deutsche bank european leveraged finance … view through eaf performance products graphite...
TRANSCRIPT
Deutsche Bank 16th Annual European Leveraged Finance Conference
Jürgen Muth, CFO
London, 14 June 2012
Investor Relations Presentation
Page 2
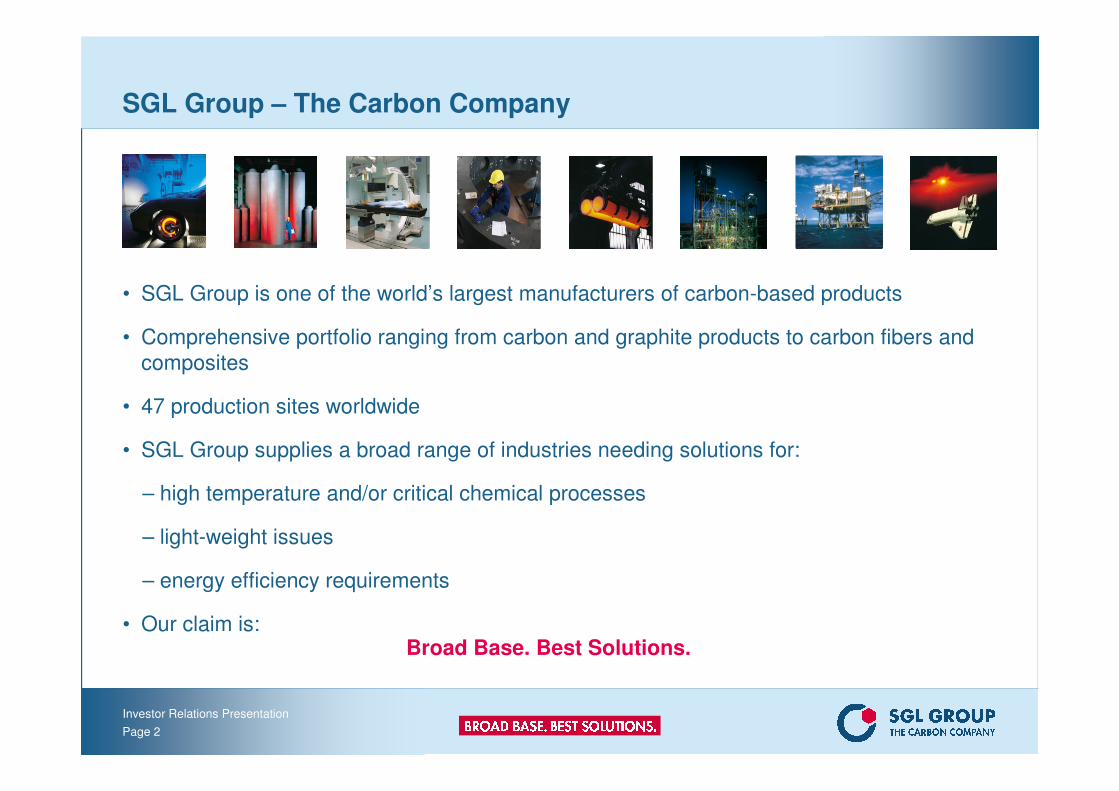
SGL Group – The Carbon Company
• SGL Group is one of the world’s largest manufacturers of carbon-based products
• Comprehensive portfolio ranging from carbon and graphite products to carbon fibers and
composites
• 47 production sites worldwide
• SGL Group supplies a broad range of industries needing solutions for:
– high temperature and/or critical chemical processes
– light-weight issues
– energy efficiency requirements
• Our claim is:Broad Base. Best Solutions.

Investor Relations Presentation
Page 3
Fundamental long-term growth drivers

Investor Relations Presentation
Page 4
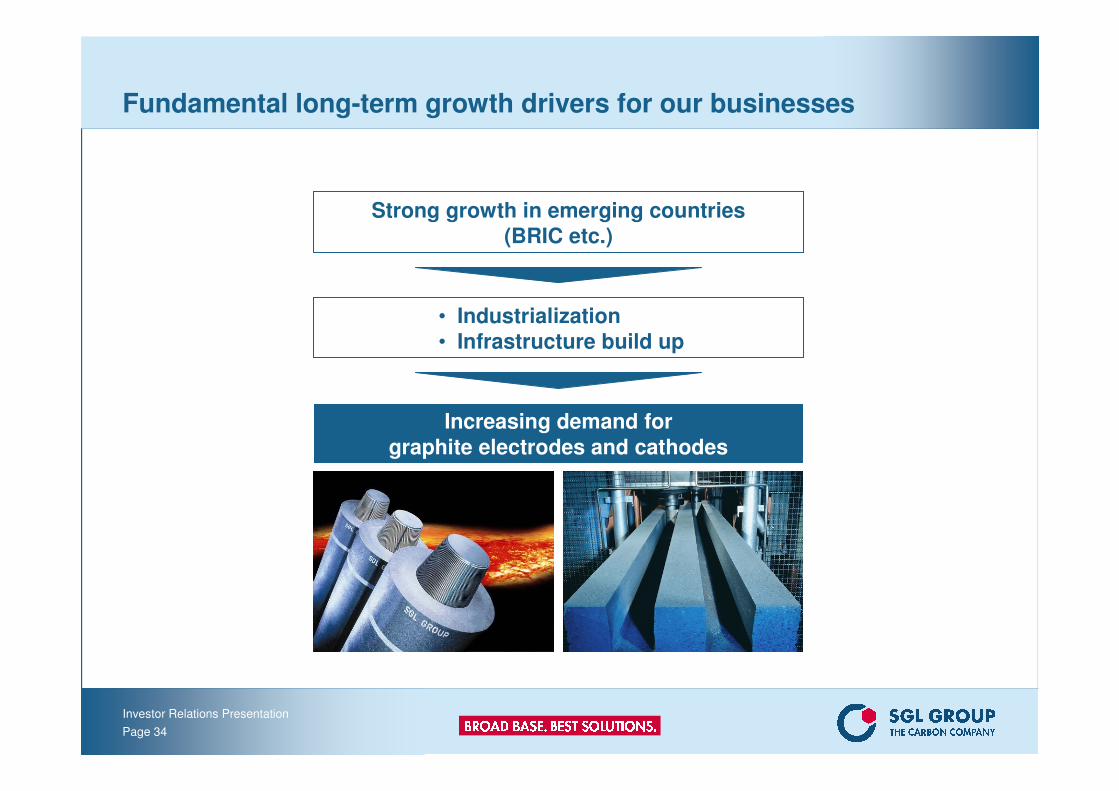
Strong growth in emerging countries(BRIC etc.)
• Industrialization• Infrastructure build up
Increasing demand forgraphite electrodes and cathodes
Fundamental long-term growth drivers for our businesses

Investor Relations Presentation
Page 5
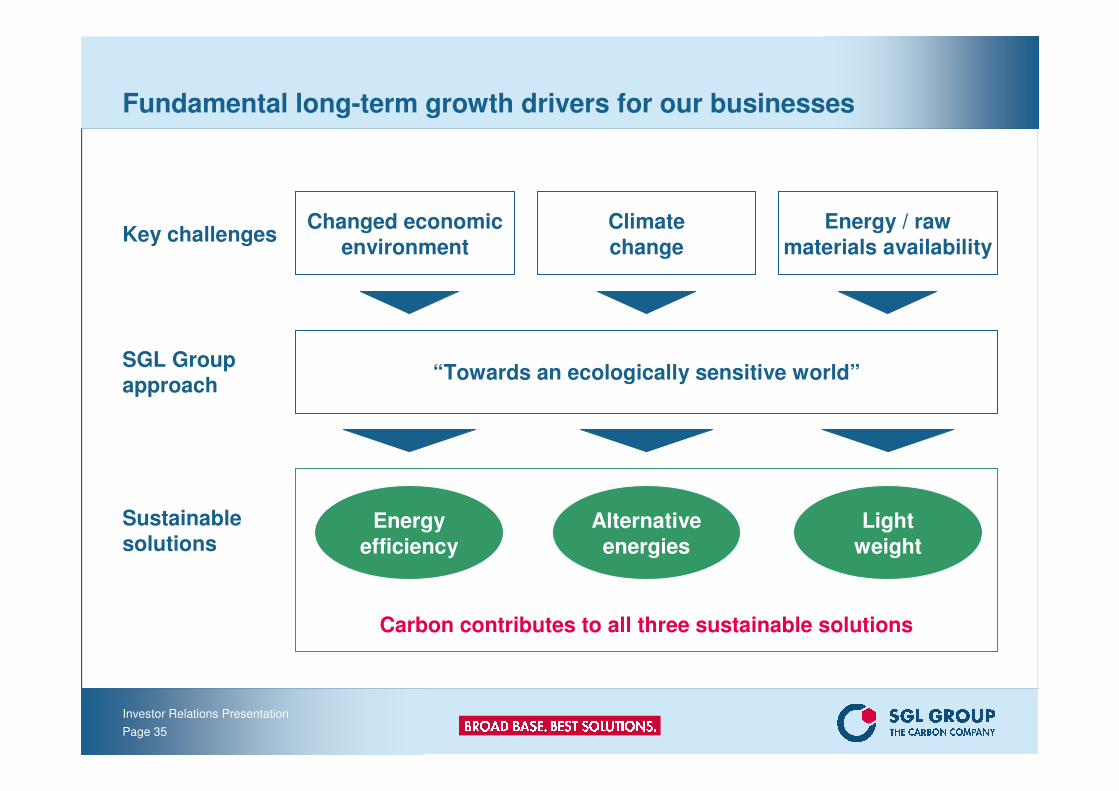
Fundamental long-term growth drivers for our businesses
SGL Group approach
“Towards an ecologically sensitive world”
Key challengesChanged economic
environmentEnergy / raw
materials availabilityClimatechange
Sustainable solutions
Energyefficiency
Lightweight
Alternativeenergies
Carbon contributes to all three sustainable solutions
Investor Relations Presentation
Page 6
Introduction to SGL Group’s Businesses
Investor Relations Presentation
Page 7
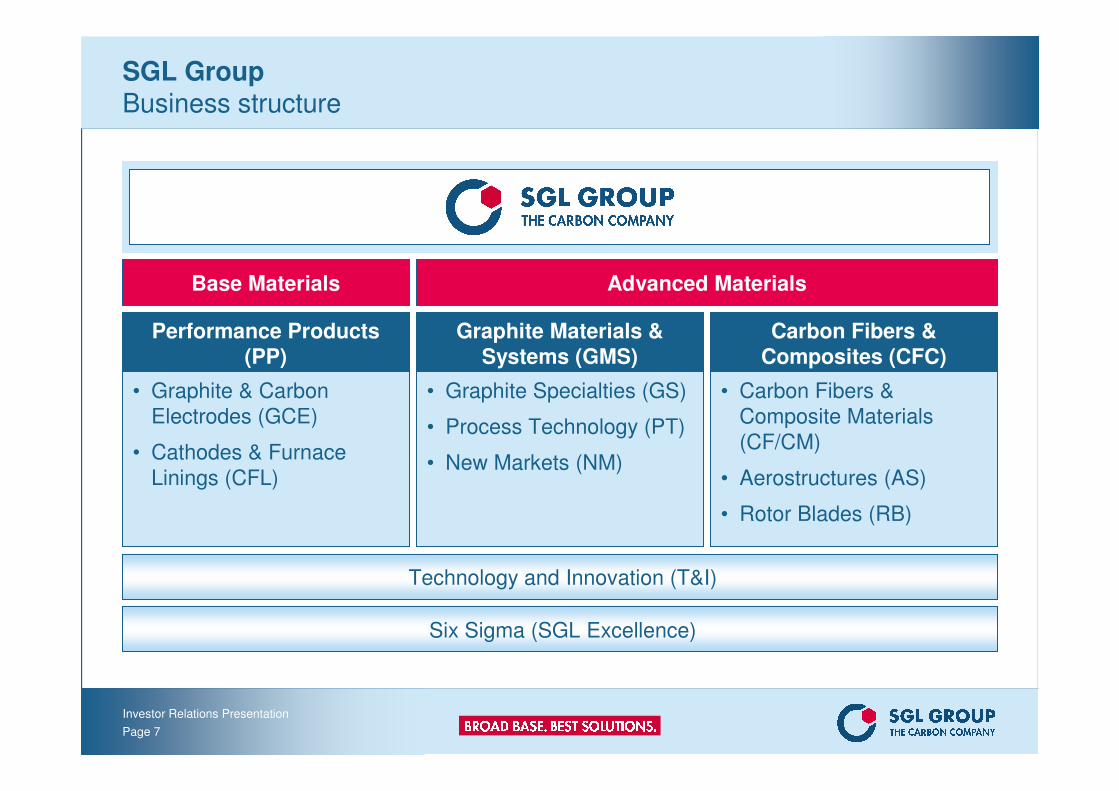
Base Materials Advanced Materials
Performance Products(PP)
Graphite Materials & Systems (GMS)
Carbon Fibers & Composites (CFC)
• Graphite & Carbon
Electrodes (GCE)
• Cathodes & Furnace
Linings (CFL)
• Graphite Specialties (GS)
• Process Technology (PT)
• New Markets (NM)
• Carbon Fibers &
Composite Materials
(CF/CM)
• Aerostructures (AS)
• Rotor Blades (RB)
Technology and Innovation (T&I)
Six Sigma (SGL Excellence)
SGL GroupBusiness structure
Investor Relations Presentation
Page 8
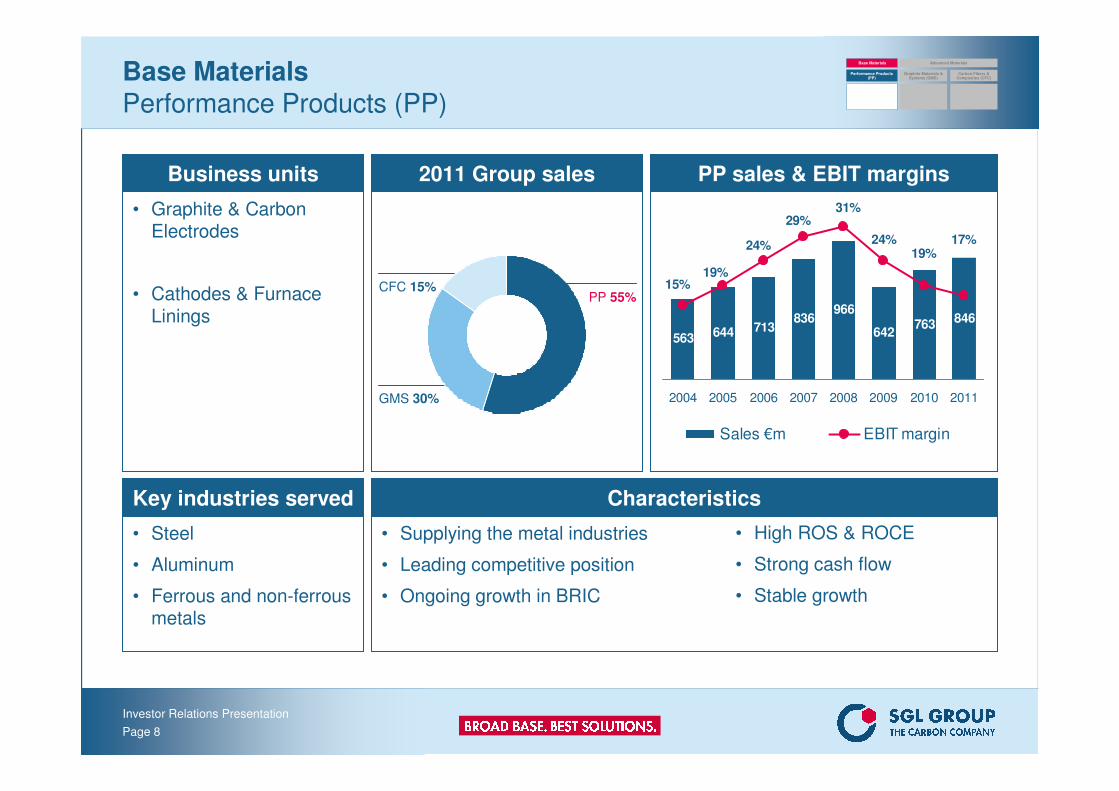
Base MaterialsPerformance Products (PP)
Business units
• Graphite & Carbon Electrodes
• Cathodes & FurnaceLinings
2011 Group sales PP sales & EBIT margins
Key industries served
• Steel
• Aluminum
• Ferrous and non-ferrous metals
Characteristics
• Supplying the metal industries
• Leading competitive position
• Ongoing growth in BRIC
• High ROS & ROCE
• Strong cash flow
• Stable growth
563 644 713836
966
642763 846
24%
31%29%
24%
19%15%
17%19%
2004 2005 2006 2007 2008 2009 2010 2011
Sales €m EBIT margin
Base Materials Advanced Materials
Performance Products (PP)
Graphite Materials & Systems (GMS)
Carbon Fibers & Composites (CFC)
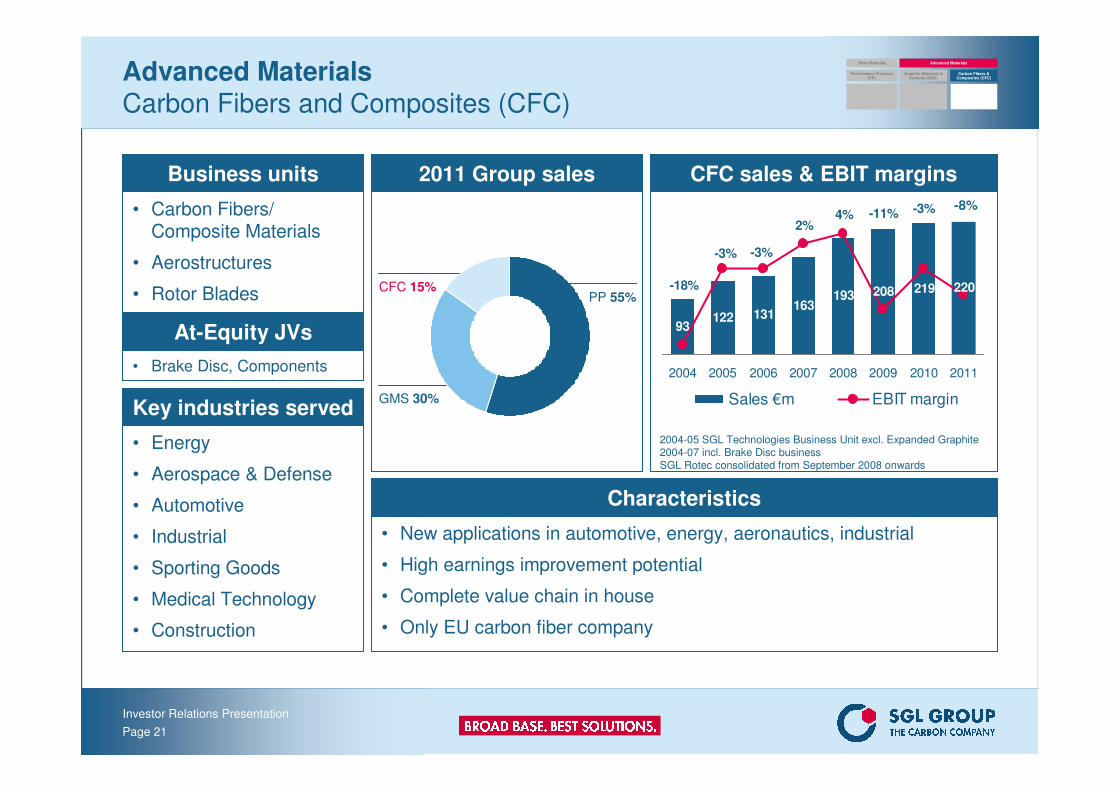
GMS 30%
CFC 15%PP 55%
Investor Relations Presentation
Page 9
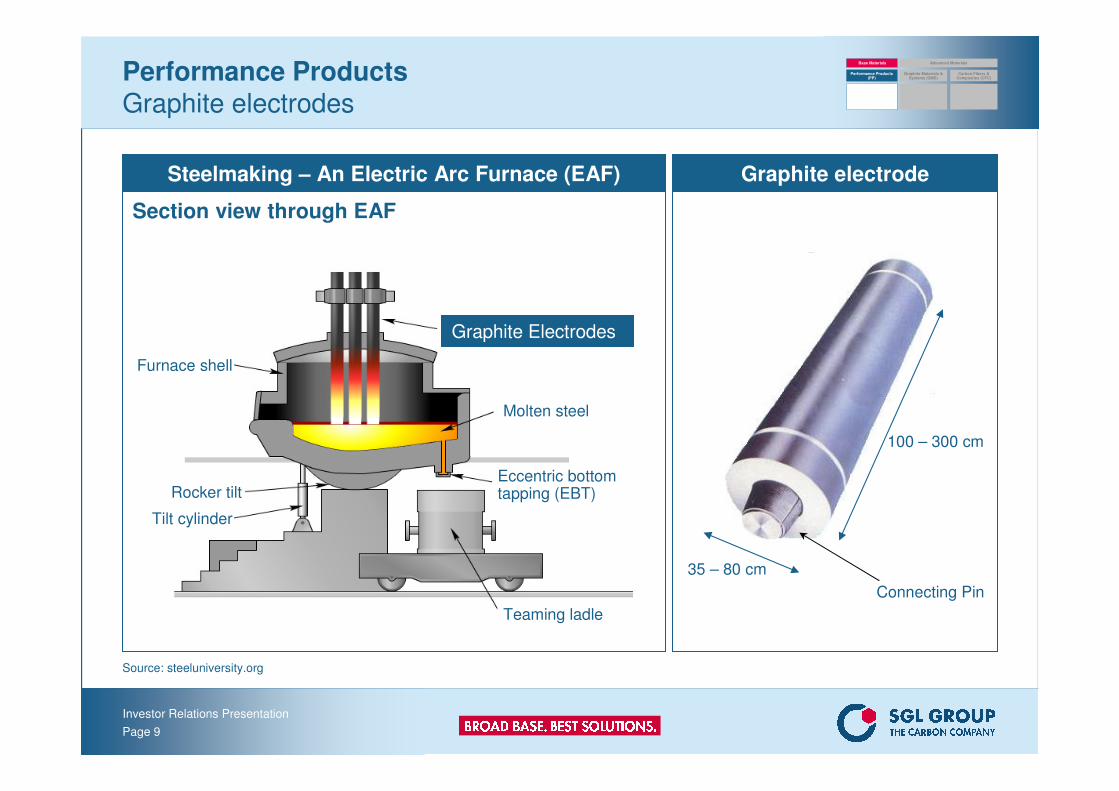
Section view through EAF
Performance Products Graphite electrodes
Graphite electrodeSteelmaking – An Electric Arc Furnace (EAF)
100 – 300 cm
35 – 80 cm
Connecting Pin
Graphite Electrodes
Molten steel
Eccentric bottomtapping (EBT)
Teaming ladle
Furnace shell
Rocker tilt
Tilt cylinder
Source: steeluniversity.org
Base Materials Advanced Materials
Performance Products (PP)
Graphite Materials & Systems (GMS)
Carbon Fibers & Composites (CFC)
Investor Relations Presentation
Page 10
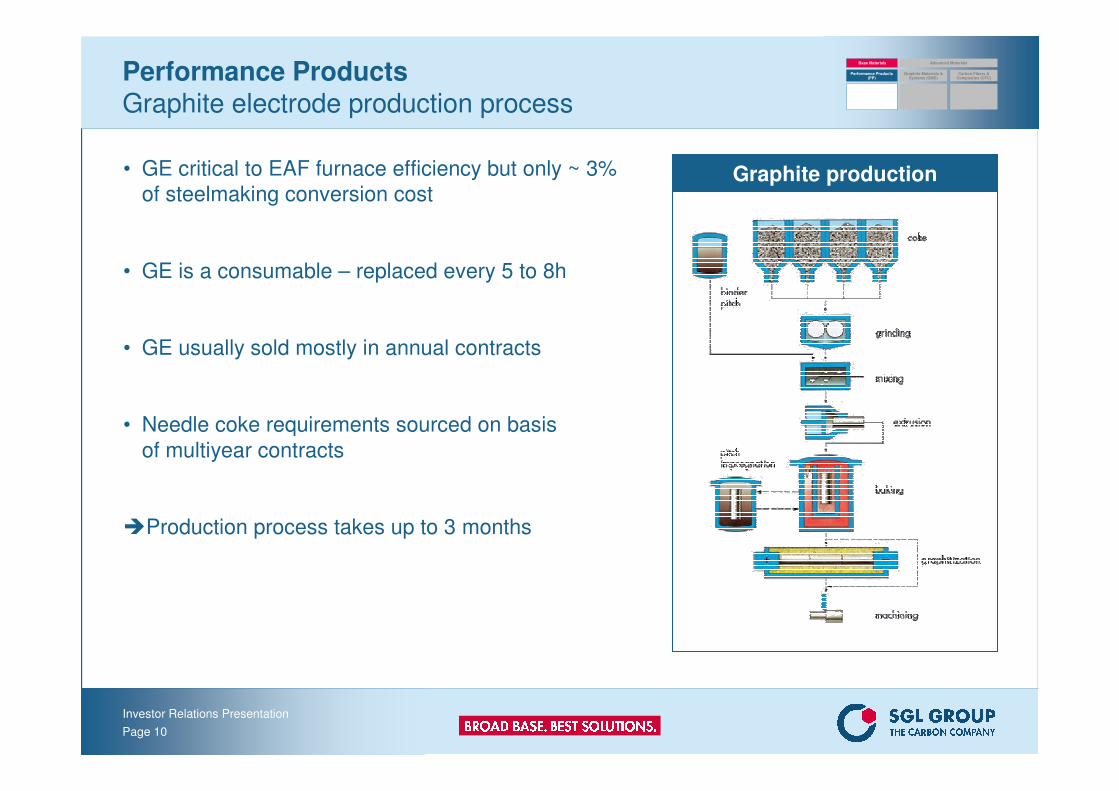
Performance ProductsGraphite electrode production process
Graphite production• GE critical to EAF furnace efficiency but only ~ 3%
of steelmaking conversion cost
• GE is a consumable – replaced every 5 to 8h
• GE usually sold mostly in annual contracts
• Needle coke requirements sourced on basis
of multiyear contracts
�Production process takes up to 3 months
Base Materials Advanced Materials
Performance Products (PP)
Graphite Materials & Systems (GMS)
Carbon Fibers & Composites (CFC)
Investor Relations Presentation
Page 11
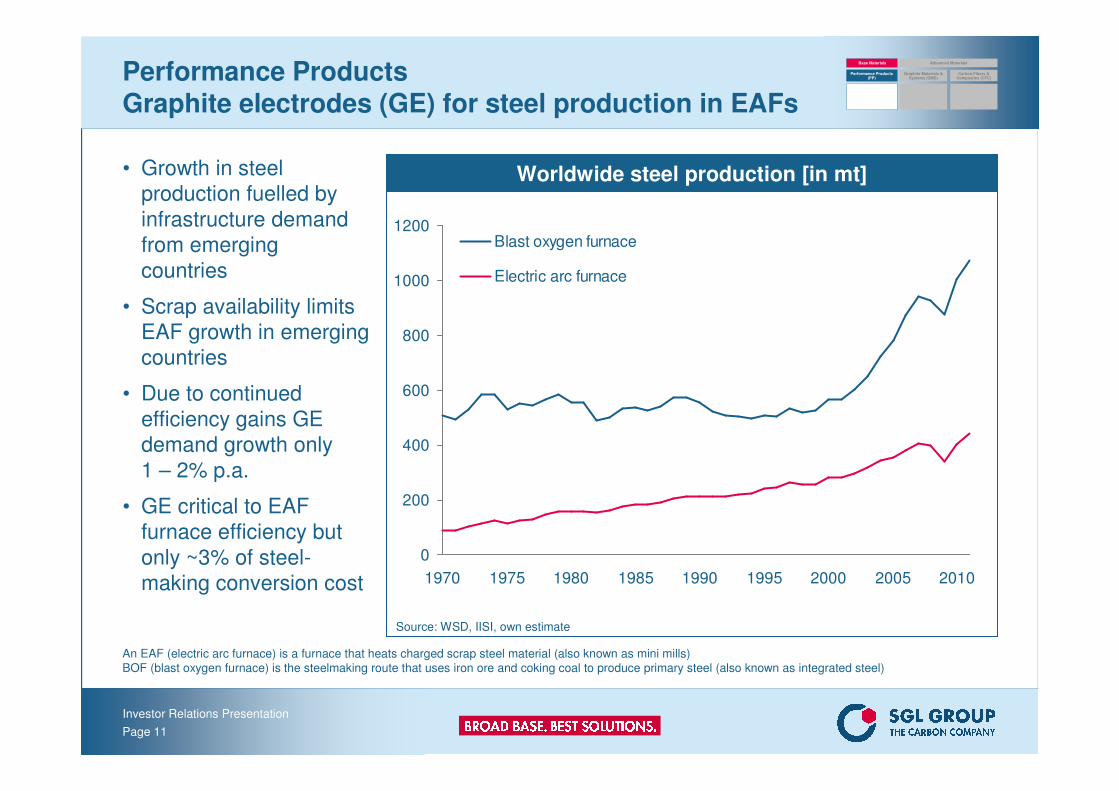
Worldwide steel production [in mt]
Performance ProductsGraphite electrodes (GE) for steel production in EAFs
• Growth in steel
production fuelled by
infrastructure demand
from emerging
countries
• Scrap availability limits
EAF growth in emerging
countries
• Due to continued
efficiency gains GE
demand growth only
1 – 2% p.a.
• GE critical to EAF
furnace efficiency but
only ~3% of steel-
making conversion cost
An EAF (electric arc furnace) is a furnace that heats charged scrap steel material (also known as mini mills)
BOF (blast oxygen furnace) is the steelmaking route that uses iron ore and coking coal to produce primary steel (also known as integrated steel)
0
200
400
600
800
1000
1200
1970 1975 1980 1985 1990 1995 2000 2005 2010
Blast oxygen furnace
Electric arc furnace
Source: WSD, IISI, own estimate
Base Materials Advanced Materials
Performance Products (PP)
Graphite Materials & Systems (GMS)
Carbon Fibers & Composites (CFC)
Investor Relations Presentation
Page 12
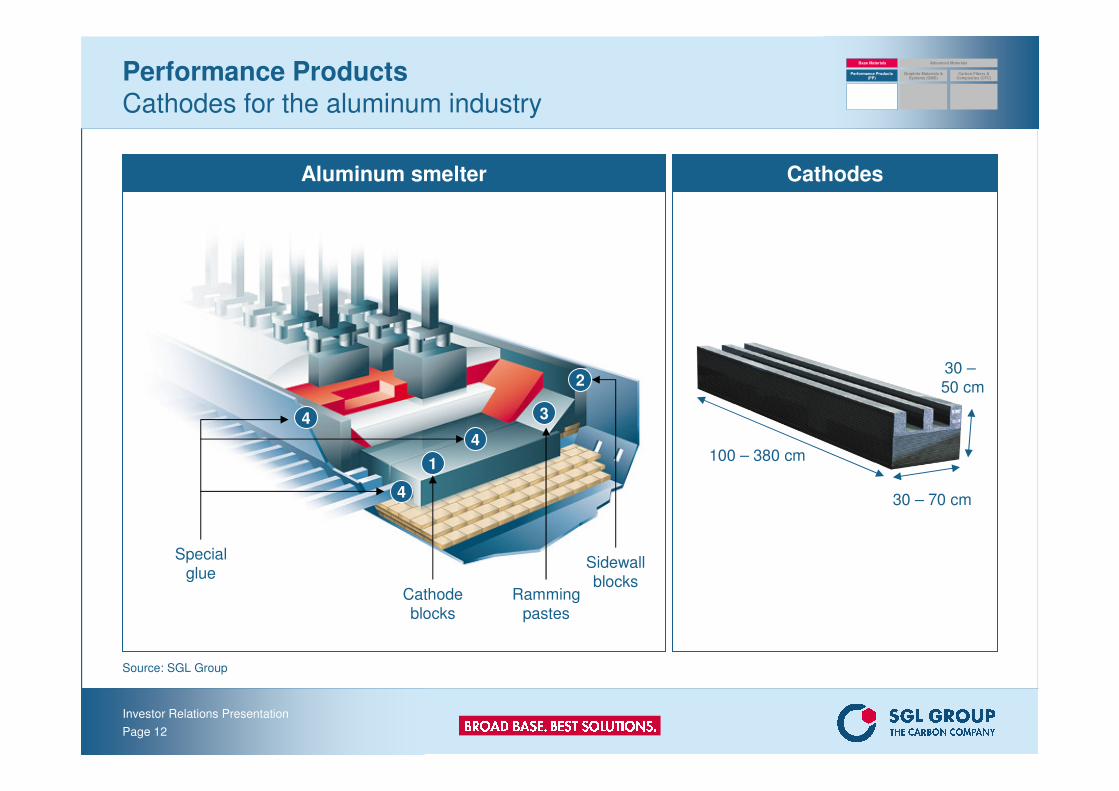
Performance ProductsCathodes for the aluminum industry
CathodesAluminum smelter
Source: SGL Group
30 – 70 cm
30 –
50 cm
100 – 380 cm
4
4
4
1
3
2
Special
glue
Cathode
blocks
Ramming
pastes
Sidewall
blocks
Base Materials Advanced Materials
Performance Products (PP)
Graphite Materials & Systems (GMS)
Carbon Fibers & Composites (CFC)
Investor Relations Presentation
Page 13
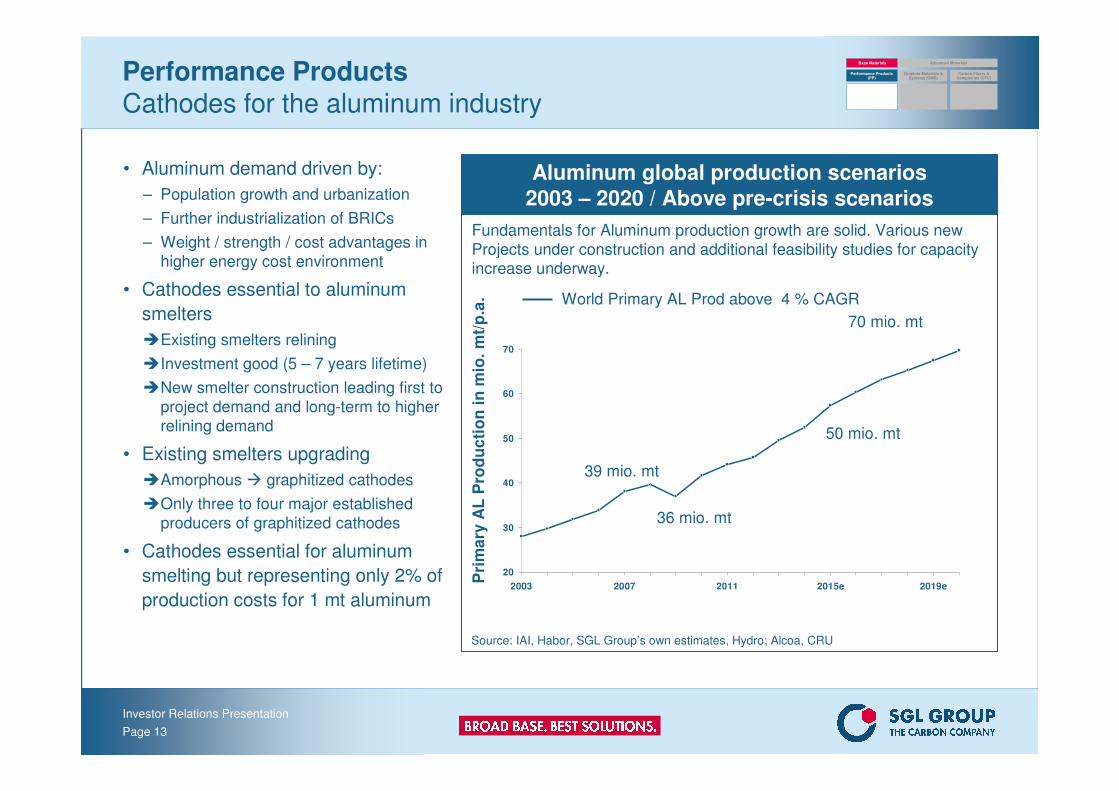
Fundamentals for Aluminum production growth are solid. Various new
Projects under construction and additional feasibility studies for capacity increase underway.
20
30
40
50
60
70
2003 2007 2011 2015e 2019e
Aluminum global production scenarios2003 – 2020 / Above pre-crisis scenarios
Performance ProductsCathodes for the aluminum industry
• Aluminum demand driven by:
– Population growth and urbanization
– Further industrialization of BRICs
– Weight / strength / cost advantages in
higher energy cost environment
• Cathodes essential to aluminum
smelters
�Existing smelters relining
�Investment good (5 – 7 years lifetime)
�New smelter construction leading first to
project demand and long-term to higher
relining demand
• Existing smelters upgrading
�Amorphous � graphitized cathodes
�Only three to four major established
producers of graphitized cathodes
• Cathodes essential for aluminum
smelting but representing only 2% of
production costs for 1 mt aluminum
Pri
ma
ry A
L P
rod
uc
tio
n i
n m
io.
mt/
p.a
.39 mio. mt
36 mio. mt
50 mio. mt
70 mio. mt
Source: IAI, Habor, SGL Group’s own estimates, Hydro; Alcoa, CRU
World Primary AL Prod above 4 % CAGR
Base Materials Advanced Materials
Performance Products (PP)
Graphite Materials & Systems (GMS)
Carbon Fibers & Composites (CFC)
Investor Relations Presentation
Page 14
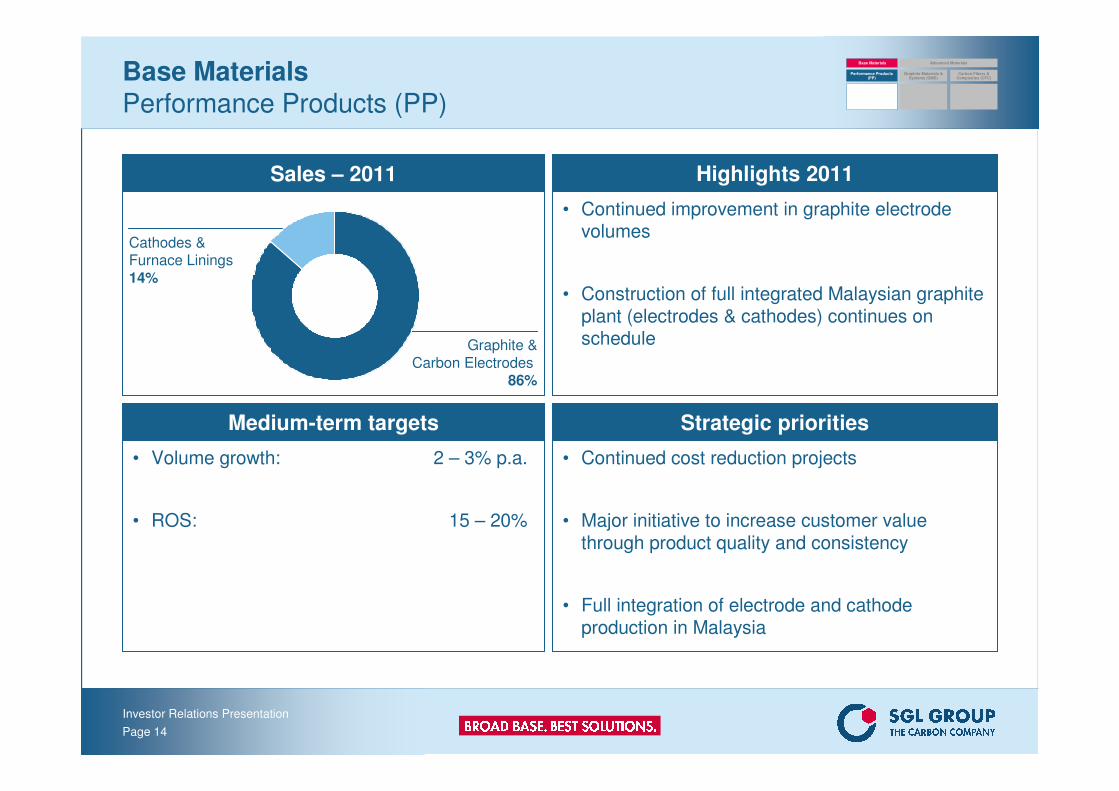
Sales – 2011
Base MaterialsPerformance Products (PP)
Highlights 2011
• Continued improvement in graphite electrode volumes
• Construction of full integrated Malaysian graphite plant (electrodes & cathodes) continues on schedule
Strategic priorities
• Continued cost reduction projects
• Major initiative to increase customer value through product quality and consistency
• Full integration of electrode and cathode production in Malaysia
Medium-term targets
• Volume growth: 2 – 3% p.a.
• ROS: 15 – 20%
Graphite &
Carbon Electrodes86%
Cathodes &Furnace Linings
14%
Base Materials Advanced Materials
Performance Products (PP)
Graphite Materials & Systems (GMS)
Carbon Fibers & Composites (CFC)
Investor Relations Presentation
Page 15
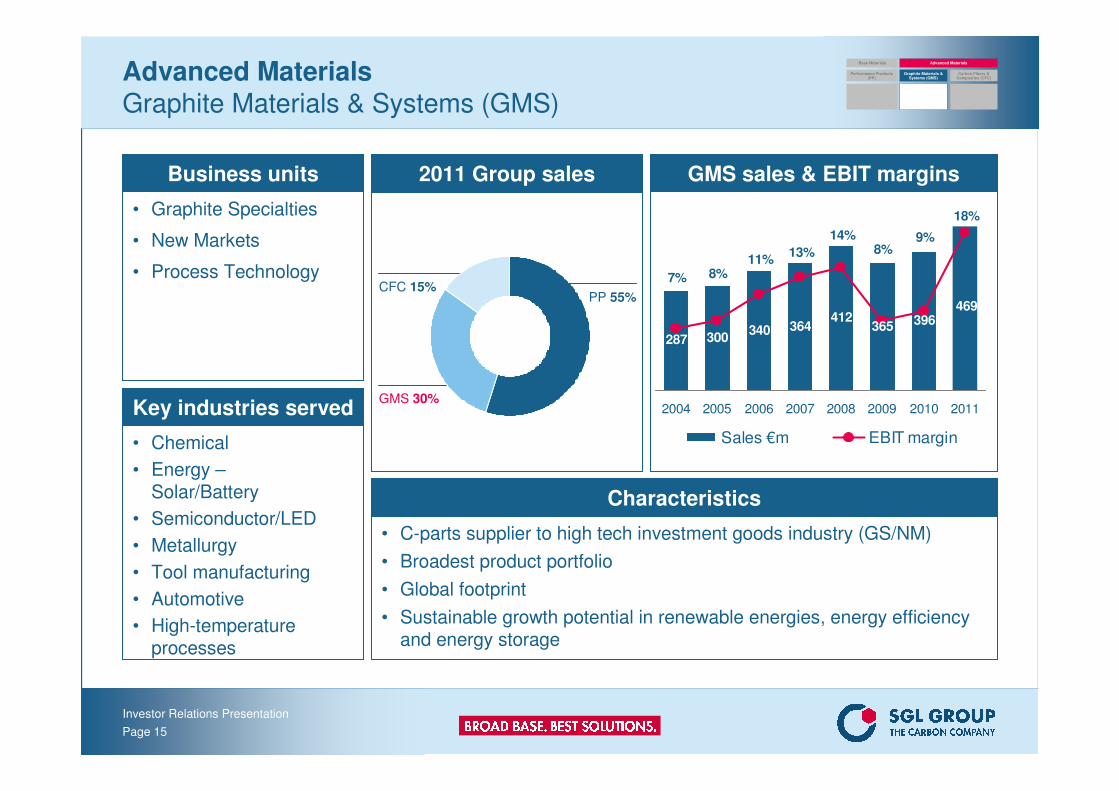
Advanced MaterialsGraphite Materials & Systems (GMS)
Business units
• Graphite Specialties
• New Markets
• Process Technology
2011 Group sales GMS sales & EBIT margins
Key industries served
• Chemical
• Energy –Solar/Battery
• Semiconductor/LED
• Metallurgy
• Tool manufacturing
• Automotive
• High-temperature processes
Characteristics
• C-parts supplier to high tech investment goods industry (GS/NM)
• Broadest product portfolio
• Global footprint
• Sustainable growth potential in renewable energies, energy efficiency and energy storage
287 300340 364
412365 396
469
18%
8%11%
13%
14% 9%
7%
8%
2004 2005 2006 2007 2008 2009 2010 2011
Sales €m EBIT margin
Base Materials Advanced Materials
Performance Products (PP)
Graphite Materials & Systems (GMS)
Carbon Fibers & Composites (CFC)
GMS 30%
CFC 15%PP 55%
Investor Relations Presentation
Page 16
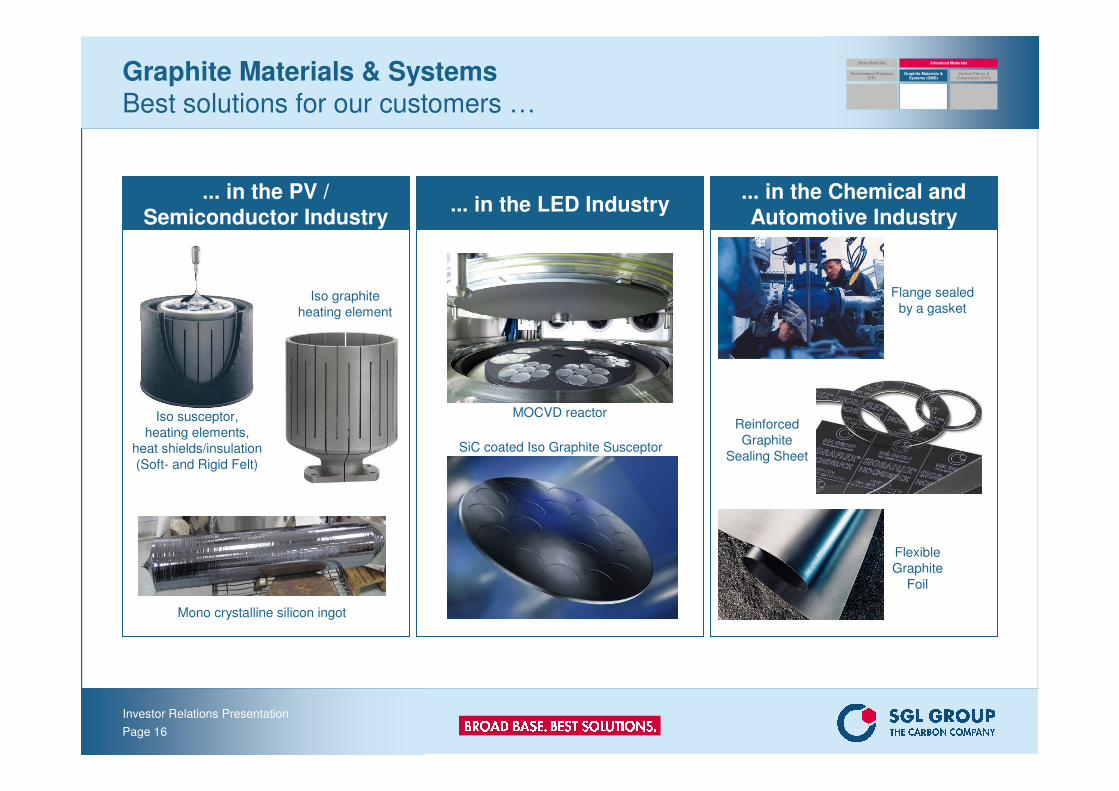
Graphite Materials & SystemsBest solutions for our customers …
Base Materials Advanced Materials
Performance Products (PP)
Graphite Materials & Systems (GMS)
Carbon Fibers & Composites (CFC)
... in the PV / Semiconductor Industry
... in the LED Industry... in the Chemical and Automotive Industry
Iso graphite
heating element
Iso susceptor,
heating elements,
heat shields/insulation
(Soft- and Rigid Felt)
Mono crystalline silicon ingot
MOCVD reactor
SiC coated Iso Graphite Susceptor
Flange sealed
by a gasket
Reinforced
Graphite
Sealing Sheet
Flexible
Graphite
Foil
Investor Relations Presentation
Page 17
Graphite manufacturing passes multiple process steps and requires 4 to 6 months of production time (net)
Raw Materials (Pitches & Cokes)
High quality raw
materials from
reliable sources
Pre-pressing Processes
Breaking, milling,
sieving, binding, mixing, homoge-
nizing
Baking 850°C – 1,200°C
Carbonizing
Finishing / Value-Adding
Purification
Coating
4 days
4- 6 weeks
2 days
3 days
Impregnate & Re-Bake
Carbonizing,
Densification
4 weeks
Source: GS Production
Isostatic pressing Extruding
or
Pressing
Formation of graphite structure
and densification
Graphitizing 2,800°C – 3,000°C
Machining
Machining of the feedstock:
Sawing, turning, milling, sanding,
boring, lapping, polishing Σ 4 - 6 months
Production time
1- 5 days
5 weeks
1 day
Base Materials Advanced Materials
Performance Products (PP)
Graphite Materials & Systems (GMS)
Carbon Fibers & Composites (CFC)
Investor Relations Presentation
Page 18
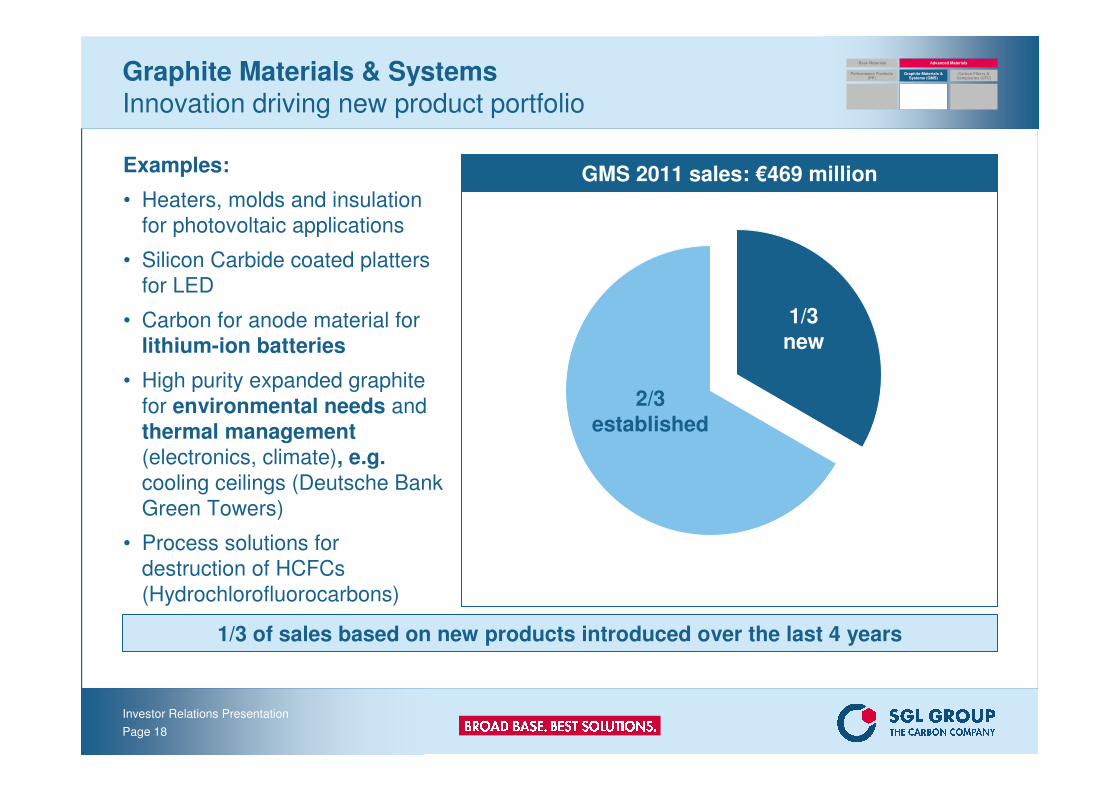
Graphite Materials & SystemsInnovation driving new product portfolio
GMS 2011 sales: €469 millionExamples:
• Heaters, molds and insulation
for photovoltaic applications
• Silicon Carbide coated platters
for LED
• Carbon for anode material for
lithium-ion batteries
• High purity expanded graphite
for environmental needs and
thermal management(electronics, climate), e.g. cooling ceilings (Deutsche Bank
Green Towers)
• Process solutions for
destruction of HCFCs
(Hydrochlorofluorocarbons)
1/3 of sales based on new products introduced over the last 4 years
1/3new
2/3established
Base Materials Advanced Materials
Performance Products (PP)
Graphite Materials & Systems (GMS)
Carbon Fibers & Composites (CFC)
Investor Relations Presentation
Page 19
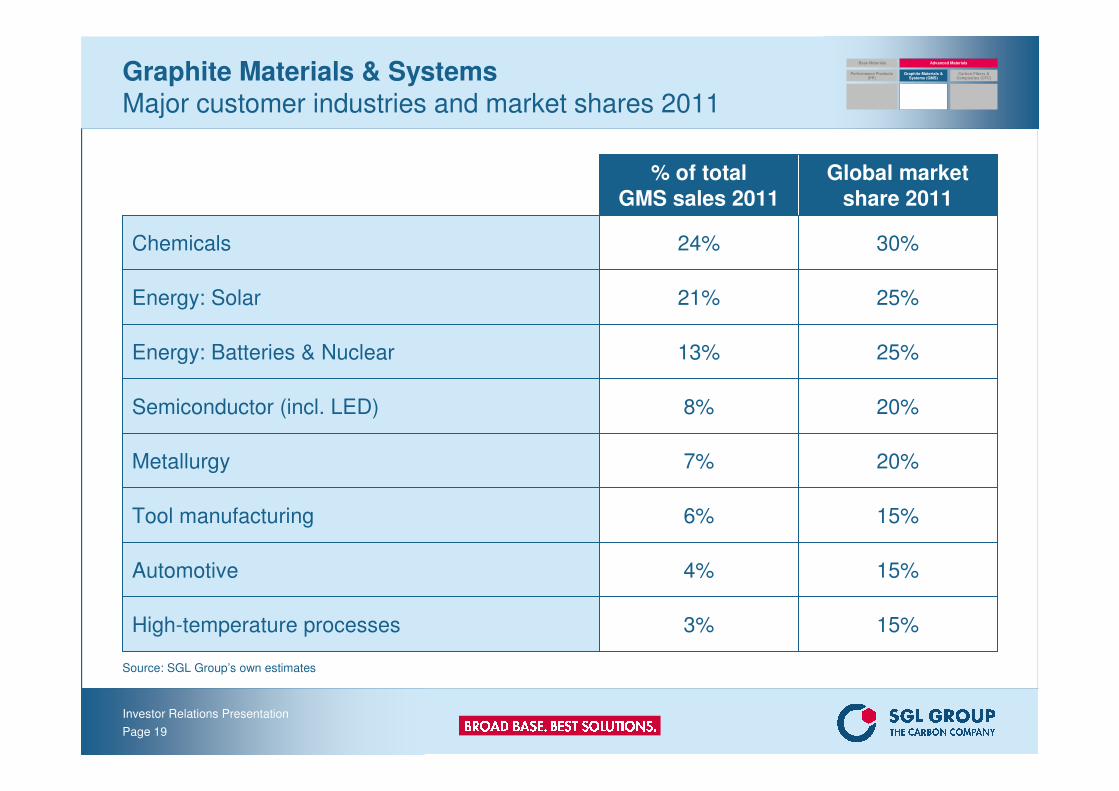
Graphite Materials & SystemsMajor customer industries and market shares 2011
25%13%Energy: Batteries & Nuclear
30%24%Chemicals
3%
4%
6%
7%
8%
21%
% of totalGMS sales 2011
Global marketshare 2011
15%High-temperature processes
15%Automotive
15%Tool manufacturing
20%Metallurgy
20%Semiconductor (incl. LED)
25%Energy: Solar
Source: SGL Group’s own estimates
Base Materials Advanced Materials
Performance Products (PP)
Graphite Materials & Systems (GMS)
Carbon Fibers & Composites (CFC)
Investor Relations Presentation
Page 20
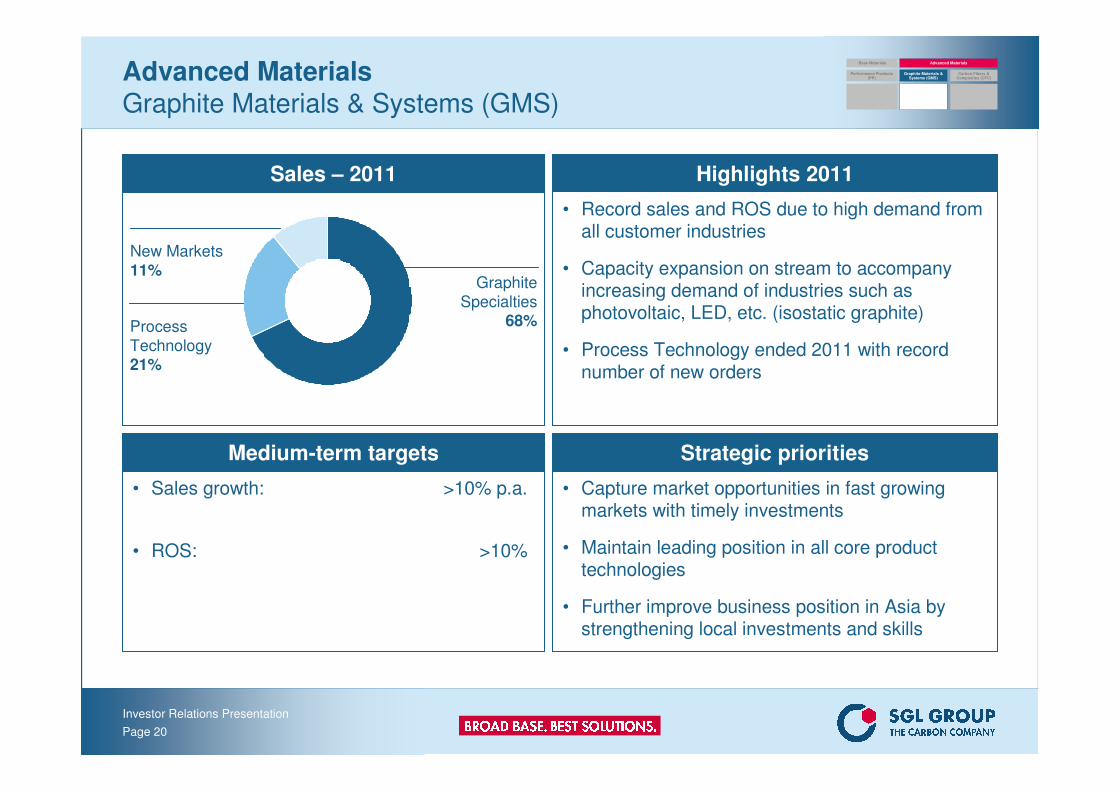
Advanced MaterialsGraphite Materials & Systems (GMS)
Sales – 2011 Highlights 2011
• Record sales and ROS due to high demand from all customer industries
• Capacity expansion on stream to accompany increasing demand of industries such as photovoltaic, LED, etc. (isostatic graphite)
• Process Technology ended 2011 with record number of new orders
Strategic priorities
• Capture market opportunities in fast growing markets with timely investments
• Maintain leading position in all core product technologies
• Further improve business position in Asia by strengthening local investments and skills
Medium-term targets
• Sales growth: >10% p.a.
• ROS: >10%
Graphite
Specialties68%Process
Technology21%
Base Materials Advanced Materials
Performance Products (PP)
Graphite Materials & Systems (GMS)
Carbon Fibers & Composites (CFC)
New Markets
11%
Investor Relations Presentation
Page 21
Advanced MaterialsCarbon Fibers and Composites (CFC)
Business units
• Carbon Fibers/ Composite Materials
• Aerostructures
• Rotor Blades
2011 Group sales CFC sales & EBIT margins
Key industries served
• Energy
• Aerospace & Defense
• Automotive
• Industrial
• Sporting Goods
• Medical Technology
• Construction
Characteristics
• New applications in automotive, energy, aeronautics, industrial
• High earnings improvement potential
• Complete value chain in house
• Only EU carbon fiber company
93122 131
163193 208 219 220
4%2%
-3%-3%
-3%-11%
-18%
2004 2005 2006 2007 2008 2009 2010 2011
Sales €m EBIT margin
2004-05 SGL Technologies Business Unit excl. Expanded Graphite2004-07 incl. Brake Disc businessSGL Rotec consolidated from September 2008 onwards
Base Materials Advanced Materials
Performance Products (PP)
Graphite Materials & Systems (GMS)
Carbon Fibers & Composites (CFC)
GMS 30%
CFC 15%PP 55%
-8%
At-Equity JVs
• Brake Disc, Components
Investor Relations Presentation
Page 22
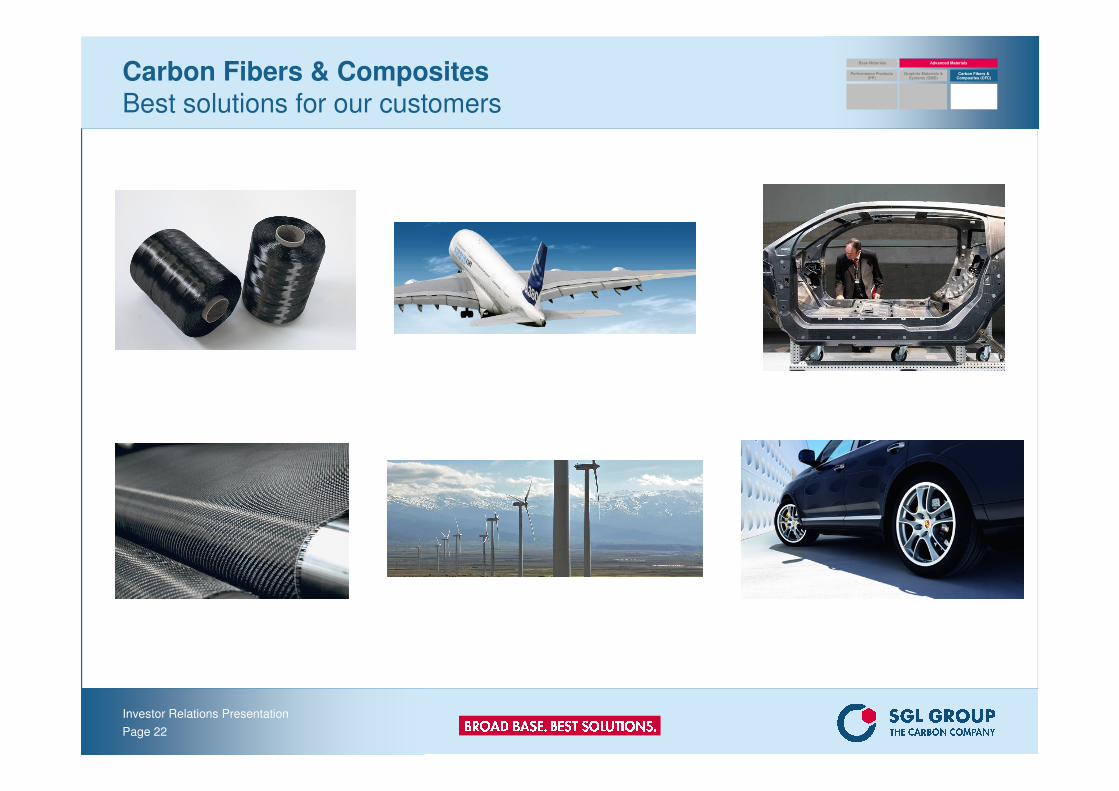
Carbon Fibers & CompositesBest solutions for our customers
Base Materials Advanced Materials
Performance Products (PP)
Graphite Materials & Systems (GMS)
Carbon Fibers & Composites (CFC)
Investor Relations Presentation
Page 23
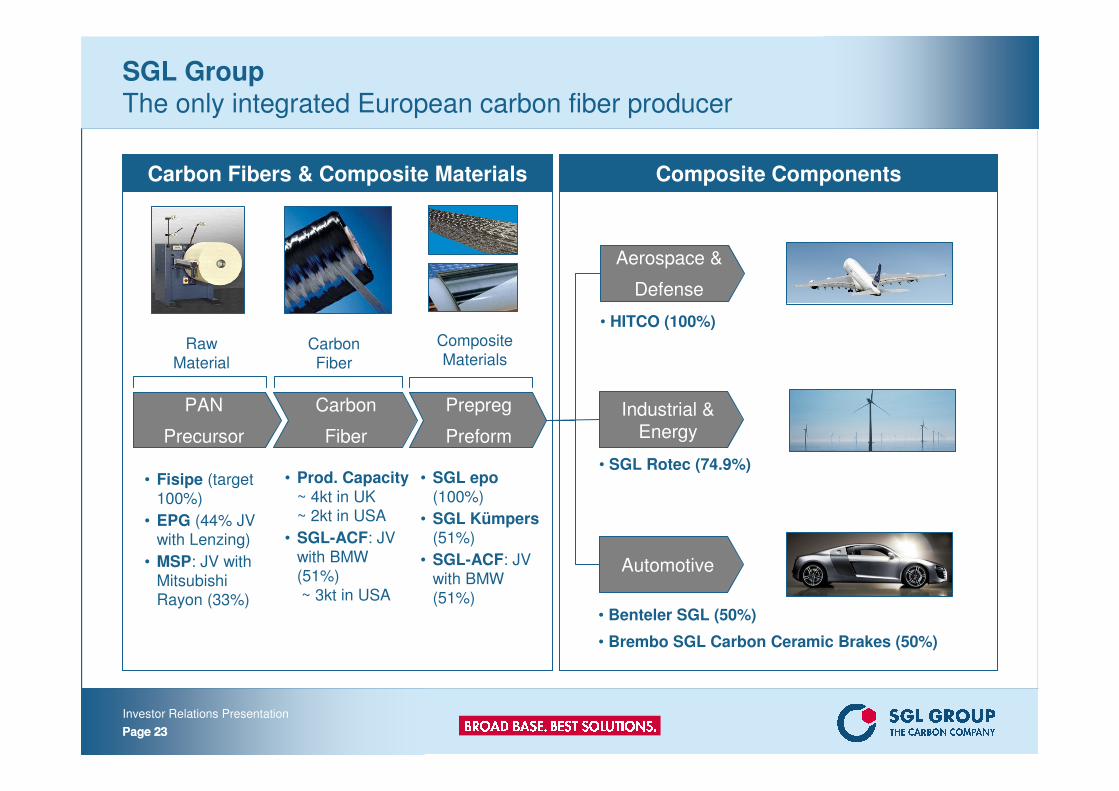
SGL GroupThe only integrated European carbon fiber producer
Carbon Fibers & Composite Materials Composite Components
PAN
Precursor
Carbon
Fiber
Prepreg
Preform
Industrial & Energy
Aerospace &
Defense
Automotive
Carbon
Fiber
Composite
Materials
• HITCO (100%)
• SGL Rotec (74.9%)
• Benteler SGL (50%)
• Brembo SGL Carbon Ceramic Brakes (50%)
Raw
Material
• Fisipe (target
100%)
• EPG (44% JVwith Lenzing)
• MSP: JV with
Mitsubishi Rayon (33%)
• Prod. Capacity~ 4kt in UK~ 2kt in USA
• SGL-ACF: JV
with BMW (51%)
~ 3kt in USA
• SGL epo(100%)
• SGL Kümpers(51%)
• SGL-ACF: JV
with BMW
(51%)
Page 23
Investor Relations Presentation
Page 24
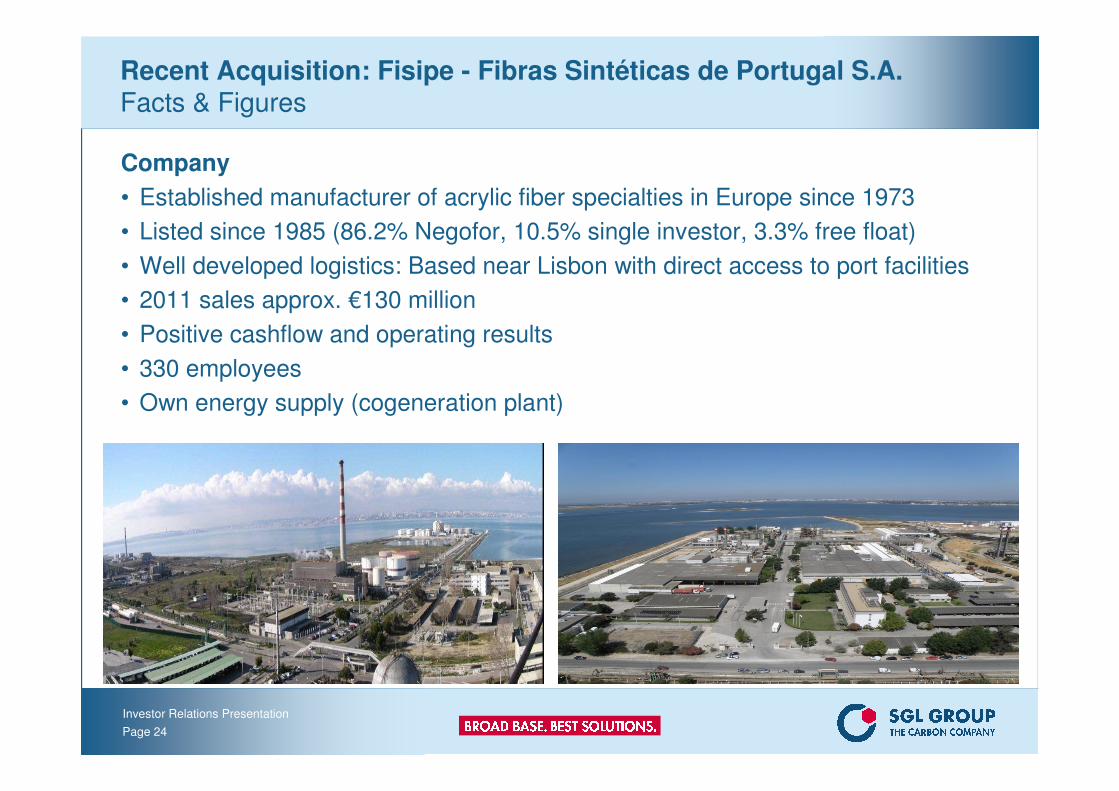
Recent Acquisition: Fisipe - Fibras Sintéticas de Portugal S.A. Facts & Figures
Company
• Established manufacturer of acrylic fiber specialties in Europe since 1973
• Listed since 1985 (86.2% Negofor, 10.5% single investor, 3.3% free float)
• Well developed logistics: Based near Lisbon with direct access to port facilities
• 2011 sales approx. €130 million
• Positive cashflow and operating results
• 330 employees
• Own energy supply (cogeneration plant)
Investor Relations Presentation
Page 25
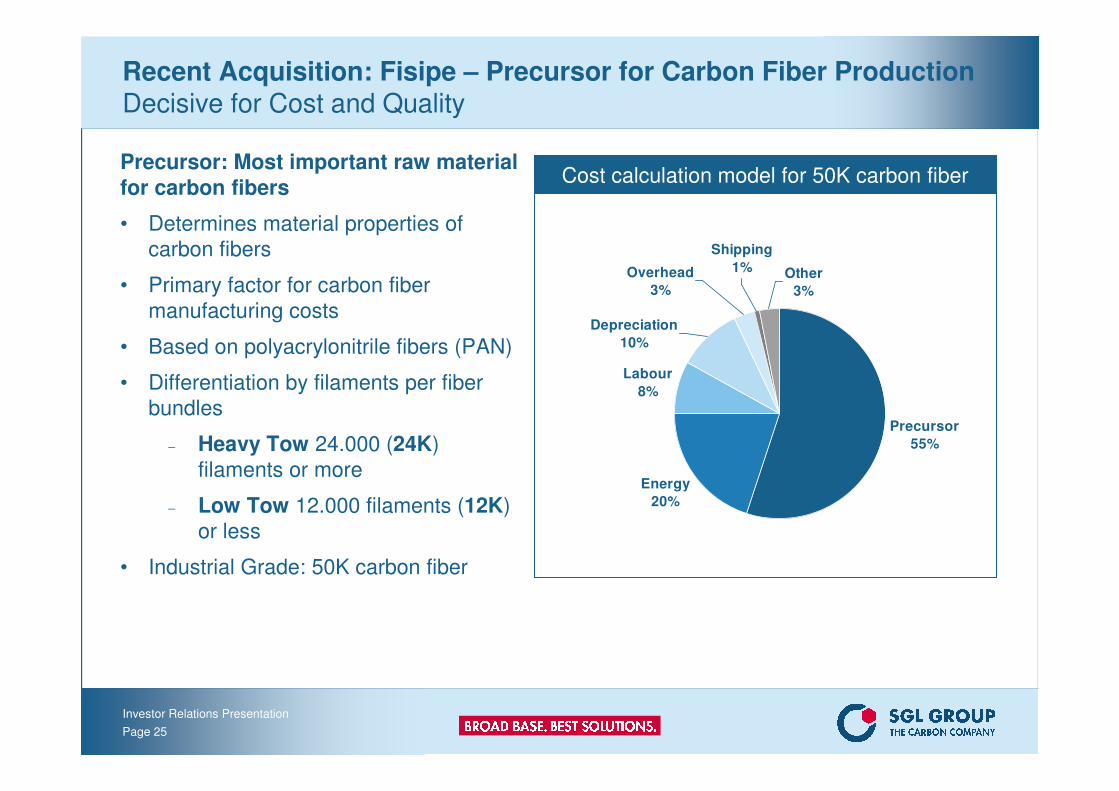
Recent Acquisition: Fisipe – Precursor for Carbon Fiber Production Decisive for Cost and Quality
Precursor: Most important raw material for carbon fibers
• Determines material properties of
carbon fibers
• Primary factor for carbon fiber
manufacturing costs
• Based on polyacrylonitrile fibers (PAN)
• Differentiation by filaments per fiber
bundles
− Heavy Tow 24.000 (24K)
filaments or more
− Low Tow 12.000 filaments (12K)
or less
• Industrial Grade: 50K carbon fiber
Precursor
55%
Energy
20%
Labour
8%
Depreciation
10%
Shipping
1%Overhead
3%Other
3%
Cost calculation model for 50K carbon fiber
Investor Relations Presentation
Page 26
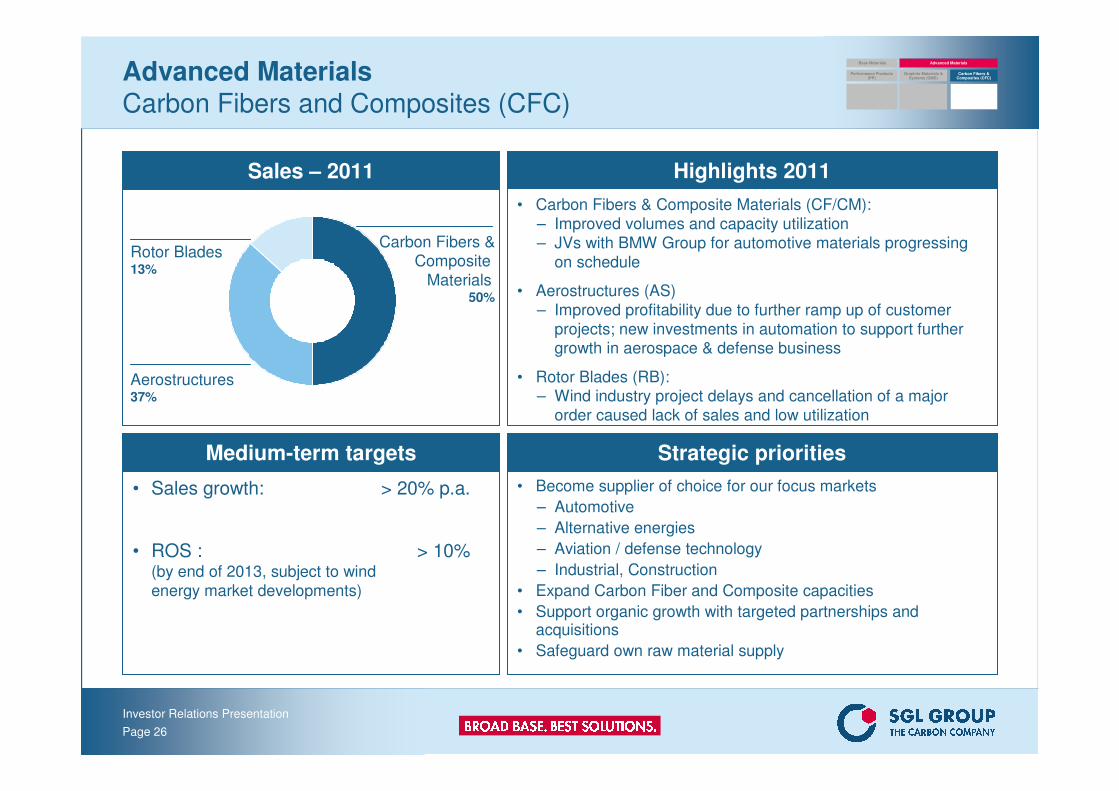
Advanced MaterialsCarbon Fibers and Composites (CFC)
Sales – 2011 Highlights 2011
• Carbon Fibers & Composite Materials (CF/CM):
– Improved volumes and capacity utilization
– JVs with BMW Group for automotive materials progressing
on schedule
• Aerostructures (AS)
– Improved profitability due to further ramp up of customer
projects; new investments in automation to support further growth in aerospace & defense business
• Rotor Blades (RB):– Wind industry project delays and cancellation of a major
order caused lack of sales and low utilization
Strategic priorities
• Become supplier of choice for our focus markets
– Automotive
– Alternative energies
– Aviation / defense technology
– Industrial, Construction
• Expand Carbon Fiber and Composite capacities
• Support organic growth with targeted partnerships and acquisitions
• Safeguard own raw material supply
Medium-term targets
• Sales growth: > 20% p.a.
• ROS : > 10%(by end of 2013, subject to wind
energy market developments)
Aerostructures37%
Carbon Fibers &Composite
Materials50%
Rotor Blades13%
Base Materials Advanced Materials
Performance Products (PP)
Graphite Materials & Systems (GMS)
Carbon Fibers & Composites (CFC)
Investor Relations Presentation
Page 27
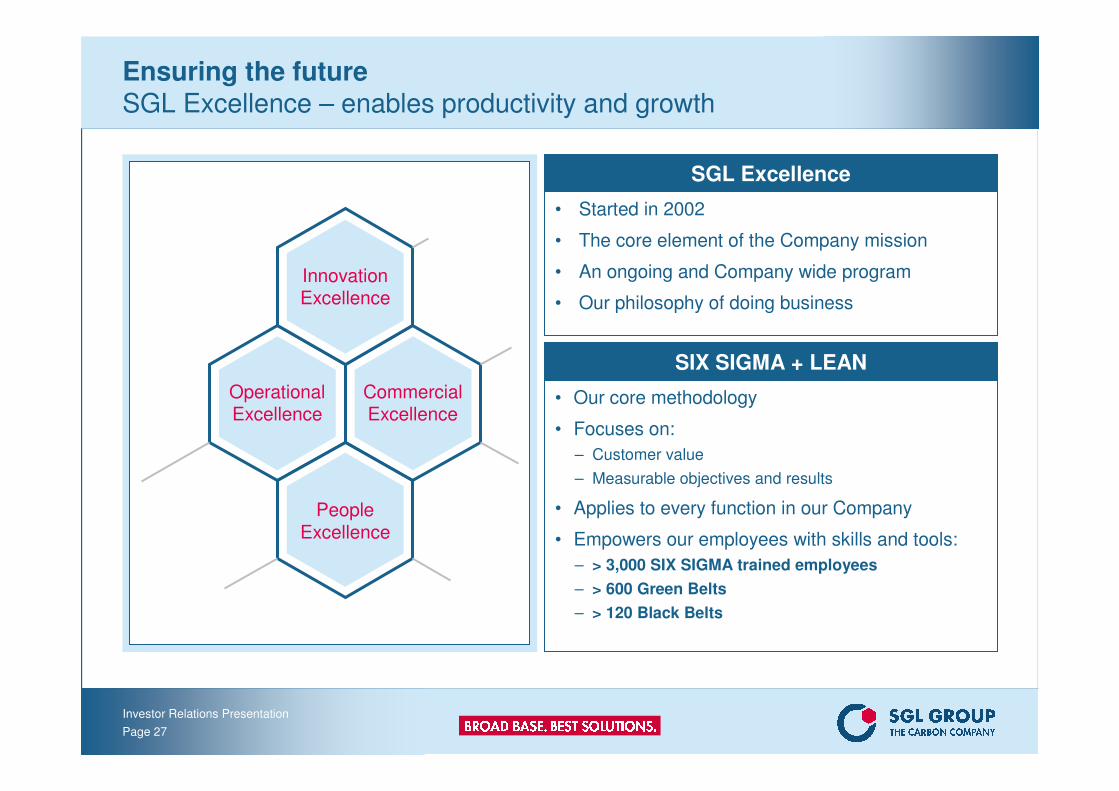
Ensuring the futureSGL Excellence – enables productivity and growth
InnovationExcellence
CommercialExcellence
OperationalExcellence
PeopleExcellence
SGL Excellence
• Started in 2002
• The core element of the Company mission
• An ongoing and Company wide program
• Our philosophy of doing business
SIX SIGMA + LEAN
• Our core methodology
• Focuses on:
– Customer value
– Measurable objectives and results
• Applies to every function in our Company
• Empowers our employees with skills and tools:
– > 3,000 SIX SIGMA trained employees
– > 600 Green Belts
– > 120 Black Belts
Investor Relations Presentation
Page 28
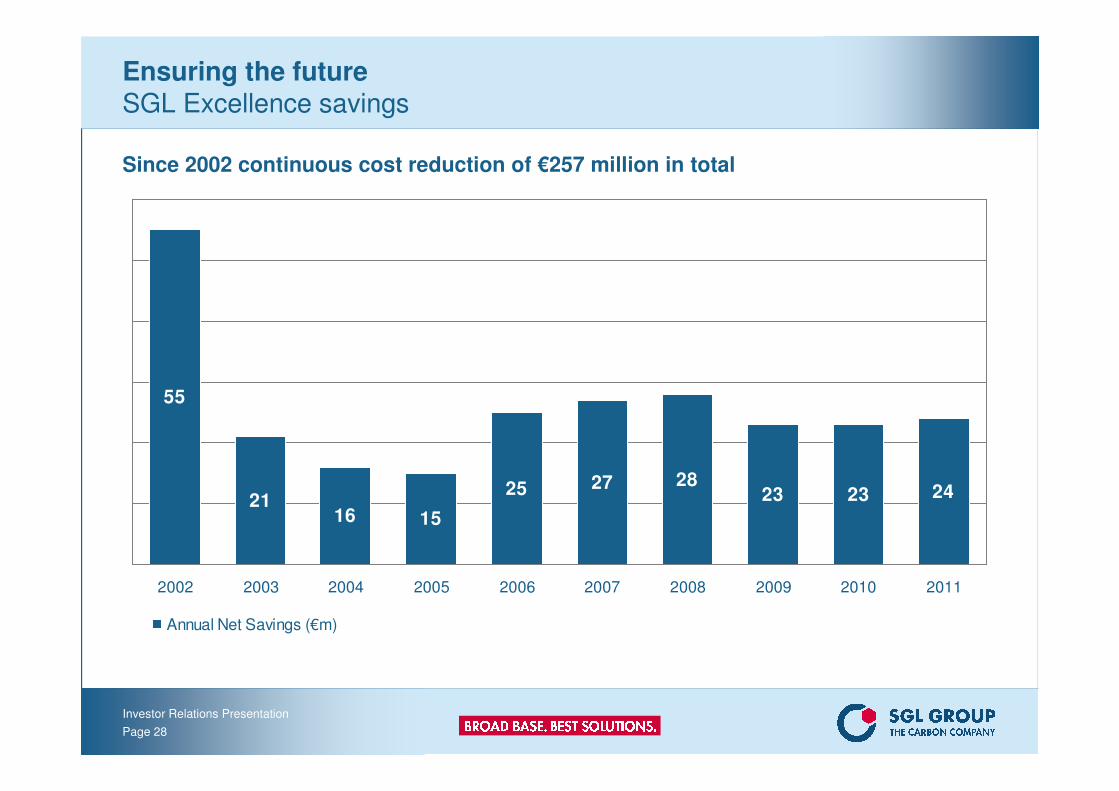
Ensuring the futureSGL Excellence savings
Since 2002 continuous cost reduction of €257 million in total
55
2116 15
25 27 2823 2423
2002 2003 2004 2005 2006 2007 2008 2009 2010 2011
Annual Net Savings (€m)
Investor Relations Presentation
Page 29
Latest Financials and 2012 Outlook

Investor Relations Presentation
Page 30
SGL GroupQ1/2012 Results for the Group
• Sales revenue increase: 5%, currency adjusted 3%
• EBIT includes sustainable cost savings of €6 million from SGL Excellence Initiative (SGL X)
10.09.5Return on sales (in %)
53.554.2EBITDA
14.914.1Net profit after non-controlling interests
0.230.20EPS, basic (in €)
20.921.1Profit before tax
-11.8-11.0Net financing result
363.8381.6Sales revenue
-3.6
36.3
Q1/2011Q1/2012in € million
-4.1Result from At-Equity accounted investments
36.2Operating profit (EBIT)

Investor Relations Presentation
Page 31
Financing Structure, Balance Sheet Ratios and Cash on HandAllow Continuation of Growth Path
SGL Group has currently no refinancing requirements
SGL Group established a solid long term financial structure in May 2007
• €200 million Corporate Bond at EURIBOR plus 125 bps (maturity 2015)
• €145.5 million* Convertible Bond at 0.75%, adjusted conversion price of €36.30 (maturity 2013)(originally €200 million prior to conversion)
• €200 million credit facility, undrawn (original 2012 maturity extended to 2015)
Followed by supplemental debt instruments in June 2009 and in April 2012
• €134.7 million* Convertible Bond at 3.5%, adjusted conversion price of €29.21 (maturity 2016)(originally €190 million prior to conversion)
• €240 million Convertible Bond at 2.75%, adjusted conversion price of €43.84 (maturity 2018)
SGL Group has solid balance sheet ratios and liquidity at end of March 2012
• Equity ratio: 47%
• Gearing: 0.39
• Total liquidity: €163 million
* As at April 30, 2012
Investor Relations Presentation
Page 32
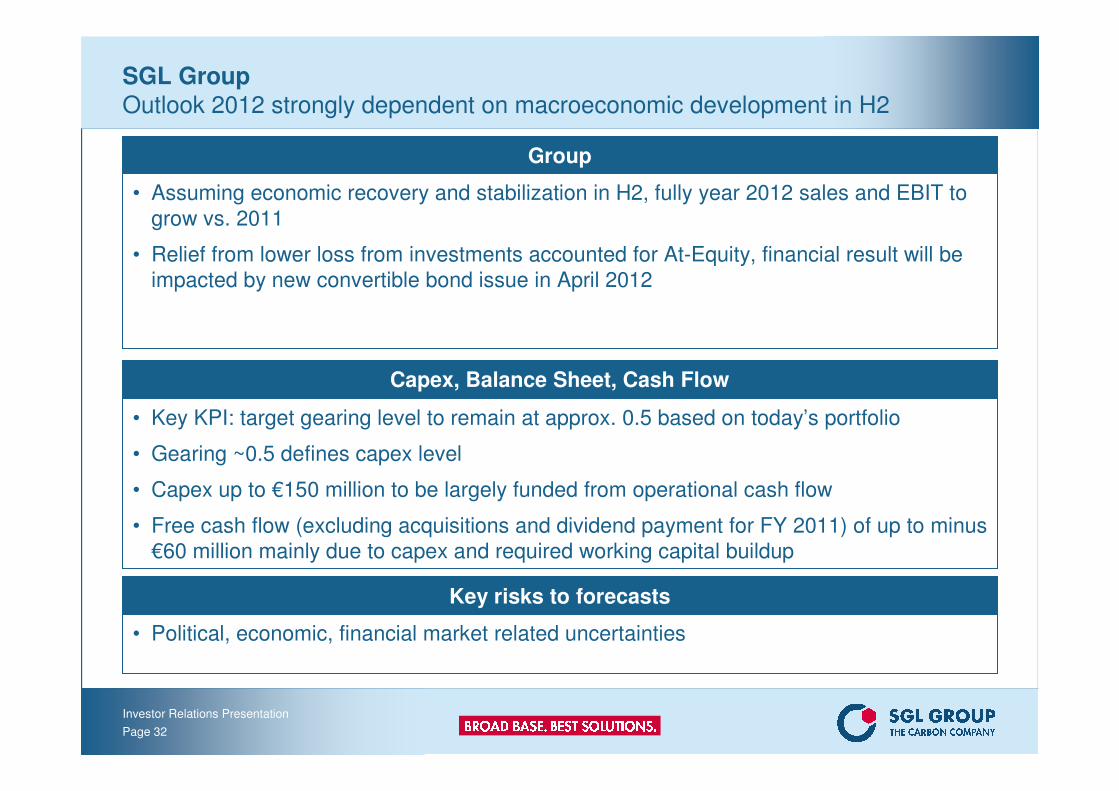
SGL GroupOutlook 2012 strongly dependent on macroeconomic development in H2
Group
• Assuming economic recovery and stabilization in H2, fully year 2012 sales and EBIT to
grow vs. 2011
• Relief from lower loss from investments accounted for At-Equity, financial result will be
impacted by new convertible bond issue in April 2012
Capex, Balance Sheet, Cash Flow
• Key KPI: target gearing level to remain at approx. 0.5 based on today’s portfolio
• Gearing ~0.5 defines capex level
• Capex up to €150 million to be largely funded from operational cash flow
• Free cash flow (excluding acquisitions and dividend payment for FY 2011) of up to minus
€60 million mainly due to capex and required working capital buildup
Key risks to forecasts
• Political, economic, financial market related uncertainties
Investor Relations Presentation
Page 33
Fundamental long-term growth drivers and mid term horizon
Investor Relations Presentation
Page 34
Strong growth in emerging countries(BRIC etc.)
• Industrialization• Infrastructure build up
Increasing demand forgraphite electrodes and cathodes
Fundamental long-term growth drivers for our businesses
Investor Relations Presentation
Page 35
Fundamental long-term growth drivers for our businesses
SGL Group approach
“Towards an ecologically sensitive world”
Key challengesChanged economic
environmentEnergy / raw
materials availabilityClimatechange
Sustainable solutions
Energyefficiency
Lightweight
Alternativeenergies
Carbon contributes to all three sustainable solutions
Investor Relations Presentation
Page 36
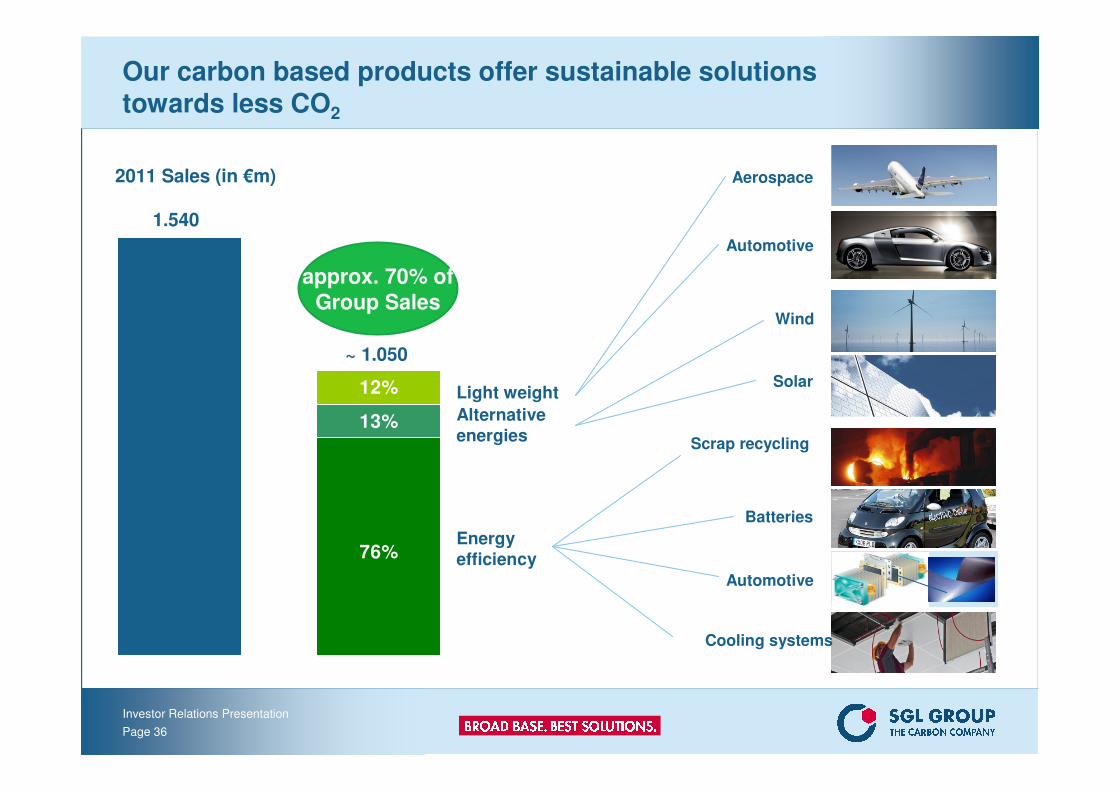
Our carbon based products offer sustainable solutionstowards less CO2
76%
13%
12%
1.540
~ 1.050
Light weight
Alternativeenergies
Energyefficiency
Scrap recycling
Wind
Aerospace
Automotive
Solar
Batteries
Cooling systems
Automotive
2011 Sales (in €m)
approx. 70% ofGroup Sales
Investor Relations Presentation
Page 37
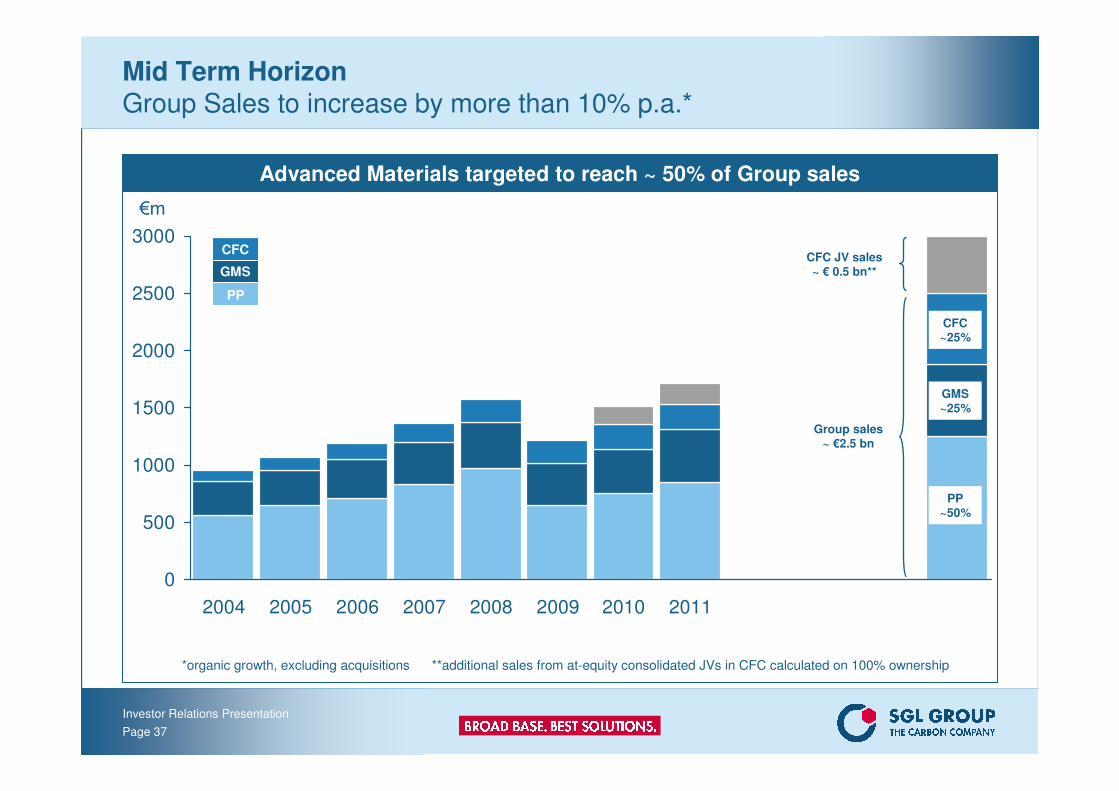
Advanced Materials targeted to reach ~ 50% of Group sales
Mid Term HorizonGroup Sales to increase by more than 10% p.a.*
0
500
1000
1500
2000
2500
3000
2004 2005 2006 2007 2008 2009 2010 2011 2012 2013 2014 2015
PP~50%
GMS~25%
€m
*organic growth, excluding acquisitions **additional sales from at-equity consolidated JVs in CFC calculated on 100% ownership
Group sales~ €2.5 bn
CFC JV sales~ € 0.5 bn**
CFC~25%
PP
GMS
CFC
Investor Relations Presentation
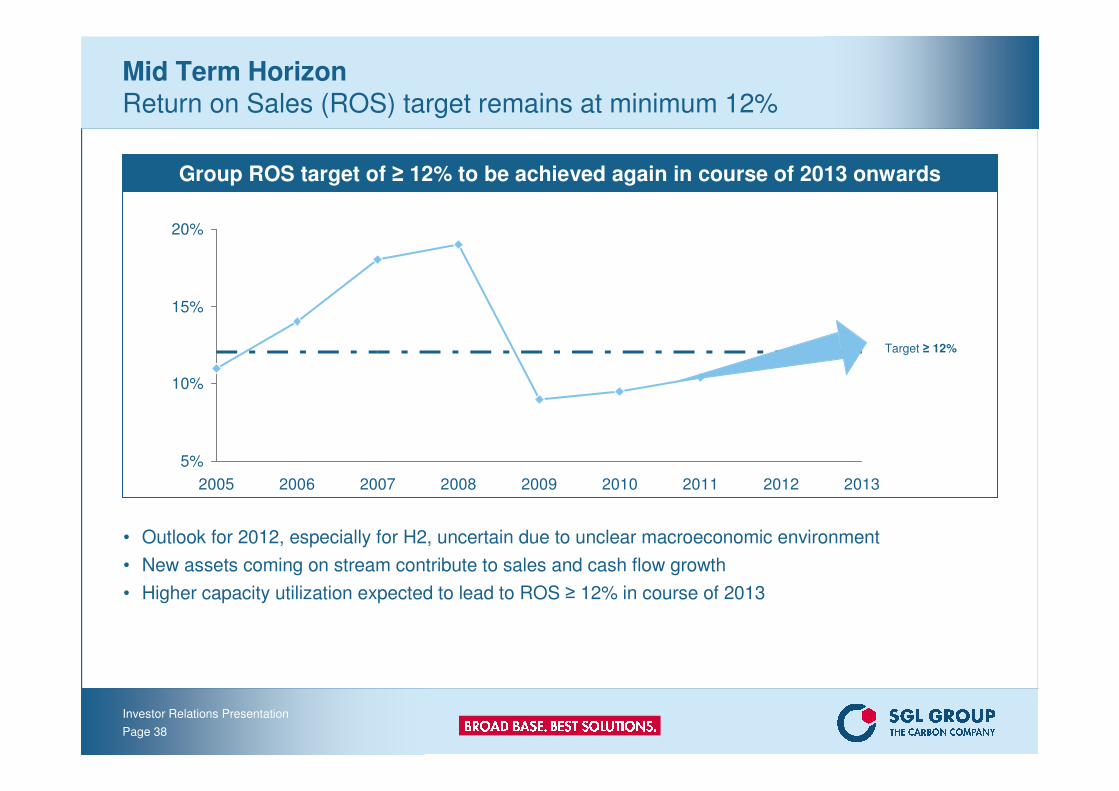
Page 38
5%
10%
15%
20%
2005 2006 2007 2008 2009 2010 2011 2012 2013
Group ROS target of ≥ 12% to be achieved again in course of 2013 onwards
Mid Term Horizon Return on Sales (ROS) target remains at minimum 12%
• Outlook for 2012, especially for H2, uncertain due to unclear macroeconomic environment
• New assets coming on stream contribute to sales and cash flow growth
• Higher capacity utilization expected to lead to ROS ≥ 12% in course of 2013
Target ≥ 12%

Investor Relations Presentation
Page 39
0%
5%
10%
15%
20%
25%
30%
2005 2006 2007 2008 2009 2010 2011 2012 2013 2014 2015
0%
20%
40%
60%
80%
100%
120%
Group ROCE target of ≥ 17% to be reached again by the end of the planning period
Mid Term Horizon Return on Capital Employed (ROCE) target remains at minimum 17%
• Anticyclical investments provide basis for long term growth
• The resulting sales growth will lead to normalized capital intensity* improving from 109% in 2011 to ~80% as investment pace slows and sales growth accelerates
• As a consequence we expect to reach our Group ROCE target ≥ 17% again towards the end of the planning period
Target ≥ 17%
Target ~80%
Capital intensity* (right hand scale)
ROCE (left hand scale)
*capital employed/sales, measure of capital invested per € of sales
Investor Relations Presentation
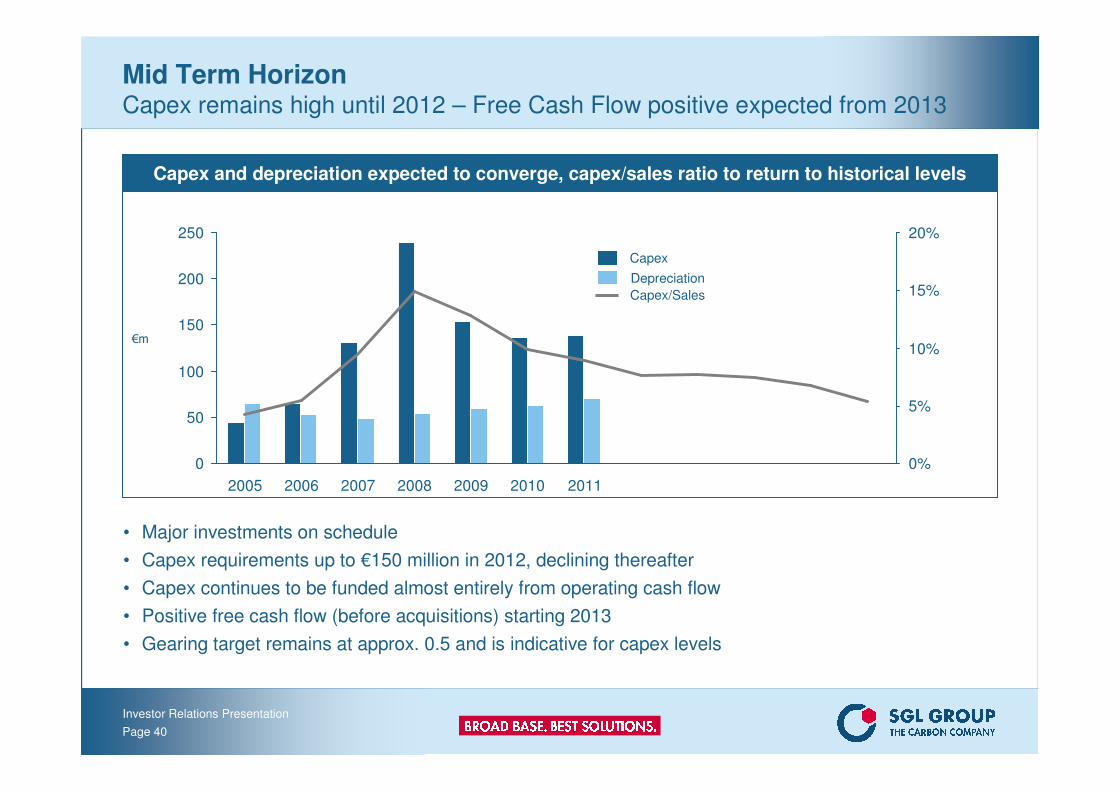
Page 40
Capex and depreciation expected to converge, capex/sales ratio to return to historical levels
Mid Term Horizon Capex remains high until 2012 – Free Cash Flow positive expected from 2013
• Major investments on schedule
• Capex requirements up to €150 million in 2012, declining thereafter
• Capex continues to be funded almost entirely from operating cash flow
• Positive free cash flow (before acquisitions) starting 2013
• Gearing target remains at approx. 0.5 and is indicative for capex levels
0
50
100
150
200
250
2005 2006 2007 2008 2009 2010 2011
0%
5%
10%
15%
20%
€m
Depreciation
Capex
Capex/Sales
Investor Relations Presentation
Page 41
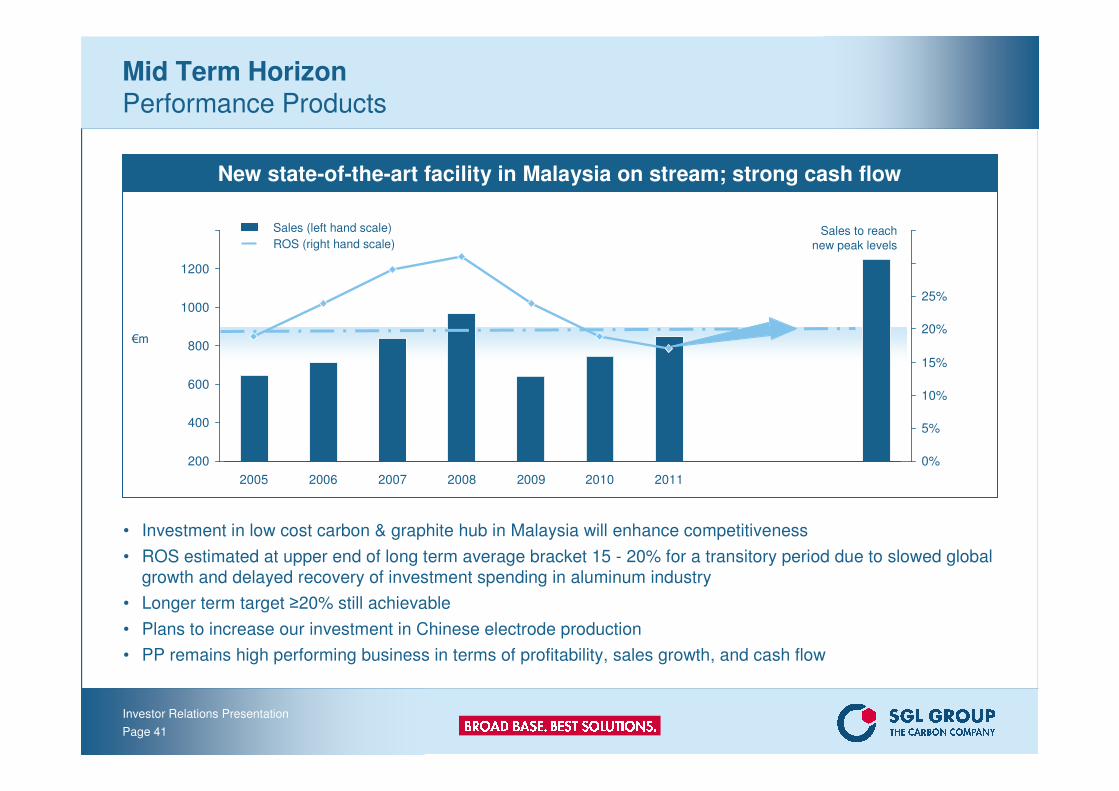
New state-of-the-art facility in Malaysia on stream; strong cash flow
Mid Term Horizon Performance Products
• Investment in low cost carbon & graphite hub in Malaysia will enhance competitiveness
• ROS estimated at upper end of long term average bracket 15 - 20% for a transitory period due to slowed global
growth and delayed recovery of investment spending in aluminum industry
• Longer term target ≥20% still achievable
• Plans to increase our investment in Chinese electrode production
• PP remains high performing business in terms of profitability, sales growth, and cash flow
200
400
600
800
1000
1200
1400
2005 2006 2007 2008 2009 2010 2011 2012 2013 2015
0%
5%
10%
15%
20%
25%
30%
35%
€m
Sales (left hand scale)
ROS (right hand scale)Sales to reach
new peak levels
Investor Relations Presentation
Page 42
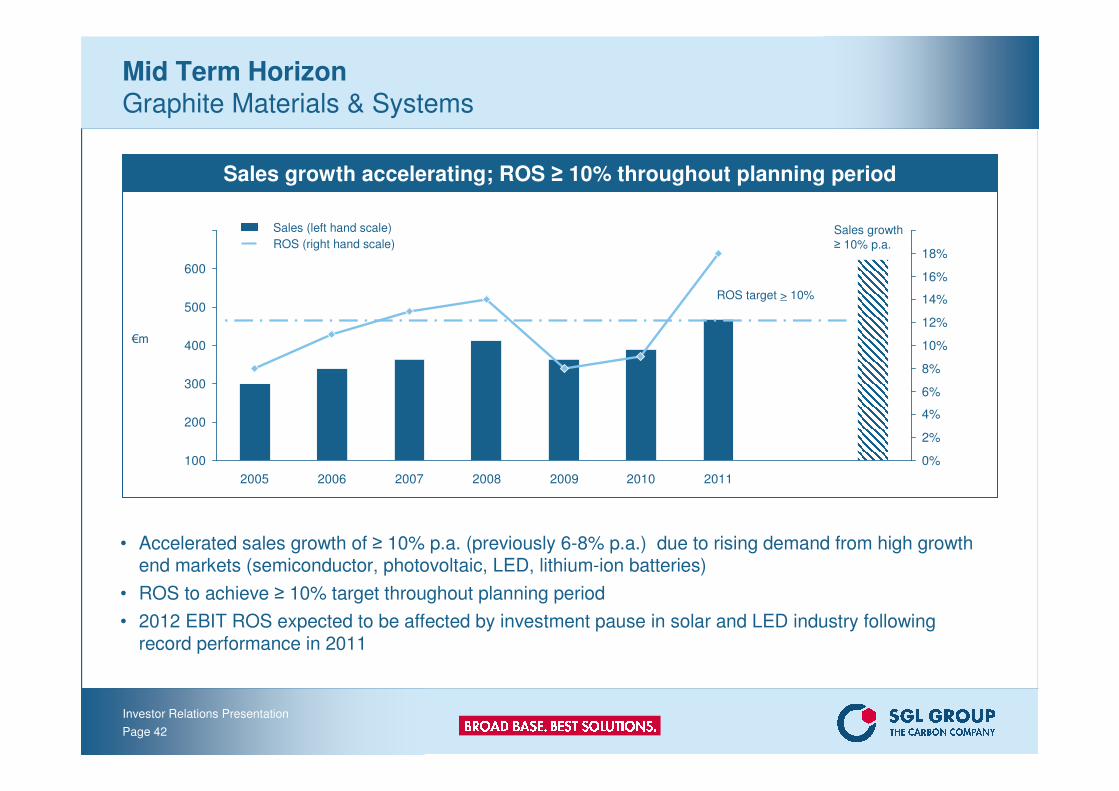
Sales growth accelerating; ROS ≥ 10% throughout planning period
Mid Term Horizon Graphite Materials & Systems
• Accelerated sales growth of ≥ 10% p.a. (previously 6-8% p.a.) due to rising demand from high growth end markets (semiconductor, photovoltaic, LED, lithium-ion batteries)
• ROS to achieve ≥ 10% target throughout planning period
• 2012 EBIT ROS expected to be affected by investment pause in solar and LED industry following record performance in 2011
100
200
300
400
500
600
700
2005 2006 2007 2008 2009 2010 2011 2015
0%
2%
4%
6%
8%
10%
12%
14%
16%
18%
20%
€m
Sales growth
≥ 10% p.a.
ROS target > 10%
Sales (left hand scale)
ROS (right hand scale)
Investor Relations Presentation
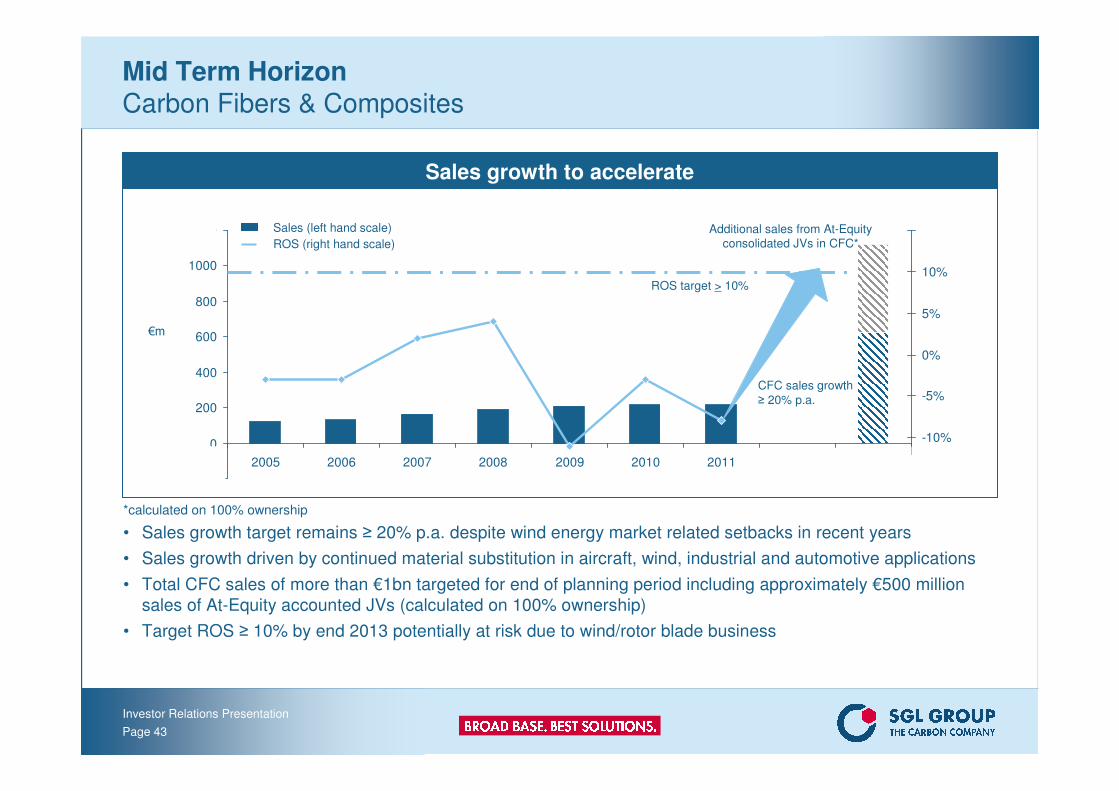
Page 43
Sales growth to accelerate
Mid Term Horizon Carbon Fibers & Composites
• Sales growth target remains ≥ 20% p.a. despite wind energy market related setbacks in recent years
• Sales growth driven by continued material substitution in aircraft, wind, industrial and automotive applications
• Total CFC sales of more than €1bn targeted for end of planning period including approximately €500 million
sales of At-Equity accounted JVs (calculated on 100% ownership)
• Target ROS ≥ 10% by end 2013 potentially at risk due to wind/rotor blade business
-200
0
200
400
600
800
1000
1200
2005 2006 2007 2008 2009 2010 2011 2013 2015
-15%
-10%
-5%
0%
5%
10%
15%
€m
CFC sales growth
≥ 20% p.a.
ROS target > 10%
Sales (left hand scale)
ROS (right hand scale)
Additional sales from At-Equity
consolidated JVs in CFC*
*calculated on 100% ownership
Investor Relations Presentation
Page 44
Mid Term Horizon Key Messages and Targets on track
• New assets leading to significant sales growth more than 10% p.a.
• Reaching Group sales of more than €2.5 billion
• in addition approximately €500 million from At-Equity accounted JVs in CFC
(calculated on 100% ownership)
• Sales growth targets raised and confirmed
• CFC from ≥ 15% p.a. ≥ 20% p.a.
• GMS from 6% - 8% p.a. ≥ 10% p.a.
• PP reaches record sales levels
• All three Business Areas to become profit pillars as a result of a more balanced portfolio
• Group ROS target ≥ 12% to be reached in course of 2013
• Group ROCE target ≥ 17% to be achieved by end of planning period
• Gearing target remains at approx. 0.5
• Free cash flow expected to turn positive in 2013
Investor Relations Presentation
Page 45
Thank you for your attention !We look forward to your questions !
Investor Relations Presentation
Page 46
Important note:
This presentation contains forward looking statements based on the information currently available to us and on our current projections and assumptions. By nature, forward looking statements are associated with known and unknown risks and
uncertainties, as a consequence of which actual developments and results can deviate significantly from the assessment
published in this presentation. Forward looking statements are not to be understood as guarantees. Rather, future
developments and results depend on a number of factors; they entail various risks and unanticipated circumstances and are
based on assumptions which may prove to be inaccurate. These risks and uncertainties include, for example, unforeseeable changes in political, economic, legal and business conditions, particularly relating to our main customer industries, such as
electric steel production, to the competitive environment, to interest rate and exchange rate fluctuations, to technological
developments, and to other risks and unanticipated circumstances. Other risks that may arise in our opinion include price
developments, unexpected developments associated with acquisitions and subsidiaries, and unforeseen risks associated
with ongoing cost savings programs. SGL Group assumes no responsibility in this regard and does not intend to adjust or otherwise update these forward looking statements.