deutsche bank leveraged finance conference george gresham september 24, 2008
TRANSCRIPT
Deutsche Bank Leveraged Deutsche Bank Leveraged Finance ConferenceFinance Conference
George Gresham
September 24, 2008September 24, 2008
Forward-Looking StatementsForward-Looking Statements
Statements in this presentation that are not reported financial results or other historical information are “forward-looking Statements in this presentation that are not reported financial results or other historical information are “forward-looking statements” within the meaning of the Private Securities Litigation Reform Act of 1995. Such forward-looking statements statements” within the meaning of the Private Securities Litigation Reform Act of 1995. Such forward-looking statements include: (1) our intent to grow our business by growing revenues with current customers, winning new customers, include: (1) our intent to grow our business by growing revenues with current customers, winning new customers, penetrating new markets, innovating and leveraging our databases and marketing assets; (2) our plans to renew existing penetrating new markets, innovating and leveraging our databases and marketing assets; (2) our plans to renew existing customers and win new customers; (3) our plans to increase same-store sales; (4) our expectation of growth in gaming customers and win new customers; (3) our plans to increase same-store sales; (4) our expectation of growth in gaming revenue and gaming expansion in various markets; (5) our belief that providing cash access services on new platforms revenue and gaming expansion in various markets; (5) our belief that providing cash access services on new platforms should enhance profitability and margins; (6) our belief that higher margin platforms will increase their installed base in the should enhance profitability and margins; (6) our belief that higher margin platforms will increase their installed base in the future, (7) our belief that the Arriva card should enhance profitability, (8) our guidance with respect to revenue, gross margin, future, (7) our belief that the Arriva card should enhance profitability, (8) our guidance with respect to revenue, gross margin, operating expense and operating income, and (9) our estimated future free cash flow and uses thereof. Such forward-looking operating expense and operating income, and (9) our estimated future free cash flow and uses thereof. Such forward-looking statements are based on current plans, estimates and expectations, and are not guarantees of future performance. They are statements are based on current plans, estimates and expectations, and are not guarantees of future performance. They are subject to a number of business risks and uncertainties, any of which could cause actual results to differ materially from subject to a number of business risks and uncertainties, any of which could cause actual results to differ materially from those expressed in or implied by the forward-looking statements, including the following: (1) technical, competitive and those expressed in or implied by the forward-looking statements, including the following: (1) technical, competitive and regulatory impediments, operational and resource limitations and gaming establishment acceptance of our value regulatory impediments, operational and resource limitations and gaming establishment acceptance of our value propositions; (2) competitive pressures such as pricing, availability and breadth of offerings or gaming establishments propositions; (2) competitive pressures such as pricing, availability and breadth of offerings or gaming establishments replacing their outsourced cash access services with in-house cash access services; (3) competitive pressures that require replacing their outsourced cash access services with in-house cash access services; (3) competitive pressures that require us to reduce our pricing or changes in gaming establishment patron cash access behavior; (4) regulatory or social us to reduce our pricing or changes in gaming establishment patron cash access behavior; (4) regulatory or social responsibility impediments, economic downturns, a decline in the popularity of gaming or changes in the demographic profile responsibility impediments, economic downturns, a decline in the popularity of gaming or changes in the demographic profile of gaming patrons; (5) our failure to obtain regulatory approval for our EDITH platform or our inability to enter into strategic of gaming patrons; (5) our failure to obtain regulatory approval for our EDITH platform or our inability to enter into strategic relationships with providers of redemption kiosks on favorable terms; (6) gaming patron preference for using traditional relationships with providers of redemption kiosks on favorable terms; (6) gaming patron preference for using traditional gaming establishment cashiers or gaming establishment unwillingness to incur capital expenditures for unmanned platforms; gaming establishment cashiers or gaming establishment unwillingness to incur capital expenditures for unmanned platforms; (7) our failure to properly manage the credit risk associated with the Arriva card; (8) our inability to control the demand for (7) our failure to properly manage the credit risk associated with the Arriva card; (8) our inability to control the demand for cash access services within gaming establishments, competition from new and existing competitors and the incurrence of cash access services within gaming establishments, competition from new and existing competitors and the incurrence of unplanned operating or capital expenses; (9) our failure to achieve estimated future income levels, unanticipated capital unplanned operating or capital expenses; (9) our failure to achieve estimated future income levels, unanticipated capital expenditures, changes in tax rates or position and the need to deploy cash flow to existing or new business development expenditures, changes in tax rates or position and the need to deploy cash flow to existing or new business development initiatives. Additional factors that could cause actual results to differ materially are included under the heading “Risk Factors” initiatives. Additional factors that could cause actual results to differ materially are included under the heading “Risk Factors” in the Company’s Annual Reports on Form 10‑K and Quarterly Reports on Form 10‑Q filed with the U.S. Securities and in the Company’s Annual Reports on Form 10‑K and Quarterly Reports on Form 10‑Q filed with the U.S. Securities and Exchange Commission from time to time. The Company undertakes no obligation to publicly update or revise any forward-Exchange Commission from time to time. The Company undertakes no obligation to publicly update or revise any forward-looking statement. looking statement.
This presentation includes pro forma information, or non-GAAP financial measures, that are different from financial measures This presentation includes pro forma information, or non-GAAP financial measures, that are different from financial measures calculated in accordance with GAAP and may be different from pro forma calculations made by other companies. calculated in accordance with GAAP and may be different from pro forma calculations made by other companies.
22
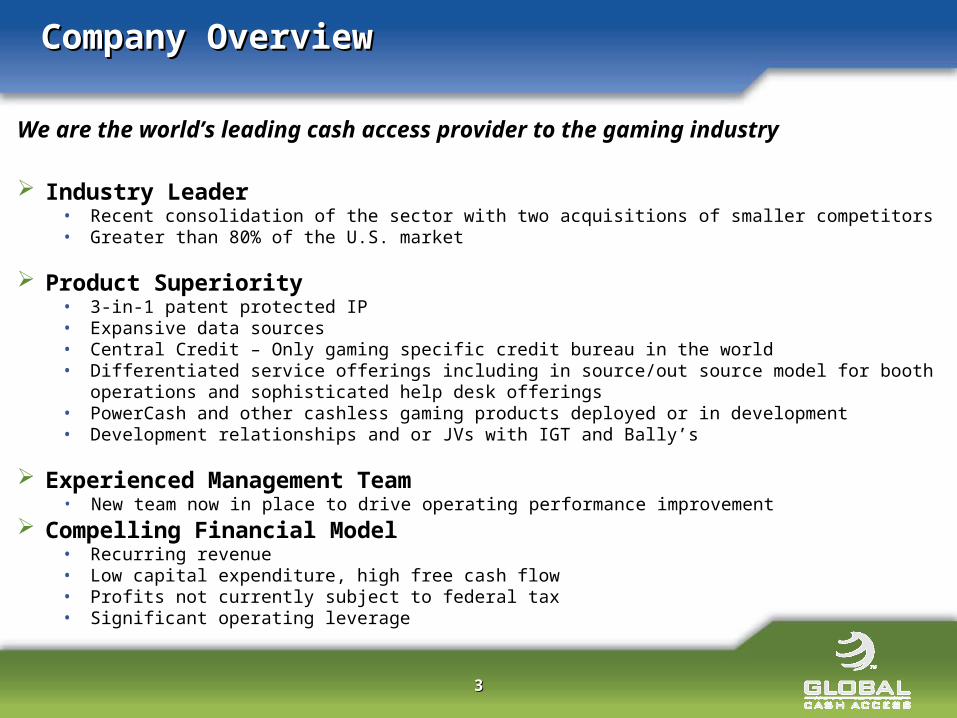
Company OverviewCompany Overview
We are the world’s leading cash access provider to the gaming industry
Industry Leader • Recent consolidation of the sector with two acquisitions of smaller competitors• Greater than 80% of the U.S. market
Product Superiority • 3-in-1 patent protected IP• Expansive data sources• Central Credit – Only gaming specific credit bureau in the world• Differentiated service offerings including in source/out source model for booth operations and
sophisticated help desk offerings• PowerCash and other cashless gaming products deployed or in development• Development relationships and or JVs with IGT and Bally’s
Experienced Management Team • New team now in place to drive operating performance improvement
Compelling Financial Model • Recurring revenue• Low capital expenditure, high free cash flow• Profits not currently subject to federal tax• Significant operating leverage
33
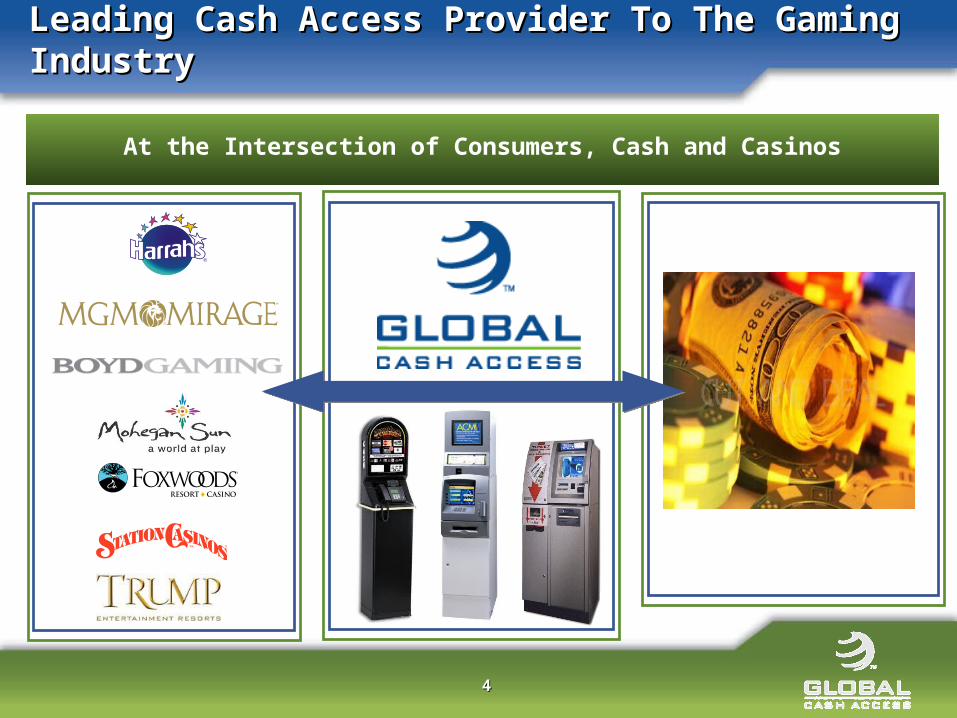
Leading Cash Access Provider To The Gaming IndustryLeading Cash Access Provider To The Gaming Industry
44
At the Intersection of Consumers, Cash and Casinos
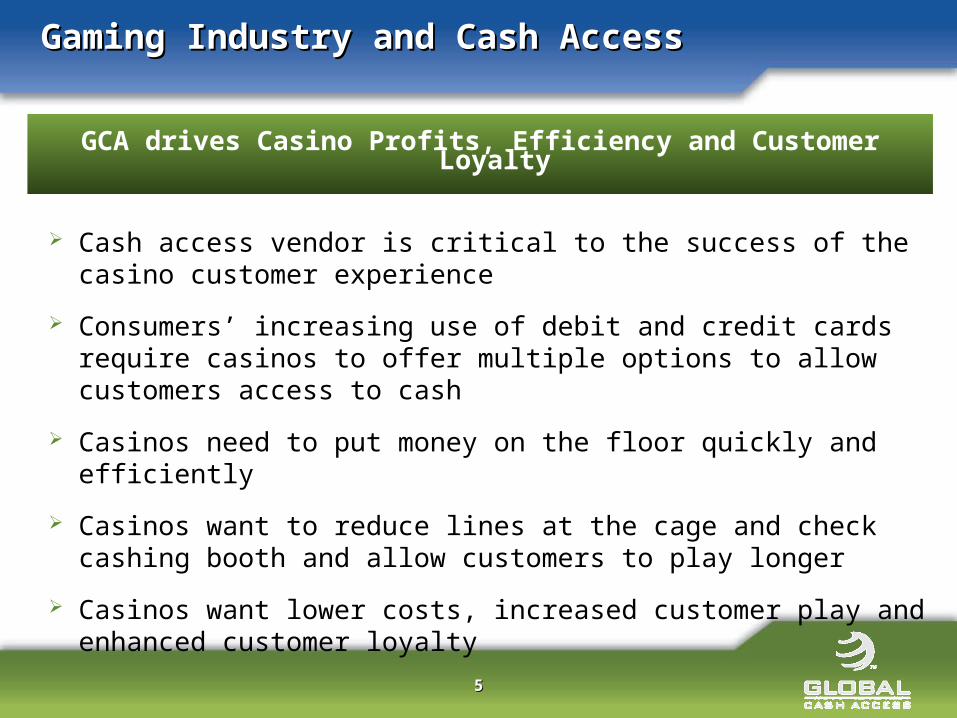
Gaming Industry and Cash AccessGaming Industry and Cash Access
55
Cash access vendor is critical to the success of the casino customer experience
Consumers’ increasing use of debit and credit cards require casinos to offer multiple options to allow customers access to cash
Casinos need to put money on the floor quickly and efficiently
Casinos want to reduce lines at the cage and check cashing booth and allow customers to play longer
Casinos want lower costs, increased customer play and enhanced customer loyalty
GCA drives Casino Profits, Efficiency and Customer Loyalty
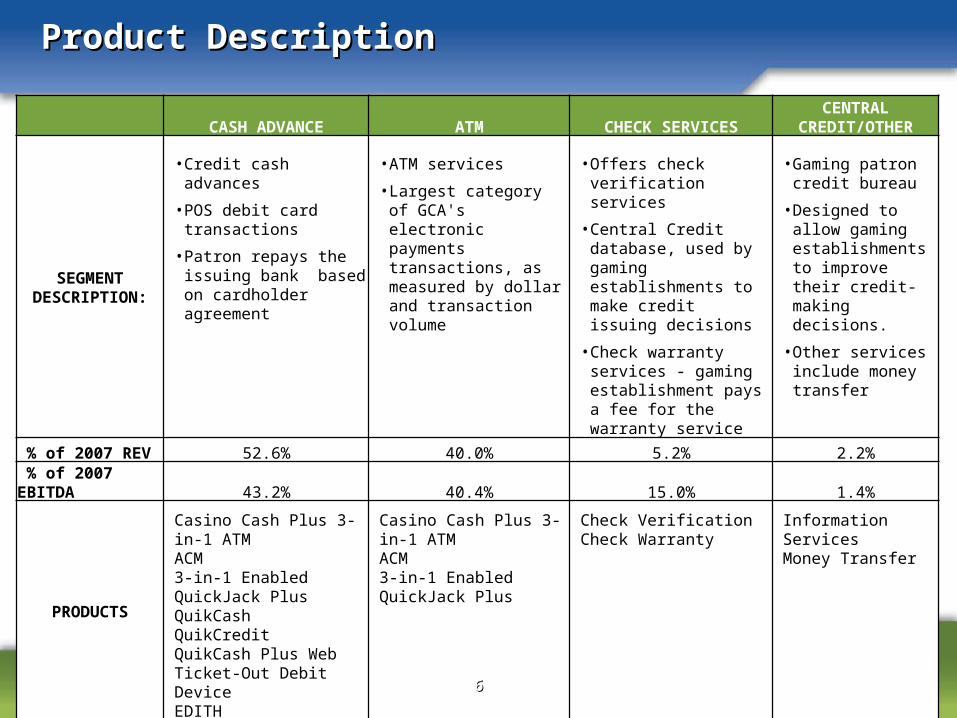
Product DescriptionProduct Description
CASH ADVANCE ATM CHECK SERVICESCENTRAL
CREDIT/OTHER
SEGMENT DESCRIPTION:
• Credit cash advances
• POS debit card transactions
• Patron repays the issuing bank based on cardholder agreement
• ATM services
• Largest category of GCA's electronic payments transactions, as measured by dollar and transaction volume
• Offers check verification services
• Central Credit database, used by gaming establishments to make credit issuing decisions
• Check warranty services - gaming establishment pays a fee for the warranty service
• Gaming patron credit bureau
• Designed to allow gaming establishments to improve their credit-making decisions.
• Other services include money transfer
% of 2007 REV 52.6% 40.0% 5.2% 2.2%
% of 2007 EBITDA 43.2% 40.4% 15.0% 1.4%
PRODUCTS
Casino Cash Plus 3-in-1 ATMACM3-in-1 Enabled QuickJack PlusQuikCashQuikCreditQuikCash Plus WebTicket-Out Debit DeviceEDITH
Casino Cash Plus 3-in-1 ATMACM3-in-1 Enabled QuickJack Plus
Check VerificationCheck Warranty
Information ServicesMoney Transfer
66
77
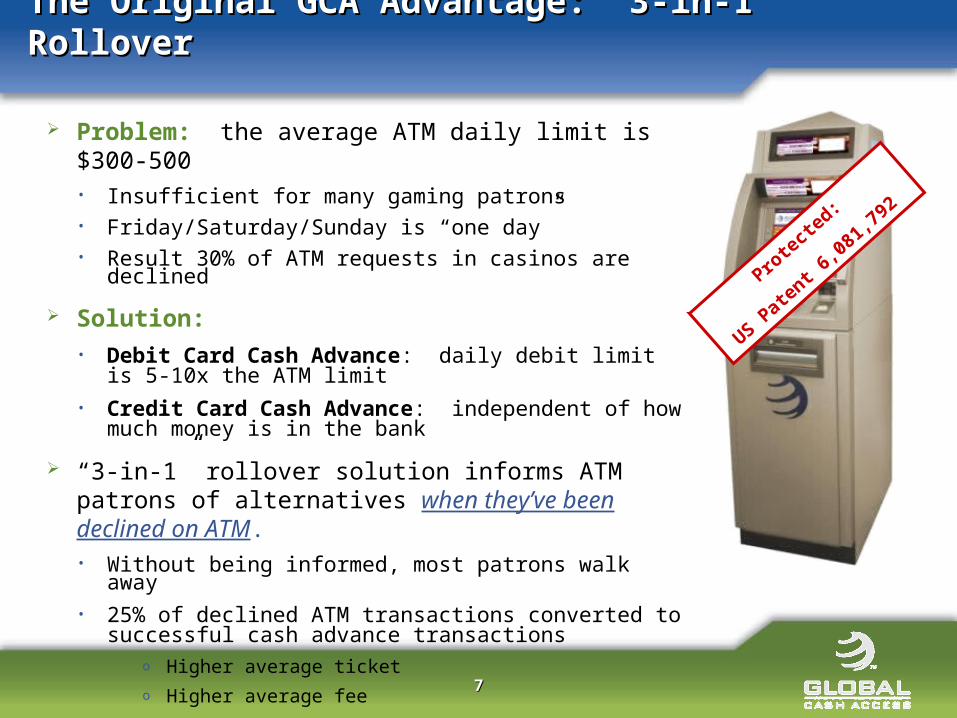
The Original GCA Advantage: 3-in-1 RolloverThe Original GCA Advantage: 3-in-1 Rollover
Prote
cted
:
US Pat
ent 6
,081
,792
Problem: the average ATM daily limit is $300-500• Insufficient for many gaming patrons• Friday/Saturday/Sunday is “one day”• Result 30% of ATM requests in casinos are declined
Solution:• Debit Card Cash Advance: daily debit limit is 5-10x the
ATM limit
• Credit Card Cash Advance: independent of how much money is in the bank
“3-in-1” rollover solution informs ATM patrons of alternatives when they’ve been declined on ATM.• Without being informed, most patrons walk away• 25% of declined ATM transactions converted to successful
cash advance transactionso Higher average ticketo Higher average fee
88
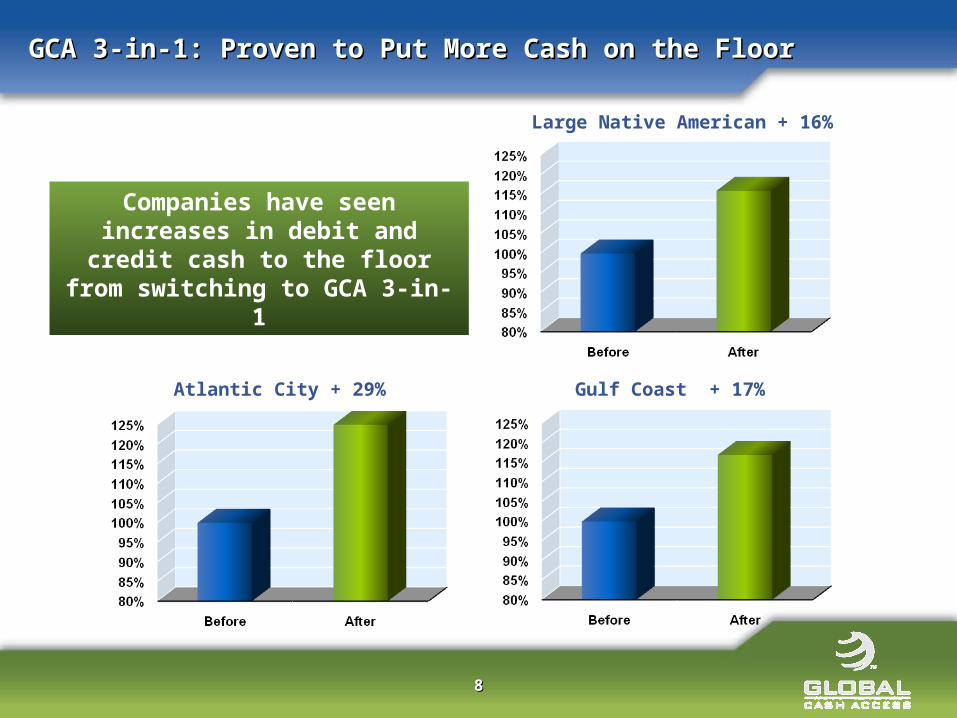
GCA 3-in-1: Proven to Put More Cash on the FloorGCA 3-in-1: Proven to Put More Cash on the Floor
Large Native American + 16%
Atlantic City + 29% Gulf Coast + 17%
Companies have seen increases in debit and credit cash to the floor
from switching to GCA 3-in-1
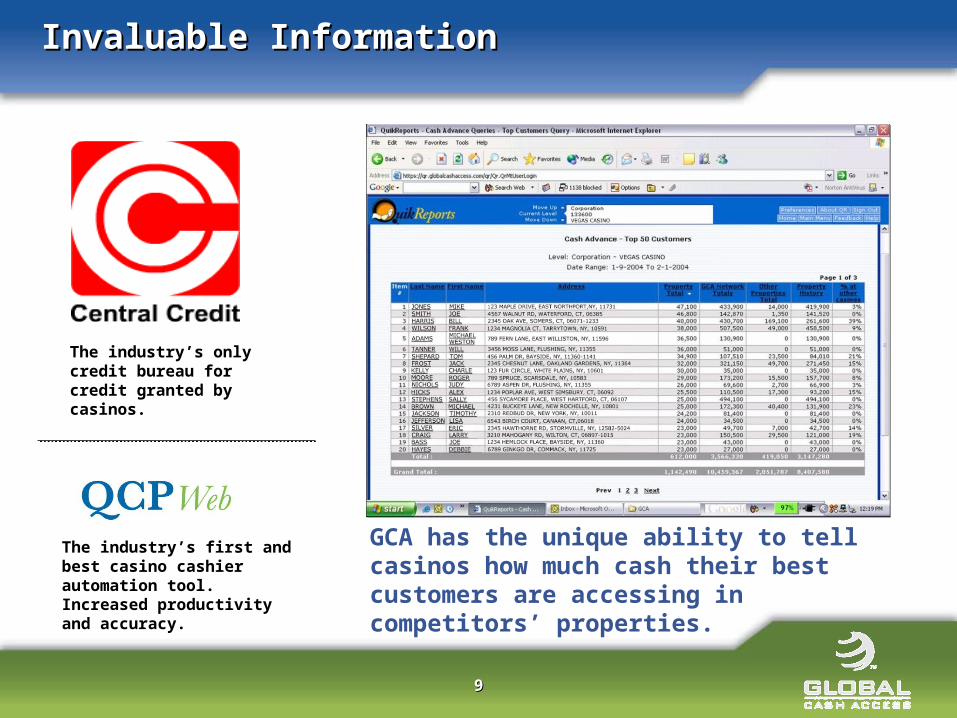
Invaluable InformationInvaluable Information
99
The industry’s only credit bureau for credit granted by casinos.
The industry’s first and best casino cashier automation tool. Increased productivity and accuracy.
GCA has the unique ability to tell casinos how much cash their best customers are accessing in competitors’ properties.
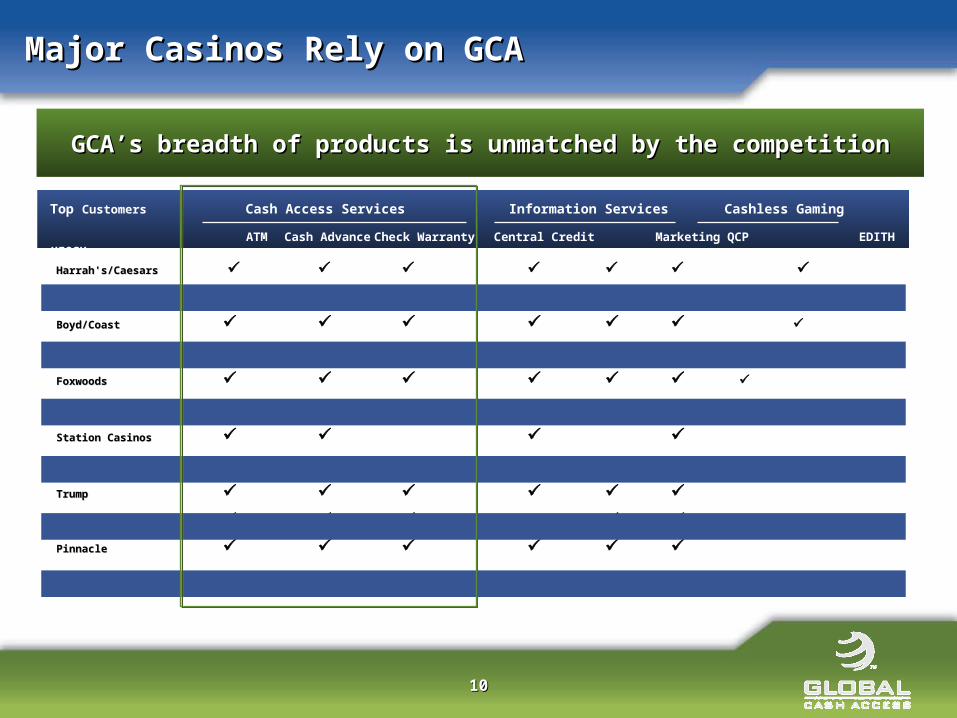
Major Casinos Rely on GCAMajor Casinos Rely on GCA
1010
GCA’s breadth of products is unmatched by the competitionGCA’s breadth of products is unmatched by the competition
Harrah's/CaesarsHarrah's/Caesars
MGM MIRAGEMGM MIRAGE
Boyd/CoastBoyd/Coast
Penn NationalPenn National
FoxwoodsFoxwoods
Mohegan SunMohegan Sun
Station CasinosStation Casinos
WynnWynn
TrumpTrump
PechangaPechanga
PinnaclePinnacle
Thunder ValleyThunder Valley
ATM Cash Advance Check Warranty Central Credit Marketing QCP EDITH KIOSK
Top Customers Cash Access Services Information Services Cashless Gaming
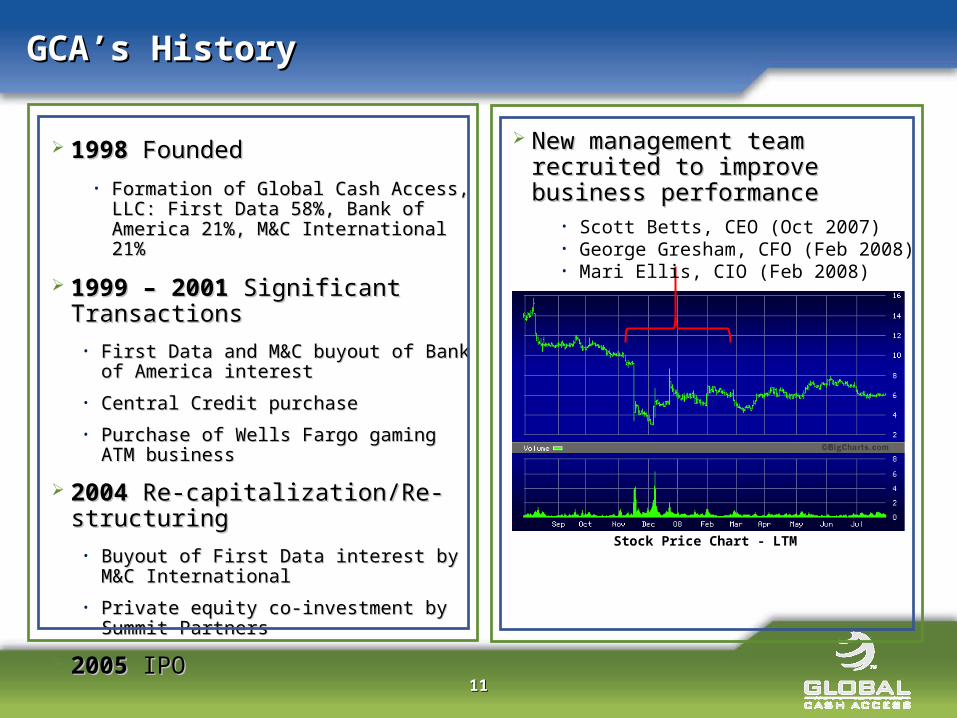
GCA’s HistoryGCA’s History
1111
1998 1998 FoundedFounded
• Formation of Global Cash Access, LLC: Formation of Global Cash Access, LLC: First Data 58%, Bank of America 21%, First Data 58%, Bank of America 21%, M&C International 21%M&C International 21%
1999 – 2001 1999 – 2001 Significant TransactionsSignificant Transactions• First Data and M&C buyout of Bank of First Data and M&C buyout of Bank of
America interestAmerica interest
• Central Credit purchaseCentral Credit purchase
• Purchase of Wells Fargo gaming ATM Purchase of Wells Fargo gaming ATM businessbusiness
2004 2004 Re-capitalization/Re-structuringRe-capitalization/Re-structuring• Buyout of First Data interest by M&C Buyout of First Data interest by M&C
InternationalInternational
• Private equity co-investment by Summit Private equity co-investment by Summit PartnersPartners
20052005 IPO IPO
Stock Price Chart - LTM
New management team recruited to New management team recruited to improve business performanceimprove business performance
• Scott Betts, CEO (Oct 2007)• George Gresham, CFO (Feb 2008)• Mari Ellis, CIO (Feb 2008)
Experienced Management TeamExperienced Management Team
Payments/Gaming
Experience – Years
Scott Betts - President, Chief Executive Officer, Secretary and Treasurer 7
• Joined GCA in late 2007• FDC, Payments industry consultant
George W. Gresham - Executive Vice President and Chief Financial Officer 6
• Joined GCA in February 2008 • EFD – eFunds Corporation, Deloitte & Touche, LLP.
Kathryn S. Lever - Executive Vice President and General Counsel 7
• Joined GCA in September 2005 • Practiced gaming law/regulation at Brownstein, Hyatt, Farber, and Shreck LP
Mark Labay - Senior Vice President, Product Management 6
• Joined GCA in 2002• Deloitte & Touche, LLP.
Kurt Sullivan - Executive Vice President, Check Services and Central Credit 22
• Joined GCA in December 2000 • Circus Circus Enterprises, Inc.
Mari Ellis - Executive Vice President, Technology 11
• Joined GCA in February 2008 • FDC, Blackhawk, Concord EFS
1212
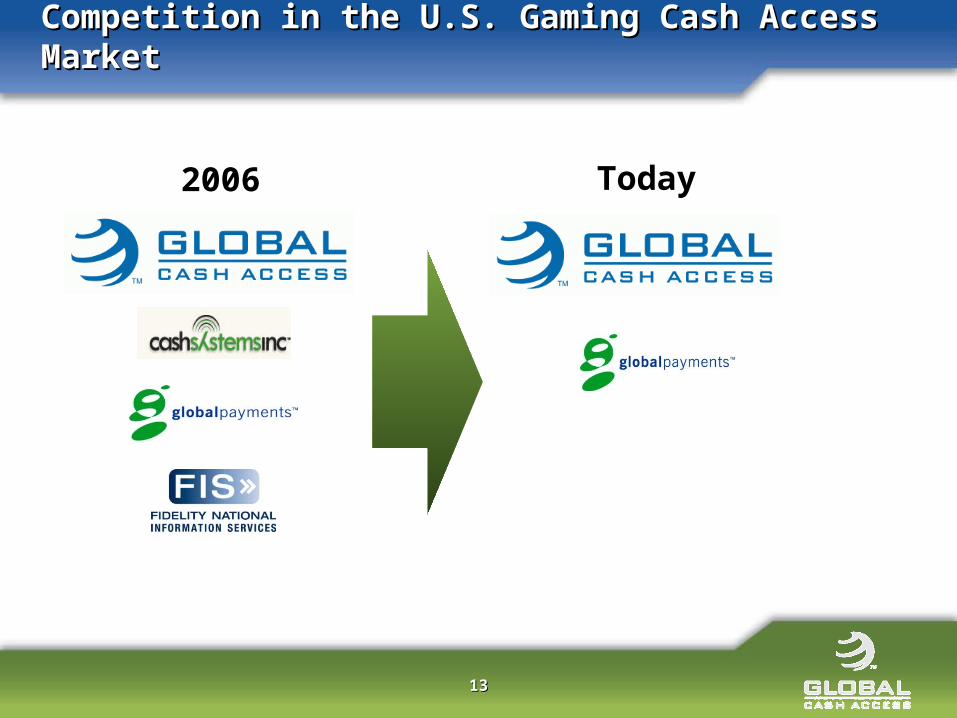
Competition in the U.S. Gaming Cash Access MarketCompetition in the U.S. Gaming Cash Access Market
1313
2006 Today
1414
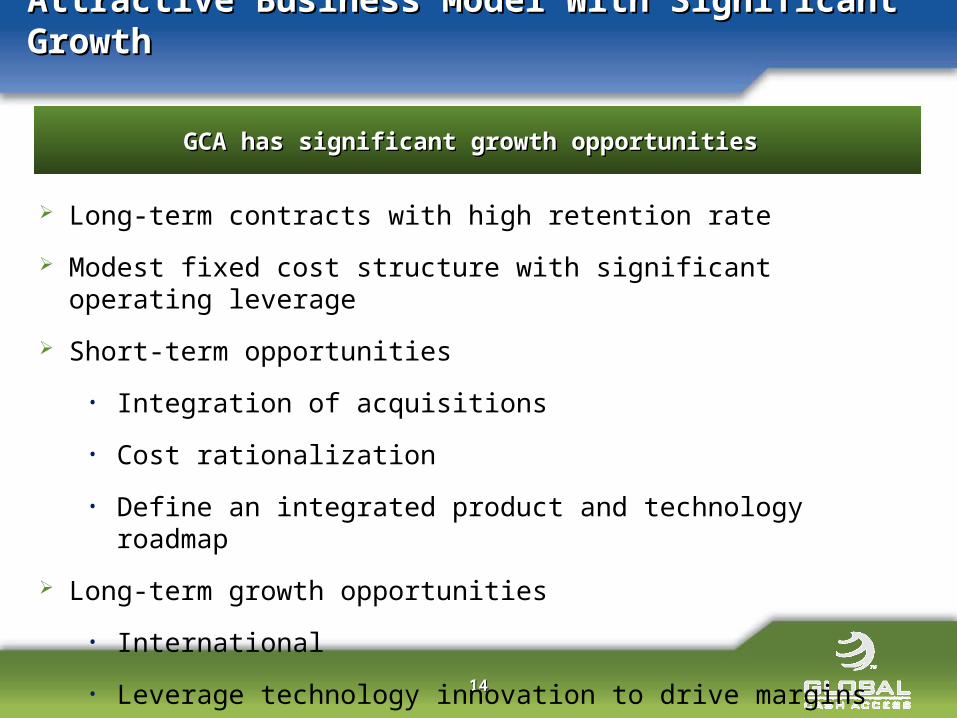
Attractive Business Model With Significant GrowthAttractive Business Model With Significant Growth
Long-term contracts with high retention rate
Modest fixed cost structure with significant operating leverage
Short-term opportunities
• Integration of acquisitions
• Cost rationalization
• Define an integrated product and technology roadmap
Long-term growth opportunities
• International
• Leverage technology innovation to drive margins
GCA has significant growth opportunities GCA has significant growth opportunities
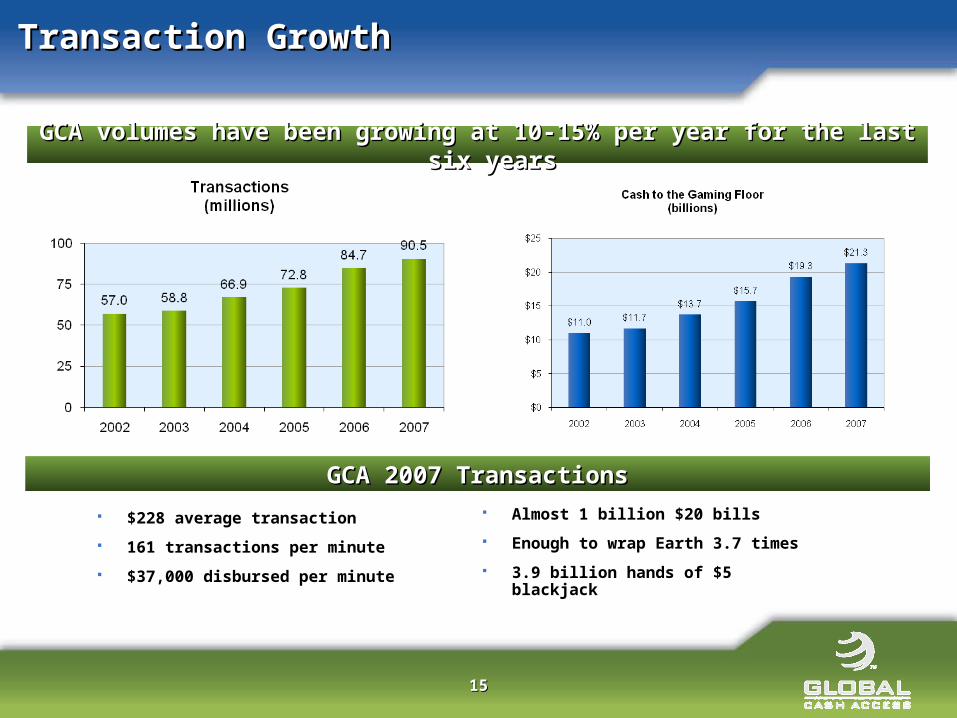
Transaction GrowthTransaction Growth
1515
GCA 2007 TransactionsGCA 2007 Transactions
GCA volumes have been growing at 10-15% per year for the last six yearsGCA volumes have been growing at 10-15% per year for the last six years
$228 average transaction
161 transactions per minute
$37,000 disbursed per minute
Almost 1 billion $20 bills
Enough to wrap Earth 3.7 times
3.9 billion hands of $5 blackjack
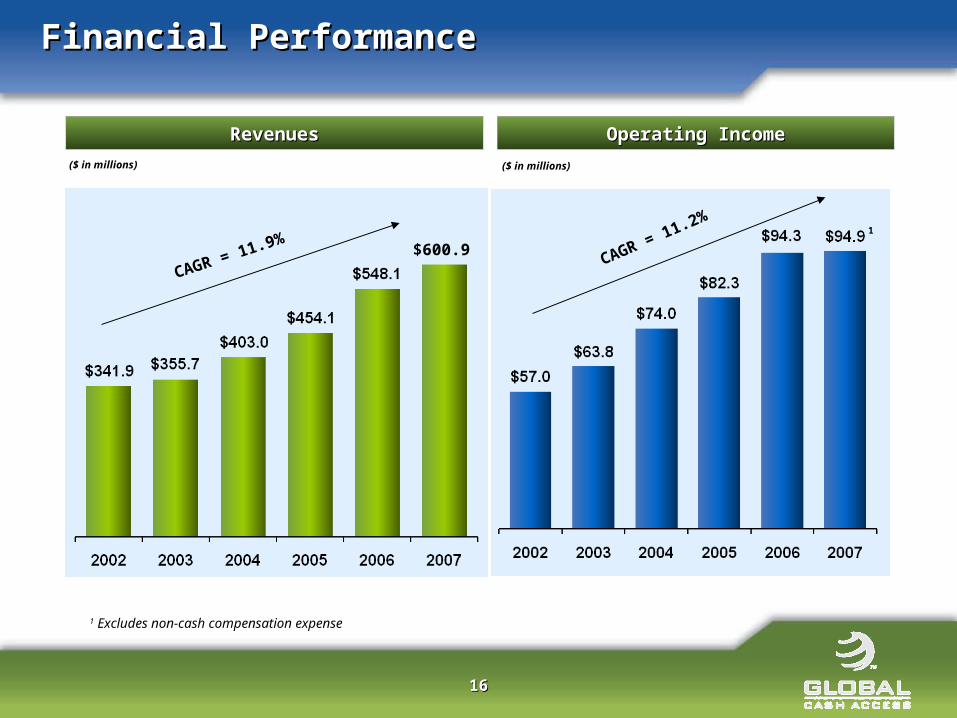
Financial PerformanceFinancial Performance
1616
($ in millions)
CAGR = 11.9%CAGR = 11.2%
($ in millions)
1 Excludes non-cash compensation expense
RevenuesRevenues Operating IncomeOperating Income
1
$600.9
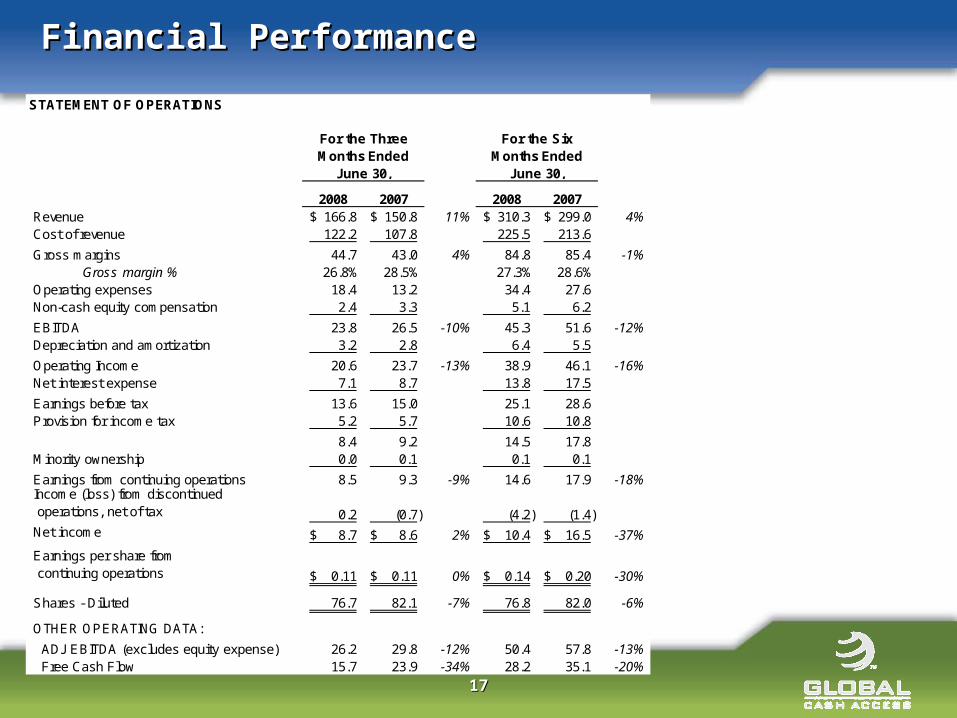
Financial PerformanceFinancial Performance
1717
STATEMENT OF OPERATIONS
2008 2007 2008 2007Revenue 166.8$ 150.8$ 11% 310.3$ 299.0$ 4%Cost of revenue 122.2 107.8 225.5 213.6
Gross margins 44.7 43.0 4% 84.8 85.4 -1%Gross margin % 26.8% 28.5% 27.3% 28.6%
Operating expenses 18.4 13.2 34.4 27.6 Non-cash equity compensation 2.4 3.3 5.1 6.2
EBITDA 23.8 26.5 -10% 45.3 51.6 -12%Depreciation and amortization 3.2 2.8 6.4 5.5
Operating Income 20.6 23.7 -13% 38.9 46.1 -16%Net interest expense 7.1 8.7 13.8 17.5
Earnings before tax 13.6 15.0 25.1 28.6 Provision for income tax 5.2 5.7 10.6 10.8
8.4 9.2 14.5 17.8 Minority ownership 0.0 0.1 0.1 0.1
Earnings from continuing operations 8.5 9.3 -9% 14.6 17.9 -18% Income (loss) from discontinued operations, net of tax 0.2 (0.7) (4.2) (1.4) Net income 8.7$ 8.6$ 2% 10.4$ 16.5$ -37%
Earnings per share from continuing operations 0.11$ 0.11$ 0% 0.14$ 0.20$ -30%
Shares - Diluted 76.7 82.1 -7% 76.8 82.0 -6%
OTHER OPERATING DATA:
ADJ EBITDA (excludes equity expense) 26.2 29.8 -12% 50.4 57.8 -13% Free Cash Flow 15.7 23.9 -34% 28.2 35.1 -20%
For the Three Months Ended
June 30,
For the Six Months Ended
June 30,
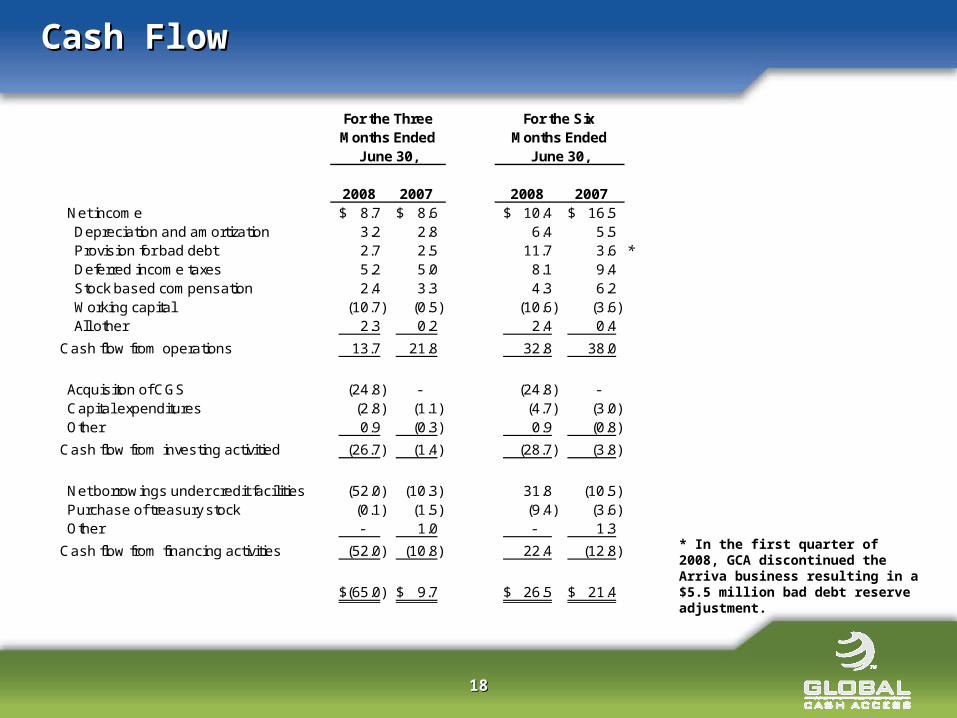
Cash FlowCash Flow
1818
2008 2007 2008 2007 Net income 8.7$ 8.6$ 10.4$ 16.5$ Depreciation and amortization 3.2 2.8 6.4 5.5 Provision for bad debt 2.7 2.5 11.7 3.6 * Deferred income taxes 5.2 5.0 8.1 9.4 Stock based compensation 2.4 3.3 4.3 6.2 Working capital (10.7) (0.5) (10.6) (3.6) All other 2.3 0.2 2.4 0.4
Cash flow from operations 13.7 21.8 32.8 38.0
Acquisiton of CGS (24.8) - (24.8) - Capital expenditures (2.8) (1.1) (4.7) (3.0) Other 0.9 (0.3) 0.9 (0.8)
Cash flow from investing activitied (26.7) (1.4) (28.7) (3.8)
Net borrowings under credit facilities (52.0) (10.3) 31.8 (10.5) Purchase of treasury stock (0.1) (1.5) (9.4) (3.6) Other - 1.0 - 1.3
Cash flow from financing activities (52.0) (10.8) 22.4 (12.8)
(65.0)$ 9.7$ 26.5$ 21.4$
For the Three Months Ended
June 30,
For the Six Months Ended
June 30,
* In the first quarter of 2008, GCA discontinued the Arriva business resulting in a $5.5 million bad debt reserve adjustment.
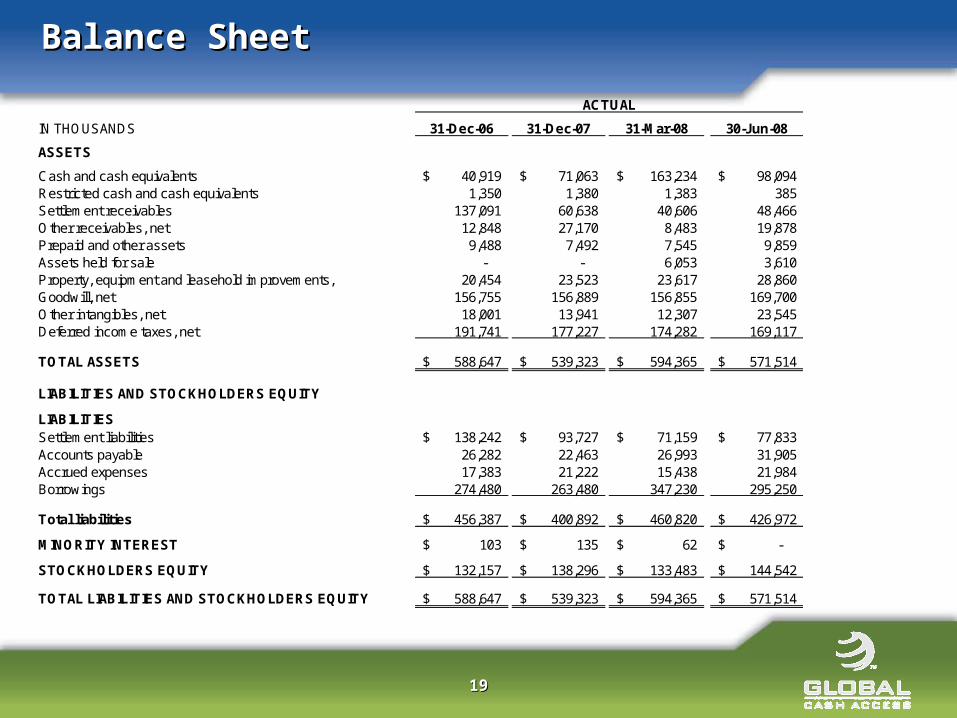
Balance SheetBalance Sheet
1919
IN THOUSANDS 31-Dec-06 31-Dec-07 31-Mar-08 30-Jun-08
ASSETS
Cash and cash equivalents 40,919$ 71,063$ 163,234$ 98,094$ Restricted cash and cash equivalents 1,350 1,380 1,383 385 Settlement receivables 137,091 60,638 40,606 48,466 Other receivables, net 12,848 27,170 8,483 19,878 Prepaid and other assets 9,488 7,492 7,545 9,859 Assets held for sale - - 6,053 3,610 Property, equipment and leasehold improvements, 20,454 23,523 23,617 28,860 Goodwill, net 156,755 156,889 156,855 169,700 Other intangibles, net 18,001 13,941 12,307 23,545 Deferred income taxes, net 191,741 177,227 174,282 169,117
TOTAL ASSETS 588,647$ 539,323$ 594,365$ 571,514$
LIABILITIES AND STOCKHOLDERS EQUITY
LIABILITIESSettlement liabilities 138,242$ 93,727$ 71,159$ 77,833$ Accounts payable 26,282 22,463 26,993 31,905 Accrued expenses 17,383 21,222 15,438 21,984 Borrowings 274,480 263,480 347,230 295,250
Total liabilities 456,387$ 400,892$ 460,820$ 426,972$
MINORITY INTEREST 103$ 135$ 62$ -$
STOCKHOLDERS EQUITY 132,157$ 138,296$ 133,483$ 144,542$
TOTAL LIABILITIES AND STOCKHOLDERS EQUITY 588,647$ 539,323$ 594,365$ 571,514$
ACTUAL
SummarySummary
2020
Industry Leader
Attractive Business Model• Long-term contracts with high retention rate
• Contractual linkage to customer expansion
• Low capital and labor intensity
Significant Growth Opportunities• United States
• Asia
• Europe
New Product Leadership• Competitive differentiation
• Margin improvement
• One-to-one relationship with gaming patrons
Robust Free Cash Flow