deutsche telekom cmd 2015 - lead in business
TRANSCRIPT
DEUTSCHE TELEKOM CAPITAL MARKETS DAY 2015 Bonn, February 26/27, 2015

GROUP STRATEGY COST AnD PORTfOLIO TRAnSfORMATIOn LEAD In bUSInESS SUPERIOR PRODUCTIOn MODEL EUROPE GERMAnY T-MObILE USA fInAnCE
DISCLAIMER
This presentation contains forward-looking statements that reflect the current views of Deutsche Telekom management with respect to future events. These forward-looking statements include statements with regard to the expected development of revenue, earnings, profits from operations, depreciation and amortization, cash flows and personnel-related measures. You should consider them with caution. Such statements are subject to risks and uncertainties, most of which are difficult to predict and are generally beyond Deutsche Telekom’s control. Among the factors that might influence our ability to achieve our objectives are the progress of our workforce reduction initiative and other cost-saving measures, and the impact of other significant strategic, labor or business initiatives, including acquisitions, dispositions and business combinations, and our network upgrade and expansion initiatives. In addition, stronger than expected competition, technological change, legal proceedings and regulatory developments, among other factors, may have a material adverse effect on our costs and revenue development. Further, the economic downturn in our markets, and changes in interest and currency exchange rates, may also have an impact on our business development and the availability of financing on favorable conditions. Changes to our expectations concerning future cash flows may lead to impairment write downs of assets carried at historical cost, which may materially affect our results at the group and operating segment levels. If these or other risks and uncertainties materialize, or if the assumptions underlying any of these statements prove incorrect, our actual performance may materially differ from the performance expressed or implied by forward-looking statements. We can offer no assurance that our estimates or expectations will be achieved. Without prejudice to existing obligations under capital market law, we do not assume any obligation to update forward-looking statements to take new information or future events into account or otherwise. In addition to figures prepared in accordance with IFRS, Deutsche Telekom also presents non-GAAP financial performance measures, including, among others, EBITDA, EBITDA margin, adjusted EBITDA, adjusted EBITDA margin, adjusted EBIT, adjusted net income, free cash flow, gross debt and net debt. These non-GAAP measures should be considered in addition to, but not as a substitute for, the information prepared in accordance with IFRS. Non-GAAP financial performance measures are not subject to IFRS or any other generally accepted accounting principles. Other companies may define these terms in different ways.
2

GROUP STRATEGY COST AnD PORTfOLIO TRAnSfORMATIOn LEAD In bUSInESS SUPERIOR PRODUCTIOn MODEL EUROPE GERMAnY T-MObILE USA fInAnCE
LEAD In bUSInESS
Reinhard Clemens, Board member for T-Systems
3

GROUP STRATEGY COST AnD PORTfOLIO TRAnSfORMATIOn LEAD In bUSInESS SUPERIOR PRODUCTIOn MODEL EUROPE GERMAnY T-MObILE USA fInAnCE
KEY MESSAGES
1 DT Group “Lead in Business” initiative will tap the significant growth potential of the B2B market.
2 Best networks, scalable platforms, security and outstanding cloud experience differentiate us in the market.
3 TSI 2015+ as a radical paradigm shift: focus on profitable growth areas massive reduction of production costs discontinuation of unprofitable business
4 Market Unit (MU) will grow external revenues above market growth.
5 TSI: self funding entity after 2016; MU: adj. EBIT of ~7% by 2018.
4

GROUP STRATEGY COST AnD PORTfOLIO TRAnSfORMATIOn LEAD In bUSInESS SUPERIOR PRODUCTIOn MODEL EUROPE GERMAnY T-MObILE USA fInAnCE
MARKET TREnDS
5

GROUP STRATEGY COST AnD PORTfOLIO TRAnSfORMATIOn LEAD In bUSInESS SUPERIOR PRODUCTIOn MODEL EUROPE GERMAnY T-MObILE USA fInAnCE
CUSTOMERS ExPECT OUR SUPPORT In THREE MAjOR AREAS
DIGITAL bUSInESS MODELS Interactions are increasingly based on digital exchanges –
e.g. platforms, social media, eGovernment Customers expect solutions for digital businesses
Globalizing customers from SME to MNC expect seamless international TC offerings
Customers expect internationally integrated fixed/mobile services
SEAMLESS InT’L TC
CLOUD & IT TRAnSfORMATIOn Guidance for the transformation of legacy IT
into the cloud environment SME’s demand easy to use cloud
products with transparent pricing models
6
GROUP STRATEGY COST AnD PORTfOLIO TRAnSfORMATIOn LEAD In bUSInESS SUPERIOR PRODUCTIOn MODEL EUROPE GERMAnY T-MObILE USA fInAnCE
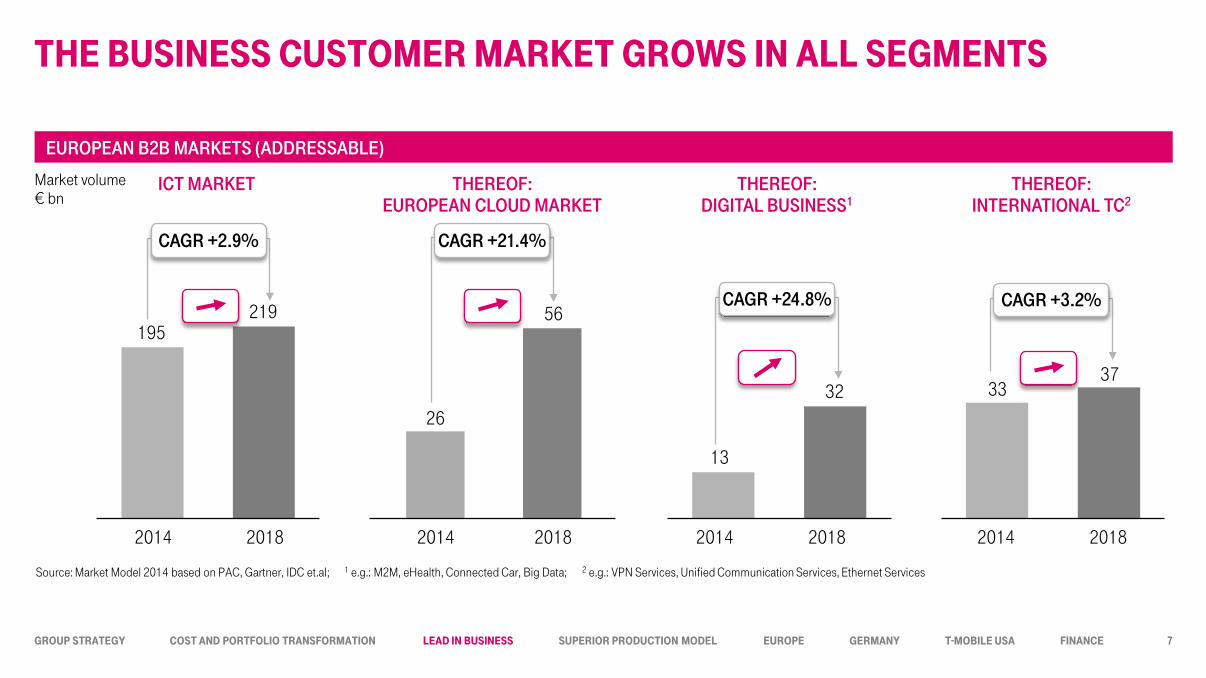
THE bUSInESS CUSTOMER MARKET GROwS In ALL SEGMEnTS
2018
219
2014
195
2018
32
2014
13
2018
37
2014
33
ICT MARKET THEREOF: DIGITAL BUSINESS1
THEREOF: INTERNATIONAL TC2
Source: Market Model 2014 based on PAC, Gartner, IDC et.al; 1 e.g.: M2M, eHealth, Connected Car, Big Data; 2 e.g.: VPN Services, Unified Communication Services, Ethernet Services
EUROPEAN B2B MARKETS (ADDRESSABLE)
Market volume € bn
CAGR +2.9%
CAGR +24.8% CAGR +3.2%
THEREOF: EUROPEAN CLOUD MARKET
56
26
CAGR +21.4%
2018 2014
7
GROUP STRATEGY COST AnD PORTfOLIO TRAnSfORMATIOn LEAD In bUSInESS SUPERIOR PRODUCTIOn MODEL EUROPE GERMAnY T-MObILE USA fInAnCE
STRATEGY LEAD In bUSInESS 2015–2018
8

GROUP STRATEGY COST AnD PORTfOLIO TRAnSfORMATIOn LEAD In bUSInESS SUPERIOR PRODUCTIOn MODEL EUROPE GERMAnY T-MObILE USA fInAnCE
OUR STRATEGY
LEADING EUROPEAN TELCO
TRANSFORM PORTFOLIO
EVOLVE FINANCIAL TARGETS & EFFICIENCY
ENCOURAGE LEADERSHIP & PERFORMANCE DEVELOPMENT
INTEGRATED IP NETWORKS
WIN WITH PARTNERS
BEST CUSTOMER
EXPERIENCE
LEAD IN BUSINESS
9

GROUP STRATEGY COST AnD PORTfOLIO TRAnSfORMATIOn LEAD In bUSInESS SUPERIOR PRODUCTIOn MODEL EUROPE GERMAnY T-MObILE USA fInAnCE
bUSInESS CUSTOMERS REPRESEnT A SIGnIfICAnT SHARE Of DT’S REvEnUES
10
Global Players Pan European Player Offshore Specialists
ACN
AT&T BC
IBM GS
CSC
Fujitsu
NTT Data
HP Serv.
Atos
Cap
OBS
BT Cog-nizant
CGI
TCS
Infosys Wipro IT Serv.
DT
44
24 28
10
19
10
18 15
9 11 6
13
7 8 7
12
6
DT Group Revenue: €62.7 bn
23%
34%
36%
B2C
B2B US
7%
Wholesale
€14.5 bn
1 2014 Revenues for HP Services estimates by financial analysts. Revenue for AT&T BC, BT (GS+BT Business) and OBS include only IT & wireline services for Business Customers.
REV. BY CUSTOMER SEGMENTS 2014 COMPETITIVE ENVIRONMENT (REV. 20141)
€ bn (rounded)

GROUP STRATEGY COST AnD PORTfOLIO TRAnSfORMATIOn LEAD In bUSInESS SUPERIOR PRODUCTIOn MODEL EUROPE GERMAnY T-MObILE USA fInAnCE
HIGH MARKET POTEnTIAL ESPECIALLY In MID-MARKET IT
“Mittelstand” Germany T-Deutschland GK
Multinational Companies T-Systems MU
MNC
Mid-Market Customers
Business cust. Europe
DT-Europe
INTEGRATED IP NETWORKS
WIN WITH PARTNERS
BEST CUSTOMER
EXPERIENCE
LEAD IN BUSINESS
TSI MU TDG GK DT EU
34% 96% 94%
TC
IT
5%
95%
10%
90%
TC
IT
58%
42% TC
IT
€6.0 bn €5.7 bn €2.8 bn
1 External Revenues DT Group
SPLIT OF TC AND IT REVENUES 2014 PER SEGMENT1
11

GROUP STRATEGY COST AnD PORTfOLIO TRAnSfORMATIOn LEAD In bUSInESS SUPERIOR PRODUCTIOn MODEL EUROPE GERMAnY T-MObILE USA fInAnCE
GROUP InITIATIvE “LEAD In bUSInESS” TO bOOST THE b2b REvEnUE In ICT
Strengthen B2B in Europe: Focus on Fixed + Mobile + Cloud service
offers & bundles International product launches: Cloud VPN,
M2M best-coverage Establish innovative G2M and partnership
programs
German Mid Market initiative: Nationwide sales and service presence One-stop-shop product portfolio including
customized bundle offers Focus business initiatives: IT Cloud, M2M,
Deutschland LAN
T-Systems 2015+: Transformation program incl. new set-up
with 3 divisions: IT, TC, Digital
Group wide initiative to strengthen the Int’l TC Business
Growth focus on digital innovation areas like Cloud, Big Data, M2M
TARGET: ≈ 3% REvEnUE2 CAGR In TSI MU
UnTIL 20181
TARGET: +€0.4 bn IT REvEnUE In SME
(UnTIL 2018 In GERMAnY)
TARGET: ICT REvEnUE GROwTH >12%
In EU (CAGR UnTIL 20181)
DT-EU GERMANY TSI MARKET UNIT
1 CAGR 2014-2018 2 External + DTAG
12
GROUP STRATEGY COST AnD PORTfOLIO TRAnSfORMATIOn LEAD In bUSInESS SUPERIOR PRODUCTIOn MODEL EUROPE GERMAnY T-MObILE USA fInAnCE
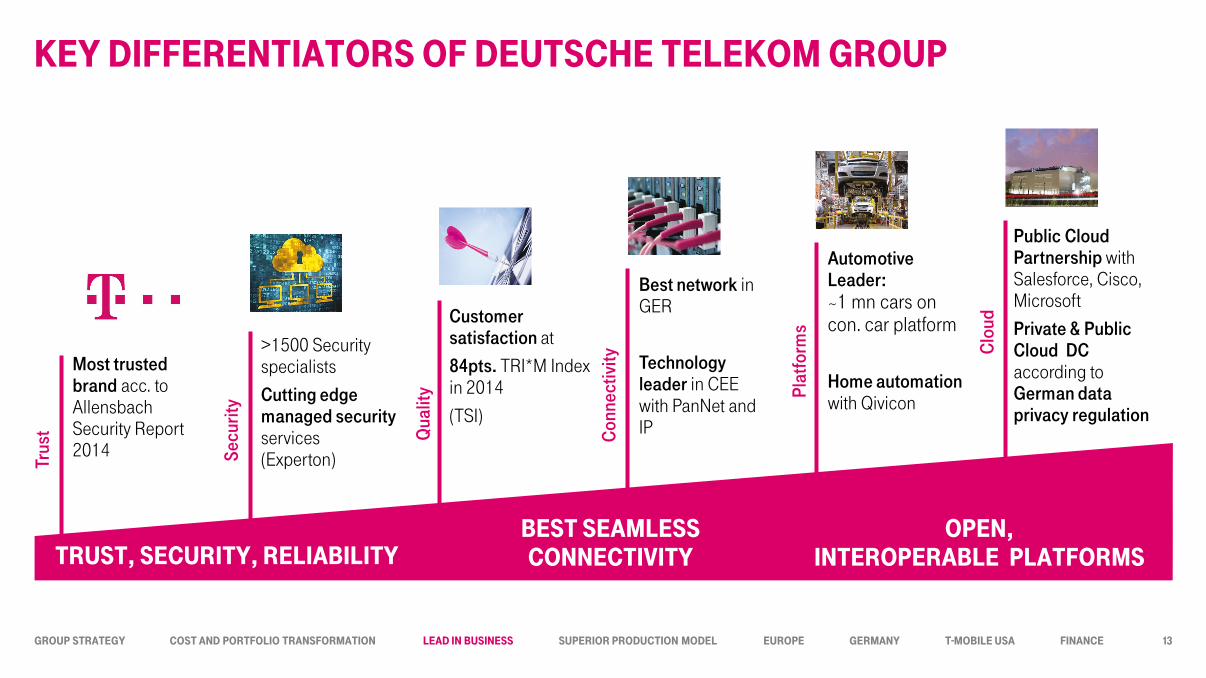
KEY DIffEREnTIATORS Of DEUTSCHE TELEKOM GROUP
Most trusted brand acc. to Allensbach Security Report 2014
Customer satisfaction at 84pts. TRI*M Index in 2014
(TSI)
Best network in GER
Technology leader in CEE with PanNet and IP
>1500 Security specialists Cutting edge managed security services (Experton)
Automotive Leader: ~1 mn cars on con. car platform Home automation with Qivicon
Public Cloud Partnership with Salesforce, Cisco, Microsoft Private & Public Cloud DC according to German data privacy regulation
Trus
t
Secu
rity
Qua
lity
Con
nect
ivity
Plat
form
s
Clo
ud
TRUST, SECURITY, RELIAbILITY bEST SEAMLESS COnnECTIvITY
OPEn, InTEROPERAbLE PLATfORMS
13
GROUP STRATEGY COST AnD PORTfOLIO TRAnSfORMATIOn LEAD In bUSInESS SUPERIOR PRODUCTIOn MODEL EUROPE GERMAnY T-MObILE USA fInAnCE
T-SYSTEMS MARKET UnIT
14
GROUP STRATEGY COST AnD PORTfOLIO TRAnSfORMATIOn LEAD In bUSInESS SUPERIOR PRODUCTIOn MODEL EUROPE GERMAnY T-MObILE USA fInAnCE
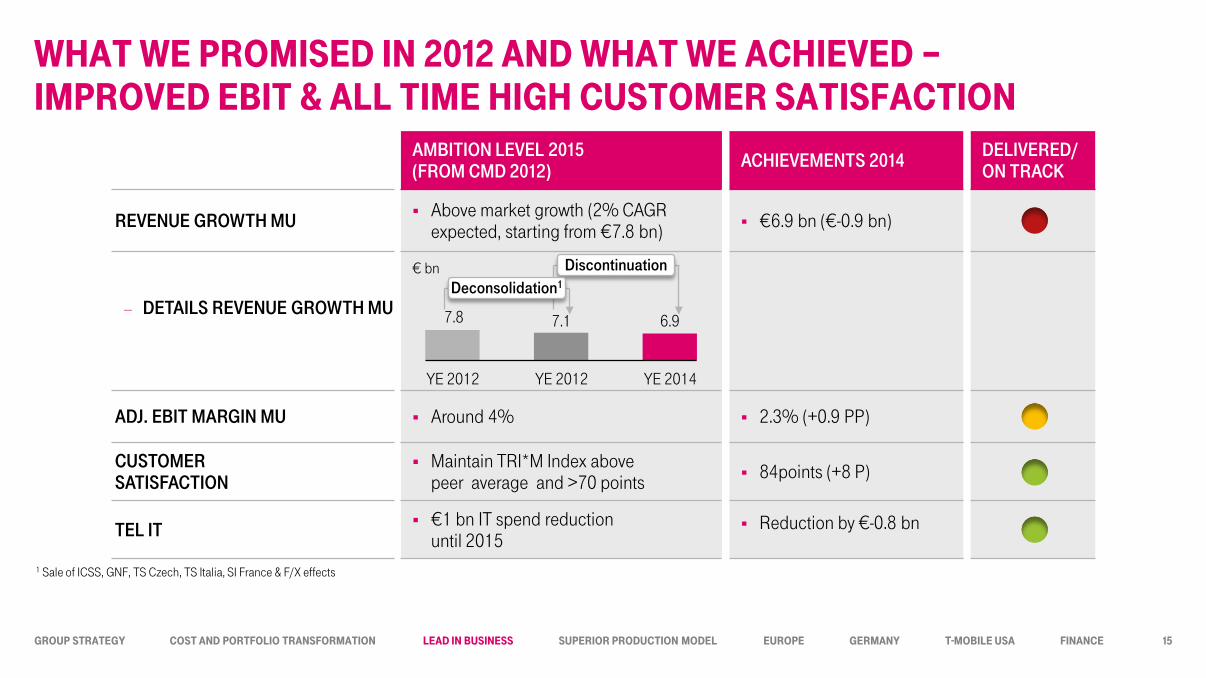
wHAT wE PROMISED In 2012 AnD wHAT wE ACHIEvED – IMPROvED EbIT & ALL TIME HIGH CUSTOMER SATISfACTIOn
AMBITION LEVEL 2015 (FROM CMD 2012) ACHIEVEMENTS 2014 DELIVERED/
ON TRACK
REVENUE GROWTH MU Above market growth (2% CAGR expected, starting from €7.8 bn) €6.9 bn (€-0.9 bn)
− DETAILS REVENUE GROWTH MU
€ bn
ADJ. EBIT MARGIN MU Around 4% 2.3% (+0.9 PP)
CUSTOMER SATISFACTION
Maintain TRI*M Index above peer average and >70 points 84points (+8 P)
TEL IT €1 bn IT spend reduction until 2015
Reduction by €-0.8 bn
7.8 7.1 6.9
YE 2014 YE 2012 YE 2012
1 Sale of ICSS, GNF, TS Czech, TS Italia, SI France & F/X effects
Discontinuation Deconsolidation1
15
GROUP STRATEGY COST AnD PORTfOLIO TRAnSfORMATIOn LEAD In bUSInESS SUPERIOR PRODUCTIOn MODEL EUROPE GERMAnY T-MObILE USA fInAnCE
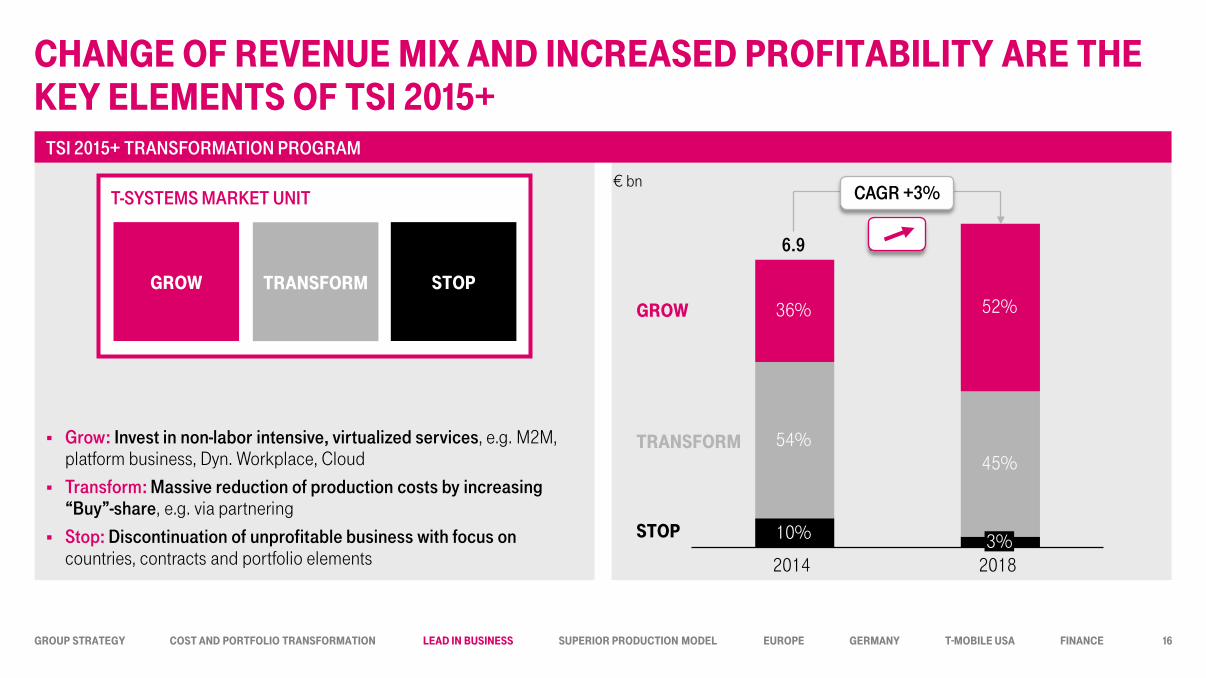
Grow: Invest in non-labor intensive, virtualized services, e.g. M2M, platform business, Dyn. Workplace, Cloud
Transform: Massive reduction of production costs by increasing “Buy”-share, e.g. via partnering
Stop: Discontinuation of unprofitable business with focus on countries, contracts and portfolio elements
CHAnGE Of REvEnUE MIx AnD InCREASED PROfITAbILITY ARE THE KEY ELEMEnTS Of TSI 2015+
T-SYSTEMS MARKET UNIT
TRAnSfORM GROw STOP
3% 2018
52%
2014
45%
6.9
10%
54%
36%
TRAnSfORM
GROw
STOP
TSI 2015+ TRANSFORMATION PROGRAM
€ bn CAGR +3%
16
GROUP STRATEGY COST AnD PORTfOLIO TRAnSfORMATIOn LEAD In bUSInESS SUPERIOR PRODUCTIOn MODEL EUROPE GERMAnY T-MObILE USA fInAnCE
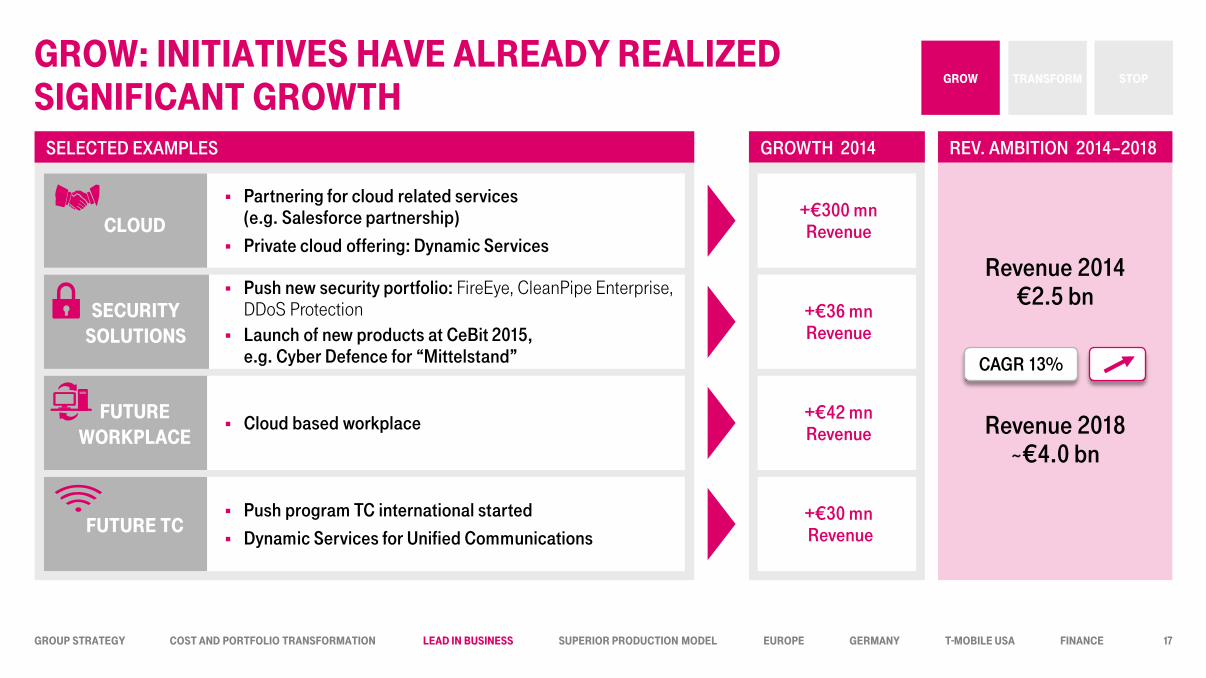
GROw: InITIATIvES HAvE ALREADY REALIzED SIGnIfICAnT GROwTH
TRAnSfORM GROw STOP
SELECTED EXAMPLES
REV. AMBITION 2014–2018
GROWTH 2014
Partnering for cloud related services (e.g. Salesforce partnership)
Private cloud offering: Dynamic Services
Push new security portfolio: FireEye, CleanPipe Enterprise, DDoS Protection
Launch of new products at CeBit 2015, e.g. Cyber Defence for “Mittelstand”
Cloud based workplace
Push program TC international started Dynamic Services for Unified Communications
CLOUD
fUTURE wORKPLACE
SECURITY SOLUTIOnS
fUTURE TC
+€300 mn Revenue
+€36 mn Revenue
+€42 mn Revenue
+€30 mn Revenue
Revenue 2014 €2.5 bn
Revenue 2018 ~€4.0 bn
CAGR 13%
17

GROUP STRATEGY COST AnD PORTfOLIO TRAnSfORMATIOn LEAD In bUSInESS SUPERIOR PRODUCTIOn MODEL EUROPE GERMAnY T-MObILE USA fInAnCE
TRAnSfORM: MEASURES In CLASSIC ICT bUSInESS IMPROvE PROfITAbLITY
TRAnSfORM GROw STOP
SELECTED EXAMPLES
REV. AMBITION 2014–2018
RESULTS 2014
Reduction of workforce via automation, partnering and efficiency gains
Radical reduction of data center locations
Concentration of global service production
Deliver more services from near- or offshore locations
PERSOnnEL RESTRUC-
TURInG
OPTIMIzE GLObAL
SERvICES
COnSOLI-DATIOn
OffSHORE qUOTA
6% MU total workforce
reduction (nat.)
18 data centers closed since 2012
€~10 mn effect on EBIT
+ 8% OS quota
since 2012
Revenue 2018 ~€3.4 bn
Revenue 2014 €3.7 bn
CAGR -2%
18

GROUP STRATEGY COST AnD PORTfOLIO TRAnSfORMATIOn LEAD In bUSInESS SUPERIOR PRODUCTIOn MODEL EUROPE GERMAnY T-MObILE USA fInAnCE
STOP: DISCOnTInUED ACTIvITIES In 2014
TRAnSfORM GROw STOP
SELECTED EXAMPLES
REV. AMBITION 2014–2018
RESULTS 2014
Partnering for labor intensive services (i.e. Field Service) rather than keep own organization: Sale of IDS
Action plan for every inefficient customer contract: 22 contracts optimized, 26 in the process until YE 2015
No loss making local business unit (LBU) from 2016 onwards
PORTfOLIO
LbU’S
COnTRACTS
~500 FTE reduction: Field
Services
22 contracts optimized
5 LBU optimized: Italy, France,
Belgium, Japan, Singapore
Revenue 2018 ~€0.2 bn
Revenue 2014 €0.6 bn
CAGR -22%
19

GROUP STRATEGY COST AnD PORTfOLIO TRAnSfORMATIOn LEAD In bUSInESS SUPERIOR PRODUCTIOn MODEL EUROPE GERMAnY T-MObILE USA fInAnCE
DIvISIOnAL SET UP AS nExT STEP Of OUR TRAnSfORMATIOn
New structural set up Implementation of divisions in order to focus on core
business and specific customer requirements End-to-end and P&L responsibility for each business
segment
TSI 2015+
TRAnSfORM GROw STOP
Business objective: Grow international TC services IP VPN solutions Infrastructure security
services
FMC bundles
Business objective: Grow dynamic IT services Dyn. Workplace Dyn. Hosting
Dyn. Services for SAP
Business objective: Grow platform based business Health &
Connected Car Industry 4.0
Cloud partnering
TC DIVISION
IT DIVISION
DIGITAL DIVISION
P. Molck-Ude F. Abolhassan A. Bronder
T-SYSTEMS MARKET UNIT
20

GROUP STRATEGY COST AnD PORTfOLIO TRAnSfORMATIOn LEAD In bUSInESS SUPERIOR PRODUCTIOn MODEL EUROPE GERMAnY T-MObILE USA fInAnCE
fInAnCIAL OUTLOOK
21
GROUP STRATEGY COST AnD PORTfOLIO TRAnSfORMATIOn LEAD In bUSInESS SUPERIOR PRODUCTIOn MODEL EUROPE GERMAnY T-MObILE USA fInAnCE
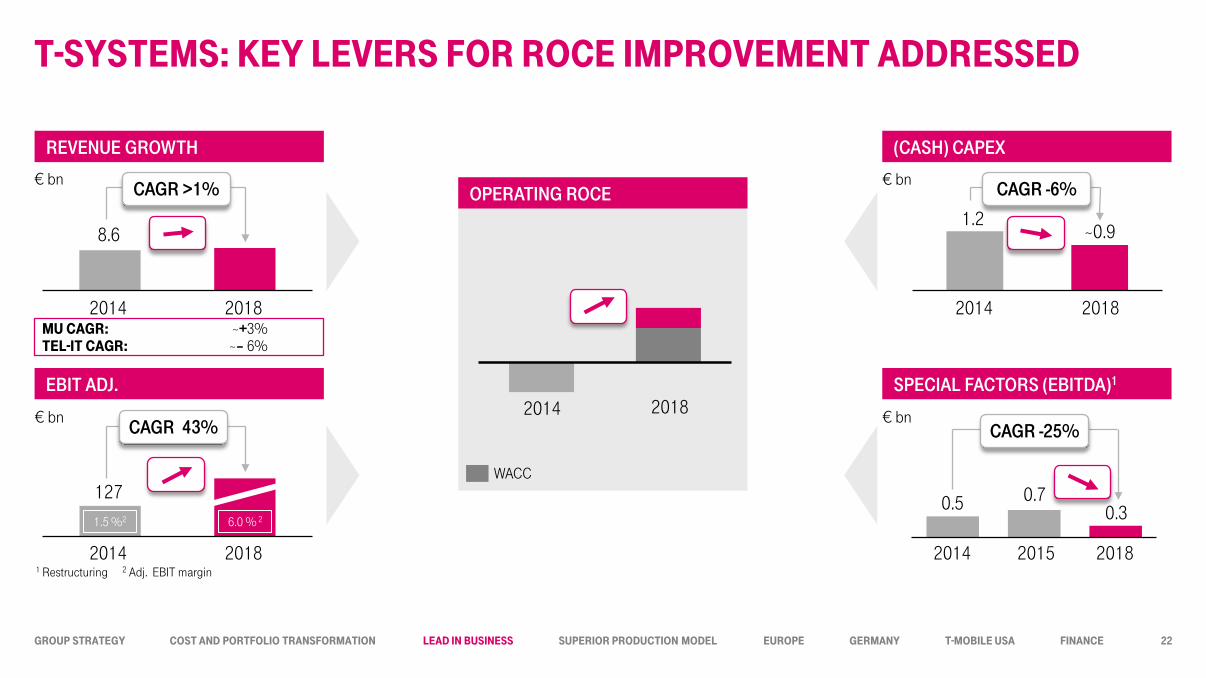
T-SYSTEMS: KEY LEvERS fOR ROCE IMPROvEMEnT ADDRESSED
8.6
2014 2018
127
REVENUE GROWTH
EBIT ADJ.
(CASH) CAPEX
SPECIAL FACTORS (EBITDA)1
OPERATING ROCE
2014 2018
€ bn
€ bn
1.2
2014 2018
0.5
€ bn
€ bn
CAGR >1% CAGR -6%
CAGR 43% CAGR -25%
2014 2015 2018
0.7 0.3 1.5 %2 6.0 % 2
MU CAGR: ~+3% TEL-IT CAGR: ~– 6%
1 Restructuring 2 Adj. EBIT margin
WACC
~0.9
22
2014 2018

GROUP STRATEGY COST AnD PORTfOLIO TRAnSfORMATIOn LEAD In bUSInESS SUPERIOR PRODUCTIOn MODEL EUROPE GERMAnY T-MObILE USA fInAnCE
MID TERM AMbITIOn LEvEL
23

GROUP STRATEGY COST AnD PORTfOLIO TRAnSfORMATIOn LEAD In bUSInESS SUPERIOR PRODUCTIOn MODEL EUROPE GERMAnY T-MObILE USA fInAnCE
MID TERM AMbITIOn LEvEL
MID TERM AMBITION LEVEL YEAR
REVENUE TSI >1% CAGR expected 2014–2018
REVENUE MU Above market growth 3% CAGR expected 2014–2018
QUALITY MU Maintain TRI*M index above peer average at current levels of 84 points 2018
ADJ. EBIT MARGIN TSI Around 6% 2018
ADJ. EBIT MARGIN MU Around 7% 2018
ADJ. CASH CONTRIBUTION TSI Positive from 2017 2017
24