develop a c-program to convert - mdh · web viewthe pre-processor will replace the next word with...
TRANSCRIPT

Power Consumption Optimization in Bluetooth Networks.
Autor: Sergio Díez Núñez.Tutors: Martin Ekström, Marcus Blom.University: Mälardalens Hogskola (Västeras, SWEDEN).Home University: Universidad de Alcalá de Henares (Alcalá de Henares, Madrid, SPAIN).Date: Autumn Semester 2007.

______ Sergio Díez Núñez ________ Power Consumption Optimization in Bluetooth Networks ______
Abstract.
Bluetooth is continually progressing, more companies bet on it more and more and there are more devices which implements it because of its multiple advantages. However, mobile devices power consumption limits it useful life and it’s necessary to know the exact moment when the battery will exhaust, for reloading or replacing it. Also, if we give out consumption between network devices, we could extend batteries useful life.In this Project, a program will be done to display current throw Bluetooth devices in a continuous way, without gaps, from files captured with LabViewMeasurements software. Power consumption of two typical Bluetooth operation, Inquiry and Page Scan, will be analyze, to find matches between the operation and the consumption to adjust network to get more useful time, until all the batteries discharge at same time.
Página 2 de 44

______ Sergio Díez Núñez ________ Power Consumption Optimization in Bluetooth Networks ______
Acknowledgements.
One page isn’t much to express my gratitude, so I’ll owe much to lot of people.
First and biggest acknowledgements are for my mother and father. Mum, thanks for giving all for me, for being the best teacher in the life career and for show me to beat anything stands in my way. You have taught me there is only one thing to make life has sense, love, and you have got 4 sons who love so much they don’t know. Dad, I couldn’t imagine what proud you would be of me, and although you can’t teach me more things, I have learned and will continue learning from you. You shown me the real worth of things, thanks this now I’m very happy with things I’ve got. You will always be the light which guides my steps and the hand which helps me raise. Thanks!
Laura, you have taught me what fathers can’t teach. Thanks for don’t losing your hope with me and supporting me in my decisions even if they were harmful for you. You have been my day by day and you will be the closest person to me in my life. There isn’t anything in the world which matters to me more than you do. Thanks!
My brothers and sister, Ángel Félix, Isabel y Adrián. Ángel Félix, I learned with you the rest, together. If I have been given the perfect friend, he wouldn’t be so good as you are. Isabel, it’s important to known what things to learn from you, but it goes by and you could show the diamonds you have inside. Adrián, I have learnt to be a big brother with you trying to be your model, you have made me better. Thanks!
The rest of my family: Juan (the fourth brother I’ve never had), Félix (the fifth, oldest one), Félix y Mari Carmen (granddad and grandmum), Daniela, Nines (my university model), Pili (my other university model), Paloma( tireless, she always encourages me), Roberto and Miguel (another 4 brothers and sisters more), Latif and Jalil (destiny family)… and the rest of uncles, aunts and cousins, and their husbands, wives and children (don’t get angry with me if I don’t write your names, they are written in my heart). Thanks for back me to the hilt along this time. Thanks!
My friends, from school mates, Adrián (always there), Ismael (I’ll finish before you!), Paco (intellectual genius), Alan (amazing progress), Rodrigo, David,… to the University ones, Guillermo, Juanfran, Diego, David, María, Alberto, Josema, Fernando, Mario, Emilio, Mario (school, university, football, jogging, Erasmus… partner), Vicente, Héctor… of course Alfonso, Carlos, Juan y Juane, Jorge y Jorge, Pizarro, Samuel, Enrique… and all their girlfriends. All the people I have met these months in the Erasmus in Sweden, life mates. Thanks for sharing happiness and knowledgements at same parts with me. Thanks!
Finally, my teachers, the first and closer to my heart, Mariano, Adrián, Rafa, Isabel, Maria Jesus, Ricardo, Manolo, Paquita, Nacho, Don Juan and Manuel Tena,… and the last ones, with much scientific knowledges to share, Mayte, Javier, Juan Carlos, Martin (especially), Marcus and Mikael, to put technology world close enough to touch. Thanks!
Eight years later, here finish one stage in my life. Lots of them still left!
Página 3 de 44

______ Sergio Díez Núñez ________ Power Consumption Optimization in Bluetooth Networks ______
Agradecimientos.
Una página es poco para expresar mi gratitud, así que deberé mucho a mucha gente. Los primeros agradecimientos y más grandes son para mi madre y mi padre. Mamá, gracias por haberlo dado todo por mí, por haber sido la mejor profesora en la carrera de la vida y enseñarme a luchar contra cualquier cosa que se me interponga. Tú me has enseñado que sólo hace falta una cosa para hacer que la vida tenga sentido, amor, y tú tienes 4 hijos que te quieren tanto que no lo saben. Papá, no puedo ni imaginar lo orgulloso que estarías de mí, y aunque ya no puedas enseñarme más cosas, yo he aprendido y seguiré aprendiendo de tí. Me enseñaste a valorar las cosas, y gracias a eso ahora soy muy feliz con lo que tengo. Siempre seréis la luz que guíe mis pasos y la mano que me ayude a levantar. Gracias!
Laura, tú me has enseñado lo que unos padres no pueden enseñar. Gracias por no perder la esperanza conmigo, y haberme apoyado en cada decisión, a temor de ser perjudicial para ti. Tú has sido mi día a día y serás la persona que más cerca de mí esté jamás. No hay nada en el mundo que me importe más que tú. Gracias!
Mis hermanos, Ángel Félix, Isabel y Adrián. Ángel Félix, contigo aprendí todo lo demás, juntos. Si me hubieran regalado el amigo perfecto, no hubiera sido tan bueno como tú. Isabel, contigo hay que saber elegir las cosas que aprender, pero se te pasará, y podrás enseñar los diamantes que llevas dentro. Adrián, contigo he aprendido a ser un hermano mayor e intentando ser tu modelo, me has hecho mejor persona. Gracias!
El resto de mi familia: Juan (el cuarto hermano que nunca tuve), Félix (mi quinto hermano, el mayor), Félix y Mari carmen (los Yayos), Daniela, Nines ( una de mis modelos universitarias), Pili (mi madrina, que me quiere como una madre), Pili (mi otra modelo) y Paloma (la incansable, siempre me dará ánimos) y Roberto y Miguel (otros 4 hermanos más), Latif y Jalil(la familia que el destino nos ha dado)...y el resto de tíos y primos, y todos sus maridos, mujeres y niños (no os enfadéis si no pongo vuestro nombre, lo llevo escrito en el corazón). Gracias por vuestro apoyo incondicional todo este tiempo. Gracias!
Mis amigos, desde los del colegio, Adrián (siempre estás ahí), Ismael (aún acabaré antes que tú), Paco (fenómeno intelectual), Alan (sorprendente progreso), Rodrigo, David... hasta los de la Universidad, Guillermo, JuanFran, Diego, David, María, Alberto, Josema, Fernando, Mario, Emilio, Mario (mi amigo en el colegio, universidad, fútbol, carreras, Erasmus...),Vicente, Héctor... también Alfonso, Carlos, Juan y Juane, Pizarro, Jorge y Jorge, Samuel, Enrique...y todas sus novias. Todos los que he conocido en estos meses de Erasmus en Suecia, compañeros de vida. Gracias por compartir alegría y conocimientos a partes iguales conmigo. Gracias!
Finalmente, mis profesores, los primeros y más cercanos al corazón, Mariano, Adrián, Rafa, Isabel, María Jesús, Ricardo, Manolo, Paquita, Nacho, Don Juan y Manuel Tena..., y los últimos, con muchos más conocimientos científicos que compartir, Mayte, Javier, Juan Carlos, Martin, Marcus y Mikael, por poner el mundo tecnológico al alcance de mi mano. Gracias!
Ocho años después, aquí acaba una etapa de mi vida. Aún quedan muchas más!
Página 4 de 44

______ Sergio Díez Núñez ________ Power Consumption Optimization in Bluetooth Networks ______
Index.
1. Introduction.................................................................................................................6
2. First Part: Develop a C-Program to convert *.lvm files to *.txt files erasing repeat samples..............................................................................................................8
2.1. Introduction..........................................................................................................8
2.2. The input files, *.lvm ...........................................................................................9
2.3. C- Program, converter.c ...................................................................................11
2.4. The output files, *.txt .........................................................................................22
2.5. Some wrong previous steps................................................................................25
2.6. Suggested improvements....................................................................................25
2.7. Conclusions.........................................................................................................26
3. Second Part: Power Consumption Analysis from *.txt files..................................26
3.1. Introduction........................................................................................................26
3.2. Working Methodology.......................................................................................27
3.3. Inquiry.................................................................................................................293.3.1. Inquiry Normal................................................................................................293.3.2. Inquiry Fast......................................................................................................303.3.3. Inquiry Long....................................................................................................313.3.4. Inquiry Fast & Long.......................................................................................32
3.4. PageScan..............................................................................................................333.4.1. PageScan Normal.............................................................................................333.4.2. PageScan Fast..................................................................................................343.4.3. PageScan Long.................................................................................................353.4.4. PageScan Fast & Long....................................................................................36
3.5. Conclusions.........................................................................................................38
4. Some documentation.................................................................................................41
5. Conclusions................................................................................................................43
6. Bibliography and resources......................................................................................44
Página 5 de 44

______ Sergio Díez Núñez ________ Power Consumption Optimization in Bluetooth Networks ______
List of figures.
Figure 1: Overlapped packets…………………………………………………………………..8Figure 2: Inputs and outputs, first part………………………………………………………..9Figure 3: Input file example……………………………………………………………………10Figure 4: Empty packet…………………………………………………………………………11Figure 5: Block 1, pre-processor orders……………………………………………………..12Figure 6: Block 2, variables……………………………………………………………………13Figure 7: Block 3, open files…………………………………………………………………...15Figure 8: Block 4, read main header…………………………………………………………15Figure 9: Block 5, arrays declaration………………………………………………………..16Figure 10: Array explanation…………………………………………………………………17Figure 11: Block 6, packet header loop………………………………………………………17Figure 12: Block 7, read data loop……………………………………………………………18Figure 13: Block 8, comparison loops………………………………………………………..19Figure 14: Block 9, copy correct values……………………………………………………..20Figure 15: Block 10, arrays actualizations………………………………………………….20Figure 16: Block 11, warning and free memory…………………………………………….21Figure 17: Block 13, close files………………………………………………………………..21Figure 18: Output file example………………………………………………………………..22Figure 19: Packet correlation…………………………………………………………………23Figure 20: Empty packets, file advertisement……………………………………………….24Figure 21: Input/output, working methodology……………………………………………..24Figure 22: Inputs and outputs, second part………………………………………………….26Figure 23: Inquiry normal general……………………………………………………………29Figure 24: Inquiry normal detail…………………………………………………………….. 29Figure 25: Inquiry Fast general……………………………………………………………….30Figure 26: Inquiry Fast detail…………………………………………………………………30Figure 27: Inquiry Long general……………………………………………………………...31Figure 28: Inquiry Fast detail…………………………………………………………………31Figure 29: Inquiry Fast&Long general………………………………………………………32Figure 30: Inquiry Fast&Long detail………………………………………………………...32Figure 31:Page Scan normal general………………………………………………………...33Figure 32: Page Scan normal detail………………………………………………………….33Figure 33: Page Scan Fast general…………………………………………………………..34Figure 34: Page Scan Fast detail……………………………………………………………..34Figure 35: Page Scan Long general………………………………………………………….35Figure 36: Page Scan Long detail…………………………………………………………….35Figure 37: Page Scan Fast&Long general…………………………………………………..36Figure 38: Page Scan Fast&Long detail…………………………………………………….36Figure 39: Power functions……………………………………………………………………37Figure 40: Extract InquiryResults……………………………………………………………37Figure 41: Inquiry Power Consumption Means…………………………………………….37Figure 42: Page Scan Power Consumption Means…………………………………………38Figure 43: Big file general……………………………………………………………………..38Figure 44: Big file detail……………………………………………………………………….39Figure 45: Lower Values Analysis…………………………………………………………….39Figure 46: Decision regions…………………………………………………………………...40Figure 47: Bigger scale analysis……………………………………………………………...40Figure 48: Bigger scale decision regions……………………………………………………41Figure 49: Project time evolution graphic…………………………………………………..41Figure 50: Task table…………………………………………………………………………...41
Página 6 de 44
______ Sergio Díez Núñez ________ Power Consumption Optimization in Bluetooth Networks ______
1. Introduction.
Because of its simplicity, versatility and expansion, Bluetooth wireless technology bear in mind in multiple devices for data exchange. There is a Special Interest Group (SIG) in Bluetooth which takes care of this technology development. This organization is composed of more than 4000 members in areas such as telecommunications, network technologies or informatics industry. The associated firms implement this technology in their products, cooperate between them to improve their features and pay an annual fee according to their benefits.
The image, logo and trade mark of Bluetooth are property of the group, so they can only be used by their members. The products must pass high quality tests specified by the group.
From mobile phones to medical tools, devices connect themselves thanks to this technology. Some advantages are its low consumption, minimum cost (one Bluetooth chip cost less than 3 USA Dollar), easy make use of it, ad-hoc connection. It use Industrial, Scientific and Medical (ISM) radio band 2,4 GHz, so there isn’t additional costs. Also, solid objects aren’t obstacles and it isn’t necessary to be in the same vision line neither, because the transmission is in all directions.
I wouldn’t give a thorough investigation about this technology, but I would like to underline the world importance which main aim is eliminate cables between devices until 10-100 meters distance.
But just like every wireless device, power consumption is a critical stone to determine devices service life. They aren’t usually connected to electric network (Bluetooth is also implemented is non-mobile devices), so energy comes from batteries. Batteries always goes flat. And when a device hasn’t battery, it doesn’t work and it can’t transmit/receive data.
Nowadays, it isn’t difficult load the battery of one device, although is very tedious. But if we imagine a future work environment of this technology, with dozens or hundreds of Bluetooth devices working together, the task of load or replace all these batteries is a big problem.
Let’s suppose an example of work environment, a Hospital floor. Each patient with a heart pulse counter on his chest and monitor screens in the control room. If a monitor don’t detect any activity, it could be because the battery of this device is unloaded or perhaps a real failure is happening to the patient in this moment. If we could know the exact time when the batteries go flat, we could change or load the batteries at the same time, and avoid the uncertainty situation before commented.
We would be able to know this if we knew the battery who left in each device and the power consumption associated with each operation, in order to assign more power consumption operations to those devices with more battery.
Página 7 de 44
______ Sergio Díez Núñez ________ Power Consumption Optimization in Bluetooth Networks ______
This Project is a small part of a greater dimension project which is now developing at this University of Mälardalens (Västeras, SWEDEN). The bigger project covers aspects such as handover, positioning services, reduce of power consumption… in Bluetooth networks.
In this Project, some files will be captured which represent the current throw Bluetooth devices, testing different configurations, different operations,… with the main aim to find a clear relation between the power consumption and the operation we have done.
The first part will be make a program in C language programming to be able to represent the captured files in a continuous way. This could be important, because the software we use to capture files, LabViewMeasurements, captures the samples in packets which overlapped in the time. So there will be repeated samples, and the measures after the last measures of a packet won’t be the first of the next packet exactly. This could be show with an example like this.
|------------------------------------------------------------------------------------- > time
|-------------------------------| packet 1T1 |-----------------------------| packet 2
T2 <----------->
repeated samples
Figure 1: Overlapped packets.
The second part will be a statistic data manipulation of two concrete operation: Inquiry and Page Scan, getting important data in order to establish their associated power consumption. Also, it will worth like reference to other operation, to estimate the time we spend analyzing the files and to evaluate if the method we use is the best, and try to find other solutions.
Finally, some obtained conclusions will be presented, and proposal about future steps to be given in respect of this Project.
2. First Part: Develop a C-Program to convert *.lvm files to *.txt files erasing repeat samples.
2.1. Introduction.
To optimize power consumption is essential to experiment with real elements in different configurations, data acquisition and its later processing.
This part could be considered like an intermediate stage between data acquisition and the processing; we could name it pre-processing.
Página 8 de 44

______ Sergio Díez Núñez ________ Power Consumption Optimization in Bluetooth Networks ______
In the data acquisition stage it’s used LabViewMeasurement software and some oscilloscopes connected to the devices to measure the power consumption that we want.
On later stages of the Project, different configurations of these devices will be tested, doing different operations, with various active devices, various distances… but now the thing that’s most important is the data acquiring.
The result of data acquisition are *.lvm extension files, which represent the input to our program. In these files are sequentially stored packets whom contain the taking measures over our circuit or device. Each packet has a timestamp in its header which indicates the precise moment when it starts to capture samples. The problem becomes when we observe the timestamps and see that packets start to capture samples when the packet before hadn’t left to do the same operation. Then, first samples of the second packets will be exactly the last samples that the first packet took.
The aim will be to find the point where start the coincidences and to erase repeated samples. As a result, we will obtain a *.txt file which will store correct samples, with whole original samples and no one repeated.
Figure 2: Inputs and outputs, first part.
2.2. The input files, *.lvm .
Our program input files are composed of a main header, same for the whole file, and an undefined number of “packets”, with individual header and 2 columns where is shown the sample number of the packet and the value itself. Let see this with a example.
Página 9 de 44
C- Program*. lvm file *. txt file

______ Sergio Díez Núñez ________ Power Consumption Optimization in Bluetooth Networks ______
Figure 3: Input file example.
We open this files with Notepad software, but it could be open with other software if it would be necessary.
The main header starts on the beginning of the file, and ends with the characters string “***End_of_Header*** ”. It shows settings about the file and the software which generated it , but the most important fields for our purpose are the last three:
- Description: indicates the operation we’re doing over the circuit. In this case, acquiring samples of power consumption from a sensor node.
- Date: indicates the date on this capture has been made. In this case, 27th
September 2007.
- Time: indicates the time when this capture started, in hours, minutes and seconds, with 6 valid decimal numbers. In this case, 12:38:01,087707.
Hereafter there is the sequence of samples packets captured in the file. Each packet has its own header and the samples. The packet header, limited also with the string
Página 10 de 44

______ Sergio Díez Núñez ________ Power Consumption Optimization in Bluetooth Networks ______
“***End_of_Header***”, is composed of some interesting fields, but the most important in this case will be:
- Samples: indicates the number of samples contained in the packet. In this case, there are 3000 samples in each packet.
- Time: is the timestamp of the packet, indicates when the packet starts to get samples. It use the same format than the previous time field. In this case, 12:38:01,087707.
These two fields are very important, because if we know the time that the packet is getting samples and the number of samples, we would know in a easy way the frequency of the samples dividing time between number of samples. This time, we have 1 sample each 0,1 ms.
After the packet header, there are two columns with numbers. Actually, there are three columns, but the third one it’s only used to indicates which is the first sample of the packet. This will be important because sometimes there are empty packets, only filled with a header but not with samples. You could see that it will be an empty packet because the field called “Samples” indicates 0 samples. We don’t know why exactly happens, but this will be a particular thing to be present. Here is a picture where you could see what we are talking about.
Figure 4: Empty packet.
The other two columns indicate the number of sample into the packet, from 0 to Samples-1, and the value of the measurement. The amount of decimal numbers could be setting with LabViewMeasurement software.
2.3. C- Program, converter.c .
Before developing the program, it was necessary practising with the tasks that the program should do later. In this way, the first step was handling the files in data grid with Excel and discover what hand-made operation could be implemented and what one couldn’t. It was very important to know the limits and advantages that computers and software offer, like available memory, embedded loops, recursive functions…
Now, the definitive source code will be commented by functional blocks. There are some functional blocks that could be implemented by functions, but I have preferred let the code in only one source code file to avoid errors in the parameters passing through functions. Also it’s possible to see the full code in the same page.
Página 11 de 44

______ Sergio Díez Núñez ________ Power Consumption Optimization in Bluetooth Networks ______
Figure 5: Block 1, pre-processor orders.
In the first four lines (1-4), it’s indicated the name of the source code file, the date of the version, the name of the author and the number or version. In this case:
- Name: main.c- Data: 23rd October 2007- Author: Sergio Díez Núñez- Version: Definitive version.
The lines 6, 7 and 8 are “library include” sentences. We include stdio.h to use input/output functions like printf, scanf, fprintf, fscanf, gets…or file management functions, like fopen, fclose, feof… We include stdlib.h for system calls, like malloc/free (for memory allocation/deallocation) or atoi (translate a string character into an integer argument). We include string.h to use string functions, like strcmp (to find out if two strings are the same).
The line 10 is a “define” sentence. The pre-processor will replace the next word with the next value. In this case, MAX_DATA represents the number of bytes that we use in arrays to get data from the *.lvm file.
The line 11 is also a “define” sentence. MAX_SAMPLES represents the number of samples that we capture in each packet. Usually, its value is 3000 or 4000 samples and we could put directly this value instead 10000, but it works perfectly with 10000 value and files with less samples per packet. Later we will use this value as the size of arrays, so if we declare 10000 samples instead true value some variables in the array won’t be used.
Página 12 de 44

______ Sergio Díez Núñez ________ Power Consumption Optimization in Bluetooth Networks ______
Figure 6: Block 2, variables.
In the next block, starts the main function and we declare the variables we will use in the rest of the program.
In the line 14 starts the calling for the main function. Actually, the value returned by main function is not very important but we will used the returned value –1 in case some memory allocation error happens. The arguments argc and argv aren’t important neither because we don’t pass these arguments by order line. It will be commented in the section Suggested Improvements.
In the lines 16 and 17 two pointers are declared. The variables pfile1 and pfile2 will be pointers used for handling the input file (*.lvm) and the output file (*.txt) respectively. They will be used as parameters in file management functions like fopen, fclose, fprintf, fscanf…
In the lines 19, 20 and 21 three arrays are declared. Their size is MAX_DATA (previously commented), enough to avoid memory problem obtaining data from the input file. Normally, each one will get data from each column from the input data. Each column is separated from the next with a ‘\t’ character. So data1, data2 and data3 normally will contain data, obtained like character string, from column 1, 2 and 3 respectively.
In the lines 23 and 24 another two MAX_DATA sized arrays are declared. The array outputname will contain the name of the output file, and inputname the input one. These names will be given by keyboard by the user while the program is running. More options about this will be commented in Suggested Improvements section too.
In the lines 26, 27, 28 and 29 some integer and long integer variables are declared. We will used them to handle time. Time in the input file appears like characters strings, and we will need to change it into integer variables to be able to show the timestamp on the screen and in the output file in the correct way. We divided the seconds into seconds and milliseconds variables because of these time are stored
Página 13 de 44

______ Sergio Díez Núñez ________ Power Consumption Optimization in Bluetooth Networks ______
with the character “,” instead “.” in the decimal number and fscanf function can’t get these values as a unique value. The name “milliseconds” isn’t very precise because it actually represents microsecond instead milliseconds, but it’s more familiar word for us to work. Millisecond variables are long integer because of the maximum size that a integer can stored is 32767 (65535 if is unsigned) and we need more resolution in these variables. A couple of each variable is declared because later we will handle two arrays with data at the same time to compare samples.
In the line 31 we declare an integer variable called timefound. It will indicate that we have found the time in the packet header, we have stored and we can start to get samples data.
In the line 33 we declare another integer variable, called warning. It will be a warning advertisement or flag which indicate if we need to modify the source code adding another comparison loop. In this way, we avoid to do unnecessary loops.
In the line 34 we declare a pointer to make easier working with arrays looking for the coincidences. We only use the necessary memory doing these things with dynamic memory allocation. A little example to explain what we do will be shown in the initialization of this variable with malloc function.
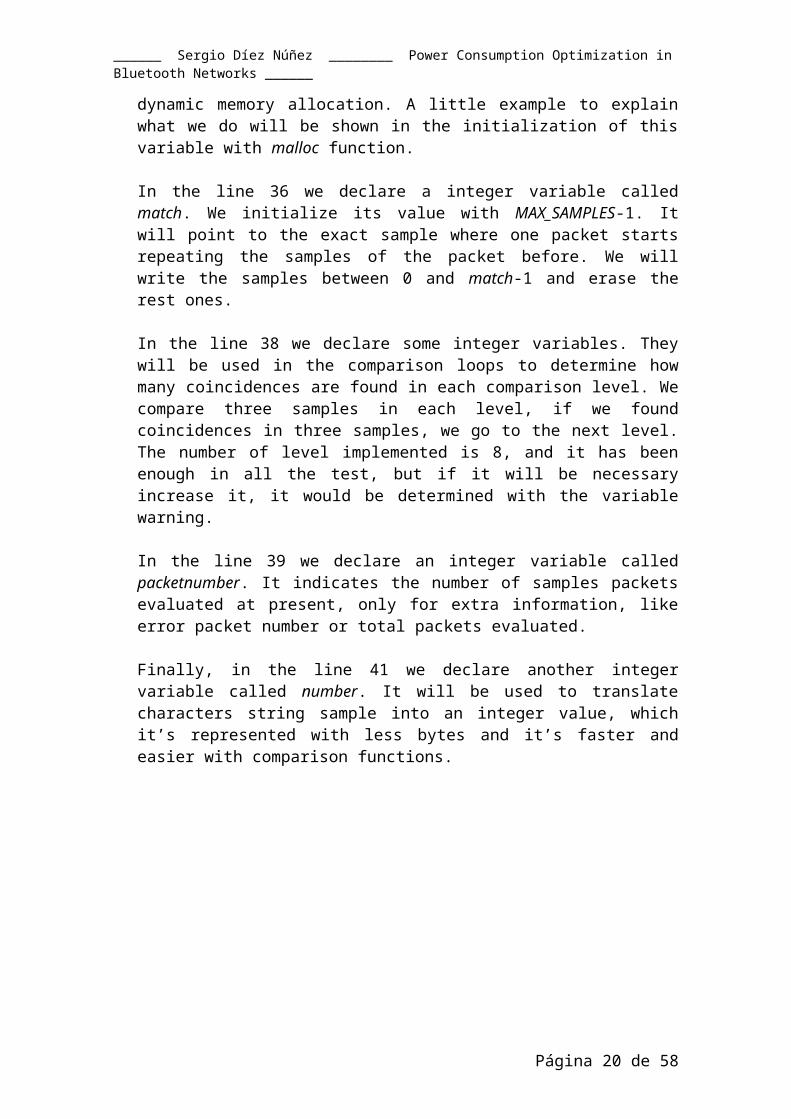
In the line 36 we declare a integer variable called match. We initialize its value with MAX_SAMPLES-1. It will point to the exact sample where one packet starts repeating the samples of the packet before. We will write the samples between 0 and match-1 and erase the rest ones.
In the line 38 we declare some integer variables. They will be used in the comparison loops to determine how many coincidences are found in each comparison level. We compare three samples in each level, if we found coincidences in three samples, we go to the next level. The number of level implemented is 8, and it has been enough in all the test, but if it will be necessary increase it, it would be determined with the variable warning.
In the line 39 we declare an integer variable called packetnumber. It indicates the number of samples packets evaluated at present, only for extra information, like error packet number or total packets evaluated.
Finally, in the line 41 we declare another integer variable called number. It will be used to translate characters string sample into an integer value, which it’s represented with less bytes and it’s faster and easier with comparison functions.
Página 14 de 44

______ Sergio Díez Núñez ________ Power Consumption Optimization in Bluetooth Networks ______
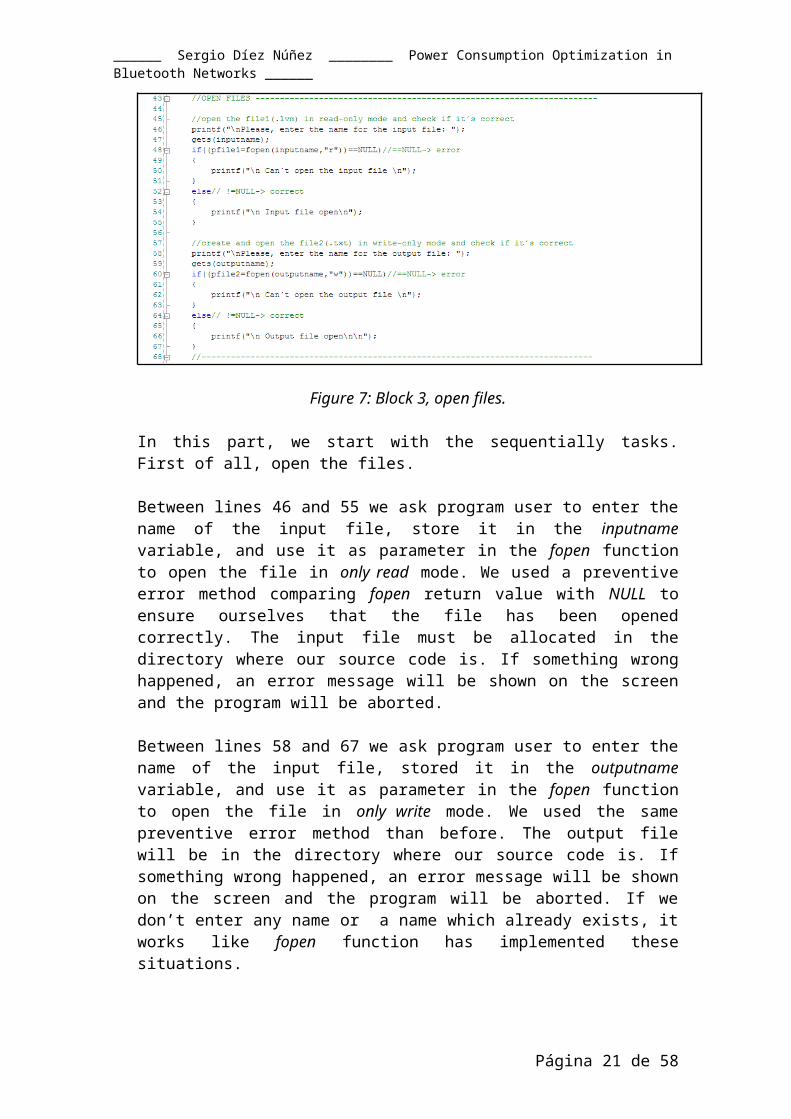
Figure 7: Block 3, open files.
In this part, we start with the sequentially tasks. First of all, open the files.
Between lines 46 and 55 we ask program user to enter the name of the input file, store it in the inputname variable, and use it as parameter in the fopen function to open the file in only read mode. We used a preventive error method comparing fopen return value with NULL to ensure ourselves that the file has been opened correctly. The input file must be allocated in the directory where our source code is. If something wrong happened, an error message will be shown on the screen and the program will be aborted. Between lines 58 and 67 we ask program user to enter the name of the input file, stored it in the outputname variable, and use it as parameter in the fopen function to open the file in only write mode. We used the same preventive error method than before. The output file will be in the directory where our source code is. If something wrong happened, an error message will be shown on the screen and the program will be aborted. If we don’t enter any name or a name which already exists, it works like fopen function has implemented these situations.
Figure 8: Block 4, read main header.
Página 15 de 44

______ Sergio Díez Núñez ________ Power Consumption Optimization in Bluetooth Networks ______
In this block, we read the main header of the input file. We do it with a do-while sentence. Each data in the input file is separated from the next one with a “\t” character if they are in the same line, or “\n” character if they are in different lines. We read data from the input file until we find the exact sentence “***End_of_Header***”. We do this establishing a strings compare between the data collected and the string “***End_of_Header***” in the output condition of the do-while loop, between lines 72 and 85.
In the line 86 we write in the output file “\n” character to indicate that this is the beginning of the file.
Figure 9: Block 5, arrays declaration.
Next in the input file will be the sequence of packets with header and data, but before we will reserve memory to handle these packets. We will have a pointer, ppb, which points to two elements array. These elements will be pointers, ppb[0] and ppb[1], which point to MAX_SAMPLES elements arrays.
Between lines 93 and 97 we reserve memory for the two elements array.
Between lines 99 and 106 we reserve memory for the MAX_SAMPLES elements arrays. We have made this with malloc function, and compare the return value with NULL to ensure ourselves there is enough available memory.
Finally, we fill the variables values, each one is an integer, with the initial value 0.
For better understanding the next picture show what exactly we do.
Página 16 de 44

______ Sergio Díez Núñez ________ Power Consumption Optimization in Bluetooth Networks ______
Figure 10: Array explanation.
Figure 11: Block 6, packet header loop.
Here starts the main process of the program, sample files handling.
In the line 113 the while sentence is for repeating the process while data packets left in the input file, pointed by the variable pfile1.
Between lines 116 and 130 we manipulate and get data from packet headers, in a similar way as we did with the main header. But this time, we need to gather data from timestamp. The way we do this is with another do-while loop, but this time comparing with the string “Time”, and when we find it, store it in the line 126. With this fscanf, we store the different magnitudes hours, minutes and seconds separately by “:” and 6 valid values (fill with 0 to the left, nonvalid) separated with “;” for the microseconds. We use another variable, timefound, to remember that we have already gather the time information of this header. It could be done with another do-while loop too, but we preferred do it in this way.
Página 17 de 44

______ Sergio Díez Núñez ________ Power Consumption Optimization in Bluetooth Networks ______
Figure 12: Block 7, read data loop.
In this part, we begin with the initialization of timefound variable for the next incoming packet in the line 132.
In the line 133, we read the strings from the input file “X_Value”, “untitled” and “comment”. Their values aren’t important because they are strings.
In the line 135, we read the first sample value. Actually, the only important value is taking in data2, which represent the measurement sample. We read this first sample separated from the others because this has 3 columns, instead 2. The third column is the “,” character.
In the lines 137 and 138, we translate the sample, because it has been took like string and we want it as integer value. This is made with atoi function and we store it in the first position of our second handling array. The second handling array, ppb[1], will contain the samples of the new packet we are reading, and our first handling array, ppb[0], will contain the samples of the previous packet. Later we will look for matches between the first samples of the second array and all the samples of the first array.
Between the lines 140 and 145, we copy the rest of the samples of the packet, converted into integer, in the second array, ppb[1].
In the line 147, we rise the number of processed packets.
Between lines 150 and 154, we contemplate the situation when the first packet of the file has been read. There is no previous packet to compare with, so, we copy entire the second array into the first array.
Página 18 de 44

______ Sergio Díez Núñez ________ Power Consumption Optimization in Bluetooth Networks ______
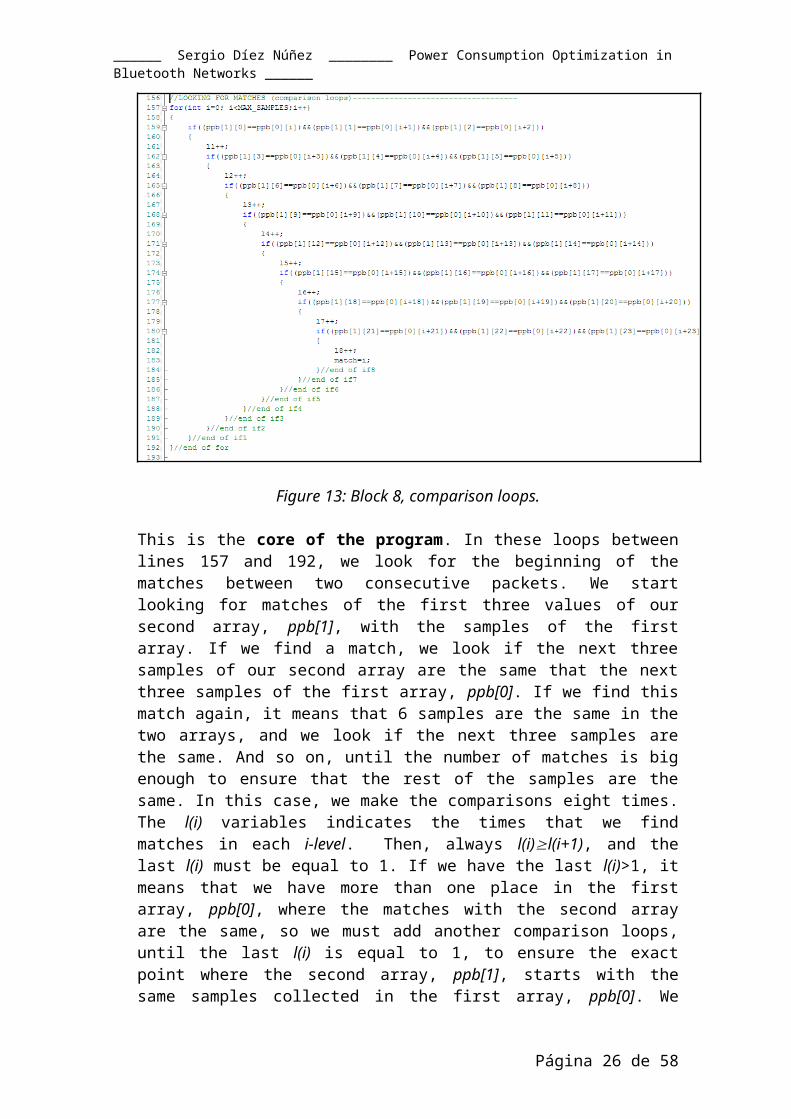
Figure 13: Block 8, comparison loops.
This is the core of the program. In these loops between lines 157 and 192, we look for the beginning of the matches between two consecutive packets. We start looking for matches of the first three values of our second array, ppb[1], with the samples of the first array. If we find a match, we look if the next three samples of our second array are the same that the next three samples of the first array, ppb[0]. If we find this match again, it means that 6 samples are the same in the two arrays, and we look if the next three samples are the same. And so on, until the number of matches is big enough to ensure that the rest of the samples are the same. In this case, we make the comparisons eight times. The l(i) variables indicates the times that we find matches in each i-level. Then, always l(i)l(i+1), and the last l(i) must be equal to 1. If we have the last l(i)>1, it means that we have more than one place in the first array, ppb[0], where the matches with the second array are the same, so we must add another comparison loops, until the last l(i) is equal to 1, to ensure the exact point where the second array, ppb[1], starts with the same samples collected in the first array, ppb[0]. We store the number of the sample where begin the matches in the match variable.
Página 19 de 44
______ Sergio Díez Núñez ________ Power Consumption Optimization in Bluetooth Networks ______
Figure 14: Block 9, copy correct values.
Now, in the line 194 we check that the number of comparison loops has been enough. In other case, we activate the warning flag, assigning the worth 1.
In the line 196 we initialize again the number of matches is each level for the next packets.
Then, if match=0 it would mean two things (lines 197 to 205):
- This is the first packet and the match has been found in the sample 0 because we copied the second array into the first array, so they got the same samples. Then, we do anything.
- We haven’t found matches between the packets. This is the consequence of some empty packets. Then, we write the number of empty packets and their timestamps to find it easier. Also, we print some information about this in the output file.
If match isn’t 0 (lines 206 to 215), then we copy the first array timestamp stored (tagged with a cero at the end) in the output file and the correct samples values (of ppb[0] array) before they start to be the same than in the other array, indicated by match variable.
Figure 15: Block 10, arrays actualizations.
Página 20 de 44
______ Sergio Díez Núñez ________ Power Consumption Optimization in Bluetooth Networks ______
This is the end of for-loop, lines 216 to 225, where we reinitialize our variables for a correct work. Once we have copied the values into the output file, the values of our handling arrays are irrelevant, then we copy the information of the second array, ppb[1] into the first array[0], and the information of the next packet will be copy in the second array for the next iteration of the loop. The same happen with time values, we copy the values with 1 at the end, into the values with 0 at the end. The match value is assigned to MAX_SAMPLES-1 indicating that at the beginning, there isn’t matches until the last sample. And now, another iteration of the for-loop will start.
Is also important realize that the last packet must be copied entire because there isn’t incoming packets which repeat its samples, and that’s what we do in the lines between 226 and 229. This is the same that previous times, but now copying all the values.
Figure 16: Block 11, warning and free memory.
Now, we are finishing our program. In the line 234 we print on the screen the total amount of processed packets, only for extra information.
In the line 236 and 237 we evaluate the value of warning flag. If it is 1, we print on the screen that we need to add in the source code more comparison loops to ensure the exact match of the samples.
Between the lines 241 and 244, we free the memory from the two handling arrays, ppb[0] and ppb[1], and their pointer, ppb.
Figure 17: Block 13, close files.
Página 21 de 44

______ Sergio Díez Núñez ________ Power Consumption Optimization in Bluetooth Networks ______
This is the last block. Between lines 246 and 254 we close the input file (*.lvm) and free the pointer pfile1 with the fclose function. We evaluate the returned value for handling possible errors.
Between lines 255 and 263 we do the same with the output file (*.txt).
The line 264 is to be able to see the results on the screen once we’ve finish the running of the program.
The line 265 is the end of our main function, and our program.
2.4. The output files, *.txt .
The output file is created by our program and stored only the correct samples. Actually, we add the extension .txt when we enter the name of the output file because we have been open this kind of files with Notepad. This files are the aim of our program, and here it’s an example.
Figure 18: Output file example.
Página 22 de 44

______ Sergio Díez Núñez ________ Power Consumption Optimization in Bluetooth Networks ______
On the one hand, we print the timestamp of each packet before printing their samples, on the first column. On the other hand, we print the samples on the second column, one per line.
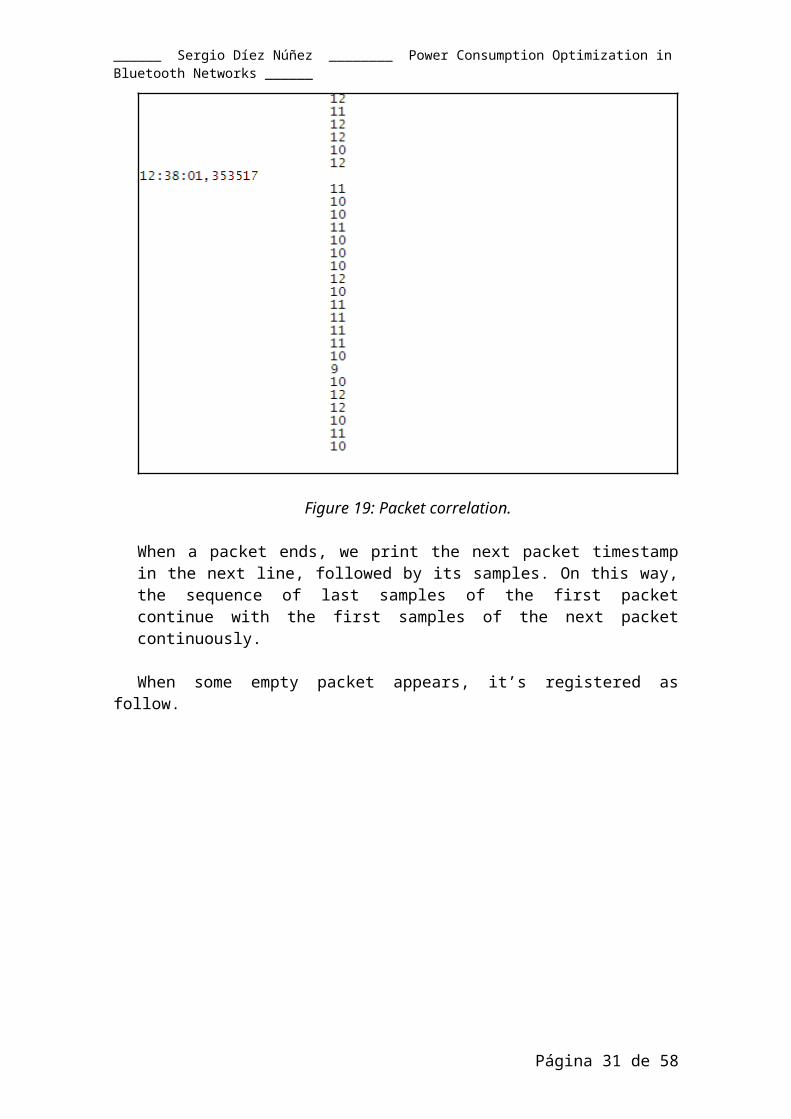
Figure 19: Packet correlation.
When a packet ends, we print the next packet timestamp in the next line, followed by its samples. On this way, the sequence of last samples of the first packet continue with the first samples of the next packet continuously.
When some empty packet appears, it’s registered as follow.
Página 23 de 44

______ Sergio Díez Núñez ________ Power Consumption Optimization in Bluetooth Networks ______
Figure 20: Empty packets, file advertisement.
In this situation, we print all the samples of the previous packet. Then we inform with the line “------- >The problem is in these empty packets < ----------”, that there’s a problem because we’ve found an empty packet. After this, we skip the next packet, and start again like if we were at the beginning of the file. It is shown in the next picture.
Figure 21: Input/output, working methodology.
Página 24 de 44

______ Sergio Díez Núñez ________ Power Consumption Optimization in Bluetooth Networks ______
Now, the output file is ready for further analysis in the second part of the project. The typical size of output files for 25 MB input files with 3000 samples packets is around 4 MB.
2.5. Some wrong previous steps.
- I tried to store all the samples of all the packets in same sized arrays, and compare the arrays after. I stored the number of the last correct sample of each packet, and I wrote all the correct samples at the end of the program in the output file.
This option was functionally correct, there were problems with the stack memory working with big input files (more than 10 MB).
The solution I took was work with only two arrays and turn their contain, reading, comparing and copying at the same time, not at the end.
- The value assigned to MAX_DATA was 20 at the beginning but it wasn’t enough and some memory violations appeared when I stored strings. I tried with 25 but errors still appeared. Finally, I decided to put 30 and it works properly.
- I had lots of problems getting data from timestamps. At the beginning, I tried to look for any function for translate string into some kind of structure, struct, where hours, minutes and seconds were different fields, but I didn’t find a good enough one. Then, I decided to get it with the fscanf function with the arguments separated in this way “(%d:%d:%lf)”. The seconds variable was a double variable (float point), but it didn’t work because there was a “,” character instead a “.” character. That’s the reason because I took the seconds in the way “(%d:%d:%d,%6lf)” , hours, minutes and second in integer variables, and microseconds with 6 important digits in long integer variable.
2.6. Suggested improvements.
- It could be possible pass the names of the input and output file by the command line when we run the program, and handle these names with the arguments argc and argv of the main function. Either, it could be possible to run the program for more than one file at the same time, that it’s to say, enter names for input and output names at the beginning, and run the program once per file until the number of files was empty.
- Also it is possible modify the information we write in the output file. We could write the main header, or the packets headers, or different messages in case of empty packets…
- Erase the empty packets and make the loop able to work when some of this packet is found. Now, we need to wait one packet more for a properly work, and start from the beginning like if the packet that follow the empty packet was the first one.
Página 25 de 44
______ Sergio Díez Núñez ________ Power Consumption Optimization in Bluetooth Networks ______
- Make a new time structure, struct, which contain all the time fields inside (hours, minutes, seconds and milliseconds) and declare two variables, for example time0 and time1, of this new type. The way to access to our variables could be with the dot operator “.”, time0.hours or time1.seconds, for example.
- Another good improvement to save time would be don’t start making comparisons from the beginning of the packet. It could be possible using timestamps like I did it when it was been done manually with Excel grid. If we subtract consecutive timestamps we will get an approximation of the time that the samples are different. This is not totally exact, but I tested that the matches were always found between 300 samples before and 300 samples after the sample that timestamp subtraction indicated. In this way, we would only made 600 comparisons between 2 packets, instead MAX_SAMPLES comparisons.
2.7. Conclusions.
Before make this program, analyze and get the exact samples with Excel software from a typical input file like the ones we work with in the second part of the project, 25 Mbytes sized, it would take one week of work, working 8 hour per day.
Now, thanks to this program, it only takes a few seconds; 25 Mbytes sized files around 10 seconds.
3. Second Part: Power Consumption Analysis from *.txt files.
3.1. Introduction.
The *.txt output files of the previous part of our Project will be our starting point in this part. Mainly, it consist on analyze the measurements of the files when some activity or event is happening, in order to find some connection between the power consumption and the activity.
Figure 22: Inputs and outputs, second part.
In this case, we will analyze two different situations, Inquiry and PageScan, in 3000 samples files per packet (with 0,1 ms between two consecutive samples) and 1 minute length (around 25 MB in *.lvm and 4 MB in *.txt).
Página 26 de 44
Data Analysis*. txt files Conclusions

______ Sergio Díez Núñez ________ Power Consumption Optimization in Bluetooth Networks ______
What we will do with them will be a very mechanical work with Excel grids and it becomes very heavy, monotonous and it takes a long time (mean time,1 file per day). So, it’s recommended to create a new tool able to process and handling data from *.txt in a easier, faster and effective way.
3.2. Working Methodology.
We have follow the same working guideline for all the files.
First, we need to put samples from *.txt file into Excel grids. The maximum number of row in this software is 65535, insufficient to hold all the samples from our files. So we need to copy and paste once time and another into different columns until complete all the samples. We will start copying in the next column from the last packet of the previous column, in order to lose samples (it doesn’t matter if we lose or repeat samples if they haven’t significant values). We will left in blank some columns between samples columns for drawing graphics and getting important statistic data.
Besides then, the data analysis will start. The easy way to look where the events happen is drawing a graphic and observe where the values grow up. Now, we found another Excel inconvenient, because it allow only draw graphics with a maximum of 32000 points. So, we will draw 2 graphics per column, and left without representation some points without interesting values (65535 – 2*32000 = 1535 values without representation).
Watching out these graphics, we will see peaks where our samples take higher values. We must find these values in the sample columns and draw another graphic, focused in these points to see what happens in this event or activity.
These points represent the samples which were got while a concrete operation was made. These values are integers and must be translated into the correct magnitude, in mA (milliAmpers), multiplying by a scale factor that we get from the resolution of the oscilloscope: it is , (value in mA) = 100/255*(value as integer).
Next, we will calculate the maximum, minimum and average from the values, with MAX(), MIN(), and PROMEDIO() (MEAN() in English version) functions, from the first sample which starts rising its value to the last which start decaying it value.
Also, we will need to calculate the interval of time between the first sample and the last one to get the energy, our principal aim. It’s enough counting the number of samples, with the CONTAR() (COUNT() in English version) function, substract 1, and multiplying by the inter sample time, 0,1 ms.
We will repeat all these steps with all the files, looking for events and getting statistics data. Later, we will compare one and others to make conclusions.
Also, it’s important to say that some empty packets were found while events happened, so these packets weren’t analyze.
Página 27 de 44

______ Sergio Díez Núñez ________ Power Consumption Optimization in Bluetooth Networks ______
For each event, Inquiry and PageScan, we will analyze 4 files:
- Normal: normal file, around 100 significant values each 15000/25000 samples of the *.txt file.
- Fast: the events happen faster than in the normal one, with higher frequency, around 100 significant values each 6000 samples of the *.txt file.
- Long: the events are more time length, around 1000 significant values each 15000/25000 samples of the *.txt file.
- Fast&Long: the events happen faster and are more time length, around 1000 significant values each 6000 samples of the *.txt file.
3.3. Inquiry.
Página 28 de 44

______ Sergio Díez Núñez ________ Power Consumption Optimization in Bluetooth Networks ______
3.3.1. Inquiry Normal.
This is an extract of the main look of Inquiry file. One activity each 25000 samples.
Figure 23: Inquiry normal general.
And this is another graphic with more resolution of the activity.
Figure 24: Inquiry normal detail.3.3.2.Inquiry Fast.
Página 29 de 44

______ Sergio Díez Núñez ________ Power Consumption Optimization in Bluetooth Networks ______
This is an extract of the main look of Inquiry Fast file. One activity each 6000 samples.
Figure 25: Inquiry Fast general.
And this is another graphic with more resolution of the activity.
Figure 26: Inquiry Fast detail.
3.3.3. Inquiry Long.
Página 30 de 44
______ Sergio Díez Núñez ________ Power Consumption Optimization in Bluetooth Networks ______
This is an extract of the main look of Inquiry Long file. One activity each 25000 samples.
Figure 27: Inquiry Long general.And this is another graphic with more resolution of the activity.
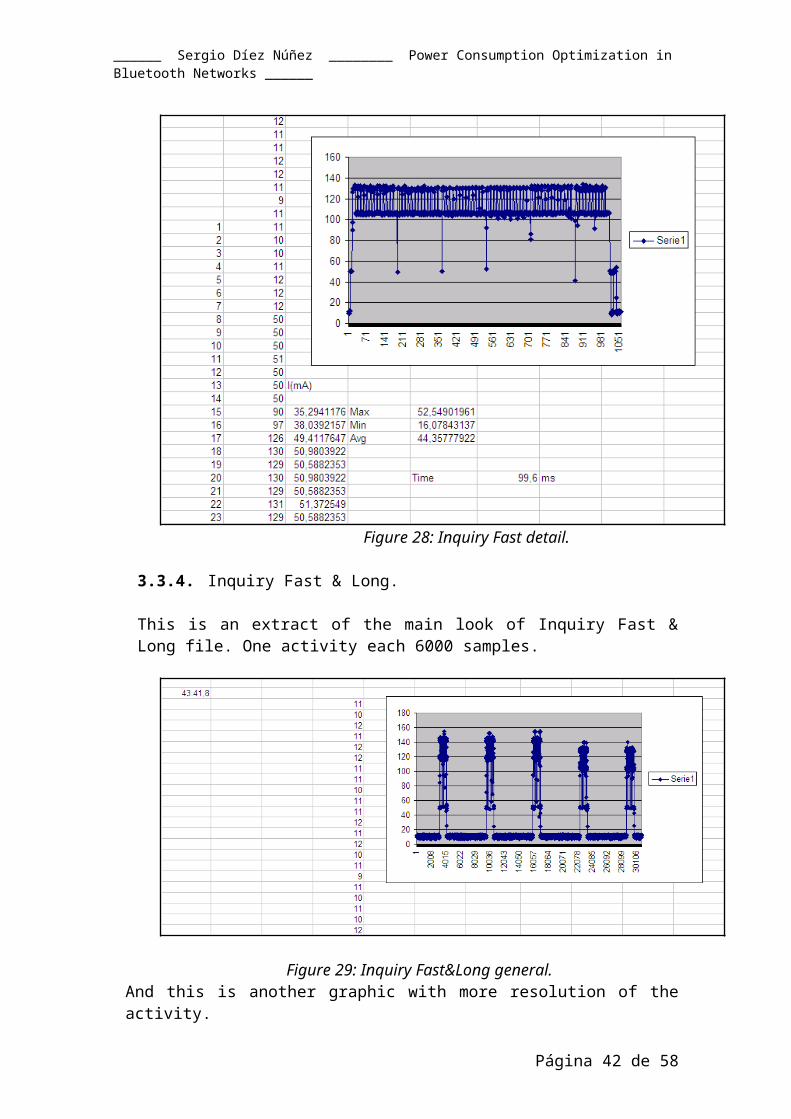
Figure 28: Inquiry Fast detail.
3.3.4. Inquiry Fast & Long.
Página 31 de 44

______ Sergio Díez Núñez ________ Power Consumption Optimization in Bluetooth Networks ______
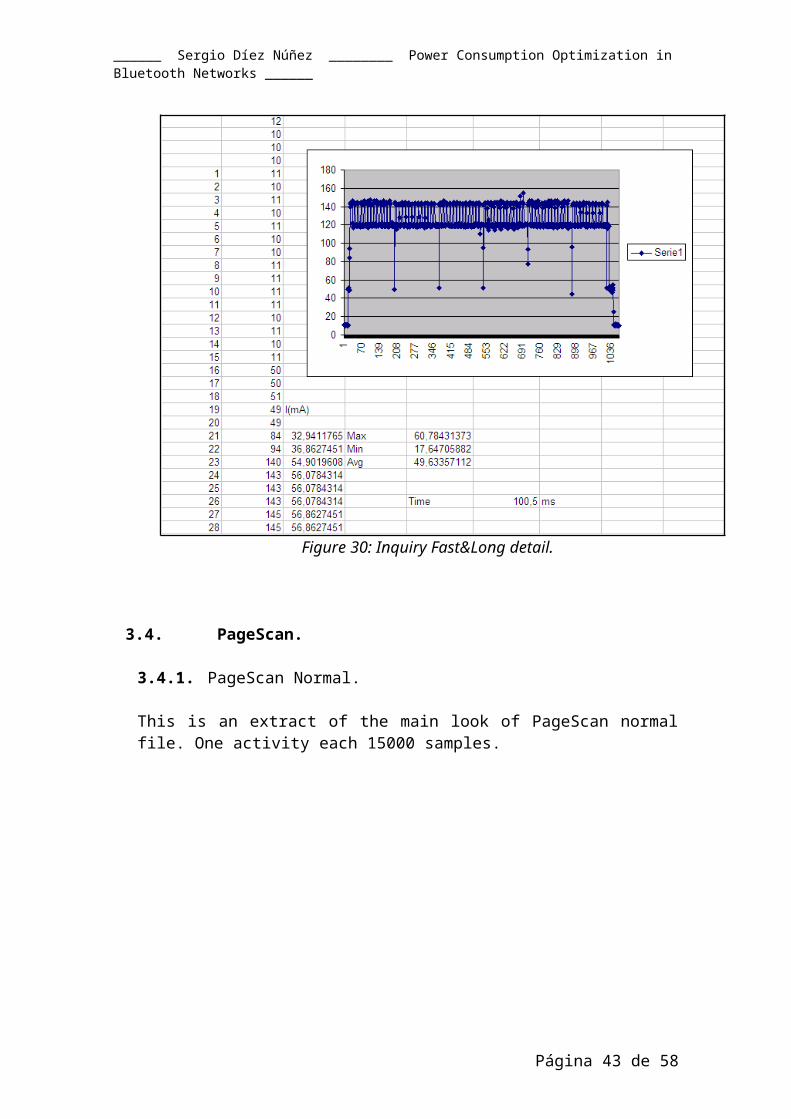
This is an extract of the main look of Inquiry Fast & Long file. One activity each 6000 samples.
Figure 29: Inquiry Fast&Long general.And this is another graphic with more resolution of the activity.
Figure 30: Inquiry Fast&Long detail.
3.4. PageScan.
Página 32 de 44

______ Sergio Díez Núñez ________ Power Consumption Optimization in Bluetooth Networks ______
3.4.1. PageScan Normal.
This is an extract of the main look of PageScan normal file. One activity each 15000 samples.
Figure 31:Page Scan normal general.
And this is another graphic with more resolution of the activity.
Figure 32: Page Scan normal detail.
3.4.2. PageScan Fast.
Página 33 de 44

______ Sergio Díez Núñez ________ Power Consumption Optimization in Bluetooth Networks ______
This is an extract of the main look of PageScan Fast. One activity each 6000 samples.
Figure 33: Page Scan Fast general.
And this is another graphic with more resolution of the activity.
Figure 34: Page Scan Fast detail.3.4.3. PageScan Long.
Página 34 de 44

______ Sergio Díez Núñez ________ Power Consumption Optimization in Bluetooth Networks ______
This is an extract of the main look of PageScan Long file. One activity each 15000 samples.
Figure 35: Page Scan Long general.
And this is another graphic with more resolution of the activity.
Figure 36: Page Scan Long detail.
3.4.4. PageScan Fast & Long.
Página 35 de 44

______ Sergio Díez Núñez ________ Power Consumption Optimization in Bluetooth Networks ______
This is an extract of the main look of PageScan Fast & Long file. One activity each 6000 samples.
Figure 37: Page Scan Fast&Long general.
And this is another graphic with more resolution of the activity.
Figure 38: Page Scan Fast&Long detail.
Página 36 de 44
______ Sergio Díez Núñez ________ Power Consumption Optimization in Bluetooth Networks ______
Once calculating interesting current values, we could calculate also power consumption. We need to know the system voltage, it is 3,3 V. So, now we have all data to make our calculations.
We will make 2 new Excel files, called InquiryResults and PageScanResults, where we will draw graphics with maximum, minimum and average current of all activities in each kind of operation. Notwithstanding, current values aren’t very much significant, so we will use time data to calculate power consumption, and the next functions:
Figure 39: Power functions.
Our aim is to calculate W in each activity from each operation. With these data we will be able to take more relevant conclusions for our investigation work. This is an extract from the file InquiryResults.xls:
Figure 40: Extract InquiryResults.
In these files (InquiryResults.xls and PageScanResults.xls) we translate max, min, avg and Time from the previous files, and we make calculations, with the functions shown in Figure 38, for Power (P), Power Consumption (W), and max. min and avg mean. Actually, we will use Power Consumption data, W, to analyse and compare the operations. If we calculate the mean of Power Consumption in each operation, we obtain a grid like this.
Figure 41: Inquiry Power Consumption Means.
Página 37 de 44
P = V * I W = P * T

______ Sergio Díez Núñez ________ Power Consumption Optimization in Bluetooth Networks ______
Here, we can see Power Consumption is practically the same in Inquiry and InquiryFast operations, also happen with InquiryLong and InquiryFastLong. However, in this case the consumption is ten times higher than two fore operations. The same things happen with Page Scan operation: PageScan and PageScanFast have approximately the same consumption, and PageScanLong and PageScanFastLong have ten times higher consumption. We can see it in the next figure.
Figure 42: Page Scan Power Consumption Means.
If we compare two main operations, Inquiry versus PageScan, we could see power consumption is slightly higher in Page Scan in each way (normal, fast, long and fast&long).
3.5. Conclusions.
This part would be inaccessible with bigger files. Indeed, Martin Ekström gave a 40 MB captures file and estimated time to analyse it in the same way I did with Inquiry and PageScan would be 15 days of work for only 1 file. This is an example what I’m talking about.
Figure 43: Big file general.
Here it is. If we make a zoom into the samples, we can see this another picture.
Página 38 de 44

______ Sergio Díez Núñez ________ Power Consumption Optimization in Bluetooth Networks ______
Figure 44: Big file detail.
This means activities with around 70 significant samples each less than 500 samples. As I said before, only one file, 1 minute of captures, would mean 3 weeks of work.
If we do more conscientious analysis, we could think about 2 different things:
- If we knew the power consumption, could we be able to know the operation we have made?
- If we knew the operation, could we able to know the associated power consumption?
This analysis is made with next grid:
Figure 45: Lower Values Analysis.
Página 39 de 44

______ Sergio Díez Núñez ________ Power Consumption Optimization in Bluetooth Networks ______
Figure 46: Decision regions.
In the first grid, the purple column shows the probability the consumption will be the expected for each operation (we have the operation and we want to know the associated consumption). And the purple line shows the probability when we have the consumption this matches with the operation associated with these consumption values range (we have the consumption and we want to know the operation).
If we think about our situation, we need to assign more power consumption operation to more loaded batteries. So, the most advisable will be look at the purple column. For example, if we have to do a PageScan operation, we know with 10,87% probability that the consumption will be the typical for a PageScan operation (aprox. 1,7665 mWs).
But we find a problem because percent accuracy is too low with our data. This is because power consumption values of different operation are very similar, and it’s very unlikely to know the exact operation associated with one power consumption. Notwithstanding, if we studied more operations, we could set a limited range of operations for each consumption. So, if we have more operations with the same consumption, will could set operations in the net in a mellowed way, with more tolerance than if we have only one operation per consumption (we could choose between more options in the first case).
A example of this follow. If we analyse our files with another bigger scale, we could difference only 2 consumption values.
Figure 47: Bigger scale analysis.
Página 40 de 44
InquiryFast Inquiry PageScan PageScanFast
Intermediate1 Intermediate2 Intermediate3

______ Sergio Díez Núñez ________ Power Consumption Optimization in Bluetooth Networks ______
Figure 48: Bigger scale decision regions.
Here, we can see if we want to do a Inquiry operation (InquiryFast, PageScan, PageScanFast), we will know with 100% probability that power consumption will be around the mean of these 4 operations. And if we need to do a InquiryLong operation (InquiryFastLong, PageScanLong, PageScanFastLong), we know with 100% probability that it will need more power consumption, around the mean of 4 operations, and it could be assigned to devices with more battery left.
4. Some documentation.
Next, I show an extract from a Microsoft Office Project 2003 file where is easy look the rough time spent in each activity in relation with the Project.
Figure 49: Project time evolution graphic.
Task Number
Name Duration (work days)
1 Problem situation and analysis 52 Part 1: C-Programming 20
2.1 File function and C Language review 2
Página 41 de 44
Intermediate
InquiryInquiryFastPageScan
PageScanFast
InquiryLongInquiryFastLongPageScanLong
PageScanFastLong
______ Sergio Díez Núñez ________ Power Consumption Optimization in Bluetooth Networks ______
2.2 Implementation and easy files test 82.3 Real files tests 22.4 Solution with 2 arrays, easy files 32.5 Print timestamp 32.6 Comment and variable names review 23 Part 2: File analysis 27
3.1 Preliminary plan for Alcalá 33.2 .lvm big files tests 23.3 Inquiry files analysis 63.4 Page Scan files analysis 83.5 Add time calculation 23.6 Add power calculation 33.7 Graphic conclusions 34 Report 20
Figure 50: Task table.
It shows 4 main activities.
The first one was evaluate the problem situation, requirements, things to be done. Also I made practices with Excel files, and read documents about a new software FTS4BT (Frontline Test System for Bluetooth). It’s a Bluetooth Sniffer to analyse Bluetooth traffic by software in a easy way, but it wasn’t so easy as it said. It could be my second part of the Project, but I can’t manage to understand the operation mode, so that’s the reason because of the change of the second part.
The second was developing the program in C language. This is wide commented in the section 3 of this report.
The third was the analysis of the power consumption captured files. This is also commented in the section 4 of this report.
The last one has been making this report. This work could be done at the same time that the project is been doing or at the end of this. I have prefer to do it before the end because the information of the last part would be more recent, and after doing the first part because I think there are more perspectives and global vision of the program and the intended goals. The conclusions, obviously have been taken after having all the information about power consumption, because I need these data to draw graphics and see the information clearly.
5. Conclusions.
Página 42 de 44
______ Sergio Díez Núñez ________ Power Consumption Optimization in Bluetooth Networks ______
I will comment what it was needed and what I have done to make the conclusions of the project.
The first part was do the C program to convert *.lvm files in *.txt files. Actually, it isn’t necessary that output files have *.txt extension, but I add it because it’s easy to open this files with Notepad. Output files represents captured files in a continuous way, without gaps between the packets, because packets start to get samples before the previous packet has finish, then there were gaps and repeated samples.
The bigger project which University of Mälardalens is doing will need to work with lots of capture files to analyse power consumption. The estimated time to do this work with Excel grids with 1 minute duration files could be one week. This program do it in less than 10 seconds. The time advantage is very noteworthy.
Nowadays, while I’m finishing my project, Martin Ekström and Marcus Blom have modified the source code of the program to calculate power consumption of each capture file. In this manner the second part of my project could be deleted to analyse more capture files, and it is possible only to pass the file through the program and it calculate data we need. It suppose a important significant time advantage, because other way, the problem would be unapproachable.
From the second part of the Project, I could emphasize that results aren’t so good as we expected. We can’t assure with 100% probability what consumption matches with each operation. However, though we can’t difference each operation from the others, we could difference groups of operations from other group of operations, and get an approximate consumption of the operation (some operations will have the same approximate consumption). This allows to assign operations to devices with higher liberty grade, and make the net more flexible.
It’s very recommended, almost mandatory, to analyse the rest of typical Bluetooth operations and compare the obtained results. This Project give a way to analyse the power consumption and find matches between operations and consumptions. In future, the analysis could be done by software. It will be faster, and also it could be done with more statistic tools and graphics design software to make conclusion easier.
Time is very important in this kind of Projects, and it’s important to make a time estimation of each task, and ensure ourselves that the Project is approachable. Maybe, if I have spent more time thinking about the way I would do the analysis, I could realize that it would be faster by software. The time spent developing the program will be longer, but this program could allow me analyze bigger amount of captured files, and make conclusions based in wide perspective of the power consumption.
Página 43 de 44

______ Sergio Díez Núñez ________ Power Consumption Optimization in Bluetooth Networks ______
6. Bibliography and resources.
For knowledges about Bluetooth technology:
- http://es.wikipedia.org/wiki/Bluetooth , last access 31st October 2007.- http://spanish.bluetooth.com/bluetooth/ , last access 31st October 2007.- http://www.faq-mac.com/mt/archives/008265.php , last access 31st October
2007.- http://electronika2.tripod.com/info_files/bluetooth.htm , last access 31st
October 2007.
For the first part, C-Programming:
- Curso de programación C/C++, [Fco. Javier Ceballos Sierra, RA-MA Editorial, 1995 Edition].
- Introductory C: Pointers, Functions, and Files, [Richard L. Peterson, Academic Press Editorial, 1997 Second Edition].
- http://conclase.net/c/ficheros/ , last access 17th September 2007.- http://mimosa.pntic.mec.es/~flarrosa/fichc.pdf , last access 31st October
2007.- http://nereida.deioc.ull.es/~pcgull/ihiu01/cdrom/c/contenido/node20.html ,
last access 31st October 2007.
Other resources:
- http://www.mdh.se/ide/iss/index.php , last access 31st October.- David Espinosa Alfaro Thesis: Simulation of Bluetooth™ Scatternet for
battery life optimization.
Página 44 de 44