developing a framework of orientated tools and …
TRANSCRIPT
i | P a g e
DEVELOPING A FRAMEWORK OF LEAN ORIENTATED TOOLS AND PRACTICES TO BE INTRODUCED AT WITS: A WITS PLUS CASE STUDY
Nicoleen Potgieter
STUDENT NUMBER 11866
School of Mechanical, Industrial and Aeronautical Engineering
University of the Witwatersrand, Johannesburg
A research report submitted to the Faculty of Engineering and the Built
Environment, University of the Witwatersrand, in partial fulfillment of the
requirements for the degree of Master of Science in Engineering.
Johannesburg 2020

ii | P a g e
Declaration of Originality
I, the undersigned declare that:
This research is being submitted as a due requirement to the University of the
Witwatersrand, Johannesburg, in partial fulfillment for the degree of Master of
Science in Engineering (Industrial) (50/50).
This research is my own unaided work unless specifically referenced as such in
the text
No work submitted here has previously been published
All the information gained herein was whilst enrolled at the University of the
Witwatersrand
Nicoleen Potgieter
13 November 2020

iii | P a g e
Abstract
This research report aims to identify Lean orientated tools and practices that can be
used within the University of the Witwatersrand, Johannesburg (Wits) to create
awareness and knowledge that can support the analysis and improvement of
administrative processes.
Many administrative processes at Wits are complex and involve many stakeholders.
When a new process or a change to a process is introduced staff does not always
analyse the changes or realise the impact thereof on current processes. Through
ignoring this, duplicated processes are created leading to a lot of frustration. There is
therefore a need within the University for staff to gain a better understanding of how
to analyse and improve processes when changes are introduced without creating any
duplication. This study will, therefore, consider selected Lean orientated tools and
practices to see how these practices can assist in this regard.
The study involved staff from Wits Plus and Faculties at the University and made use
of pre-interviews and post-interviews and a workshop to establish which Lean
orientated tools and practices were best suited to analyse and improve administrative
processes. The workshop introduced and exposed participants to Lean orientated tools
and practices and allowed them to use them in practice. The findings identified Flow
Diagrams, DMAIC (Define, Measure, Analyse, Improve and Control), and the Six Honest
Serving Men framework as the three most suited practices to analyse and improve
administrative processes. These practices are proposed in a framework for future use
and support to Wits staff.

iv | P a g e
Acknowledgments
To everyone who supported me during this time, I express my deepest and sincerest
gratitude.
To my Father God who gave me the strength, the patience, and the wisdom to continue
with this report and degree from start to finish.
My sincere gratitude goes to my two supervisors, Dr. Teresa Hattingh and my co-
supervisor Professor Anne Fitchett who gave me all the support, mentoring, and coffee
during this demanding time. Their guidance helped me from my first to my last word.
I would also like to thank my direct line manager, the Registrar, Ms. Carol Crosley for her
support during the completion of my Master's degree and for allowing me to embark on
this journey. Her smiles and continued support meant a lot to me.
I also want to thank the staff of Wits Plus and the Faculties who believed in me worked
with me and allowed me into their offices. Without your participation and valuable input,
this report would not exist.
Lastly, to my wonderful sister Jolinda Prinsloo, I would not have been able to do this
without your continuous love, friendship, and support.
I am forever grateful.

v | P a g e
Table of Contents
____________________________________________________________________________________________________
Declaration…………………………………………………………………………………………………………………..…..….ii
Abstract……………………………………………………………………………………………………………...…….iii
Acknowledgments………………………………………………………………………………………………..…...iv
CHAPTER 1 ……………………………………………………………………………………………………….…...1
1. Introduction…………………………………………………………………………………………………..….…1
1.1 A Personal Narrative…………………………………………………………………………………….....1
1.2 Background……………………………………………………………………………………………….……2
1.3 Terminology………………………………………………………………………………….………….…….7
1.4 Overview of Wits Plus Centre for Part-Time Studies ……………………………….……..….8
1.5 The Wits Readmission Committee Process (WRC)……………………………………..........11
1.6 Research Motivation……………………………………………………………………………………...14
1.7 Purpose of the Research…………………………………………………………………………………14
1.8 Research Question and Problem Statement……………………………………………….........15
1.9 Research Objectives……………………………………………...………………………………….……16
1.10 Research Limitations…………………………………………………………………………..16
1.11 Report Layout……………………………………………………………………...……….…….17
CHAPTER 2……………………………………………………………………………………………………………..19
2. Literature Review……………………………………………………………………………………….....19
2.1 Introduction…………………………………………………………………………………………….……19
2.2 Lean Principles……………………………………………………………………………………..............19
2.3 Evolution of Lean…………………………………………………………………………………………..21

vi | P a g e
2.4 Lean in the Service and Higher Education Sectors………………………………..…….........22
2.5 Lean Orientated Tools and Practices……………………………………………………………….26
2.5.1 Value Stream Mapping (VSM)……………………………………………………………….27
2.5.2 DMAIC (Define, Measure, Analyse, Improve and Control) ……………………..29
2.5.3 PDCA (Plan, Do, Check, Act) ……………………………………………….……….............30
2.5.4 ‘Six Honest Serving Men’- Framework……………………………………………….….31
2.5.5 Fishbone Diagram……………………………………………………………………………….32
2.5.6 Comparison of the Lean Orientated Tools and Practices and the Reasons for
Selecting these Tools and Practices……………………………………………………….32
2.6 Conclusion of the Literature Review…………………………………………………………….....36
CHAPTER 3
3. Research Methodology…………………………………………………………………………………..37
3.1 Introduction……………………………………………………………………………………………….....37
3.2 Methodology……………………………………………………………………………………………...….37
3.2.1 Research Design: Qualitative Research Method……………………………………..37
3.2.2 Reliability and Validity…………………………………………………………………..…….39
3.2.2.1 Bias………………………………………………………………………………................39
3.2.2.2 Triangulation……………………………………………………………………………40
3.3 Sampling…………………………………………………………………………………………...................41
3.4 Data Collection Methods………………………………………………………………………..............42
3.4.1 Interviews…………………………………………………………………………………..………43
3.4.2 Workshop…………………………………………………………………………………..............45
3.5 Ethics……………………………………………………………………………………………………………46
3.6 Method…………………………………………………………………………..…………………………..…47
3.6.1 Research Question………………………………………………………………………………48
3.6.2 Part 1: Pre-Interviews………………………………………………………………………….48
3.6.3 Part 2: Workshop………………………………………………………………….……………..50
3.6.4 Part 3: Post-Interviews…………………………………………………………………..……52

vii | P a g e
3.6.5 Analysis………………………………………………………………………………………..…….54
3.6.5.1 Pre-Interviews………………………………………………………………………………..54
3.6.5.2 Workshop……………………………………………………………………………………….54
3.6.5.2.1 Grading Criteria and Grading Categories……………………..........55
3.6.5.3 Post Interviews……………………………………………………………………………….56
3.7 Conclusion………………………………………………………………………………………..…..............56
CHAPTER 4…………………………………………………………………………………………………….……….57
4. Data Analysis and Findings…………………………………………………………………………..…57
4.1 Background………………………………………………………………………………….................57
4.2 Introduction………………………………………………………………………………………..…..57
4.3 Analysis Section………...............................................................................................................58
4.3.1 Pre-Interviews………………………………………………………………………………58
4.3.1.1 Aim of the Pre-Interviews………………………………………………….58
4.3.2 Workshop …………………………………………………………………………………….67
4.3.2.1 Aim of the Workshop and the Purpose of using Process
Mapping……………………………………………………………………………………… 67
4.3.2.1.1 Value Stream Mapping (VSM)…..…………………..…………..69
4.3.2.1.2 DMAIC …………………….……………………………………………...75
4.3.2.1.3 PDCA (Plan, Do, Check and Act) ….……..……………….……..81
4.3.2.1.4 ‘Six Honest Serving Men’…………………………………………83
4.3.2.1.5Fishbone Diagram ……….…………………………………….……86
4.3.3 Post-Interviews…………………………………………………………………………….86
4.3.3.1 Aim of the Post-Interviews………………………………………………….86
4.4 Findings…………………………………………………………………………………………………..91
4.4.1Introduction to the Findings………………………………………………………………91
4.4.2 Pre-Interview Findings……………………………………………………………………..91
4.4.3 Workshop Findings…………………………………………………………….……...….92

viii | P a g e
4.4.3.1 Findings - Value Stream Mapping (VSM) …………………………….93
4.4.3.2 Findings - DMAIC ………………………..……………………………………94
4.4.3.3 Findings - PDCA ……………………………………………………...………..95
4.4.3.4 Findings - ‘Six Honest Serving Men’………………………………..….96
4.4.3.5 Findings - Fishbone Diagram………………………...…...……...…..…..97
4.4.3.6 Summary of the Workshop Findings…………………………………..98
4.4.3.7 Combined Average Grading of all the Lean Orientated Tools
and Practices………………………………………………………………….102
4.4.4 Post-Interviews Findings……………………………………………………………..103
4.5 Conclusion………………………………………………………………………………………..……103
CHAPTER 5
5 Discussion………………………………………………………………………………………………..….104
5.1 Introduction………………………………………………………………………………...………...104
5.2 Discussion of each Lean Orientated Tool and Practice………………………………104
5.2.1 Discussion: ‘Six Honest Serving Men’ …………………………...……………….104
5.2.2 Discussion: DMAIC …………………………………………………..……………….....105
5.2.3 Discussion: Value Stream Mapping…………………………..…………………...106
5.2.4 Discussion: PDCA ……………………………………………………..…...…………….106
5.2.5 Discussion: The Fishbone Diagram …………………………..……....................107
5.3 Use of Lean Orientated Tools and Practices to Analyse and Improve
Processes……………………………………………………………………………………………….107
5.4 Implications…………………………………………………………………………………………...108
5.5 Proposing a Wits Process Flow Framework………………………………………………109
5.5.1 Wits Process Flow Framework: Step by Step Guide…………….…………111
5.5.2 Wits Process Flow Framework: Breakdown of Each Step…….…………113
5.6 Conclusion and Final Thoughts………………………………………………….…………….115
ix | P a g e
CHAPTER 6
6 Conclusion and Recommendations…………………………………………………………………….116
6.1 Introduction……………………………………………………………………………………….…….116
6.2 Research Question and Objectives.…………………………………………………….……….116
6.3 Shortcomings in the Findings of the Research…………………………………….……….117
6.3.1Pre-Interviews………………………………………………………………………………..118
6.3.2 Sample Size……………………………………………………………………………………118
6.3.3 Tools……………………………………………………………………………………………..119
6.3.4 Post-Interviews……………………………………………………………………….…….119
6.4 Further Future Recommendations……………………………………………………………..120
6.5 Conclusion and Final Thoughts………………………………………………………….……….121
7 References……………………………………………………………………………………………………….124
8 Appendices………………………………………………………………………………………………………136
8.1 Appendix A: Ethics Approval Certificate……………………………………………………..136
8.2 Appendix B: Pre-Interview Questions…………………………………………………...……137
8.3 Appendix C: Post-Interview Questions………………………………………………….........138
8.4 Appendix D: Workshop Agenda…………………………………………………………..……..139
8.5 Appendix E: Workshop Presentation………………………………………………………….140
8.6 Appendix F: Workshop Brainstorming Notes………………………………………..........151
8.7 Appendix G: Workshop Process Mapping Notes…………………..…………..…...……..158
8.8 Appendix H: Procedure Document Wits Process Flow
Framework…………………………………………………………………………………………........164

x | P a g e
List of Figures
Figure 1: The Frustrated Worker…………………………………………………………………………….4
Figure 2: Wits Plus Offerings and Faculty Interactions………………………………………….…..8
Figure 3: Reporting Organogram…………………………………………………………………….............9
Figure 4: Five Lean Principles……………………………………………………………………...………...20
Figure 5: Value Stream Map (VSM) ………………………..………………………………………………69
Figure 6: Current WRC Process……………………………………………….……...………….…………..70
Figure 7: WRC Communication and Rule Process……………………………………….……..…….71
Figure 8: WRC Meeting and Outcomes Process…………..………………………………………..…72
Figure 9: Readmitted Students Registrations and Mid-Year Exclusions
Process…………………………………..………………………………………………………………...................73
Figure 10: Implementation Plans with Timelines……………………………………………………74
Figure 11: Five Stages of DMAIC………………………………..……………………………………..……75
Figure 12: DMAIC-Define the Problem and Set Goals…………...................................................76
Figure 13: DMAIC-Measure the Process…………………………………………………………………77
Figure 14: DMAIC-Analyse the Process ……………………….…………………………………………78
Figure 15: DMAIC-Improve the Process …………………….…………………………………………..79
Figure 16: DMAIC-Control ………………………………………...…………………………………………..80
Figure 17: PDCA Cycle……………………………………………….…………………………………………..81
Figure 18: PDCA-WRC Process………………………………………..……………………………………..82
Figure 19: ‘Six Honest Serving Men’ ………………………………………………………………………83
Figure 20: ‘Six Honest Serving Men’-Mapped ……………..…………………………………………...84

xi | P a g e
List of Figures (continued)
Figure 21: Comparative Grading of all Lean Orientated Tools and Practices……………102
Figure 22: Wits Process Flow Framework……………………………………………………….……111
Figure 23: Wits Process Flow Framework- Step-by-Step Guideline……………….………..112

xii | P a g e
List of Tables
Table 1: Terminology Table ………………………………………………………………………………..….7
Table 2: WRC Codes………………………………………………………………………………………………13
Table 3: Different Elements of each Lean Orientated Tool and Practice….…………………33
Table 4: Comparison Table -Advantages of the Five Lean Orientated Tools and Practices
……...…………………………………………………………………………………………………………………….34
Table 5: Comparison Table - Disadvantages of the Five Lean Orientated Tools and
Practices…………………………………………………………………………………………………..................35
Table 6: University Staff Participation Table……………………………………………………….….43
Table 7: Pre-Interview Questions Table…………………………………………………………………49
Table 8: Post-Interview Questions Table.…………………………………………….………….……..53
Table 9: Grading Criteria and Description of the Grading Categories………….……………55
Table 10: Pre-Interview Questions………………………………………………………….…………….60
Table 11: Post-Interview Questions……………………………………………………………….………87
Table 12: Grading Criteria and Description of the Grading Categories………….……….…..92
Table 13: Scoring Matrix Findings: Value Stream Mapping ………..……………………….……93
Table 14: Scoring Matrix Findings: DMAIC ………………….………….……………………….……..94
Table 15: Scoring Matrix Findings: PDCA …………….………………………………………….…......95
Table 16: Scoring Matrix Findings: ‘Six Honest Serving Men’ ………………………………..…96
Table 17: Scoring Matrix Findings: Fishbone Diagram……………………..……..…………….…97
Table 18: Summary of the Workshop Findings of the Lean Orientated Tools and
Practices…………………..………………………………………………………………………………………...100

xiii | P a g e
Nomenclature
AISU Academic Information Systems Unit
BIS Business Intelligence Services
DMAIC Define, Measure, Analyse, Improve and Control
DR Deputy Registrar
DVC Deputy Vice-Chancellor
FT Full-Time
GEMP Graduate Entry Medical Programme
LHE Lean Higher Education
LSS Lean Six Sigma
N+2 A programme must be completed within two years of regulation time.
PGCE Postgraduate Certificate in Education
PDCA Plan Do Check Act
PT Part-Time
RACI Roles, Accountability, Communication, Information table
SIMS Student Information Management System
TQM Total Quality Management
WITS University of the Witwatersrand, Johannesburg
WRC Wits Readmission Committee
WRC-1 Wits Readmission Committee (First Committee)
WRC-2 Wits Readmission Committee (Second Committee)

1 | P a g e
Chapter 1: Introduction
Chapter One introduces the purpose of this research and provides context for the
research that was undertaken. The motivation, research question, and objectives for
this research will be discussed in this chapter along with the limitations and bias of the
study and the framework that will be proposed. In this chapter, the role and
interactions of Wits Plus with the Faculties of the University’s Wits Readmissions
process will be explained.
1.1 A Personal Narrative
I completed my undergraduate degree studies at the University of Pretoria after which
my career started in the education environment where I worked in the private sector
at National Private Colleges for six years. I joined Wits in 2002 as an Admissions
Consultant and over the past 17 years, I have occupied various service offices within
the University.
From my early working years, I learned to appreciate properly run systems and
processes and my first encounter with an office with no processes in place was when I
joined the Faculty of Humanities in 2004. Had I perhaps at that time been aware of Lean
principles, eliminating duplication and waste, my approach to ‘cleaning up’ the
administration within the Faculty office would have taken a very different approach.
My strong feelings towards the importance of having properly structured, mapped, and
communicated processes in place however came about in 2015 with #FeesMustFall.

2 | P a g e
The movement brought about numerous changes and University rules and processes
were changed in split seconds to accommodate student demands. Jansen (2018) noted
that ‘Universities’ academic and organisational cultures were being broken down in the
narrow interest of politics by political parties who do not care about Higher Education
in the country’. He further pointed out that ‘Higher Education (HE) Institutions function
on rules and regulations and over the past few years processes to deliver quality
service to students has been turned up-side-down.’ He warns that the blatant defiance
of University processes can, in the long run, lead to the collapse of University systems
and the culture Universities try so hard to create.
Consequently, I decided that my research would aim to use my years of experience and
the valuable knowledge gained from my Lean studies to improve processes. I have
encountered many situations with staff being frustrated with the multitude of
processes or lack thereof, seeing time and time again staff having to start from scratch
with a process as a predecessor did not leave a documented trail when they left the
University. I am hoping that my findings will prove to be useful to the University
improving service levels not only to our students but also to ourselves.
1.2 Background
Dickeson(2011) notes that both Universities and Colleges have been searching for
more efficient academic programmes and support service delivery with Houston
(2008) pointing out that the focus of higher education has changed from accountability
to improvement, and that using Lean methodologies is key in this improvement
strategy. Kang and Monyonge (2014) write that fierce competition is taking place
within higher education regarding service delivery and providing a learning
environment to students, with facilities and services that support student life.

3 | P a g e
With increased University fees, students are expecting to receive better service,
therefore putting Universities under pressure to improve their services (Kang and
Monyonge, 2014). Tyagi et al. (2015) state that there needs to be continuous innovation
to uphold a competitive advantage and through implementing Lean tools and methods,
knowledge creation and support can be initiated.
A Lean approach can be optimised for administrative processes and there are valuable
arguments to be considered when thinking of implementing Lean principles in the
service industry, especially in higher education (Beckers, 2015). In his, book Lean
Higher Education: Increasing the Value and Performance of University Processes,
Balzer (2010) defines Lean in higher education as ‘defining the value of processes from
the perspectives of beneficiaries, identifying process flows’. This he states is done by
eliminating waste, creating process flows, and striving for perfection through
continuous improvement and transforming processes. He gives examples of flow
diagrams and value stream mapping showing where processes break down due to
waste. He further notes that in most universities, leaders do not always step back to
have a holistic view of all processes to discover the problems experienced by staff.
There is often no framework guiding them as to how a process can be changed or
improved. He notes several common concerns regarding service levels within the
higher education environment:
University processes fail to meet the needs of parents, students, faculty and
departments;
That processes within universities are perceived to be extremely slow and not
adding value;
When there is a complaint or failure of processes, intervention is required from
staff in authority;
That documented processes are poor, with no standardisation, instruction or
training;
That processes fail to benefit from staff insight;

4 | P a g e
That there is no mechanism for staff to share their thoughts, concerns,
suggestions; and
That there is no transforming climate assisting an organisation to improve
service levels regularly.
In many instances, administrative processes at Wits fall short, with staff being
frustrated at a lack of processes having to start from scratch with a process as a
predecessor did not leave a documented trail on leaving the University. This supports
the point that Balzer (2010) makes in that documented processes are poor and there
is no standardisation, instruction, or training. Dennis (2007) notes that through
sharing knowledge and having clearly defined standards an organisation can do well
even if key members of staff leave. He suggested creating a management system where
records of important learning facts can be shared. Figure 1 provides a graphic
representation of the frustrations that workers experience when processes are unclear
or unfamiliar.
Figure 1: The Frustrated Worker

5 | P a g e
Radnor and Bucci (2011) note three shared advantages when an organisation
introduces Lean initiatives:
(1) Creating an understanding that there is a need to change;
(2) Revising processes and practices that have not been revised for many years;
(3) Engaging staff in a way that will enable them to question and challenge their work
practices.
Implementing Lean, however, in a University is no easy task, and Jørgensen et al. (2007)
note that several studies have shown that the implementation of Lean may be anything
but a helpful experience for staff. For this reason, the aim of this research is not to
implement Lean at Wits but to experiment practically with five Lean orientated tools
and practices. In doing so, the three most suited practices will be identified and
recommended in a framework that in the future will be able to support Wits staff in
analysing and improving their administrative processes. This may not be the purest
way of implementing Lean but Netland and Powell (2017) note that whatever approach
is taken there are huge opportunities to improve the way universities work and Lean
is an important part of this. How Lean is applied should not be seen as a failure but as
an essential developmental step and an opportunity to apply Lean from experience of
key staff (Netland and Powell, 2017).
Bicheno and Holweg (2016) state that there are two approaches to Lean, firstly the
purist approach and then the alternative where some have comprehended that ‘real
lean’ is motivated more by behavior and that it offers a growth opportunity. They note
that every ‘Lean Guru’ has her/his own style regarding Lean transformation noting that
there is no right or wrong way. Ballé et al. (2006) state that going Lean should be less
about ‘leaning out’ every business process but about improving performance, seeing
and solving problems, and growing the intellectual capacity and skill of the
organisation members. Lean transformation should be framed to change the thought
processes of employees to be Kaizen conscious. Lean is about growing the behavior
6 | P a g e
and experience of the people who practice the system and, although difficult, it
empowers individuals to bring out their motivation and capabilities (Ballé et al. 2006).
When looking at the University and improving the services it renders, it is not always
clear what method to follow. Leite and Vieira (2015) notes that Lean services do not
have a specific model of tools, practices, or standards but rather a mix of tools and
practices that can be applied to the situation that needs to be improved. Atkinson
(2004) states that Lean is a concept, a set of tools and techniques and methodologies
that leads to effective resource allocation while Radnor and Walley (2008) state that
going Lean involves using a variety of tools and techniques. Netland and Powell (2017)
see institutions taking elements of the Lean toolkit e.g. visual management and
applying them to support improvement also noting that Lean Six Sigma, sticky note
mapping processes, and whiteboards work best to change initiatives.
In conclusion, it is stressed again that this research is not to implement Lean at Wits.
The research is done to find ways in which Lean orientated tools and practices can be
used at Wits to support the analysis and improvement of administrative processes,
especially as little to no thought is given to analyse and improve processes currently.
Balzer et al. (2016) note that the goal is to improve processes, empower employees,
who know the process to re-invent and transform them using Lean practices and
principles.

7 | P a g e
1.3. Terminology
Throughout the report, reference will be made to certain terminology. For ease of
reference, Table 1 explains what each term means:
Table 1: Terminology Table
Faculty A Faculty comprises the offices of the Dean, Faculty
Registrar, and Schools, including Faculty Human Resources
and Finance offices. Students register for their degree in a
specific Faculty and the Faculty is responsible for the
complete life cycle of a registered student.
Full-time studies A student who attends classes on a full-time basis during
the day (Witwatersrand, 2019)
Non-degree purposes Course/s taken by a student when they are not registered
for a degree but as an occasional student.
Part-time studies A student who attends classes after hours (after 5 pm).
Programme General Rule 1.24 states that a programme is a course or
set of courses that may lead to a qualification.
(Witwatersrand, 2019)
Occasional studies General Rule 1.21 states that Occasional studies are studies
which are undertaken by a student for non-degree
purposes, not leading to a degree (Witwatersrand, 2019)
Short course General Rule 1.30 states that a short course is a certified
teaching and learning activity. (Witwatersrand, 2019)
Readmission General Rule 5.7.2 stipulates that the Senate may cancel the
registration of students whose performance is not
satisfactory, and this student will need to apply for
readmission into the University. (Witwatersrand, 2019)
Wits-Plus Centre for Part-time studies.

8 | P a g e
1.4. Overview of Wits Plus Centre for Part-Time Studies
Wits Plus was established to cater for the more mature student, the working person
wanting to complete either a Bachelor of Arts or a Bachelor of Commerce degree. Over
the past three years, Wits Plus has grown exponentially to 6613 course registrations in
2019. Wits Plus offers a wide range of degrees and its offerings have grown to include
bachelor’s degrees in Computer Science, Engineering, Graduate Entry Medical
Programme (GEMP) part-time courses, Postgraduate Certificate in Education (PGCE),
various short courses as well as occasional studies.
The inclusion of more degree offerings at a part-time level has increased the
interactions between Wits Plus and all the Faculties. In most instances, Wits Plus offers
identical courses that are on offer full-time but a part-time basis. In some cases,
however, Wits Plus may offer additional courses, e.g. Human Resources Management
to part-time students that are not available to full-time students to cater to the needs
of the working student. Figure 2 below gives a graphical illustration of the types of
offerings at Wits Plus also highlighting the Faculty interactions. Each course or
programme is owned by a Faculty, while Wits Plus offers a service to the Faculty in
delivering the course or programme. Students are currently able to register at Wits Plus
for a degree, as an occasional student or for a short course. The right-hand side of the
figure shows the interaction Wits Plus has with the five Faculties and for whom they
offer degree programmes, short courses, and occasional studies.
Figure 2: Wits Plus Offerings and Faculty Interactions

9 | P a g e
For a clearer understanding, it should be noted that each of the five Faculties reports
to a Dean and these Deans in turn report to the Deputy Vice-Chancellor (DVC)
Academic, of the University. The administration of each student’s record is dealt with
by the Faculty Offices, which are in turn managed by a Faculty Registrar, reporting
directly to the Dean. Wits Plus, on the other hand, is not a Faculty nor does it report to
a Dean but a Director who reports to the DVC (Academic). Figure 3 is an illustration of
the current reporting structure. Wits Plus also does not have a Faculty Registrar in
place but a Senior Officer who carries out similar functions to those of the Faculty
Registrar. Wits Plus finds itself on the outer periphery of the Faculty structures and
therefore many times is forgotten when Faculties implement new processes or change
their rules which directly affect the students studying through Wits Plus. Wits Plus do
not compile their own rules or practices but follow the rules as determined by the
Faculties. The problem here arises in that the needs of part-time students often vary
from the needs of full-time students, therefore, making one rule or process that fits all
not always feasible or practical.
Figure 3: Reporting Organogram

10 | P a g e
To complicate matters further, despite the growth in student numbers and offerings,
most processes and rules that regulate students’ registrations, readmission, and
graduation between Wits Plus and the Faculties have remained unwritten. In the past
year, the need to standardise these processes to improve the levels of service has
increased, especially where there are variances in processes between full-time and
part-time students. Rules specific to Wits Plus need to be formalised, with staff agreeing
on the roles, responsibilities, and accountability between the offices.
This raises the question as to why previously no thought has been given to develop an
improvement process or framework. There are various reasons for this, including:
Staff having limited time to analyse and agree on standardised processes;
High staff turnover that occurs annually within service departments and
Faculties;
Lack of a clear understanding by staff of administrative processes and why they
are required;
Lack of a clear understanding that there is a need to analyse and improve
processes.
Many administrative processes happen throughout the year within the Faculties and
service departments. For this research, however, the Wits Readmissions Committee
(WRC) process, a complex process involving both Wits Plus and the Faculties, will be
used. Confusion and frustration exist between the Faculties and Wits Plus as to when
what processes need to take place when a student is readmitted. There is a clear need
to analyse and streamline the WRC processes for there to be a better understanding
and to improve the process as a whole for all the stakeholders.

11 | P a g e
1.5. The Wits Readmission Committee Process (WRC)
As discussed, the Wits Readmission Committee process (WRC) will be used in this
research and to assist the reader the WRC process is explained in the following section.
The Wits Readmission Committee follows two stages known as WRC 1 and WRC 2 that
take place at the beginning of each year. The process normally starts during September
when the University advertises the dates for the publication of the various Faculties’
results and the dates for applications to the respective WRC meetings to all students.
The Faculty Board of Examiners meetings takes place at the end of each year, in each of
the five Faculties, discussing and ratifying the results of each student within the Faculty
before publication. The Board of Examiners meetings also considers the results of the
students registered at Wits Plus. Students failing to meet minimum requirements
(passing enough credits to progress into the next year of study) are excluded and they
are not allowed to re-register in the following year for their degree programme. This
includes students registered on a part-time basis. Students receive an outcome code
called Minimum Requirements Not Met (MRNM). To be considered for registration in
the new academic year, the students coded MRNM must appeal to WRC1. There is no
involvement from Wits Plus in the WRC process, except to code students MRNM for the
Board of Examiners meeting.
Students appealing their exclusion make use of an online application system when
applying to WRC1. Manual applications are also considered. Based on the student’s
application and evidence submitted, the WRC committee decides on the readmission of
the student into the academic year. If WRC1 decides that the student’s reasons are not
valid for readmission, the student is refused permission to reregister but they can
appeal to the WRC2. Normally this committee only considers new evidence raised by
the student for readmission.

12 | P a g e
WRC2 has the final decision on whether the student will be allowed, with certain
conditions, to reregister or if they will be excluded for at least 1 year from the
University.
WRC1 will readmit students as follows:
1. Readmitted without any conditions and they can reregister in the new academic
year,
2. Readmitted with conditions. Students who are readmitted with conditions must
see an ‘At Risk Coordinator’ or ‘Teaching and Learning Advisor’ within the
respective Faculties to discuss and agree on certain conditions. These advisors
guide students through the process of their course registration and programmes
they need to attend during the year in order not to place themselves at risk again
at the end of the subsequent academic year.
There are different WRC outcome codes used by Faculties to code student records and
these codes are noted in Table 2. Through the coding, Faculties can track the number
of students who have applied to the Wits Readmission committees, those readmitted
through the structures, and those excluded from the University. These numbers are
reported yearly to the Senate of the University.

13 | P a g e
Table 2: WRC Codes (adapted from the Wits Student Information System
(SIMS))
Many times, students who are readmitted on conditions must pass their courses mid-
year, and should they fail at mid-year their registrations are immediately canceled
without any further option for appeal. In most cases, these students are excluded for a
period of between six to eighteen months from the University. Students' records are
coded accordingly on the student system through all these stages.
To involve Wits Plus more in the WRC process, to streamline and improve Wits Plus
service levels to their students and the Faculties, this process motivated the
undertaking of this research.

14 | P a g e
1.6. Research Motivation
Netland and Powell (2017) states that Higher Education faces funding challenges and
with operations overloaded with unnecessary and unproductive activities there is a
need for universities to become more efficient and effective.
This research aims to find ways in which Lean orientated tools and practices can be
used at Wits to support the analysis and improvement of administrative processes. In
many instances, Wits administration processes fall short as no framework or guideline
can direct staff with what steps to follow once new administrative processes are
introduced or existing ones are changed. When a new process or a change to a process
is introduced, staff do not analyse these changes and see how they impact on a current
process. They are therefore not able to incorporate them sensibly into a current
process without creating unnecessary waste. Instead, duplicated processes are created
leaving staff frustrated and not always knowing what is required of them.
Corbett (2007) points out that an organisation’s goal should be to improve
performance by encouraging employees to eliminate unneeded activities and
operational waste.
1.7. Purpose of the Research
Balzer (2010) states that there is currently no framework that can guide universities
on how to change or improve their processes, with Corbett (2007) noting that when a
Lean approach is adopted, the biggest challenge in a non-industrial environment is to
know which tools or principles to use.
15 | P a g e
The purpose of this research is therefore for Wits Plus and Faculty staff to experiment
with five Lean orientated tools and practices. Through this experiment, they will
identify which of the tools or practices can support them when analysing and
improving their administrative processes when changes are introduced, without
creating unnecessary waste. Ballé et al. (2006) note that by using Lean principles the
thinker is positioned in the right direction. The Lean orientated tools and practices that
are found to be most supportive in analysing and improving processes will then be
included in a Wits Process Flow Framework, a basic structure that can be used for
analysing and improving administrative processes. The framework can also be used in
staff training and succession planning. It will guide staff to think differently about the
work they do, and their behavior towards their tasks, and to be more problem solving
orientated, moving away from the way Wits currently manages process changes.
Jørgensen et al. (2007) state that a framework can assist a company to access its
currents status of Lean development and identify which areas need improvement.
McManus et al. (2007) also note that with a framework there are opportunities to
improve methods and tools. For purposes of this research, the WRC process will be
used when experimenting with the Lean orientated tools and practices to see which
can be recommended for the framework.
1.8. Research Question and Problem Statement
The main research question for this report is:
Which Lean orientated tools and practices are best suited to support the analysis and
improvement of administrative processes at Wits?

16 | P a g e
1.9. Research Objectives
The main objectives of this research to answer the research question above are:
1. To experiment with five Lean orientated tools and practices to analyse the Wits
Readmissions (WRC) process between Wits Plus and Faculty A to identify
improvement opportunities;
2. To evaluate the Lean orientated tools and practices to see which ones support the
analysis and improvement of processes;
3. To use the findings to develop and propose a Wits Process Flow Framework that
can be used to analyse and improve administrative processes at Wits. This Lean
orientated framework will be recommended for future use to all Wits Faculties
and service departments.
1.10. Research Limitations
The most significant research limitation of this study is the personal bias of the author
that will be discussed in further detail in Chapter 3 of this report. The author has
extensive experience in the administrative processes within Wits and has knowledge
of which processes currently work, and where there are gaps or a lack of processes.
Assumptions are made by the author regarding the variety of Lean orientated tools and
practices that are available and that could work in a higher education environment and
are based on the author’s personal experience and interactions with Wits Plus and
Faculty staff. The author is also aware of the need that has existed for a very long time
within these departments to have their processes analysed to improve their working
environments. The author strongly feels Wits can benefit from a framework that can
guide them to analyse and improve processes.

17 | P a g e
A further limitation of the study was potential bias in that the author identified the
participants to participate in this research due to their extensive years of
administrative experience and the frustrations they have experienced with the lack of
proper processes being in place at Wits. Anthony (2014) states that if the research
initiative is not led by people who have a passion and a good understanding of its full
potential then it will fail. Strategic group membership can assist with explaining a
company’s performance, practices needed to achieve performance, and understanding
its decisions making (Ballé et al, 2006).
1.11. Report Layout
The remainder of the report is structured as follows:
Chapter 2: Literature Review
The Literature Review aims to give an overview of Lean evolution and the principles
and practices of Lean. The chapter will introduce and describe the various Lean
orientated tools and practices that will be used as well as the theory and framework
relevant to the study.
Chapter 3: Research Methodology
This chapter aims to describe the methodology and methods used in the research study
by looking at the various research design methods focusing on the pre-interviews, the
workshop, and post interviews. The chapter will further discuss and justify the
research approach, bias, and give a summary of the Lean orientated tools and practices
used in the study and the data collection.

18 | P a g e
Chapter 4: Analysis and Findings
This chapter will present an analysis of the data from the pre-interviews, the workshop,
and post interviews and show a presentation of the results of the exercises using the
various Lean orientated tools and practices.
Chapter 5: Discussion of the Findings
This chapter will discuss the findings of the various Lean orientated tools and practices
the use of these Lean orientated tools and practices and the implications thereof. The
Wits Process Flow Framework is also presented and discussed in this chapter.
Chapter 6: Conclusion
The final chapter concludes the research by showing how the objectives of the research
were met. The Chapter concludes with the shortcomings of the results, further and
future recommendations for any further future work.

19 | P a g e
Chapter 2: Literature Review
2.1 Introduction
The literature review will critically focus on the current literature available about the
implementation of Lean orientated tools and practices outside the manufacturing
industry into various service sectors. It will focus on the implementation of Lean
orientated tools and practices in the higher education environment noting the
advantages and the disadvantages thereof.
2.2 Lean Principles
Lean thinking started in the 1940s in Japan when the Toyota automotive manufacturing
industry made use of a set of Lean practices, whereby they created value through a
continuous flow of efficiency (Melton 2005). Currently Lean has spread worldwide and
industry-wide despite its origins being in the Japanese car and automotive industry,
and companies are adopting Lean principles outside the manufacturing industry.
Lean is a philosophy that focusses on increasing efficiencies within processes by
removing waste and creating extra time by removing unwanted steps within a process.
Melton (2005) notes that Lean is a revolution and it is changing the way people go
about their work, creating continuous flow with new ideas and the development of
processes. Bicheno and Holweg (2016) note that Lean would not be able to survive if
there was no continuous improvement, with a continuous need to reduce waste,
enhance value and involve the people that work within an organistation.

20 | P a g e
Lean aims to minimise waste along a value stream and to create value for stakeholders.
Bicheno and Holweg (2016) describe the five fundamental Lean principles noted by
Womack and Jones illustrated in the diagram below:
1. Specify the value from the
customer’s point of view - what does
your customer want and what is
necessary? Give the customer what
they want, when they need it. Identify
value then the waste is clear and can
be eliminated.
2. Identify the Value Stream - center
on people or activities who add value
or can contribute to the value
stream.
3. Flow; create a flow of value for your
customer.
4. Pull, short term response to the
needs of your customers and their
demands. Do not overproduce.
5. Perfection, the more your processes
improve the more you identify waste
and strive for perfection in
eliminating it. Deliver what the
customer wants when they want it.
Figure 4: Five Lean Principles (adapted from Bicheno and Holweg 2016)
21 | P a g e
There are various Lean orientated tools and practices, with all of them having defined
stages; results can be fast, eliminating waste while making changes to improve
processes. Lean continuously strives to resolve problems and engage stakeholders.
When introducing Lean, quality is improved and it results in the delivery of value. The
only decision to be made is that institutions and stakeholders are valued enough to
introduce Lean and to use the tools to change operations.
2.3 Evolution of Lean
It has often been thought that Lean principles can only apply to the manufacturing
industry and therefore it was difficult to understand how to introduce Lean principles
into other industries. Corbett (2007) notes that Lean was developed as a set of tools or
practices to be used by workers for them to eliminate inefficiencies and waste from
production systems. This was done to improve quality and reliability in manufacturing
but lately, several companies have shown that any company can apply Lean principles
as it improves productivity without increasing costs. The change of environment from
manufacturing into others has not changed the goal of Lean and the principals remain
the same to improve efficiencies, performance, and eliminate waste from processes.
The challenge, however, comes when adapting manufacturing practices to a non-
manufacturing/industrial environment. Bicheno and Holweg (2016) note that once
you take Lean out of its original context you will find some tools no longer apply as
originally developed, and the change may require Lean to be adapted into the new
context.

22 | P a g e
2.4 Lean in the Service and Higher Education Sectors
Bhatia and Drew (2006) state that Governments around the world want to deliver
better education and better health care, getting better value for money by looking at
Lean techniques and Lean principles that can be used at the working level.
Leite and Vieira (2015) note that Lean services do not have a precise model of tools or
practices or standards but rather apply a mix of tools and practices to the situation that
needs to be improved. Radnor et al (2006) state that the public sector engages less with
the full set of Lean tools and more with the principles of Lean. Most organisations use
limited tools e.g. Value Stream Mapping, suggesting that many tools used in
manufacturing are not directly applicable in a service environment. In some instances,
tools must be adapted for a greater need for flexibility to address the needs of the
customer. Asnan et al. (2015) outlines that the five principles of Lean as discussed by
Womack and Jones could be applied in the service sector. Eliminating waste is also an
important aspect which the service sector should focus on. When applying Lean
practices in the service sector there is a focus on the employee, enforcing their
importance without losing sight of what the customer needs, solving their problems,
and by giving them what they want, when they want it.
Balzer et al. (2016) note that Lean principles and practices have been incorporated in
both the private and public sectors with LHE enabling post-secondary institutions to
look for similar solutions to respond to the demands of higher education. The higher
education environment is changing rapidly, especially with the introduction of new and
more sophisticated technologies.

23 | P a g e
This means that institutional service levels cannot remain the same, quality is critical,
and there needs to be an understanding of what quality issues affect students,
academics, employees as well as other clients and how to support them. There needs
to be an awareness of what needs to change, what needs to be created, and how
processes and practices can be reused. It is, to say the least, a radical change. Ambekar
(2016) states that the education sector can benefit from Lean, understanding waste,
and improving quality service delivery. He notes that the value of Lean needs to be
identified and the outcome of Lean in higher education is to reduce waste, have efficient
processes, and engage the workforce. Comm and Mathaisel (2005) did a quantitative
study on Lean in 18 public and private universities in the USA and found that a
university or a college could be a good candidate for the application of Lean practices
and principles. They note that the best practices of Lean established by Nightingale
(1999), are being applied by some higher education institutions which are to optimise
flow and to focus on the customer while improving continuously and promoting Lean
thinking at all levels. They further state that if Lean is to be implemented successfully
seven best practice components must be present, as these will assist with waste
elimination and making processes more efficient and provide better value for the
customer. These are:
(1) Environment for change - change initiatives must be proactive,
(2) Leadership - the leadership should drive the change,
(3) Culture – the culture must be open and honest, and staff must feel that they can
participate,
(4) Employee empowerment – employees must have the permission to make the
required changes and recognition must be given to them for taking initiative,
(5) Training – there needs to be proper training for everyone to understand the steps
that need to be followed,

24 | P a g e
(6) Communication – managers need to share information and encourage all staff to do
the same,
(7) Measurement - to determine progress.
Antony (2014) noted that Cardiff University in Wales started to introduce Lean
principles to improve their processes while the King Abdullah University of Science and
Technology took on board the structured approach of the Lean Six Sigma (LSS) to
improve their service levels to students (Svensson et al. 2013). King Abdullah
University launched an LSS programme in 2011 to improve the quality of their business
processes as well as to provide their staff with a platform where they could initiate
improvement processes. They used LSS to provide tools to the staff to change
administrative processes. Currently, 25% of the staff component has been trained and
improvement projects are being executed across the university. Hines and Lethbridge
(2008) note that universities can reduce waste to improve service levels and they
recommend that the focus should not be on one process when implementing Lean
principles as other parts of the organisation will be affected. Lean transformation needs
to take place at the highest level.
Kang and Manyonge (2014), note that Lean programmes can have a significant impact
on higher education. However, for institutions to do this change is required, revising
processes and practices. Introducing Lean orientated practices will enable staff to
rethink work processes and commit to continuous improvement with constant
monitoring (Oliveira-Brochado and Marques, 2007).

25 | P a g e
Emiliani et al. (2005) writes that most institutions in the USA struggle with service
levels and financial viability. He points out that university administrators and staff
should not think that Lean could not apply in a higher education environment and notes
that Kaizen can successfully improve service levels. Kaizen refers to continuous
improvement, a typical Lean methodology that is a team-based process of
improvement. Emiliani et al. (2005) mentions teaching students that Lean principles
e.g. value stream mapping, understanding waste, and Kaizen, will be highly valued by
managers who employ them, as their knowledge would lead to better outcomes for
stakeholders.
The question arises as to why Lean tools should be used to achieve better service. Why
is Lean not used more in an educational environment? George (2003) states that if
higher education institutions implement Lean they would have similar improvement
experiences as those experienced by service industries. Lean starts with adding value
to processes, better enabling a working environment that has a direct impact on service
delivery. Bicheno and Holweg (2016) state that Lean sees mistakes as learning
opportunities. When introducing Lean into any environment, it increases the value and
reduces waste and there will be advantages and disadvantages in doing so.
Introducing Lean is however a huge undertaking. Balzer et al. (2016) note that the
success of implementing Lean will depend on the preparedness of the University.
Anthony et al. (2012) state that to tackle support functions with a prescribed method
of Lean often delays growth and makes very little impact on the overall programme. To
avoid this from happening when Lean is introduced into any process it involves a
serious mind shift focusing on not only one process alone but also all processes within
an organisation. Zhou (2016) notes that the application of Lean tools and techniques
can methodically assist with defining, evaluating, and attack inadequacies.
26 | P a g e
As noted by Balzer et al. (2016), implementing Lean is a big undertaking and therefore
this research is not aimed at introducing Lean at Wits but to experiment practically
with five Lean orientated tools and practices. The reason for not implementing Lean is
because there is no mandate from University management to do so. If this is to be done
in future, the buy-in of both the University management and staff will be required.
However, this research was done to start a process whereby staff can find a way to
analyse and improve their administrative processes, and although it may not be the
purest way of doing Lean it is a start to respond to a need and to put a system in place.
2.5 Lean Orientated Tools and Practices
There are various Lean orientated tools and practices to improving processes and Zhou
(2016) notes that Value Stream Mapping, Single-Minute Exchange of Die (SMED), 5S,
and Kaizen can deal with a variety of issues and circumstances. Atkinson (2004) states
that Lean is a concept, a process, a set of tools, techniques, and methodologies that is
successful in bringing about effective resource allocation. The only major problem
Corbett (2007) identifies is when implementing a Lean approach in a non-industrial
environment you need to know which tools to use and how to apply them effectively.
Different cultures and infrastructure mean that one cannot just apply any Lean tool or
technique used in manufacturing the method must be custom-made to address the
realities in that specific environment.
Ballé et al. (2006) note that it will not work if you apply Lean tools and principles to
every process you have, but when Lean tools and principles are used to change
employees’ thought processes, the possibilities are limitless. It is therefore envisaged
that this framework will support staff to think differently about the work they do, their
behavior, and to be more problem solving orientated. A detailed breakdown of each of
the Lean orientated tools and practices that will be experimented with in this research
follows below.

27 | P a g e
2.5.1 Value Stream Mapping (VSM)
Rother and Shook (2003) call the Toyota method Value Stream Mapping ‘Material and
Information Flow Mapping’ stating that it is a way to learn and see, a paper and pencil
tool that assists the understanding of the material and information flows as a product
moves through a value stream. With this tool a visual drawing is made representing
every process, asking vital questions when drawing the future state. They state that it
is the best way to teach people to see value as well as the origin of the waste.
Ballé et al (2006) note that Value Stream Mapping is a useful tool to use when on the
path to “going Lean”. It assists with imaging the information flow, finding true value
adding activities, and determining the potential for improvement. Dal Forno et al.
(2014) also used Value Stream Mapping as a technique when diagnosing the
implementation and maintenance of a Lean approach concluding that Value Stream
Mapping identifies improvement opportunities, as it eliminates waste with the support
of operational staff. They note that Value Stream Mapping is a useful tool to understand
current processes and to identify opportunities to make enhancements. VSM is useful
to guide improvements and is used to remove waste from a process. To do this, there
needs to be an understanding to improve process flows as well as any interactions with
stakeholders and VSM can continuously identify opportunities to improve processes
and reduce waste.
Wilson (2009) notes that Value Stream Mapping (VSM) applies to various business
processes and is not bound to manufacturing processes only. VSM can be used for all
processes within an office environment. Bonaccorsi et al. (2011) note that by using
Value Stream Maps a process can be looked at holistically to find ways of improvement
of a process, identifying and tackling serious issues. It is a useful tool to identify all
processes, value-and non-value adding.

28 | P a g e
Value Stream Mapping maps are information flows, taking into account policies and
regulations when mapping a process. Comm and Mathaisel (2003) also made use of
Value Stream Mapping to analyse parts that can be improved through Lean
methodology. They note that using a Value Stream Map can reduce cost and time as it
identifies waste. A visual map is made of the current situation, while another map is
made of the ideal situation. The tool is useful in mapping the goal that needs to be
achieved as well as the relationship between the departments allowing the opportunity
to put an implementation plan into place. Melton (2005) states that when you want to
add value you need to understand the value, what your customer values, map, and
define these activities identifying non-value adding steps and wastes removing them
from the processes. Through process mapping, the touchpoints between departments
also become visible.
Rother and Shook (2003) note that in Value Stream Maps are a qualitative tool
describing in detail how a facility should function to create flow. In a value stream, all
value and non-value add works towards a big picture of improving the whole process.
They note that to develop a future state, the current state needs to be analysed, more
than one process is visualised and more than just waste is seen. Bonaccorsi et al. (2011)
question whether VSM can be applied unaltered within the service industry and
suggests that a Service Value Stream Management Map (SVSM) modified from the VSM
must rather be used to address service needs. Although altered, they do note that there
is merit in using value stream maps as it commits to Lean and Lean education. There is
a choice of which value stream needs to be improved, giving the opportunity of
mapping the current and future states while identifying waste and the impact it has on
improvement targets.

29 | P a g e
2.5.2 DMAIC (Define, Measure, Analyse, Improve and Control)
DMAIC a problem solving method aiming to improve processes by following a five-step
methodology used in the Six Sigma process (Ganguly, 2012) meaning:
Define - select your problem and set a goal.
Measure - assess the current situation and investigate what is the problem.
Analyse - identify and explain why things are the way they are.
Improve – draw up an implementation plan to see how the best outcome can be
achieved.
Control - adjust what is wrong to be able to control it in the new situation.
DMAIC is data-driven and deals with defects, quality, and waste (Sehgal and Kaushish,
2015). Its five-phase improvement process connects statistical and other tools found
to be effective in improving practices (Snee, 2010). DMAIC improves efficiencies,
enhances the quality, and reduces costs. It has evolved beyond the manufacturing
industry into the service sector and has systematically provided a framework that is
result orientated. Bendall and Marra (2005) found that DMAIC can be used effectively
to reduce quality problems and eliminate complaints from customers as it
systematically reduces variation in processes. DMAIC should preferably be used when
concentrating on a specific area of interest and a top-down method should be used as
it is more beneficial when aligning the business strategy and linking it with the
customers’ needs (Lynch et al., 2003). Schroeder et al. (2009) further comment that
DMAIC is a ‘meta routine’ used when changing an existing routine or design or when
moving into a completely new routine.
Sokovic et al. (2010) find that DMAIC gives the best results when the process is flexible,
further noting that it is a systematic process, based on facts and providing a rigorous
framework that is results orientated. Snee (2010) stresses that DMAIC is easy to
understand and has been used successfully around the world, stating that it is elegant
in its simplicity.

30 | P a g e
2.5.3 PDCA (Plan, Do, Check, Act)
Johnson (2002) notes that PDCA is a well-known model for continuous improvement
as it teaches organisations how to:
Plan – recognize the opportunity and plan the change,
Do- test the change,
Check- review and analyse the findings to identify learnings, and
Act- take action based on what was learned under the check step.
The PDCA is the most widely used improvement cycle and it is considered to be the
foundation of the Toyota Production System as it is part of their daily actions (Bicheno
and Holweg, 2016). Sokovic et al states that PDCA is a well-known cycle for continuous
improvement asking what is being accomplished, how to change improvement, and
what improvement changes can be made. The PDCA method helps to control a process
whilst looking for continuous ways of improving a process. Moen and Norman (2006)
note that the PDCA provides a framework for improvement methods that can be
applied to any type of organisation as it allows for a simple way to empower staff and
to facilitate teamwork. The PDCA is continuously looking for better solutions to
improve processes and assist in achieving the goal that has been set.
31 | P a g e
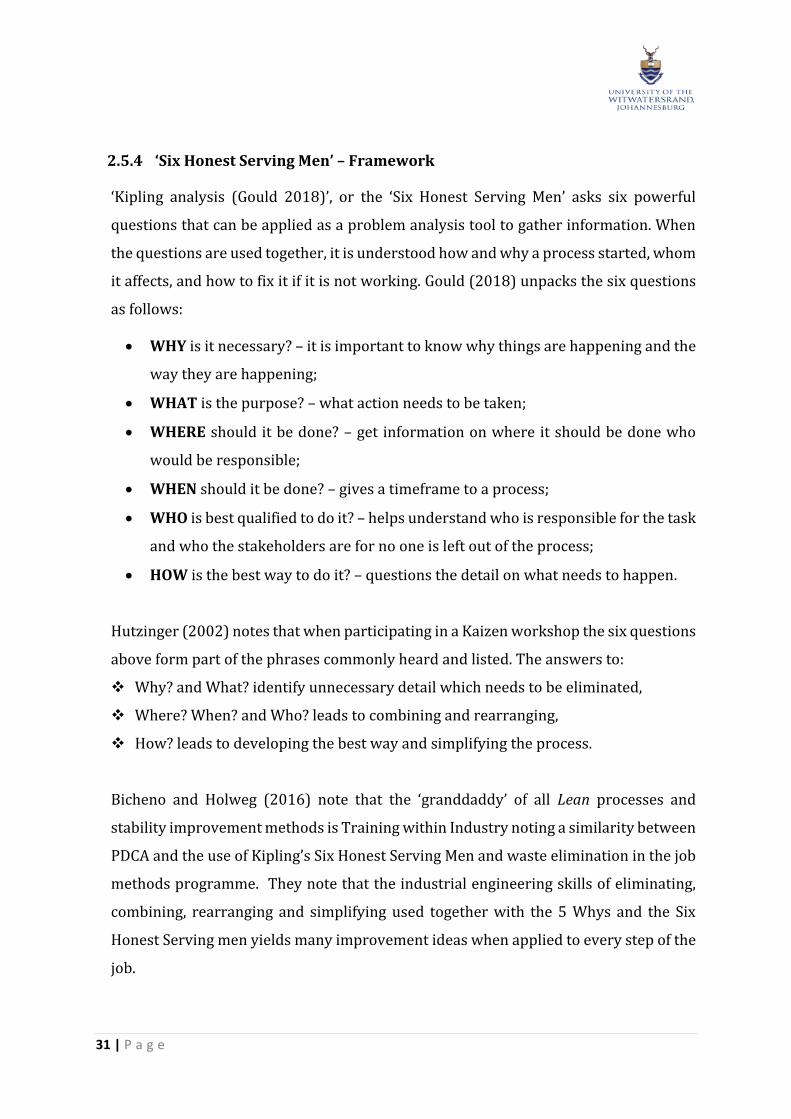
2.5.4 ‘Six Honest Serving Men’ – Framework
‘Kipling analysis (Gould 2018)’, or the ‘Six Honest Serving Men’ asks six powerful
questions that can be applied as a problem analysis tool to gather information. When
the questions are used together, it is understood how and why a process started, whom
it affects, and how to fix it if it is not working. Gould (2018) unpacks the six questions
as follows:
WHY is it necessary? – it is important to know why things are happening and the
way they are happening;
WHAT is the purpose? – what action needs to be taken;
WHERE should it be done? – get information on where it should be done who
would be responsible;
WHEN should it be done? – gives a timeframe to a process;
WHO is best qualified to do it? – helps understand who is responsible for the task
and who the stakeholders are for no one is left out of the process;
HOW is the best way to do it? – questions the detail on what needs to happen.
Hutzinger (2002) notes that when participating in a Kaizen workshop the six questions
above form part of the phrases commonly heard and listed. The answers to:
Why? and What? identify unnecessary detail which needs to be eliminated,
Where? When? and Who? leads to combining and rearranging,
How? leads to developing the best way and simplifying the process.
Bicheno and Holweg (2016) note that the ‘granddaddy’ of all Lean processes and
stability improvement methods is Training within Industry noting a similarity between
PDCA and the use of Kipling’s Six Honest Serving Men and waste elimination in the job
methods programme. They note that the industrial engineering skills of eliminating,
combining, rearranging and simplifying used together with the 5 Whys and the Six
Honest Serving men yields many improvement ideas when applied to every step of the
job.

32 | P a g e
2.5.5 Fishbone Diagram
The Fishbone diagram is also known as the ‘Ishikawa diagram’ or the ‘ cause and effect
diagram’ proposed in 1943 by Kaoru Ishikawa (Ilie and Ciocoiu, 2010), a professor of
engineering. He was a pioneer in quality management processes and the Fishbone
diagram was initially proposed as a thinking tool to improve productivity. Later it was
seen as one of the best tools to control quality and improvement. The diagram
represents the major problems in a process that makes a process unsustainable. The
Fishbone shows the relationship between seemingly disconnected elements with each
rib representing a cause that in turn contributes to the outcome. Bilsel and Lin (2012)
note that the Fishbone diagram is a great, intuitive tool that can determine the causes
of problems. The diagram analyses multiple problems and therefore you need to draw
up multiple diagrams. Using the Fishbone diagram creates an opportunity to
understand risk and to establish how to address and mitigate this.
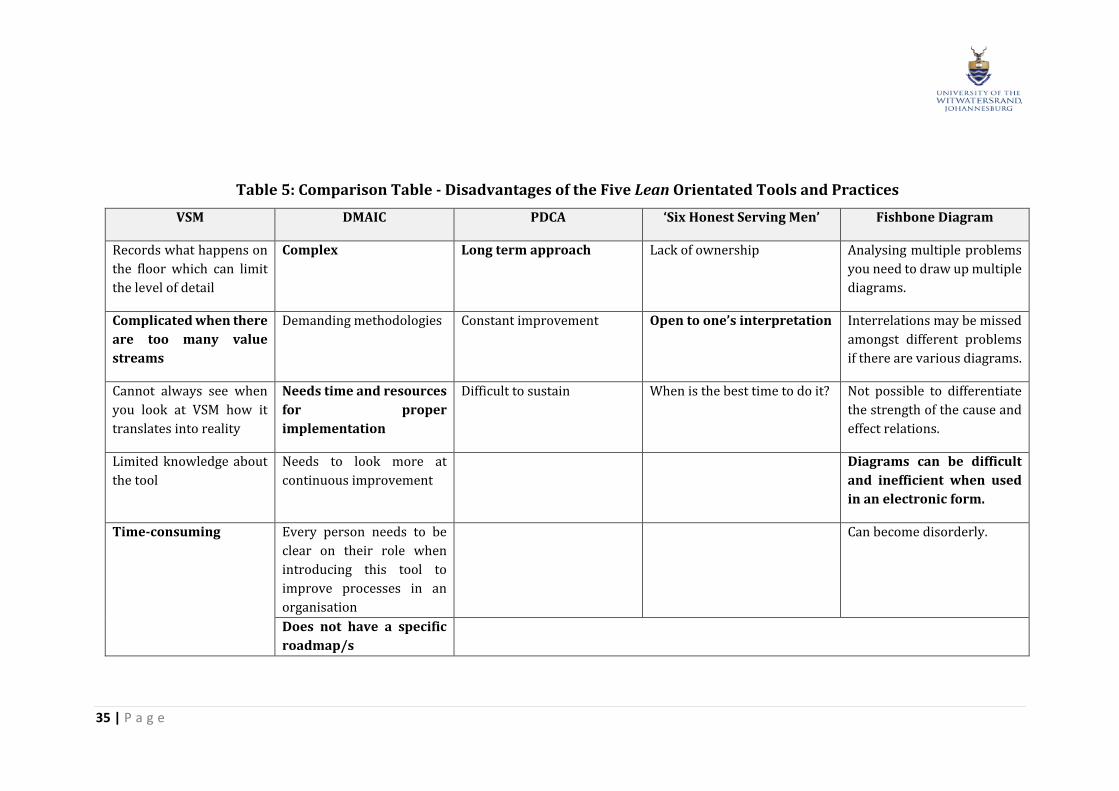
2.5.6 Comparison of the Lean Orientated Tools and Practices and the Reasons for
Selecting these Tools and Practices
Lean orientated tools and practices are a way of accomplishing change and when
describing these in this chapter there are various opportunities that are revealed.
Table 3 illustrates each analysing step that is followed when using the particular Lean
orientated tool or practice. Table 4 and Table 5 shows the comparison between the
tools and practices and how they complement each other by noting the advantages and
disadvantages of each. These tables further support the reason for selecting these tools
in that they facilitate the following:
1. process orientation;
2. definition of process analysis and evaluation;
3. reduction of waste; and
4. measurement of performance.

33 | P a g e
Table 3: Different Elements of each Lean Orientated Tool and Practice
VSM DMAIC PDCA Six Honest Serving
Men
Fishbone
Provides a visual
representation of
all activities
Provides structure
to a process
Provides an
improvement
methods framework
Provides a
framework that
clarifies roles
Provides a method
whereby all
possible problem
causes are
identified.
Define scope Define the process ‘Plan’ considers the
processes that need
to be improved
What is the purpose
of the process?
Analyse each step
that contributes to
a process
Analyses current
state of the process
Measures how a
process is being
implemented and
how well it is being
executed
Considers
improvement and
how much of a
process is required
Describe why the
process is
necessary?
Diagnose system
process
Defines the desired
future state – the
ideal process
Analyses the
process
Changes the
required elements of
a process
Shows when it
should be done?
Determines the
cause of the
problem
Draw up an
implementation
plan
Identify
improvement
options and
implement an
improvement plan
Make required
changes to
processes and other
related procedure
documents
Who should be doing
this who is the
owner of the process
and responsible for
changing it?
Identify problem
areas to eliminate
and streamline the
process
Draw up an
improvement plan
Control the new
process and ensure
ownership
How is the best way
to do it?
Eliminate problems
and streamline the
process

34 | P a g e
Table 4: Comparison Table – Advantages of the Five Lean Orientated Tools and Practices
VSM DMAIC PDCA ‘Six Honest Serving Men’ Fishbone Diagram
Visual representation Provides structure Applicable to any type of
organisation
Recognises the importance of
questioning
Identifies all possible
problem causes.
Identifies value-adding
steps
Reduces waste Provides a framework Clarifies roles Determines causes in a
structured way.
Identifies non-value
adding steps
Addresses a specific
problem
Guides theory and
knowledge
Focuses on gaps in skills
training
Uses knowledge of all
participants.
Identifies gaps in the
process
Quality management
approach
Allows for the adaption if
there are changes
Considers ethical frameworks Focuses on the causes of the
problem; do not look at the
complaints and irrelevant
discussions.
Know your customer
and what they value
Focuses on the customer
and the process
A simple way to empower
staff
Builds self-awareness Easy to understand
graphical format.
Continuous improvement
and striving for perfection
Facilities teamwork Analyses a process Levels the knowledge by
allowing everyone to share
their expertise
Identifies areas where
there is a lack of data.
35 | P a g e
Table 5: Comparison Table - Disadvantages of the Five Lean Orientated Tools and Practices
VSM DMAIC PDCA ‘Six Honest Serving Men’ Fishbone Diagram
Records what happens on
the floor which can limit
the level of detail
Complex Long term approach Lack of ownership Analysing multiple problems
you need to draw up multiple
diagrams.
Complicated when there
are too many value
streams
Demanding methodologies Constant improvement Open to one’s interpretation Interrelations may be missed
amongst different problems
if there are various diagrams.
Cannot always see when
you look at VSM how it
translates into reality
Needs time and resources
for proper
implementation
Difficult to sustain When is the best time to do it? Not possible to differentiate
the strength of the cause and
effect relations.
Limited knowledge about
the tool
Needs to look more at
continuous improvement
Diagrams can be difficult
and inefficient when used
in an electronic form.
Time-consuming Every person needs to be
clear on their role when
introducing this tool to
improve processes in an
organisation
Can become disorderly.
Does not have a specific
roadmap/s

36 | P a g e
2.6 Conclusion of the Literature Review
The literature review started by giving the reader a brief overview of the history of
Lean, Lean principles and practices, and the evolution thereof. The review further
explored the potential gains when applying Lean orientated tools and practices in the
higher education sector and the extent to which it has been introduced into this sector.
The chapter continued by exploring the five Lean orientated tools and practices that
will be used in this research, giving a brief background describing each tool. The
various elements that are used by each process to analyse and improve a process are
shown including the advantages and disadvantages of using each process. The
information given in this chapter will support the development of the methods section
in Chapter 3 and will form the basis from which Lean orientated tools and practices will
be recommended for the Wits Process Flow Framework.

37 | P a g e
Chapter 3: Research Methodology
3.1 Introduction
This chapter will focus on and discuss in depth the methods that were used by the
researcher to obtain the results of this research. From these methods, the most suitable
Lean orientated tools and practices will be identified to inform the development of a
suitable process flow framework.
3.2 Methodology
This part of the report will consider the various approaches taken when conducting
research. This section will consider the research approach whilst looking at the
sampling and data collection methods. In conclusion, section 3.6 Method will look at
the methods the researcher used to execute the study.
3.2.1 Research Design: Qualitative Research Method
Kothari (2004) states that two approaches can be followed when conducting research
namely the Quantitative research approach, or a Qualitative research approach.
Abawi (2008) notes that qualitative research aims to develop an understanding of a
human or social problem from many perspectives and is undertaken to find the answer
to the question starting with ‘Why?’, ‘How?’ or ‘In what way?’ Abawi (2008) notes that
analysing this qualitative data can become time-consuming and can be influenced by
the bias of the researcher. It can, on the other hand, provide deep and rich data that can
be very useful. Qualitative research is context and case dependent and therefore results
need to be kept in context and the researcher has to report personal and professional
information that can have an impact on the data collection and interpretation.

38 | P a g e
Patton (2015) notes that researchers who make use of the qualitative research method
must provide ample quotations from their participants who partook in the research.
Rahman (2017) states that qualitative research is not statistical, and it combines
numerous realities noting several advantages and disadvantages in using this method.
Qualitative research produces detailed descriptions of the participant's opinions,
feelings, and experiences that can interpret the meaning of their actions. It understands
the human experience in specific situations and this type of research studies individual
situations or actions, and it understands different people’s viewpoints. The research
sees the experience participants have and how their understanding is informed by
culture the data collection is subjective and comprehensive and it has a flexible
structure (Rahman, 2017).
On the other hand, Rahman (2017) notes that the method focuses on participants'
experiences and meanings more than on the contextual sensitivities, giving it low
credibility in certain settings. This method can generalise data received from a small
sample size to a whole population and analysing the data can be difficult, taking a
considerable amount of time.
For this research, the author used a qualitative research method to collect the data. This
method was used as the author wanted participants who directly deal with the WRC
process and who are experiencing the problems to express their views and experiences
in the research. The research is not based on the collection of numerical data that needs
to be analysed by using mathematical methods. The data was collected by using pre-
interviews, followed by a workshop after which post-interviews took place.
39 | P a g e
3.2.2 Reliability and Validity
Validation is an essential part of the research and it involves the documentation of the
research in such a way that another researcher can come to the same conclusions using
a similar case study. Worley and Doolen (2006) note that using multiple sources to
create a chain of evidence and asking sources to review the results may increase
validity. Dörnyei (2007) notes that reliability and validity guarantee the results of the
performance. Researchers should be able to choose the method that answers their
question the best, not losing sight of the fact that the more accurate a researcher is
during the conducting of the research the more accurate the findings would be
(Alshenqeeti, 2014).
3.2.2.1 Bias
The author noted in Chapter 1 of this report that one of the limitations of this research
is personal bias. Noble and Smith (2015) note that researchers using qualitative
methods are criticised quite often for lack of rigor and transparency in their analytical
procedures and findings and that the research is simply a collection of personal
opinions subjected to the researcher’s bias. They further note that it becomes quite
difficult when using qualitative methods as there are no standards by which such
research is judged. Cohen et al. (2007) note that bias needs to be minimized with Norris
(1997) stating that using validity practices do not ensure accuracy, trustworthiness or
objectiveness and that it is the nature of research that the knowledge can be revised.
Noble and Smith (2015) suggest that to ensure the trustworthiness a qualitative
researcher should incorporate strategies to ensure the trustworthiness of their
findings. In the case of this research, the author incorporated the following strategies
to ensure the trustworthiness of the findings. The author accounted for personal bias
and acknowledged that there was bias in the sampling method, there is a critical
reflection of the methods used ensuring the depth and relevance of the data collection

40 | P a g e
and a meticulous record was kept of the pre-interviews, workshops, and post-
interviews to ensure that the data interpretations were consistent and transparent.
The author compared and looked for differences across the interviews and the
workshop to ensure that there were different perspectives and not only that of the
author. The author furthermore included rich verbatim descriptions of participants'
accounts to support the findings included in Chapter 4. The author demonstrates clarity
regarding the thought process during data analysis and subsequent interpretations
through making use of the Interview question tables to note the aim of each question.
Finally, to address bias, the author also made use of triangulation as discussed in the
following section.
3.2.2.2 Triangulation
Patton (1999) notes that Triangulation refers to a researcher using multiple data
sources or methods in conducting qualitative research to develop an all-inclusive
understanding of a topic. Carter et al. (2104) note that there are four types of
triangulation namely (1) Method triangulation, (2) Investigator triangulation, (3)
Theory triangulation, and (4) Data source triangulation.
For purposes of this research, the author made use of the Method triangulation type.
This was chosen as it involves the use of multiple data collection methods about the
same topic. In the case of this research, pre-interviews took place, after which a
workshop was held followed by post-interviews to ensure the credibility of the
research findings. Post-interviews were held with Wits Plus and Faculty A which
assisted with the confirmation that accurate and credible conclusions were drawn from
the workshop findings.

41 | P a g e
3.3 Sampling
There are two ways to collect data, one called convenience and the other purposive
sampling. Convenience sampling (haphazard sampling or accidental sampling) is
where subjects are close to a researcher while with purposive sampling (deliberate
sampling) the researcher has a project in mind.
For this research, the author makes use of the purposive sampling method. The data
collected through using this method contributes to the understanding of a theoretical
framework. The researcher normally has a project in mind when using this method, in
this case, it is the analysing of the WRC process. Data collection relies on the sound
judgment of the researcher and therefore it is called ‘judgmental, selective or subjective
sampling’. The researcher makes a deliberate choice when selecting the participants,
departments, events, or organisations that are studied. Participants are chosen based
on having specific characteristics or specific qualities, with no fundamental theories
and with no specific number of participants. It will be people who are willing to provide
information due to their knowledge and experience; they are chosen because they are
knowledgeable, experienced, and are willing and available to participate (Laerd, 2012).
Purposive sampling uses various sampling methods (Etikan et al., 2016) and in the case
of this research, the homogeneous sampling method was used. This method samples
people with the same traits and in this research case staffs’ occupations, exposure, and
experience in a Wits administrative role. This sampling method was further chosen, as
this group of staffs’ would be best able to answer the research question. There are
advantages and disadvantages to using Purposive Sampling and Laerd (2012) notes
that some of the advantages are that it can reach the target sample quickly and that it
justifies generalisations made from the sample that is being studied and provides a
wide range of non-probability sampling techniques. In the case of this research,
participants were chosen due to their Faculty and administrative background and
specifically due to their experience with the WRC process.

42 | P a g e
Participants were also willing to participate and could contribute to the process, share
their knowledge and input and experience with one another.
The disadvantage of using this technique is that it is based on the researchers’ bias and
when using purposive sampling it can be difficult to defend the representativeness of
one’s sample.
3.4 Data Collection Methods
For this research, the two data collection methods used were interviews (pre and post)
and a workshop. It should be noted that the research was conducted with a small group
of participants. This was since within the Faculties and Wits Plus only the managerial
staff are directly involved in the WRC process. Pre-interviews were conducted with the
managers of Wits Plus and Faculty A as they deal directly with the WRC process and
they were specifically chosen as they were experiencing the most challenges when it
came to the WRC process, in dealing the longest with excluded students moving
between Wits Plus and Faculty A. The workshop included more staff and the managers
from three other Faculties who were also directly involved in the WRC process.
The Teaching and Learning Advisors from Faculty A were also included as they assist
with the counseling of excluded students. These people were included in the workshop
to contribute to richer discussions on the WRC process and contribute to the choice of
Lean orientated tools or practices that could be chosen to form part of the Wits Process
Flow Framework. Between all the staff, they have more than 20 years of administrative
knowledge and experience within the higher education sector. Other staff could not be
included in this research as they do not deal with the WRC process and would not have
been able to add value to the research. Table 5 notes the staff who participated in the
research.

43 | P a g e
Table 6: University Staff Participation Table
In the section below the researcher will discuss and expand in more detail the reasons
for choosing these data collection methods.
3.4.1 Interviews
Interviews are a flexible method of conducting research. While doing the interviews
staff knowledge, experiences, and different personalities are considered when
validating the data. McDaniel et al. (1994) reviewed the validity factors from interviews
and found that if an interview is structured in such a way to examine job-related
competencies logically and in an organised way, there is a better prediction of future
performance.
Alshenqeeti (2014) notes that when using interactive interviews, the interviewer can
press for clarity and a topic can be probed. There is also a high return rate with fewer
incomplete answers. Interviews can involve reality with a controlled answering order
and they can be relatively flexible. On the other hand, Alshenqeeti (2014) notes that
interviews can be time-consuming and that it works only for small-scale studies.
Centre/ Faculty Employment level Number of
Participants
Wits Plus Wits Plus staff member 1
Faculty A Faculty staff members 3
Faculty B Faculty staff member 1
Faculty C Faculty staff member 1
Faculty D Faculty staff member 1
44 | P a g e
A further disadvantage is that it is never 100% anonymous and is open to potential
subconscious bias with potential inconsistencies. Cohen et al. (2007) propose that
when using interviews as a research method the attitude of the interviewer, tendency
to seek answers to support own merits, and preconceived notions should be
minimised to reduce bias.
Olivia (2018) notes that there are various types of interviews can be made use of, (1)
Structured Interviews, (2) Unstructured Interviews, and (3) Semi-Structured
Interviews. For purposes of this research, the author made use of the semi-structured
interview method in conducting the pre and post interviews. The reason for deciding
on semi-structured interviews was due to the author having specific questions to ask
that allowed for targeting the experience of the staff while allowing for additional
questions to be asked to ensure that certain ideas could be further expanded on. By
using this method staff were able to express their thoughts and feelings on process
mapping, what they wanted to achieve, and how they see the outcome of the research.
In conclusion, there can be advantages and disadvantages when conducting interviews,
and when a researcher selects a type of interview it will depend on what they want to
achieve from the interviews. To ensure that the interview data is valid and reliable,
Alshenqeeti (2014) suggests that the researcher try to avoid asking leading questions,
to take notes and not just tape record an interview and by giving the interviewee the
chance, to sum up, and clarify points. In the case of this research, the author recorded
the pre-interviews, workshop, and post-interviews including the taking of notes. The
interviewees were given the opportunity in both the pre- and post-interviews to ask
further questions for clarity and the same method was applied to the participants in
the workshop.

45 | P a g e
3.4.2 Workshop
Osborn in 1948 first described the methods for using a creative group for problem-
solving, which later became known as brainstorming with the term ‘workshop’ used
only from the 1960s when Osborn’s social ideas spread to other domains e.g. policy-
making, organisational change and innovation (Ǿrngreen and Levinsen, 2017). There
are three types of workshops (1). Exploratory Workshops, (2). Learning Workshops,
and (3). Creating Workshop.
For this research, the author used exploratory workshops. The reason for using this
type of workshop is to allow staff to explore the current state of the WRC process, how
the process currently works between Wits Plus and Faculty A, identifying gaps and
challenges, and how these can be addressed.
It is important to validate the data collected from the workshop and Sufi et al. (2018)
note that evaluating workshop data ensures that quality statements are made and that
the workshop benefits the stakeholders. They made the following suggestions to
measure the impact of a workshop:
1. Set objectives and goals by defining the output and outcomes, make use of a pre-
workshop questionnaire to set goals that need to be addressed. This assists with
questions asked after the workshop and to measure the overall impact.
2. Balance time and effort considering costs.
3. Create metrics of important issues of what is studied to make things comparable
and to create a standard that will support the decision-making at the workshop.
4. Understand bias and be aware of it to evaluate the data honestly.
5. Design a survey to evaluate the workshop as it helps to know if the workshop has
made a difference. Gather feedback before, during, and after the workshop by
using a post questionnaire to measure the impact.

46 | P a g e
6. Use a game after the workshop to see if people understood the concepts and
knowledge areas.
7. Measure people who did not attend by encouraging attendees to share their
experience with them.
Baysinger (1997) notes that there are advantages and disadvantages to using
workshops noting that through a workshop, you can motivate your participants
allowing for flexibility regarding its length and frequency. Workshops can be a series
that build on one another. The disadvantage of using a workshop is that many of the
participants may have too wide a range of skills and there may be difficulty in covering
all the material in a single workshop. It may also be difficult to handle large groups
(Baysinger, 1997).
By using the workshop method for this research it is envisaged that the participants
would through their expertise be able to identify what actions need to be taken to best
address the challenges they face and to move a new WRC process forward. By using,
the various Lean orientated tools and practices it would be best to confirm which of the
tools and practices would support the analysing and improvement of administrative
processes going forward.
3.5 Ethics
The ethical considerations as set out by the University of the Witwatersrand,
Johannesburg ethics for when research is conducted when it includes human subjects
were adhered to when the data was gathered for this research. Ethical clearance was
received from the School Ethics Committee at the University protocol number MIAEC
033/19 (Appendix A) before the research commenced.

47 | P a g e
The following ethics documentation was also completed for this study:
Letter of consent from the Director of Wits Plus to conduct the research
Letters of consent from the participants to participate in the study
The letter of consent was explained to all participants before them participating in the
interviews and the workshop. They were made aware that participation was voluntary,
and that the data was gathered for research purposes only.
3.6 Method
This section describes the method the researcher used in executing the study and is
divided into three parts namely:
Part 1: Pre-Interviews. Hour-long pre-interviews were scheduled and conducted
on 10 and 11 April 2019 with two staff members, one from Wits Plus and one from
Faculty A before the Workshop was held.
Part 2: Workshop. A full-day workshop was held on 10 May 2019 with the staff
member of Wits Plus and three staff members of Faculty A. The author also
included participants from three of the other Faculties who are responsible for the
WRC processes in the workshop. These faculty members were also included due
to new degree offerings in conjunction with Wits Plus and they would be working
with Wits Plus going forward when it comes to the WRC process.
Part 3: Post-Interviews. Hour-long post-interviews were scheduled and
conducted on 24 and 30 May 2019, approximately two weeks after the workshop.
Interviews were held again with the same staff with whom the pre-interviews
were conducted. The purpose of these interviews was to discuss and confirm the
findings of the workshop and to establish if Wits Plus and Faculty A still agreed
with the findings of the workshop.
48 | P a g e
3.6.1 Research Question
As noted in Chapter 1 the main research question for this report is:
Which Lean orientated tools and practices are best suited to support the analysis and
improvement of administrative processes at Wits?
The Wits Readmissions process (WRC) as discussed in Chapter 1 that takes place with
Wits Plus and the Faculties was chosen as the administrative process that would be
used in this research. The five Lean orientated tools and practices Value Stream
Mapping, DMAIC, PDCA, Six Honest Serving Men, Fishbone Diagram) identified in
Chapter 2 were used.
3.6.2 Part 1: Pre-Interviews
The pre-interviews were scheduled and completed with one Wits Plus and one Faculty
A staff member. Participants were asked specific questions to establish if they have
drawn up process maps before or if they were aware of any process maps or
improvement tools and the current state of processes within their offices with a focus
on the WRC process. The author compiled an interview schedule with pre-interview
questions that guided the interviews. The pre-interviews were recorded while the
researcher made notes against each of the questions that were asked. The responses
were transcribed from the audio recordings and supplemented with written notes
during the analysis. Table 7 represents the interview questions and the aim of each
question.

49 | P a g e
Table 7: Pre-Interview Questions Table
INTERVIEW QUESTION ASKED AIM OF THE QUESTION
1. Which cohorts of students are
currently registering with Wits Plus?
Establish which type of students are
registered and what the needs of these
students are.
2. Which rules/guidelines are currently
in place to govern the life cycle of
students?
Establish if processes are in place and
which processes are in place.
Are these processes consistent across
Wits Plus/Faculties?
3. Explain to me how the WRC process
works.
Establish which rules are in place.
Are the same WRC rules in place across
Wits Plus/Faculties?
4. What role does Wits Plus play in the
WRC process?
Establish if there are different roles.
Do all staff participate in the process
equally?
5. Would you say that the WRC processes
are working between Wits Plus and the
Faculty?
Are processes in place?
Is there an understanding of process
mapping?
6. Would you like to see the WRC process
change and what would you like to see
change?
Establish if there is a need in Wits
Plus/Faculties to have processes or rules
changed?
7. Explain to me how you deal in your
office with the situation when a new
process is introduced.
Establish if there is process knowledge.
Does training happen?
8. What process flows if any do you have
in your office?
Establish knowledge of process mapping.
Do process maps exist?
9. Have you ever used any Lean tools to
map processes?
Is there any experience with mapping
processes and using Lean tools to do so?
10.
Would you say all staff are clear on
what processes they need to follow
when dealing with a student/inquiry in
the office?
Establish knowledge of processes and
rules.
Establish training needs.
11. Would you say it is worthwhile to map
processes?
Establish the need and whether they
would find the mapping useful.

50 | P a g e
3.6.3 Part 2: Workshop
The Workshop aimed to introduce participants to the various Lean orientated tools and
practices and allow them to use these by drawing up process maps through which the
WRC process was analysed and improvements proposed. The author of the report
facilitated the Workshop. The Workshop was recorded, and the responses were
transcribed from the audio recordings and supplemented with the output documents
from the Workshop during analysis (Refer to Appendix: Workshop Brainstorming
Notes and Appendix G: Workshop Notes).
(1) Session 1: The Workshop started with a presentation from the author. An
overview of the history of Lean was given; noting the service sectors where Lean
orientated tools and practices has been successfully introduced and implemented
after which there was a discussion of these Lean orientated tools and practices that
were identified that would be used during the workshop (refer to Appendices D and
E for the Workshop Agenda and Workshop Presentation). The author decided to
give the participants the Lean orientated tools and practices in the following order
(1) Value Stream Mapping, (2) DMAIC, (3) PDCA, (4) Six Honest Serving Men, and
(5) Fishbone diagram.
(2) Session 2: A brainstorming session followed the presentation session before
participants started to experiment with using the Lean orientated tools and
practices to create visual flow charts of the WRC process. During this session, all
participants noted how the WRC process worked in their specific area noting the
interactions between Wits Plus and Faculties.

51 | P a g e
The following points were considered during this exercise:
1. The current challenges stakeholders face,
2. Pinpointing their challenges,
3. Identifying gaps in the WRC processes taking place between Wits Plus and the
Faculties,
4. Determining gaps in staff’s knowledge regarding the WRC process,
5. Identifying waste in duplication of processes and to reduce waste from future
processes,
6. Identifying gaps in the communication between Wits Plus and the Faculties,
7. Determining variance in processes between Faculties and Wits Plus.
These discussions were all captured by the author on flipchart paper and
displayed around the room (refer to Appendix U). These informed the flow charts
that were drawn up which are shown and discussed later in this chapter.
(3) Session 3: After the brainstorming session, participants started to experiment on
process flow charts of the WRC process by using the various Lean orientated tools
and practices given to them. The participants decided as a collective to work
together as one group on these flow charts with each participant allowed to give
their input in the process. Participants could voice any opinions they had on the
Lean orientated tools and practices during this time; they could also refer to the
paper exercise of the morning session.
(4) Session 4: Participants gave their verbal input and rating of the Lean orientated
tools and practices at the end of the workshop. Participants noted which Lean
orientated tools and practices they understood best, the advantages of each, and
which ones would they believed would support them in creating further workflows
of processes within their offices to analyse and improve their processes.

52 | P a g e
3.6.4 Part 3: Post-Interviews
In conducting the post-interviews, a semi-structured interview style was followed, and
these took place two weeks after the workshop was conducted. The post-interviews
were conducted on a one-on-one basis with the same staff as were interviewed at the
beginning of the research being one staff member of Wits Plus and one staff member
from Faculty A. These two staff members are responsible for the management of both
these departments. The interview schedule contained a list of structured questions that
guided the post-interview questions (Refer to Appendix C).
The purpose of the post-interviews was to establish the impact of the workshop and if
experimenting with the Lean orientated tools and practices to draw up process flows
used in the workshop had the desired outcome in that:
1. Through experimenting with these Lean orientated tools and practices the
Wits Readmissions (WRC) process was analysed and improvement
opportunities were identified;
2. Lean orientated tools and practices were identified that will be used and will
support the analysing and improvement of processes;
3. A framework can be created from these Lean orientated tools and practices
that can be used to create other process charts of other and new processes.
To validate the post-interview process and to ensure alignment between the questions
Table 8 Post-Interview Questions illustrates the questions asked and the aim of the
question.

53 | P a g e
Table 8: Post-Interview Questions Table
INTERVIEW QUESTION ASKED AIM OF THE QUESTION
1. Did you find the workshop useful? Establish from participants if the need was
met.
2. Did you find the creation of process
flows of the processes useful?
Establish if there is an understanding of
Lean orientated tools and practices offered.
3. Looking at all the process flows, which of
the tools do you think can add the most
value?
Establish if the participant understood the
Lean orientated tools and practices.
Confirm with the participant which Lean
orientated tools and practices would be
used.
4. Will you use Lean orientated tools and
practices in any other of your
processes?
Establish if the processes would be used.
5. Which of the Lean orientated tools
and practices used at the workshop do
you prefer most and why?
Establish and confirm which were the most
understood Lean orientated tools and
practices and why.
6. Which of the Lean orientated tools
and practices used at the workshop do
you least prefer? Why?
Establish which of the Lean orientated
tools and practices were not understood
and understand why.
7. Do you think it is useful to create
process flows and why?
Establish an understanding and value add.
8. Would you recommend to other
administrative units to use these Lean
orientated tools and practices to map
their processes?
Establish value add.

54 | P a g e
3.6.5 Analysis
3.6.5.1 Pre-Interviews
During the pre-interviews eleven questions were posed to the staff of Wits Plus and
Faculty A. The questions aimed to establish the processes currently in place in both
Wits Plus and Faculty A as well as the level of knowledge that existed when it came to
process mapping. The answers to the questions were reviewed and assisted the
researcher to:
1. Determine staffs understanding of process mapping;
2. Determine if any process mapping had been done previously;
3. Determine the need for process mapping;
The answers to the questions assisted the researcher to confirm that there was a need
within the University’s administrative environment to map processes and to explore
various Lean orientated tools and practices to do so. The answers from the pre-
interviews also assisted the researcher to confirm the five Lean orientated tools and
practices that would be used during the workshop.
3.6.5.2 Workshop
The data gathered from the workshop was scrutinised and analysed by the researcher.
The researcher reviewed all the answers and comments made at the workshop against
each Lean orientated tool and practice that was used and graded these against the
following categories:
1. The tool/practice was not useful
2. The tool/practice was partially useful
3. The tool/practice was useful
4. The tool/practice was most useful

55 | P a g e
3.6.5.2.1 Grading Criteria and Grading Categories
Each Lean orientated tool and practice that was used to experiment with received an
average grading score against the grading category and these are set out in Table 9:
Grading Criteria and Description of the Grading Categories.
Table 9: Grading Criteria and Description of the Grading Categories
Grading Category Description Average Grading
Level
Not useful The tool/practice is not found to be useful
by the participants when analysing and
improving a process. After an explanation, it
is seen to be complicated and not a
tool/practice that will be readily used. The
answer to the tool/practice is graded below
a 25% level.
1.0
Partially Useful The tool/practice is found to be partially
useful when analysing a process. Most
participants indicate that they will not
readily use the tool/practice to analyse a
process and the answer to the tool/practice
is graded below 50%.
2.0
Useful The tool/practice is found to be useful.
Participants agree that it analyses a process,
identifies areas and opportunities to
improve but there are however some
limitations. The answer to the tool/practice
is graded below 75%.
3.0
Most Useful The tool/practice is found to be most useful.
Participants agree that it analyses a process,
identifies areas, and opportunities to
4.0

56 | P a g e
improve and they will use this tool/practice
to support them. The answer to this
tool/practice places it above the 75%
grading level.
3.6.5.3 Post-Interviews
Two weeks after the conclusion of the Workshop post-interview meetings were held
with staff from Wits Plus and Faculty A. During the post-interviews, the researcher
posed eight questions to the staff with the aim being to confirm the findings from the
workshop. The grading scores compiled from the workshop were compared by the
researcher against the answers to the questions from the post-interviews. Specific
questions were posed regarding the Lean orientated tools and practices used and
during the workshop and their usefulness. In doing so the responses confirmed that
the three Lean orientated tools and practices identified in the workshop were still
preferred and would be used to map existing processes and new processes and that
these could be proposed for a framework.
3.7 Conclusion
In this chapter, the author described the various research methods used to collect data
for this research report and to answer the research question and from which ultimately
a process framework could be compiled and recommended. The chapter further
discussed the pre-interviews, the workshop, and the post-interview methods used to
point to the advantages and disadvantages. In conclusion, the grading criteria and
categories to analyse and report on the results were discussed.

57 | P a g e
Chapter 4: Data Analysis and Findings
4.1 Background
The purpose of this chapter is to show a detailed analysis of the full findings of the pre-
interviews, the workshop, and the post-interviews. The chapter also shows the process
maps drawn up during the workshop.
This chapter is set out as follows:
Analysis of the findings by showing the findings of each of the Lean orientated
tools and practices that the participants experimented with.
Findings of the pre-interviews, the workshop, and the post-interviews.
Discussion of the findings
Introduction of the proposed framework
4.2 Introduction
The following section shows the findings from the pre-interviews, the workshop where
participants experimented with the Lean orientated tools and practices, and the post-
interviews. During the workshop, the participants voiced their opinions when
experimenting with the tools and practices and these are included in the findings of
this chapter. This section also shows the graphical illustrations and the outcomes given
for each Lean orientated tool or practice that was used. The three Lean orientated tools
and practices with the highest scores are recommended for the Process Flow
Framework in Chapter 5.

58 | P a g e
4.3 Analysis Section
4.3.1 Pre-Interviews
4.3.1.1 Aim of the Pre-Interviews
One-on-one pre-interviews were held with the key staff members from both Wits Plus
and Faculty A who are responsible for the management of Wits Plus and the Faculty,
and who are directly involved with the WRC process. The pre-interviews probed
whether staff have made use of and created any process maps to analyse processes and
if so, what method they used.
The aim of the pre-interviews as noted in Chapter 3 was to see:
1. Which type of students are registered at Wits Plus and if processes were in place;
2. If processes were consistent across Wits Plus/Faculties;
3. If the same WRC rules were in place across Wits Plus/Faculties;
4. If all staff participate in the process equally;
5. If there was an understanding of process maps;
6. If there is a need in Wits Plus/Faculties to have processes or rules changed;
7. If there is process knowledge;
8. If training happens;
9. If there is knowledge of process maps;
10. If process maps existed;
11. If there was an experience with the creation of process maps.
59 | P a g e
The responses received from the key staff members from both Wits Plus and Faculty A
interviewed are illustrated in Table 10: Findings: Pre-Interview Questions. This table
includes the author’s remarks that assisted with the agenda-setting of the workshop. It
further ensured the addressing of key issues during the workshop.

60 | P a g e
Table 10: Pre-Interview Questions
Pre-Interview Questions
Question 1Which cohorts of students are currently registering with Wits Plus?
Responses from Wits Plus and Faculty A staff
Researcher’s Remark
The majority of students are the more mature working student who
passed Grade 12 before 2017. These students have different needs,
as they are more mature than the typical 19-year-old is. There is
also the excluded cohort of students from various other Faculties
that apply and register at Wits Plus.
Students are becoming more aware of the Wits Plus offerings and therefore
registering at Wits Plus. Excluded students are seeing Wits Plus as a way of
continuing their studies.
Question 2: Which rules/guidelines are currently in place to govern the life cycle of students?
Responses from Wits Plus and Faculty A staff Researcher’s Remark
Currently, the same rules that apply for full-time (FT) students
apply to part-time (PT) students but in many instances, their rules
are unwritten, with changes communicated verbally or at meetings
to Wits Plus. This sometimes occurs very late causing many
frustrations for the part-time students. Wits Plus has never
compiled its own rules; therefore, there are no formal rules or
guideline booklets in place because that has always been done by
There is a need for formalising rules for Wits Plus, as they currently have no
formal say in any changes. If a Faculty does not write a rule, it is not done
and an unwritten rule/practice is used to address incidents with students.
Faculty forgets to inform Wits Plus of rule changes. This is not done
purposively but causes problems especially if a rule is changed at the
beginning of the year.

61 | P a g e
the Faculties. The concern with this is that staff will not know the
rules if the manager leaves and guidelines that can be shared with
both staff and students are required.
Question 3: Explain to me how the WRC process works?
Responses from Wits Plus and Faculty A staff Researcher’s Remark
Students who do not meet the minimum requirements are
excluded regardless of being a Wits Plus or Faculty students and
students apply on-line or manually to be considered for
readmission. All applications regardless of being a full-time or part-
time student are prepared by the Faculty for the WRC meetings.
Faculties constitute the WRC committees, the Faculty WRC
considers all applications, and Wits Plus is not part of this
committee. WRC committee decides on the readmission or not of
all the students (both full and part-time) and Faculty codes the
outcome on the student record. Faculty decides on the conditions
for readmissions of the Wits Plus students and the Faculty tend to
be very lenient with their conditions, as they are full-time working
students.
Wits Plus is completely out of the loop with the WRC process, with no
oversight on their students applying to WRC nor forming part of the WRC
meetings. Wits Plus does not handle any students WRC application nor are
they involved in any of the coding of the WRC students when WRC1 or WRC
2 committees uphold the exclusion. They have no formal say about the
conditions that are set for their students.

62 | P a g e
Question 4: What role does Wits Plus play in the WRC process?
Responses from Wits Plus and Faculty A staff Researcher’s Remark
As noted in the previous question, Wits Plus does not play an active
role in the WRC process and it is not so much an issue at this stage
but can become a problem as questions can be raised as to why
Faculty is doing Wits Plus work. Faculty A keeps a manual list of all
the WRC applications, and the Faculty works from these but Wits
Plus is not involved in this process. If a student has, a valid reason
for being excluded, their readmission is approved. The same rules
that apply for the full-time students in Faculty A apply to Wits Plus
students with the progression rules applied leniently to part-time
students. Wits Plus is however growing and there is a need to have
WRC processes in place. Wits Plus knows their students and their
circumstances and, in some cases, it has been found that Wits Plus
is confused when students are excluded as Faculty decides on their
behalf.
Wits Plus needs to be part of the WRC process as they have a more holistic
view of their students. The need for formal Wits Plus rules is noted again.
Question 5: Would you say that the WRC processes are working between Wits Plus and the Faculty?
Responses from Wits Plus and Faculty A staff Researcher’s Remark
In most cases, the answer would be yes but there are problem cases
e.g. students excluded from full-time studies, having reached N+2

63 | P a g e
searching for a place to go to complete their degree, and Faculty
rules do not allow for them to reregister for the same degree again
in the Faculty. These students are also not allowed to continue their
studies through Wits Plus and several students have slipped
through and registered with Wits Plus. On the other hand, Faculty
can readmit a student with one outstanding course forcing them to
go to Wits Plus to complete the last course they need for their
degree. Processes need to be streamlined, as schools are
sometimes reluctant to take students back, although students have
been readmitted and need to be accommodated. With WRC, there
can be such a mix of students who are readmitted. Students can be
readmitted by the DVC’s office and Wits Plus is not aware of these
decisions as these cases are only communicated to Faculties, but
students need to reregister with Wits Plus. Confusion arises w.r.t
the number of courses that students can take when readmitted,
students requesting to see the rules in writing. There needs to be
scenario mapping as various types of students can be excluded.
There also needs to be more clarity on credits especially if a student
who was excluded from full-time studies can register for part-time
studies.
Students want to access rules, and these are not written down or
streamlined. This stresses the need again for progression rules.
Rules are further required for students wanting to transfer between FT and
PT studies. There seems to be a lot of confusion regarding the WRC process
that needs to be followed, by when, by whom, and for which students.
Although the processes are complex and unwritten, there is a good working
relationship between the various stakeholders.
Question 6: Would you like to see the WRC process change and what would you like to see change?
Responses from Wits Plus and Faculty A staff Researcher’s Remark
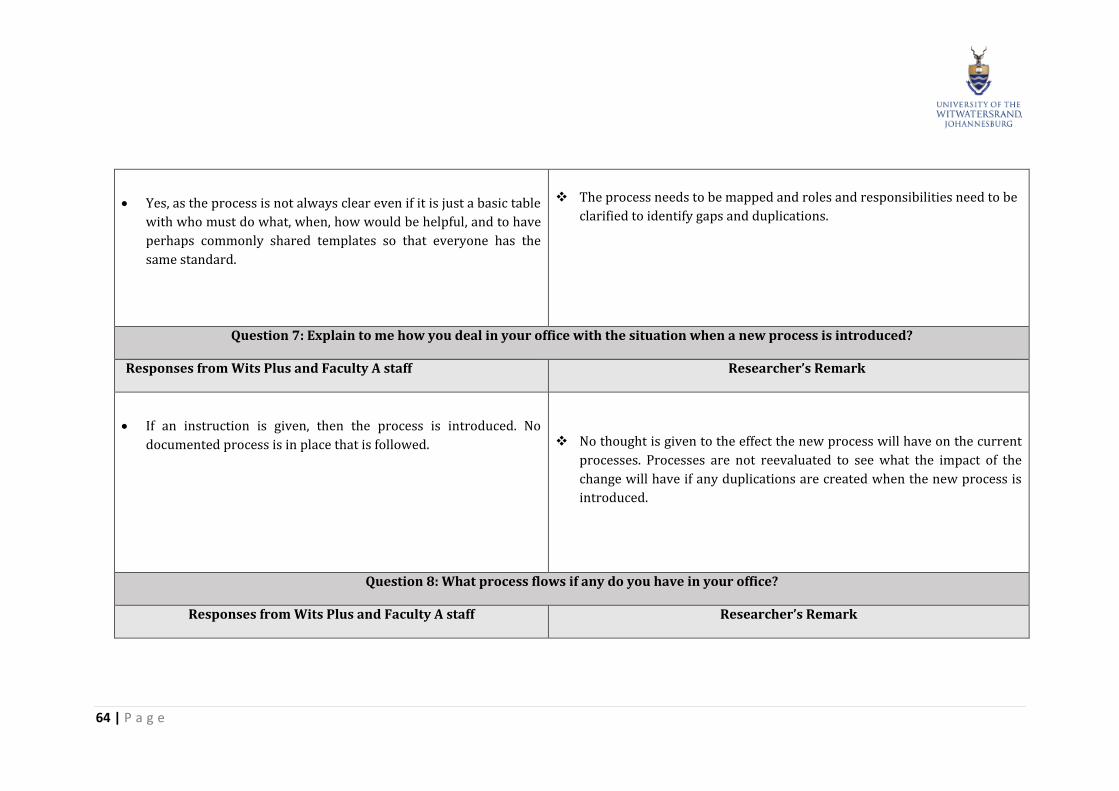
64 | P a g e
Yes, as the process is not always clear even if it is just a basic table
with who must do what, when, how would be helpful, and to have
perhaps commonly shared templates so that everyone has the
same standard.
The process needs to be mapped and roles and responsibilities need to be
clarified to identify gaps and duplications.
Question 7: Explain to me how you deal in your office with the situation when a new process is introduced?
Responses from Wits Plus and Faculty A staff Researcher’s Remark
If an instruction is given, then the process is introduced. No
documented process is in place that is followed.
No thought is given to the effect the new process will have on the current
processes. Processes are not reevaluated to see what the impact of the
change will have if any duplications are created when the new process is
introduced.
Question 8: What process flows if any do you have in your office?
Responses from Wits Plus and Faculty A staff Researcher’s Remark

65 | P a g e
Processes are not specifically mapped. Year planners that show
activities that happen monthly within the office are available as
well as a RACI document showing per task who is responsible, who
is accountable who it needs to be communicated to and who needs
to be informed.
It is not clear how much other staff understands all processes that need to
be followed in Wits Plus or Faculties so there is a need for process maps
that can be shared with staff. Mapping will make planning easier.
Question 9: Have you ever used any Lean orientated tools or practices to map processes?
Responses from Wits Plus and Faculty A staff Researcher’s Remark
No not Lean tools. Faculty A has started to note down the PG
submission processes. It would be useful to be exposed to various
Lean tools and practices that can assist with drawing up process
maps and streamlining processes. It would be useful to have a
process that can guide how to draw up process maps It takes up
time to draw up process maps and it is difficult to find time to do.
In most cases now staff use their common sense when doing their
work and handling issues and problems.
Currently, there are no process maps and if it is done, it is seen as a task for
the Manager. Staff are not part of drawing up process maps. Staff needs to
be involved as their buy-in is required.
Question 10: Would you say all staff is clear on what processes they need to follow when dealing with a student/inquiry in the office?
Responses from Wits Plus and Faculty A staff Researcher’s Remark

66 | P a g e
Not always. In most cases, if a process is an unclear staff do not
know what to do and it lands on the table of the manager.
Instead of addressing problems, they are escalated, as the staff member is
unclear as to what to do.
Question 11: Would you say it is worthwhile to do a process flow of the WRC processes?
Responses from Wits Plus and Faculty A staff Researcher’s Remark
Yes, and to have it on a shared drive for all staff to access. Processes
also do not talk to one another causing a lot of duplication. Many
times, things change but there are no documented processes that
can be used by staff. Having this will assist especially if a staff
member is not in the office or on leave.
There is a process, but it is not formally documented. If there are process
maps staff can be clear on what to do.
67 | P a g e
4.3.2 Workshop
4.3.2.1 Aim of the Workshop and the Purpose of using Process Mapping
Bicheno and Holweg (2016) note that the real purpose of mapping is to design a future
state, a way to visualize the current state and future states. As noted in Chapter 3 the
Workshop aimed to allow participants to be exposed to various Lean orientated tools
and practices and by taking these and experimenting with them to create process maps
of ways to improve the WRC process. By drawing process maps staff can better
visualise a process to see the value of how it streamlines a process and eliminates waste
and hopefully they would be able to use the same method for other administrative
processes within their offices. Netland and Powell (2017) note that when Lean tools
are applied as part of the broader initiative the use of approaches e.g. Lean Six Sigma,
sticky note mapping processes, or whiteboards work the best.
In this research, process maps were drawn up using the five Lean orientated tools and
practices. They were chosen as they enabled:
1. a process focussed orientation,
2. process maps to be drawn up,
3. definition of the process,
4. analysis and process evaluation,
5. the performance to be measured, and
6. improvement by reducing unnecessary steps that can create waste.
68 | P a g e
The section that follows shows the detailed illustrations of the process maps created
from the workshop discussions. Process maps allow for the analysing of current and
future states and creating the opportunity for processes to be broken down into more
organised steps whilst allowing the compilation of a future implementation flow
(Bonaccorsi et al., 2011). The Lean orientated tools and practices were explained by
the author to the participants in session 1 of the workshop. The participants worked
together in one group and this allowed each member in the group to contribute to a
process flow, bearing in mind their ideas and suggestions to better analyse and suggest
improvements to the WRC process. Dennis (1996) notes that group members
characteristically have a lot of information about possible alternatives and this
information shapes the pre-discussions as well as the member's preferences that can
shape the group decision. In the case of this research, the group work allowed all
participants to make a positive contribution to the workshop. Group discussion
improves the quality of decisions allowing members to share information giving access
to a larger pool of information. (Dennis, 1996)
As pointed out in Chapter 1, this may not be the purist way of applying Lean tools or
practices but is a starting point to encourage staff to think about the work they do, and
how they can analyse and improve processes. It is an excellent vehicle for involvement
and participation and it is great to generate ideas (Bicheno and Holweg, 2016). Beckers
(2015) also notes that the visual representation of processes and waste when working
in a group can be useful as it gives an overview as well as providing structure to the
process. Anthony et al.2012 also states that visual management is a great tool to assist
with understanding a process, what is under control and what not.
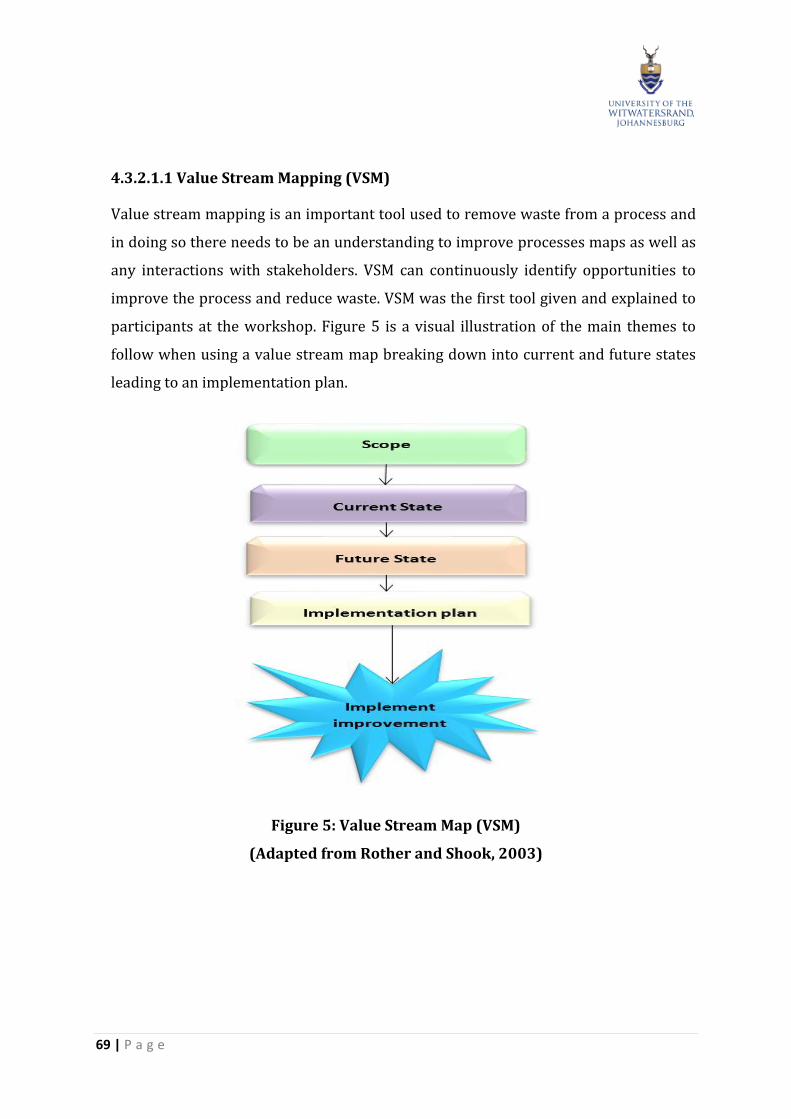
69 | P a g e
4.3.2.1.1 Value Stream Mapping (VSM)
Value stream mapping is an important tool used to remove waste from a process and
in doing so there needs to be an understanding to improve processes maps as well as
any interactions with stakeholders. VSM can continuously identify opportunities to
improve the process and reduce waste. VSM was the first tool given and explained to
participants at the workshop. Figure 5 is a visual illustration of the main themes to
follow when using a value stream map breaking down into current and future states
leading to an implementation plan.
Figure 5: Value Stream Map (VSM)
(Adapted from Rother and Shook, 2003)

70 | P a g e
The current state of a process needs to be mapped from which a new future state can
be developed. Figure 6 identifies all the steps currently followed by Wits Plus and the
Faculties when it comes to the WRC process, none of these processes are currently
documented.
Figure 6: Current WRC Process

71 | P a g e
Figure 7 illustrates the WRC communication and rule processes. In this diagram, it is
proposed that Wits Plus should be involved in the coding of their students. It also
shows the inclusion of Wits Plus in the Board of Examiners' meetings to be part of the
decision-making when it comes to the exclusion of their students.
Figure 7: WRC Communication and Rule Process

72 | P a g e
Figure 8 is the second diagram shows the process to follow during the WRC meetings.
This map shows the process when students apply to WRC and are either readmitted or
excluded, including the periods of exclusion and that, they need to reapply if they are
excluded. It also includes Wits Plus in the WRC meetings going forward.
Figure 8: WRC Meeting and Outcomes Process

73 | P a g e
Figure 9 shows the process after concluding the WRC meetings per Faculty including
the communication that needs to take place with the students as well as the counseling
and intervention sessions that take place with the students during the year. It further
illustrates the mid-year exclusions should students not meet the mid-year conditions
stipulated by the Board of Examiners, leading to their registrations being canceled.
Figure 9: Readmitted Students Registrations and Mid-Year Exclusions Process

74 | P a g e
Figure 10 shows the implementation plans coming from the workshop as well as the
action plan table detailing the action plans and timelines that participants noted with
the new refined WRC process. From all the processes identified in Figures 6 to 9 detailed
value stream maps can be drawn up.
.
Figure 10: Implementation Plan with Timelines

75 | P a g e
4.3.2.1.2 DMAIC
DMAIC can be used to solve problems in a planned way. The process maps depicted in
Figures 11 to 16, illustrates the process maps discussed by using the DMAIC stages at
the workshop.
Figure 11: Five Stages of DMAIC

76 | P a g e
Participants used each of the five DMAIC stages to discuss and scrutinise the WRC
process. Figure 12: DMAIC illustrates how the workshop participants defined the WRC
process, and the goals they set out to achieve with changing the process for it to be
improved.
Figure 12: DMAIC – Define the Problem and Set Goals

77 | P a g e
Figure 13 illustrates how the workshop participants measured and assessed how they
are currently handling the WRC process. They noted the weaknesses within the WRC-
process but similarly had the opportunity to reflect on what they do well.
Figure 13: DMAIC - Measure the Process

78 | P a g e
Figure 14 illustrates and explains why things are the way they are. This diagram further
illustrates the value and non-value adding steps within the WRC process.
Figure 14: Analyse the Process

79 | P a g e
Figure 15 illustrates the suggested improvements to the WRC process as noted by the
workshop participants. It was felt that these improvements would go a long way in
streamlining the process and making Wits Plus part of the WRC process. It will take the
decision-making away from Faculties to determine what readmissions conditions need
to be set for excluded part-time students since there is not an understanding of the
needs of a part-time student.
Figure 15: DMAIC - Improve the Process

80 | P a g e
Figure 16 was compiled to illustrate the desired outcome the workshop participants
noted and suggested to improve and move the WRC process forward.
Figure 16: DMAIC - Control

81 | P a g e
4.3.2.1.3 PDCA (Plan, Do, Check and Act)
The PDCA method assists in controlling a process whilst looking for continual ways of
improving a process. Figure 17 PDCA Cycle illustrates the different stages of the PDCA
cycle - Plan, Do, Check, and Act.
Figure 17: PDCA Cycle
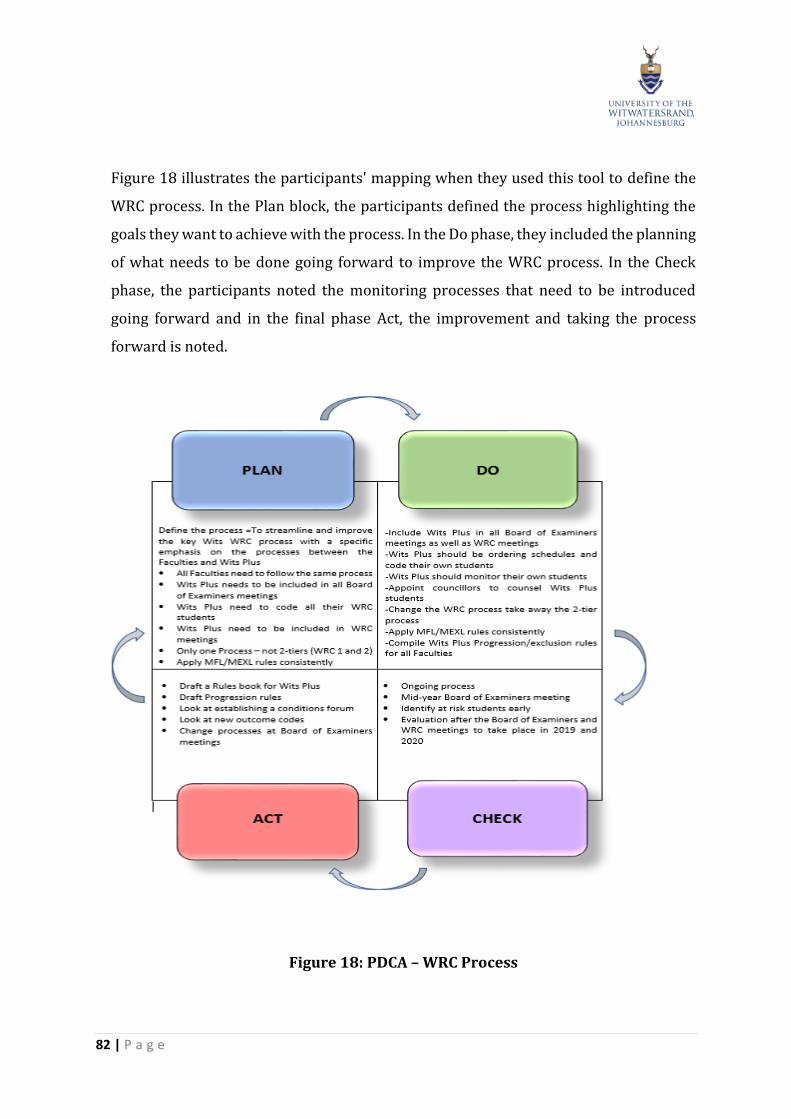
82 | P a g e
Figure 18 illustrates the participants' mapping when they used this tool to define the
WRC process. In the Plan block, the participants defined the process highlighting the
goals they want to achieve with the process. In the Do phase, they included the planning
of what needs to be done going forward to improve the WRC process. In the Check
phase, the participants noted the monitoring processes that need to be introduced
going forward and in the final phase Act, the improvement and taking the process
forward is noted.
Figure 18: PDCA – WRC Process

83 | P a g e
4.3.2.1.4 ‘Six Honest Serving Men’
The ‘Six Honest Serving Men’ framework is useful to get to important information
swiftly with each question reviewing a specific detail. Figure 19 is a visual illustration
of the six questions that are asked when using the ‘Six Honest Serving Men’.
Figure 19: ‘Six Honest Serving Men’

84 | P a g e
Figure 20 is an illustration of the mapping that took place by the participants in the
workshop when using the ‘Six Honest Serving Men’.
To clarify the roles and responsibilities of the WRC process.
Information needs to be shared amongst all the stakeholders.
There needs to be succession planning done for when a staff member leaves the office.
The best process is needed for all stakeholders including students.
To standardise the WRC process across Wits Plus and the Faculties.
To improve the efficiency of the WRC process and streamline the process.
To ensure that all stakeholders know what their responsibilities are.
To improve the experience for the student but also for the staff who must deal with very
difficult students who have been excluded.
To get the best throughput of the students.
Currently in Faculty but the process needs to start including Wits Plus going forward.
WRC1 can remain at the Faculty level but there is a need to change the structure of WRC
2 and to make it a central committee again.
Need to appoint Curriculum Advisors at Wits Plus to properly advise and assist part-time
students who have been excluded.
Figure 20: ‘Six Honest Serving Men Mapped’

85 | P a g e
Pre-screening of students needs to happen before the end of year exams (October) to
establish how many students will be excluded. Wits Plus needs to be part of this process
and should be able to request schedules to work through the records of the Wits Plus
students to also establish who is at risk.
Identify at the Board of Examiners meetings students who are not high risk, who can be
recommended to be readmitted with conditions, and who do not have to be excluded. Wits
Plus needs to be part of the Board of Examiners meetings and needs to know about these
decisions that are taken on the student’s records.
WRC meetings take place at the beginning of each year. The later these meetings take
place the closer it moves to registrations. One of the concerns with the WRC2 process is
that it happens at the same time as registrations making it difficult to run the two
processes concurrently.
WRC 1 is best placed within the Faculties, as is currently the process to be dealt with by
the Faculty Administrators. Wits Plus needs to be part of these committee meetings.
WRC 2 needs to be a centralised committee with a support structure of more
professional staff e.g. Psychologist who would be best able to advise on the readmission
of students.
Going forward Wits Plus Administrators need to be part of all WRC processes.
Include Wits Plus in all WRC meetings going forward.
Wits Plus needs to monitor its own readmitted students throughout the year and advise
on mid-year exclusions.
Wits Plus progression and exclusion rules need to be drafted and approved.
A Wits Plus rules book needs to be compiled.
Figure 20: ‘Six Honest Serving Men’ - Mapped
86 | P a g e
4.3.2.1.5 Fishbone Diagram
The Fishbone diagram identifies the root causes of a problem and it provides a
systematic way of looking at the elements that cause a situation. Picarillo (2018) note
that a Fishbone Diagram is a comprehensive evaluation of the causes of the main
problems. It was the last tool given to the participants to use, however, they did not
want to engage with the diagram. Participants struggled to understand the value of the
diagram and found it to be complicated and noted that it looked difficult. The author
did not force them to engage further with the diagram, as the staff were also very
fatigued at this stage and did not want to continue.
4.3.3 Post-Interviews
4.3.3.1 Aim of the Post-Interviews
The researcher compiled the post-interview questions to inform the findings from the
workshop. Table 10: Post-Interview Questions notes the questions that were asked by
the author with the responses received from Wits Plus and Faculty A in the one column
and the remarks of the researcher in the other.
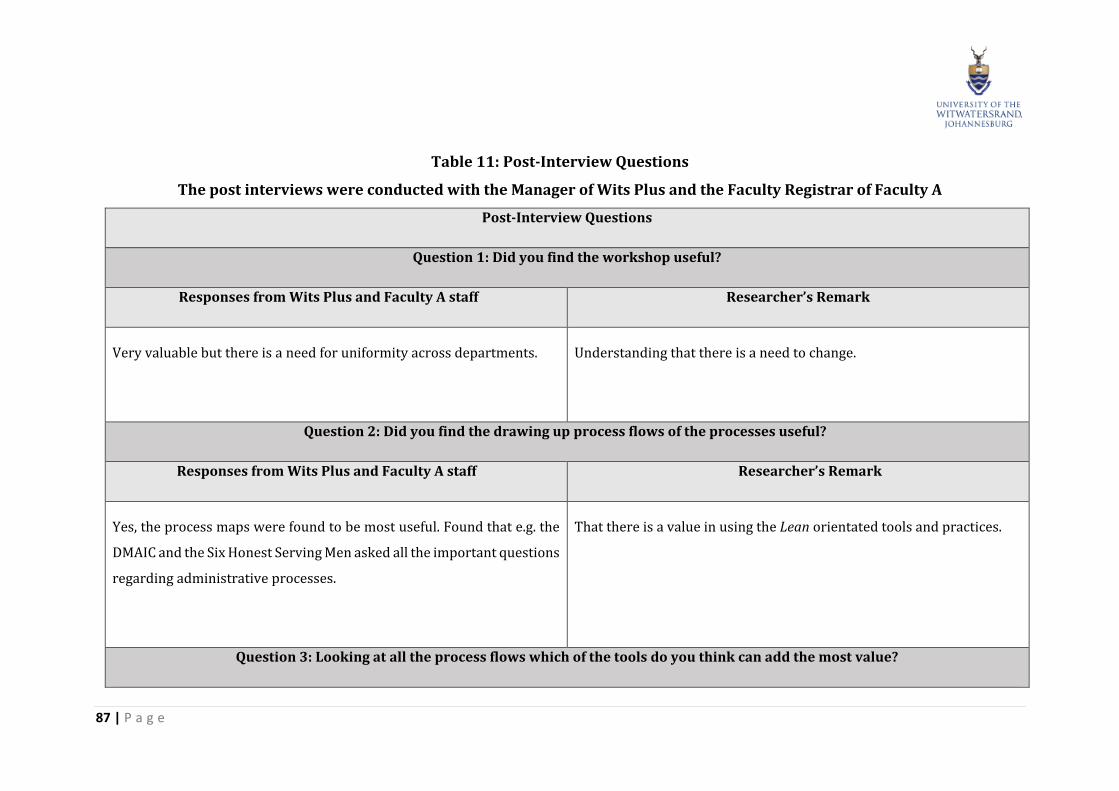
87 | P a g e
Table 11: Post-Interview Questions
The post interviews were conducted with the Manager of Wits Plus and the Faculty Registrar of Faculty A
Post-Interview Questions
Question 1: Did you find the workshop useful?
Responses from Wits Plus and Faculty A staff Researcher’s Remark
Very valuable but there is a need for uniformity across departments. Understanding that there is a need to change.
Question 2: Did you find the drawing up process flows of the processes useful?
Responses from Wits Plus and Faculty A staff Researcher’s Remark
Yes, the process maps were found to be most useful. Found that e.g. the
DMAIC and the Six Honest Serving Men asked all the important questions
regarding administrative processes.
That there is a value in using the Lean orientated tools and practices.
Question 3: Looking at all the process flows which of the tools do you think can add the most value?

88 | P a g e
Responses from Wits Plus and Faculty A staff Researcher’s Remark
Honest Serving Six Men
Value Stream Mapping
DMAIC
The most useful Lean orientated tools and practices were again
identified confirming the outcome from the workshop.
Question 4: Will you use Lean orientated tools and practices in any other of your processes?
Responses from Wits Plus and Faculty A staff Researcher’s Remark
Yes, especially the Honest Six Serving men. This practice is clear on the
outcome that needs to be achieved. Departments will never be the same
when this practice is used. Comfortable to use.
Confirmed the value add and that it will be used.
Question 5: Which of the Lean orientated tools and practices used at the workshop do you prefer most and why?
Responses from Wits Plus and Faculty A staff Researcher’s Remark

89 | P a g e
The Six Honest Serving Men adds value as it asks all the correct
administrative related questions.
Departments need a practice that immediately speaks to the heart of
their problem and what they need to do.
Question 6: Which of the Lean orientated tools and practices used at the workshop do you least prefer? Why?
Responses from Wits Plus and Faculty A staff Researcher’s Remark
Fishbone Diagram was not understood or the value it can add. Simple tools and practices are needed but there is a sense also that
participants are requiring a solution for a problem and there is not an
interest in what causes the problem.
Question 7: Do you think it is useful to draw up process flows to map processes and why it is useful?
Responses from Wits Plus and Faculty A staff Researcher’s Remark
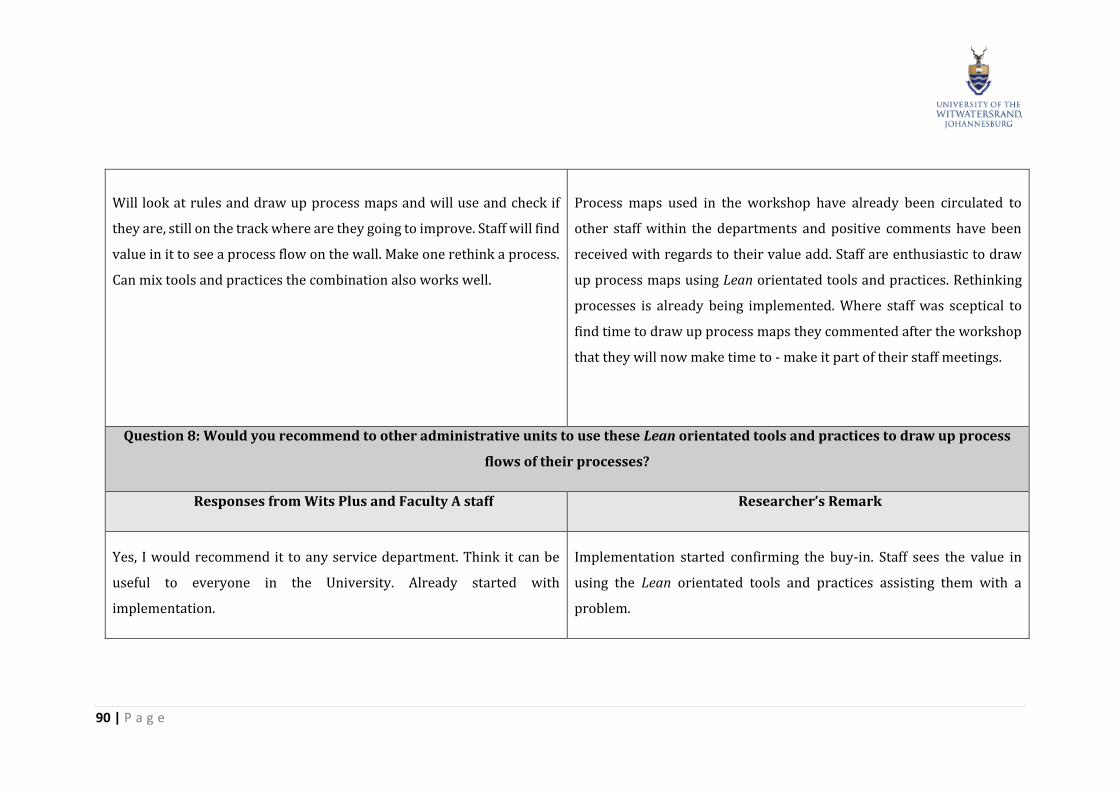
90 | P a g e
Will look at rules and draw up process maps and will use and check if
they are, still on the track where are they going to improve. Staff will find
value in it to see a process flow on the wall. Make one rethink a process.
Can mix tools and practices the combination also works well.
Process maps used in the workshop have already been circulated to
other staff within the departments and positive comments have been
received with regards to their value add. Staff are enthusiastic to draw
up process maps using Lean orientated tools and practices. Rethinking
processes is already being implemented. Where staff was sceptical to
find time to draw up process maps they commented after the workshop
that they will now make time to - make it part of their staff meetings.
Question 8: Would you recommend to other administrative units to use these Lean orientated tools and practices to draw up process
flows of their processes?
Responses from Wits Plus and Faculty A staff Researcher’s Remark
Yes, I would recommend it to any service department. Think it can be
useful to everyone in the University. Already started with
implementation.
Implementation started confirming the buy-in. Staff sees the value in
using the Lean orientated tools and practices assisting them with a
problem.

91 | P a g e
4.4 Findings
4.4.1. Introduction to the Findings
In this section, a detailed breakdown of each of the Lean orientated tools and practices
and the comments recorded from the workshop are noted. Cohen et al. (2007) note that
in doing research any bias needs to be minimised. To address any bias, the verbal
comments from the workshop on the Lean orientated tools and practices are included
in the discussion of each Lean orientated tool and practice. Noble and Smith (2015)
recommend that qualitative researchers include rich verbatim descriptions of
participants' accounts to support findings. The Lean orientated tools and practices are
assessed and discussed according to the scores they received, ranging from the highest-
scoring tool to the lowest. The advantages noted in Chapter 2 are included in the
discussions and compared to the advantages of the findings of the workshop expressed
by participants. The highest-scoring Lean orientated tool and practice are
recommended for the process flow framework that will be discussed at the end of this
Chapter.
4.4 2 Pre-Interview Findings
From the pre-interviews with staff from both Wits Plus and Faculty A staff noted their
frustrations with the lack of clearly defined processes and process mapping, that they
have little knowledge of drawing up process maps and that they could find value in
having a framework that can support them to analyse and improve their administrative
processes. Staff noted in the pre-interviews that they would welcome a documented
WRC process that could be applied consistently across the five Faculties and Wits Plus
addressing the needs of all the stakeholders. It would be beneficial to have all processes
clearly defined and visible, as it will assist the staff to know what to do. The pre-
interviews established that the staff had not used process maps as a method to analyse
and improve their processes.

92 | P a g e
4.4.3 Workshop Findings
As a reminder to the reader, the findings compiled from the workshop are graded in
the following four categories illustrated below in Table 12.
Table 12: Grading Criteria and Description of the Grading Categories
Grading Category Description Average Grading Level
Not useful The tool/practice is not found to be useful
by the participants when analysing and
improving a process. After an explanation, it
is seen to be complicated and not a
tool/practice that will be readily used. The
answer to the tool/practice is graded below
a 25% level.
1.0
Partially Useful The tool/practice is found to be partially
useful when analysing a process. Most
participants indicate that they will not
readily use the tool/practice to analyse a
process and the answer to the tool/practice
is graded below 50%.
2.0
Useful The tool/practice is found to be useful.
Participants agree that it analyses a process,
identifies areas and opportunities to
improve but there are however some
limitations. The answer to the tool/practice
is graded below 75%.
3.0
Most Useful The tool/practice is found to be most useful.
Participants agree that it analyses a process,
identifies areas, and opportunities to
improve and they will use this tool/practice
to support them. The answer to this
tool/practice places it above the 75%
grading level.
4.0

93 | P a g e
4.4.3.1 Findings - Value Stream Mapping (VMS)
Participants experimented with Value Stream Mapping. By using the WRC process, they
discussed the current state of the process and looked at ways of improving the current
processes by compiling a new future state. Duplicated steps creating waste were
identified in the process and an improvement plan going forward was identified. The
tool was verbally graded at 3.0 as illustrated in Table 13 below.
Table 13: Scoring Matrix Findings: Value Stream Mapping
Grading Category Average Grading Participants’ Grade
Not Useful 1.0
Partially Useful 2.0
Useful 3.0 3.0
Most Useful 4.0
The workshop participants noted that they found the value stream mapping tool useful
to map process. It supported them in understanding the process better. They were able
to analyse the process and to identify areas of improvement and duplicated processes
that created waste. The tool made it easy to identify an improvement plan and can be
used to analyse other processes within their offices to improve other processes.
Participants found the tool valuable, interrogating a process to create value flow, and
remove waste. The following verbal comments were made: ‘Value stream mapping
interrogates our process’; ‘so used to just do what we do’; ‘quite valuable’; ‘you can
determine a value stream’;’ there is some duplication’; ‘interrogates a process’; ‘next to
DMAIC’. Participants further commented that deciding to use VSM as a tool to analyse

94 | P a g e
processes within their offices will be a big undertaking and they favored using the ‘Six
Honest Serving Men’ and DMAIC more. Participants did however conclude with
commenting that they would use VSM as a separate exercise especially in cases where
process maps must be drawn up when they have complex processes that need to be
analysed.
4.4.3.2 Findings – DMAIC
Participants experimented next with the DMAIC. By using the steps that are found in
the DMAIC (Define, Measure, Analyse, Improve, and Control) the workshop
participants looked at each leg of the process. Participants verbally graded the tool at
the end of the workshop to fall in the useful category giving it a score of 3.0 as indicated
in Table 14 below.
Table 14: Scoring Matrix Findings: DMAIC
Grading Category Average Grading Participants Grade
Not Useful 1.0
Partially Useful 2.0
Useful 3.0 3.0
Most Useful 4.0

95 | P a g e
Participants engaged with each of the DMAIC steps and used them to answer the
questions on how the current WRC process is working and how it should be working.
They enjoyed using the different steps analysing the WRC process and noted that there
can be value in using these steps to draw up other processes maps within their offices.
Participants found DMAIC to be thought-provoking, bearing in mind the impact a
process has on a student. For them, DMAIC interrogates a process, identifies areas of
waste and duplication, and creates awareness of parts of the process not thought of
before. Participants made the following verbal comments: ‘don’ t see as a map but it
makes you think’; ‘makes you define your process’; ‘it includes the student experience’;
‘will use both tools DMAIC and Six Men’; ‘think of the experience of the customer’; ‘very
specific’; ‘makes you think about your stakeholders”; ‘insight into so many elements’;
‘makes you think about what you want to change’.
4.4.3.3 Findings – PDCA
Following the DMAIC participants used the steps of the PDCA which is quite similar to
the steps used in DMAIC. Though experimenting with the PDCA participants scored the
PDCA at 2.0 partially useful shown in Table 15.
Table 15: Scoring Matrix Findings: PDCA
Grading Category Average Grading Participants Grade
Not Useful 1.0
Partially Useful 2.0 2.0
Useful 3.0
Most Useful 4.0

96 | P a g e
Participants found the PDCA to be a useful problem-solving method, drilling down into
a process. They noted that the PDCA allows for teamwork, standardisation of a process
highlighting the problem areas. In using the PDCA they also became more aware that
they operated in silos from one another and there is a need to standardise processes
across faculties. The following verbal comments were made: ‘duplication’;‘similar to
DMAIC’; ‘makes you drill down’. Although useful method participants felt that the PDCA
had shortcomings and if given a choice they would rather make use of the DMAIC steps.
If PDCA had been used before the DMAIC, it could perhaps have had a higher score and
a different outcome in the verbal responses.
4.4.3.4 Findings – ‘Six Honest Serving Men’
Participants experimented next with the ‘Six Honest Serving Men’ and scored this
framework at 4.0 placing it in the Most useful category as shown in Table 16.
Table 16: Scoring Matrix Findings: ‘Six Honest Serving Men’
Grading Category Average Grading Participants Grade
Not Useful 1.0
Partially Useful 2.0
Useful 3.0
Most Useful 4.0 4.0

97 | P a g e
Participants found this framework easy to use, asking straightforward and practical
questions and noted that asking these six questions would be the first thing they would
do in the future when they have to analyse a process. Participants noted that the
framework focusses on key questions, clarifies roles and responsibilities sparking the
thought process before drilling into the more difficult issues. The six questions go to
the core of what should be focused on while giving insight into elements not thought
off before in a process. The ‘Six Honest Serving Men’ also made participants reflect on
the importance of training and succession planning that are key elements not thought
of when using the other Lean orientated tools and practices. Verbal comments noted
from the participants were: ‘the six men are going to solve all our problems’; ‘first plot
a process’; ‘before you map use six men to talk about the process’; ‘easiest to
remember’; ‘six men are going to be the one to solve all our problems’; ‘straight
forward’; ‘map what is on your table’; ‘ask the correct and practical questions’.
Participants noted that they would like to use the ‘Six Honest Serving Men’ to start the
brainstorming session and then to combine it with DMAIC to make for a rich, complete
way to analyse a process.
4.4.3.5 Findings - Fishbone Diagram
The Fishbone diagram was the last tool that was suggested to the participants to
experiment with. Participants did not want to engage with the diagram and therefore
the tool was graded in this particular case at 1.0 as illustrated in Table 17.
Table 17: Scoring Matrix Findings: Fishbone Diagram
Grading Category Average Grading Participants Grade
Not Useful 1.0 1.0
Partially Useful 2.0
Useful 3.0
Most Useful 4.0

98 | P a g e
Participants noted that they did not see the Fishbone diagram as a useful tool when it
came to analysing a process. One comment made by a participant was ‘I don’t
understand that tool’. It should be stressed that participants were tired at this stage of
the Workshop and that their lack of engagement with the tool and the score is not
necessarily reflective of the tool’s function and value.
4.4.3.6 Summary of the Workshop Findings
The various Lean orientated tools and practices given to the participants at the
workshop attracted valuable discussions with each tool sparking a different
conversation and ideas. Specific Lean orientated tools and practices lead to specific
questions perhaps not asked or even thought off when using another tool. Participants
noted some duplication amongst the various Lean orientated tools and practices but
still found each one different and useful. Thoughts around how well service
departments are doing their jobs, and how differently the offices operate from one
another were established quite early in the workshop with the stakeholders noting that
they work in silos, sometimes looking for reasons not to work together. Concerns were
raised around current processes and how insufficient they can be especially processes
that are completed at the beginning of the year when everyone functions under
pressure. The brainstorming session at the start of the workshop was most useful and
participants felt that the exercise got the thought process going and recommended
doing it before mapping any process. It was stressed that process maps need to involve
every staff member of a department or Faculty Office and it was suggested that
departments and Faculties might want to include the mapping of processes in strategic
planning sessions to start the process.

99 | P a g e
Participants noted that they would use and recommend the steps used in the ‘Six
Honest Serving Men’, DMAIC and Value Stream Mapping for a framework. They
suggested that they would use the framework of the ‘Six Honest Serving Men’, asking
the six questions at the beginning of the exercise to get the thought process going. After
using the six questions to brainstorm, the steps of DMAIC would be used to analyse the
process and from which detailed process maps will be drawn. It was felt that there is
value in using these together suggesting them in a combination for a new framework
and to use in higher education institutions.
Bonaccorsi et al. (2011) note that due to the differences in the manufacturing and the
service industries Lean concepts often must be reinterpreted or redefined in an
appropriate way, which is confirmed in the present study.
In conclusion, it is clear from the comments that the staff enjoyed the interaction with
the Lean orientated tools and practices, with lively discussion taking place when
drawing up the process flow diagrams of the WRC process. Table 18 shows a summary
of the workshop findings gathered from each Lean orientated tool and practice.

100 | P a g e
Table 18: Summary of the Workshop Findings of the Lean Orientated Tools and Practices
Six Honest Serving
Men
DMAIC VSM PDCA The Fishbone
Diagram
Highest scoring Lean
orientated practice
in the ‘well
understood’
category
Very good
interaction with
DMAIC, easy to
understand
Third-highest
scoring tool.
Lower participation
rate not the same as
enthusiasm expressed
when using the other
Lean orientated tools
and practices
Little interaction
.
Evoked lively
discussions
Will make use of
DMAIC when
analysing processes
within their offices.
VSM was easy to
understand although
lengthy.
A useful tool to solve
problems
No visual attraction
Goes to the root of
the work process
Thought-provoking You need to be clear
on your desired
outcome when using
this tool.
Enjoyed DMAIC more
and if given a choice,
would rather use
DMAIC before using the
PDCA.
Asks precise and
clear questions
Takes office process
into consideration
The tool interrogates
and questions all
parts of a process.
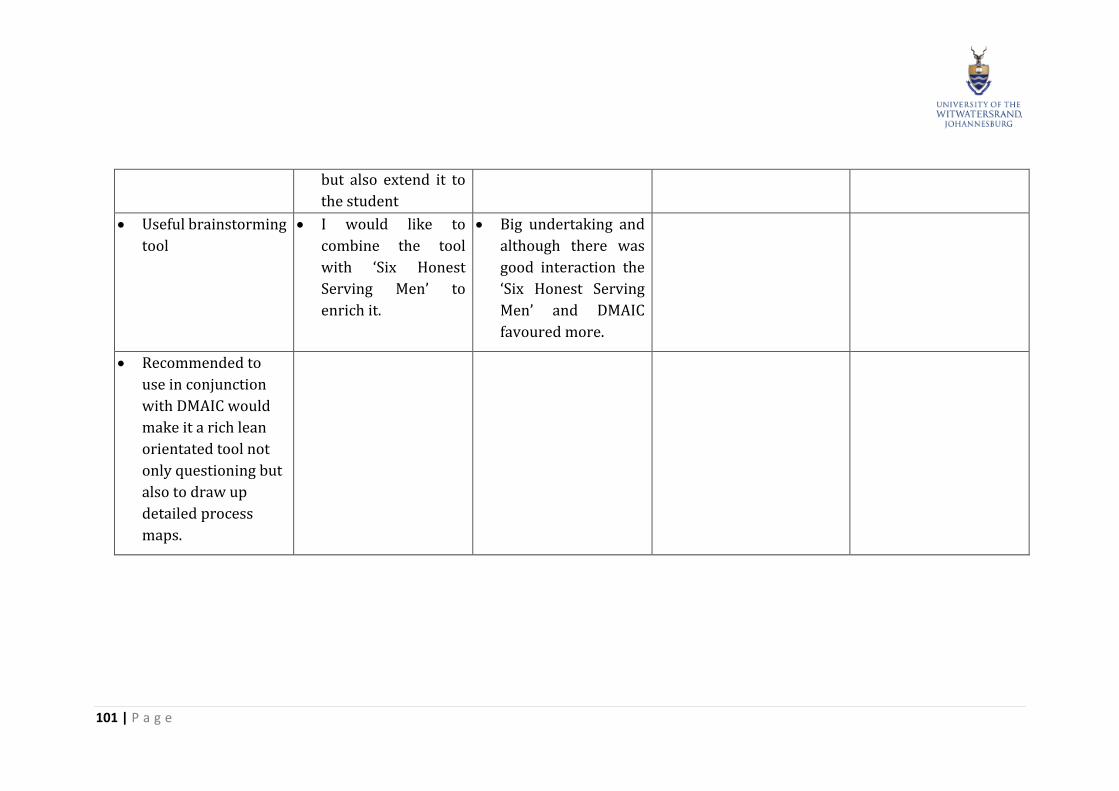
101 | P a g e
but also extend it to
the student
Useful brainstorming
tool
I would like to
combine the tool
with ‘Six Honest
Serving Men’ to
enrich it.
Big undertaking and
although there was
good interaction the
‘Six Honest Serving
Men’ and DMAIC
favoured more.
Recommended to
use in conjunction
with DMAIC would
make it a rich lean
orientated tool not
only questioning but
also to draw up
detailed process
maps.

102 | P a g e
4.4.3.7 Combined Average Grading of all the Lean Orientated Tools and Practices
All the data gathered on all the Lean orientated practices used by the participants at
the workshop are shown in Figure 21: Comparative Grading of all the Lean orientated
tools and practices.
Figure 21: Comparative Grading of all Lean Orientated Tools and Practices
From this graphical illustration, the three Lean orientated tools and practices that
participants found would be useful and most useful to them to use when analysing a
process to improve it were:
1. Value Stream Mapping, scoring a 3 and placing it in the ‘useful’ grading category;
2. DMAIC also scoring a 3 placing it in the ‘useful’ grading category;
3. ‘Six Honest Serving Men’ 4 and placing it also in the ‘most useful’ grading
category.
Value Stream Mapping, DMAIC, and the Six Honest Serving Men will be recommended
for a Process Flow Framework that will be discussed in Chapter 5.
1
2
3 3
4
VALUE STREAM MAPPING
DMAIC PDCA HONEST SIX SERVING MEN
FISHBONE
Grading of all Lean orientated tools and practices
Not Useful Partially Useful Useful Most Useful

103 | P a g e
4.4.4 Post-Interview Findings
The Post-Interviews the participants in the workshop made the following further
valuable observations:
(1.) Process maps identify deviations easily that can be addressed with the staff;
(2.) Visual presentations show duplication;
(3.) Seeing a process makes staff question the value of the process to see if it works;
(4.) The visual maps further assist with checking if a process is still valid and up to
date.
In closing the interview, Faculty A noted ‘It does not matter how small a process is you
need to map it’.
4.5 Conclusion
In closing, several reasons for selecting these Lean orientated tools and practices are
noted and it was hoped that staff could through practically using these Lean orientated
tools and practices, decide on one or more to use going forward to draw up process
maps within their working environments or even think of creating their process
mapping methodology. The workshop exercise, however, and the creation of process
maps brought to the foreground the importance of analysing processes to improve
them. Staff realized, through drawing up a process flow, that the value of having a
visible process is that it would be much easier to change or amend a process than when
you do not have a process map of the particular process. Staff confirmed in the post-
interviews that DMAIC, Six Honest Serving Men, and Value Stream Mapping remained
their three preferred Lean orientated tools and practices noting again that a
combination of DMAIC and Six Honest Serving Men should be used. Bicheno and
Holweg (2016) note that when you take Lean out of its context it is required that you
adapt it. This is seen to be true from these discussions when proposing a mixture of the
DMAIC and Six Honest Serving Men.

104 | P a g e
Chapter 5: Discussion
5.1. Introduction
The purpose of this chapter is to discuss the findings that were presented in Chapter 4
and to establish which Lean orientated tools and practices Wits Plus, the Faculties, and
other service departments would use to support them to analyse and improve their
administrative processes and propose to be placed in a Wits Process Flow Framework.
5.2 Discussion of each Lean Orientated Tool and Practice
The Lean Orientated Tools and Practices will be discussed in this section according to
the ratings they received from the Workshop.
5.2.1 Discussion: ‘Six Honest Serving Men’
Gould (2018) notes that the ‘Six Honest Serving Men’ is a powerful set of questions. The
framework clarifies roles and responsibilities and questions what task should be
focused on and why.
In the Workshop, the six questions triggered the most comment from all the
participants and were found to be the most useful by all the participants. This was not
a surprise as participants interacted best with this practice, and felt that it went to the
root of the work that they do, asking precise and clear questions. Participants noted
that the framework makes you think of key questions to ask when completing a task
including where the process belongs. It gives insight into many other elements not
thought off before and it is a good starting point to get the thought process going before
drilling into the more difficult issues. Gould (2018) and McDonald (2010) note that the
framework analyses a process while recognising the importance of questioning and

105 | P a g e
focusing on role clarity. The framework focusses on gaps in skills and training within a
workforce and assists in building self-awareness.
The ‘Six Honest Serving Men’ is seen as a useful brainstorming exercise and it was
recommended that it should be used in conjunction with DMAIC, as that would make it
a rich Lean orientated practice not only questioning but also creating detailed process
maps. This finding supported a similar finding from Leite and Vieira (2015) who noted
that Lean does not have a single model of tools or practices that is the best for services,
but a mix of tools or practices must be used that can best serve an operation.
5.2.2 Discussion: DMAIC
Snee (2007) notes that DMAIC has been created to act as a general problem solving
and process improvement framework and it is an easy method to evaluate processes.
When the DMAIC steps are merged into organisation problem and improvement
activities, the cultural benefits increase as staff start to think differently, not only about
the work, but the way things are done (Snee, 2007). DMAIC received a score of 3.0 and
was rated as a useful method to assist with the analysing and improvement of
processes. Participants in the Workshop noted that DMAIC interrogates a process,
noting which part of a process needs to be adapted, it shows the duplication of
processes and creates awareness into parts of a process not thought of before.
Participants also noted that structure is provided when using DMAIC and there is a
focus on the student and not only the process.
Bicheno and Holweg (2016) note that DMAIC can be used for the smallest process
change as well as at various levels e.g. policy deployment, organisational change, and
training. De Mast and Lokkerbol (2012) note that DMAIC is an approach to solving a
problem having similar functions to the PDCA.
106 | P a g e
5.2.3 Discussion: Value Stream Mapping
Participants found the concept of using process flows and drawing flows to analyse and
streamline a process as useful. The VSM received a score of 3.0 similar to the DMAIC.
Cudney (2018) notes that the advantage of Value Stream Mapping is that it requires
participants to understand the bigger picture, delivering a process that is of value,
mapping what needs to be done before looking at an improvement strategy.
Participants found that VSM interrogates all parts of a process, and a department needs
to be clear on an outcome when using this tool. Lian and Van Landeghem (2002) note
the following advantages when using VSM in that it is a visual representation of all
activities, identifying value-adding steps, therefore, leading to continuous
improvement, striving for perfection. It leads to knowing the customer and what they
want and value. Participants in the workshop noted that VSM creates a visual flow of a
process and breaks processes down into organised steps that allows for future
planning. Bonaccorsi et al. (2011) state that VSM enhances service performance by
identifying and tackling criticalities; it is the preferred way to plan and implement
change.
5.2.4 Discussion: PDCA
Soković (2010) notes that the purpose of PDCA is to improve processes, and according
to Gupta (2006), it plays an important role in quality management. It teaches an
institution how to plan, do, and check to see if it conforms and acts on what has been
learned (Johnson, 2002). Participants scored the PDCA at 2.0 in the partially useful
category. The reason for this was not because it was not useful, but the participants
found that it was similar to DMAIC and rather preferred using DMAIC than the PDCA.
Bicheno and Holweg (2016) note that PDCA and DMAIC cycles can be used for the
smallest process change and at various levels from Hoshin, Policy deployment,
organisational change, training to value stream implementation.

107 | P a g e
It should also be noted had the PDCA been used before the DMAIC, it could perhaps
have had a higher score and a different outcome.
5.2.5 Discussion: The Fishbone Diagram
Bilsel and Lin (2012) note that when a problem occurs, the cause of the problem should
be identified and fixed and the Fishbone diagram is a popular tool to help with this. The
Fishbone diagram was the tool the staff least interacted with. As noted in Chapter 4 the
Fishbone was the tool that the participants did not interact with due to it being last in
the Workshop programme, and that they were tired and just not interested in drawing
another process. One may think that the visual representation of a fish may attract
people to use and interact more with it, but this was seemingly not the case with this
group of participants. Another deduction from this can also be that the participants are
not interested in what causes a problem but that they have more interest in fixing the
problem, finding a solution, and making it work. There is more focus on addressing the
symptom and not the root cause.
5.3 Use of Lean Orientated Tools and Practices to Analyse and Improve Processes
These specific Lean orientated tools and practices were selected to make staff think
about the way they do things, to analyse a process, and to see how they can go about
improving their work. The aim of the research was however not to find the perfect
result with only one specific Lean orientated tool or practice but to have the exposure
to a variety of Lean orientated tools and practices to experience and learn from these,
to see the value that they can add and create within their working environment. It was,
therefore, preferable to give staff a choice of similar Lean orientated tools and practices.
108 | P a g e
Ultimately, one would like them to become accustomed to more of the Lean orientated
tools and practices so that they use them continuously to improve their work and to
find better ways of doing things.
5.4 Implications
The Lean orientated tools and practices were chosen to allow for employee
participation in drawing up process maps, taking their ideas and suggestions into
account, allowing them to make positive contributions to the change. In participating
in compiling process maps, understanding of processes was ensured as well as creating
awareness amongst staff of the reason for completing certain tasks.
Drawing up process maps is not just to the benefit of the service department but all the
stakeholders of the University, as it results in satisfied customers because there are
clearly defined processes. Kang and Manyonge (2014) note that Lean programmes can
have a significant impact on higher education. However, for institutions to do this,
change is required, and processes and practices need to be revised. There were several
reasons for selecting these Lean orientated tools and practices and it was hoped that
staff could, through practically experiencing these practices, decide on one or more to
use going forward in their working environments. The workshop exercise brought to
the foreground that processes and rules are in place but not consistently followed or
applied and that it is important to analyse and improve processes. Staff realised the
value of having a visible process and how much easier a process can be changed when
there is a visible flow.

109 | P a g e
5.5 Proposing a Wits Process Flow Framework
Balzer (2010) notes that in most universities, leaders do not always step back to have
a holistic view of all processes to discover the problems experienced by staff. There is
often no framework guiding them as to how a process can be changed or improved.
With a framework in place, there are opportunities to improve the method and tools as
well as evolving practices in the framework based upon further codification of best
practices. The framework is a means by which service departments should be able to
facilitate the improvement of each of their processes which can then lead to improved
service levels.
This research discovered the Lean orientated tools and practices that Faculties and
other service departments within the University would be able to utilise within their
offices to draw up process maps of their current or new processes with which to
analsye and improve their administrative processes to improve service levels, create
value and eliminate waste. By exposing staff to five Lean orientated tools and practices
to experiment with, they were allowed to experience first-hand the value of applying
Lean orientated tools and practices to their environment, to draw up a process map of
a process to get the best value from it, creating new process maps and in the same
instance deleting duplicated steps that create waste.
The research identified three Lean orientated tools and practices recommended for
constructing a Wits Process Flow Framework. These three tools are:
Six Honest Serving Men,
DMAIC,
Value Stream Map (VSM).
110 | P a g e
The three Lean orientated tools and practices are suggested in a Wits Process Flow
Framework (Refer to Annexure H). The framework suggests a process on how to use
these Lean orientated tools and practices to draw up process maps of new processes
or process changes. The following discussion will highlight how the framework would
work and could be used. It is hoped that this framework will create awareness amongst
staff and stakeholders and be used in staff training and succession planning sessions to
make staff aware of the importance of analyzing a process and how this can be done by
using process maps. The Wits Process Flow Framework will be recommended to the
broader University community, to assist service departments within the University to
draw up process maps to analyse and improve their administrative processes.

111 | P a g e
5.5.1 Wits Process Flow Framework: Step by Step Guide
The Wits process flow framework is a structured four-step approach with each step
having a specific focus and method to achieve the desired outcome. It is hoped that this
framework will assist service departments within the university to transform their
levels of service and inform managerial approaches when implementing and changing
processes within a service department. Figure 22 below is an illustration of the Wits
Process flow framework noting the four steps to follow when using this framework.
Figure 22: Wits Process Flow Framework

112 | P a g e
Figure 23: Wits Process Flow Framework Step by Step Guideline illustrates the four
steps a service department will follow when using this framework to either introduce
a new process within their department or when improving/changing a current process
within the department.
Figure 23: Wits Process Flow Framework: Step by Step Guideline
In the following section, a detailed breakdown is given for each of the four steps when
using this framework.

113 | P a g e
5.5.2 Wits Process Flow Framework – Breakdown of Each Step
The Head of a Faculty or Manager of a service department would identify a specific
process that needs improvement, or a new process that is being introduced, which will
need a plan of action as to how these new processes will be introduced. For this
planning and decision making it is suggested that use is made of the Six Honest Serving
Men. This Lean orientated practice requires the Manager to ask specific pertinent
questions before starting to map out how the process will be implemented or change
the current one. The Manager can decide on how the current or new process maps is to
be presented to staff regarding the steps that need to be followed in doing their daily
work. To draw up a process flow, it is recommended that the Manager make use of one
of the following Lean orientated tools and or practice namely:
(1.) Value Stream Mapping (VSM), or
(2.) DMAIC (Define, Measure, Analyse, Improve, and Control).
If the Manager decides to use DMAIC it would be recommended that the Manager first
with staff analyse the process for which the process maps needs to be drawn up, then
define the process and suggest improvements. Once the improvements have been
agreed upon the impact can be measured over an agreed period ensuring the desired
outcome is achieved.
STEP 1: PLAN

114 | P a g e
In this step, the Manager will convene a workshop, in which s/he will explain the
process that will be used to draw up the process maps. The Manager may want to use
at the start of the process the Honest Six Serving Men to get the thought process going.
Process maps will be drawn up by using either the VSM or DMAIC and for this part of
the framework, there will be a specific focus on the following legs of the VSM and
DMAIC:
If VSM is used: The current and future state and an implementation plan
If DMAIC is used: Define, Measure, Analyse and Improve
This step will happen after the workshop has taken place, refining, and finalising the
process maps that took place during the workshop. The maps will be shared with staff
for input and changes. The Maager may want to have a meeting or smaller (2-hour)
workshop to work through the maps and to agree and conclude on the new process
with all the stakeholders.
Once the processes map has been introduced into the daily work of the office it needs
to be monitored to see if it is assisting with the work processes to make them easier
and more efficient. It is recommended that this should be done every six months to a
year depending on the cycle of the process. If there are any changes or improvements,
the process maps will need to be amended accordingly and it may sometimes mean
that not the whole process is changing but only a part of it to make it efficient again.
STEP 2: DEVELOP AND SHARE
STEP 4: MONITOR AND IMPROVE
STEP 3: AGREE, REFINE AND IMPLEMENT

115 | P a g e
For this part of the framework, there will be a specific focus on the following legs of
VSM and DMAIC:
If VSM is used: Implementation and monitoring of the improvement plan
If DMAIC is used: Control, to ensure that the suggested plan or improvements
work
It is recommended that all process flow diagrams be revisited at least once a year to
ensure relevance.
5.6 Conclusion and Final Thoughts
In conclusion, the final thoughts from the participants were that the workshop was a
valuable exercise, especially regarding the deliberations that took place, the
information that was shared, working together as a collective, and learning from each
other. Although Wits Plus and the Faculties work differently, there is value in the
collective thinking about processes. There is always a need to rethink a process, before
falling into a rut of doing things and not taking time to consider other ways or
methodologies. It also started to create awareness of the various Lean orientated tools
and practices and the value these can add to the University. The three lean orientated
tools and practices the workshop participants found most useful in assisting them to
analyse and improve their administrative processes were included and proposed in a
Wits Process Flow framework.

116 | P a g e
Chapter 6: Conclusion and
Recommendations
6.1 Introduction
In this chapter, the Wits Process Flow Framework is presented as well as any further
recommendations for future research that may be undertaken.
6.2 Research Question and Objectives
The main research question is:
Which Lean orientated tools and practices can be recommended in a process flow
framework to support the analysing and improvement of administrative processes at
Wits?
The main objectives of the research as set out in Chapter 1 that was reached by the
completed research was:
1. To experiment with five Lean orientated tools and practices to analyse the
Wits Readmissions (WRC) process between Wits Plus and Faculty A to identify
improvement opportunities.
This objective was reached in Chapter 4 where the diagrams show how the WRC
process was analysed by using the various tools and practices and the improvement
plans that were drawn up from the exercises.
117 | P a g e
2. To evaluate the Lean orientated tools and practices to see which ones support
the analysing and improvement of processes;
This objective was reached in Chapter 4 and Chapter 5. Chapter 4 shows how the five
tools and practices were rated by the workshop participants in the grading categories
of most useful, useful, partially useful, and not useful. The findings were discussed in
more detail in Chapter 5.
3. To use the findings to develop and propose a Wits Process Flow Framework
that can be used to analyse and improve administrative processes at Wits. This
Lean orientated framework will be recommended for future use to all Wits
Faculties and service departments.
This objective was reached and discussed in Chapter 5. By using the findings of the
workshop Value Stream, DMAIC, and the Six Honest Serving Men were identified as
being the preferred Lean orientated tools and practices that would be used in the
future to support Wits staff to the analyse and improve their administrative
processes.
6.3 Shortcomings in the Findings of the Research
In the section below the author highlights some points which can be potential
shortcomings of the findings gathered and it is therefore important to note them as
they may have an impact on the findings.

118 | P a g e
6.3.1 Pre-Interviews
Semi-structured interviews undertaken with one staff member from both Wits Plus
and one from Faculty A may be a shortcoming. Other staff members from within Wits
Plus and Faculty A, as well as the other Faculties who participated in the workshop,
could have been interviewed. In excluding them, they may feel that they have been
disadvantaged as they were not able to state their views.
They may have had a different view of the Lean orientated tools and practices if they
were interviewed alone and not part of the group. The author, however, feels that they
were able to state their views during their participation in the workshop. Another
shortcoming in just choosing to interview one staff member from Wits Plus and Faculty
A could be that these staff know the author and that they did not want to disappoint
the author and therefore agreed to participate. The author however feels that the staff
had an opportunity before the interviews started to inform the author that they did not
want to participate as the question was posed to them by the author if they were
comfortable participating.
6.3.2 Sample Size
A small sample size of participants sharing similar characteristics was used in the
research, which was based on a purposive sampling method using a qualitative
methodology that works successfully with small sample sizes when participants share
similar characteristics. The researcher believes that the findings gathered from this
sample size are appropriate, although due to the small number of participants working
together in the workshop, they could have influenced one another concerning the
outcome of the findings of the tools. The staff interviewed are also the only staff that
currently deals with the WRC process in the Faculties and Wits Plus.

119 | P a g e
6.3.3 Tools
The fact that the staff did not interact with the same enthusiasm towards the Fishbone
Diagram as to the other tools could raise the question if participants got tired towards
the end and that there were perhaps too many tools for them to use in the session.
Workshop participants could have influenced one another; if one did not understand
the diagram the participant could have persuaded the others to display the same
hesitation to engage with the diagram. The researcher, however, believes that the
findings gathered for the Fishbone are correct and participants were allowed to
express their views and to engage with it. If the study is repeated and a different
sample size of participants chosen, or if the Fishbone Diagram is placed earlier in the
workshop, the result may be different. Participants also found DMAIC and PDCA similar
so if the study is repeated only one of these tools should be used or if both are used, the
PDCA could be introduced before the DMAIC to see if the outcome is different in that
the PDCA would be favoured more than the DMAIC.
6.3.4 Post-Interviews
Post-Interviews were undertaken with the same members of staff interviewed during
the pre-interview sessions. Other participants in the workshop were not part of the
post-interviews and might feel disadvantaged for not being part of these post-
interviews and thereby given a chance to justify their preferences of Lean orientated
tools and practices. The author, however, feels that all participants engaged in the
discussions during the workshop and did make use of the opportunity to express their
views and justify their choice of them. The author is however aware that she could have
swayed the decisions made by the group and that they may not have wanted to admit
that a Lean orientated tool or practice did not work and disappoint the author. The
author, however, feels that the participants used the opportunity at the end of the
workshop to express their views as participants noted that they think using five Lean
orientated tools and practices at one workshop was ambitious.

120 | P a g e
6.4 Further Future Recommendations
The researcher would like to make the following recommendations for future research
in this regard:
If a similar study were repeated, it would be suggested that a different
participant sample be included in the research as far as size and levels of
employments are concerned as this can refine the findings of the Lean
orientated tools and practices.
That with a similar study, the possibility of using fewer Lean orientated tools
and practices can be explored or even only one Lean orientated tool and or
practice.
That in a similar study, more participants from different backgrounds can be
included as different minds can change the outcome of the findings concerning
which Lean orientated tools and practices are preferred.
That with a similar study participants can be divided into two groups to see if
there may be a different outcome concerning the Lean orientated tools and
practices that they prefer.
That a similar study can make use of a scoring matrix that the staff can complete
during the workshop.
If the Fishbone diagram is used, it may be valuable to include the services of a
postgraduate student, a professional industrial engineer, or business analyst to
facilitate digging deeper into the root causes of a specific process.
If both the PDCA and DMAIC are used, the PDCA could be used before DMAIC to
see if there would be a different result.
A follow-up study should happen within six months to see if the framework is
being used.
In a future workshop, time should be spent discussing and exploring the
principles of Lean
Root cause analysis should be included in a future workshop.

121 | P a g e
6.5 Conclusion and Final Thoughts
Five Lean orientated tools and practices were identified and workshopped with Wits
Plus and Faculties to answer the main objective of the research question, namely which
Lean orientated tools and practices can be recommended in a process flow framework
to support the analysing and improvement of administrative processes at Wits. The
Wits Readmissions (WRC) process was used to identify improvement opportunities
and three Lean orientated tools and practices, Six Honest Serving Men, DMAIC, and
Value Stream Mapping were identified as the preferred tools to use to develop a
process flow framework. Other findings indicated a gap in the knowledge amongst staff
about Lean orientated tools and practices and the value they can add to analyse and
improve processes. The interviews confirmed that the staff felt that they are working
in silos, getting a job done without consideration as to how it is done. The workshop
and interviews confirmed the limited role Wits Plus plays when dealing with their
students’ processes affecting them and the Faculties they work with. Due to this, their
students are not always getting the same opportunities as other students, or the part-
time students get more opportunities than is afforded to full-time students. Silos need
to be broken down between the different departments, wherein staff need to work
together to foster collaboration and improve overall performance. Efforts on
improving processes need to involve the entire University.
The study concluded that many administrative processes within Faculties at Wits are
not formally written down and staff are reliant on the experience and memories of
colleagues who have been at the University for many years. There needs to be visible
strategic leadership when processes need to be changed and this requires proactive
leadership from managers to take responsibility for their management roles and
engage their teams in looking for ways to improve service levels. There need to be
common goals to improve service standards, implementing and adhering to specified
service levels that can enable the integration of various departments by ensuring
dynamic and uniform information and process maps.

122 | P a g e
There needs to be a focus on front-end service delivery and more use should be made
of technology to play a role in facilitating information flows through improved data
sharing and collaboration.
As was noted at the beginning of this research the aim was not to implement Lean. If
Lean is to be implemented there needs to be proactive change strategies driven by the
Leadership of the University to change the environment. Staff need to be trained to
understand what will be expected of them with open communication from managers
sharing information and encouraging staff. Progress will need to be monitored, and
staff will have to feel that they can participate in the Lean change, that they will be
empowered to make the required changes, and that they will receive recognition for
bringing about change. Wits is not at this point yet but there is no reason not to find
ways in which Lean practices can be used at Wits to start to support the process.
In conclusion, Lean orientated tools and practices can provide a vehicle for developing
process maps that staff can comfortably use to analyse and improve their
administrative processes. Klotz et al. (2008) note that process mapping enables the
representation of business processes and that maps allow for the visualisation and
controlling activities of an organisation. According to them, the visibility increases
transparency or process visibility. It is therefore anticipated that process maps create
awareness and visibility support the streamlining of services within the University. It
can also form part of departments and Faculties’ standard operating procedures, staff
induction, and training.

123 | P a g e
Service departments at Wits are sometimes reluctant to adapt to change. There is,
however, value to be seen when Lean orientated tools and practices are introduced,
and it is worth our while to consider Lean techniques to improve service levels within
the service departments at Wits. There may still be a long way to go but there is a need
to make staff aware of Lean methodologies and the value that it can bring to a system.
It may be the right time to start thinking differently about processes, the way things are
done, and not always complaining that a process is not working.
In the words of Henry Ford ‘Don’t find fault, find a remedy’ (Ford, 2016).

124 | P a g e
7. References
Abawi, K., 2008. Qualitative and quantitative research. World Health.
Alshenqeeti, H., 2014. Interviewing as a data collection method: A critical review. English
Linguistics Research, 3(1), pp.39-45.
Ambekar, S., 2016. Exploring the application of lean principles to management education
in India. EXCEL International Journal of Multidisciplinary Management Studies, 6(6), pp.1-
13.
Antony, J., Krishan, N., Cullen, D. and Kumar, M., 2012. Lean Six Sigma for higher education
institutions (HEIs). International Journal of Productivity and Performance Management.
Antony, J., 2014. Readiness factors for the Lean Six Sigma journey in the higher education
sector. International Journal of Productivity and Performance Management, 63(2), pp.257-
264.
Asnan, R., Nordin, N. and Othman, S.N., 2015. Managing change on lean implementation in
service sector. Procedia-Social and Behavioral Sciences, 211, pp.313-319.
Atkinson, P., 2004. Creating and implementing lean strategies. Management
Services, 48(2), p.18.

125 | P a g e
Ballé, M., Beauvallet, G., Smalley, A. and Sobek, D.K., 2006. The thinking production
system. Reflections, 7(2), pp.1-12.
Balzer, W.K., Francis, D.E., Krehbiel, T.C. and Shea, N., 2016. A review and perspective on
Lean in higher education. Quality Assurance in Education.
Balzer, W.K., 2010. Lean higher education: Increasing the value and performance of
university processes. Productivity Press.
Baysinger, G., 1997. Workshops: Advantages, Disadvantages and Considerations, accessed
2018, https://web.stanford.edu/group/swain/cinf/workshop97jun/wrkshpadvdis.html
Beckers, D.K., 2015. Reducing waste in administrative services with lean
principles (Master's thesis, University of Twente).
Bendall, F. and Marra, T., 2005. Six Sigma Black Belts: What Do They Need to Know. Journal
of Quality Technology (Vol. 33, No 4).
Bhatia, N. and Drew, J., 2006. Applying lean production to the public sector. The McKinsey
Quarterly, 3(1), pp.97-98.
Bicheno, J. and Holweg, M., 2016. The lean toolbox: A handbook for lean transformation.
Buckingham: Picsie Books, p.1.

126 | P a g e
Bilsel, R.U. and Lin, D.K., 2012. Ishikawa cause and effect diagrams using capture recapture
techniques. Quality Technology & Quantitative Management, 9(2), pp.137-152.
Björnfot, A., Bildsten, L., Erikshammar, J., Haller, M. and Simonsson, P., 2011, July. Lessons
learned from successful value stream mapping (VSM). In 19Th Annual Conference Of The
International Group For Lean Construction, Lima.
Bonaccorsi, A., Carmignani, G. and Zammori, F., 2011. Service value stream management
(SVSM): developing lean thinking in the service industry. Journal of Service Science and
Management, 4(04), p.428.
Brochado, A., 2009. Comparing alternative instruments to measure service quality in
higher education. Quality Assurance in education.
Carter, N., Bryant-Lukosius, D., DiCenso, A., Blythe, J. and Neville, A.J., 2014, September. The
use of triangulation in qualitative research. In Oncology nursing forum (Vol. 41, No. 5).
Cohen, L., Manion, L., Morrison, K. and Morrison, R.B., 2007. Research methods in
education” Routledge.
Comm, C.L. and Mathaisel, D.F., 2005. A case study in applying lean sustainability concepts
to universities. International Journal of Sustainability in Higher Education, 6(2), pp.134-
146.
Comm, C.L. and Mathaisel, D.F., 2005. An exploratory study of best lean sustainability
practices in higher education. Quality Assurance in Education, 13(3), pp.227-240.

127 | P a g e
Comm, C.L. and Mathaisel, D.F., 2003. Less is more: a framework for a sustainable
university. International Journal of Sustainability in Higher Education, 4(4), pp.314-323.
Corbett, S., 2007. Beyond manufacturing: The evolution of lean. The McKinsey Quarterly,
(3), p.96.
Cudney, E.A., 2018. Using Hoshin Kanri to improve the value stream. Productivity Press.
Dal Forno, A.J., Pereira, F.A., Forcellini, F.A. and Kipper, L.M., 2014. Value Stream Mapping:
a study about the problems and challenges found in the literature from the past 15 years
about application of Lean tools. The International Journal of Advanced Manufacturing
Technology, 72(5-8), pp.779-790.
De Jager, J. and Gbadamosi, G., 2010. Specific remedy for specific problem: measuring
service quality in South African higher education. Higher education, 60(3), pp.251-267.
De Mast, J. and Lokkerbol, J., 2012. An analysis of the Six Sigma DMAIC method from the
perspective of problem solving. International Journal of Production Economics, 139(2),
pp.604-614.
Dennis, A.R., 1996. Information exchange and use in small group decision making. Small
Group Research, 27(4), pp.532-550.
Dennis, P., 2017. Lean Production simplified: A plain-language guide to the world's most
powerful production system. Crc press.

128 | P a g e
Dickeson, R.C., 2010. Prioritizing academic programs and services: Reallocating resources
to achieve strategic balance, revised and updated. John Wiley & Sons.
Dörnyei, Z., 2007. Research Methods in Applied Linguistics: Quantitative. Qualitative and.
Emiliani, B., Kensington, C. and Most, U.S., 2005. Lean in higher education. Center for Lean
Business Management. Available at http://www. superfactory. com/articles/lean_higher_ed.
aspx.
Etikan, I., Musa, S.A. and Alkassim, R.S., 2016. Comparison of convenience sampling and
purposive sampling. American journal of theoretical and applied statistics, 5(1), pp.1-4.
Francis, D., 2014. Lean and the learning organization in higher education. Canadian
Journal of Educational Administration and Policy, (157).
Ford, H., 2016. Don’t find fault, find a remedy.
Ganguly, K., 2012. Improvement process for rolling mill through the DMAIC six sigma
approach. International Journal for quality research, 6(3), pp.221-231.
George, M.L., 2003. How to use lean speed and Six Sigma quality to improve services and
transactions.

129 | P a g e
Gould, P., 2018. Quality is King. Using ‘Six Honest Serving Men’ as a problem analysis tool,
accessed 28 May 2019,
https://qualityisking.co.uk/2018/03/using-six-honest-serving-men-as-a-problem-
analysis-tool/
Gupta, Praveen. "Beyond PDCA-A new process management model." Quality progress 39,
no. 7 (2006): 45.
Hines, P. and Lethbridge, S., 2008. New development: creating a lean university. Public
Money and Management, 28(1), pp.53-56.
Houston, D., 2008. Rethinking quality and improvement in higher education. Quality
Assurance in Education.
Huntzinger, J., 2002. The roots of Lean. Training Within Industry: The origin of Kaizen.
Association for Manufacturing Excellence, 18, No. 2.
Ilie, G. and Ciocoiu, C.N., 2010. Application of fishbone diagram to determine the risk of an
event with multiple causes. Management Research and Practice, 2(1), pp.1-20.
Jansen, J., 2018. Political parties don’t give a dam about the future of education, accessed
June 2018,
https://www.timeslive.co.za/ideas/2018-01-18-political-parties-dont-give-a-damn-
about-the-future-of-education/
130 | P a g e
Johnson, C.N., 2002. The benefits fo PDCA. Quality Progress, 35(5), p.120.
Jørgensen, F., Matthiesen, R., Nielsen, J. and Johansen, J., 2007. Lean maturity, lean
sustainability. In Advances in production management systems (pp. 371-378). Springer,
Boston, MA.
Kang, P. and Manyonge, L., 2014. Exploration of lean principals in higher educational
institutes–based on degree of implementation and indigence.
Klotz, L., Horman, M., Bi, H.H. and Bechtel, J., 2008. The impact of process mapping on
transparency. International Journal of Productivity and Performance Management, 57(8),
pp.623-636.
Kothari, C.R., 2004. Research methodology: Methods and techniques. New Age International.
Laerd, Purposive sampling, accessed 16 November 2018,
http://dissertation.laerd.com/purposive-sampling.php
Leite, H.D.R. and Vieira, G.E., 2015. Lean philosophy and its applications in the service
industry: a review of the current knowledge. Production, 25(3), pp.529-541.
Lian, Y.H. and Van Landeghem, H., 2002, October. An application of simulation and value
stream mapping in lean manufacturing. In Proceedings 14th European Simulation
Symposium (pp. 1-8). c) SCS Europe BVBA.

131 | P a g e
Lynch, D.P., Bertolino, S. and Cloutier, E., 2003. How to scope DMAIC projects. Quality
progress, 36(1), pp.37-41.
McDaniel, M.A., Whetzel, D.L., Schmidt, F.L. and Maurer, S.D., 1994. The validity of
employment interviews: A comprehensive review and meta-analysis. Journal of applied
psychology, 79(4), p.599.
McDonald, P., 2010. Teaching the concept of management: Perspectives from ‘six honest
serving men’. Journal of Management & Organization, 16(5), pp.626-640.
McManus, H.L., Haggerty, A. and Murman, E., 2007. Lean engineering: a framework for
doing the right thing right. The aeronautical journal, 111(1116), pp.105-114.
Melton, T., 2005. The benefits of lean manufacturing: what lean thinking has to offer the
process industries. Chemical engineering research and design, 83(6), pp.662-673.
Moen, R. and Norman, C., 2006. Evolution of the PDCA cycle.
Netland, T.H. and Powell, D.J., 2017. A lean world. The Routledge Companion to Lean
Management. Routledge, New York.
Nightingale, D., 1999. Lean Enterprise Model.

132 | P a g e
Noble, H. and Smith, J., 2015. Issues of validity and reliability in qualitative
research. Evidence-based nursing, 18(2), pp.34-35.
Norris, N., 1997. Error, bias and validity in qualitative research. Educational action
research, 5(1), pp.172-176.
Oliveira-Brochado, A. and Marques, R.C., 2007. Comparing alternative instruments to
measure service quality in higher education (No. 258). Universidade do Porto, Faculdade de
Economia do Porto.
Olivia, n.d. Choosing an Interview Type for Qualitative Research, accessed 12 November
2018, https://www.statisticssolutions.com.
Ørngreen, R. and Levinsen, K., 2017. Workshops as a Research Methodology. Electronic
Journal of E-learning, 15(1), pp.70-81.
Patton, M.Q., 1999. Enhancing the quality and credibility of qualitative analysis. Health
services research, 34(5 Pt 2), p.1189.
Patton, M.Q., 2015. Qualitative Research, Encyclopedia of Statistics in Behavioral
Science.(Brian S. Everitt & David C. Howell, Eds.).(1633-1636).
Picarillo, A.P., 2018. Introduction to quality improvement tools for the clinician. Journal
of Perinatology, 38(7), p.929.

133 | P a g e
Radnor, Z. and Bucci, G., 2011. Analysis of lean implementation in UK business schools and
universities. Association of Business Schools, London.
Radnor, Z., Walley, P., Stephens, A. and Bucci, G., 2006. Evaluation of the lean approach to
business management and its use in the public sector. Scottish Executive Social
Research, 20, pp.1-6.
Radnor, Z. and Walley, P., 2008. Learning to walk before we try to run: adapting lean for
the public sector. Public money and management, 28(1), pp.13-20.
Rahman, M.S., 2017. The Advantages and Disadvantages of Using Qualitative and
Quantitative Approaches and Methods in Language" Testing and Assessment" Research: A
Literature Review. Journal of Education and Learning, 6(1), pp.102-112.
Rother, M. and Shook, J., 2003. Learning to see: value stream mapping to add value and
eliminate muda. Lean Enterprise Institute.
Schroeder, R.G., Linderman, K., Liedtke, C. and Choo, A.S., 2009. Six Sigma: Definition and
underlying theory. Quality control and applied statistics, 54(5), pp.441-445.
Sehgal, S. and Kaushish, D., 2015. A State of art of review of DMAIC approach. International
Journal of Science and Research, 4(8), pp.450-452.
Seddon, J., O’Donovan, B. and Zokaei, K., 2011. Rethinking lean service. In Service Design
and Delivery (pp. 41-60). Springer, Boston, MA.

134 | P a g e
Snee, R.D., 2007. Use DMAIC to make improvement part of ‘the way we work’. Quality
Progress, 40(9), pp.52-54.
Snee, R.D., 2010. Lean Six Sigma–getting better all the time. International Journal of Lean
Six Sigma.
Sokovic, M., Pavletic, D. and Pipan, K.K., 2010. Quality improvement methodologies–PDCA
cycle, RADAR matrix, DMAIC and DFSS. Journal of achievements in materials and
manufacturing engineering, 43(1), pp.476-483.
Sufi, S., Nenadic, A., Silva, R., Duckles, B., Simera, I., de Beyer, J.A., Struthers, C., Nurmikko-
Fuller, T., Bellis, L., Miah, W. and Wilde, A., 2018. Ten simple rules for measuring the impact
of workshops.
Svensson, C., Baessa, M.A. and Bakhsh, M.M., 2013, September. Establishing a lean six sigma
program in higher education. First International Conference on LSS for Higher Education.
Tyagi, S., Cai, X., Yang, K. and Chambers, T., 2015. Lean tools and methods to support
efficient knowledge creation. International Journal of Information Management, 35(2),
pp.204-214.
Wilson, J., 2009. Directions to discovery. Industrial Engineer, 41(4), pp.38-43.

135 | P a g e
Witwatersrand, U. o. t., 2019. Faculty Rules and Syllabus of Faculty of Commerce, Law and
Management. Johannesburg: Wits University, accessed 01 June 2019,
https://www.wits.ac.za/students/
Worley, J.M. and Doolen, T.L., 2006. The role of communication and management support
in a lean manufacturing implementation. Management decision, 44(2), pp.228-245.
Zhou, B., 2016. Lean principles, practices, and impacts: a study on small and medium-sized
enterprises (SMEs). Annals of Operations Research, 241(1-2), pp.457-474.

136 | P a g e
8. Appendices
8.1 APPENDIX A
ETHICS APPROVAL CERTIFICATE
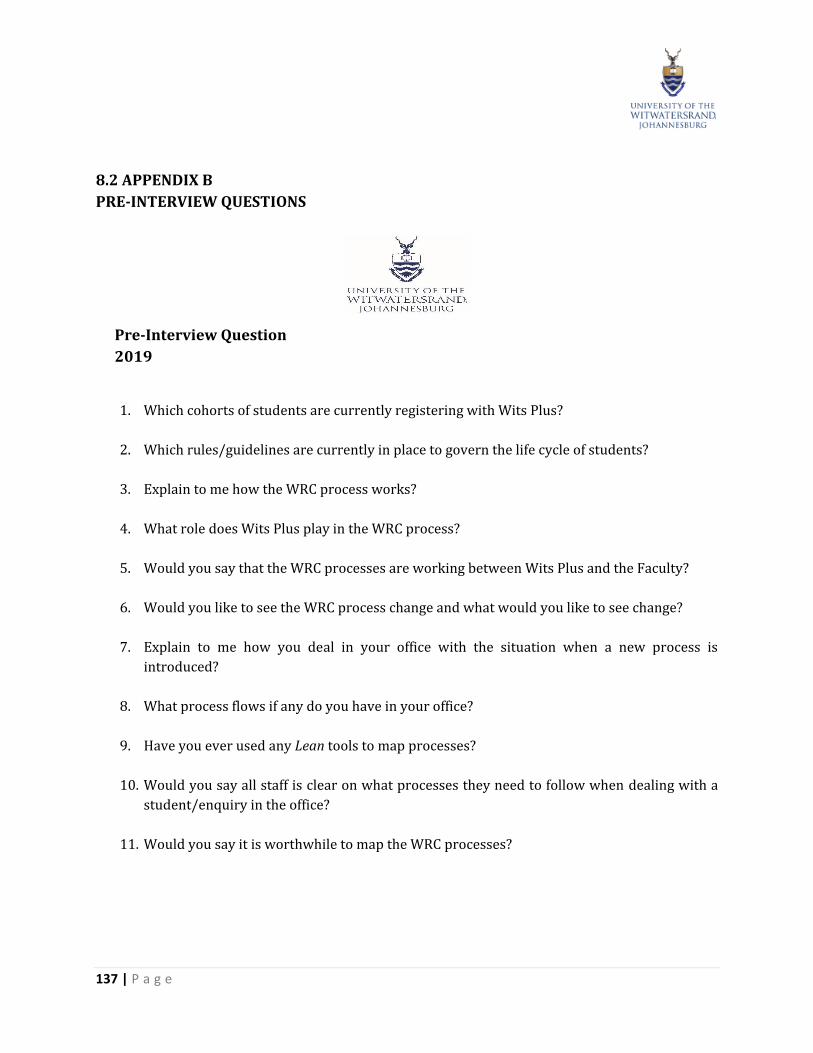
137 | P a g e
8.2 APPENDIX B
PRE-INTERVIEW QUESTIONS
Pre-Interview Question
2019
1. Which cohorts of students are currently registering with Wits Plus?
2. Which rules/guidelines are currently in place to govern the life cycle of students?
3. Explain to me how the WRC process works?
4. What role does Wits Plus play in the WRC process?
5. Would you say that the WRC processes are working between Wits Plus and the Faculty?
6. Would you like to see the WRC process change and what would you like to see change?
7. Explain to me how you deal in your office with the situation when a new process is
introduced?
8. What process flows if any do you have in your office?
9. Have you ever used any Lean tools to map processes?
10. Would you say all staff is clear on what processes they need to follow when dealing with a
student/enquiry in the office?
11. Would you say it is worthwhile to map the WRC processes?

138 | P a g e
8.3 APPENDIX C
POST-INTERVIEW QUESTIONS
Post-Interview Question
2019
1. Did you find the workshop useful?
2. Did you find the mapping of the process useful?
3. Looking at all the process flows which of the tools do you think can add most value?
4. Will you use Lean tools in any other of your processes?
5. Which of the Lean tools used at the workshop do you prefer most? Why?
6. Which of the Lean tools used at the workshop do you least prefer? Why?
7. Do you think it is useful to map processes and why?
8. Would you recommend to other administrative units to use these tools to map their
processes?

139 | P a g e
8.4 APPENDIX D
WORKSHOP AGENDA

140 | P a g e
8.5 APPENDIX E
WORKSHOP PRESENTATION

141 | P a g e
APPENDIX E – WORKSHOP PRESENTATION (CONTINUED)

142 | P a g e
APPENDIX E – WORKSHOP PRESENTATION (CONTINUED)

143 | P a g e
APPENDIX E – WORKSHOP PRESENTATION (CONTINUED)

144 | P a g e
APPENDIX E – WORKSHOP PRESENTATION (CONTINUED)

145 | P a g e
APPENDIX E – WORKSHOP PRESENTATION (CONTINUED)

146 | P a g e
APPENDIX E – WORKSHOP PRESENTATION (CONTINUED)

147 | P a g e
APPENDIX E – WORKSHOP PRESENTATION (CONTINUED)

148 | P a g e
APPENDIX E – WORKSHOP PRESENTATION (CONTINUED)

149 | P a g e
APPENDIX E – WORKSHOP PRESENTATION (CONTINUED)

150 | P a g e
APPENDIX E – WORKSHOP PRESENTATION (CONTINUED)

151 | P a g e
8.6 APPENDIX F:
WORKSHOP BRAINSTORMING NOTES

152 | P a g e
APPENDIX F: WORKSHOP BRAINSTORMING NOTES (CONTINUED)

153 | P a g e
APPENDIX F: WORKSHOP BRAINSTORMING NOTES (CONTINUED)

154 | P a g e
APPENDIX F: WORKSHOP BRAINSTORMING NOTES (CONTINUED)

155 | P a g e
APPENDIX F: WORKSHOP BRAINSTORMING NOTES (CONTINUED)

156 | P a g e
APPENDIX F: WORKSHOP BRAINSTORMING NOTES (CONTINUED)

157 | P a g e
APPENDIX F: WORKSHOP BRAINSTORMING NOTES (CONTINUED)

158 | P a g e
8.7 APPENDIX G:
WORKSHOP PROCESS MAPPING NOTES: VALUE STREAM MAPPING

159 | P a g e
APPENDIX G: WORKSHOP PROCESS MAPPING NOTES: VALUE STREAM MAPPING
(CONTINUED)

160 | P a g e
WORKSHOP PROCESS MAPPING NOTES: DMAIC (CONTINUED)
P

161 | P a g e
WORKSHOP PROCESS MAPPING NOTES: DMAIC (CONTINUED)

162 | P a g e
WORKSHOP PROCESS MAPPING NOTES: PDCA (CONTINUED)

163 | P a g e
WORKSHOP PROCESS MAPPING NOTES: ‘SIX HONST SERVING MEN’ (CONTINUED)

164 | P a g e
8.8 APPENDIX H: PROCEDURE DOCUMENT WITS PROCESS FLOW FRAMEWORK
______________________________________________________________________________________________________
PROCEDURE DOCUMENT
WITS FRAMEWORK TO IMPROVE SERVICE PROCESSES WITHIN THE UNIVERSITY
1. Background
The following four-step Wits Process Framework can be seen as general advice and can
serve as a guideline and starting point when service departments within the University
want to streamline and map their various service processes to improve service levels to
their students and other stakeholders. The framework is based on Lean methods as Lean
focusses on increasing efficiencies within processes by removing waste, and unwanted
steps. Melton (2005) notes that Lean is a revolution and it is changing the way people go
about their work creating continuous flow with a difference between ideas and the
development of processes.

165 | P a g e
2. Wits Process Flow Framework
The Wits process flow framework is structured into a four-step approach each with a
specific focus and method to achieve the desired outcome. It is hoped that this framework
will assist service departments within the university to transform their levels of service
and inform managerial approaches regarding the implementing and changing processes
within a service department. Figure 1 below is an illustration of the Wits Process flow
framework noting the four steps to follow when using this framework.
Figure 1: Wits Process Flow Framework

166 | P a g e
Figure 2 is an illustration of the four steps a service department will follow when using
this framework to either introduce a new process within their department or when
improving/changing a current process within the department.
Figure 2: Wits Process Flow Framework Step by Step Guideline
The Manager/ Head of a Faculty or Service department would identify a specific process
that will need improvement or in the case of a new process, being introduced will need to
decide on a plan of action as to how these new processes will be introduced or current
process changed. For this, planning and decision-making it is suggested that use is made
of the Six Honest Serving Men (refer to Figure 3 below). This tool requires the Manager or
STEP 1: PLAN

167 | P a g e
Head to ask specific pertinent questions before starting to map out how the process will
be implemented or change the current one.
There are six pertinent questions to be asked by the Manager or Head noted in the diagram
below:
Figure 3: ‘Six Honest Serving Men’

168 | P a g e
The Manager/ Head of the department can decide on how the current or new process
should be mapped for it to be clear to staff regarding the steps that need to be followed in
doing their daily work. To map a process it is recommended that the Manager make use
of one of the following Lean tools namely
(3.) Value Stream Mapping (VSM), or
(4.) DMAIC (Define, Measure, Analysed, Improve, and Control).
Figures 4 and 5 are the visual illustrations of these two process maps. To assist the
manager in deciding which tool to use a brief explanation is given on each tool as well as
the advantages and the disadvantages of using them. These advantages and disadvantages
are displayed in Tables 1 and 2.
2.1 Value Stream Mapping (VSM)
By using value stream maps, one has the opportunity of taking a process, looking at it
holistically, and finding ways to better the process, identifying and tackling serious issues.
It is a useful tool to identify all processes, value, or non-value ads. VSM maps both material
and information maps. It takes University policies and regulations into consideration
when processes maps are being drawn up.

169 | P a g e
Figure 4: Value Stream Mapping (VSM)
The following advantages and disadvantages are noted by Lian and Landeghem, 2002
when using VSM.

170 | P a g e
Table 1: Advantages and Disadvantages of a Value Stream Map
VSM is a valuable tool to continuously identify opportunities for improvement, adding
value, eliminating waste, and improving workflows.
Advantages of VSM Disadvantages of VSM
VSM is a visual representation of all
activities.
VSM records what happens on the floor that
can limit the level of detail.
A VSM identifies value-adding steps. A VSM can be complicated when there are too
many value streams.
A VSM identifies non-value adding steps. With a VSM, you cannot always see how it
translates into reality.
A VSM identifies gaps in processes. Limited knowledge about the tool.
Know your customer and what they value. Value stream mapping can be time-
consuming. With a VSM, there is continuous
improvement and striving for perfection.

171 | P a g e
2.2 DMAIC
The DMAIC cycle is a method of Lean Six Sigma that is an improvement approach to solving
problems. DMAIC improves efficiencies, quality, and to reduce costs. DMAIC may look to
be complex but once you get staff accustomed to using the DMAIC the more they will look
to find ways to improve the work that they do daily.
Figure 5: DMAIC

172 | P a g e
There are also certain advantages and disadvantages using DMAIC and these are
illustrated in Table 2.
Table 2: Advantages and Disadvantages of using the DMAIC method
Advantages of DMAIC Disadvantages of DMAIC
DMAIC provides structure to a process. DMAIC can be complex.
DMAIC reduces waste. DMAIC can be demanding.
DMAIC compliments Lean. DMAIC needs time and resources for
proper implementation.
DMAIC addresses a specific problem. DMAIC needs to look more at continuous
improvement.
DMAIC has a quality management
approach.
Every person needs to be clear on their role
when introducing this tool to improve
processes in an organisation.
DMAIC ensures that there is a focus on the
customer as well as the process.
There is not a specific roadmap/s.
DMAIC may look to be complex but once you get staff accustomed to using the DMAIC the
more they will look to find ways to improve the work that they do daily.

173 | P a g e
In this step, the Manager/ Head will convene a workshop. The Manager/ Head will explain
the tool that will be used to map the process. The Head/Manager may want to use at the
start of the process the Honest Six Serving Men to get as noted before the thought process
going. The process will then be mapped using either the VSM or DMAIC and for this part
of the framework, there will be a specific focus on the following legs of the tools:
If VSM is used: The current and future state and an implementation plan
If DMAIC is used: Define, Measure, Analyse and Improve
This step will happen after the workshop has taken place refining and finalising the
mapping that took place during the workshop. The maps will be shared with staff for input
and changes. The Head may want to have a meeting or smaller (2-hour) workshop to work
through the maps, to agree, and conclude on the new process with all the stakeholders.
STEP 2: DEVELOP AND SHARE
STEP 3: AGREE, REFINE AND IMPLEMENT

174 | P a g e
Once the processes map/s have been introduced into the daily work of the office it needs
to be monitored to see if it is assisting with the work processes to make them easier and
more efficient. It is recommended that this should be done every six months to a year
depending on the cycle of the particular process. If there are any changes or
improvements, the process maps will need to be amended accordingly and it may
sometimes mean that not the whole process is changing but only a part of it to make it
efficient again. For this part of the framework, there will be a specific focus on the
following legs of the tools:
If VSM is used: Implementation and monitoring of the improvement plan
If DMAIC is used: Control, to ensure that the suggested plan or improvements work
It is recommended that all process flow diagrams be revisited at least once a year to ensure
relevance.
Nicoleen Potgieter
2019
--------------------------------------------------------------- END-------------------------------------------------------
STEP 4: MONITOR AND IMPROVE