developing a mobile learning application for …1018544/fulltex… · ·...
TRANSCRIPT

Department of Science and Technology Institutionen för teknik och naturvetenskap Linköping University Linköpings universitet
gnipökrroN 47 106 nedewS ,gnipökrroN 47 106-ES
LiU-ITN-TEK-A-16/035--SE
Developing a Mobile LearningApplication for
Entrepreneurship Education inUganda and Zambia
Marcus Nygren
2016-08-26

LiU-ITN-TEK-A-16/035--SE
Developing a Mobile LearningApplication for
Entrepreneurship Education inUganda and Zambia
Examensarbete utfört i Medieteknikvid Tekniska högskolan vid
Linköpings universitet
Marcus Nygren
Handledare Lena TibellExaminator Camilla Forsell
Norrköping 2016-08-26

Upphovsrätt
Detta dokument hålls tillgängligt på Internet – eller dess framtida ersättare –under en längre tid från publiceringsdatum under förutsättning att inga extra-ordinära omständigheter uppstår.
Tillgång till dokumentet innebär tillstånd för var och en att läsa, ladda ner,skriva ut enstaka kopior för enskilt bruk och att använda det oförändrat förickekommersiell forskning och för undervisning. Överföring av upphovsrättenvid en senare tidpunkt kan inte upphäva detta tillstånd. All annan användning avdokumentet kräver upphovsmannens medgivande. För att garantera äktheten,säkerheten och tillgängligheten finns det lösningar av teknisk och administrativart.
Upphovsmannens ideella rätt innefattar rätt att bli nämnd som upphovsman iden omfattning som god sed kräver vid användning av dokumentet på ovanbeskrivna sätt samt skydd mot att dokumentet ändras eller presenteras i sådanform eller i sådant sammanhang som är kränkande för upphovsmannens litteräraeller konstnärliga anseende eller egenart.
För ytterligare information om Linköping University Electronic Press seförlagets hemsida http://www.ep.liu.se/
Copyright
The publishers will keep this document online on the Internet - or its possiblereplacement - for a considerable time from the date of publication barringexceptional circumstances.
The online availability of the document implies a permanent permission foranyone to read, to download, to print out single copies for your own use and touse it unchanged for any non-commercial research and educational purpose.Subsequent transfers of copyright cannot revoke this permission. All other usesof the document are conditional on the consent of the copyright owner. Thepublisher has taken technical and administrative measures to assure authenticity,security and accessibility.
According to intellectual property law the author has the right to bementioned when his/her work is accessed as described above and to be protectedagainst infringement.
For additional information about the Linköping University Electronic Pressand its procedures for publication and for assurance of document integrity,please refer to its WWW home page: http://www.ep.liu.se/
© Marcus Nygren

Institutionen för teknik ochnaturvetenskap
Department of Science and Technology
Examensarbete
Developing a Mobile Learning Application forEntrepreneurship Education in Uganda and Zambia
Examensarbete utfört i Medieteknikvid Tekniska högskolan vid Linköpings universitet
av
Marcus Nygren
LiTH-ITN-EX--16/NNNN--SE
Norrköping 2016
Department of Science and Technology Linköpings tekniska högskolaLinköpings universitet Linköpings universitet, Campus NorrköpingSE-601 74 Norrköping, Sweden 601 74 Norrköping


Developing a Mobile Learning Application forEntrepreneurship Education in Uganda and Zambia
Examensarbete utfört i Medieteknikvid Tekniska högskolan vid Linköpings universitet
av
Marcus Nygren
LiTH-ITN-EX--16/NNNN--SE
Handledare: Lena Tibellitn, Linköpings universitet
Iliana BjörlingYoungDrive
Examinator: Camilla Forsellitn, Linköpings universitet
Norrköping, 26 augusti 2016


Avdelning, InstitutionDivision, Department
Media and Information TechnologyDepartment of Science and TechnologySE-601 74 Norrköping
DatumDate
2016-08-26
SpråkLanguage
⇤ Svenska/Swedish
⇤ Engelska/English
⇤
⇥
RapporttypReport category
⇤ Licentiatavhandling
⇤ Examensarbete
⇤ C-uppsats
⇤ D-uppsats
⇤ Övrig rapport
⇤
⇥
URL för elektronisk version
http://urn.kb.se/resolve?urn=urn:nbn:se:liu:diva-XXXXX
ISBN
—
ISRN
LiTH-ITN-EX--16/NNNN--SE
Serietitel och serienummerTitle of series, numbering
ISSN
—
TitelTitle Developing a Mobile Learning Application for Entrepreneurship Education in Uganda and
Zambia
FörfattareAuthor
Marcus Nygren
SammanfattningAbstract
Entrepreneurship educations in developing countries have not yet been able to takeadvantage of digital tools. The Ugandian non-profit YoungDrive has 60 coaches teaching en-trepreneurship to 12 000 youth in rural areas. The coaches have a problem during and aftertheir education with assessing and improving their abilities to learn and teach entrepreneur-ship. The purpose of this study was to investigate how an app can be designed to addressthis issue.
Methods within service design, agile development and interaction design has been usedand combined to construct and analyse interviews, workshops, question sets, and app testswith the coaches in Uganda and Zambia. In total, three months were spent testing anditerating on low-detailed and high-detailed prototypes. The result is a launched hybrid appfor Android, iOS and web.
A formative test shows coaches are more reliably correct using an improved design ofmultiple-choice questions than a standard multiple-choice design. Interviews shows thecoaches has become more aware of what they know and do not know, and feels more con-fidence before their youth lesson with an increased quiz result. Further research shouldevaluate that the actual quality of the youth lesson improves.
Increasingly well-constructed multiple-choice questions with thoughtful feedbackcould stimulate creativity and problem-solving, deemed important by entrepreneurship ed-ucation research. After overcoming usability issues, the final app could reach both low andhigh-order learning objectives within entrepreneurship.
The app did seemingly improve the quality of entrepreneurship education for thecoaches in this specific developing world context. Further research should also investigatethe design and implications of a digital-only entrepreneurship education for the coaches,having in mind that the teacher is believed the main factor of entrepreneurship education.As of now, the app is an effective compliment and assistance to the physical training.
NyckelordKeywords entrepreneurship education, digital learning, mobile app, developing countries

Abstract
Entrepreneurship educations in developing countries have not yet been able totake advantage of digital tools. The Ugandian non-profit YoungDrive has 60coaches teaching entrepreneurship to 12 000 youth in rural areas. The coacheshave a problem during and after their education with assessing and improvingtheir abilities to learn and teach entrepreneurship. The purpose of this study wasto investigate how an app can be designed to address this issue.
Methods within service design, agile development and interaction design hasbeen used and combined to construct and analyse interviews, workshops, ques-tion sets, and app tests with the coaches in Uganda and Zambia. In total, threemonths were spent testing and iterating on low-detailed and high-detailed proto-types. The result is a launched hybrid app for Android, iOS and web.
A formative test shows coaches are more reliably correct using an improveddesign of multiple-choice questions than a standard multiple-choice design. In-terviews shows the coaches has become more aware of what they know and donot know, and feels more confidence before their youth lesson with an increasedquiz result. Further research should evaluate that the actual quality of the youthlesson improves.
Increasingly well-constructedmultiple-choice questions with thoughtful feed-back could stimulate creativity and problem-solving, deemed important by en-trepreneurship education research. After overcoming usability issues, the finalapp could reach both low and high-order learning objectives within entrepreneur-ship.
The app did seemingly improve the quality of entrepreneurship education forthe coaches in this specific developing world context. Further research shouldalso investigate the design and implications of a digital-only entrepreneurshipeducation for the coaches, having in mind that the teacher is believed the mainfactor of entrepreneurship education. As of now, the app is an effective compli-ment and assistance to the physical training.
iii


Acknowledgments
This master thesis took a multi-disciplinary approach of combining service de-sign, interaction design, technology and learning, and entrepreneurship. With-out the guidance and expertise from a number of people, this master thesis wouldnot have been the same.
For service design, I want to thank Peter Gahnström at LiU Innovation leadingme to Expedition Mondial. There I especially want to thank Susanna Nissar forbeing a great tutor, and also Erik Widmark. Practising service design with theguidance of Susanna and Erik is experience that I will carry with me forever.
Interaction design was introduced thanks to a recommendation from LenaTibell and Konrad Schönborn, to go to Jonas Löwgren’s first test lecture aboutthoughtful interaction design at Linköping University. His literature was a per-fect fit into the world of interaction design for me, coming from an engineeringperspective. It showed me what being a great designer really meant, and I wascompelled.
For technology, Henrik Marklund at Knowly provided valuable research andfeedback within digital learning. Julien Tentage from Grameen Foundation inKampala could give early feedback on what design ideas might suit the targetgroup from a technology and design perspective.
For learning effectiveness research, I greatly want to thank Lena Tibell, andalso Konrad Schönborn. Lena and Konrad has given thoughtful input to theproject throughout.
For entrepreneurship education, I have so many to thank, including againKonrad. But by biggest thanks goes to those that knew the entrepreneurshipcoaches: Josefina Lönn and Iliana Björling from YoungDrive, and Gerald Emoyoand others from Plan International.
Thank you for your contributions! Lastly but not least, I want to thank Lin-nea Rothin who put me right track on the master thesis, and to Lena Tibell andKonrad Schönborn who has been supervising this master thesis from start to end.Your continuous feedback have been incredibly valuable, and I feel honoured tohave been given this learning opportunity.
Thank you.
Norrköping, August 2016Marcus Nygren
v


Contents
1 Introduction 11.1 Purpose . . . . . . . . . . . . . . . . . . . . . . . . . . . . . . . . . . 1
1.1.1 An App for the Entrepreneurship Coaches . . . . . . . . . . 21.1.2 YoungDrive’s Definition of Success for the App . . . . . . . 2
2 Theory 32.1 Entrepreneurship Education . . . . . . . . . . . . . . . . . . . . . . 32.2 Learning with Mobile Technology . . . . . . . . . . . . . . . . . . . 42.3 Design for Learning . . . . . . . . . . . . . . . . . . . . . . . . . . . 5
2.3.1 Learning Entrepreneurship: Mapping Educational Objec-tives with Bloom’s Revised Taxonomy . . . . . . . . . . . . 5
2.3.2 Building Skills: by Spaced Practice, Deliberate Practice andPerceptual Exposure . . . . . . . . . . . . . . . . . . . . . . 5
2.3.3 Learning from Feedback . . . . . . . . . . . . . . . . . . . . 72.3.4 Learning by Thinking: Reflection & Retrieval Practice . . . 8
2.4 Design for Motivation . . . . . . . . . . . . . . . . . . . . . . . . . . 92.4.1 Cognitive Load Theory . . . . . . . . . . . . . . . . . . . . . 92.4.2 Progress and Payoffs . . . . . . . . . . . . . . . . . . . . . . 11
2.5 Design Thinking in Multi-Disciplinary Projects . . . . . . . . . . . 122.5.1 A Good Designer . . . . . . . . . . . . . . . . . . . . . . . . 122.5.2 How to Deal with Relationships and Roles . . . . . . . . . . 132.5.3 Thinking of a Product as a Service . . . . . . . . . . . . . . 132.5.4 Starting the Project . . . . . . . . . . . . . . . . . . . . . . . 13
2.6 Service Design Methodology . . . . . . . . . . . . . . . . . . . . . . 142.6.1 Principles . . . . . . . . . . . . . . . . . . . . . . . . . . . . 142.6.2 Sequencing . . . . . . . . . . . . . . . . . . . . . . . . . . . . 142.6.3 Service Design Tools . . . . . . . . . . . . . . . . . . . . . . 15
2.7 Digital Service Design . . . . . . . . . . . . . . . . . . . . . . . . . . 162.7.1 The 4 stages of a "Service Sprint" . . . . . . . . . . . . . . . 162.7.2 Step 1 - Insights: Analysis, Retrospective & Stakeholder
feedback . . . . . . . . . . . . . . . . . . . . . . . . . . . . . 162.7.3 Step 2 - Ideation: Planning Interactions and Delivery . . . 172.7.4 Step 3 - Trigger Material . . . . . . . . . . . . . . . . . . . . 17
vii

viii Contents
2.7.5 Step 4 - Interactions: with "Service Mini-Sprints" . . . . . . 182.8 Hybrid App Development . . . . . . . . . . . . . . . . . . . . . . . 18
3 Research Questions 19
4 Methods and Implementation 214.1 YoungDrive, Terminology and Limitations . . . . . . . . . . . . . . 21
4.1.1 Entrepreneurship in Uganda . . . . . . . . . . . . . . . . . . 214.1.2 YoungDrive . . . . . . . . . . . . . . . . . . . . . . . . . . . 224.1.3 Roles within YoungDrive . . . . . . . . . . . . . . . . . . . . 224.1.4 Mobile Technology in Uganda’s Rural Areas . . . . . . . . . 23
4.2 Collaborators for the Master Thesis . . . . . . . . . . . . . . . . . . 234.2.1 The Current Author . . . . . . . . . . . . . . . . . . . . . . . 234.2.2 Supervisors . . . . . . . . . . . . . . . . . . . . . . . . . . . 244.2.3 Stakeholders . . . . . . . . . . . . . . . . . . . . . . . . . . . 244.2.4 Advisors . . . . . . . . . . . . . . . . . . . . . . . . . . . . . 24
4.3 Describing the YoungDrive Coaches and the Research Context . . 254.3.1 Social Characteristics and Businesses in Uganda . . . . . . 254.3.2 Social Characteristics and Businesses in Zambia . . . . . . 27
4.4 Study Design and Data Collection . . . . . . . . . . . . . . . . . . . 274.4.1 Creation of Design Process . . . . . . . . . . . . . . . . . . . 274.4.2 Implementation of Design Process . . . . . . . . . . . . . . 284.4.3 Iteration 1: Uganda Coach Visit . . . . . . . . . . . . . . . . 29
4.4.3.1 Customer Journey Map: "A Day As a Coach" . . . 304.4.4 Iteration 2: Zambia Coach Training . . . . . . . . . . . . . . 30
4.4.4.1 Creation of Questions . . . . . . . . . . . . . . . . 314.4.4.2 Trigger Material Used . . . . . . . . . . . . . . . . 314.4.4.3 Design Workshop #1 in Zambia . . . . . . . . . . 324.4.4.4 Assessment via Quiz . . . . . . . . . . . . . . . . . 324.4.4.5 Experimenting with Quiz Before or After the Ses-
sion . . . . . . . . . . . . . . . . . . . . . . . . . . 334.4.4.6 Experimenting with Design of Questions . . . . . 334.4.4.7 Interviews with Josefina . . . . . . . . . . . . . . . 344.4.4.8 Design Workshop #2 in Zambia . . . . . . . . . . 344.4.4.9 Assessing Test Items According to Bloom’s Revised
Taxonomy . . . . . . . . . . . . . . . . . . . . . . . 344.4.5 Iteration 3: Uganda Formative Test . . . . . . . . . . . . . . 34
4.4.5.1 Trigger Material Used . . . . . . . . . . . . . . . . 344.4.5.2 Interaction Activities in Uganda . . . . . . . . . . 35
4.4.6 Iteration 4: Uganda Summative Test . . . . . . . . . . . . . 354.5 Data Analysis Framework . . . . . . . . . . . . . . . . . . . . . . . 37
4.5.1 Data Analysis Methods . . . . . . . . . . . . . . . . . . . . . 374.5.1.1 Persona or Need groups . . . . . . . . . . . . . . . 374.5.1.2 Customer Journey Map . . . . . . . . . . . . . . . 384.5.1.3 Sprint Backlog and Sprint Planning . . . . . . . . 384.5.1.4 Sprint Demo . . . . . . . . . . . . . . . . . . . . . 39

Contents ix
4.5.1.5 Analysing Notes . . . . . . . . . . . . . . . . . . . 394.5.1.6 Analysing Log Data . . . . . . . . . . . . . . . . . 394.5.1.7 Analysing Test Items According to Bloom’s Revised
Taxonomy . . . . . . . . . . . . . . . . . . . . . . . 404.5.1.8 Analysing Quiz Results . . . . . . . . . . . . . . . 40
4.5.2 Analysis Implementation of Quiz Results and Pre-Data . . 414.5.2.1 Step 1: Data Acquisition from Server . . . . . . . 414.5.2.2 Step 2: Data Acquisition from Pre-Study . . . . . 414.5.2.3 Step 3: Data Enhancement of Server Results . . . 424.5.2.4 Step 4: Date Enhancement of Pre-study Results . 434.5.2.5 Step 5: Data Enhancement by Joining Pre-test and
Results Summary . . . . . . . . . . . . . . . . . . . 434.5.2.6 Step 6: Visualization Mapping . . . . . . . . . . . 444.5.2.7 Step 7: Rendering . . . . . . . . . . . . . . . . . . 44
4.6 Application Implementation . . . . . . . . . . . . . . . . . . . . . . 454.6.1 User Needs . . . . . . . . . . . . . . . . . . . . . . . . . . . . 454.6.2 Stakeholder Meeds . . . . . . . . . . . . . . . . . . . . . . . 454.6.3 Choosing Frameworks for Creating the App . . . . . . . . . 454.6.4 Creating a First Version of the App . . . . . . . . . . . . . . 454.6.5 Enabling Data Collection . . . . . . . . . . . . . . . . . . . . 46
4.6.5.1 Login . . . . . . . . . . . . . . . . . . . . . . . . . . 464.6.5.2 Online and Offline Database . . . . . . . . . . . . 46
5 Results 495.1 The YoungDrive App: Iteration 1-4 . . . . . . . . . . . . . . . . . . 495.2 Iteration 1: Uganda Coach Visit . . . . . . . . . . . . . . . . . . . . 52
5.2.1 Interviews and Field Visits . . . . . . . . . . . . . . . . . . . 525.2.1.1 Stakeholder Interview Findings: Entrepreneurship
Education Considerations . . . . . . . . . . . . . . 525.2.1.2 Coach Interview and Field Visit Findings: Teach-
ing with Confidence . . . . . . . . . . . . . . . . . 535.2.2 Co-Creation Workshops . . . . . . . . . . . . . . . . . . . . 54
5.2.2.1 Customer Journey Map: "A Day As a Coach" . . . 545.2.2.2 Smartphone Test using Quizoid and Duolingo . . 55
5.2.3 Sprint Demo . . . . . . . . . . . . . . . . . . . . . . . . . . . 575.2.3.1 Next Iteration . . . . . . . . . . . . . . . . . . . . . 58
5.3 Iteration 2: Zambia Coach Training . . . . . . . . . . . . . . . . . . 585.3.1 Co-Creation Workshops . . . . . . . . . . . . . . . . . . . . 58
5.3.1.1 Co-Designing an App for the YoungDrive Training 585.3.1.2 Understandingwhat Builds Confidence among Coaches 61
5.3.2 Quiz Results and Quiz Usage Observations . . . . . . . . . 615.3.2.1 Quiz Results from the Coaches . . . . . . . . . . . 615.3.2.2 Lessons Learned fromApp Test Observations: Mo-
tivation . . . . . . . . . . . . . . . . . . . . . . . . 645.3.2.3 Lessons Learned fromApp Test Observations: Learn-
ing . . . . . . . . . . . . . . . . . . . . . . . . . . . 65

x Contents
5.3.3 Analysing the Test Items . . . . . . . . . . . . . . . . . . . . 665.3.4 Sprint Demo . . . . . . . . . . . . . . . . . . . . . . . . . . . 68
5.3.4.1 Validating the Coaches’ Level of Knowledge . . . 685.3.4.2 Distance Learning . . . . . . . . . . . . . . . . . . 695.3.4.3 Next Iteration . . . . . . . . . . . . . . . . . . . . . 69
5.4 Iteration 3: Uganda Formative Test . . . . . . . . . . . . . . . . . . 705.4.1 Initial Evaluation of the New Version of the App . . . . . . 715.4.2 App Test: Learning Gain and Effect of Functionality for For-
mative Assessment . . . . . . . . . . . . . . . . . . . . . . . 715.4.2.1 Observations during test-session . . . . . . . . . . 72
5.4.3 Follow-Up Co-Creation Workshops . . . . . . . . . . . . . . 765.4.4 App Tests with Three Coaches Before and After a Youth Ses-
sion . . . . . . . . . . . . . . . . . . . . . . . . . . . . . . . . 775.4.4.1 App Test with Coaches Before a Youth Session: Col-
lection of Affective Reactions, and Proposals forImprovements . . . . . . . . . . . . . . . . . . . . 77
5.4.4.2 App Test with Coaches After the Youth Session:Quiz Results and Analysis . . . . . . . . . . . . . . 78
5.4.5 Sprint Demo . . . . . . . . . . . . . . . . . . . . . . . . . . . 805.4.5.1 Next Iteration . . . . . . . . . . . . . . . . . . . . . 80
5.5 Iteration 4: Uganda Summative Test . . . . . . . . . . . . . . . . . 815.5.1 Analysis of Quiz Results . . . . . . . . . . . . . . . . . . . . 81
5.5.1.1 Quiz Results and Pre-Test Data Analysed in GoogleSheets . . . . . . . . . . . . . . . . . . . . . . . . . 82
5.5.1.2 Parallel Coordinates Visualization . . . . . . . . . 885.5.2 Analysis of Interviews . . . . . . . . . . . . . . . . . . . . . 91
5.5.2.1 Learning . . . . . . . . . . . . . . . . . . . . . . . . 935.5.2.2 Interaction Design . . . . . . . . . . . . . . . . . . 945.5.2.3 Service Design . . . . . . . . . . . . . . . . . . . . 96
6 Discussion 996.1 How is the Development Affected by the Technical Possibilities? . 99
6.1.1 Online Data Collection was Needed Earlier . . . . . . . . . 1006.1.2 Problems with Internet Access . . . . . . . . . . . . . . . . . 1006.1.3 Backwards Capability Issues . . . . . . . . . . . . . . . . . . 1006.1.4 No Time Assigned for Writing Automatic Tests . . . . . . . 1016.1.5 Difficulties Comparing Quiz Results between Iterations . . 101
6.2 How is the Design Affected by the Contextual Constraints? . . . . 1016.2.1 From Computer Expert into a Digital Service Designer . . . 1026.2.2 HavingMany People Involved in the Design Process to Adapt
to the Contextual Constraints . . . . . . . . . . . . . . . . . 1036.2.3 Spending Time in the Real-World Training . . . . . . . . . . 1046.2.4 Having Low Scores on the Quizzes Might Lower Motivation 105
6.3 How Can Test Questions be Developed to Support Entrepreneur-ship Learning? . . . . . . . . . . . . . . . . . . . . . . . . . . . . . . 1056.3.1 Constructing Good Questions in Entrepreneurship . . . . . 106

Contents xi
6.3.2 Necessary Improvements to the Multiple-Choice Design . . 1066.3.3 Learning Effect from the Questions . . . . . . . . . . . . . . 107
6.4 How Does Design Affect Usability and Learning Done via the App? 1076.4.1 Benefits with Confidence Level and Correctness in Combi-
nation . . . . . . . . . . . . . . . . . . . . . . . . . . . . . . . 1086.4.2 Deciding on Learning Methods . . . . . . . . . . . . . . . . 1096.4.3 Summary . . . . . . . . . . . . . . . . . . . . . . . . . . . . . 110
6.5 How Can Users’ Feedback be Used to Inform Modifications of theApp? . . . . . . . . . . . . . . . . . . . . . . . . . . . . . . . . . . . 110
7 Conclusions 1137.1 Contribution to the Domain of Entrepreneurship Education in a
Developing Country Context . . . . . . . . . . . . . . . . . . . . . . 1137.2 Demonstration of how Certain Technical Constraints and Design
Constraints can be Overcome in a Developing World Context . . . 1147.3 Provided Methods of Investigating Usability and Learnings with a
Digital Training Tool in the Real-World Entrepreneurship TrainingContext . . . . . . . . . . . . . . . . . . . . . . . . . . . . . . . . . . 114
7.4 Created New Methods in Service Design, when Co-Designing Dig-ital Artefacts in a Developing Country Context . . . . . . . . . . . 115
8 Future Work 1178.1 How is the Development Affected by the Technical Possibilities? . 117
8.1.1 Data Analysis Improvements . . . . . . . . . . . . . . . . . 1178.1.2 Code Quality . . . . . . . . . . . . . . . . . . . . . . . . . . 1188.1.3 Availability in More Countries . . . . . . . . . . . . . . . . . 1188.1.4 Availability on All Android Devices . . . . . . . . . . . . . 1198.1.5 Availability on Feature Phones . . . . . . . . . . . . . . . . 1198.1.6 Reaching Statistical Significance . . . . . . . . . . . . . . . 119
8.2 How is the Design Affected by the Contextual Constraints? . . . . 1208.2.1 Replacing the Teacher . . . . . . . . . . . . . . . . . . . . . 1208.2.2 Scaffolding the Coach Guides . . . . . . . . . . . . . . . . . 1208.2.3 More Time Designing the App for Different Need Groups . 1208.2.4 Training the Coaches with Using a Smartphone . . . . . . . 121
8.3 How can Test Questions be Developed to Support Entrepreneur-ship Learning? . . . . . . . . . . . . . . . . . . . . . . . . . . . . . . 1218.3.1 Designing for honesty with "Are you sure?" . . . . . . . . . 1218.3.2 Self-Reflection After a Youth Session . . . . . . . . . . . . . 1228.3.3 Avoiding Memorization of Answers . . . . . . . . . . . . . . 1228.3.4 Improving the Questions . . . . . . . . . . . . . . . . . . . . 122
8.4 How does Design Affect Usability and Learning Done via the App? 1238.4.1 Assessing Coach Guide Knowledge Before the Youth Session 1238.4.2 Using a Flashcards Approach . . . . . . . . . . . . . . . . . 1238.4.3 Adding more media channels to more closely simulate the
learning environment . . . . . . . . . . . . . . . . . . . . . . 1248.4.4 Improvements to the Certification Mode . . . . . . . . . . . 124
xii Contents
8.4.5 Improvements training Correct Structure and Time Man-agement . . . . . . . . . . . . . . . . . . . . . . . . . . . . . 124
8.4.6 Scaffolding with Flashcards . . . . . . . . . . . . . . . . . . 1258.4.7 Memory Design . . . . . . . . . . . . . . . . . . . . . . . . . 1258.4.8 Sharing with One Another . . . . . . . . . . . . . . . . . . . 1258.4.9 Including the Paper Manuals in the App . . . . . . . . . . . 125
8.5 How can Users’ Feedback be Used to Inform Modifications of theApp? . . . . . . . . . . . . . . . . . . . . . . . . . . . . . . . . . . . 1268.5.1 Educator Dashboard . . . . . . . . . . . . . . . . . . . . . . 1278.5.2 To Answer the Research Question More Elegantly . . . . . 127
A Appendix A: Images of Developed Application 137
B Appendix B: Pre-Test 143
C Appendix C: Time Plans & Activities 147C.1 Original Time Plan and Activities . . . . . . . . . . . . . . . . . . . 147
C.1.1 Before Uganda . . . . . . . . . . . . . . . . . . . . . . . . . . 147C.1.2 In Uganda . . . . . . . . . . . . . . . . . . . . . . . . . . . . 147C.1.3 After Uganda . . . . . . . . . . . . . . . . . . . . . . . . . . 149C.1.4 After Semester . . . . . . . . . . . . . . . . . . . . . . . . . . 149
C.2 Revised Time Plan and Activities . . . . . . . . . . . . . . . . . . . 149C.2.1 Iteration 1: Uganda Coach Visit . . . . . . . . . . . . . . . . 149C.2.2 Iteration 2: Zambia Coach Training . . . . . . . . . . . . . . 150C.2.3 Iteration 3: Uganda Formative Test . . . . . . . . . . . . . . 150C.2.4 Iteration 4: Uganda Summative Test . . . . . . . . . . . . . 150
1Introduction
The following master thesis was carried out in the Master’s program of MediaTechnology and Engineering at the Department of Science and Technology, LinköpingUniversity. The work has been carried out for the non-profit entrepreneurshipacademy YoungDrive in Uganda and Zambia. The organization teaches startinga business to youth in developing countries, with YoungDrive coaches now edu-cating 12 000 youth within Plan International’s project in Uganda, and now alsorunning a coach training in Zambia. An application for the entrepreneurshipcoaches is thought to help coaches assess what they know, and learn to becomeeven better with teaching entrepreneurship to the youth.
There are both opportunities and challenges for mobile tools for rural areasof Uganda. While entrepreneurship activity is high, and mobile services aregrowing rapidly (see 4.1.4), the two fields have not yet been combined with en-trepreneurial learning in a developing country context. The research questionsfocus on the process and result of developing an app used by first-time smart-phone users for entrepreneurship learning.
1.1 Purpose
In order for young ambitious entrepreneurs to build sustainable enterprises, theyneed to have basic entrepreneurial skills. A mobile learning platform could as-sess and teach those skills either complementing a physical entrepreneurship ed-ucation, or being accessible to the entrepreneur whenever and wherever deemedmost important.
1
2 1 Introduction
1.1.1 An App for the Entrepreneurship Coaches
The entrepreneurship education YoungDrive is an initiative of Illiana Björlingfrom YoungDrive, now collaborating with Plan International. Within the project"A working future", they have educated, supported and inspired 12 000 Ugandanyouth in the process of starting their own businesses (Nissar, 2016).
The result of the master thesis will be a working prototype of an entrepreneur-ship coach training app. The overall goal of the master thesis is to answer theresearch questions described in section 3. The master thesis will consist of de-signing and developing the app for the entrepreneurship education YoungDrive,including evaluating it’s effectiveness towards the coaches.
1.1.2 YoungDrive’s Definition of Success for the App
By training coaches that can carry out the education in larger groups of entrepreneurs,the education reach many young people at the same time. A mobile learning plat-form is predicted to improve the effect of the training even more, by fulfilling thefollowing requirements:
• Validate the coaches’ level of knowledge during their education
• Train the coaches on distance
• Certify all staff
YoungDrive requests the app to be be suited for the coach training, and havemultiple-choice questions as its basis mechanics. YoungDrive’s experience goalfor the app is "It should be easy to understand, pedagogical and enjoyable touse, and the coaches should think it is fun and meaningful to learn via the app"(Björling and Lönn, 2016).
2Theory
To understand how to reach the objectives of the project, this chapter describesand presents related work on entrepreneurship education and digital learning.An effective learning app must help the user to reach educational objectives,which is why methods to design for learning is presented. Further, to ensurea learning app will be used voluntarily, methods to design for motivation is pre-sented from a product development standpoint. Finally, relevant theory withindesign thinking, service design and creation of apps is presented.
2.1 Entrepreneurship Education
Entrepreneurship education has been a growing field of investigation over thelast three decades. While Dickson and Weaver (2008) says there are few empir-ical studies available, examples include among others Kuratko (2005), Pittawayand Cope (2007) and Bae and Fiet (2014). Oviawe (2010) and Iakovleva andStehphan (2011) has had an interest in interventions for teaching and learningentrepreneurship in the developing world.
First, Oviawe (2010) conclude by how teaching of creativity and problem-solving skills seems to be especially beneficial for entrepreneurship in developedcountries. In YoungDrive, the youth are tasked with starting their own busi-ness from no capital, which fosters creativity and problem-solving skills. Fur-ther, Iakovleva and Stehphan (2011) indicated that respondents from develop-ing countries do have stronger entrepreneurial intentions than those from de-veloped countries. This stems from attitudes, subjective norms, and perceivedbehavioural control. Their encouragement is that developing countries need tofocus on the development of institutions that can support entrepreneurial efforts.YoungDrive is one such example.
Ruskovaara and Pihkala (2015) concludes, that the teacher seems to be the
3

4 2 Theory
main factor for entrepreneurship education, and that research agrees with them.There seems to be no indication of difference between men and women, nor pre-vious professional teaching experience. They could find that entrepreneurial ac-tivity seems to lead to better entrepreneurship education. Dickson and Weaver(2008) recommends mainly two things for enhancing entrepreneurship educa-tion practices. First, the playful side of teaching and learning is mentioned. Sec-ondly, they encourage teacher training that develops the competencies as a men-tor, enabler or coach.
2.2 Learning with Mobile Technology
YoungDrive has asked for a multiple-choice question learning game used for as-sessment and improvement of the YoungDrive learning objectives during andafter the training. In recent times, digital learning (e-learning) has had a tremen-dous impact both outside and inside the classroom. With a growing teacher inter-est, research so far shows that digital education is difficult and risky, but poten-tially rewarding (Luckin and Noss, 2012). Thus, digital education simultaneouslyshows great potential and vulnerability. Much of the research on digital learningto date on digital games has focused on proof-of-concept studies and media com-parisons (Luckin and Noss, 2012). A study by Clark and Killingsworth (2014)motivates why a digital tool or game is a good thing by showing an increase inlearning outcomes, relative to non-game instructional conditions.
A large amount of development has taken place on diagnostic testing envi-ronments, that allow teachers and learners to assess present performance againstprior performance (Luckin and Noss, 2012). There are numerous examples of de-velopments in e-assessment using mobile environments, as well as immersive en-vironments and social and collaborative environments. One such example is theeducational app platform iSchool, developed by iSchool Zambia (iSchool, 2014).The app has been praised and made popular as it was designed to fit the Zam-bia school curriculum to the point, accessible as a home edition, pupil editionand teacher edition. Interest in formative e-assessment is increasing. It has beenshown that multiple-choice tests in e-assessment can be used to good effect (Nicol,2007).
Two studies within electronic assessment (e-assessment) or mobile learning(m-learning) have been done that this master thesis is inspired by. One uses delib-erate practices in a mobile learning environment (Yengin and Uzanboylu, 2012).The other focused on and further validated the research of various experimentalstudies, that multiple-choice can be a viable auto-assessment method to improv-ing student learning, especially for m-learning (de Marcos and Otón, 2010).
Luckin and Noss (2012) says that further consideration should be given tohow technology can be used to enable the assessment of knowledge and skills notusually distinguished within current curricula. Clark and Killingsworth (2014)encourages a focus on how theoretically-driven decisions influence learning out-comes: for the broad diversity of learners, within and beyond the classroom.Combining these two, introducing e-assessment of entrepreneurship in a devel-
2.3 Design for Learning 5
oping country context is a contribution to existing research.
2.3 Design for Learning
The following sections deals with how to design for effective learning (Dirksen,2012). Designing for the mind is sometimes referred to as cognitive psychology,how our brain works in regard to mental processes such as retention and trans-fer of knowledge. There are a number of strategies and techniques that can beused when designing learning for the mind specifically: to decide educationalobjectives, how to reach these objectives (building skills and learning from as-sessment), and how to retain information (learning by reflection).
2.3.1 Learning Entrepreneurship: Mapping Educational
Objectives with Bloom’s Revised Taxonomy
What to teach should be determined by the learning objectives of the activity.Learning activities often involve both lower order and higher order thinkingskills as well as a mix of concrete and abstract knowledge. All of this needsto be designed for depending on activity. Bloom’s Revised Taxonomy (Krathwohl,2002) separates between lower or higher cognitive complexity, and concrete (fac-tual or conceptual) or abstract knowledge (procedural or metacognitive) (Cheongand Cheong, 2012). The taxonomy thus provides a framework for determin-ing and clarifying learning objectives. Bloom’s Revised Taxonomy is useful tomap the whole range of learning objectives for entrepreneurship and as an en-trepreneurship coach. See figure 2.1 from Heer (2012). Each colored block isan example of a learning objective matching with the two dimensions. The figurealso explains the different concepts. Depending on the objective, it fits differentlyinto the Knowledge dimension and Cognitive Process dimension of Bloom’s Re-vised Taxonomy.
To craft good multiple-choice questions could be an art, but to map the ques-tion to learning objective makes it into more of a science: when designing forlearning, using Bloom’s Revised Taxonomy you can analyse if the educationalobjectives are met.
2.3.2 Building Skills: by Spaced Practice, Deliberate Practice
and Perceptual Exposure
Spaced practice deals with spreading out learning, with the purpose of improvingretention. Clark and Killingsworth (2014) concludes that spaced learning versusmassed learning (no rest between sessions) did have a memory benefit in theirstudy, and found no evidence of consistent correlation between total durationand effects on learning outcomes in their study. Taking spaced learning into con-sideration, could mean making the user apparent on the person’s meta-cognitiveability (your personal insight of what you’ll remember and when you are likelyto forget).

6 2 Theory
Figure 2.1: Bloom’s Revised Taxonomy visualised with examples of differentlearning objectives. The entrepreneurship topic question "What is financialliteracy?" would be conceptual and remember.
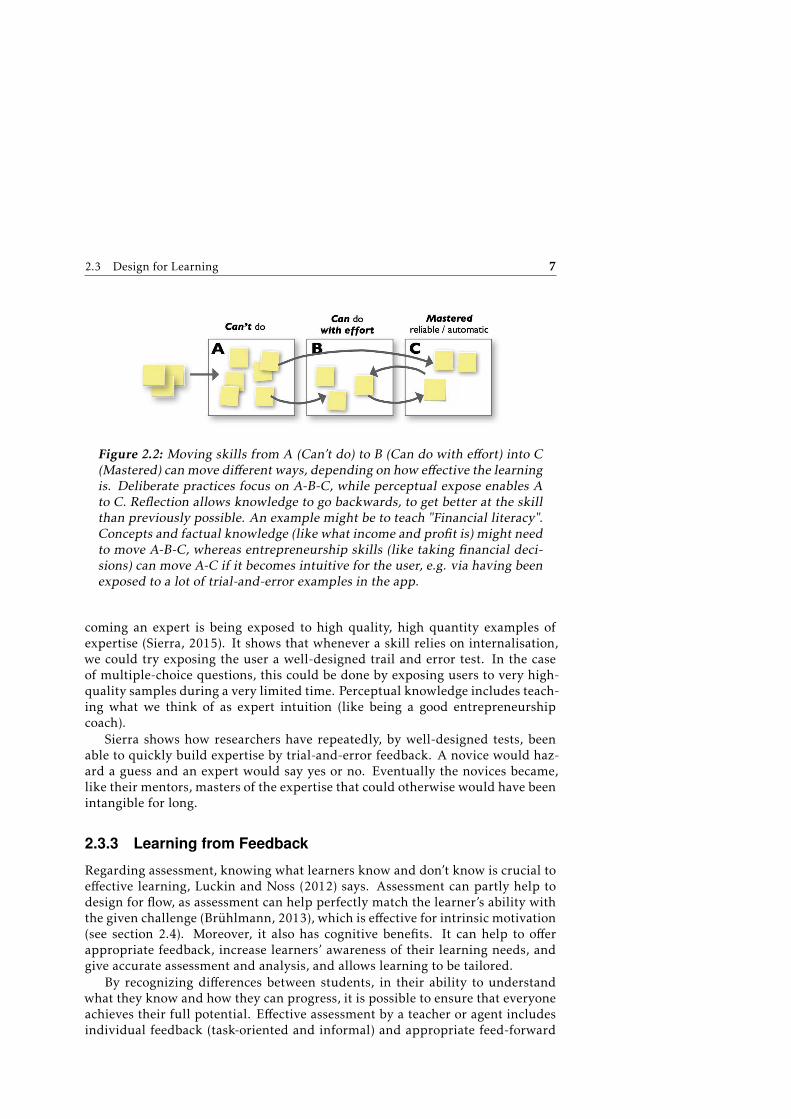
To design for optimal learning outcomes of skills (e.g. entrepreneurial activityor coaching skills), deliberate practice has been proven effective. It has beentested before for mobile learning environments (Yengin and Uzanboylu, 2012).Building skills effectively, Sierra (2015) suggests helping users practice right, bydesigning practice exercises that will take a fine-grained task from unreliable to95% reliability, within one to three 45-90-minute sessions. Sierra (2015) suggestsskills to be divided into three buckets: can’t do (but need to do), can do witheffort, and mastered (reliable/automatic). The goal then is to move skills fromcan’t do into mastered, in the best way possible. See figure 2.2 from Sierra (2015).If you can’t get the user to 95% reliability within this time, stop trying; you needto redesign the sub-skill (Sierra, 2015).
Desirable difficulties applies here, meaning that during deliberate practice, itmay feel as if learning gets more and more difficult, but in the long term the useris actually learning more. As a result, fewer people does true deliberate practice,but they do not get the same reward in return. Sierra (2015) suggests motivationto overcome desirable difficulties, see section 2.4.
By deliberate practice, you can practice better. The second attribute of be-
2.3 Design for Learning 7
Figure 2.2: Moving skills from A (Can’t do) to B (Can do with effort) into C(Mastered) canmove different ways, depending on how effective the learningis. Deliberate practices focus on A-B-C, while perceptual expose enables Ato C. Reflection allows knowledge to go backwards, to get better at the skillthan previously possible. An example might be to teach "Financial literacy".Concepts and factual knowledge (like what income and profit is) might needto move A-B-C, whereas entrepreneurship skills (like taking financial deci-sions) can move A-C if it becomes intuitive for the user, e.g. via having beenexposed to a lot of trial-and-error examples in the app.
coming an expert is being exposed to high quality, high quantity examples ofexpertise (Sierra, 2015). It shows that whenever a skill relies on internalisation,we could try exposing the user a well-designed trail and error test. In the caseof multiple-choice questions, this could be done by exposing users to very high-quality samples during a very limited time. Perceptual knowledge includes teach-ing what we think of as expert intuition (like being a good entrepreneurshipcoach).
Sierra shows how researchers have repeatedly, by well-designed tests, beenable to quickly build expertise by trial-and-error feedback. A novice would haz-ard a guess and an expert would say yes or no. Eventually the novices became,like their mentors, masters of the expertise that could otherwise would have beenintangible for long.
2.3.3 Learning from Feedback
Regarding assessment, knowing what learners know and don’t know is crucial toeffective learning, Luckin and Noss (2012) says. Assessment can partly help todesign for flow, as assessment can help perfectly match the learner’s ability withthe given challenge (Brühlmann, 2013), which is effective for intrinsic motivation(see section 2.4). Moreover, it also has cognitive benefits. It can help to offerappropriate feedback, increase learners’ awareness of their learning needs, andgive accurate assessment and analysis, and allows learning to be tailored.
By recognizing differences between students, in their ability to understandwhat they know and how they can progress, it is possible to ensure that everyoneachieves their full potential. Effective assessment by a teacher or agent includesindividual feedback (task-oriented and informal) and appropriate feed-forward

8 2 Theory
advice. Sitzmann and Kanar (2008) has studied how questions used to promptself-monitoring and self-evaluation benefit learning, showing gradual, positiveeffect on learning. Regarding multiple-choice tests, Nicol (2007) gives seven prin-ciples of good feedback practice, see figure 2.3.
Figure 2.3: Seven principles of good feedback practice Nicol (2007).
Moreover, research on fixed mindset (I can’t do X) versus growth mindset (Ican’t do X yet) talks about howmindset guides behaviour. In a mathematics gamestudents were rewarded by the mentality of "Not yet" and effort versus getting agrade on existing knowledge (Dweck, 2014). Regarding learning, those exposedto a growth mindset mentality, previously having a fixed mindset, got superiorresults, especially those students previously having difficulties with learning. Re-garding motivation, a study showed that high achievers played to the end regard-less, but in the growth mindset version those still played to the end, but so manymore lower and medium achievers also stayed until the end (Dweck, 2014).
2.3.4 Learning by Thinking: Reflection & Retrieval Practice
Stefano and Staats (2015) suggests that in some cases, learning from reflection ismore effective than learning by doing. During the act of reflection, the studentdevelops necessary skills and self-awareness to refine their own learning activi-ties. His results suggest that reflection as an activity that can be more effectivethan additional learning. This surely applies to the teacher as well says Luckinand Noss (2012). Stefano and Staats (2015) found that individuals who are giventime to reflect on a task, outperforms students who are given the same amount oftime to practice with the same task. But, similar to deliberate practice, it is a desir-able difficulty: individuals in the test themselves, had a tendency to believe thatallocating time to practice on the task rather than reflecting on it would benefitthem.
When it comes to study technique, Bjork (2016) as well shows that retrievalfrom memory is more effective than people who repeat reading the same thingto remember: the more effective students, retrieves from memory. One way touse memory retrieval as a study technique, is to ask "What was in that article?",before checking the answer in the article (the flashcard principle). It is an ex-ample of memory retrieval that is extremely effective for learning, their researchshows. There is a danger with multiple-choice questions, that the student is givenno time to reflect on the question and their prior knowledge, before evaluatingthe alternatives (Nicol, 2007). In the case of learning to teach entrepreneurship,

2.4 Design for Motivation 9
where the information should be easily accessible during the teaching situation,selecting an alternative from multiple-choice does not simulate the teaching en-vironment. Thus, memory via retrieval is essential in the multiple-choice designto have an effect in a real-world teaching scenario.
2.4 Design for Motivation
Research in motivation is commonly divided into three areas:
• Self-determination - the student is driven by a genuine wish that comesfrom themselves
• Achievement - the student is driven by extrinsic motivations, to be rewarded
• Expectation value - the student is driven by extrinsic motivations, but it isnot coming from being rewarded
Koballa andGlynn (2007) andAbell and Lederman (2007) provide an overviewof theories developed for these three areas. Further, Fulmer and Frijters (2009)provides a review of methods to collect data which can be used to study motiva-tion. Deci and Ryan (1985) and Deci and Ryan (2000) studies self-determinationtheory, Elliot and Covington (2001) studies achievement theory, and Eccles andWigfield (2002) and Wigfield and Eccles (2000) studies expectancy-value theory.
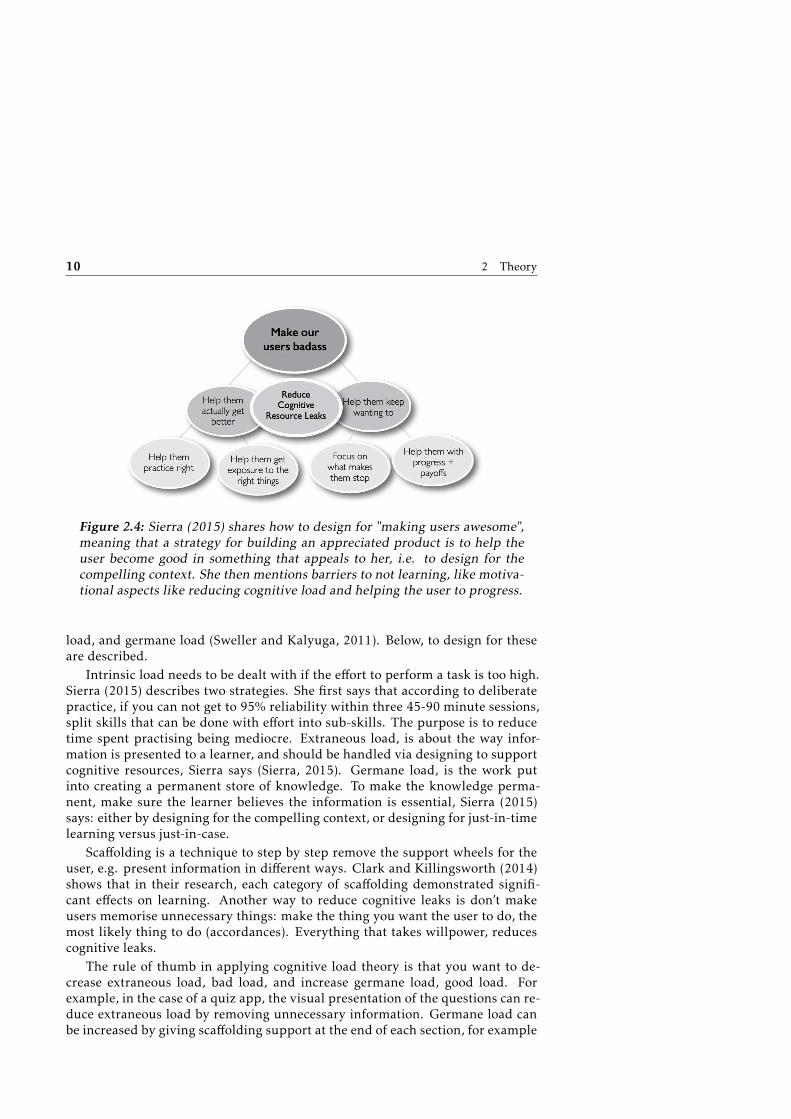
In terms of product development, Sierra (2015) argues that if you have de-signed for the user’s compelling context the user is already motivated (by self-determination). Then, the motivation of the user is to become better (achieve).Sierra (2015) suggests the focus to be how to help users progress (see "Progressand payoffs", achieve), and what pulls them off (see "Cognitive load theory" be-low). See figure 2.4, for a summary of her focus on designing for building exper-tise.
In terms of using the product in a training environment, expectation value be-comes relevant. Research within training transfer (Brinkerhoff, 2013) shows thatbefore and after is as important as the training itself. To design for this, the leadershould be involved with the participants before the training, and communicateexpectations. The student should be expected to implement the training in every-day life (Brinkerhoff, 2013). Both of these aspects holds true for the YoungDriveprogram, and how a teacher communicates the use of an app needs to be takeninto consideration.
2.4.1 Cognitive Load Theory
Sierra (2015) argues that working on what stops people matters more than work-ing on what entices them. Thus, a focus needs to be identifying and remov-ing stumbling blocks. She then describes how humans have scarce cognitiveresources, and how to design for these. Cognitive load theory (CLT) researchis divided into three types of load: intrinsic load (stumbling blocks), extrinsic
10 2 Theory
Figure 2.4: Sierra (2015) shares how to design for "making users awesome",meaning that a strategy for building an appreciated product is to help theuser become good in something that appeals to her, i.e. to design for thecompelling context. She then mentions barriers to not learning, like motiva-tional aspects like reducing cognitive load and helping the user to progress.
load, and germane load (Sweller and Kalyuga, 2011). Below, to design for theseare described.
Intrinsic load needs to be dealt with if the effort to perform a task is too high.Sierra (2015) describes two strategies. She first says that according to deliberatepractice, if you can not get to 95% reliability within three 45-90 minute sessions,split skills that can be done with effort into sub-skills. The purpose is to reducetime spent practising being mediocre. Extraneous load, is about the way infor-mation is presented to a learner, and should be handled via designing to supportcognitive resources, Sierra says (Sierra, 2015). Germane load, is the work putinto creating a permanent store of knowledge. To make the knowledge perma-nent, make sure the learner believes the information is essential, Sierra (2015)says: either by designing for the compelling context, or designing for just-in-timelearning versus just-in-case.
Scaffolding is a technique to step by step remove the support wheels for theuser, e.g. present information in different ways. Clark and Killingsworth (2014)shows that in their research, each category of scaffolding demonstrated signifi-cant effects on learning. Another way to reduce cognitive leaks is don’t makeusers memorise unnecessary things: make the thing you want the user to do, themost likely thing to do (accordances). Everything that takes willpower, reducescognitive leaks.
The rule of thumb in applying cognitive load theory is that you want to de-crease extraneous load, bad load, and increase germane load, good load. Forexample, in the case of a quiz app, the visual presentation of the questions can re-duce extraneous load by removing unnecessary information. Germane load canbe increased by giving scaffolding support at the end of each section, for example
2.4 Design for Motivation 11
helping users to remember, by showing them their answers.
2.4.2 Progress and Payoffs
Sierra (2015) argues that to pull users forward, to stay motivated, progress andpayoffs are essential. Both of these, are investigated in terms of motivationalpsychology.
The feeling of progress can be emphasised by a path with guidelines to helpthe user know where they are at each step, e.g. for a training. To create a path,she encourages the designer to make a list of key skills ordered from beginner toexpert. Then, these are sliced into groups of ranking or levels.
This way, it is possible to design a “belt” path for your context. The firstlevel, should feel like a superpower for the user. The best payoff, is a intrinsicallyrewarding experiences, according to Sierra (2015). For an entrepreneur, gainingthe skills of selling (the progress) can be as rewarding as having gained themoneyfor it (the payoff).
For motivation, the earlier, lower levels should be achievable in far less timeand effort than the later, advanced levels. One practice is to try to have each newlevel take roughly double the time and effort of the previous level. This highlyrelates to flow.
Caring for the compelling context, why the user wants to learn the skill, arehelpful strategies. A sometimes critiqued way of progression is to give the userhigh pay-off tips, but if done in a fair way, it is a good way for both learning andmotivation.
This kind of path map is superb to simple gamification, says Sierra (2015). Inan app for building entrepreneurship coach skills, the act of becoming certified(getting 100% correct), might not be as rewarding as the progress of getting there.Therefore, gamification of the sort "rewarding effort" might be more beneficialwith "rewarding result". Suitable gamification could also mean unlocking newpossibilities of adding value to the app (for example adding questions to the quiz),versus getting a badge or a star.
The shown benefits of designing for intrinsic motivation is in-line with self-determination theory (Deci and Ryan, 1985, 2000). Pink (2011) concludes thatthe surprising truth about what motivates us is that drive is fostered by autonomy,mastery and purpose. Meanwhile, Clark and Killingsworth (2014) says that sim-ple gamification as well as more sophisticated game mechanics can prove effec-tive. However, he adds that it should be investigated if "simple gamification" (e.g.contingent point and badges connected to learning activities) more frequentlyfocus on lower-order learning outcomes, compared to studies with more sophis-ticated game mechanics. For the case of entrepreneurship, the goal is on higher-order learning outcomes, meaning simple gamification is not enough to motivateusers. Thus, if you do not design for the compelling context, entrepreneurshipcoaches may well prefer other learning methods instead of using your gamifiedapp.

12 2 Theory
2.5 Design Thinking in Multi-Disciplinary Projects
Interaction design talks about the creation of digital artefacts specifically (Löw-gren and Stolterman, 2007). When it comes to the design process, it is influencedby related areas such as human-computer science, and more recently human-centered design. However, various disciplines suggest different design processes.For example, agile development suggest how do develop software efficiently. When-ever a project is multi-disciplinary, various design processes may need to be com-bined. Whenever this happens, design thinking (how to think about design) be-comes a skill essential to thoughtfully design the process.
Löwgren and Stolterman (2007) writes about design thinking and useful tech-niques in general, from his interaction design perspective. Service design think-ing connects various fields of activity (Stickdorn and Schneider, 2010), and it’smethodology relies on being close to the users. While interaction design talksabout the creation of digital artefacts specifically, service design talks about thecreation of services. As some digital artefacts are used within a service, or can bethought of as both a product and service simultaneously, the combination of thetwo can be very useful. Service design could help the designer be aware of howsuch a artefact would need to interplay with its physical environment.
Each discipline holds efficient methods and tools, that can be modified to suitthe specific situation even better. From the field of graphic design, mental modelsdescribe the perceptions of the user. From interaction design, desirability, utility,usability and pleasurability can be useful principles to evaluate a product (Clat-worthy, 2010). While none of these are a mandatory part of service design, thesehave been useful in service design projects previously (Stickdorn and Schneider,2010). In difficult situations, combining different disciplines places demands onthe designer. This is where design thinking becomes relevant. Below, relevantmethods and tools are briefly described, and what it means to be a good designer.
2.5.1 A Good Designer
The result of a method can not be better than the people engaging in carrying outthe process (Löwgren and Stolterman, 2007). With its user-centered focus (Stick-dorn and Schneider, 2010), service design can be said to equip the designer withtools both for reasoning and design ethnography. But it also suits to get to knowand design for the learning situation. In learning, the end goal is that the studentraises their level of knowledge and expertise, and the design needs to be adaptedfor this specifically. Central to design for learning is to dig deep into the topic be-ing communicated. In this case, understanding entrepreneurship, understandingexactly what is being taught (the training), and adapting the design after this.
A good designer can deal with the complexities of design: a satisfactory (andsurprising) solution or design can be achievedwhile working in a highly restrictedsituation (Löwgren and Stolterman, 2007). This can be done e.g. by inventingnew design techniques. One such example that would suit designing an app forentrepreneurship training in a development country, would be a field hackathon.A field hackathon would thus allow that during the training, the topic and the

2.5 Design Thinking in Multi-Disciplinary Projects 13
users are observed and understood. Then, the app can be tested (in this can aquiz assessment of the trained material). Then, users can be invited to give feed-back, suggestions of improvements, and ideas. For the next day, an improvedversion of the app is tested, and then the process is repeated.
More examples of how a service design process can be invented to deal withdigital artefacts, can be described in the chapter 2.7. However, to do such fieldtests (like a field hackathon), requires building trust and having an enabling en-vironment, which is where relationships and roles become crucial.
2.5.2 How to Deal with Relationships and Roles
While a researcher is interested in reality, a designer is interested in what realitycould become (Löwgren and Stolterman, 2007). Being thoughtful means concep-tual clarity from the designer, caring for the vision, and being equipped withappropriate tools of reasoning. These are all good characteristics for a success-ful project. According to Löwgren and Stolterman (2007), "real" design is aboutfinding ways to design a project within the existing preconditions and limitations.Being innovative and communicating well with the stakeholders becomes crucial.
There are three roles an interaction designer in particular can take: the com-puter expert, the socio-technical expert, and the political agent. The trend is in-creasingly towards socio-technical experts (Löwgren and Stolterman, 2007), themiddle ground, as human understanding and collaboration is so important. Thisseems to be a perfect fit with service design, where interaction design is bothtechnical skills and design, and service design can be both design and ethnogra-phy. Even more importantly, service design suggests making the whole processco-creative, involving all stakeholders (Stickdorn and Schneider, 2010).
2.5.3 Thinking of a Product as a Service
Service design thinking is described as a process of designing, rather than to itsoutcome. A service’s intent is to meet customer needs. If it does, it will be usedfrequently, and recommended (Stickdorn and Schneider, 2010). As this is oftennot the case, service design can be applicable to fields including social design,product design, graphic design and interaction design. The result can be a prod-uct service hybrid. When designed and considered well, service design shapesthe value proposition and desirability of the product for the better.
2.5.4 Starting the Project
Löwgren and Stolterman (2007) writes about the beginning of a project: This iswhere the designer gets involved in design work, establishes a preliminary un-derstanding of the situation, navigates through available information, and initi-ates all necessary relationships with clients, users, decision makers, and so forth.Based on all this, she creates a design proposal (Löwgren and Stolterman, 2007).

14 2 Theory
2.6 Service Design Methodology
Below, brief descriptions of five principles of service design are described accord-ing to Stickdorn and Schneider (2010), together with how the work is dividedinto iterations, and examples of tools that can be applied.
2.6.1 Principles
Stickdorn and Schneider (2010) describes five principles that constitute servicedesign thinking, and how to follow these.
He describes how to follow these principles, bymaking the process user-centered(e.g. via design ethnography), co-creative (involve all stakeholders) and holistic(keep the big picture). Sequencing (visualize the service, and make iterations)and evidencing (make the service tangible) are the two last important principles.
2.6.2 Sequencing
Sequencing the process means splitting the design process into iterations, whichconsists of a number of steps, which are repeated for each iteration. This is a com-mon denominator with the agile methodology SCRUM, which is often applied insoftware development.
While service design literature and practice refer to various frameworks, re-gardless of number of steps, every service design project includes: exploration,creation, reflection and implementation (Stickdorn and Schneider, 2010). Wid-mark and Nissar (2016) suggests a model where one iteration consists of insights,ideation, trigger material, and interactions. See figure 2.5.
Figure 2.5: In the model by Widmark and Nissar (2016) an iteration consistsof Interactions, Insights, Ideation and Trigger material.
1. Interactions, where you are listening, the Explorative phase.
2. Insights, which is where you analyse the Interactions in order to try to un-derstand, the Understanding phase.
3. Ideation, where you find possible ideas and when creation of a new versionof the app is done, the Design phase.
2.6 Service Design Methodology 15
4. Trigger material, where material is developed to test the outcome of ourevaluation in the next round, the Trigger development.
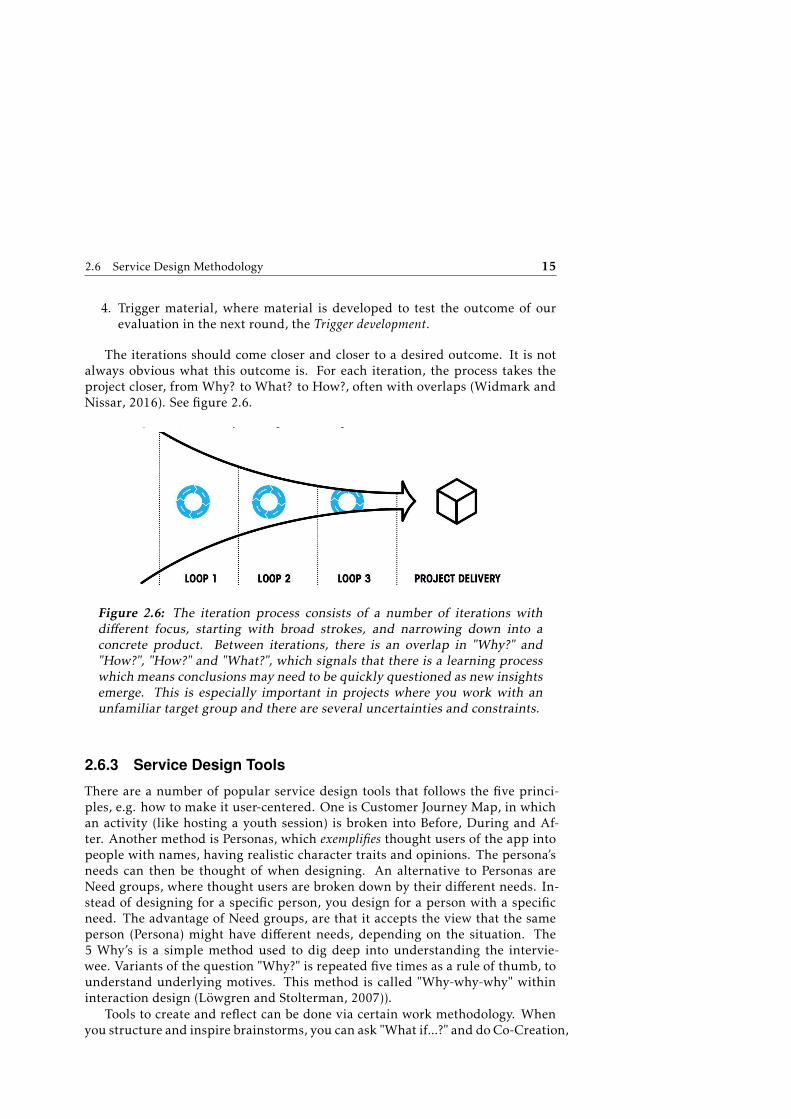
The iterations should come closer and closer to a desired outcome. It is notalways obvious what this outcome is. For each iteration, the process takes theproject closer, from Why? to What? to How?, often with overlaps (Widmark andNissar, 2016). See figure 2.6.
Figure 2.6: The iteration process consists of a number of iterations withdifferent focus, starting with broad strokes, and narrowing down into aconcrete product. Between iterations, there is an overlap in "Why?" and"How?", "How?" and "What?", which signals that there is a learning processwhich means conclusions may need to be quickly questioned as new insightsemerge. This is especially important in projects where you work with anunfamiliar target group and there are several uncertainties and constraints.
2.6.3 Service Design Tools
There are a number of popular service design tools that follows the five princi-ples, e.g. how to make it user-centered. One is Customer Journey Map, in whichan activity (like hosting a youth session) is broken into Before, During and Af-ter. Another method is Personas, which exemplifies thought users of the app intopeople with names, having realistic character traits and opinions. The persona’sneeds can then be thought of when designing. An alternative to Personas areNeed groups, where thought users are broken down by their different needs. In-stead of designing for a specific person, you design for a person with a specificneed. The advantage of Need groups, are that it accepts the view that the sameperson (Persona) might have different needs, depending on the situation. The5 Why’s is a simple method used to dig deep into understanding the intervie-wee. Variants of the question "Why?" is repeated five times as a rule of thumb, tounderstand underlying motives. This method is called "Why-why-why" withininteraction design (Löwgren and Stolterman, 2007)).
Tools to create and reflect can be done via certain work methodology. Whenyou structure and inspire brainstorms, you can ask "What if...?" and do Co-Creation,

16 2 Theory
meaning doing ideation together with stakeholders or users. To create, agile de-velopment can be used, which is often suitable for software engineering. Themanifesto for agile development is (Alliance, 2001):
• Individuals and interactions over processes and tools
• Working software over comprehensive documentation
• Customer collaboration over contract negotiation
• Responding to change over following a plan
An example of an agile methodology is SCRUM, where a project is dividedinto several iterations similar to a service design approach of sequencing, butalso introducing concepts like retrospectives (reflecting on one’s work) and sprintdemo (demonstrating the results of the iteration to stakeholders) (Kniberg, 2005).
There are also some service design best practices: interviews are often donevia open questions (encouraging stories) and dialogue can be facilitated with aquestionnaire guide. In workshops, post-its are often used, and followed up withspecific questions. Service design methodology encourages taking pictures, film-ing and recording audio, benefiting the analysis done afterwards (Widmark andNissar, 2016).
2.7 Digital Service Design
Themethod combines the benefits of Service Design, AgileMethodologies (namelySCRUM) and Interaction Design. Its purpose is to contribute a holistic approachto the digital design solution for a specific target group. The methodology wasco-created by the current author and Expedition Mondial for the master thesis(Nissar, 2016).
2.7.1 The 4 stages of a "Service Sprint"
In Digital Service Design, an iteration is called a service sprint. Each iterationincludes four steps: insights, ideation, trigger material and interactions. Eachstep borrows a number of best practices from agile development or interactiondesign. There are also new methods, like how a field hackathon includes miniservice sprints each day. Below, the four steps are presented.
2.7.2 Step 1 - Insights: Analysis, Retrospective & Stakeholder
feedback
Insights consists of analysis (service design), but also a retrospective (SCRUM) andstakeholder meeting (service design). In the analysis, the app is evaluated (in termsof interaction design - pleasurability, usability, utility and desirability (Clatwor-thy, 2010)), and quantitative data is processed (often by clustering data points)

2.7 Digital Service Design 17
and compared with qualitative data (quiz results and questionnaires). This pro-duces an analysis overview of the result. In the retrospective, the design process isevaluated ("start doing, stop doing, continue doing"), and changes to the designprocess are suggested for the following iteration.
Both the result analysis and the design process analysis is then presentedduring two stakeholder meetings (service design), structured as sprint demos"(SCRUM), with the purpose of getting feedback. The first "Expert meeting" in-forms the next iteration’s design process, while the second "Partner meeting"informs the next iteration’s delivery. From the new insights, a product backlog(SCRUM) is converted from needs and ideas into stories balancing 1) user needsand 2) stakeholder needs.
2.7.3 Step 2 - Ideation: Planning Interactions and Delivery
Ideation consists of doing sprint planning (SCRUM) for the trigger material (a lo-fi or/and a hi-fi prototype) and the interactions (where tests and workshops andfield visits happen).
• Trigger material
1. Ideas are formulated which would satisfy the user needs. This is oftenan iterative process, which happens in dialogue with chosen expertsand entrepreneurs in technology, design and education.
2. To plan the implementation of the ideas, every technical task is laidout, measured in time and prioritized. The least prioritized tasks canthus be cut or moved to the next iteration, in case it is necessary.
• Interactions planning
1. If the technical planning has been realistic, it is time to determine whatthis iteration’s interactions should look like. How will this be tested?
2. The interactions activities are chosen (what, how, when), so that theseare communicated to the local partner, who may schedule the daysthat will be visited, and solves the needs to the best of their ability.
2.7.4 Step 3 - Trigger Material
Trigger material is about preparing the interactions (field visits, interviews, apptests, workshops) and creating the low-fidelity (pen and paper) and high-fidelityprototype (developed app) to be tested with the users. To track the progress andplan effectively, each day starts by a daily stand-up, where today’s targets are set,ending by reflecting if the targets were met. If they were not, either the designprocess needs to change, or something needs to be cut short.

18 2 Theory
2.7.5 Step 4 - Interactions: with "Service Mini-Sprints"
Interactions always consist of a sprint demo with the users with the low-fidelityor high-fidelity prototype. During the development process, these are formativetests, while for final app evaluation, this is a summative test. Group tests arefacilitated as workshops. Often, a scenario is presented, devices are given, resultsare submitted, followed by an open discussion. Individual tests are facilitatedin the field (using the before, during, after technique). I observe how the coachdoes the job today, tests and observes if the app fits into the process, followed byan interview.
These tests always inform what steps to be taken next, both in terms of appdevelopment and interactions. Instead of waiting for the next iteration to dothese changes, often a so-called Service Mini-Sprint is done.
In a service mini-sprint, the insights gathered during the day allows for last-minute adjustments of coming pre-planned workshops (co-define, co-create or co-refine) or field visits (change of interview questions), that can sometimes happenthe same day. To take advantage of the precious time with the coaches, at the endof the day, app improvements are made and tomorrow’s design process revisited.This means, that already the next day, an improved version of the app can betested. Similarly, improvements to a workshop format can be improved. Thesemini-sprints allows for very fast iterations, which can sometimes accelerate theoutcome of the visit.
2.8 Hybrid App Development
The history of app and web development is rich and increasingly intertwined.First, websites were developed for desktop only, and when smartphones becamepopular, they were made responsive. With today’s possibilities of native mobiledevelopment or developing a native app using web technologies, there are nu-merous viable alternatives available if an app should function on several devices,depending on budget and preferences.
One of the main argument for developing an app in web technologies, is thatthe whole application, including the server, can be written in one programminglanguage, JavaScript (full-stack). Tools such as Cordova (Apache, 2011) can thencompile JavaScript applications into native apps. Thus, they can appear on AppleiOS and Android Play Store, as well as on the web, or installable offline on asmartphone from the computer.
JavaScript is developing rapidly as a language, as well as its ecosystem offrameworks and tools. Frameworks have emerged andmatured, like Meteor (Inc.,2016), which makes building full-stack applications in JavaScript reliable andfast. Previously, web hosting has been troublesome for JavaScript server appli-cations. Today, tools such as Heroku (Salesforce, 2007) have introduced free andpaid hosting for such applications, with smart bindings to code platforms such asGitHub (GitHub, 2008), which makes collaboration and version handling easy.
3Research Questions
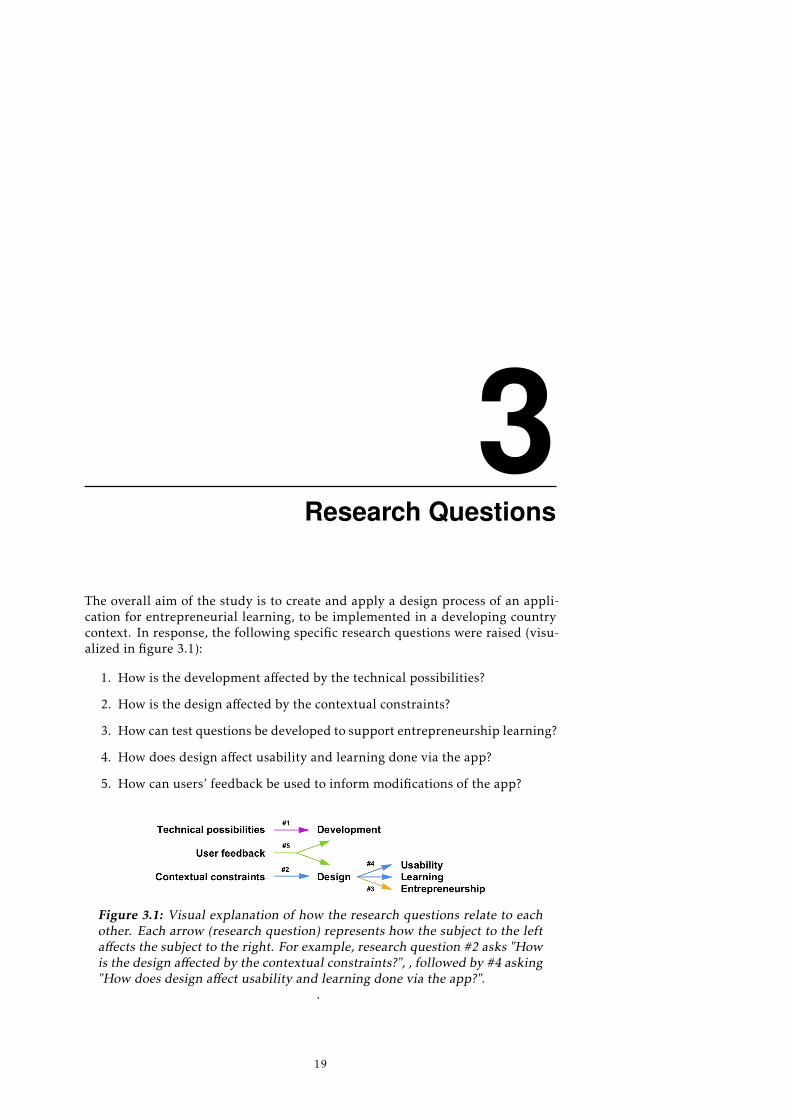
The overall aim of the study is to create and apply a design process of an appli-cation for entrepreneurial learning, to be implemented in a developing countrycontext. In response, the following specific research questions were raised (visu-alized in figure 3.1):
1. How is the development affected by the technical possibilities?
2. How is the design affected by the contextual constraints?
3. How can test questions be developed to support entrepreneurship learning?
4. How does design affect usability and learning done via the app?
5. How can users’ feedback be used to inform modifications of the app?
Figure 3.1: Visual explanation of how the research questions relate to eachother. Each arrow (research question) represents how the subject to the leftaffects the subject to the right. For example, research question #2 asks "Howis the design affected by the contextual constraints?", , followed by #4 asking"How does design affect usability and learning done via the app?".
.
19


4Methods and Implementation
To understand the users of the app and the design possibilities, the setting andresearch context is described, together with a description of the collaborators andparticipants of the master thesis. Subsequently, study design and data collectionis presented, followed by a data analysis framework that presents methods usedto analyse quantitative and qualitative data. Finally, the application implementa-tion is described.
4.1 YoungDrive, Terminology and Limitations
In this section, the organizational structure of YoungDrive and the master thesisis described, also explaining why there is an opportunity to innovate in regardsto mobile technology in Uganda.
4.1.1 Entrepreneurship in Uganda
A couple of prominent facts helps to portrait entrepreneurship activity in Uganda:
• Uganda can be ranked the world’s most entrepreneurial country (with 28%of the population considered entrepreneurs (Lönn, 2015a))
• Uganda is ranked the youngest population in the world (78% of all Ugan-dans are below 30 (Balyesiima and Kaggwa, 2012))
• Uganda has a very high unemployment rate (62 % of people between 18–30are unemployed (AAU, DRT, UNNGOF, 2012))
With a high unemployment rate and little or none social security, starting abusiness is for many young entrepreneurs simply a tool for survival. But tough
21

22 4 Methods and Implementation
conditions can also lead to creativity, and there are as well many innovative en-trepreneurs with great ideas and the aim to create positive social impact (Nissar,2016). As Mitchell and Smith (2007) says about entrepreneurship, the motiva-tion of entrepreneurship does not need to be solely wealth accumulation any-more. The activity of entrepreneurship contributes to society, in a way that isnot captured by the commercial entrepreneurship literature. No matter the rea-son of starting a business, Uganda’s many entrepreneurs are contributing to thenational society by boosting the economy and creating new jobs.
4.1.2 YoungDrive
YoungDrive (2016) is based on a Swedish concept, and had previously had a pilotin Botswana, when tasked with running the entrepreneurship module of A work-ing future for Plan International. The organization fosters and educates youngentrepreneurs in developing countries. They train the coaches, provide trainingmaterial, and support the coaches via direction and direct support through co-project leaders and Youth Mentors.
YoungDrive moves an entrepreneur to location, becoming country managerand "teacher". The teacher educates project leaders during four days, followed byeducating coaches, which then roll out the training to the youth groups during 10sessions, 1 session per week in average. The Community Based Trainers (CBTs)also rolls out other trainings, often simultaneously.
For the future of YoungDrive, they want to make the CBTs even better, andcollect and take use of data (monitoring and evaluation). Another motivationis scaling and monetization, as Plan International wants to increase the projectto more countries, with an increased digital focus, and YoungDrive wants to beindependent of project funding (i.e. a social enterprise).
Given the above, this was a great time to introduce digital enablers for Young-Drive, where there previously had been no technology-focus, especially towardsCBTs and Youth Mentors. The master thesis is the first project which focuses ondigital enablers for YoungDrive.
4.1.3 Roles within YoungDrive
The country manager trains the project leaders. It is also the main person responsi-ble for partnerships and the quality of the YoungDrive program in the respectivecountry. In Uganda, the country manager is Iliana Björling. She is located in theUganda capital, Kampala, which is a strategic location because it is the same cityin which the national office of the main partner, Plan International, is located. InZambia, the country manager is Josefina Lönn, who previously was the projectleader in Kampala, and has held all the trainings up to this point. Now, she leadsthe operations and has trained the coaches in Zambia, in the new role of countrymanager and project leader.
The project leaders train the coaches and oversee the coaches, manages thecoach training, and also collaborates with local stakeholders for quality assuranceand to oversee daily operations.
4.2 Collaborators for the Master Thesis 23
The coaches train the youth. In Zambia, a coach only has responsibility fortraining youth in the YoungDrive program. In Uganda, this is called a YouthMentor (YM), in contrast to being a Community Based Trainer (CBT), which alsotrains the youth in other programs and leads the youth saving groups. Most of theCBT’s in Uganda holds sessions together with a Youth Mentor, or divides work be-tween them, instead of being alone. The coaches are often volunteers, receivinga small scholarship from the partner organization. They are often business own-ers themselves. The coaches could be described as social entrepreneurs (Mitchelland Smith, 2007). Many of the YoungDrive coaches (and youth) are driven bythat their business can have an impact on their community, as well as take themout of unemployment or increase their current livelihood.
The youth are the ones receiving the training from the CBTs and the YMs,being encouraged to start their own businesses.
4.1.4 Mobile Technology in Uganda’s Rural Areas
One of the reasons why mobile services are growing rapidly in Uganda is thatthe country has invested heavily in communication networks, even connectingremote rural villages with fibre optic cables and thereby connecting them to aworld of information.
As much as 65% of the adults in Uganda owns a cell phone, which has al-lowed many areas in the country to skip the landline stage of development andjump right to the digital age. For those who hasn’t electricity at home, there areavailable charging booths for mobiles all over the country.
The wide use of mobile phones in Uganda and other developing countries haslead the way for the development of several innovative mobile services and inmany cases the mobile services are way ahead of us (Nissar, 2016). In Swedenmobile banking services that allows us to transfer money through our mobilephones were made popular with Swish, introduced in 2012. In the neighbouringcountry Kenya, people have had similar services for the last 10 years, and mobilemoney is since long also common in Uganda.
A prominent example of an app that has previously been developed with thetarget group in mind is Ledger Link (Foundation, 2014). This mobile bankingservice empowers, developed in partnership with a bank, allows saving groupsin rural areas such as Tororo to save money remotely. It is developed with human-centered design methods, and has won several awards.
4.2 Collaborators for the Master Thesis
Collaborators in the project are the current author, supervisors, stakeholders andexperts. Below, the responsibilities of these are more clearly laid out.
4.2.1 The Current Author
It is needed to take on several roles in the project by the current author: mostnotably that of a project leader, designer and developer. It is needed to balance
24 4 Methods and Implementation
stakeholders’ different opinions and requirements, and caring for the vision inorder for the project to be successful (see section 2.5.1 A Good Designer).
There are two groups, with the current author included in both of them, whichgather at the end of each sprint for a check-up meeting. The Expert group con-sisted of Expedition Mondial and LiU Innovation. Expedition Mondial couldhelp with the design process, and LiU Innovation could offer input on social in-novation. The meetings mostly lasted for one hour. The Partner group consistedIliana Björling from YoungDrive, and Lena Tibell and Konrad Schönborn fromLinköping University. In Partner meetings, the insights from each iteration waspresented and discussed. Then possible decisions were laid out, followed by dis-cussing the alternatives. Outside of these groups, these people can also give ad-vice in certain situations. For specific areas, there are also some experts whichhave been beneficial during the projects. Below, the whole team is explained:
4.2.2 Supervisors
The supervisors are from YoungDrive and Linköping University. The Young-Drive team consists of Iliana Björling, founder of YoungDrive, and Josefina Lönn,country manager in Zambia. They are both helpful in giving knowledge on theentrepreneurship education program, and giving support. The Linköping Uni-versity team consists of Lena Tibell, Professor, and Konrad Schönborn, Doctor,within the Department of Visual Learning and Communication.
4.2.3 Stakeholders
The stakeholders are considered YoungDrive and Plan International. YoungDriveis the client of the work, and their needs should be satisfied. This person is mainlyrepresented by Iliana Björling, who is part of the YoungDrive Strategic Manage-ment Team. Using service design, the project leaders in Uganda and Zambia, arealso considered stakeholders: Josefina Lönn in Zambia, and the two co-projectleaders in Uganda. Finally, the most important stakeholder of all according toservice design, is the actual users: the coaches. They should be the main consid-eration of the work.
Plan International is the organization allowing for all the interactions withthe end users in Uganda. A similar organization is operational in Zambia. Theyare the ones that are providing facilities, organizes transport, etcetera. They inturn, have the organization Community Vision, which organizes the coaches. IfPlan International or Community Vision does not appreciate of the project andthe collaboration, then the interactions with the coaches will not be possible.
4.2.4 Advisors
Since the development country context is new to the current author, there are alsospecific experts advised in the project. For design process, Susanna Nissar andErik Widmark from Expedition Mondial has supported with all of their knowl-edge within service design. Julien Tantege, Research Specialist at Grameen Foun-

4.3 Describing the YoungDrive Coaches and the Research Context 25
dation, has been kind to offer support before and during the work, sharing theirinsights from related work, and giving feedback during ideation. She has experi-ence doing technical development for rural areas. For pedagogical development,Henrik Marklund from edtech startup Knownly in Sweden has given supportwith regards to building skills within digital learning. For feedback for how thework relates to social innovation, Peter Gahnström at LiU Innovation has offeredfeedback.
4.3 Describing the YoungDrive Coaches and the
Research Context
The biggest challenge with regards to time constraints and cultural differencesis that it is difficult to understand the target group of the app. Therefore, thewhole design and development process will take place in Uganda, with severalinteractions with the intended users. The work was carried out from Hive Co-lab, a co-working space and an innovation hub. The work is done mainly fromKampala, because that is where YoungDrive is situated, meaning that there isstill a long distance to the coaches and youth in Tororo, which is located near theKenyan border. Another challenge with being in Uganda compared to Sweden isthat internet speed and access is worse, especially outside Kampala.
The interactions took place in either Uganda or Zambia, in the locations wheretraining of the coaches and youth takes place. There were a number of resourcesmade available to support the work, for example the YoungDrive manuals. Eachyouth is given a Participant manual, describing each week of the 10-week Young-Drive program. Coaches are also given a Coach guide, which describes how tocarry out and teach each week’s topic during the youth training. As most of thecoaches did not have smartphones or tablets, four smartphones (3 Android, 1iOS) and ten tablets (3 Android, 7 iOS) were brought from Sweden. All of thesedevices had a web browser and access to an app store. These were either donated,borrowed or bought devices. During the user tests, also using a laptop would betested. The following section describes the Ugandian and Zambian coaches andtheir businesses.
4.3.1 Social Characteristics and Businesses in Uganda
According to statistics gathered by YoungDrive during 2015 evaluations (Lönn,2015c), there are a number of considerations to make regarding the coaches inUganda. This regards entrepreneurship experience, technical access, and lan-guage, see a summary in figure 4.1. Taken together the coaches’ and project lead-ers’ technical skills are currently low, and this needs to be in consideration whendesigning the app. Regarding language, English can be used in the coach app.
The coaches in Tororo are divided into three different regions. Based on re-gion, income and experience, they run different kinds of businesses. 1 In Tororo,
1In Uganda and Zambia, a small-scale business is typically not registered. Thus, the coaches’definition of a business can be more generous.

26 4 Methods and Implementation
Figure 4.1: Table showing entrepreneurship experience, technical access,and language between Tororo coaches and the project leaders in Uganda andZambia. All of the Tororo coaches run a business (with a majority runningmore than one). This means they do have practical experience of runninga business outside of the YoungDrive coach training. While all have a cellphone, smartphones are very uncommon - only 3 uses Internet on the phone,every day or weekly (mostly for Facebook or email). Regarding power, nonehas power at home, 3/26 has solar, and only 4/26 can write on a computer.While about half of the asked Uganda youth can not understand (129/225),read (133/225) or write (132/225) English, most of the coaches in Ugandaare proficient. These characteristics are similar for youth and project leadersas well.
.
the coaches’ businesses range from: pineapple, water melon, onion, chili, bak-ery, catering, corn, beans, fabric, plastic products, bird farm, milk, fish, groundnuts, cabbage, tomato, hairdresser, sewer, shop and rice. For photograph of theenvironment, see figure 4.2.
Figure 4.2: One of the co-project leaders showing the rural part of Tororo,where crops are growing close to where he lives.
.
In Tororo, there are 2 Project Leaders. one project leader’s business rangefrom: bakery, corn, pig farm and plastic products. The other person’s businessrange from: silver fish, beans, corn, and bird farm. In comparison, in Kamuli,there are 4 Project Leaders. Their businesses range from: selling office supply, mo-torcycle taxi, bird farm, pig farm, green pepper, corn, cabbage, tomato, aubergine,chipati ("bread"), chilli, and charging of cellphones.
Among the youth, the top 8 most popular businesses in Tororo, with 134

4.4 Study Design and Data Collection 27
respondents, are corn, cassava ("potato"), saloon, fish, making of bricks, beans,brooms and rope. These range from 9 for corn (6.7%) to 5 for rope (3.7%).
4.3.2 Social Characteristics and Businesses in Zambia
During the visit in Zambia, the coaches had not yet formed their youth groups,and started their own teaching. Regarding characteristics, ages ranged from 21-39 years old (26.8 average). Other data available about the coaches were notesof the Zambian coach job interviews, which could be compared with during quizanalysis (Lönn, 2015b). Compared with Uganda, 9 out of 10 had business experi-ence.
4.4 Study Design and Data Collection
As a computer expert with social skills needing to design and develop an appfor an unfamiliar cultural and socio-economic context, it was needed to quicklybecome a good designer. The technical aspect of the project was but one. It wasneeded to learn how to develop hybrid apps in JavaScript that worked offline, andhad an online back-end. However, those are merely the technical demands.
It was needed to quickly become a good designer, not mainly from a perspec-tive of graphic design or interaction design, but how to explore, design, and im-plement what the user needs from the requirements "fun, user-friendly, and goodfor learning". There was also a need to evaluate the effectiveness of the implemen-tations, to assess learning and the interaction design aspects of desirability, utility,usability and pleasurability. The approach used to learn design from these per-spectives was to read extensive literature, consult a diverse set of experts, and behumble and curious in interactions with the end-users and stakeholders. In thefollowing section, the creation and implementation for a suitable design processis described, together with the study design and data collection for each iterationof the project.
4.4.1 Creation of Design Process
As there was a unfamiliar target group - mostly young Ugandans with little orno experience of smartphones - service design thinking would benefit true under-standing of cultural context and in-depth empathy for the end users. Tools andmethodology in service design were chosen with the help of Expedition Mondialin Stockholm, who provided education and coaching.
The end result would be a digital artefact (an app), which is not common inservice design. While this product could be thought of as a service, the toolsand methodology would benefit to borrow from Agile methodology and Interac-tion design. Being a computer expert kind of designer (Löwgren and Stolterman,2007) helps being adjusted to agile methodology and interaction design. How-ever, aspiring to be a socio-technical expert, Expedition Mondial are consulted,who are experienced with service design, and are aspiring to be more of computerexperts. This led to the joined development of a Digital Service Design method,
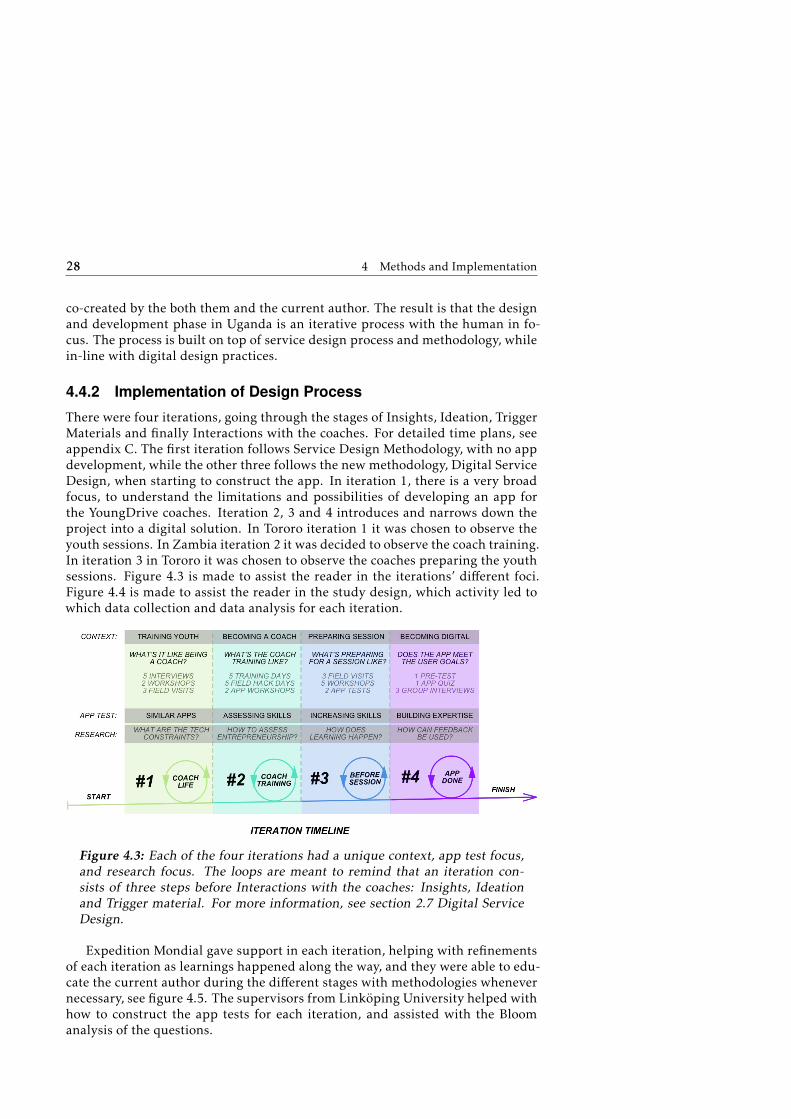
28 4 Methods and Implementation
co-created by the both them and the current author. The result is that the designand development phase in Uganda is an iterative process with the human in fo-cus. The process is built on top of service design process and methodology, whilein-line with digital design practices.
4.4.2 Implementation of Design Process
There were four iterations, going through the stages of Insights, Ideation, TriggerMaterials and finally Interactions with the coaches. For detailed time plans, seeappendix C. The first iteration follows Service Design Methodology, with no appdevelopment, while the other three follows the new methodology, Digital ServiceDesign, when starting to construct the app. In iteration 1, there is a very broadfocus, to understand the limitations and possibilities of developing an app forthe YoungDrive coaches. Iteration 2, 3 and 4 introduces and narrows down theproject into a digital solution. In Tororo iteration 1 it was chosen to observe theyouth sessions. In Zambia iteration 2 it was decided to observe the coach training.In iteration 3 in Tororo it was chosen to observe the coaches preparing the youthsessions. Figure 4.3 is made to assist the reader in the iterations’ different foci.Figure 4.4 is made to assist the reader in the study design, which activity led towhich data collection and data analysis for each iteration.
Figure 4.3: Each of the four iterations had a unique context, app test focus,and research focus. The loops are meant to remind that an iteration con-sists of three steps before Interactions with the coaches: Insights, Ideationand Trigger material. For more information, see section 2.7 Digital ServiceDesign.
Expedition Mondial gave support in each iteration, helping with refinementsof each iteration as learnings happened along the way, and they were able to edu-cate the current author during the different stages with methodologies whenevernecessary, see figure 4.5. The supervisors from Linköping University helped withhow to construct the app tests for each iteration, and assisted with the Bloomanalysis of the questions.
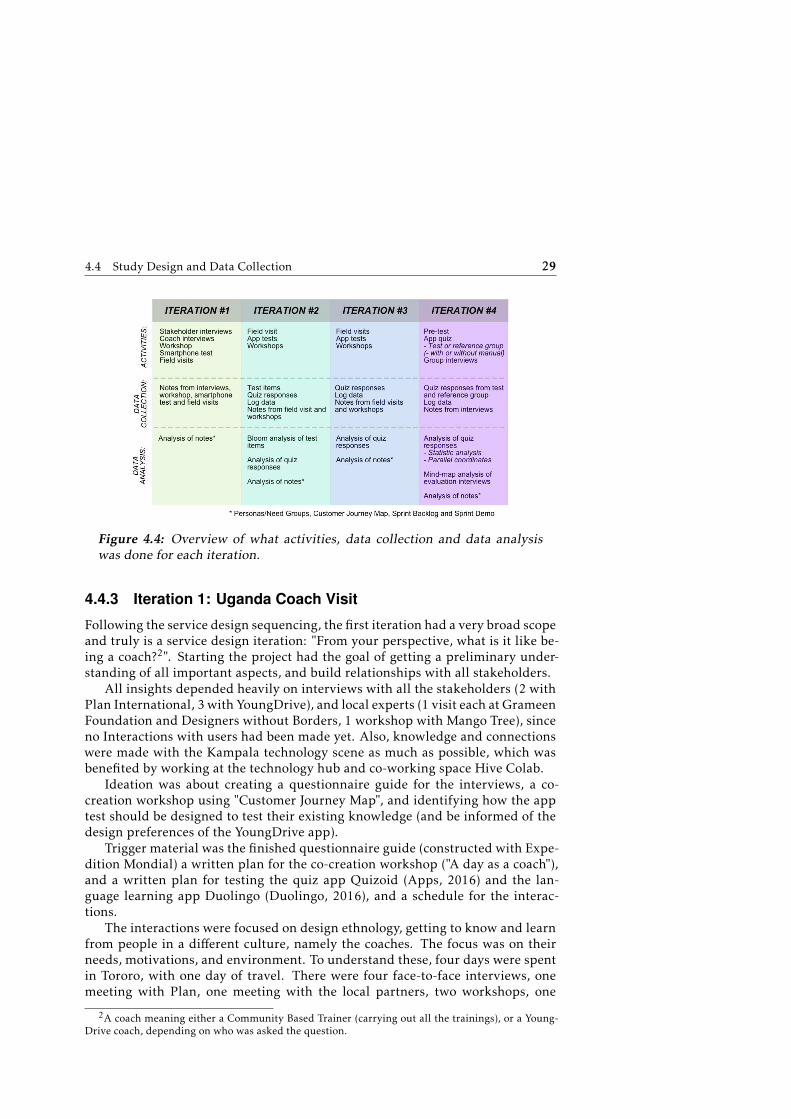
4.4 Study Design and Data Collection 29
Figure 4.4: Overview of what activities, data collection and data analysiswas done for each iteration.
4.4.3 Iteration 1: Uganda Coach Visit
Following the service design sequencing, the first iteration had a very broad scopeand truly is a service design iteration: "From your perspective, what is it like be-ing a coach?2". Starting the project had the goal of getting a preliminary under-standing of all important aspects, and build relationships with all stakeholders.
All insights depended heavily on interviews with all the stakeholders (2 withPlan International, 3 with YoungDrive), and local experts (1 visit each at GrameenFoundation and Designers without Borders, 1 workshop with Mango Tree), sinceno Interactions with users had been made yet. Also, knowledge and connectionswere made with the Kampala technology scene as much as possible, which wasbenefited by working at the technology hub and co-working space Hive Colab.
Ideation was about creating a questionnaire guide for the interviews, a co-creation workshop using "Customer Journey Map", and identifying how the apptest should be designed to test their existing knowledge (and be informed of thedesign preferences of the YoungDrive app).
Trigger material was the finished questionnaire guide (constructed with Expe-dition Mondial) a written plan for the co-creation workshop ("A day as a coach"),and a written plan for testing the quiz app Quizoid (Apps, 2016) and the lan-guage learning app Duolingo (Duolingo, 2016), and a schedule for the interac-tions.
The interactions were focused on design ethnology, getting to know and learnfrom people in a different culture, namely the coaches. The focus was on theirneeds, motivations, and environment. To understand these, four days were spentin Tororo, with one day of travel. There were four face-to-face interviews, onemeeting with Plan, one meeting with the local partners, two workshops, one
2A coach meaning either a Community Based Trainer (carrying out all the trainings), or a Young-Drive coach, depending on who was asked the question.
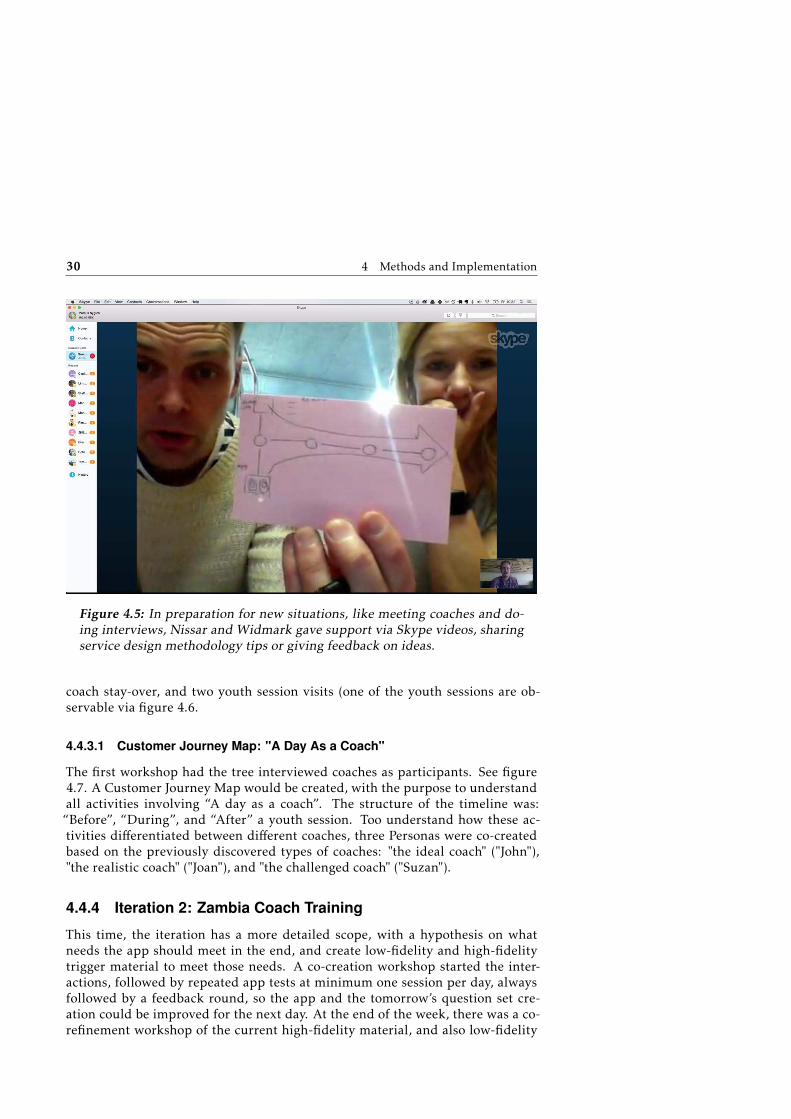
30 4 Methods and Implementation
Figure 4.5: In preparation for new situations, like meeting coaches and do-ing interviews, Nissar and Widmark gave support via Skype videos, sharingservice design methodology tips or giving feedback on ideas.
coach stay-over, and two youth session visits (one of the youth sessions are ob-servable via figure 4.6.
4.4.3.1 Customer Journey Map: "A Day As a Coach"
The first workshop had the tree interviewed coaches as participants. See figure4.7. A Customer Journey Map would be created, with the purpose to understandall activities involving “A day as a coach”. The structure of the timeline was:“Before”, “During”, and “After” a youth session. Too understand how these ac-tivities differentiated between different coaches, three Personas were co-createdbased on the previously discovered types of coaches: "the ideal coach" ("John"),"the realistic coach" ("Joan"), and "the challenged coach" ("Suzan").
4.4.4 Iteration 2: Zambia Coach Training
This time, the iteration has a more detailed scope, with a hypothesis on whatneeds the app should meet in the end, and create low-fidelity and high-fidelitytrigger material to meet those needs. A co-creation workshop started the inter-actions, followed by repeated app tests at minimum one session per day, alwaysfollowed by a feedback round, so the app and the tomorrow’s question set cre-ation could be improved for the next day. At the end of the week, there was a co-refinement workshop of the current high-fidelity material, and also low-fidelity

4.4 Study Design and Data Collection 31
Figure 4.6: Photograph from the location where one of the youth sessionswere held. Here, a YoungDrive coach in Tororo teaches youth in basic salesand marketing.
Figure 4.7: Two local project leaders and one coach mapping out the activi-ties a coach does before, during and after hosting a youth session, in what iscalled a Customer Journey Map.
material for the new version of the app.
4.4.4.1 Creation of Questions
Project leader Josefina in Zambia refined Iliana’s first question sets, prepared forthe visit to Zambia. Josefina created question sets mostly taking into account thestructure and the order of the coach manuals, what it means being a coach withinthe topic, and lastly scenarios, but also thinking about assessing a variation oflevels on Bloom’s Revised Taxonomy. After the interactions, the questions createdfrom were analysed using Bloom’s Revised Taxonomy in partnership with thesupervisors from Linköping University.
4.4.4.2 Trigger Material Used
A high-fidelity trigger material was done, a very basic quiz app, keeping it as sim-ple as possible (see Application Implementation, Iteration 2). All of the devices

32 4 Methods and Implementation
(tablets and smartphones) that were kept in Kampala were brought to Zambia.Josefina’s questions were added to the app, and the app was installed on all of thedevices. This process was repeated for all the days, Sunday-Friday.
4.4.4.3 Design Workshop #1 in Zambia
The coach training started with having a design workshop with all (10/10) of thecoaches, see figure 4.8. The co-creation workshop was made to let the coachescreate a low-fidelity prototype, and as a result identify important functionalityin theminds of the coaches, before being biased by seeing the high-fidelity triggermaterial created in advance.
1. Since the experience with smartphones and apps were mostly non-existing,an introducing to these topics was made.
2. All were familiar with what Facebook was, so thus the Facebook app wasshown as an example. Wanting to know what the app would look like if thecoaches would have designed the app, they were trained how to design anapp via drawing wireframes.
3. Using post-its, they started with during limited time drawing the start viewfrom the Facebook app.
4. Then, they were asked to draw what they thought happened on the friendicon click, drawing the view on another post-it.
5. Then, the mission of the YoungDrive app was described: "If you would begiven a quiz app now, what would you like it to be like? It’s main purpose,is to assess what you’ve learned throughout the day. How would you designit? What happens when you open the app?". They were then divided intothree teams, having limited time to draw the best imaginable YoungDrivecoach quiz app they could. First, they designed the app from the top oftheir heads. They then pitched their results to each other.
6. On the next iteration, they were to suggest and design improvements howthe app should be designed to improve learning, not only assessment. "It’ssecondary purpose, is to practise what you’ve learned throughout the day.What would be different?" They then again pitched their results to eachother.
In addition to helping to understand the coaches, the design proposals werephotographed and served as guidance formodifications of the existing app through-out the week.
4.4.4.4 Assessment via Quiz
At the end of each day, the app was used to test the coaches’ knowledge. Eachcoach got either a smartphone, tablet or computer. The coach first took the quizfor the most recent session, and could then choose what to do next.

4.4 Study Design and Data Collection 33
Figure 4.8: Each person designed a YoungDrive app first for assessment,then adapting the app for learning. They were allowed to test the smart-phones and tablets, and use the apps Quizoid or Duolingo for reference.
As there was no back-end developed, Josefina by hand documented the scoresof each coach, writing the name of the coach, the session, number of correct an-swers, and what questions had been answered wrong. Josefina then, when plan-ning the next day, looked at the statistics, looking for trends that would informthe sessions for the following day. She also evaluated the quality of the questions,before creating the new question sets for the next day.
4.4.4.5 Experimenting with Quiz Before or After the Session
Since the coaches appreciated the app somuch, we felt tempted to try what wouldhappen with fun and learning if we tried using the app before a session instead ofonly after. During the rest of the week, we continued, finally finding preferencesand tendencies from the coaches, via observation, interviews, and survey.
4.4.4.6 Experimenting with Design of Questions
During the week, extra tests were done to test the following:
• Number of questions per quiz
• Single-answer questions or multiple-answer questions
• Framing of questions
• Challenge level of questions
• Determining what made a question hard
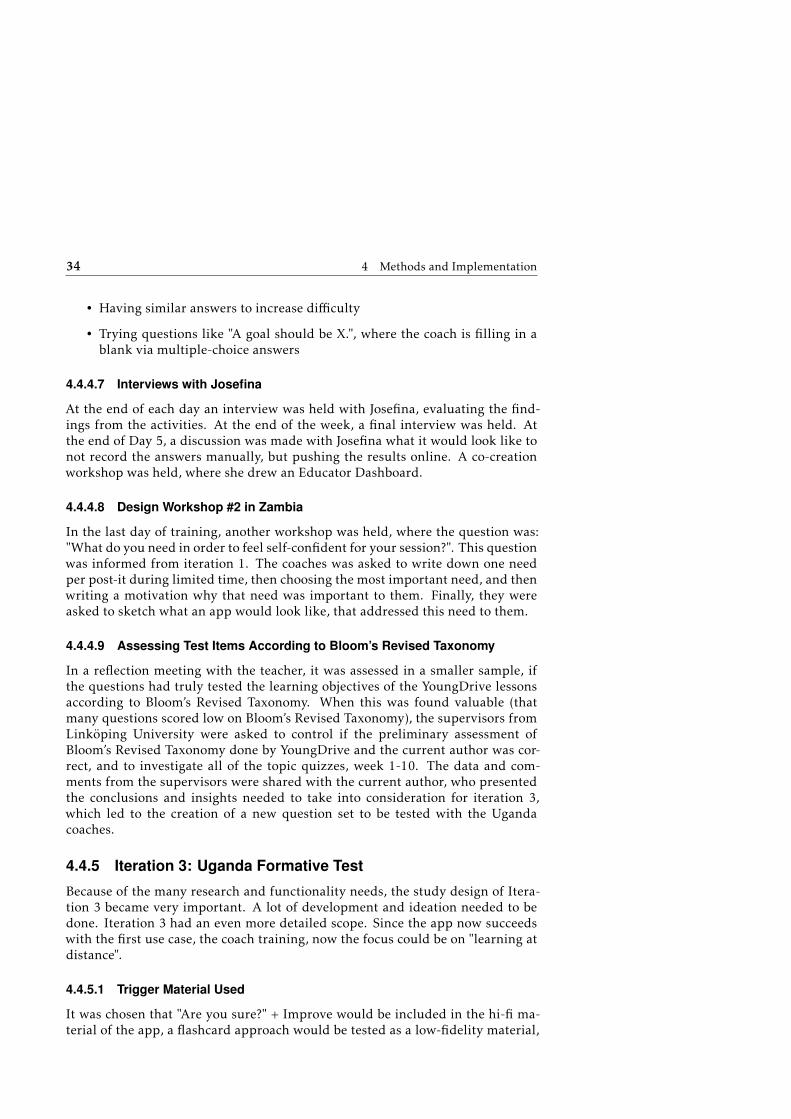
34 4 Methods and Implementation
• Having similar answers to increase difficulty
• Trying questions like "A goal should be X.", where the coach is filling in ablank via multiple-choice answers
4.4.4.7 Interviews with Josefina
At the end of each day an interview was held with Josefina, evaluating the find-ings from the activities. At the end of the week, a final interview was held. Atthe end of Day 5, a discussion was made with Josefina what it would look like tonot record the answers manually, but pushing the results online. A co-creationworkshop was held, where she drew an Educator Dashboard.
4.4.4.8 Design Workshop #2 in Zambia
In the last day of training, another workshop was held, where the question was:"What do you need in order to feel self-confident for your session?". This questionwas informed from iteration 1. The coaches was asked to write down one needper post-it during limited time, then choosing the most important need, and thenwriting a motivation why that need was important to them. Finally, they wereasked to sketch what an app would look like, that addressed this need to them.
4.4.4.9 Assessing Test Items According to Bloom’s Revised Taxonomy
In a reflection meeting with the teacher, it was assessed in a smaller sample, ifthe questions had truly tested the learning objectives of the YoungDrive lessonsaccording to Bloom’s Revised Taxonomy. When this was found valuable (thatmany questions scored low on Bloom’s Revised Taxonomy), the supervisors fromLinköping University were asked to control if the preliminary assessment ofBloom’s Revised Taxonomy done by YoungDrive and the current author was cor-rect, and to investigate all of the topic quizzes, week 1-10. The data and com-ments from the supervisors were shared with the current author, who presentedthe conclusions and insights needed to take into consideration for iteration 3,which led to the creation of a new question set to be tested with the Ugandacoaches.
4.4.5 Iteration 3: Uganda Formative Test
Because of the many research and functionality needs, the study design of Itera-tion 3 became very important. A lot of development and ideation needed to bedone. Iteration 3 had an even more detailed scope. Since the app now succeedswith the first use case, the coach training, now the focus could be on "learning atdistance".
4.4.5.1 Trigger Material Used
It was chosen that "Are you sure?" + Improve would be included in the hi-fi ma-terial of the app, a flashcard approach would be tested as a low-fidelity material,

4.4 Study Design and Data Collection 35
and to "record answer via voice" could only be presented as an idea during a fieldinterview (experts said there would be usability issues, and the first-time smart-phone user agreed). The Gold/Silver/Bronze reward system was included in thehigh-fidelity material.
4.4.5.2 Interaction Activities in Uganda
Instead of only testing the app in Tororo, because of the major changes, a testwas held in Kampala, to early get feedback from an entrepreneurship student.During the test in Tororo, as Plan International staff are not allowed to supportvisiting coaches in the field during local elections, the co-project leaders in Tororowere consulted to carry out the field trips, so that it was still possible to attendthe youth group meetings.
For the interactions, a big app test was held, a group interview was held, andthen they were divided into co-creation workshop groups, with a presentation inthe end. There was another partner meeting, with Plan International and Com-munity Vision present. There was an app test with all of the coaches, "Testing theYoungDrive coach app", followed up by splitting into six workshop groups basedon solving different problems discovered during the test.
The following day, there were three field visits to CBTs, observing how theyprepared themselves for a youth session, and then observe usage of the app im-mediately after having prepared a youth session for assessing and becoming pre-pared for a session.
The app test simulated the app being used to assess preparedness for a youthsession.
After the high-fidelity app test, it was tested with a low-fidelity prototype thatthe coach thinks aloud about the question, before receiving the multiple-choiceanswers. This test was done as a live quiz, and if the interviewee could not an-swer the question directly, the audience were asked and tested if they knew theanswer (raised hands), and if nobody knew the answer, it was tested which of themultiple-choice alternatives they found most likely. During the afternoon, thecoaches were divided into five groups focusing on improving the app experiencefor the coaches.
OnWednesday, the coaches from the field visits were gathered for a workshop.The purpose was to see how they acted when given the challenge: "Get 100% cor-rect answers in one go, on the hardest quiz". A co-creation workshop ("EducatorDashboard") was held in parallel, with 3 CBTs and 1 project leader respectively.
4.4.6 Iteration 4: Uganda Summative Test
The focus of iteration 4 was a summative test, to assess the learning effect of theapp. First, a pre-test was carried out in paper, including questions about thecoach and an entrepreneurship quiz, based on a well-known study (Walstad andKourilsky, 1998), see Appendix B. During the test, this was the first time that theapp could send data to the server. Data was sent whenever a quiz was started,and whenever a quiz was finished. The group was divided into two, the ones who
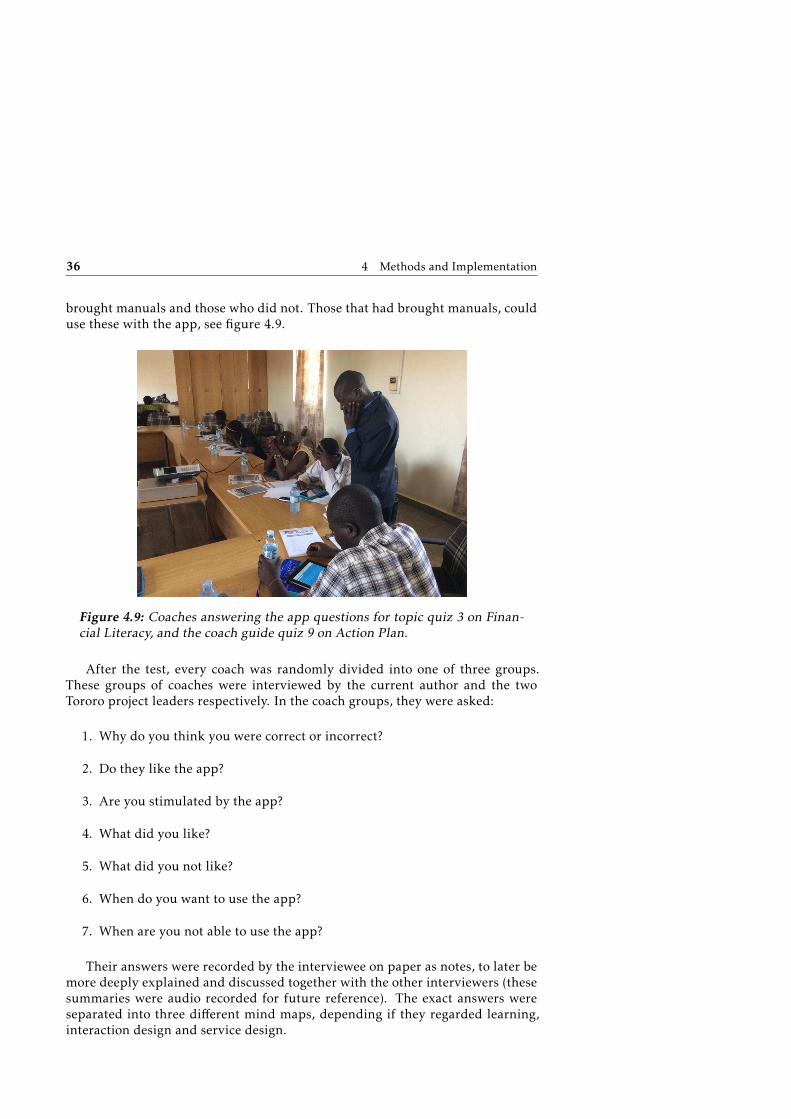
36 4 Methods and Implementation
brought manuals and those who did not. Those that had brought manuals, coulduse these with the app, see figure 4.9.
Figure 4.9: Coaches answering the app questions for topic quiz 3 on Finan-cial Literacy, and the coach guide quiz 9 on Action Plan.
After the test, every coach was randomly divided into one of three groups.These groups of coaches were interviewed by the current author and the twoTororo project leaders respectively. In the coach groups, they were asked:
1. Why do you think you were correct or incorrect?
2. Do they like the app?
3. Are you stimulated by the app?
4. What did you like?
5. What did you not like?
6. When do you want to use the app?
7. When are you not able to use the app?
Their answers were recorded by the interviewee on paper as notes, to later bemore deeply explained and discussed together with the other interviewers (thesesummaries were audio recorded for future reference). The exact answers wereseparated into three different mind maps, depending if they regarded learning,interaction design and service design.

4.5 Data Analysis Framework 37
4.5 Data Analysis Framework
The results from each iteration needed to be analysed, see the previous figure4.4. Depending on the kind of activity and results gathered, different data is col-lected. For qualitative methods, the output is almost always notes and observa-tions, which are then concluded into insights. These insights, can then sometimesbe used in the analysis methods described in the section below. For quantitativedata, the output is almost always quiz results or data about the coaches. Howthese can be analysed is explained immediately afterwards, together with imple-mentation.
4.5.1 Data Analysis Methods
For analysing qualitative data in the research phase, Personas or Need groupsare methods to analyse the though users of a product or a service. A CustomerJourney Map supports understanding of how such users interact with a productor a service. Getting feedback from users involves getting ideas or suggestionsfor improvement of a product or a service. To analyse these, a sprint backlog isused to keep track of the priority of such feedback. Weather or not the featuresare then successfully implemented in the eyes of the users and stakeholders, canbe tested using a sprint demo, where feedback is gathered for future work. Thesemethods can be more closely read about below, together with analysing notes, logdata and test items.
4.5.1.1 Persona or Need groups
When creating a product or a service, it is important to understand who you aredesigning for. Since the intended users might not always be around during thedevelopment phase, it helps to have a clear mental image of the user. Fictionalexamples of users are one method to do this, either by using personas or needgroups. In this project, this is especially important, as a lot of development is off-site from the intended users, and the current author has no previous experienceinteracting with the intended users.
A persona is a fictional character, created to give an example of the user whoyou are designing your service for (Stickdorn and Schneider, 2010). Dependingon how broad the target group is for the service you are building, the personamight have several different needs. Then, dividing the intended user groups interms of designing for their different needs than their character traits might bemore helpful (Widmark and Nissar, 2016). Dividing users by needs, if calledforming need groups. A need group (like "The beginner" or "The planner") can bedescribed by their behaviour and their need. Personas and need groups shouldbe developed from research insights gathered from interviews or workshops withusers and stakeholders (Stickdorn and Schneider, 2010).

38 4 Methods and Implementation
4.5.1.2 Customer Journey Map
A customer journey map is said to provide a vivid but structured visualisationof a service user’s experience (Stickdorn and Schneider, 2010). A typical cus-tomer journey is multi-channel and time-based, see figure 4.10. The customerjourney map is beneficial both for understanding a user’s touchpoints with a ser-vice, and also for collecting and analysing stories which explain why the jour-neys happened as they did (Stickdorn and Schneider, 2010). In this project, theCustomer Journey Map is used to understand the activities that happen before,during and after having a youth session, and how these activities differentiate bydifferent types of coaches (by persona and need group).
Figure 4.10: General example of a customer service map. Themap is dividedby channel (could also be by a persona) and time (in this case before, duringand after using a service).
4.5.1.3 Sprint Backlog and Sprint Planning
During product development, to do a sprint backlog serves as a type of data anal-ysis. When a high altitude of ideas and feedback has been gathered, a sprintbacklog is a list sorted with the most important and urgent items on top. To workthrough ideas in a structured way, requests are categorized into what is called"stories". A good story answers "As a [user type] I want to be able to do [feature]so that [benefit]". Each story can then be broken down into tasks ("What needs tobe done in order to satisfy the story?"). During the sprint planning, at the start ofeach iteration, the most important stories and tasks are identified. By analysingand then working on the most prioritized story and task, you ensure that you arealways working on what is most important for the success of the project. In thisproject, the sprint backlog is used to determine what actions needs to be priori-tized in order to accomplish the goals set up during sprint planning.
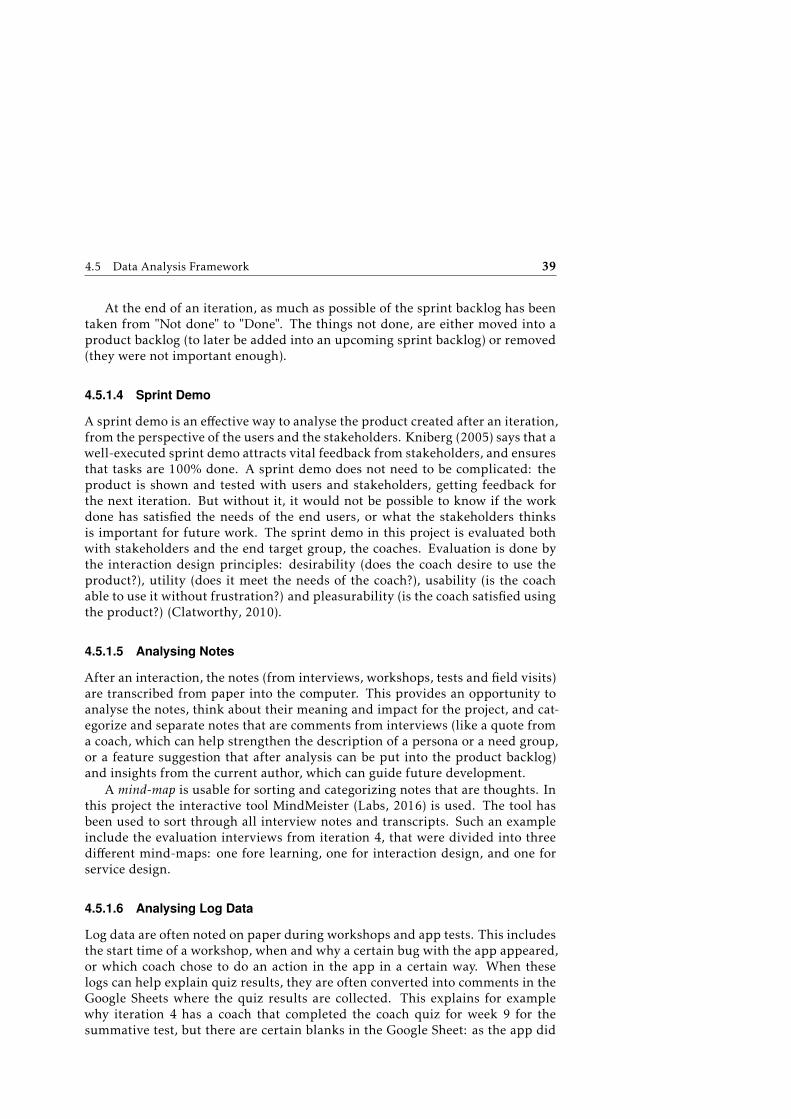
4.5 Data Analysis Framework 39
At the end of an iteration, as much as possible of the sprint backlog has beentaken from "Not done" to "Done". The things not done, are either moved into aproduct backlog (to later be added into an upcoming sprint backlog) or removed(they were not important enough).
4.5.1.4 Sprint Demo
A sprint demo is an effective way to analyse the product created after an iteration,from the perspective of the users and the stakeholders. Kniberg (2005) says that awell-executed sprint demo attracts vital feedback from stakeholders, and ensuresthat tasks are 100% done. A sprint demo does not need to be complicated: theproduct is shown and tested with users and stakeholders, getting feedback forthe next iteration. But without it, it would not be possible to know if the workdone has satisfied the needs of the end users, or what the stakeholders thinksis important for future work. The sprint demo in this project is evaluated bothwith stakeholders and the end target group, the coaches. Evaluation is done bythe interaction design principles: desirability (does the coach desire to use theproduct?), utility (does it meet the needs of the coach?), usability (is the coachable to use it without frustration?) and pleasurability (is the coach satisfied usingthe product?) (Clatworthy, 2010).
4.5.1.5 Analysing Notes
After an interaction, the notes (from interviews, workshops, tests and field visits)are transcribed from paper into the computer. This provides an opportunity toanalyse the notes, think about their meaning and impact for the project, and cat-egorize and separate notes that are comments from interviews (like a quote froma coach, which can help strengthen the description of a persona or a need group,or a feature suggestion that after analysis can be put into the product backlog)and insights from the current author, which can guide future development.
A mind-map is usable for sorting and categorizing notes that are thoughts. Inthis project the interactive tool MindMeister (Labs, 2016) is used. The tool hasbeen used to sort through all interview notes and transcripts. Such an exampleinclude the evaluation interviews from iteration 4, that were divided into threedifferent mind-maps: one fore learning, one for interaction design, and one forservice design.
4.5.1.6 Analysing Log Data
Log data are often noted on paper during workshops and app tests. This includesthe start time of a workshop, when and why a certain bug with the app appeared,or which coach chose to do an action in the app in a certain way. When theselogs can help explain quiz results, they are often converted into comments in theGoogle Sheets where the quiz results are collected. This explains for examplewhy iteration 4 has a coach that completed the coach quiz for week 9 for thesummative test, but there are certain blanks in the Google Sheet: as the app did
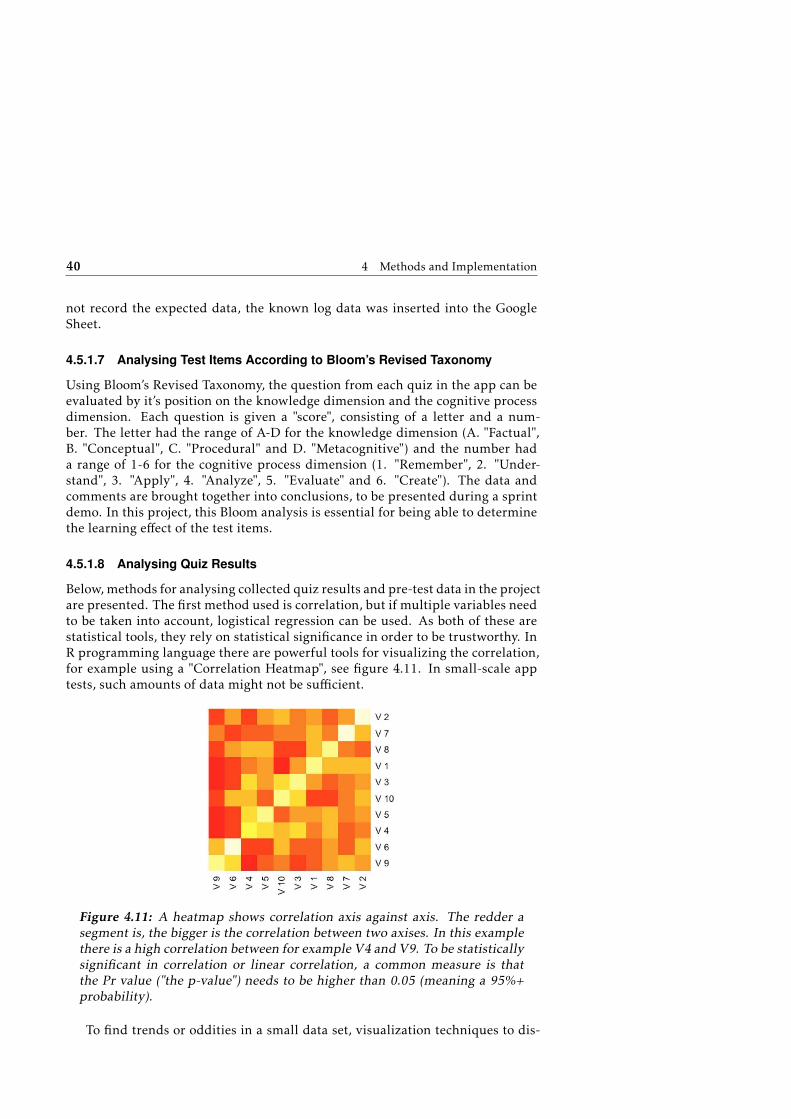
40 4 Methods and Implementation
not record the expected data, the known log data was inserted into the GoogleSheet.
4.5.1.7 Analysing Test Items According to Bloom’s Revised Taxonomy
Using Bloom’s Revised Taxonomy, the question from each quiz in the app can beevaluated by it’s position on the knowledge dimension and the cognitive processdimension. Each question is given a "score", consisting of a letter and a num-ber. The letter had the range of A-D for the knowledge dimension (A. "Factual",B. "Conceptual", C. "Procedural" and D. "Metacognitive") and the number hada range of 1-6 for the cognitive process dimension (1. "Remember", 2. "Under-stand", 3. "Apply", 4. "Analyze", 5. "Evaluate" and 6. "Create"). The data andcomments are brought together into conclusions, to be presented during a sprintdemo. In this project, this Bloom analysis is essential for being able to determinethe learning effect of the test items.
4.5.1.8 Analysing Quiz Results
Below, methods for analysing collected quiz results and pre-test data in the projectare presented. The first method used is correlation, but if multiple variables needto be taken into account, logistical regression can be used. As both of these arestatistical tools, they rely on statistical significance in order to be trustworthy. InR programming language there are powerful tools for visualizing the correlation,for example using a "Correlation Heatmap", see figure 4.11. In small-scale apptests, such amounts of data might not be sufficient.
Figure 4.11: A heatmap shows correlation axis against axis. The redder asegment is, the bigger is the correlation between two axises. In this examplethere is a high correlation between for example V4 and V9. To be statisticallysignificant in correlation or linear correlation, a common measure is thatthe Pr value ("the p-value") needs to be higher than 0.05 (meaning a 95%+probability).
To find trends or oddities in a small data set, visualization techniques to dis-

4.5 Data Analysis Framework 41
cover the quantitative data by hand might be more beneficial. To enable a visu-alization, data needs to be acquired, enhanced, mapped to a geometry and lastlyrendered (Ropinski, 2014). When rendered, a suitable rendering of a multiple-variable data set might be parallel coordinates, see figure 4.12. Made interactive,each axis can be made filterable by user interaction.
Figure 4.12: Parallel coordinates enables you to visually observe relation-ships and trends between dimensions: positive or negative relationship (cor-relation or invert), or no relationship at all (random) (Lopez, 2016)
4.5.2 Analysis Implementation of Quiz Results and Pre-Data
In this section, the steps needed to analyse the quantitative data is explained indetail, so that others can use a similar approach. In this example, quiz resultsare from iteration 4, but a similar approach has been taken with the manuallyrecorded quiz results from iteration 2-3 as well.
Data analysis of quiz results was done first by a general overview in GoogleSheets, by statistical analysis in R, and by a parallel coordinates visualization.The process to do this is described below.
4.5.2.1 Step 1: Data Acquisition from Server
It was desired to store the data in Google Sheets, thus it was necessary to collectthe MongoDB database content, and convert JSON format into a Google Sheets-readable format, like CSV.Multiple approaches were tried, and the Google Chromeextension called Magic Json (Team, 2016) was the one that worked without prob-lems.
4.5.2.2 Step 2: Data Acquisition from Pre-Study
The Pre-study data acquisition was done by instead of looking at the paper-submittedpre-study evaluation forms, using the data processed into Google Sheets.

42 4 Methods and Implementation
4.5.2.3 Step 3: Data Enhancement of Server Results
This section presents how data from the server was processed, to enable visualiza-tion mapping. To make the data easier to work with, the columns were reordered,and made sortable and filterable. Some columns were given conditional format-ting, so it would be easier to spot irregularities, see figure 4.13. After this, someobservations could be made.
Figure 4.13: The quiz results collected in a Google Sheet after data enhance-ment. In this figure, cell E1 has been filtered so that only results for quiz 3are shown. Conditional formatting has been done with row G so that if it isa certification quiz, yellow color is used.
To be able to compare the test results with the pre-test results, it was clear thatit would not be viable to test every dimension against every dimension. Instead,since goals of the app evaluation had been predefined in the following way, thequiz results were summarized into a new sheet so that the following could bederived:
• % correct 1st try
• number of tries until 100%
• number of tries until 100% in 1 try
These could be calculated by having columns for:
• Quiz 3
– Start time training
– % correct 1st try
– number of tries until 100% in 1 try
– Time difference start to end time certification

4.5 Data Analysis Framework 43
• Quiz 9
– Start time training
– % correct 1st try
– Time difference start to end 1st try
– Time difference start to passed training
– Time difference 1st try to certified
Then, to see trends, color scales were again added. With ordinal values, a se-quential color scheme is used (for example fastest time, from green to red), andwith nominal values (like if they are female or male) where there is no right value,a qualitative color scheme is used. Now it was easier to spot outliers and trends,and giving validation to findings from notes and observations made during inter-views, workshops and app tests.
4.5.2.4 Step 4: Date Enhancement of Pre-study Results
To see differences in answers more clearly, the data from the pre-study was madesortable and filterable. Then, the data was resampled for each column that hadnumerable (sortable) data in text instead of numbers, so for example "The daybefore" was changed to -1 and "The same day" to 0. In a similar way, school levelwas divided into four different groups, from 0 to 3, where 0 meant secondary,year unknown, 1 meant lower secondary, 2 meant upper secondary, and 3 meanttertiary.
After this, each column was given conditional formats using a color scale, us-ing Google Sheets built-in functionality. This gave a visual way to quickly get anoverview of the pre-test data.
4.5.2.5 Step 5: Data Enhancement by Joining Pre-test and Results Summary
The summary sheet and the pre-quiz sheet were joined, becoming a multiple-variate data set (several dimensions that were to bee compared with several otherdimensions), see figure 5.20. A meeting with the university supervisors was held,so they could further give support in how to properly analyse the data. Since thetwo control groups showed similar means on the pre-quiz results, the two controlgroups were determined comparable.
To meet the challenges of using Google Sheets, a multivariate analyzation soft-ware or a visualization was suggested to discover the data in less time. It washard to determine a suitable multivariate analysis software suitable when havingso few data points. Principle Component Analysis or Cohen’s kappa would not besuitable, neither was it believed applicable to do Linear correlation on all dimen-sions. After discussion with other Master thesis students working with analysingdata from various disciplines, parallel coordinates was suggested. It would allowvery quickly filtering of the data, finding correlations, and distinguish outliersand common characteristics.

44 4 Methods and Implementation
Figure 4.14: The multi-variate data set, made filterable and sortable inGoogle Sheets. Color scales and calculating means makes it easier to com-pare characteristics of the coach together with pre-test and quiz results.However, it is cumbersome and hard to quickly filter data on multiple pa-rameters.
.
To guide the usage of the parallel coordinates (as there is so much to discoverin the data set), using R to do Logistic correlation was also done. A disadvantagewith this method, is that to be statistically significant, many data points maybe needed, and it was now known before-hand if the method would be useful.Probably, parallel coordinates would be the best method to analyse a small multi-variate data set.
4.5.2.6 Step 6: Visualization Mapping
The goal with visualization mapping is to generate renderable data, in this casefor the parallel coordinates visualization. Thus, a new spreadsheet is added, spe-cific for visualizing the data. Columns were deleted that would serve no visualpurpose (for example timestamps), gave all cells data values (even N/A when un-defined), deleting users that did not have data, and shortened the column namesso they would fit on the screen. The data was then exported from the GoogleSheet into CSV.
4.5.2.7 Step 7: Rendering
For rendering, the JavaScript library D3.js, (Bostock, 2014) was chosen. It sup-ports data-driven documents for visualizing data with HTML, SVG and CSS. Itsupports both JSON and CSV data. A visual framework for multidimensionaldetectives for D3.js was found called "Parcoords.js", Chang (2012). The examplecode from "Linking with a Data Table" provided the basis for the rendering. Itallowed observing both the parallel coordinates visualization and the table datafrom the Google Sheet simultaneously.
To work, the example CSV file was replaced with the data from exporting theGoogle Sheets data. To benefit the visualization, also the colors were changed,and the toolkit’s functionality to drag the axes titles around to reorder the dimen-sions was used, since the goal was to quickly compare and find correlations. Theresult is visible in 4.15.
4.6 Application Implementation 45
4.6 Application Implementation
In this section, the prerequisites for the app is described, from the perspective ofthe user, stakeholders, and the developer.
4.6.1 User Needs
The technical constraints for the project, would need to affect the technologiesused, if the project would be user-centered. On the client side, the app wouldneed to be mobile and web-based, consider non-access to internet, and not usea lot of battery, to work for the coaches of YoungDrive. That the app should besimple to use in this cultural setting leading to design constraints and needs forevaluation.
4.6.2 Stakeholder Meeds
As the project was only three months, and the first month would be without dig-ital development, time constraints were massive. However, to be able to answerhow design affects learning, evaluation was needed to be done via data collection.
If no evaluation, there would be no need to write code, instead working witha low-fidelity prototype using pure design tools. Now, a data-driven approachwas needed to measure, and therefore an app needed to be developed. On theserver side, a database and API would be needed, to pull data from the databaseand push data from the client. Since internet was not always available, the clientmust be smart in its usage of pushing and pulling data. This would need to beinvestigated further into the project.
4.6.3 Choosing Frameworks for Creating the App
A JavaScript framework helps and speeds up the creation of building web apps.In the start of the project, Meteor (Inc., 2016) and Ionic Framework (Co., 2016)were both tested and compared with each other. It was decided that Meteor wasthe best way forward, partly because it would allow the app to be accessible onthe web as well.
React (Facebook, 2016) (a JavaScript library for building user interfaces) waschosen as the front-end framework, having integration with Meteor and beingrelatively easy to learn and fast for development.
4.6.4 Creating a First Version of the App
Since Meteor was chosen, a multiple-choice quiz tutorial in Meteor was used toguide the first version of the app. Modifications were made, for example makingit responsive and changing it to YoungDrive’s graphic profile.
The app was pushed to GitHub, and first hosted on Meteor free storage, thenavailable via youngdrive.meteorapp.com. For Android and iOS, it was made pos-sible to install the app from the computer. For each day of the training in Zambia,new quizzes were added to the app, which created a belt path (see 2.4.2).

46 4 Methods and Implementation
After iteration 2, a different hosting platform was needed when the Meteorfree tier was removed, where Heroku was chosen. Staging environment usingHeroku allowed changes on specific GitHub branches to deploy updates automat-ically on Heroku servers. The MongoDB database was created using the Herokuplugin MongoLab. A Meteor build-pack was used to allow Meteor to be usedwith Heroku.
It was also tested to upload the app to Android Play Store. The necessarysteps from Cordova needed to be followed, screenshots needed to be uploaded,and some administrative tasks. After this, it only took a day for the app to appearon the Play Store, and everything worked.
4.6.5 Enabling Data Collection
For iteration 3, as components grew, there was a need for a client-side router. TheMeteor plugin Flow Router was used, as it was very popular with good integra-tions. For iteration 3, there was also a need to store data per individual, partlybecause the feature was prioritized from YoungDrive, but also because of the pur-pose of data collection. In order to store data per individual, a database and loginwould be needed. Because of technical difficulties, login and automatic data col-lection was not implemented until iteration 4, which is further described in theDiscussion, section 6.1.3.
4.6.5.1 Login
To record data per user, would require login. This would be a usability issue formost problems, being first-time smartphone users. They need to find it intuitive,user-friendly, and be able to remember the password in the future. A lot of dif-ferent suggestions were through the ideation phase. The simplest login possiblewas chosen, after evaluation and discussion with experts: a 3-digit code, whichwas to be given to each coach during the test. Meteor had limitations with theirauto-login module, which is very fast to implement. Thus, a 3-digit login waswritten manually. To summarize, the front-end was not problematic, however,implementing server-client communication so that it worked online and offline,was.
4.6.5.2 Online and Offline Database
If data was to be sent from the client to the server, there needs to be a databasewith Meteor Collections. An example app was made first, only using MeteorCollections. Meteor’s use of Distributed Data Protocol (DDP), made app pushesfeel immediate, even though data was not sent until there was Internet access.
However, it was found out that if it took more than 15 minutes to get online,the push would be aborted. For users that are seldom online, this would not beviable. An offline database was needed, and the plugin GroundDB was imple-mented. As it was cumbersome to get right, pushing the data whenever online,and hard to test (needed to wait 15 minutes each time), this was not ready for the

4.6 Application Implementation 47
interactions until Iteration 4. As a consequence, until iteration 4 of the app, noresults were saved online via the app whatsoever.
For iteration #4, data collection was done by the app itself, which pushes datato the server whenever online (it saves quiz start, and quiz finish). The serverreceives JSON data from the client, stored in the MongoDB database hosted onHeroku. Each data point is saved in a database called Results, with the signed inuser (from the Users database). In the database, there are collections for Users,Quiz Lists, and Quiz Results.
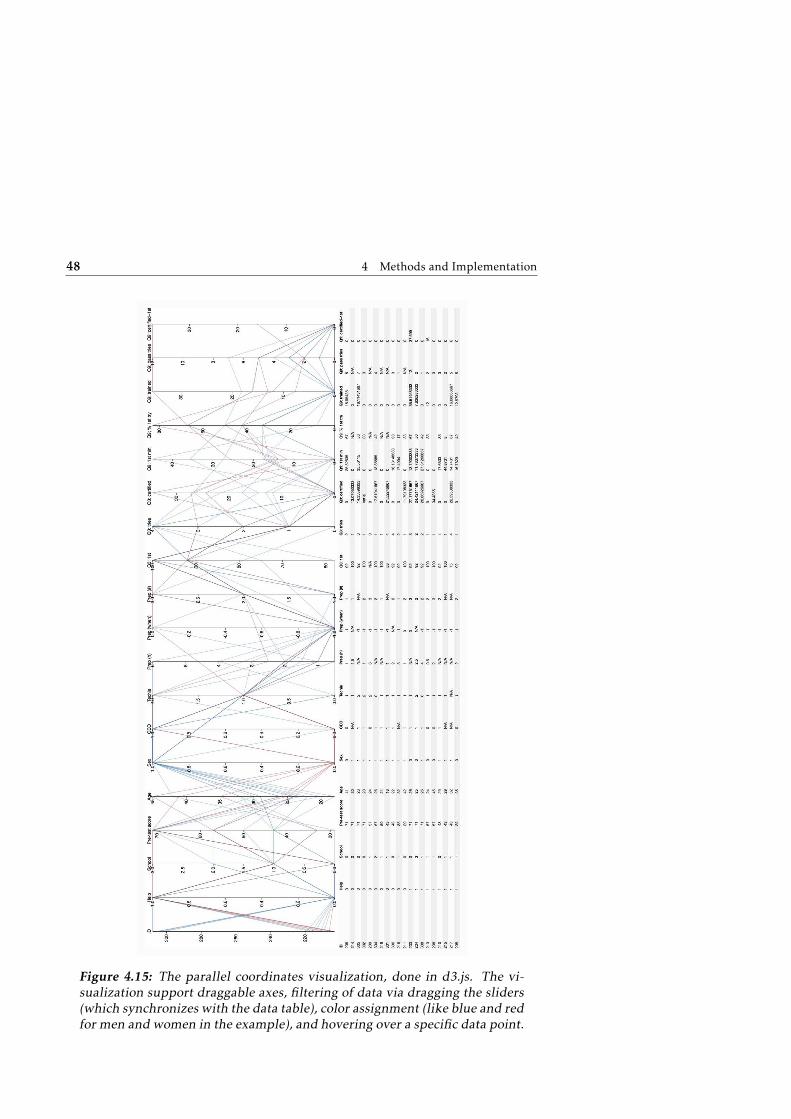
48 4 Methods and Implementation
Figure 4.15: The parallel coordinates visualization, done in d3.js. The vi-sualization support draggable axes, filtering of data via dragging the sliders(which synchronizes with the data table), color assignment (like blue and redfor men and women in the example), and hovering over a specific data point.

5Results
In this chapter the developed application is first demonstrated and explained,and how the app has evolved from iteration 1-4. Then, the results from all thequalitative and quantitative data collection in iteration 1-4 are explained.
5.1 The YoungDrive App: Iteration 1-4
After three months time, the app developed has been successful in addressingYoungDrive’s goals with the app, with very high precision to the needs and con-text of the end users. In figure 5.1 the app development from iteration 1-4 areshown. In appendix A, all screens for iteration 4 can be seen in greater detail.The final app works on web or as an app, online or offline, on all of YoungDrive’sAndroid and iOS devices. The app is fast to use, the back button on the phonecan be used to go to the previous view, and the font size and images are consistentfor each screen (which was not the case iteration 1-3, see figure 5.1 E-3. For ananalysis of the quiz results and interview answers from the final version of theapp, see section 5.5.1 and 5.5.2.
49
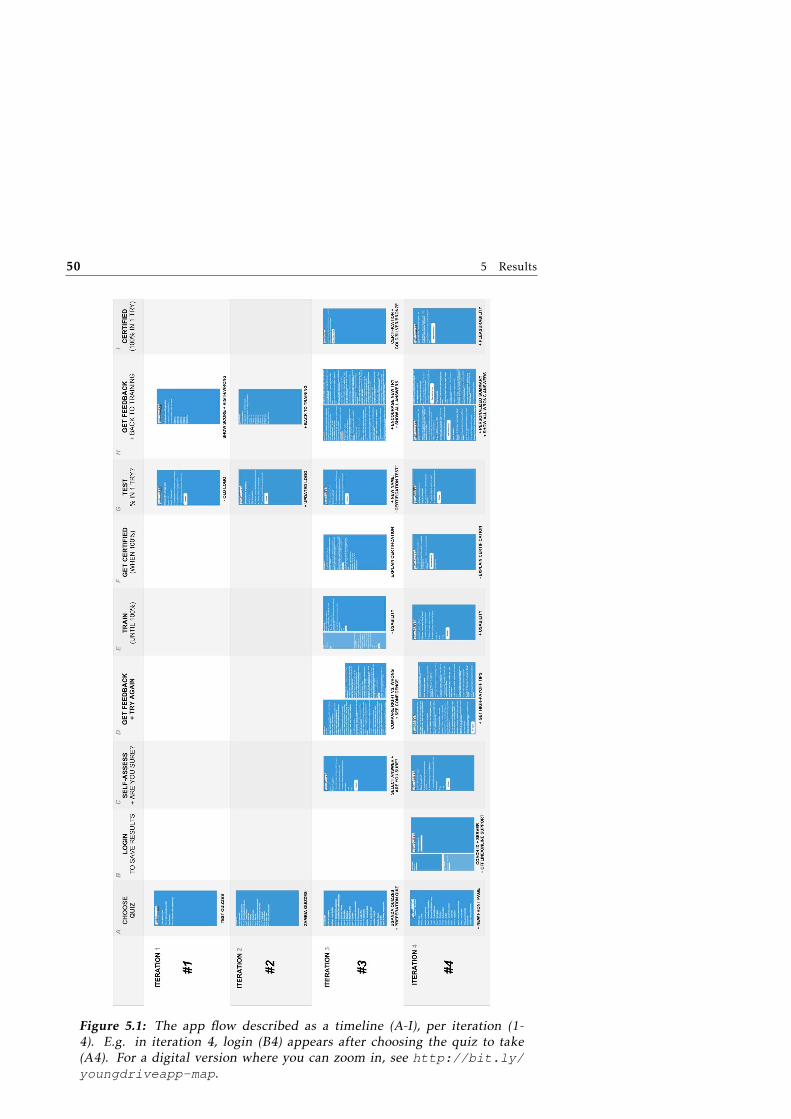
50 5 Results
Figure 5.1: The app flow described as a timeline (A-I), per iteration (1-4). E.g. in iteration 4, login (B4) appears after choosing the quiz to take(A4). For a digital version where you can zoom in, see http://bit.ly/youngdriveapp-map.
5.1 The YoungDrive App: Iteration 1-4 51
The quiz flow during iteration 1-2 was a standard multiple-choice quiz game,designed for assessment, but not for learning. In a scoreboard, the coaches couldsee which questions they were awarded points for and not, with a total score, seefigure 5.1 H-1. In the end of iteration 2, whey were encouraged to go back to thestart screen, to redo the same quiz again, or select a new one. 1 point is awardedfor correct answers, whereas 0 points is given for incorrect answers.
In iteration 3, feedback for self-reflection was introduced. The coach answersYes or No on "Are you sure?" for each question (figure 5.1 C-3), with the aim ofincreasing meta-cognitive skills, and being able to give personalized feedback onthe score board.
Thanks to recording both if the coaches were correct and confident, the appcan give very precise learning feedback (for example showing that the coach an-swered alternative B with confidence, but showing that A was actually the correctalternative).
In iteration 3-4, after observing their incorrect answers, and learning theircorrect ones (closely compare figure 5.1 D-3 and E-3), coaches were able to retakethe wrong answers immediately.
In iteration 3, the score board was simply showing each correct question withthe answer the coach provided versus the correct one. After giving feedback, thecoach can train, and improve on incorrect answers and guesses, and when being100% correct and confident, ideally take the whole quiz without faults.
For iteration 4, the score board is more personal, encouraging the coach toreflect on her own learning process. The feedback is designed to give a self-confidence boost ("You were correct, and you were sure" or "You guessed, but youwere correct. You can answer with confidence the next time"), unlearn knowledge("You were incorrect, but you were sure"), or encourage studying more when un-sure and wrong ("You were incorrect, and you were not sure").
To discourage guessing during training, since iteration 3, the coach is shownnumber of tries on the quiz if they do not get 100% on their first try (see the topbar of figure 5.1 E-3). For iteration 4, the coach will also get a minus point (-1)for answering incorrectly but confidently "Are you sure?": "Yes". If uncertain, thecoach should answer "Are yo sure?": "No", and no penalty will be given. The coachwill later recieve feedback, either "You can be confident next time" (if correct butunsure) or "How can you get these correct next time?" (if unsure and incorrect).
The coach is encouraged to be well-prepared before trying again (either con-sulting the answers or the manuals). At 100% correct answers, they can get certi-fied, by getting the whole quiz correct without faults. Failing a question on thecertification would show that they have not reliably learned all the answers dur-ing the training. The more effort the coach has put into the training, the morelikely the coach will be to pass the certification.
This certification quiz is the same as in training, but no longer do they need toanswer "Are you sure?". If the coach can again get 100% correct answers, withoutany faults, they have proved they are correct and confident with the topic theyshould teach the youth.
If they fail a question, the score board will encourage more training and thatthey did not get certified, see figure 5.1 H-4. Since the coach did get 100% correct
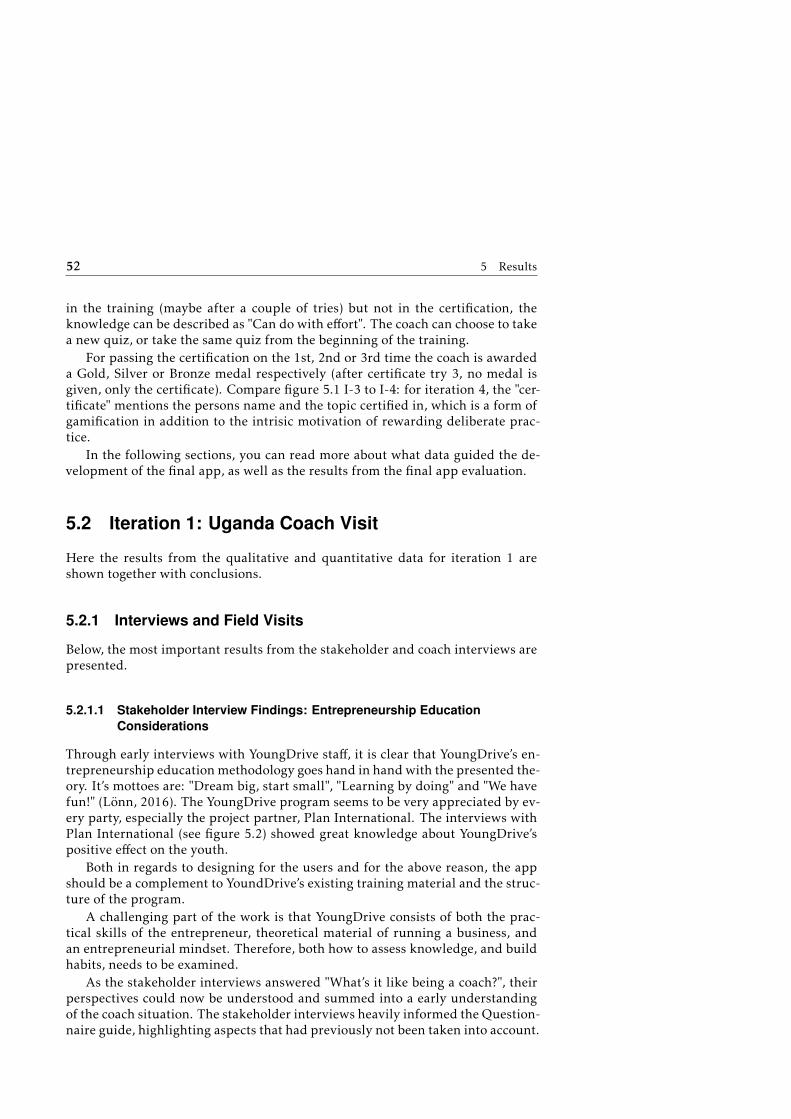
52 5 Results
in the training (maybe after a couple of tries) but not in the certification, theknowledge can be described as "Can do with effort". The coach can choose to takea new quiz, or take the same quiz from the beginning of the training.
For passing the certification on the 1st, 2nd or 3rd time the coach is awardeda Gold, Silver or Bronze medal respectively (after certificate try 3, no medal isgiven, only the certificate). Compare figure 5.1 I-3 to I-4: for iteration 4, the "cer-tificate" mentions the persons name and the topic certified in, which is a form ofgamification in addition to the intrisic motivation of rewarding deliberate prac-tice.
In the following sections, you can read more about what data guided the de-velopment of the final app, as well as the results from the final app evaluation.
5.2 Iteration 1: Uganda Coach Visit
Here the results from the qualitative and quantitative data for iteration 1 areshown together with conclusions.
5.2.1 Interviews and Field Visits
Below, the most important results from the stakeholder and coach interviews arepresented.
5.2.1.1 Stakeholder Interview Findings: Entrepreneurship Education
Considerations
Through early interviews with YoungDrive staff, it is clear that YoungDrive’s en-trepreneurship educationmethodology goes hand in handwith the presented the-ory. It’s mottoes are: "Dream big, start small", "Learning by doing" and "We havefun!" (Lönn, 2016). The YoungDrive program seems to be very appreciated by ev-ery party, especially the project partner, Plan International. The interviews withPlan International (see figure 5.2) showed great knowledge about YoungDrive’spositive effect on the youth.
Both in regards to designing for the users and for the above reason, the appshould be a complement to YoundDrive’s existing training material and the struc-ture of the program.
A challenging part of the work is that YoungDrive consists of both the prac-tical skills of the entrepreneur, theoretical material of running a business, andan entrepreneurial mindset. Therefore, both how to assess knowledge, and buildhabits, needs to be examined.
As the stakeholder interviews answered "What’s it like being a coach?", theirperspectives could now be understood and summed into a early understandingof the coach situation. The stakeholder interviews heavily informed the Question-naire guide, highlighting aspects that had previously not been taken into account.

5.2 Iteration 1: Uganda Coach Visit 53
Figure 5.2: Meeting with Plan from the office in Tororo, making final prepa-rations for the meetings.
5.2.1.2 Coach Interview and Field Visit Findings: Teaching with Confidence
The purpose of the coach interviews and observations was to understand "What’sit like being a coach?", from the coaches own perspective. Thanks to having simi-lar interviews with stakeholders, the coaches’ opinions and experiences could becompared. Also, more detailed answers on background, desires, experience andsituation could be provided.
From the interviews and observations it was understood that CBTs can beresponsible for from 7 up to 12 different youth groups in different programs, andsuch a high number places huge demands on the CBT. Even if there are only 7groups, being behind on schedule or not being confident, can be very demanding.
The interviews and observations with CBTs, Project Leaders and stakehold-ers led to the realization that different coaches handles this differently well. Allcoaches possess high self-confidence in varying degrees in various situations, andas a result, quality among coaches is unbalanced, which stakeholders see as a chal-lenge. Depending on the situation, everything is going according to plan, you arenot confident, or you are falling behind with the schedule, you can be in one ofthese three Need groups:
• The ideal coach
• The realistic coach
• The challenged coach
It was discovered that coach confidence comes largely from being able to havegood youth sessions, see figure 5.3. This is important, because according to theinterviews, being a high-quality YoungDrive coach to a large extent means havinghigh-quality youth sessions. For having a high-quality youth session, these arethe most important attributes mentioned by the project leaders:

54 5 Results
• Correct information
• Correct structure
• Time management
• Fun atmosphere
Figure 5.3: Observing a youth session, the coach using the whiteboard tomake certain concepts more clear.
These findings were used to inform the Customer Journey Map workshop. Inaddition to the findings here, questions were also asked around ethnography.
5.2.2 Co-Creation Workshops
Two workshops were held, which together would inform future development ofan application. These were the findings from those two workshops:
5.2.2.1 Customer Journey Map: "A Day As a Coach"
The three coaches understood the concept of the workshop surprisingly effort-lessly, although the concept of post-its and Customer Journey Map and Personaswere unfamiliar to them. Contributing to the energy, was probably that the time-line and personas were largely informed by their interview answers. The work-shop gave great insights for understanding the coach situation and the coachesthemselves, both observing their behaviour during the workshop and learningabout all the unknown activities involved in being a coach.
The first workshop was concluded with many important insights. Thanks tousing Personas, it was discovered from the workshop that the difference betweencoaches and the quality of the youth training was more diverse than originallythought. This is especially true when the coaches prepares for their youth session,an activity which was regarded as important as the coach training, but where
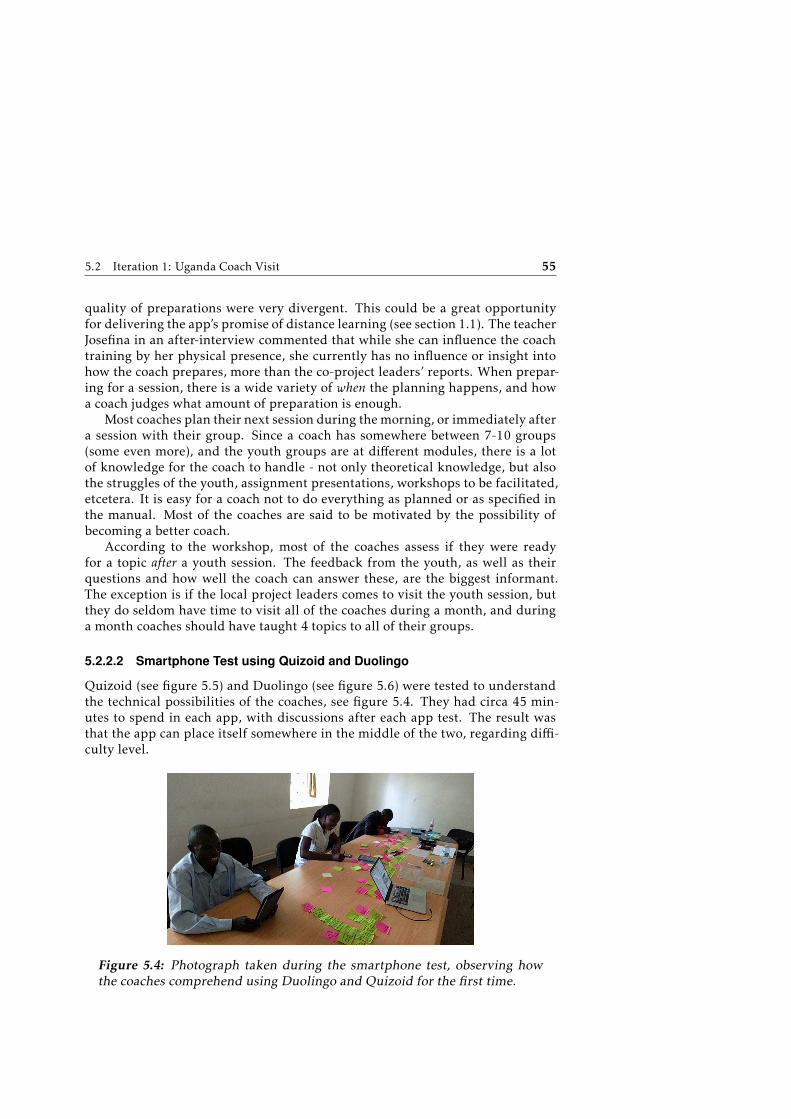
5.2 Iteration 1: Uganda Coach Visit 55
quality of preparations were very divergent. This could be a great opportunityfor delivering the app’s promise of distance learning (see section 1.1). The teacherJosefina in an after-interview commented that while she can influence the coachtraining by her physical presence, she currently has no influence or insight intohow the coach prepares, more than the co-project leaders’ reports. When prepar-ing for a session, there is a wide variety of when the planning happens, and howa coach judges what amount of preparation is enough.
Most coaches plan their next session during themorning, or immediately aftera session with their group. Since a coach has somewhere between 7-10 groups(some even more), and the youth groups are at different modules, there is a lotof knowledge for the coach to handle - not only theoretical knowledge, but alsothe struggles of the youth, assignment presentations, workshops to be facilitated,etcetera. It is easy for a coach not to do everything as planned or as specified inthe manual. Most of the coaches are said to be motivated by the possibility ofbecoming a better coach.
According to the workshop, most of the coaches assess if they were readyfor a topic after a youth session. The feedback from the youth, as well as theirquestions and how well the coach can answer these, are the biggest informant.The exception is if the local project leaders comes to visit the youth session, butthey do seldom have time to visit all of the coaches during a month, and duringa month coaches should have taught 4 topics to all of their groups.
5.2.2.2 Smartphone Test using Quizoid and Duolingo
Quizoid (see figure 5.5) and Duolingo (see figure 5.6) were tested to understandthe technical possibilities of the coaches, see figure 5.4. They had circa 45 min-utes to spend in each app, with discussions after each app test. The result wasthat the app can place itself somewhere in the middle of the two, regarding diffi-culty level.
Figure 5.4: Photograph taken during the smartphone test, observing howthe coaches comprehend using Duolingo and Quizoid for the first time.
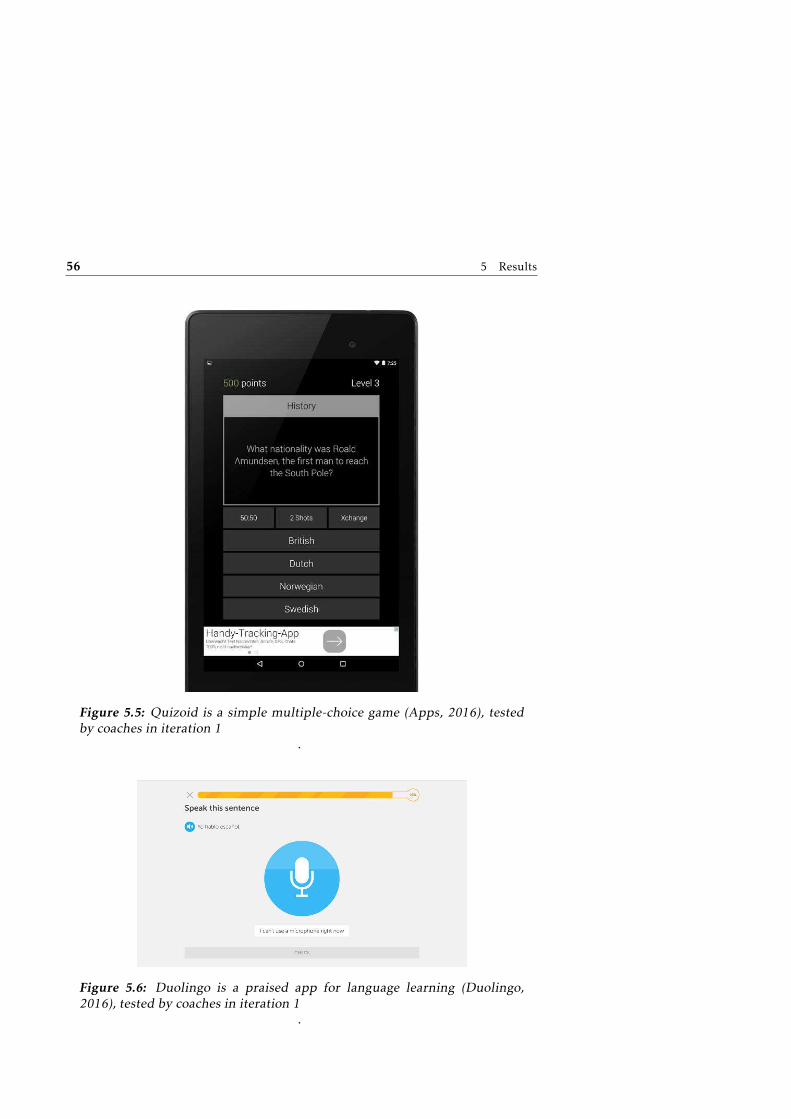
56 5 Results
Figure 5.5: Quizoid is a simple multiple-choice game (Apps, 2016), testedby coaches in iteration 1
.
Figure 5.6: Duolingo is a praised app for language learning (Duolingo,2016), tested by coaches in iteration 1
.

5.2 Iteration 1: Uganda Coach Visit 57
Two of the three YoungDrive coaches (two of them being the local projectleaders) used a smartphone for the first time. The attitude towards using a smart-phone was overwhelmingly positive. One of the coaches even mentioned: "Mar-cus, today one of my dreams have gone true" regarding using a smartphone forthe first time. He even asked if he could borrow one of the devices during theremainder of the stay. Even for coaches that had never touched a smartphone be-fore, some concepts were easily understood (like using the camera and Quizoid).
Other concepts were harder (accidently getting to the settings menu, unlock-ing the device, understanding advanced games, or training languages using Duolingowith advanced interactions). Point and click is easily understood, whereas slidingis much more unnatural.
5.2.3 Sprint Demo
During the evaluation meeting with Linköping University and YoungDrive, itwas determined that Iteration #1 had provided preliminary answers for researchquestion #1 (technical possibilities), #2 (contextual constraints), #4 (usability andlearning), and partly #5 (how to use user feedback). Thus, the iteration could beconsidered very successful, and now, the development of the app could begin.
It is clear from the data that the motivation of the app should be to assess andstrengthen the entrepreneurship knowledge and skills of the coach. For coachquality to improve was a desire from the stakeholders as well as the coachesthemselves, even if they were also satisfied with the current results. This leadto a challenging situation how an app can address becoming a better-performingcoach.
An app could increase accuracy of correct information. With an app, thecoach could keep a record of the module content, and see when and if they doneed to refresh their skills. It was discovered that a coach app can benefit notonly the coach training, but also in a surprisingly precise way, what was called"distance learning" in section 1.1. Accountability if the coach is ready for a ses-sion by automatic assessment. A very important aspect to increase learning andconfidence will be to give good feedback (see section 2.3.3).
With all the possible benefits of an app, it is definitely a problem that so fewcoaches have smartphones. Either continued development could be guided solelyby the use case of having an app tailored for the coach training (where donateddevices are available). But this would be to ignore that an app helping the coachto prepare for a session would be extremely beneficial, which discovered duringthe field visits to youth sessions and during interviews.
The motivation for using technology is very high, so one way forward wouldbe that the app for distance training will reach only the users that can be givenaccess to a smartphone, counting that more coaches will get smartphones in thefuture. Not using smartphones but feature phones (which all coaches possess),would mean building an SMS-based service (see 8.1.
As most coaches are already motivated to become a better coach and usingtechnology, the advise from Sierra (2015) of designing for their compelling con-text can be followed. From a YoungDrive perspective, this might mean "Given a
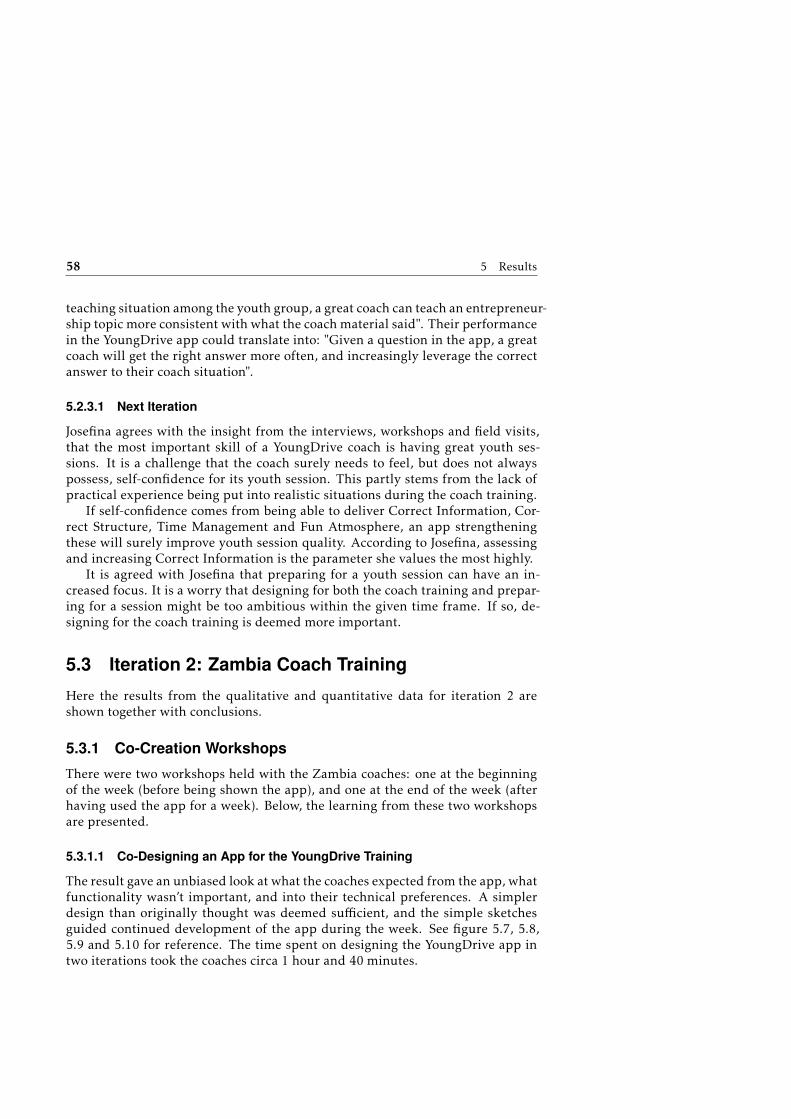
58 5 Results
teaching situation among the youth group, a great coach can teach an entrepreneur-ship topic more consistent with what the coachmaterial said". Their performancein the YoungDrive app could translate into: "Given a question in the app, a greatcoach will get the right answer more often, and increasingly leverage the correctanswer to their coach situation".
5.2.3.1 Next Iteration
Josefina agrees with the insight from the interviews, workshops and field visits,that the most important skill of a YoungDrive coach is having great youth ses-sions. It is a challenge that the coach surely needs to feel, but does not alwayspossess, self-confidence for its youth session. This partly stems from the lack ofpractical experience being put into realistic situations during the coach training.
If self-confidence comes from being able to deliver Correct Information, Cor-rect Structure, Time Management and Fun Atmosphere, an app strengtheningthese will surely improve youth session quality. According to Josefina, assessingand increasing Correct Information is the parameter she values the most highly.
It is agreed with Josefina that preparing for a youth session can have an in-creased focus. It is a worry that designing for both the coach training and prepar-ing for a session might be too ambitious within the given time frame. If so, de-signing for the coach training is deemed more important.
5.3 Iteration 2: Zambia Coach Training
Here the results from the qualitative and quantitative data for iteration 2 areshown together with conclusions.
5.3.1 Co-Creation Workshops
There were two workshops held with the Zambia coaches: one at the beginningof the week (before being shown the app), and one at the end of the week (afterhaving used the app for a week). Below, the learning from these two workshopsare presented.
5.3.1.1 Co-Designing an App for the YoungDrive Training
The result gave an unbiased look at what the coaches expected from the app, whatfunctionality wasn’t important, and into their technical preferences. A simplerdesign than originally thought was deemed sufficient, and the simple sketchesguided continued development of the app during the week. See figure 5.7, 5.8,5.9 and 5.10 for reference. The time spent on designing the YoungDrive app intwo iterations took the coaches circa 1 hour and 40 minutes.

5.3 Iteration 2: Zambia Coach Training 59
Figure 5.7: The design proposal from team 1
Figure 5.8: The design proposal from team 2
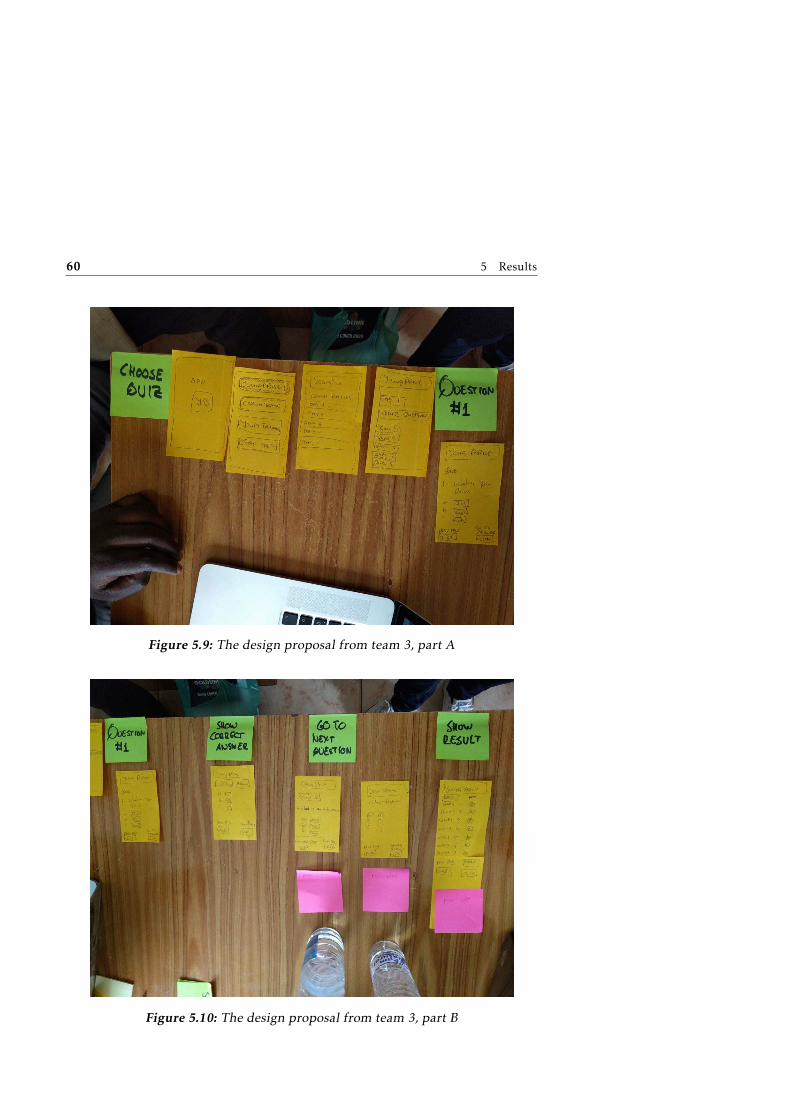
60 5 Results
Figure 5.9: The design proposal from team 3, part A
Figure 5.10: The design proposal from team 3, part B
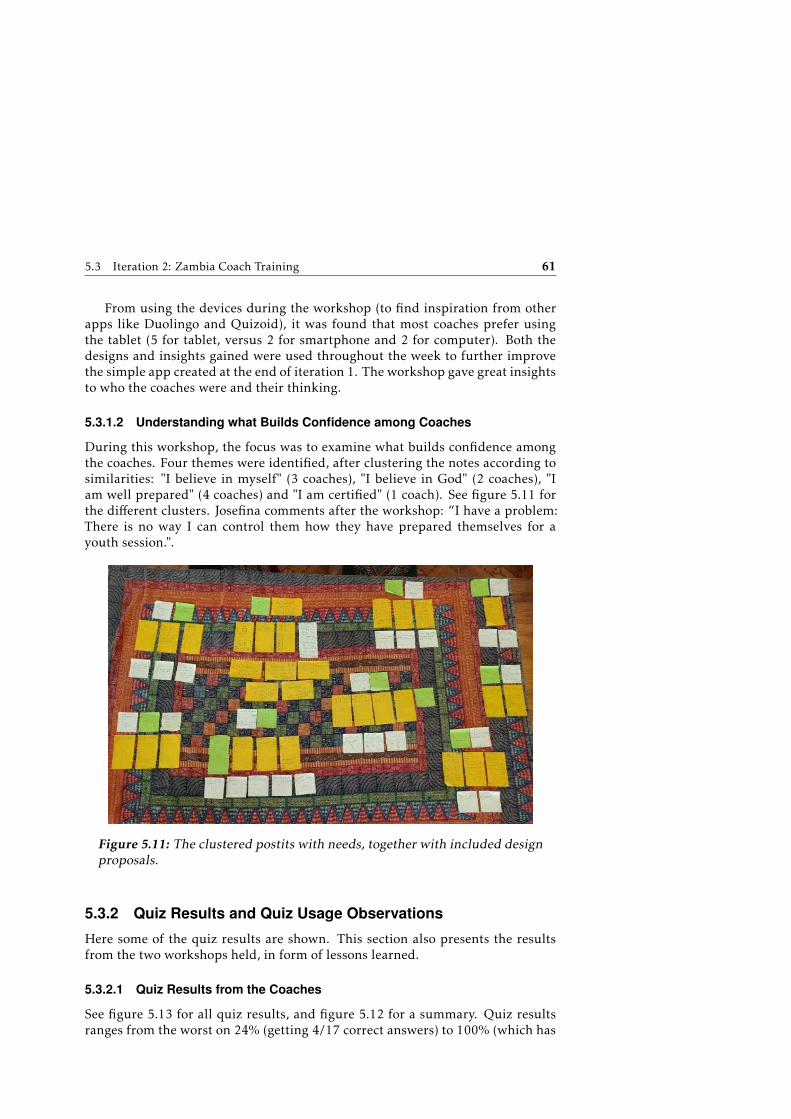
5.3 Iteration 2: Zambia Coach Training 61
From using the devices during the workshop (to find inspiration from otherapps like Duolingo and Quizoid), it was found that most coaches prefer usingthe tablet (5 for tablet, versus 2 for smartphone and 2 for computer). Both thedesigns and insights gained were used throughout the week to further improvethe simple app created at the end of iteration 1. The workshop gave great insightsto who the coaches were and their thinking.
5.3.1.2 Understanding what Builds Confidence among Coaches
During this workshop, the focus was to examine what builds confidence amongthe coaches. Four themes were identified, after clustering the notes according tosimilarities: "I believe in myself" (3 coaches), "I believe in God" (2 coaches), "Iam well prepared" (4 coaches) and "I am certified" (1 coach). See figure 5.11 forthe different clusters. Josefina comments after the workshop: “I have a problem:There is no way I can control them how they have prepared themselves for ayouth session.".
Figure 5.11: The clustered postits with needs, together with included designproposals.
5.3.2 Quiz Results and Quiz Usage Observations
Here some of the quiz results are shown. This section also presents the resultsfrom the two workshops held, in form of lessons learned.
5.3.2.1 Quiz Results from the Coaches
See figure 5.13 for all quiz results, and figure 5.12 for a summary. Quiz resultsranges from the worst on 24% (getting 4/17 correct answers) to 100% (which has
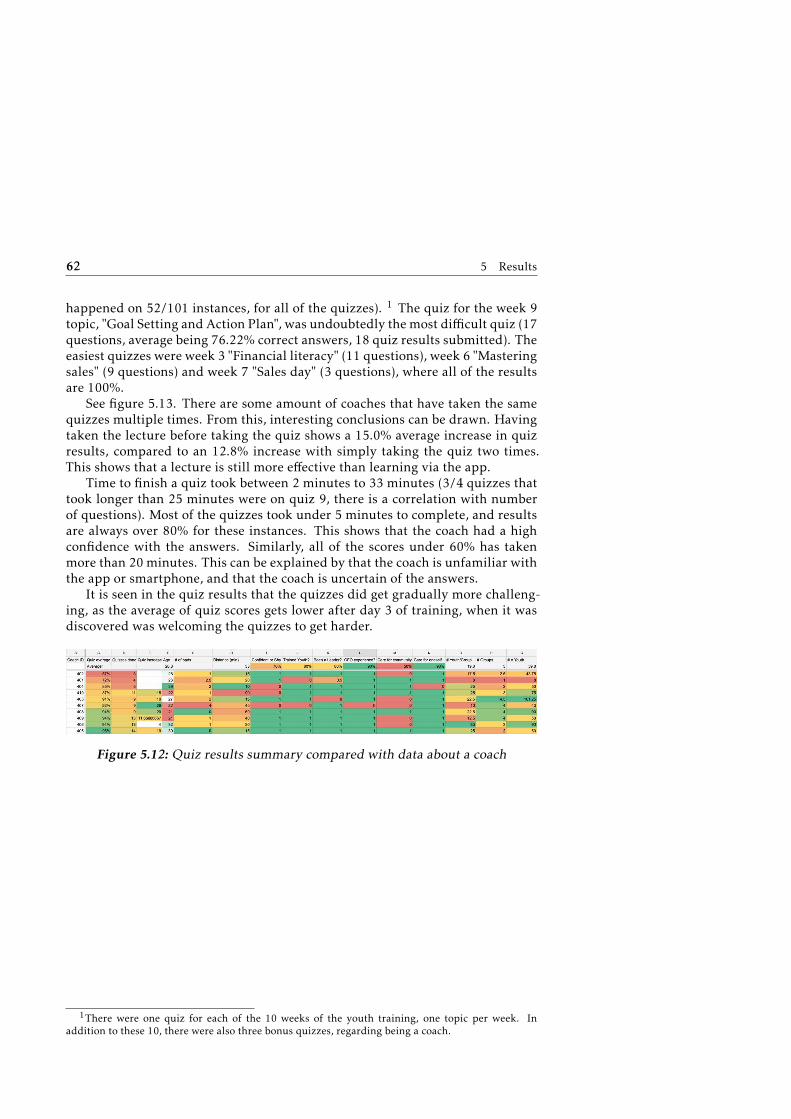
62 5 Results
happened on 52/101 instances, for all of the quizzes). 1 The quiz for the week 9topic, "Goal Setting and Action Plan", was undoubtedly themost difficult quiz (17questions, average being 76.22% correct answers, 18 quiz results submitted). Theeasiest quizzes were week 3 "Financial literacy" (11 questions), week 6 "Masteringsales" (9 questions) and week 7 "Sales day" (3 questions), where all of the resultsare 100%.
See figure 5.13. There are some amount of coaches that have taken the samequizzes multiple times. From this, interesting conclusions can be drawn. Havingtaken the lecture before taking the quiz shows a 15.0% average increase in quizresults, compared to an 12.8% increase with simply taking the quiz two times.This shows that a lecture is still more effective than learning via the app.
Time to finish a quiz took between 2 minutes to 33 minutes (3/4 quizzes thattook longer than 25 minutes were on quiz 9, there is a correlation with numberof questions). Most of the quizzes took under 5 minutes to complete, and resultsare always over 80% for these instances. This shows that the coach had a highconfidence with the answers. Similarly, all of the scores under 60% has takenmore than 20 minutes. This can be explained by that the coach is unfamiliar withthe app or smartphone, and that the coach is uncertain of the answers.
It is seen in the quiz results that the quizzes did get gradually more challeng-ing, as the average of quiz scores gets lower after day 3 of training, when it wasdiscovered was welcoming the quizzes to get harder.
Figure 5.12: Quiz results summary compared with data about a coach
1There were one quiz for each of the 10 weeks of the youth training, one topic per week. Inaddition to these 10, there were also three bonus quizzes, regarding being a coach.
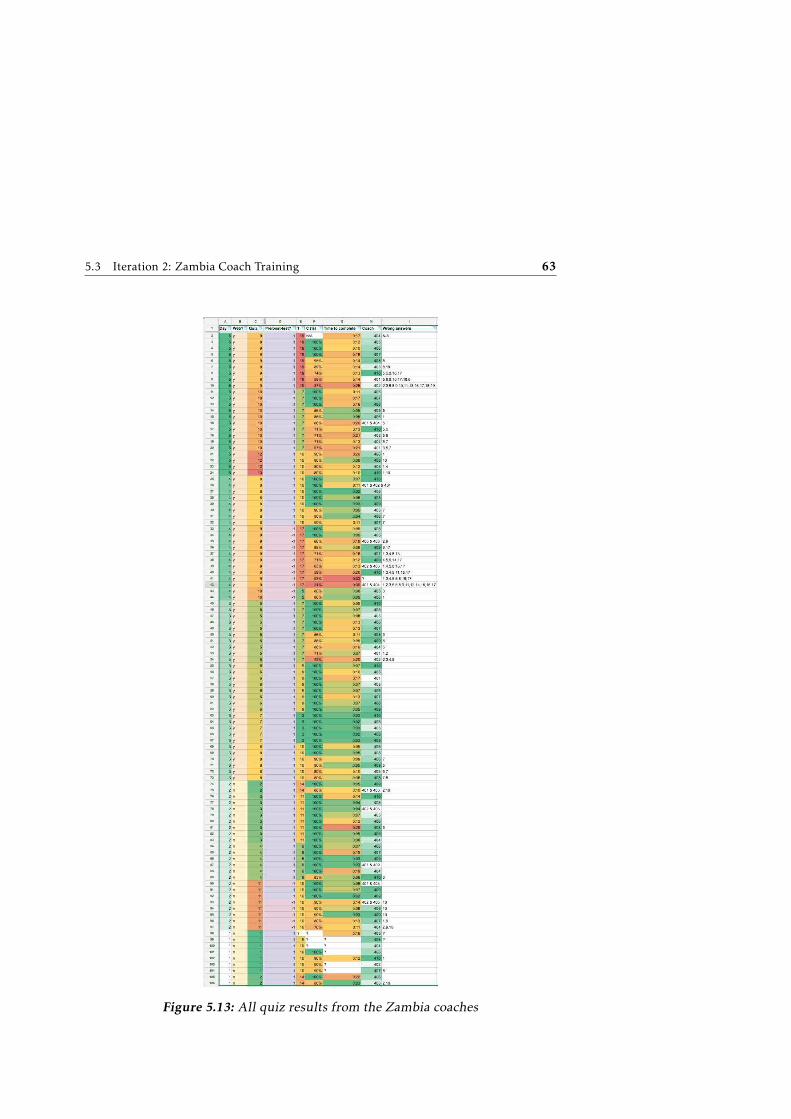
5.3 Iteration 2: Zambia Coach Training 63
Figure 5.13: All quiz results from the Zambia coaches

64 5 Results
See figure 5.12. The quiz scores when quizzes are performed in group is veryvarying (from 24% to 100%), and it is observed that influence of another coachcan lead both to a worse score than their individual average, and a higher score.It is interesting to see that the three coaches that have the worst average (67, 72and 85%) are also the ones that have taken quizzes the least times individually,and the most taking quizzes together with others. This may show that the appis more effective when used individually, and there seem no other connection toprevious entrepreneurial activity or background.
There are few correlations that can be made between the coach’s backgroundand experience, compared with quiz results or app behaviour, see again figure5.12. Nothing in the coach information distinguishes the worst 3 performersin the quiz. For the opposite, there is however a noticeable behaviour that beingconfident, having trained youth, leadership experience, business experience, carefor community, care for oneself and confidence to take on many youth, almostguarantees a high quiz average (which demonstrates learning) and quizzes done(which demonstrates motivation).
For coaches with 0-1 negative remarks during the interviews (n=6) comparedto coaches with 2-4 negative remarks (n=4), their quiz average is but 2% higher(87% to 85%). This is not significant, but this number is increased to 93% (an 8%increase) if the outlier from the group is removed (a coach which only did threequizzes with average of 57%). In the future, more research could be done intocomparing coach data with quiz results.
5.3.2.2 Lessons Learned from App Test Observations: Motivation
Regarding motivation from the coaches, one coach wished the app to be availableon the Google Play store immediately, so that "The app could be used in my sparetime". Another coach, without a smartphone, said "I’ll buy one", because theutility of the app seemed so high. There were also suggestions for improvements,like "The app should have notes, not only quesitions". Regarding usability, lowresolution screens made the text be barely visible. This showed, that the appneeded to be tested on a lot of different devices. This is particularly true, as on day1, the coaches did not know how to zoom, which could cause accident refreshs,frustration or confusion. Even more importantly, the app needs to work offline!To be online on the phone is too expensive for the coaches, and too unreliable togive a satisfactory experience. Also, during testing, relying on internet can causea lot of problems, especially if the teacher is alone.
When asked about what they thought about doing one quiz ("Graduation") asa pre-quiz (before the session), 10/10 said they liked doing the quiz before, andthat it benefited their learning during the session. When asked why it helped,10/10 said agreed on the statement "During a session, it is easier to follow"and that "Giving the paper manuals before, scanning headings and pictures etc,would not help". So, using the quiz before the session increases learning, slightlydecreases fun of the session, according to coaches. One of the coaches describedit as "Fun and encouraging".
It was also tested to work in groups or individually. The ones who answered,

5.3 Iteration 2: Zambia Coach Training 65
said that you learned more individually (3/3), and more fun doing it together(3/3). Doing it together, was enjoyable as it was "Very easy because of usingdifferent minds" and "We can collaborate to do better". It can be argued that thequiz being easier is not a valid motivation, but describes the learning in the appas a desirable difficulty.
When doing a post-quiz ("Goal setting") immediately afterwards versus at theend of the day (doing spaced versus massed learning), quotes were "I thoughtit was fun and challenging to do the quiz immediately afterwards", with anothercoach commenting "The mind was still fresh". After a discussion with the teacher,these were the results:
• 3/10 wants to do the quiz both before and after a session
• 1/10 wants to do the quiz before and at the end of the day
• 7/10 wants to do the quiz only immediately afterwards
• 10/10 wants to do the quiz immediately afterwards, and then again at theend of the day
• 7/10 wants to do the quiz immediately afterwards, and then a joined quizwith other topics at the end of the day
The high scores on using the app a lot indicates that they like the app. Theteacher wants to listen to coach opinions, at the same time not spending moretime than necessary on assessment.
Regarding motivation from the teacher, discussion with Josefina what wouldhinder her from using the app, she says: "Not doing data collection digitallyworks whenever they are 10 - but not with bigger numbers than that." Also, shedoes not wish the app to replace her. She enjoys teaching, thinks she has an im-portant role, and suggests the app to be designed to support her and the coaches,not replace her. When asked about what technical difficulties appeared with theapp, she acknowledges that bugs in the app was sometimes a hindrance to usethe app effortlessly, and that a lot of testing (both high-dose, and high-scale) isvery important to acknowledge these.
5.3.2.3 Lessons Learned from App Test Observations: Learning
Regarding assessing knowledge, coaches had surprisingly high quiz results, seefigure 5.12, and at day 3 they wished harder questions when asked. The responsewas to give harder questions at the other days, for example by introducing similaranswers, and testing 4 alternatives instead of 3. The changes were appreciated.The app was later tested on a university student in Uganda after the Zambiatraining, both on early and later quizzes. The university student from MakarereUniversity scored 100% correct, in spite of not having any entrepreneurship train-ing. This showed that guessing was possible, or that the quizzes were too easy, afinding also shown by other tests with similar test subjects.
The teacher Josefina commented that this might not be a problem, as theYoungDrive coaches are not as skilled with using a process of elimination, and
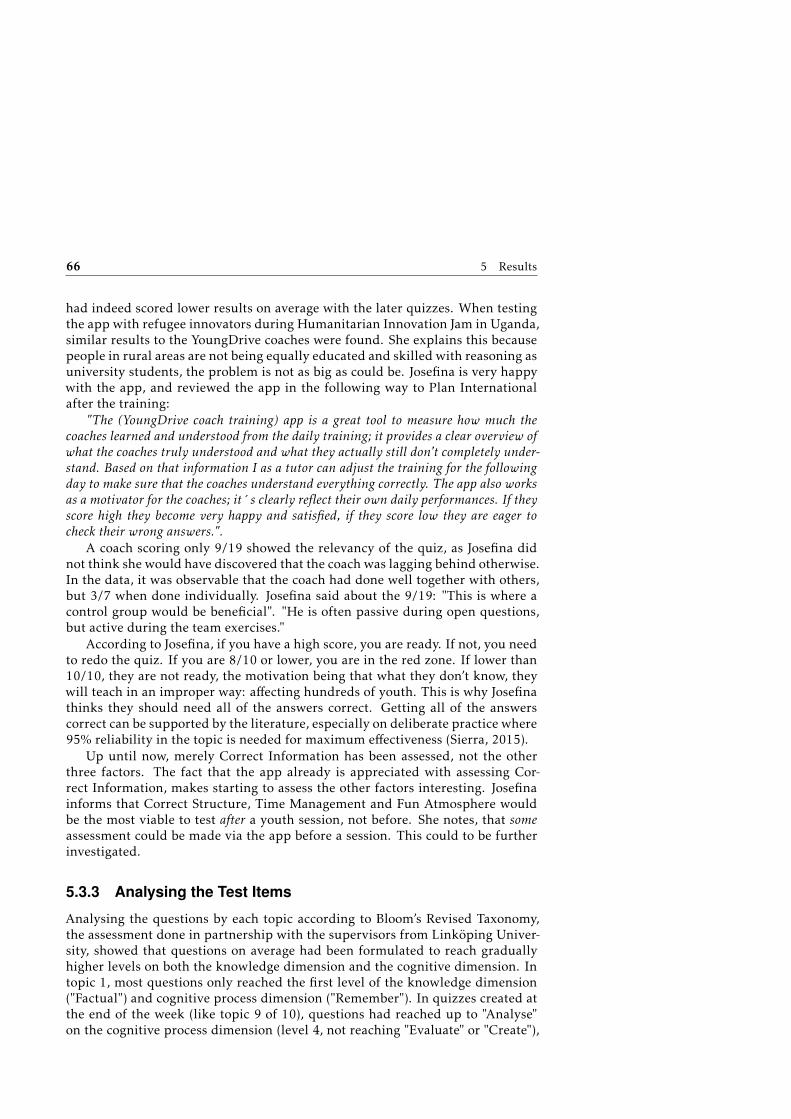
66 5 Results
had indeed scored lower results on average with the later quizzes. When testingthe app with refugee innovators during Humanitarian Innovation Jam in Uganda,similar results to the YoungDrive coaches were found. She explains this becausepeople in rural areas are not being equally educated and skilled with reasoning asuniversity students, the problem is not as big as could be. Josefina is very happywith the app, and reviewed the app in the following way to Plan Internationalafter the training:
"The (YoungDrive coach training) app is a great tool to measure how much thecoaches learned and understood from the daily training; it provides a clear overview ofwhat the coaches truly understood and what they actually still don’t completely under-stand. Based on that information I as a tutor can adjust the training for the followingday to make sure that the coaches understand everything correctly. The app also worksas a motivator for the coaches; it¥s clearly reflect their own daily performances. If theyscore high they become very happy and satisfied, if they score low they are eager tocheck their wrong answers.".
A coach scoring only 9/19 showed the relevancy of the quiz, as Josefina didnot think she would have discovered that the coach was lagging behind otherwise.In the data, it was observable that the coach had done well together with others,but 3/7 when done individually. Josefina said about the 9/19: "This is where acontrol group would be beneficial". "He is often passive during open questions,but active during the team exercises."
According to Josefina, if you have a high score, you are ready. If not, you needto redo the quiz. If you are 8/10 or lower, you are in the red zone. If lower than10/10, they are not ready, the motivation being that what they don’t know, theywill teach in an improper way: affecting hundreds of youth. This is why Josefinathinks they should need all of the answers correct. Getting all of the answerscorrect can be supported by the literature, especially on deliberate practice where95% reliability in the topic is needed for maximum effectiveness (Sierra, 2015).
Up until now, merely Correct Information has been assessed, not the otherthree factors. The fact that the app already is appreciated with assessing Cor-rect Information, makes starting to assess the other factors interesting. Josefinainforms that Correct Structure, Time Management and Fun Atmosphere wouldbe the most viable to test after a youth session, not before. She notes, that someassessment could be made via the app before a session. This could to be furtherinvestigated.
5.3.3 Analysing the Test Items
Analysing the questions by each topic according to Bloom’s Revised Taxonomy,the assessment done in partnership with the supervisors from Linköping Univer-sity, showed that questions on average had been formulated to reach graduallyhigher levels on both the knowledge dimension and the cognitive dimension. Intopic 1, most questions only reached the first level of the knowledge dimension("Factual") and cognitive process dimension ("Remember"). In quizzes created atthe end of the week (like topic 9 of 10), questions had reached up to "Analyse"on the cognitive process dimension (level 4, not reaching "Evaluate" or "Create"),
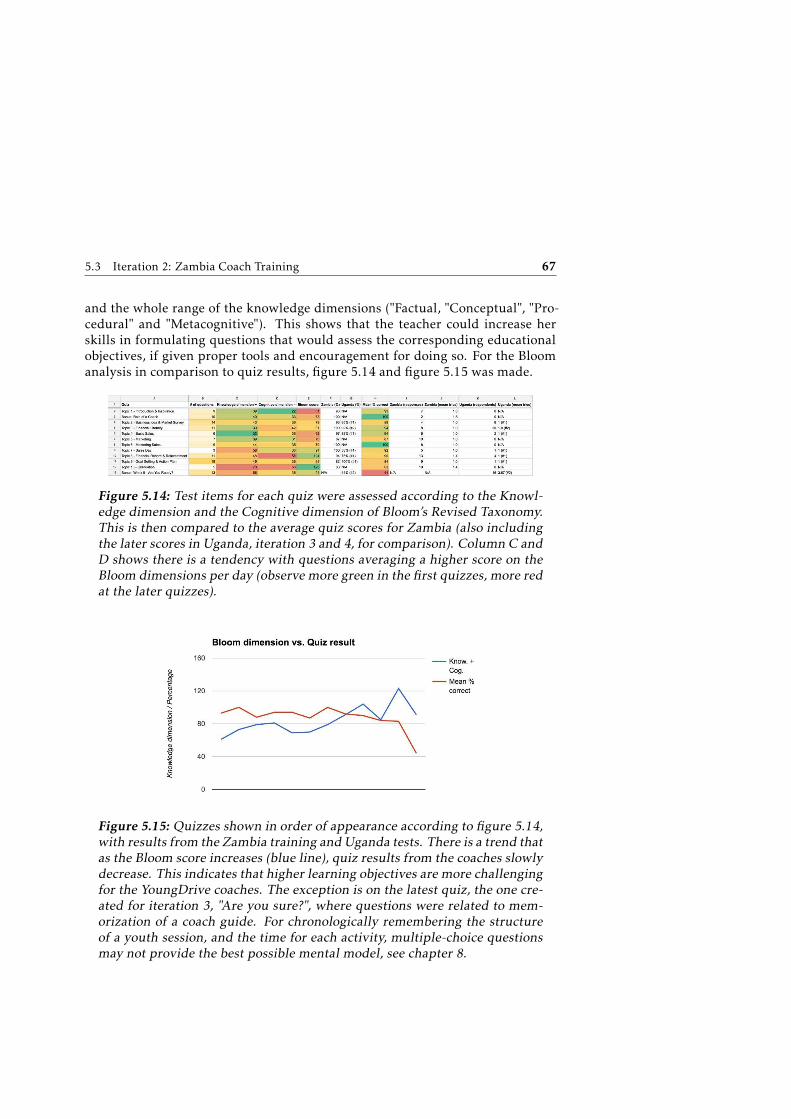
5.3 Iteration 2: Zambia Coach Training 67
and the whole range of the knowledge dimensions ("Factual, "Conceptual", "Pro-cedural" and "Metacognitive"). This shows that the teacher could increase herskills in formulating questions that would assess the corresponding educationalobjectives, if given proper tools and encouragement for doing so. For the Bloomanalysis in comparison to quiz results, figure 5.14 and figure 5.15 was made.
Figure 5.14: Test items for each quiz were assessed according to the Knowl-edge dimension and the Cognitive dimension of Bloom’s Revised Taxonomy.This is then compared to the average quiz scores for Zambia (also includingthe later scores in Uganda, iteration 3 and 4, for comparison). Column C andD shows there is a tendency with questions averaging a higher score on theBloom dimensions per day (observe more green in the first quizzes, more redat the later quizzes).
Figure 5.15: Quizzes shown in order of appearance according to figure 5.14,with results from the Zambia training and Uganda tests. There is a trend thatas the Bloom score increases (blue line), quiz results from the coaches slowlydecrease. This indicates that higher learning objectives are more challengingfor the YoungDrive coaches. The exception is on the latest quiz, the one cre-ated for iteration 3, "Are you sure?", where questions were related to mem-orization of a coach guide. For chronologically remembering the structureof a youth session, and the time for each activity, multiple-choice questionsmay not provide the best possible mental model, see chapter 8.

68 5 Results
5.3.4 Sprint Demo
Below, the conclusions presented during the sprint demo with experts and part-ners is given. The quantitative and qualitative data from iteration 2 shows thatthe app works for "validating the coaches’ level of knowledge during their educa-tion", which was the main purpose of the master thesis (see section 3. Now, theapp should be tested in Uganda as well, and there can be an increased focus on"distance training" and "certify all staff").
Iteration 2 has translated the theoretical understanding of answering the re-search questions into practical experience. Now there are observable evidencefor what the interactions from Iteration 1 showed:
• The purpose of the coach training should be to prepare the coach in havinggreat youth sessions
• Therefore, this is what the quizzes should assess
• What it really means being a good YoungDrive coach, is having good youthsessions
5.3.4.1 Validating the Coaches’ Level of Knowledge
The quiz results data shows that a lecture is still currently more valuable thantaking a quiz in the app two times to improve (15.0% to 12.8%). For iteration2, work on answering research question 4 has started. While the teacher has ap-preciated the multiple-choice assessment, challenges of designing test questionsto support entrepreneurial learning has been found. It is clear that the app isvaluable for assessment, increasing coach self-awareness and being a valuable in-dicator for the teacher. However, the questions formulated scores low on Bloom’sRevised Taxonomy (Krathwohl, 2002) compared with YoungDrive’s educationalobjectives for the topics.
There are previously found issues with using multiple-choice for assessmentand learning, but they seem to become especially relevant in the context of teach-ing entrepreneurship. Either question formulation needs to be improved, or cre-ative design solutions needs to be experimented with which can increase coachunderstanding and identify and reduce guessing. This needs to be further inves-tigated for iteration 3.
Test with university student scored 100% correct, means that common sensecan go a long way, and that the results can’t be 100% trustworthy, and thatmultiple-choice questions has serious issues (Nicol, 2007) - this, we already knewduring and before the coach training - but it needs to be taken care of. Similarlybusiness and leadership experience for the coach seems to lead to a higher quizaverage, while a low quiz average can’t seem to be connected to any of the coachcharacteristics found during the interviews. This makes it hard to design the appfor different types of coaches, without testing other parameters, which should bedone in iteration 4 for the summative test.

5.3 Iteration 2: Zambia Coach Training 69
5.3.4.2 Distance Learning
In addition to the formative app tests, workshop # 2 heavily informs what isnecessary when designing for use case 2, distance learning: preparing a sessionin regards to building confidence. The results from the workshop are somewhatsurprising, factors not only those that relate to the four parameters from iteration1 ("I am well prepared" and "I believe in myself"), but for some also "I believe inGod" or "I am certified" (which relates to purpose 3 of the app). These should beconsidered for iteration 3.
Further, app tests expose how the app is currently not actively designed withlearning in mind, and thus not distance learning. This is unfortunate, both be-cause distance learning is important, and as the app test with refugee innovatorsshows that there is an opportunity doing entrepreneurship training in rural areasoutside of YoungDrive’s coverage area. In order for online coach-training to workfor distance learning, learning and feedback, and not only assessment, is howeveressential.
While it may be technically possible, the teacher desires the app support herduring the coach training, not replace her. Therefore, completely replacing theteacher with an app should be avoided. The teacher is very important for givingcoaching and educating in a way that the app can’t. But the teacher can also beempowered by the app. For the future, Josefina would have liked to be able tostop coaches from having taught, if they do not have 90-100 % correct informa-tion on the subject. Today, Josefina can not assess this. This means that somecoaches, are teaching incorrect information to hundreds of youth. Here, the quizhas a very good need to fill.
If wrong on an answer, the app today has no means of giving high pay-off tipsto get to 100%, or exposing you to deliberate practice or perceptual exposure. Ifthe coach gets 9/10 correct answers reliably, or gets 5/10 answers with guesses,the coach still needs to retake all answers, not having learned the correct answerbefore taking the quiz again.
How to develop the app to solve these issues, is not obvious. Multiple strate-gies could and should be used. The app could benefit from introducing smartfeedback encouraging a growth mindset ("You did not get 100% yet") (Dweck,2014).
5.3.4.3 Next Iteration
After the meeting with the partner and expert group, the following was con-cluded from iteration #2:
• The app is partly working on assessment now, but not for learning. Arecoaches really learning via the app, especially learning to be better coaches?
– Multiple-choice is flawed in its current form. How can guesses be iden-tified and reduced in a multiple-choice format? How can answeringquestions improve confidence and encourage learning?
– How can questions be formulated in a way that teaches entrepreneur-ship, which is so practical?

70 5 Results
• The need for a field app still feels relevant (especially for sessions long sincethe coach training)
– An app could be used, either before you start planning (to guide whatyou need to study the most on), or after you think you are ready (soyou can assess and improve).
– When designing the app, it is concluded that an app for coach training,and an app to use before a youth session, should be able to be the sameapp if possible, since the purpose of preparing the coach to be greatwith its youth session is the same.
– Discussing the importance of self-reflection after a youth session withJosefina, led to asking more of such questions in coach quizzes. WhileFun Atmosphere can be hard to assess using multiple-choice, can Cor-rect Structure and Time Management be assessed?
After the partner and expert meeting, it was decided that the following needsto be done for iteration 3:
• Make sure that the coach actually learns the desired educational objectives,by performing the following:
– Create a new quiz guided by Josefina, "Are you ready for Session 9?",also to test if Correct Structure and Time Management could be as-sessed using multiple-choice
– See if design additions to multiple-choice can increase learning in-linewith Bloom’s revised taxonomy
• Design quiz app for learning, focus on field app, and have a design thatworks stand-alone from the YoungDrive coach training in mind.
– Investigate the effect of giving growth mindset feedback in the app(The Power of Yet approach)
• Test if the app created in Zambia could work also in Uganda
– This also means converting all the questions from the new (Zambia)manual to the old (Uganda) manual, since both structure and contentof the manuals has changed.
5.4 Iteration 3: Uganda Formative Test
Here the results from the qualitative and quantitative data for iteration 3 areshown together with conclusions in chronological order. For the coach trainingin iteration 1, designing the app only for assessment but not for improvementwas acceptable, since Josefina could give feedback in person. This meant thatscoring low (like 5/10) or high (like 9/10) on a quiz after a session, the coach nottaking the quiz again was not mandatory. Josefina could observe the results, and

5.4 Iteration 3: Uganda Formative Test 71
complement the missing information in an upcoming lecture or give immediatefeedback herself.
In contrast, image the situation of using the app being weeks or months afterthe training, and Josefina is no longer available. Instead, the coach uses the appexclusively one hour before a youth session, to assess if the coach is ready. If acoach receives the score 5/10 or 9/10, what should happen? Clearly, in this casethe app should be designed to not leave the coach alone, but help the coach to getsmart feedback, encourage the coach to try again and improve their score, andagain assess if the coach is fully ready for teaching the youth on the given topic.This new design of the app was the focus of the interactions from iteration 3, theresults observable below.
5.4.1 Initial Evaluation of the New Version of the App
Before going to Kampala, because of the major changes to the app, the conceptwas tested with an entrepreneurship student in Kampala and the Zambia teacher,Josefina. The two tests informed that the app was now ready to be tested with thecoaches in Tororo.
The entrepreneurship student’s overall opinion on the app was: "Can yougive me the link, because I’d love to do more of this. I think it’s amazing.". Therewere some issues found with phrasing: "Improve" should be renamed, because itis not intuitive what the button would do. The student was also surprised thatthe certification did not include something substantial (meaning it felt hollow).The student would have preferred unlocking a business challenge (showing self-determination), or something where he could get a learning reward instead of a"well done" and a badge (showing the student was not motivated by achievementin itself), see figure 5.1 I-3). This test was very valuable, and gave early insight tohow the Uganda coaches might act within the app.
The teacher in Zambia, Josefina, was consulted to comment on the app. Whenasked for an opinion, Josefina answered: "I like the idea that when the coacheshave answered all of the questions correctly, they can consilidate the knowledgeby the certification test, when the coach should get 100% correct on their firsttry." This verified the relevancy of the taken approach of separating Training andCertification, see figure 5.1.
5.4.2 App Test: Learning Gain and Effect of Functionality for
Formative Assessment
There were 25 coaches active during the app test. The test clearly showed evi-dence between the difference between designing for Assessment and Learning.See figure 5.17 and figure 5.18 to understand the setting.
Before the quiz started, the coaches were asked to raise their hand if they feltproficient with using a smart phone. 8 out of 23 said yes. After using the app, 16thought they were proficient (25% increase), while 5 said low proficiency, and 2said no (we don’t yet feel proficient, still fear).
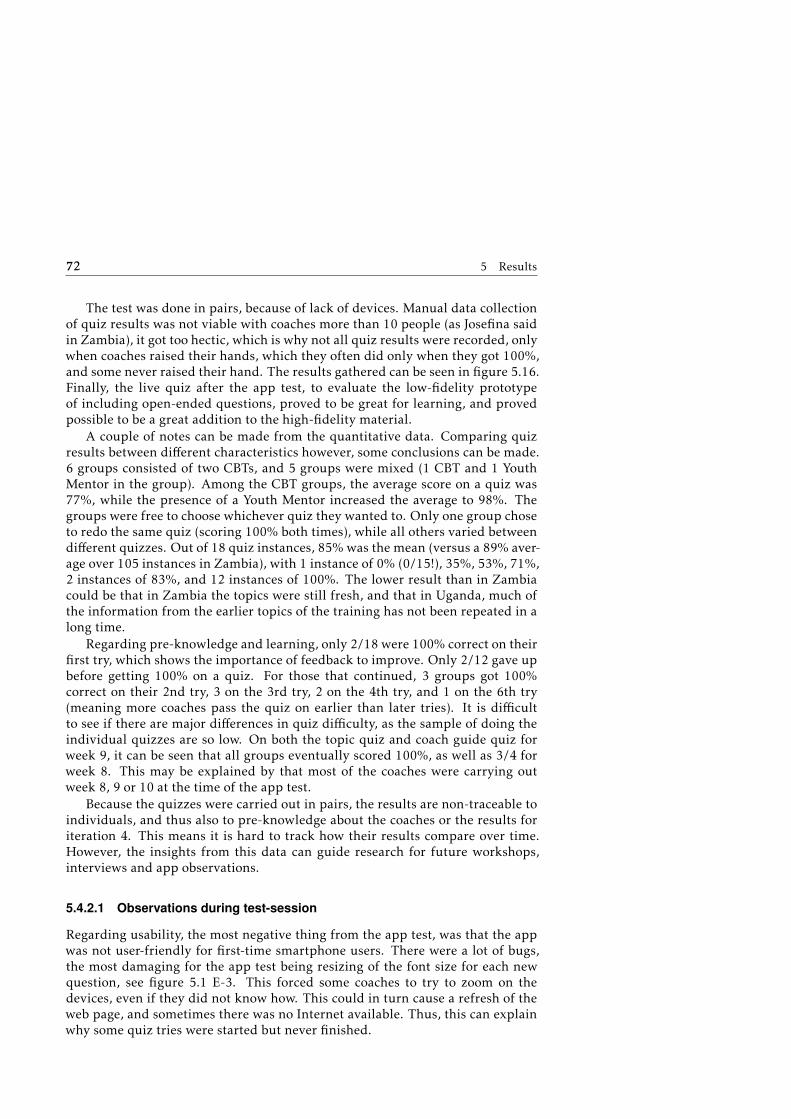
72 5 Results
The test was done in pairs, because of lack of devices. Manual data collectionof quiz results was not viable with coaches more than 10 people (as Josefina saidin Zambia), it got too hectic, which is why not all quiz results were recorded, onlywhen coaches raised their hands, which they often did only when they got 100%,and some never raised their hand. The results gathered can be seen in figure 5.16.Finally, the live quiz after the app test, to evaluate the low-fidelity prototypeof including open-ended questions, proved to be great for learning, and provedpossible to be a great addition to the high-fidelity material.
A couple of notes can be made from the quantitative data. Comparing quizresults between different characteristics however, some conclusions can be made.6 groups consisted of two CBTs, and 5 groups were mixed (1 CBT and 1 YouthMentor in the group). Among the CBT groups, the average score on a quiz was77%, while the presence of a Youth Mentor increased the average to 98%. Thegroups were free to choose whichever quiz they wanted to. Only one group choseto redo the same quiz (scoring 100% both times), while all others varied betweendifferent quizzes. Out of 18 quiz instances, 85% was the mean (versus a 89% aver-age over 105 instances in Zambia), with 1 instance of 0% (0/15!), 35%, 53%, 71%,2 instances of 83%, and 12 instances of 100%. The lower result than in Zambiacould be that in Zambia the topics were still fresh, and that in Uganda, much ofthe information from the earlier topics of the training has not been repeated in along time.
Regarding pre-knowledge and learning, only 2/18 were 100% correct on theirfirst try, which shows the importance of feedback to improve. Only 2/12 gave upbefore getting 100% on a quiz. For those that continued, 3 groups got 100%correct on their 2nd try, 3 on the 3rd try, 2 on the 4th try, and 1 on the 6th try(meaning more coaches pass the quiz on earlier than later tries). It is difficultto see if there are major differences in quiz difficulty, as the sample of doing theindividual quizzes are so low. On both the topic quiz and coach guide quiz forweek 9, it can be seen that all groups eventually scored 100%, as well as 3/4 forweek 8. This may be explained by that most of the coaches were carrying outweek 8, 9 or 10 at the time of the app test.
Because the quizzes were carried out in pairs, the results are non-traceable toindividuals, and thus also to pre-knowledge about the coaches or the results foriteration 4. This means it is hard to track how their results compare over time.However, the insights from this data can guide research for future workshops,interviews and app observations.
5.4.2.1 Observations during test-session
Regarding usability, the most negative thing from the app test, was that the appwas not user-friendly for first-time smartphone users. There were a lot of bugs,the most damaging for the app test being resizing of the font size for each newquestion, see figure 5.1 E-3. This forced some coaches to try to zoom on thedevices, even if they did not know how. This could in turn cause a refresh of theweb page, and sometimes there was no Internet available. Thus, this can explainwhy some quiz tries were started but never finished.
5.4 Iteration 3: Uganda Formative Test 73
This was the first time true frustration was shown. Out of 23 respondents,7 rated the app easy, 11 medium, and 6 hard. This was not viable, in termsof reaching YoungDrive’s goal with the app: "It should be easy to understand,pedagogical and enjoyable to use, and the coaches should think it is fun andmeaningful to learn via the app", see section 1.1.2).
Another reason for the low usability, is that cognitive load seemed to be toohigh. The feedback was not scaffolded enough, so coaches did not have enoughenergy to assess all of their results carefully before taking the test again via "Im-prove". One user did not want to press "Improve" until having read the manual.The motivation was: "Not because that is what the info says, but because I canlearn more from the manual, about more than what the questions says." This isin fact the preferred behaviour from Josefina, and the app should continue tofurther encourage only using the app training or certification mode after havingprepared via the manual. This way, the app is still assessment, but it is "learningby thinking", with feedback. In iteration 4, comparing those that are allowed touse the manuals with those that are not allowed to, would be interesting.
Regarding learning, four new ideas were tested during the app test, assessingthe new pedagogical model of the app. Item 1-3 were tested in the app (the high-fidelity trigger material), see figure 5.1, and item 4 was tested via low-fidelitytrigger material, asking a coach (and then the coach audience) if he or they couldgive the answers from memory without being shown alternatives.
1. "Try again"-button. When clicked, your wrong answers are repeated.
2. If 100% on the 1st try, gold. On 2nd try: silver. On 3rd try: bronze.
3. Ask meta-cognitive questions, "Are you sure?", at the end of each question.
4. Speak your answer to the question before you are shown alternatives.
Item 1, 2 and 3 were determined good after the interviews. Item 4 showed rel-evance, but implementation in the app would give many challenges (mainly howto assess if the coach could give the right answer without giving different alterna-tives. Voice recognition or free-form answers are hard to analyze, to implement,and to use by a first-time smartphone user).

74 5 Results
Figure 5.16: The data gathered from iteration 3. A is order of quiz submis-sion, B and C is Coach ID for coach 1 and 2 in the group, C is quiz chosen(CS9 meaning "Coach guide week 9"), D is correct answers, E is number ofquestions, G is percentage correct answers, and F is recorded quiz try on theparticular topic at the time of submission.

5.4 Iteration 3: Uganda Formative Test 75
Figure 5.17: Two coaches using a tablet for the formative app test. Thecoaches worked in pairs. After the app test, interviews was held, beforeco-creation workshops started.
Figure 5.18: A variation of smartphones and tablets were used. In one case,the battery died on one of the device so it needed to be replaced with a com-puter. It was the first time the coaches used a computer, and they learnedquickly and eagerly.

76 5 Results
5.4.3 Follow-Up Co-Creation Workshops
There were room for doing five co-creation workshops during iteration 3, whichwere done immediately after the big app test with the same 25 coaches. For thefollowing workshops, the coaches themselves could propose topics. These werethe five suggested topics by the coaches:
1. Finding the YoungDrive icon after unlocking the device
• The outcome led to in iteration 4, only the YoungDrive icon being onthe start screen, and no other apps.
2. Making the app more user-friendly
• While the proposals was not very concrete, this led to a realization thatthe app needed to be more user-friendly, and thus gave a larger focuson this for iteration 4.
3. Finding local examples of entrepreneurs to inspire the youth
• This lead to the realization that most coaches having a hard time find-ing local success examples of entrepreneurs. An app could addressthis need in the future, both having a bank of successful local en-trepreneurs, and booking them for visiting a youth session.
4. How to get access to smartphones (costing no more than 70 USD)
• The action was very concrete: a Plan International staff voluntarilyparticipated in this workshop, they contacted two retailers of smart-phones, and concluded that 1) coaches could utilize the youth savinggroup to afford buying their own devices or 2) Plan International couldbuy and then borrow devices to the coaches, coaches being preparedto pay if they got lost or damaged. The results showed that both stake-holders and coaches are very eager to be equipped with smartphones,seeing the benefits.
5. Becoming a better coach via other apps (like Google’s products)
• This workshop was very interesting, as coaches found numerous usesof a smartphone which would benefit them in their work. The coacheseven figured out how to use Google voice to ask questions, like themost profitable company in Tororo, or getting directions, or using theapp for translations. It is evident that equipping the coaches withsmartphones has very concrete extra benefits other than the Young-Drive app, and shows a tendency that the coaches are more eager touse the smartphone for utility than for entertainment.

5.4 Iteration 3: Uganda Formative Test 77
5.4.4 App Tests with Three Coaches Before and After a Youth
Session
Below, the results from the app tests with three coaches before and after havinga youth session are shown.
5.4.4.1 App Test with Coaches Before a Youth Session: Collection of
Affective Reactions, and Proposals for Improvements
There were three coaches testing the app after having prepared for their youthsession, but before carrying out the teaching. Some things were notable from thefield visits:
• "Are you sure?" is understood intuitively (you can’t progress without an-swering), but some coaches deliberately answer "Yes" even if they are notsure.
• Idea to highlight different words of similar answers, to increase speed
• In summary, if wrong, show the other alternatives either way, not only thewrong answer
• Idea for future work: "Go to participant manual" within the app
• If correct and unsure, she says "I still feel good". "Include it in wrong, be-cause maybe I was still guessing".
• Change button to "Become certified", to increase likelihood to press the but-ton. As of now, it was not obvious.
When she did get certified, she said: "I feel good". When asked why, she said:"They have appreciated what I have done". The next day, the same three CBTsgathered at the Plan International office to do an app test on the hardest quiz.
Having a service mini-sprint after the field visit, quick iterations could bemade to the app. One such example comes from the field visits. Originally, itwas believed best to use Gold/Silver/Bronze in the Training mode, and "Are yousure?" in the Certification mode. User tests showed that the other way aroundwas better, and this was changed for the next meeting with the coaches. Thisexample shows the relevancy of testing the app with the intended users, as it hadnot been evident from the tests with the Kampala student or the teacher.
A service design approach was used, first observing how preparations wasmade without the app, and then introducing assessment via the app, followedby interview. What was the most valuable feedback from the field visits, was tosee that the app had indeed been a perfect fit for use in the field before a youthsession. However, it was not possible due to time limitations to follow the coachto their youth session afterwards, to see the actual effect of preparing via the app.
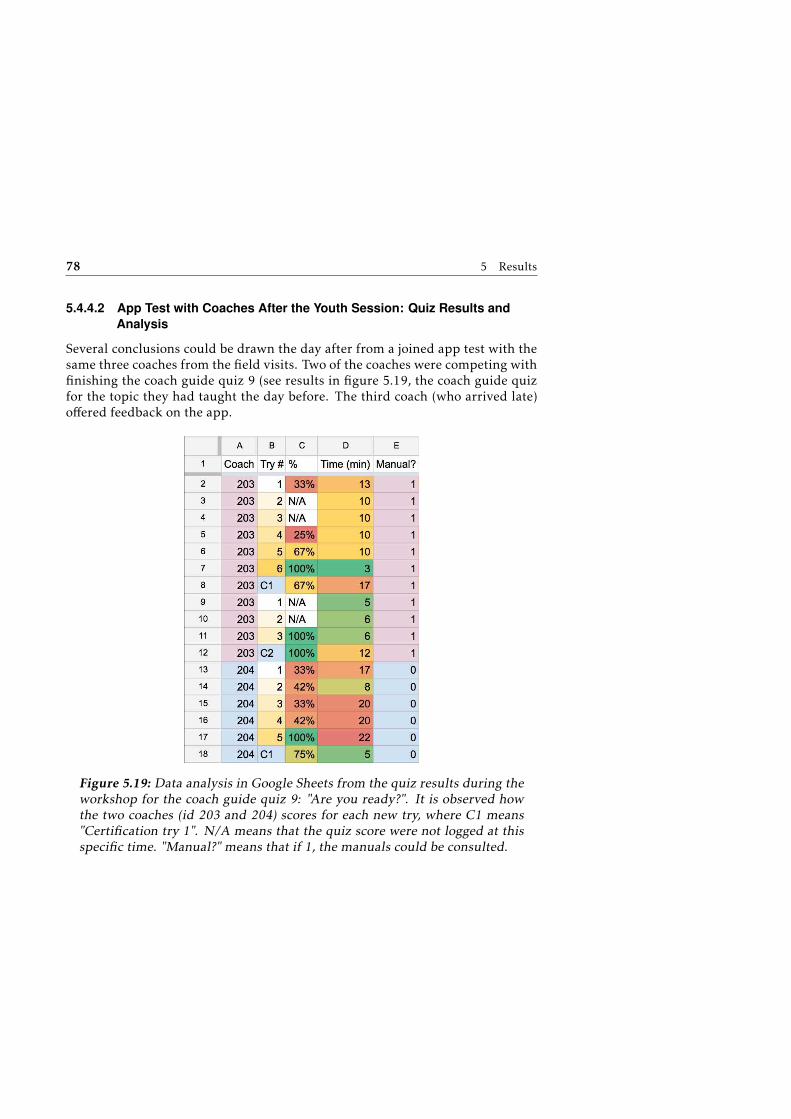
78 5 Results
5.4.4.2 App Test with Coaches After the Youth Session: Quiz Results and
Analysis
Several conclusions could be drawn the day after from a joined app test with thesame three coaches from the field visits. Two of the coaches were competing withfinishing the coach guide quiz 9 (see results in figure 5.19, the coach guide quizfor the topic they had taught the day before. The third coach (who arrived late)offered feedback on the app.
Figure 5.19: Data analysis in Google Sheets from the quiz results during theworkshop for the coach guide quiz 9: "Are you ready?". It is observed howthe two coaches (id 203 and 204) scores for each new try, where C1 means"Certification try 1". N/A means that the quiz score were not logged at thisspecific time. "Manual?" means that if 1, the manuals could be consulted.
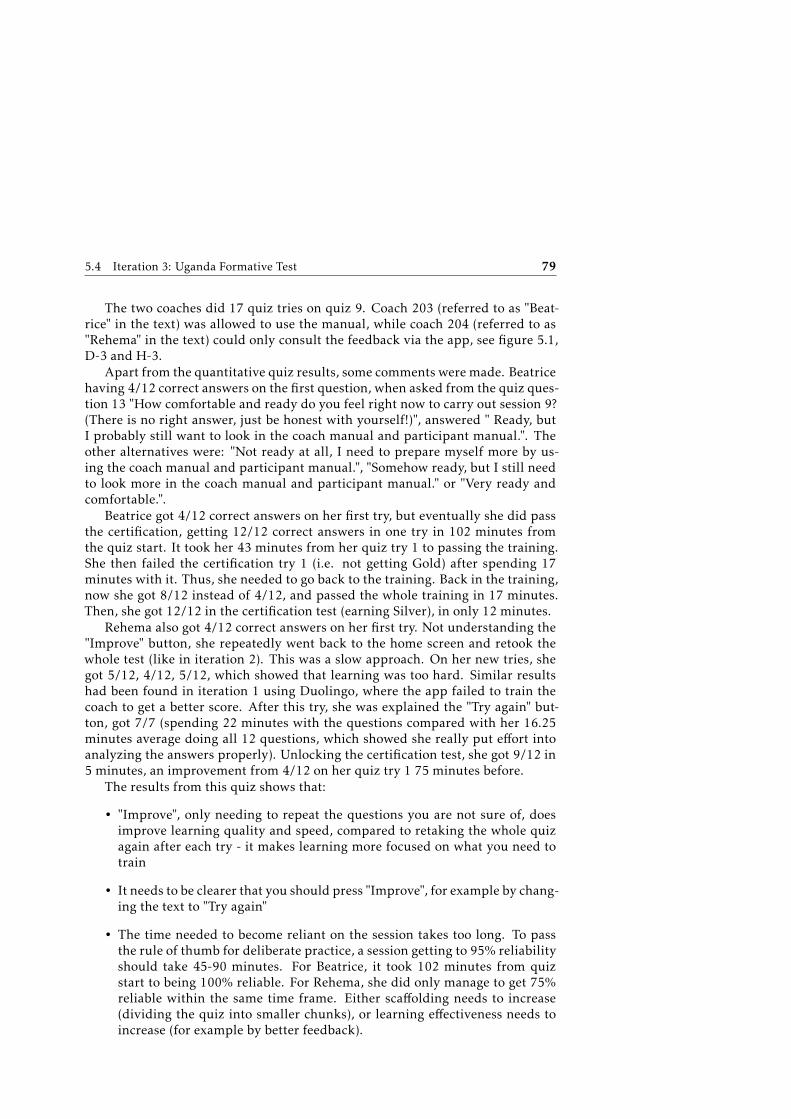
5.4 Iteration 3: Uganda Formative Test 79
The two coaches did 17 quiz tries on quiz 9. Coach 203 (referred to as "Beat-rice" in the text) was allowed to use the manual, while coach 204 (referred to as"Rehema" in the text) could only consult the feedback via the app, see figure 5.1,D-3 and H-3.
Apart from the quantitative quiz results, some comments weremade. Beatricehaving 4/12 correct answers on the first question, when asked from the quiz ques-tion 13 "How comfortable and ready do you feel right now to carry out session 9?(There is no right answer, just be honest with yourself!)", answered " Ready, butI probably still want to look in the coach manual and participant manual.". Theother alternatives were: "Not ready at all, I need to prepare myself more by us-ing the coach manual and participant manual.", "Somehow ready, but I still needto look more in the coach manual and participant manual." or "Very ready andcomfortable.".
Beatrice got 4/12 correct answers on her first try, but eventually she did passthe certification, getting 12/12 correct answers in one try in 102 minutes fromthe quiz start. It took her 43 minutes from her quiz try 1 to passing the training.She then failed the certification try 1 (i.e. not getting Gold) after spending 17minutes with it. Thus, she needed to go back to the training. Back in the training,now she got 8/12 instead of 4/12, and passed the whole training in 17 minutes.Then, she got 12/12 in the certification test (earning Silver), in only 12 minutes.
Rehema also got 4/12 correct answers on her first try. Not understanding the"Improve" button, she repeatedly went back to the home screen and retook thewhole test (like in iteration 2). This was a slow approach. On her new tries, shegot 5/12, 4/12, 5/12, which showed that learning was too hard. Similar resultshad been found in iteration 1 using Duolingo, where the app failed to train thecoach to get a better score. After this try, she was explained the "Try again" but-ton, got 7/7 (spending 22 minutes with the questions compared with her 16.25minutes average doing all 12 questions, which showed she really put effort intoanalyzing the answers properly). Unlocking the certification test, she got 9/12 in5 minutes, an improvement from 4/12 on her quiz try 1 75 minutes before.
The results from this quiz shows that:
• "Improve", only needing to repeat the questions you are not sure of, doesimprove learning quality and speed, compared to retaking the whole quizagain after each try - it makes learning more focused on what you need totrain
• It needs to be clearer that you should press "Improve", for example by chang-ing the text to "Try again"
• The time needed to become reliant on the session takes too long. To passthe rule of thumb for deliberate practice, a session getting to 95% reliabilityshould take 45-90 minutes. For Beatrice, it took 102 minutes from quizstart to being 100% reliable. For Rehema, she did only manage to get 75%reliable within the same time frame. Either scaffolding needs to increase(dividing the quiz into smaller chunks), or learning effectiveness needs toincrease (for example by better feedback).

80 5 Results
The data and observations also shows that learning Correct Structure andTime Management via multiple-choice is not effective. Especially, this is shownby the time it takes to get a high score. To score well on such a test, the coachwould retrieve from memory using a clear mental image. In its current design,getting a clear mental picture is not supported by the multiple-choice design. SeeFuture Work in chapter 8 for a further discussion how this Correct Structure andTime Management can be better assessed in the future.
5.4.5 Sprint Demo
A sprint demo concluded the findings from iteration 3. Now the coaches couldnot only assess, but also learn Correct Information, which was successful, butneeds to be done more effectively. It took an unacceptable amount of time toreach 100% proficiency on all the quizzes. This was especially evident, on thequiz on Correct Structure and Time Management, "Week 9: Are you ready?",when it took a coach 102 minutes to reach 100% without errors. In iteration2, when "Improve" did not exist, it probably would have taken even longer.
For the first time both signs of learning via perceptual exposure (many ques-tions during a limited time, by trial and error) and deliberate practice (via learn-ing via reflection) could be identified from the app. It is just that the app as ofnow is quite inefficient, especially in terms of speed, so while the ideas are there,the criteria are not fulfilled.
The focus had been on "I am well prepared", but also including "I am certi-fied.". It was shown that most coaches do not care about the simple gamificationaspect of "I am certified" (which the workshop already had shown) but that theydo care about their learning progress and learning results. The app could furtherembrace this.
If there is one thing additional learned during the iteration, it is the insightthat data is knowledge, and knowledge is powerful. A realization is that both thedeveloper, the coaches, the teacher, and the project partners can gain importantinsights from the data. Adding "Are you sure?" to each quiz question, coach under-standing was amplified, because now, also the coach’s attitude towards learningcan be evaluated. See more about this in the Discussion chapter 6.
5.4.5.1 Next Iteration
To improve effectiveness for the next iteration, a couple of goals were chosen.While the app would work well for the Ugandan coach training, the use case of ayouth session was not good enough yet. Mostly, this is in regards to that it takestoo long time to improve via the app, and that the feedback is not sufficient. Thisleads to introducing these forthcoming goals, with the associated recommenda-tions:
• Improve Deliberate practice. The criteria for Deliberate practice is not ful-filled today.

5.5 Iteration 4: Uganda Summative Test 81
– Follow the recommendation to design so that knowledge in a topic cango from unreliable to 95% reliability within one to three 45-90-minutesessions.
– If this is not possible from changing the learning tactic, don’t continuetrying: split the quizzes into smaller pieces (Sierra, 2015).
• Improve Perceptual expose
– Divide the learner’s expertise according to Sierra (2015), "Can’t do","Can do with effort", and "Can do effortlessly".
• Increase the use of questions to prompt self-monitoring and self-evaluation(Sitzmann and Kanar, 2008).
– Using "learning by thinking" and encouraging a growth mindset, canbenefit reaching metacognitive skills on Bloom’s Revised Taxonomy.
– Help the coach to analyze and evaluate its own learning, possibly im-proving faster in the app.
• Improve feedback to reflect that the teacher does not want to encouragecoaches to have their youth session before they are 100% confident withthe material
• Data collection should be online and needs to be individual, so that the datais increasingly without faults and can be more easily analysed
– To do it online means that there needs to be a database, but also a login,so individuals are traceable.
5.5 Iteration 4: Uganda Summative Test
Here the results from the qualitative and quantitative data for iteration 4 areshown together with conclusions. In these activities, there were 25 coaches presentduring both the app test and the interviews.
5.5.1 Analysis of Quiz Results
For the first time, automatic data collectionwas used, which increased the amountof quantitative data that could be analysed substantially. Below, the findings fromeach data analysis method are presented. There was one test group and one ref-erence group, the difference being if they were allowed to consult the manuals oronly use the feedback from the app.

82 5 Results
5.5.1.1 Quiz Results and Pre-Test Data Analysed in Google Sheets
For results gathered and analysed within the Google Sheet, see figure 5.20. Fora zoomed in version, see Appendix A. Early observations from the pre-test datawhen inserted into Google Sheets was that a surprising number of cells were leftblank. One user had not done the pre-test (see column for coach 220), wheresome had left questions unanswered (most commonly "Do you own a company?"(should have used the word "business"), plus "Hours of preperation" and "Occa-tions for a youth session" (there is a tendency this might be because they were notproud of their answers, because of correlations with low quiz results).
Figure 5.20: The Google Sheet after merging the pre-test data and thesummed quiz results data. See zoomed-in versions and explanations for eachsection below.
Figure 5.21: Pre-test data
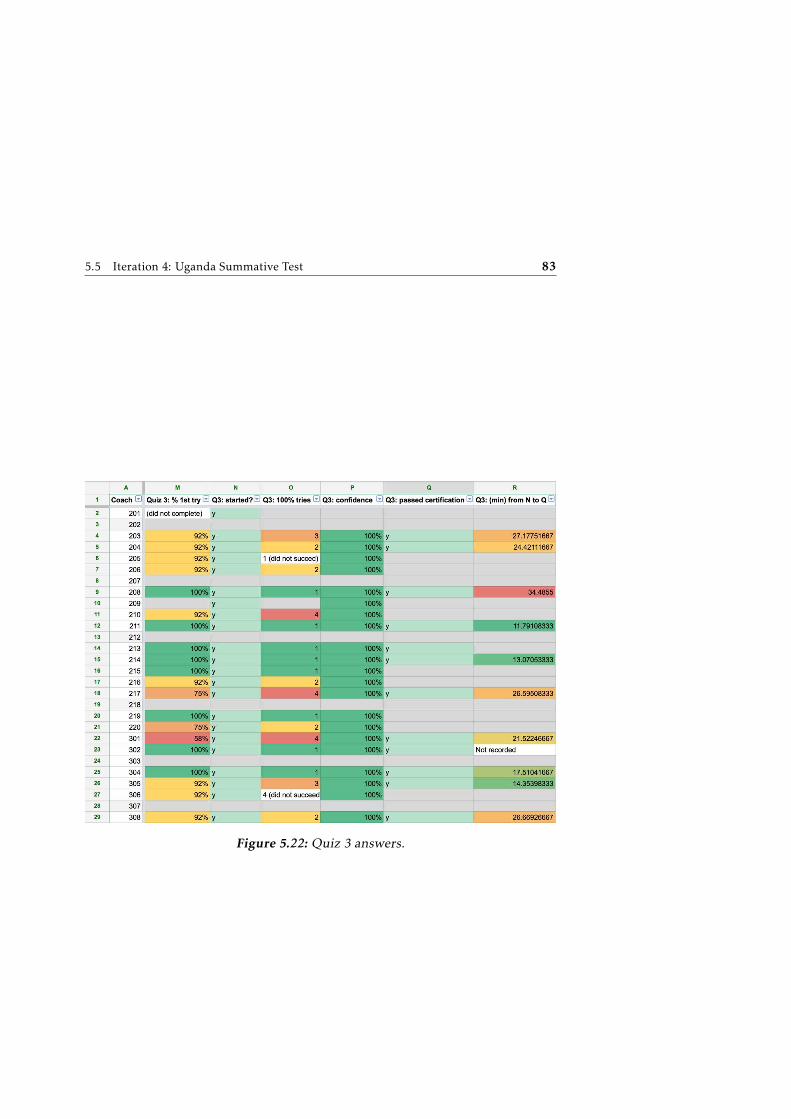
5.5 Iteration 4: Uganda Summative Test 83
Figure 5.22: Quiz 3 answers.

84 5 Results
Figure 5.23: Quiz 9 try 1 answers (correctness and recorded confidence ("Areyou sure?": "Yes/No") on coach guide quiz 9 "Are you ready?", together withanswering "How comfortable and ready do you feel right now to carry outsession 9? (There is no right answer, just be honest with yourself!", alter-native 1-4 ("Not ready at all", "Somehow ready", "Ready" or "Very ready andcomfortable"). Finally in column Y, the time it took for the coach to completequiz try 1 is given.

5.5 Iteration 4: Uganda Summative Test 85
Figure 5.24: Quiz results on the training and certification of coach guidequiz 9 "Are you ready?". Column AB: how many minutes they spent in train-ing. AC: how many times they pressed "Try again", retaking the wrong an-swers. AD: their score on the last training quiz they took. AE: the increasefrom their first training to their last. AF: recorded "Are you sure?": "Yes/No"after taking the quiz try 1. Finally, for the coaches that started the certifica-tion, their results are shown, together with the time the quiz took for thosethat got 100% correct on the first try.

86 5 Results
Figure 5.25: Pre-quiz results per question and coach. The correct answersare given in green. The questions asked can be observed in Appendix B
.
5.5 Iteration 4: Uganda Summative Test 87
Missing cells was not as obvious with the app results, were users could notprogress in a quiz without answering both the question and the confidence. How-ever, none of the passed quiz 9 certification answers had been submitted. Thus,it was needed to add these from the manual recordings, which had been used asa backup in case anything like this would happen.
There were a number of quick insights that could be drawn before the parallelcoordinates visualization, simply by looking at the data as a spreadsheet.
It was believed that smartphone users feeling like novices might have a disad-vantage with the app, since they will not learn as fast as experienced users. Theinteractions shows however, between iteration 3 to 4, almost all of the coachesdoes not feel intermediate instead of beginners using the smartphone and theYoungDrive app. The quiz data verifies this, with no direct correlation betweentechnical skills and quiz results (comparing column H "Smartphone level" 1-3)with column M and T (quiz scores on the first try for quiz 3 and 9). From thepre-test data, it can be seen that only CBTs said they didn’t feel comfortable withsmartphone (n=2, column H, of which there were 6 Youth Mentors and 14 CBTs).A reason might be age, as CBTs were older than the Youth Mentors. Also, youthmentors had higher school level than the CBTs. More probable, is that the expe-rience of using a smartphone since iteration 3 has matured over time, and thatthey are now more confident.
From the Google Sheets quiz results data, it could be seen that there was a sur-prisingly low number of answers where the user answered the question withoutconfidence (see column P, U and AF). This is not good for feedback purposes, asanswers were actually often not correct.
First-hand insights before the parallel coordinates were that there was a strongcorrelation between pre-quiz results (column D) and quiz 9 try 1 (column T), andslightly visible also in quiz 3 try 1 (columnM), but with more outliers. Also, withmanuals there was a higher probability of finishing quiz 9 training and certifi-cation (see also findings from the parallel coordinates visualization below). Thedata shows small tendencies that being honest and deliberate during the trainingincreases the likelihood that a coach can get 100% without faults, and has trulylearned.
The final version of the app shows users can get 100% on quiz results muchfaster (column R, AB and AI) than the previous version, as the score board hadbeen improved for iteration 4. Since the target group in Zambia and Uganda wasdifferent, it is hard to empirically prove if it went faster getting 100% with thepossibility of repeating only the wrong questions, asking "Are you sure?", andproviding individual feedback. Asking after the app does in iteration 4 doesshow however, that 100% of the coaches now thought the feedback was good forlearning.
Also, from observing all of the quiz submissions (see sample in figure 8.1),more users had started a quiz without finishing it than anticipated. This speaksfor usability issues (cancelling the quiz by mistake, like clicking the back button,or loss of internet access) or bad technical skills (needs to design to be more fail-safe) or lack of motivation (needs to design for unmotivated coaches as well. Theneed group of "challenged coaches" might need other design than "ideal coaches".

88 5 Results
Finally, a lot of users had done quizzes that were not Topic quiz 3 and Coachquiz 9, which might indicate high interest (if they did more than 2 quizzes) orconfusion (if they did not do 3 or 9, but they did do other quizzes) during theapp evaluation. This meant that on some aspects, there were less data than an-ticipated, (which was troublesome, as there were already few data points), andsome aspects where there was more data than anticipated (on overlooked otherquizzes).
5.5.1.2 Parallel Coordinates Visualization
Statistical analysis in R showed that none of the results were statistically signifi-cant to be notable using linear regression, or any of the other statistical methodsdetailed in the methodical framework. It was believed that statistical analysiscould at least give insight into what to look for in the parallel coordinates visual-ization, but also for this, a larger sample would be needed. An interactive paral-lel coordinates visualization could give many more insights, more faster than thestatic presentations in Google Sheets or statistical analysis in R.
There is an almost infinite number of findings and observations that are inter-esting to look at via the parallel coordinates visualization. Even if there are noclear correlations (which are often found immediately when working with largedata sets and parallel coordinates), tendencies can be found. As nothing is statis-tically significant (mostly because of the small data sample), the only thing thatcould be found are tendencies, and to analyze outliers. Then, these findings wascritically analyzed to characteristics, and observations made from the app tests.As such, the data should be seen as indications of where future research is inter-ested, and not as universal truths. For further research into the data, see figure5.26 and the below sections.

5.5 Iteration 4: Uganda Summative Test 89
Figure 5.26: The quiz results from iteration 4 shown in an interactive par-allel coordinates visualization. The visualization is available on http://
marcusnygren.github.io/youngdrive-parallel-coordinates/.

90 5 Results
Following the lines from column "ID" (for Coach ID), you can compare thedifference in performance between Youth Mentors (301-308) and CBTs (201-220).Between quiz 3 and 9, there is no unison difference. In quiz 9 however, the YouthMentors are top performers compared to CBTs, which goes in line with the projectleaders opinion in the field that YouthMentors are slightly better in the field thanthe CBTs. This could be explained also by that Youth Mentors only teach Young-Drive, while the CBTs also teaches other programs. It is important to note thatthere is nothing statistically significant to draw confident conclusions. Furtherresearch needs to be made, as a connection between how a coach performs in thefield versus the app is valuable.
The results shows that the ideal coach, according to the quiz app, would be awoman, both in contrast and in unison with the literature mentioned in section2.1. In figure 5.26 it can be seen that the female coaches (red lines) on averagehas better scores than the male coaches (blue lines), in spite of having less formaleducation. Further, she prepares more, is more aware of her own knowledgeand has a better study technique, respecting the app feedback for meta-cognitionand meta-memory. More than average, for example in quiz 9, the women havea higher lowest threshold, and a much higher record, than the men. two peoplewere fast enough to get certified on the final quiz before the app evaluation ended,see figure 5.27. Both were women. Apart from gender, these coaches had higherquiz results, faster learning, and more honesty in "Are you sure?" than the others.Today, the balance between male and female coaches is reversed from what thedata says: in Zambia only men have been hired, and in the data collection forUganda, only 30% (6/14) were women.
Other social characteristics on the two coaches that passed the certificationfor coach quiz 9 is that were that both were CBTs (not youth mentors), and werein the middle of the age groups (24 and 26 years old). Regarding performance,they had a good pre-test score (57% or 71%), had top scores on quiz 3 try 1 and 9try 1. Also, both of them used the manual, they looked at themselves as medium-skilled using a smartphone, and they preparedmany times per youth session (2 or3 times). In figure 5.27, a more detailed explanation is given. What didn’t seemto matter for top performance, was number of tries for passing the training ofquiz 9 (one coach did 2 tries on quiz 9, the other 12 tries), or time to pass trainingquiz 9 (35.5 minutes on the slowest versus 12 minutes on the fastest). Neither didit seem to matter when they prepared their session (1 did preparations the sameday, 1 the day before). Regarding social characteristics, one had a business, onedidn’t, and their school level were both low.
Finally, it is interesting to observe the differences (and lack thereof) betweenthe test group and reference group, by following the lines from the second col-umn, "Help", of figure 5.26. In the test group ("Help" = 1), the paper manualscould be read before improving on the quiz results (not during the actual test)The the reference group ("Help" = 0) were only allowed to observe the right an-swers within the app, from the score board. In quiz 3, where almost all coacheshad 92% or 100% immediately, there is no difference observable. However, inquiz 9, the hardest quiz, 5/7 that passed the training were in control group A,and 2/2 that passed the certification were in control group A. An explanation

5.5 Iteration 4: Uganda Summative Test 91
Figure 5.27: The parallel coordinates visualization showing the characteris-tics of the two coaches that passed the quiz 9 certification. They were bothCBTs, they could both could consult the manuals, they had a low education,while still having higher pre-test scores that the average. They were rela-tively young and were both women (in minority). One had a company andone did not. The one that inserted how she prepared for session, said sheprepared the day before (versus doing it the same day), on three occations.Regarding quiz results, they both had a high score on try 1 of quiz 3 "Finan-cial literacy" (1 or 0 errors), just like the majority, and it took them 1 or 3tries to pass the training. For the coach where time is recorded for gettingcertified, it took her 27 minutes to pass the quiz (higher than the average).On quiz 9, it took 13 minutes to get 67%, the other coach (time not known)scoring 83%. While the coach with 83% passed the training in only 12 min-utes and 2 tries, it was the coach taking 35 minutes to take 12 tries that couldafterwards get all of the answers correct in the Certification.
could be that the large amount of questions made the correct answers hard tomemorize versus actually learning, or that the ones with manuals felt more sup-ported or motivated because of the extra support. While these findings could betrue for a larger sample, further research needs to be done. The same methods ofdata analysis are increasingly relevant with a larger data set, and there seems tobe correlations and tendencies worth looking further into.
5.5.2 Analysis of Interviews
The answers given during the three group interviews has been summarized andclustered into three areas, see figure 5.28. Further, the answers within interactiondesign has been clustered into its four main principles, see figure 5.29. The ques-tions regarding learning has tried to answer why a coach is correct or incorrect ona given question, see figure 5.30. Service design has been clustered into the twoquestions "When do you want to use the app?" and "When are you not able to usethe app?", see figure 5.31. Zoomed-in versions of all of the areas are presented af-ter the overviews, where the analysis of the quotes can be seen in its fullest. Thequotes from these mind-maps are individual, which means that if another coachhas had a similar thought, their quote is branched next to the following quote.

92 5 Results
Figure 5.28: The interview answers has been clustered into three areas:learning, interaction design and service design.
Figure 5.29: The coach quotes regarding interaction design have been di-vided by four criteria: pleasurability, usability, utility and desirability.
Figure 5.30: The coach quotes regarding learning have been divided by ifthey give insight to why a coach has been correct or incorrect on a givenquestion.
Figure 5.31: The coach quotes regarding service design have been dividedinto when you want to use the YoungDrive app, and when you are hinderedfrom doing so.

5.5 Iteration 4: Uganda Summative Test 93
5.5.2.1 Learning
By reading the quotes from the coaches carefully, it can be understood why an-swers can appear correct by the coaches (see figure 5.32), even if this would notbe the case (see figure 5.33. Also see section Interaction Design for commentsregarding the learning experience.
Figure 5.32: Quotes explaining why a coach could give a correct answer toa given question. Either you were sure of the answers, or you made a qual-ified guess. A prerequisite for answering the question correctly is that youunderstood the question’s meaning.
Figure 5.33: Quotes explaining why a coach could give an incorrect answeron a given question. Either, the coach did not have sufficient knowledgeto answer the question confidently (for a number of reasons, given in thefigure), or the question was not understood correctly, or the app usabilitywas a hindrance.
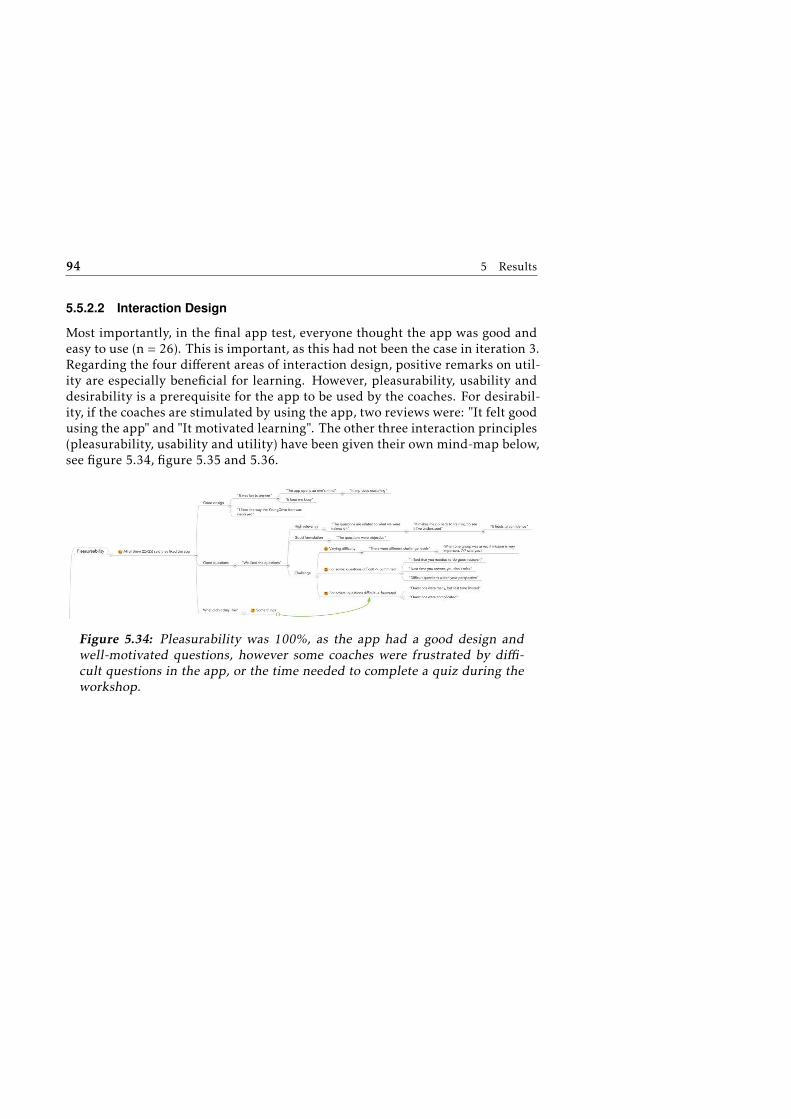
94 5 Results
5.5.2.2 Interaction Design
Most importantly, in the final app test, everyone thought the app was good andeasy to use (n = 26). This is important, as this had not been the case in iteration 3.Regarding the four different areas of interaction design, positive remarks on util-ity are especially beneficial for learning. However, pleasurability, usability anddesirability is a prerequisite for the app to be used by the coaches. For desirabil-ity, if the coaches are stimulated by using the app, two reviews were: "It felt goodusing the app" and "It motivated learning". The other three interaction principles(pleasurability, usability and utility) have been given their own mind-map below,see figure 5.34, figure 5.35 and 5.36.
Figure 5.34: Pleasurability was 100%, as the app had a good design andwell-motivated questions, however some coaches were frustrated by diffi-cult questions in the app, or the time needed to complete a quiz during theworkshop.

5.5 Iteration 4: Uganda Summative Test 95
Figure 5.35: Usability. As previosuly stated, all of the coaches (25/25)thought the app was easy to use when asked by raise of hands. However,in the interviews, some detailed comments regarding usability appeared.Regarding workshop issues, some of the devices’ battery died during theworkshop, or needed to be replaced. Regarding the app, some still mentiontoo much information to appear at once, or that information are shown thatthe coach does not expect. Only one coach mentioned thinking that thee lo-gin was not user friendly, since the Coach ID was easy to forget. The CoachID has since been documented by the local project leaders, so they can becontacted in such situations.
Figure 5.36: Utility gives a valuable measure of what benefits the coach findswith using the app. Quotes regarding usefulness are: "It quickens the exer-cise", "It carries all summaries of the work", "It reminds to guide the youthcorrectly". For training, coaches conclude that "It evaluates my performance"and that "The feedback is excellent". One coach summarizes with "It in-creases the level of perfection".

96 5 Results
5.5.2.3 Service Design
It is important to understand if and when the app will be used by the coach,and if the environment of the coach in any way can hinder use of the app. Forunderstanding the coach situation to these two criteria, see figure 5.37 and 5.37.
Figure 5.37: There are very varying answers to the question "When do youwant to use the app?". Most coaches would have liked to use the app imme-diately. Some of the coaches identified the need for devices, more training,or charging of devices in being able to do so.
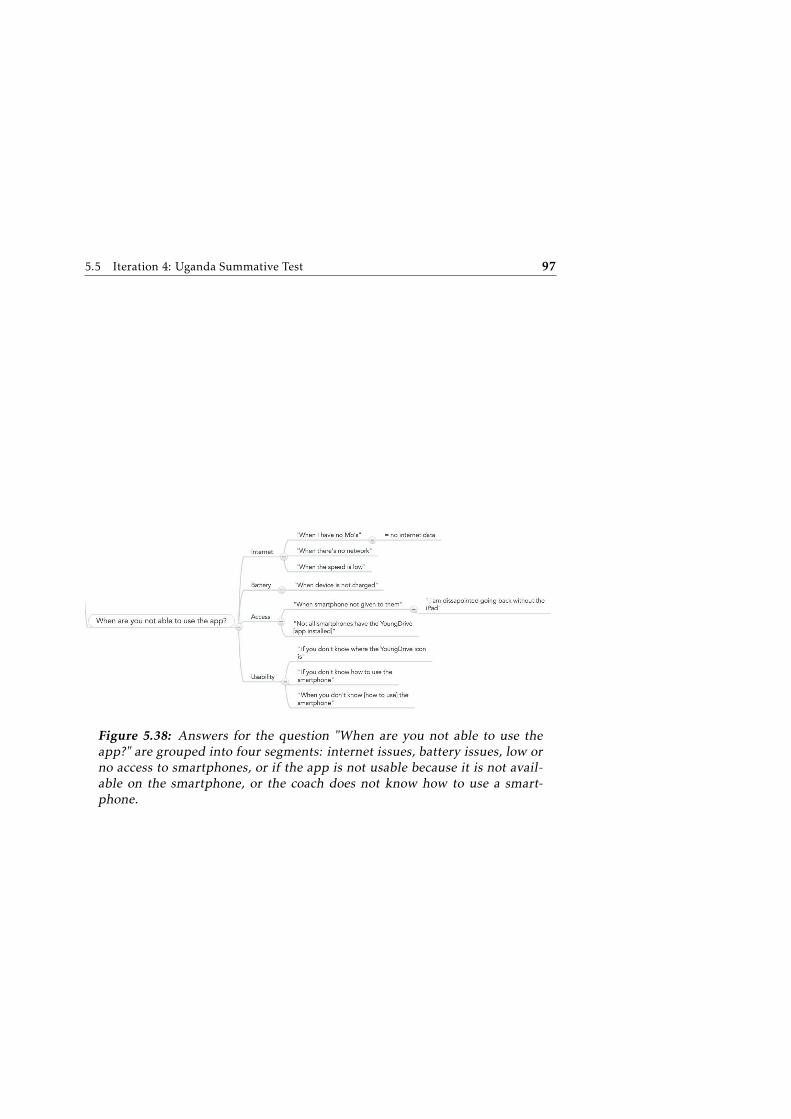
5.5 Iteration 4: Uganda Summative Test 97
Figure 5.38: Answers for the question "When are you not able to use theapp?" are grouped into four segments: internet issues, battery issues, low orno access to smartphones, or if the app is not usable because it is not avail-able on the smartphone, or the coach does not know how to use a smart-phone.


6Discussion
The discussion section is framed by revisiting the five research questions. Foreach question, important aspects are considered, often comparing with the liter-ature. This then leads to the conclusions of the master thesis, and future work.
6.1 How is the Development Affected by the
Technical Possibilities?
As devices were limited, a goal was to make the app available on as many devicesas possible. Creating a hybrid app using web technologies using Meteor madethe app available both as a native app on Android and iOS devices, as well as onthe web. On the other hand, this is not enough: the pre-evaluation showed thatonly 3 out of 16 had a smartphone today (Lönn, 2015c).
As internet is accessible but expensive and often used seldom, the app doesnot provide rich media or simulations, but focuses instead on creative designpossibilities using multiple-choice, also having cognitive load and scaffolding inmind. The interviews and observations from iteration 4 details that the coachesare happywith the user friendliness of the app, and that the training in its currentform has high value for the coaches. On the other hand, images could probablybe used to lower misconceptions in language, and a future wish of the coaches isto have the manuals accessible via mobile as well, which includes both text andimages.
Most of the coaches have been first-time smartphone users. Letting them con-tinuously test and co-create the app has created a tailor-made app from theirneeds and conditions. It may be surprising how simple design solutions usingtext and clear visuals can provide rich learning feedback, mentioned by NocolNicol (2007). On the other hand, since it is so tailor-made, it needs to be exam-
99
100 6 Discussion
ined if to make the app work in other countries than Uganda and Zambia, wheredesign and technology preferences might be different.
That the app should work offline, and still be able to push quiz results when itgets online, has been a challenge. It can be hard to find good existing approachesfor some technical platforms, but for Meteor plugins such as GroundDB provedvery usable, since it is also automatic. In other apps in developing countriessometimes the user decides themselves when to push data, but in this case, quizresults are so small in size that it was unnecessary. This might be reconsidered inthe future, for example if answers are no longer solely multiple-choice.
Below, reasons the development was negatively affected by the technical con-strains are highlighted.
6.1.1 Online Data Collection was Needed Earlier
To test on all of the coaches in Uganda, it would have been preferable if data col-lection would have happened via the app instead of manually already in iteration3, since there would be more than 10 test subjects, which had been the limit inZambia. This was planned for, but technical implications with Meteor made itdelayed. Done manually, not all data was recoded in iteration 3, which made itharder to draw conclusions from the quiz results. Both Lopez Lopez (2016) andRopinski (2014) explains how visualization techniques (like parallel coordinates)are more suitable for large data sets. This can be read more about below.
6.1.2 Problems with Internet Access
In day 3 of the Zambia coach training in iteration 2, iOS no longer allowed uncer-tified app installs from the computer: you needed to have paid a license even forunreleased apps, being a "Trusted developer". This stopped the app from beingable to be installed on all the iOS devices, so that only the web version could beused. Thus, only the web app was tested on Wednesday and onwards. This was aproblem, as the app regularly crashed at refresh because of low internet capacity.Sometimes, it was needed to go to the other office where there was wifi, to refreshthe webpage, and go back to the location. Going away from the training would ofcourse not be viable Josefina, as she would miss valuable time teaching the youth.A similar situation appeared for the current author: while it was positive thatthese challenges were identified thanks to real-world testing, valuable time test-ing the actual functionality of the app was lost, with less feedback for continueddevelopment as a result.
6.1.3 Backwards Capability Issues
Upgrading from version 1.2 to 1.3 during Iteration 3 was a good example of tech-nical limitations. It took a lot of time, but when it was discovered that version1.2 did not work for old Android devices, the changes needed to be reverted. Inanother project, new Android versions might have been acceptable, but here a"better" version of software was not viable.
6.2 How is the Design Affected by the Contextual Constraints? 101
Meteor 1.2 had several disadvantages: while it worked for all devices, it didnot support React.js Meteor 1.3 was released, which promised a better developerexperience, with JavaScript ES6 support, and access to Node Package Manager(npm), plus official support for React.js. In 1.2, only some npm packages hadbeen adapted for Meteor, and tools such as Webpack could not be used.
The downsides were discovered after implementation: there were missingbackward compatibility to the older of the Android devices. The backup wouldbe the web version, but at the time of iteration 3, there were no Heroku build-pack for Meteor 1.3, making the website to crash. This was however fixed beforeiteration 4, which is why Meteor 1.3 was kept.
6.1.4 No Time Assigned for Writing Automatic Tests
The project would have benefited from passing automatic tests before doing usertests. While automatic tests were never written because of time constraints, sinceiteration 3, beta releases and production releases were separated into differentdomains, using Heroku’s staging environment, with a different GitHub branchfor each new iteration. Even so, doing automated tests would have helped tofind things that had worked previously but not in a new version, or finding bugswith new functionality like client-server communication. This would have madeinteractions with coaches more efficient, since the users would have been exposedto an app with less accidental errors.
6.1.5 Difficulties Comparing Quiz Results between Iterations
It would be highly interesting to compare the quiz results between different iter-ations of the app, to measure how much learning has increased. However, theeducational range and knowledge between Zambia and Uganda is too large todraw such conclusions: while all of the Zambia coaches had 100% correct an-swers on quiz 3 "Financial literacy" (iteration 2), the same number for Ugandawas 91.8% (iteration 4). This makes further conclusions very hard, more thanfrom informed guesses and observations. See more about this in section 8.1.3.How to empirically measure and compare learning effectiveness between differ-ent countries could be interesting future work.
6.2 How is the Design Affected by the Contextual
Constraints?
An insight is how quickly the coaches have increased their fluency with using thesmartphone and the app. Even though the design at first needs to be very simple,as long as features are introduced slowly and as intuitive, the app could becomemore complex over time, to the point where no compromises needs to be made.
When it comes to design constraints in regards to overcoming cultural dif-ferences, learning from the expertise of local partners and technology companiescan not be overestimated. They have been very willing to share previousmistakes,

102 6 Discussion
learnings and successes. This has saved a lot of time, andmade the sparse amountof interactions and development time so much more efficient. Also, the value ofgetting to know the coaches on a first-hand basis has been greatly beneficial. Theapp has been designed together with them as co-creators, with a developed mu-tual interest and understanding, having a common goal of creating an app thatworks for their needs, in accordance with service design methodology (Stickdornand Schneider, 2010).
The design was heavily influenced by starting the project with an iterationto truly understand the target group and context, and see the needs before start-ing thinking about ideas. It was good that this iteration did not have a digitalfocus, but even questioned if the best way to solve the needs would be an appaltogether. Thanks to service design, everything in the app is informed by needs,which is an example of being a thoughtful designer (Löwgren and Stolterman,2007) (Stickdorn and Schneider, 2010)).
Service design methodology allowed the design to be embraced by the contex-tual constraints. Since service design involves looking at the whole context, boththe digital context and the physical context, it was possible to understand in whatsituation the app can be used, and the situation of the people using it.
When it comes to designing for entrepreneurship, the focus of this thesis wason the educators: both the teacher, and the YoungDrive coaches. This goes in linewith the insights from Ruskovaara and Pihkala (2015), where the teacher seemedto be the main factor for a high-quality entrepreneurship education. However,contrary to Ruskovaara and Pihkala (2015), women did perform better than themale counterparts in the quiz results. Similar results have been found in otherdeveloping countries as well: from the pre-test, it is noticed that women putsmore work into preparation, even if they have a lower school level. This could beone reason why their results were better.
More so, the interviews with coaches show that the app has been fun to use,which was a recommendation from both YoungDrive and the research from Dick-son andWeaver (2008) on recommendations for entrepreneurship education. Sec-ondly, the app has focused on another best practice from Dickson and Weaver(2008), which is that the app should develop the competencies as a mentor, en-abler or coach. This can be noticeable by interview answers such as "open’s upone’s mind" and that it "evaluates my performance" with "how I’ve understood","how I’m performing" and that "the feedback is excellent".
6.2.1 From Computer Expert into a Digital Service Designer
The iterative study method supported the project in combining research and ex-periments, and doing constant improvements, tomake increasingly well-informeddecisions. For the current author, new-found skills has been acquired within:
• ethnology (getting to know and learn from people in a different culture)
• human-centered design
• design thinking
6.2 How is the Design Affected by the Contextual Constraints? 103
• service design thinking
• interaction design
• digital learning
• data analysis
It has placed high psychological pressure and leadership demands as a newdesigner, to:
• always be in charge of balancing all the different perspectives, with the enduser’s best in mind
• be able to change the planned process when new learnings or opportunitiesemerge (leading an agile design process)
• always implement new functionality from customer needs instead of de-signer or engineer bias
• continually design and runworkshops and tests suitable for the target groups
The reason why this has been especially hard, is that simultaneously to learn-ing design and technological skills, it has been in a different cultural setting thanthe designer is used to. This has also been extremely rewarding, at the same timeexhausting.
6.2.2 Having Many People Involved in the Design Process to
Adapt to the Contextual Constraints
The contextual constraints affected the design in the way that more expertise andguidance was needed than otherwise, from a diverse set of people. Service de-sign research proposes to have a diverse team to build with a holistic perspective(Stickdorn and Schneider, 2010), and this has been followed.
In the project, working with service design in another culture has been oneof the hardest and most exciting challenges. When the interactions for iteration1 were cancelled the day before the trip because of local elections, experts couldempower and affirm that this was not out of the ordinary. A learning was thatit is only possible to plan to a certain extent, but then changing the plan at thelast second, is needed more than when one’s own culture. This support fromexperts has been very helpful, having several people familiar with working ina different cultural context before, which is one of the reasons Stickdorn andSchneider (2010) suggests making a project team multi-disciplinary.
To seek out people and situations that were not obvious, gave new insightsinto the work. The project partner Plan International, did not only back up theinteractions and provide their own expertise, but also allowed interviews with ex-perienced consultants fromGrameen Foundation and Designers without Borders.Another example is involving Expedition Mondial in the design process, testingthe app on university students and refugee innovators and at startup hubs, andinvolving the local YoungDrive project leaders more than originally thought.

104 6 Discussion
It was very valuable to combine having a diverse team with the designer hav-ing a clear direction and caring for the vision of the product. Otherwise, theproduct might have ended up in many different directions
The fact that the end users and stakeholders have been involved from thestart, made them feel and have actual ownership of the product. This has manybenefits, among others that everyone involved is satisfied with the final app, sincetheir opinions and expertise has been taken into consideration and implemented.The fact that they can notice this further increases trust, and the likelihood ofthem supporting future work, which goes in line with Stickdorn and Schneider(2010). To conclude, the design has been affected heavily by the contextual con-straints, to the point where the end users are more likely to use the app as theyhave contributed to making a tailor-made product for themselves.
6.2.3 Spending Time in the Real-World Training
The original time plan stated that the interactions for Iteration #2 would havebeen in Tororo, and that it would not be possible to test the app during coachtraining whatsoever. However, during a Skype meeting with YoungDrive projectleader Josefina, it was announced that it would be possible to participate in thecoach training in Zambia during Iteration #3. A new work plan was created,which would allow travel to Zambia and to develop the app and participate inthe YoungDrive coach training together with the coaches.
Now, it was shown already at Iteration #2, that if the app would have beencreated solely by the designer, it would have been assumed necessary with morefunctionality. Inventing the "field hackathon", designing and developing togetherwith the users, meant that already for iteration 1, the purpose "Validate thecoaches’ level of knowledge during their education" could be fulfilled. The twofollowing iterations could now focus on "Train the coaches on distance", and "Cer-tify all staff". Also, without the 5 days of attending the training during the fieldhackathon, questions for each topic would not have needed to be created, andthis would then have been a must-have for Future work.
The intense training in Zambia gave a lot of time to discuss and interact withthe trainer, Josefina Lönn. One important contextual constraint that was noticed,was that Josefina did not want to be replaced, but appreciated having the Young-Drive to the point where the app should not replace her, even if it in the futurewould benefit YoungDrive in terms of for example monetary reasons. This mightnot only be personal preference, as Ruskovaara and Pihkala (2015) claims howimportant the role of the teacher is for effective entrepreneurship education.
Without visiting the Zambia training, it would have been much harder to fo-cus on the coach training purpose of the app, since the Uganda coach trainingwas already over. A consequence might have been that the app would have beenmore focused solely on "Train the coaches on distance". This shows that spend-ing time in the real-world context of the situation you are developing for is veryimportant. - especially when it is unfamiliar to you. This goes in line with theservice design principles (Stickdorn and Schneider, 2010).

6.3 How Can Test Questions be Developed to Support Entrepreneurship Learning? 105
6.2.4 Having Low Scores on the Quizzes Might Lower Motivation
Interestingly from iteration 4, the coaches scoring from 0-53% on quizzes in-cluded two coaches being top performers in Iteration 4, but also the two coachesthat did not show up for Iteration 4. Further research could be done, if the dif-ference was on motivation or fixed versus growth mindset. It could be for some,that low quiz results in iteration 3 led to not wanting to use the app any more.The app was designed to be more empowering in iteration 4, but naturally, theapp could not be tested on the two coaches that did not show up.
6.3 How Can Test Questions be Developed to
Support Entrepreneurship Learning?
The problem identified with multiple-choice questions, regardless if the recom-mendations by Nicol Nicol (2007) were taken, is that they first could only mea-sure lower-order learning objectives, see figure 2.1. While entrepreneurial knowl-edge objectives might be considered A-B 1-2, building entrepreneurial skills isdefinitely related to C-D 3-6.
When assessing the first question sets according to Bloom’s Revised Taxon-omy (Krathwohl, 2002), some characteristics were shown, which guided futurecreation of questions. Most notably, to reach C-D 3-6 on Bloom, there were sometechniques: intelligent multiple-answers could encourage the coach to evaluate in-stead of using process of elimination or encouraging guessing. Putting the coachin a coaching scenario (how to act in X situation?), the coach could be testedon a procedural and metacognitive level to apply, analyse and evaluate skills, andget feedback. The average increase by topic from topic from iteration 2 can beexplained by that the teacher formulated new question sets after each day oftraining, getting feedback from the coaches and gradually understanding how toformulate questions to assess a certain learning objective. She was also increas-ingly informed and encouraged to assess questions according to Bloom’s RevisedTaxonomy throughout the week. When constructing the new quiz for iteration 3and 4, "Are you ready?" for week 9, the teacher had a specific goal given to her toscore higher on Bloom’s Revised Taxonomy. This was also the quiz where coacheshad the most difficulty getting a high score.
Previous research by for example Nicol (2007) had already shown howmultiple-choice can be powerful, for example by following the principles in figure 2.3. Thesame articles mention the approach taken with using a confidence-meter similarto "Are you sure?". These recommendations have been utilized.
Some bad questions have still existed, where coaches did not understand andfailed to interpret the question, because too advanced English language was used.By receiving coach feedback and analyzing quiz results in-between iterations,many improvements have been made regarding formulations. This is in accor-dance with agile methodology and SCRUM, where the value of testing the prod-uct with the intended target group iteratively is acknowledged (Kniberg, 2005).
Regarding testing and improving the quality of questions, the initial plan
106 6 Discussion
was that YoungDrive would only produce questions for two YoungDrive trainingweeks, not all 10. To have questions for all of the weeks have greatly benefitedthe master thesis, and increased the value of the final product. If not all quizzeswould have been developed and tested, this would have been a Future Work.
From a question assessment, it is shown that all of Bloom’s levels can nowbe reached via the app, but create. This is because users can not create anythingin the app. Secondly, since the multiple answers are shown immediately to theuser, they are not encouraged to apply their own thinking to the question, beforeseeing the alternatives.
6.3.1 Constructing Good Questions in Entrepreneurship
Consider the entrepreneurship topic question "What is financial literacy?" toBloom’s Revised Taxonomy (conceptual and remember) (Krathwohl, 2002). A learn-ing is that to simulate a procedural environment for the coach, a question caneffectively be presented as a scenario: "It turns out that 10 youth have not carriedout the business action, what should you do?" (metacognitive and evaluating).
However, there are several traps that the person formulating the question andanswer alternatives can fall into in the case of multiple-choice, where a goodquestion might be de-amplified because of the answer alternatives (Nicol, 2007).Consider the coach being asked to give business advice to a fictional youth namedAdam: "Adamwants to start a business that is based on a product. which businessshould he start?". In this case, the coach has before been given questions on whata service and product is (factual remember), what the difference is (factual under-stand), and been given examples (conceptual analyze). Now, the skills are beingput to a procedural test. If the answer alternatives are obvious (or memorized),the learning will be lower than scoring high on Bloom’s Revised Taxonomy.
To construct high-quality answer alternatives, all of the answers must be eval-uated and considered. In such cases, multiple-choice versus open-ended ques-tions can actually amplify learning, by reaching evaluate on Bloom’s Revised Tax-onomy or by strengthening learning by thinking (section 2.3.4). In the case of theprevious question valid alternatives for the coach to consider might have been:"Start a salon", "Start selling soap", "Start a bricklaying business". The coach mustevaluate if each alternative is either a service or a product.
6.3.2 Necessary Improvements to the Multiple-Choice Design
It is still hard to score high on the knowledge and cognitive dimension usingtechniques such as multiple-choice with entrepreneurship and coaching. This ishowever necessary, if the app should reach the learning objectives of YoungDrive.This demanded additions to the multiple-choice design, and not solely content.Such design ideas were "Are you sure?" and giving individual feedback, both ofwhich encouraged metacognitive thinking. Ideas for future work can be readabout in see section 8.4.
6.4 How Does Design Affect Usability and Learning Done via the App? 107
6.3.3 Learning Effect from the Questions
To the largest extent, the questions have been praised, in regards to formulationand challenge, which can be seen in figure 5.30 and 5.29. The lack of a post-testmakes it hard to see if the test questions in the app has made a real-world effect.Ideally, the post-test in Uganda would have been to observe coaches having theiryouth session, and compare their correctness and confidence behaviour when nothaving used the app.
The lack of data (not least from the pre-quiz), makes it hard to draw reliableconclusions from the data. Regarding the pre-quiz paper submissions, the sub-missions should have been checked for blanks before handed in. Another mistakewas that school level was not always exactly specified, and this means that schoollevel and quiz results might have a stronger correlation that can be shown now.
Regarding recording test question results, this should have been done manu-ally already in iteration 3. The fact that it was done automatically in the app foriteration 4, made so that more data could be recorded, more reliably, than whenthe project leaders filled them in by hand whenever a coach raised her hand tosay she was finished with a quiz. A learning effect is indicated partly by that insome cases coaches who had a low score on their first try with a quiz, after thetraining could pass the certification test, getting 100% in 1 try. This pattern needsto be more closely examined with a bigger number of testers.
6.4 How Does Design Affect Usability and Learning
Done via the App?
The quiz design is made with Kathy Sierra’s model of deliberate practice in mind.Sierra (2015) Depending on the combination of correct and sure, the coach knowl-edge for each question is put into three different buckets: "Can’t do", "Can dowith effort" och "Can do effortlessly". By retaking the "Can’t do" questions withTry again, reflecting on the "Can do with effort" questions (for example: correctbut unsure), and waiting to test the "Can do effortlessly" questions until the certi-fication, all questions are eventually put into "Can do effortlessly".
The coach can choose to leave the training without doing the certification quiz,later repeating the test. This is to make the learning self-directed and just-in-time,and to allow the coach to do it’s own scaffolding. If the coach uses the app beforea youth session, and has a low result, the coach will get feedback as such (forexample: "Nice effort, but you still need to practice and prepare yourself evenmore! How can you do that?"). The goal is to allow the coach to move knowledgefrom "Can’t do" to "Can do effortlessly" to "Certified" in a pace that suits thecoach. This might be necessary, instead of a one-fits-all solution, as the coaches’preferences are so different.
The learning goes faster in iteration 4 than in iteration 3, which is most no-tably shown by the fact that the speed from try 1 into getting 100% in 1 try hasincreased. This is largely because usability issues had been addressed, and be-cause design choices has been made that stimulates and makes learning more

108 6 Discussion
efficient. Most notably, the score board has been improved to show which ques-tions the coach is correct and sure of ("Can do effortlessly"), unsure but correct on("Can do with effort"), and were wrong on ("Can’t do"). One mistake made, wasnot to think about reducing cognitive load (Sweller and Kalyuga, 2011) until iter-ation 4, when usability issues were identified as serious problems in iteration 3.For the next iteration, the intrinsic load was lower due to more helpful feedback,the extraneous load was decreased by making the expected behaviour in the appmore obvious (like "Try again" after having finished a quiz with errors). Finally,germane load was increased by the feedback of "getting certified" being related togetting ready for having a youth session, which was more relatable to the coachthan only receiving a score and a medal (Sierra, 2015).
The YoungDrive app is the first known application which uses a confidencemetric (in this case "Are you sure?") for the student’s own sake, and not onlyassessment, like in the case study detailed by Nicol (2007). The effect is reachingmeta-cognitive on Bloom’s.
6.4.1 Benefits with Confidence Level and Correctness in
Combination
If a coach is wrong and sure about a lot of questions, it might be the indicationthat the coach is teaching the wrong information to the youth, which might po-tentially hurt hundreds of their youth’s businesses. If the coach is correct but notconfident, it could be considered a guess, which is strengthened by the interviewsin iteration 4, see section 5.5.2.1. In Sierra’s framework of building expertise, itwould be called "Can do with effort". In the app during iteration 3, dampenedfor iteration 4, there were troubles when coaches passing the training with toomany correct guesses, knowledge that was not yet "Can do effortlessly". Thismeant that they would fail the Certification, because they could not answer re-liably, providing the wrong alternative. This in turn meant, that they were putback into training instead of getting a medal, which was not motivating. The con-clusion was that the coach should not start the Certification mode before beingtruly ready.
One solution could have been that "Improve" would not only include repeat-ing wrong answers, but also answers where the coach had been correct but said"No" on "Are you sure?". However, coaches seldom believed they would be wrong,or at least did not determine it worthwhile to be honest. Some preventative mea-sures were taken to try to make the coach more honest. Unfortunately, for itera-tion 3, only some coaches took notice of number of tries as an indication that theyshould pay more attention. For iteration 4, the design had improved by givingcoaches minus points for being sure and wrong, but here as well, not everyonepaid attention. This goes in-line with research both from deliberate practice be-ing a desirable difficulty (learning being hard might make the coach more likelyto want to "cheat", or take an easier route like guessing instead of putting moreeffort).
The bigger problem was that the knowledge was not yet reliant, not thatcoaches were not honest. The solution for iteration 4 was to improve learning

6.4 How Does Design Affect Usability and Learning Done via the App? 109
in the app, partly by a more personal score board with feedback, which couldshow the coach which kind of questions she needed to repeat ("Can’t do" or "Cando with effort"), but instead of forcing the coach to redo correct guesses ("Can dowith effort"), she could reinforce the correct answers by personal feedback. Sierra(2015) calls this "high payoff tips", which can be very effective.
6.4.2 Deciding on Learning Methods
There was a lot of work behind choosing the learning design methods in Iteration#3. The way to progress was to brainstorm various solution, discuss them withexperts, and then create trigger material and test some of these approaches.
Retaking questions that were wrong ("Try again", called "Improve" in iteration3) was inspired by deliberate practice Sierra (2015), and is already common in e-learning driver license software to learn traffic signs or how to act in varioussituations.
Showing the coach how many quiz tries they have done, was inspired byLinköping University’s work with the e-learning tool NTA Digital, where theyreward students with badges for getting 100% in few tries. Their goal with thiskind of "gamification", is to reward students for studying before taking the test.Similarly, for the training mode, the coach seeing number of tries was a methodof studying the correct answers more thoroughly. For the certification, where thecoach was supposed to have trained before taking the test, badges worked withthe same purpose as NTA Digital, to reward students that had studied properly.
"Are you sure?" was inspired by a Swedish teacher, and has been used be-fore by others (Nicol, 2007). It has then been used to determine if a right an-swer should award a point or not. Nicol (2007) and the digital pedagogy advisorfor this thesis, Henrik Marklund, suggested that the teacher had overlooked alearning benefit of this approach: the student reflecting on their own knowledge,which is proved great for learning. This was extended in this thesis where per-sonalised feedback has the goal of the coach getting both confident and correct.In a school situation, this might not be necessary, but in the YoungDrive context,the purpose of the app was to build both correctness and confidence with the ma-terial. To pass the certification after training, getting 100% without faults, madethe coach feel that confidence, at the same time reassuring the teacher that thecoach had learned the material.
After iteration 4 a bonus test was made with Plan Tororo staff, which showedthe relevancy of the certification mode: one group that were 100% correct onthe first try, did get 100% correct on their second try, meaning guesses had beenpresent. On the other hand, a person having 1 wrong answer, passing the train-ing on the second try, did then pass the certification on the first try, with confi-dence. It can therefore be determined, that when all of the answers are answeredcorrectly, after having gotten all answers correct once, that the coach has bothcorrect information and confident - this is a good example of deliberate practice:the information has gotten reliable.
Other learning design methods were considered, as previously discussed. In alow-fidelity prototype in iteration 3 it was assessed how multiple-choice answers

110 6 Discussion
compared with using flashcards in a think-aloud test, see section 4.4.5. Chal-lenges including flashcards in the high-fidelity prototype were that the coacheshad no previous knowledge of typing on a keyboard, and analysing recordedanswers would be too technically demanding. The integration and benefits offlashcards was however discussed in various ways, see chapter 8 Future work.
6.4.3 Summary
The app does help the coaches to assess their knowledge level and what areasthey need to train on. As of now, the app can not be said to evaluate how goodthe coaches are with teaching. It sure would be valuable for coaches to track theirability to get better and remember, see chapter 8 Future Work).
There are tendencies that the app works better for some coaches, especiallythose who take time to reflect on the feedback given by the app. This speaksfor designing the app for different need groups. However, all coaches says inthe evaluation that they like the final version of the app, which is important. Ifthe motivation and confidence are high, it could indicate them becoming betterteachers, but as of now there are no evidence of this more than that the coachesthemselves have identified that confidence is important for having a good youthlecture.
The teacher has appreciated how the app allows her to assess the level ofknowledge of the coaches on a day to day basis during the training, giving in-sight into how well their teaching has been received. The teacher can use thisdata to understand what they need to repeat the following day, or if adaptingtheir teaching will lead to higher results. Allowing the teacher to analyse theirtest questions according to Bloom’s Revised Taxonomy created awareness of whatknowledge level the teacher’s questions were assessing the coaches with, and mo-tivated matching the formulation of a question to the knowledge and cognitiveprocess dimension suitable for the educational objective.
6.5 How Can Users’ Feedback be Used to Inform
Modifications of the App?
The number one time waster, has been spending time building ideas that is not in-formed by the users’ feedback, and not immediately realizing the mistake. Suchideas will not be used, are often not supported by research, or does not fit thecontext. This is the same finding that Stickdorn and Schneider (2010) has made,and is a violation from the service design principle of making the process user-centered. Luckily, almost all of the work with the master thesis has indeed beenuser-centered.
Getting enough feedback to evaluate each component of the app has beenimportant. Enough feedback, means that modifications to the app can be madewith confidence. The faster this can happen, the faster the app gets better. This iswhy the field hackathon, and service mini-sprints, were so beneficial, see 2.7. It
6.5 How Can Users’ Feedback be Used to Inform Modifications of the App? 111
ensured that fast iterations could happen with enough feedback to provide effec-tive modifications and additions. The use of service mini-sprints was so effectivethat the interactions in Tororo could be expanded with even more days, as longas this is properly planned for.
As long as the users understand the purpose of the app, and how it shouldbenefit them, they can be part of the creation process, not only the testing. Thisis an extraordinary opportunity, that should not be underestimated, as shownin case studies in Stickdorn and Schneider (2010), although these projects didnot have a digital focus. It is found that deeply involving the users and gettingto know them is essential to understand the true needs of the coaches, and cangreatly inform modifications of the app.
The app evaluation shows that not only should users’ feedback informmodifi-cations of the app, they should be the basis of the app. To do this, this report hasprovided but one approach, via Digital Service Design. It is also a service designprinciple, making the process co-creative Stickdorn and Schneider (2010).
The presence of different perspectives (from users, stakeholders, experts, andthe designers care for the vision) lead to a holistic view when designing, in linewith Stickdorn and Schneider (2010). The designer can balance these, as long asthe views are present during the whole development process, and not only in theend of the project. For the questionnaire made for iteration 1, stakeholder viewswere very important. From their views, the questions could be improved and putinto context, and lessons were learnedwhich otherwise would not have happened.In iteration 1 it was felt that maybe too much time was spent with stakeholders,almost to the point where the process where no longer user-centered.
By asking Why-why-why continually, the true needs of the coaches could begradually exposed. Similarly, by hosting co-creation workshops, the coaches canbe part of designing lo-fi app prototypes that address these needs. The role of thedesigner then, becomes putting these ideas into a context, and comparing withbest practices and relevant research (in this case, most notably learning design),modifying, developing, and testing. As Löwgren and Stolterman (2007) says, theoutput will not be better than the designer carrying out the process. To embracethe role of a socio-technical expert, more so than the computer expert or politi-cal agent, has been one of the enablers for co-creation. Service design thinkingand methods, gave a framework to have all of these perspectives in balance andconsideration, always with the end user as the most important person.


7Conclusions
In response to the research questions, the master thesis has:
1. Contributed to the domain of entrepreneurship education in a developingcountry context
2. Demonstrated how certain technical constraints and design constraints canbe overcome in a developing world context
3. Provided methods of investigating usability and learnings with a digitaltraining tool in the real-world entrepreneurship training context
4. Created newmethods in service design, when co-designing digital artefactsin a developing country context
Below, these four items are explained in greater detail, tying the report to aclose before suggesting future work in the final chapter.
7.1 Contribution to the Domain of Entrepreneurship
Education in a Developing Country Context
This research shows that an app can be effectively used during and after train-ing to assess and learn entrepreneurship. Furthermore, the app can also pre-pare coaches before youth sessions, training them both in entrepreneurship andpreparing their lessons.
In addition, this has been done in a developing country context, with coacheshaving no prior smartphone experience. The app is used for coaches in conjunc-tion with a physical entrepreneurship training today, and does not yet addressthe youth themselves, or replaces the physical training.
113

114 7 Conclusions
However, the research shows that both the teacher and the coaches greatly ap-preciates the support the app has given them. As entrepreneurship to its natureis practical in many aspects, one finding is how multiple-choice questions canincreasingly simulate real situations by metacognitive feedback, using design so-lutions such as asking "Are you sure?", giving personal feedback, and formulatingquestions as scenarios.
7.2 Demonstration of how Certain Technical
Constraints and Design Constraints can be
Overcome in a Developing World Context
In this project, it was decided to design the app together with first-time smart-phone users. Co-designing the app with the coaches and learning their perspec-tive on overcoming the technical constraints was a valuable methodology.
Apps developed specifically for rural areas has previously been built that hasovercome rural areas’ challenges with access to smartphones, internet and elec-tricity. This learning app is designed to consume low battery and internet bynot being media-rich but on relying on text. It is also internet-aware by storingapp data locally until internet is turned on. Until every coach is equipped with asmartphone, the app has been deliberately designed to work as a compliment tothe physical coach training. After the training, it is not mandatory for a coach touse the app to help prepare for a session, even if it would improve youth sessionquality.
The workshops show that coaches are willing and able to pay for devices bymicro-loan or utilizing the savings group, if granted access. Today, they haveno such means by YoungDrive or the project partner. YoungDrive can cope withusing the donated devices during the coach training, but needs to determine astrategy to enable smartphone access to the coaches. A conclusion is how in manycases creative design can overcome technical constraints, but not always.
7.3 Provided Methods of Investigating Usability and
Learnings with a Digital Training Tool in the
Real-World Entrepreneurship Training Context
To investigate usability, observations using think-aloud in the real-world entrepreneur-ship training context proved the most effective. In big groups, data could givetendencies on common problems that needed to be addressed. In smaller groups,ideas and precise feedback were more common. It helped to have a framework tocompare usability against, in this case the interaction design principles of desir-ability, utility, usability and pleasurability (Clatworthy, 2010).
To investigate learning in the real-world entrepreneurship training context,literature research and data analysis of quiz results was highly beneficial, but

7.4 Created New Methods in Service Design, when Co-Designing Digital Artefacts in aDeveloping Country Context 115
mostly when put into the context of the observations made in the real-world en-trepreneurship training context.
Surprisingly often, comparing research and expert opinions with what coachesthought was best for learning, was in unison. When this happens, the self-confidenceof the designer can increase, and the designer can be more daring and experimen-tal.
Having much testing and co-creation was a very rewarding approach, as is dis-cussed in section 6.5. To make it truly testable, lo-fi and hi-fi prototypes shouldbe used instead of hypothetical questions. While research before starting to de-velop is a great start, it was trying different solutions, all based on user advice,expert opinion and research, that gave great results.
7.4 Created New Methods in Service Design, when
Co-Designing Digital Artefacts in a Developing
Country Context
Short iterations is a challenge, especially when time is sparse and the culture isdifferent than one’s own. Often in projects, testing is overlooked. In this projectinstead, service design helped to look at the users as not only testers, but as co-creators. This is not new in itself, but the creation of Digital Service Design, andmethods within this discipline, were new. Examples include service mini-sprintsand field hackathons.
Interactions with the coaches always included Service Mini-Sprints (see 2.7.5),allowing the most important feedback and insights to be addressed in the appand workshop formats already the next day. This allowed for very effective useof the sparse interactions with the coaches, and there was no need to wait for thenext iteration to test the coaches’ feedback.
The "field hackathon", in which the app was refined and tested each day of thecoach training, was the most rewarding research and development opportunityof the whole master thesis. More than the opportunity to develop the app withthe coaches, it had the extra benefit of giving the opportunity to observe theYoungDrive training and understand the coaches.
To use a service design approach when co-creating digital artefacts in a devel-oping country context proved highly effective, and it is recommended that thisarea is further studied. It does demand bravery of the designer to get to knowthe users well (Löwgren and Stolterman, 2007), and design for their needs anddare to question the client as Stickdorn and Schneider (2010) encourages. In theend, as this project and Stickdorn and Schneider (2010) suggests, including boththe users and the client will often make them more satisfied with the result, feel-ing both increased ownership and that the product feels and indeed has beendesigned from their needs.


8Future Work
The future work section is divided by research question, and proposes additionsthat would strengthen the app goals (see section 1.1).
8.1 How is the Development Affected by the
Technical Possibilities?
Some of the wished development were too complex to be implemented duringthe master thesis. Below, it is described what future work is wished in the area.
8.1.1 Data Analysis Improvements
Today, data analysis of quiz results takes a tremendous amount of time, and newresults are thus not instantly accessible to the stakeholders. The data needs to beacquired into Google Sheets, and then needs to be enhanced in several ways to befilterable and visualized, see section 4.5. The raw data when inserted into GoogleSheets can be seen in figure 8.1.
A lot of future development time should be spent so that most of this workis made automatically. Some of this work, is related to the way that the data issaved. Today, whether the coach was correct or incorrect on a question, and howmany coaches answered that question incorrectly after the first try, needs to bedone by process of elimination, because the data is not properly structured in thedatabase.
There were also a small number of errors with quiz submissions in iteration4. Most notably, certification tests for coach quiz 9 were not submitted, which iswhy the paper submissions proved very valuable as a backup. To discover moreerrors regarding offline-online functionality, is important, as it is cumbersomeand time-costly to test these manually. A good way to discover such errors, would
117

118 8 Future Work
Figure 8.1: The raw data of the quiz results when inserted into GoogleSheets. The purpose of the image is to explain howmuch work that is neededin order to process the data into insights.
be automatic tests (or regression tests), so that the app can be used by the coacheswith confidence, without extra personnel present, checking that the app works.
8.1.2 Code Quality
Since the app will be continually used and developed by others in the future,code quality is important. React.js makes it easy to structure the code in a waythat gives a new developer a good overview of the different components, and itsfunctionality. Even so, refactoring the code into smaller components would be agood idea.
To increase speed of the app, refactoring the code to ensure that loading ofassets happen more effectively (especially quiz questions), and also that data iscached in a logical way (saving necessary information so that it does not needto load the same information again, and vice versa), would be helpful. As theYoungDrive program grows and more people will use the app, there will be alower tolerance for the app being slow. The app, especially on native, takes along time to load, mostly because of asset loading.
8.1.3 Availability in More Countries
During the Zambia tests, the coaches were given a Zambia version of the app,and in Uganda, they were given a Uganda version. In the future, it would beadvisable if the coach ID used for login would affect if the Zambia version or theUganda version should be shown.
As long as the users of the app, such as the coaches in Uganda and Zambia,does have sufficient English skills, it is acceptable that the app is solely in one lan-guage. As more countries are introduced, the app should be available in differentlanguages.

8.1 How is the Development Affected by the Technical Possibilities? 119
A challenge today is that the Zambia uses a newer manual, and e.g. thenational currency is different than Uganda’s. That Zambia has updated manu-als, means that some questions are new, some are removed, and some are re-formulated. But the teacher still wants to be able to compare quiz results be-tween the different countries. Today, the quizzes were simply replaced betweenversions. This has the advantage of being easy to implement, but the clear disad-vantage that the teacher can not compare quiz results between countries.
A good solution to internationalization of quizzes would be that each questionin the database should include an unique ID, with different texts depending oncountry and coach manual. This would allow the teacher to keep track of somecoaches have difficulties with a question, regardless of location.
8.1.4 Availability on All Android Devices
Since the introduction of Meteor 1.3, older Android devices are no longer sup-ported. For the YoungDrive coaches, this is an issue, as most often devices useolder Android operating systems, and does not have great performance. Today,a Meteor 1.2 version of the app is available on the AppStore. Also, the newestversion is available on the web. However, in the future research should be putinto if the app should abandon Meteor 1.3 altogether, or if there is another wayto ensure backwards capability.
8.1.5 Availability on Feature Phones
As far from all coaches does not currently possess smartphones, few coaches willcurrently be able to use the developed app for preparing their youth sessions.Therefore, what was discovered in iteration 1, that all coaches possess featurephones, could guide the development of a SMS-based service. While this wasnot viable for the scope of the master thesis, research has been made into relatedwork. A recommendation is to try VOTO Mobile (Mobile, 2012), which supportsmultiple-choice questions and internationalization. Today, this solution has beenused mostly for doing evaluations in rural areas, via automatic phone calls wherethe caller can be given responses in text. However, research on using such asolution for educational purposes seems promising.
8.1.6 Reaching Statistical Significance
There are multiple examples how data analysis on a larger data sample could ben-efit. More than YoungDrive being able to take more informed choices regardingthe future development of the app, it would strengthen answering the researchquestions. One such example is "Is the coach learning?". With enough data, itwould be interesting to analyse the impact of feedback on getting the correct an-swer the next time. For example, you could compare if getting feedback on beingwrong and unsure leads to better results than getting feedback on being wrongand unsure.

120 8 Future Work
8.2 How is the Design Affected by the Contextual
Constraints?
There weremany things to consider when designing for the contextual constraints.Below, aspects that should be taken into consideration are presented.
8.2.1 Replacing the Teacher
In iteration 2, Josefina (the teacher) mentions that she does not want to be re-placed by the app. However, there would be many benefits to YoungDrive ifthe coach training could happen 100% digitally. When the app was tested withrefugee innovators in iteration 2, several of them asked if it was possible for themto use the app exclusively to train themselves in entrepreneurship or starting aYoungDrive group.
How could it be done in practice? Also, when the teacher does not want to bereplaced? In practice, a freemium model could be proposed, where it is possibleto take the coach training for free digitally, but pay for a physical training. Cur-rently, this contextual constraint has affected the app in the way that it shouldcomplement the physical training, and ease the burden for the teacher.
8.2.2 Scaffolding the Coach Guides
Josefina says after iteration 2 that it is indeed valuable if the training prepares theyouth more actively for holding youth sessions, an insight that was discovered initeration 1. She mentions two challenges with introducing coach guides for eachtopic. In the end, a solution is suggested:
• The coaches are not ready the first day, as they have not gotten used to theapp yet. As such, they should be introduced in the middle of the training.
• A recurring issue is that the Friday, the last day of training, should be ded-icated to preparing a session, but the time has never been there. If so, thecoach guides will not be used. One idea could be to make the topic quizzessmaller, and mix topic questions with coach guide questions.
8.2.3 More Time Designing the App for Different Need Groups
Already since iteration 1, different need groups have been identified. It is shownfrom the tests that the idealistic and realistic coach might be more probable tohave a growth mindset, where challenged coaches might have a more fixed mind-set. Continuing to use growth mindset feedback in the app is crucial accordingto Dweck (2014), who found her method made lower and medium achievers alsoplayed until the end, while the lack of such feedback only kept high achievers.
Also, there are tendencies that different need groups are more present in dif-ferent countries. While a lot of research was done about the cultural dimensionsof Uganda, the research done on the Zambia and local Kabwe population wasmore sparse. It was known that the socio-economic differences were large, but

8.3 How can Test Questions be Developed to Support Entrepreneurship Learning? 121
not much more. For future work, it is recommended to put more work into howthe local and national culture in a country affects the mentality of the coachesand the design. It is not possible to assume that the Zambia and Uganda cul-ture should be similar, and it will be similar to other developing countries, orelsewhere.
Since doing app development together with the coaches has been so beneficialto discovering different needs, a wish is to have done more so with the coaches inTororo. While in Zambia, the development was done in the real-world training,which was superb. In Uganda, more of the trigger material could have been cre-ated in Tororo instead of Kampala. Even if it would have been more costly andinternet is slower, it would have been valuable being closer to the coaches.
8.2.4 Training the Coaches with Using a Smartphone
An additional insight from the smartphone test in iteration 1 was that using asmartphone operation system like iOS or Android needs to be made as easy aspossible. This to avoid confusion with things like not finding the YoungDriveicon, or accidentally hitting a button, or click the power button: all of whichrelates to ease of using the operating system, and not to the app in itself. A lot oftraining is needed to avoid errors, and should be taken into consideration from aservice design standpoint.
In iteration 3, such a co-creation workshop was held after the app test. Thisresulted in that for iteration 4, all of the devices had the YoungDrive icon onthe home screen of the device, and was the only noticeable app. This loweredconfusion a lot with finding the app, and realising where to click. If a coach byaccident clicked the home button, they immediately found their way back.
In the future, for new coaches, training how to use a smartphone is needed,before they are handed the device. While the YoungDrive is now simple to useto maybe not need an introduction, it would still help how to act in the app (forexample encouraging to be honest with answering "Are you sure?").
8.3 How can Test Questions be Developed to Support
Entrepreneurship Learning?
A lot has been learned about formulating and designing multiple-choice quizzesin a digital format. Below, suggestions for improvements are presented.
8.3.1 Designing for honesty with "Are you sure?"
One idea during the ideation of iteration 3, was to give the student two scores:one showing how correct they were, and one with how confident they were. Youcan be correct, but still not be empowered (you are unsure but correct). Similarly,you can be incorrect but confident (not empowered).
The reason for not having an "empowerment bar" (combining correct and sure,giving a summative score), was given by Josefina from YoungDrive: "The coaches
122 8 Future Work
might want to game the system to get a better score, or be confused by how theygot their score". For this reason, the coaches have stated they accept gettingminuspoints if the are sure but incorrect, which is easily understood by them and feelsfair.
In the app now, there is still a struggle with coaches answering positively on"Are you sure?", even if they are not. Reasons are among others that they say theyare partly sure, and sometimes that they think they will be more punished for notbeing sure than being sure and incorrect. As this is not the view of the teacher,this needs to become much more clear in the app. One idea is to ask "How sureare you?", but keep the binary scale of only two answers. This would mean, thatthe coach needs to think about how sure she is about the answer, instead of if sheis sure, which could have metacognitive benefits.
8.3.2 Self-Reflection After a Youth Session
When discussing the goals for iteration 3, Josefina talks about a need she hasnoticed during the coaches’ roll-out in Zambia, where the app could help: doingself-reflection after a youth session. She says that this is at least as importantas the coach training, especially in cases where Josefina or other project leadersdon’t have the resources to visit the coaches physically.
It is determined that while physical follow-up meetings are essential, theapp can be used to help the coach doing a structured self-assessment and self-reflection exercise. When meeting with the teacher, this data could guide thecoach-teacher discussion, the teacher focusing on discussing the most interestingdata. This does not need to be a new app. Questions can be asked in a way thatthey are indeed meta-cognitive, encouraging learning by reflection.
Josefina mentions that when she is there to give feedback, it is very clear tothe coach that he or she lacks knowledge and has not prepared enough. An appwith self-evaluation and monitoring, would help keep the coach thoughtful andgive the coach important insights. They are described to sometimes over-estimatetheir own knowledge.
8.3.3 Avoiding Memorization of Answers
To avoid memorization, the alternatives should be randomized in the future.While it is unlikely that a coach has an easier time remembering the correct an-swer by order instead of content, since they only repeat the wrong answers untilthe certification test, it is an extra measure.
8.3.4 Improving the Questions
Data analysis of results on specific questions could give a lot of insight, both intocoach behaviour, and misunderstandings of questions, in the future. Here, a lotof data is already collected to be able to guide conclusions. Not only are questionsrecorded with correct and if answered confidently, but also number of tries percoach, and if it is a training quiz or certification quiz.

8.4 How does Design Affect Usability and Learning Done via the App? 123
Simple analysis could for example mean seeing what are the most difficultquestions, where most people have answered wrong repeatedly. From the inter-views in iteration 4, it is explained that some answers might be answered wrongbecause of for example difficult wording of questions, not necessarily because oflack of knowledge. To avoid this, data analysis could be effective, together withgetting input from the teacher and coaches.
Improving the questions today has mostly been made from direct feedbackfrom the coaches, or comparing quiz question formulation with current and de-sired level on Bloom’s revised taxonomy. Regarding mapping educational ob-jectives, it needs to be made sure that there are questions for each educationalobjective of the topic, which has not been done today. In Yengin and Uzanboylu(2012) questions were designed to support gradual knowledge building with analignment to Bloom’s Taxonomy, which could also be a viable alternative for thisapp, where questions are currently formulated as information appears in the par-ticipant and coach manual respectively.
8.4 How does Design Affect Usability and Learning
Done via the App?
There is a clear connection between design and usability and learning. Here,future work for how design would improve usability or learning is presented.
8.4.1 Assessing Coach Guide Knowledge Before the Youth
Session
When asked about the Zambia coach rollout, Josefina points out several chal-lenges. "It feels like some of the coaches forget using the coach guide, even ifit has been improved and better integrated with the participant manual. Someof them, don’t even use the coach guide." This speaks for that the app should in-clude quizzes for all coach guides as well. When asked if the coach guide quiz aremore important than the topic quizzes, she answers that the correct knowledgeis more important, because that is the one that needs to be explained correctly tothe youth. Therefore, it should be moved into Future work.
8.4.2 Using a Flashcards Approach
In the ideation for iteration 2, flashcards are discussed again, with Henrik Mark-lund. In iteration 3, this was tested as a lo-fi material with successful results, butmore work should be done.
In the ideation of iteration 4, a proposal was given that did not have time toimplement. Therefore, the idea is described here: At the coach’s second quiz try(having assessed and reflected on the knowledge), flashcards could be introducedto assist the coach in retrieving from memory, before getting the multiple-choice.For future work, when in Training after the first quiz try, The question should beshown before the answers are shown, and prompt the coach to think aloud about

124 8 Future Work
what they think the answer is, before receiving the alternatives. The coach mightbe hindered from progressing to the multiple-choice answers until the app hasunderstood the coach has thought hard about their answer to the question.
This is a good use of scaffolding, slowly introducing complicated app features.The hypothesis is inspired from Bjork (2016), that knowledge is strengthened ifthe coach retrieves from memory, versus looking up the answer or choosing themost likely answer.
8.4.3 Adding more media channels to more closely simulate the
learning environment
To simulate the entrepreneur coach environment more accurately could possiblyincrease memorization of procedural learning objectives. Research exists thatsupports how using multiple channels like audio, video, voice could be benefi-cial, or to use interactive simulations. The advantage of multiple-choice from adeveloper perspective is that data can be collected easily and because of ease ofimplementation. From YoungDrive’s perspective, it serves the target group of thecoaches being first-time smartphone users well (Björling and Lönn, 2016).
8.4.4 Improvements to the Certification Mode
Following the advice from Sierra (2015) of quickly giving the user a feeling of asuperpower, this should be becoming a Certified coach in the future. From theend results of iteration 4, we can learn that notably the intrinsic motivation ishigh, deliberate practice is present, and the coach can feel the intrinsic rewardof having pushed herself and learned the material when certified. This is verypositive.
This reaction, could and should be even more amplified when certified. Itis discussable if this should be done by simple gamification, but an opinion bya coach was that medals earned should be more visible and that sounds couldstrengthen the feeling of achievement. Also, the quiz list could show these results,increasing motivation to take other quizzes that you have not yet mastered, or tobetter your score in a topic where you had not become certified.
8.4.5 Improvements training Correct Structure and Time
Management
During all app tests (iteration 2-4), it has been shown that since Correct Structureand TimeManagement are both ordinal, the Training mode for such topics wouldbe more suitable as interactive exercises than multiple-choice. The proposal is tofirst use drag-and-drop to place each activity of a youth session in the correctorder, and then selecting the right time for the each activity. This assists thecoach in creating a mental model, which can be used to retrieve from memoryduring the assessment.

8.4 How does Design Affect Usability and Learning Done via the App? 125
8.4.6 Scaffolding with Flashcards
After the coach’s first new try, Flashcards could be introduced to assist the coachin retrieving in memory, before getting the multiple-choice. To do this afterthe first assessment, is partly because of technology scaffolding (introduce newconcepts in steps), partly because the knowledge is strengthened if the coach re-trieves from memory versus looking up the answer or choosing the most likelyanswer (Bjork, 2016).
8.4.7 Memory Design
For the ideation of iteration 4, it was pointed out by pedagogical expert HenrikMarklund that if knowledge is to be memorized, memory techniques could beused. One such e-learning tool is Muth (2016). The tool has interactive learn-ing modes, aiming to learn facts and terms with speed. This was not prioritizedbecause of time constraints working with technical features that were not essen-tial. Also, the idea was never proposed by users, only by experts. Moreover, theteacher opposed the idea of remembering answers that were not in the factualremember category. To do so, would oppose the learning objectives, which scorehigher on Bloom’s revised taxonomy. However, to study how the coaches can re-member better via an app, and learn memory techniques via the app, could be afuture work which is advisable.
8.4.8 Sharing with One Another
In future versions of the app, mechanics of sharing content and co-creation wouldadd value connected to Bloom’s, reaching Create and Apply. Adding these gameelements goes in line with Clark’s research, which showed a positive correla-tion with learning and games that required multi-player collaboration (Clark andKillingsworth, 2014).
8.4.9 Including the Paper Manuals in the App
Already in iteration 2, it was proposed by coaches if the participant manual andcoach guide could be included in the app, instead of as paper. The teacher agreedin principle, especially as the paper coach guide is often overlooked (reading thedigital version could be designed to be made mandatory before unlocking otherfeatures), but also saw several challenges. Because of broadband limitations themanuals would take a lot of space to download. Also, the manuals are designedin A4 format, while a smartphone screen or even tablet is much smaller, makingit cumbersome to read the whole manuals in the same way you would with thepaper versions.
However, for the ideation of iteration 3, it was realized that if the manualscould be converted into smaller chunks, there is an opportunity for bite-sizedspaced learning, instead of massed learning. How to split the manuals into thesesmall parts? Well, by extracting the important parts for understanding an answerto a specific question, see figure 8.2. The teacher emphasised that this would take

126 8 Future Work
time for her to do, but that the effort would be worth it. While there was no timefor including the whole manuals, there was an idea the teacher thought accept-able for iteration 4: including on which page the coach would find the answer toa specific question. This was not one of the most prioritized features of iteration4, which it was never done, but for further work, this should be investigated.
Figure 8.2: By clicking on an arrow next to the question showing the correctanswer compared to your answer, the coach could read an extract from theYoungDrive manuals, which includes the right answer. The learning benefitcompared to just observing the right answer, is that the coach gets the an-swer in context, which improves memorization and understanding. An ideawould be to no longer give the coach the correct answer in the score board,but to instead let the coach choose the right answer after reading the text.
Amajor opportunity doing this would be to replace the paper manuals. Today,the manuals are the most expensive post of YoungDrive, which is why this wouldbe attractive. While a smartphone or tablet could be returned after a YoungDriveprogram has ended, this is not possible with the paper versions, so there mightbe a monetary incentive to do so. A problem that would need to be addressed isthat the manuals also have written exercises in them. These exercises could bemade interactive in the app, which would also allow for smart features such asautomatic assessment, financial literacy simulations, etcetera. While this was nota scope of themaster thesis, it is interesting further work to test if such interactiveexercises and simulations would be effective in the developing country context oflearning and teaching entrepreneurship.
8.5 How can Users’ Feedback be Used to Inform
Modifications of the App?
The users themselves has been essential in creating a valuable app. Users includecoaches, but also the teachers and stakeholders. Below, one of these aspects ispresented together with future work to answer the research question.
8.5 How can Users’ Feedback be Used to Inform Modifications of the App? 127
8.5.1 Educator Dashboard
Josefina has no means of accessing live quiz results today, as there is no educatordashboard developed. Instead, quiz results today needs to be transferred from adatabase into Google Sheets, which is cumbersome and not user-friendly.
There was not enough time to develop an educator dashboard, even if thishad been a goal. Instead, low-fi trigger material was created, and co-creationstakeholder workshops were held, both for iteration 3 and 4.
In the future, this will be a must-have, and it ties well into YoungDrive’s fu-ture wish of strengthening its quality assurance via monitoring and evaluation.Exactly how powerful the educator dashboard should be, might turn into a ethi-cal discussion. One could argue that measures need to be taken so that the appfocus is to keep supporting the coaches to become better, and not to punish thosecoaches that doesn’t have the same quiz results as others. As the combination of"Are you sure?" and correctness can give insight into the attitudes and care of thecoaches, carefulness must be taken.
From an empowerment perspective, the Educator Dashboard can guide boththe teacher in her teaching, allow her to have better coach feedback sessions, anddo future improvements of the YoungDrive program.
8.5.2 To Answer the Research Question More Elegantly
Working with user feedback to inform modifications of the app should be as cen-tral as has been during the master thesis. To further answer the research question,new situations and methodology could be tested. The new methodology DigitalService Design has been a success, and could be shared with other organizationsthan YoungDrive, especially (but not exclusively to) when working with technol-ogy in other developing countries.
Future work should also include looking at research suggesting how to workwith balancing user feedback, stakeholder opinions and research. Such findingswould be especially relevant when prioritizing and working the the backlog anddoing sprint planning.
When it comes to user feedback, it comes in various ways: both qualitativedata like interviews, and quantitative data such as quiz results, could be seenas a form of feedback. This is evident by the large number of methods used inthe master thesis, see section 4.5 Data Analysis Framework. As such, it wouldbe interesting to measure how the app is used after this finished master thesis,and if the usage of the app suggests what additional work needs to be done. Themain output of the app should be better-performing coaches, and as long as thecoaches are part of and feel ownership of the product development, the app willcontinue to give great results for the youth sessions.

Bibliography
AAU, DRT, UNNGOF. Lost Opportunity? Gaps in Youth Policy and Programmingin Uganda. ActionAid International Uganda, 2012.
S. K. Abell and N. G. Lederman. Handbook of Research on Science Education.Psychology Press, 2007.
Agile Alliance. The agile manifesto. http://www.agilemanifesto.org/,2001.
Apache. Apache cordova. https://cordova.apache.org/, 2011.
Habanero Quiz Apps. Quizoid. https://play.google.com/store/apps/details?id=de.habanero.quizoid&hl=en, 2016.
Quian S. Miao C. Bae, T. J. and J. O. Fiet. The relationship between entrepreneur-ship education and entrepreneurial intentions: A meta-analytical review.Entrepreneurship Theory and Practice, 38(2), 2014.
Mushomi J. A. Nahalamba S. Byakagaba J. Magero S. Sheila Ariko J. O. Balyesiima,D. F. and R. Kaggwa. The State of Uganda Population Report 2012. TheRepublic of Uganda, 2012.
R. Bjork. Applying cognitive psychology to enhance educational practice. http://bjorklab.psych.ucla.edu/research.html, 2016.
I. Björling and J. Lönn. Exjobbs-resultat: Coach-tränings-app. YoungDrive, 2016.
Heer J. Ogievetsky V. Bostock, M. D3.js - data-driven documents. http://
ischool.zm/, 2014.
R. O. Brinkerhoff. Making l&d matter. https://www.youtube.com/watch?v=__wUZzJV8lM, 2013.
F. Brühlmann. Gamification from the perspective of self-determination theoryand flow. Master’s thesis, University of Basel, Switzerland, 2013.
K. Chang. Parallel coordinates toolkit : Parcoords.js. https://syntagmatic.github.io/parallel-coordinates/, 2012.
129
130 Bibliography
Bruno V. Cheong, C. and F. Cheong. Designing a mobile-app-based collaborativelearning system. Journal of Information Technology Education: Innovationsin Practice, 11, 2012.
Tanner-Smith E. Clark, D. and S. Killingsworth. Digital Games, Design andLearning: A Systematic Review and Meta-Analysis (Executive Summary).SRI International, 2014.
S. Clatworthy. Interaction design: services as a series of interactions. In M. Stick-dorn and J. Schneider, editors, This is Service Design Thinking: Basics, Tools,Cases, chapter 11, pages 80–87. Consortium Book Sales and Dist, 2010.
Drifty Co. Ionic framework. http://ionicframework.com/, 2016.
Hilera J. R. Burchino R. Jiménez L. Martínez J. J. Gutiérrez J. A. Gutiérrez J. M.de Marcos, L. and S. Otón. An experiment for improving students perfor-mance in secondary and tertiary education by means of m-learning auto-assessment. Computers and Education: An International Journal, 55(1069-1079), 2010.
E. L. Deci and R. M. Ryan. Intrinsic motivation and selfdetermination in humanbehavior. Plenum, 1985.
E. L. Deci and R. M. Ryan. Intrinsic and extrinsic motivations: Classical defini-tions and new directions. Contemporary Educational Psychology, 25(54-67),2000.
Solomon G. T. Dickson, P. H. and K. M. Weaver. Entrepreneurial selection andsuccess: Does education matter? Journal on Small Business and EnterpriseDevelopment, 15(239-258), 2008.
J. Dirksen. Design for How People Learn. New Riders, 2012.
Duolingo. Duolingo. https://play.google.com/store/apps/details?id=com.duolingo&hl=en, 2016.
C. Dweck. The power of believing that you can improve. https:
//www.ted.com/talks/carol_dweck_the_power_of_believing_
that_you_can_improve?language=en, 2014.
J. S. Eccles and A. Wigfield. Motivational beliefs, values, and goals. AnnualReview of Psychology, 53(109-132), 2002.
A. J. Elliot and M. V. Covington. Approach and avoidance motivation. Educa-tional Psychology Review, 13(2), 2001.
Instagram Facebook. React. https://facebook.github.io/react/, 2016.
Grameen Foundation. Ledger link. http://awards.ixda.org/entry/
2014/ledger-link/, 2014.

131
S. M. Fulmer and J. C. Frijters. A review of self-report and alternative approachesin the measurement of student motivation. Educational Psychology Review,21(219-246), 2009.
Inc. GitHub. Github. https://github.com/, 2008.
R. Heer. A model of learning objectives. http://www.celt.iastate.edu/wp-content/uploads/2015/09/RevisedBloomsHandout-1.pdf,2012.
Kolvereid L. Iakovleva, T. and U. Stehphan. Entrepreneurial intentions in devel-oping and developed countries. Education + Training, 53(5), 2011.
Meteor Development Group Inc. Meteor. https://www.meteor.com/, 2016.
iSchool. ischool zambia. http://ischool.zm/, 2014.
H. Kniberg. Scrum and XP from the Trenches - 2nd Edition. InfoHQ, 2005.
T. R. Koballa and S. M. Glynn. Attitudinal and motivational constructs in sciencelearning. Focal Press, 2007.
D. R. Krathwohl. A revision of bloom’s taxonomy: An overview. Theory IntoPractice, 41(4), 2002.
D. F. Kuratko. The emergence of entrepreneurship education: Development,trends, and challenges. Entrepreneurship theory and practice, 25(5), 2005.
Meister Labs. Mindmeister. https://www.mindmeister.com/, 2016.
H. Lopez. Parallel coordinates: Read out pat-terns. http://une-terre.blogspot.se/2012/09/
parallel-coordinates-read-out-patterns.html, 2016.
Bligh B. Manches A. Ainsworth S. Crook C. Luckin, R. and R. Noss. DecodingLearning: The Proof, Promise and Potential of Digital Education. Nesta Op-erating Company, 2012.
J. Lönn. Youngdrive zambia coach interviews. , 2015a.
J. Lönn. Youngdrive zambia coach interviews, 2015b.
J. Lönn. Youngdrive uganda: Statistik youth, cbts, projektledare - 2015, 2015c.
J. Lönn. YoungDrive Participant Business Booklet. YoungDrive, 2016.
J. Löwgren and E. Stolterman. Thoughtful Interaction Design: A Design Perspec-tive on Information Technology. The MIT Press, 2007.
Busenitz L. W. Bird B. Marie Gaglio C. McMullen J. S. Morse E. A. Mitchell, R. K.and J. B. Smith. The central question in entrepreneurial cognition research.Entrepreneurship Theory and Practice, 31(1), 2007.
132 Bibliography
VOTO Mobile. Voto mobile. https://www.votomobile.org/, 2012.
C. Muth. Memorize. http://memorize.com/, 2016.
D. Nicol. E-assessment by design: using multiple-choice tests to good effect. Jour-nal of Further and Higher Education, 31(1), 2007.
S. Nissar. Social innovation and entrepreneurship in uganda. whymobile services are growing fast in the area. http://bit.ly/
medium-article-expedition-mondial, 2016.
M. J. I. Oviawe. Repositioning nigerian youths for economic empowermentthrough entrepreneurship education. European Journal of Educational Stud-ies, 2(2), 2010.
D.H. Pink. Drive: The Surprising Truth about what Motivates Us. Canongate,2011. ISBN 9781847677693.
L. Pittaway and J. Cope. Entrepreneurship education a systematic review of theevidence. International Small Business Journal, 25(5), 2007.
T. Ropinski. Tnm067 - scientific visualization: Chapter 1: Basics, 2014.
E. Ruskovaara and T. Pihkala. Entrepreneurship education in schools: Empiricalevidence on the teacher’s role. The Journal of Educational Research, 108:3:236–249, 2015. doi: 10.1080/00220671.2013.878301.
Salesforce. Heroku. https://www.heroku.com/, 2007.
K. Sierra. Badass: Making Users Awesome. O’Reilly Media, 2015. ISBN9781491919071.
Bell B. S. Kraiger K. Sitzmann, T. and A. M. Kanar. A multilevel analysis ofthe effect of prompting self-regulation in technology-delivered instruction.CAHRS Working Paper Series, 8, 2008.
Gino F. Pisano G. P. Stefano, G. D. and B. R. Staats. Learning by thinking: Over-coming the bias for action through reflection. Harvard Business School Tech-nology and Operations Management Unit Research Paper Series, 14(093),2015.
M. Stickdorn and J. Schneider. This is Service Design Thinking: Basics, Tools,Cases. Consortium Book Sales and Dist, 2010. ISBN 9789063692568.
Ayres P. Sweller, J. and S. Kalyuga. Cognitive Load Theory. Springer-Verlag NewYork, 2011. ISBN 9781441981264.
Agaze Dev Team. Magic json. https://chrome.google.com/webstore/
detail/magic-json/cajifcebjiflndefndbnoeenjpiiiagm?hl=
en, 2016.

133
W. B. Walstad and M. L. Kourilsky. Entrepreneurial Attitudes and Knowledge ofBlack Youth. Kauffman Center for Entrepreneurial Leadership, 1998.
E. Widmark and S. Nissar. Service design - en crash course. Expedition Mondial,2016.
A. Wigfield and J. S. Eccles. Expectancy-value theory of achievement motivation.Contemporary Educational Psychology, 25(1), 2000.
Ince I. F. Karahoca A. Karahoca D. Yengin, I. and H. Uzanboylu. The use of delib-erates practices on a mobile learning environment. 1, (241-249), 2012.
YoungDrive. Youngdrive - website. http://youngdrive.org/, 2016.

Appendix


AAppendix A: Images of Developed
Application
In the following appendix, the graphics from the final app (iteration 4) is shownin detail according to the figure from section 5.1 Developed Application. Theflow is choosing a quiz (figure A.1), logging in (figure A.2), taking the quiz (figureA.3), getting feedback (figure A.4), redoing the quiz (figure A.5), being able to getcertified when 100% correct (figure A.6), testing if you can now be 100% correctin one try, and if passing, getting the certification (figure A.7).
Figure A.1: Choose quiz
137

138 A Appendix A: Images of Developed Application
Figure A.2: Login
Figure A.3: Self-assess

139
Figure A.4: Get feedback and try again
Figure A.5: Train until 100% correct
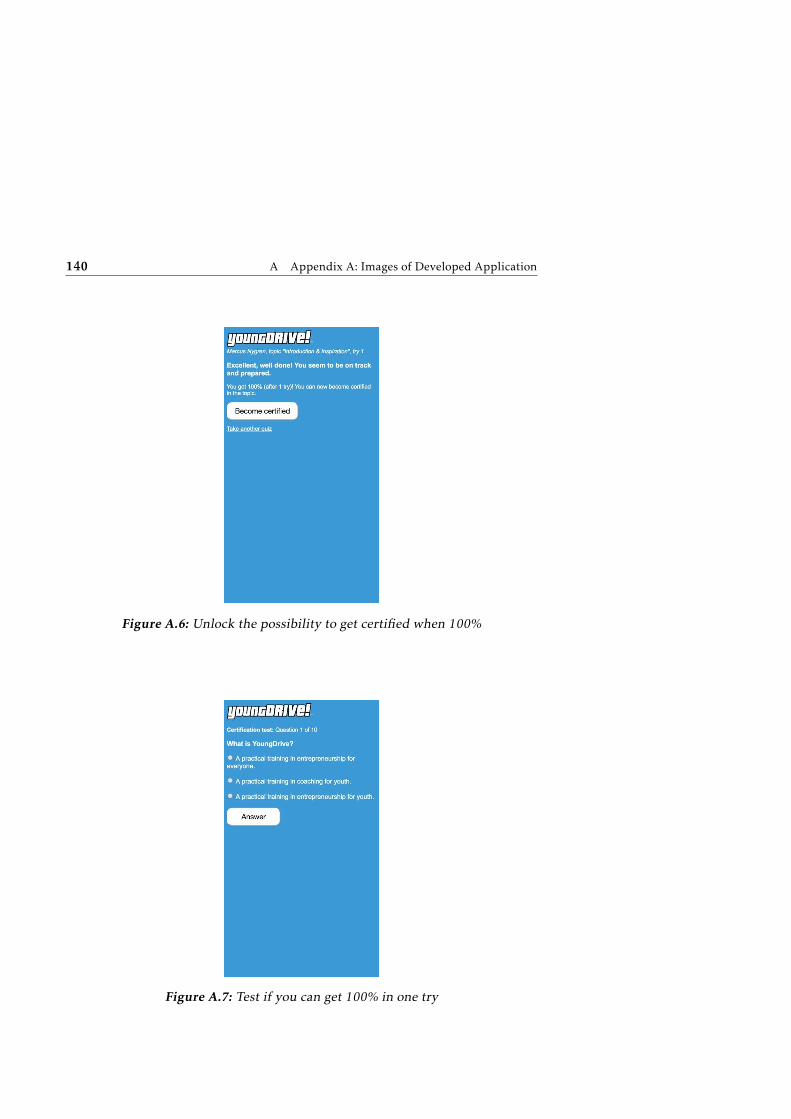
140 A Appendix A: Images of Developed Application
Figure A.6: Unlock the possibility to get certified when 100%
Figure A.7: Test if you can get 100% in one try

141
Figure A.8: If not, get feedback and go back to training
Figure A.9: If 100% correct, you get certified in the topic

BAppendix B: Pre-Test
In the following appendix, the pre-test used for iteration 4 is shown, see figureB.1 and figure B.2. The pretest is based on Walstad’s questionnaire, with mod-ifications to be understood in the Tororo context Walstad and Kourilsky (1998).The correct answers are 1) 2, 2) 1, 3) 2, 4) 3, 5) 2, 6) 2 and 7) 1.
143
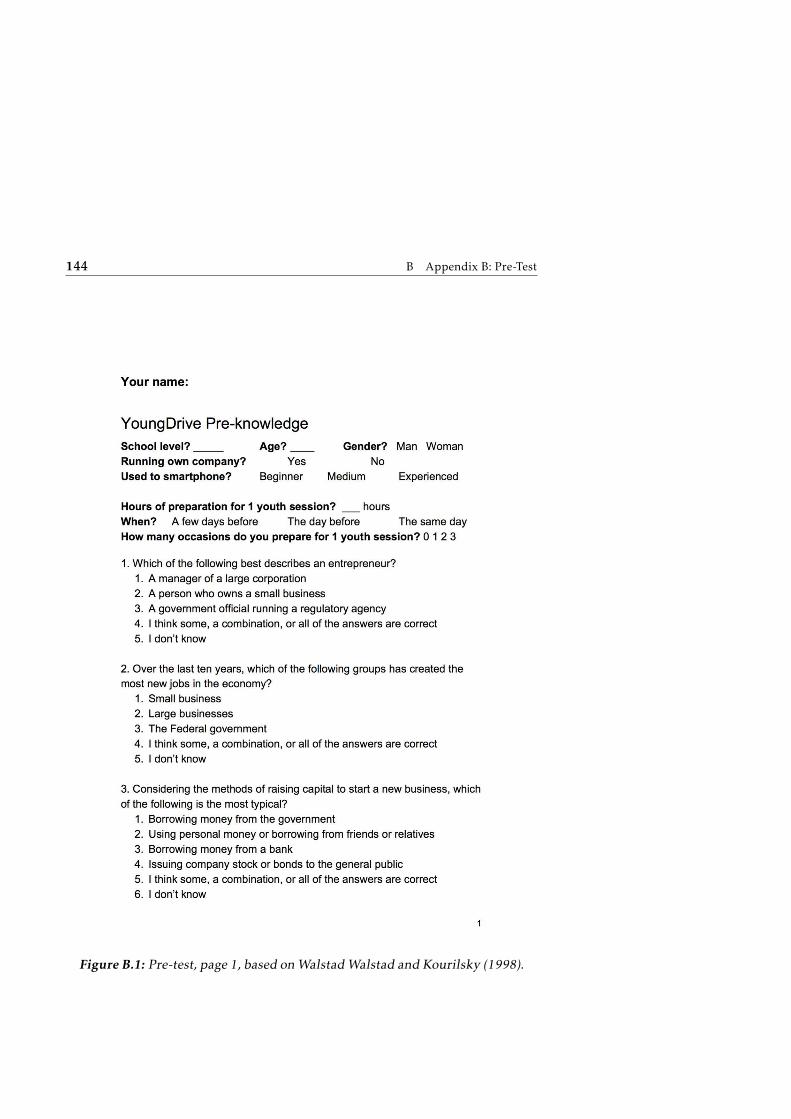
144 B Appendix B: Pre-Test
Figure B.1: Pre-test, page 1, based onWalstadWalstad and Kourilsky (1998).
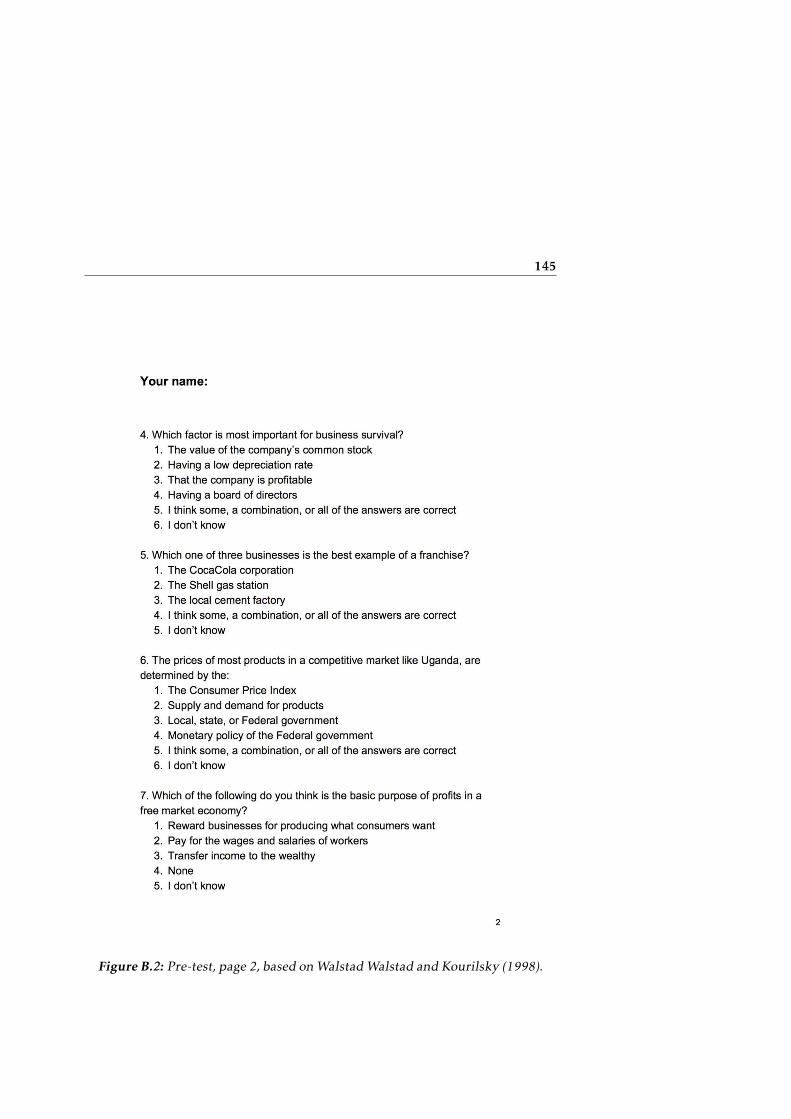
145
Figure B.2: Pre-test, page 2, based onWalstadWalstad and Kourilsky (1998).


CAppendix C: Time Plans & Activities
In appendix 1, the original time plan is presented together with the revised timeplan, done for the half-time evaluation with the examiner.
C.1 Original Time Plan and Activities
C.1.1 Before Uganda
Week Focus2 Workshop with Lena Tibell and Konrad Schönborn on Research
questions & Proposal of method.3 Start writing "Planeringsrapport". Study interaction design via
guest lecture Jonas Löwgren, and reading the book "ThoughtfulInteraction Design".
4 Interviewwith Take Aanstoot, Social entrepreneur in Kenya. Sub-mission "Planeringsrapport". Education day in Service design inStockholm (by Expedition Mondial). Meet Joachim Svärdh aboutEntrepreneurship research.
5 Approval "Planeringsrapport" with Camilla Forsell. Meetingwith Lena Tibell and Konrad Schönborn (2016-02-02). Travel toUganda.
C.1.2 In Uganda
Times specified are in local time to where the master thesis was done at the time.Uganda time (EAT - Eastern Africa Time) is 2 hours forward of Swedish time(CET - Central European Time). 1 day per week will be spent on report writing,including Analysis work for the meetings.
147

148 C Appendix C: Time Plans & Activities
Week Focus6 Cultural adaption. Land, set up wifi, set up the apartment, learn
about the YoungDrive organization, meet people. Be preparedfor stomach disease. Get familiar with the transportation systemin Kampala. Get familiar with the city.Iteration 1. Prepare Iteration 1 with Iliana. Start-up meetingwith partners. Start report writing: analyze, collect material, sort,structure and plan.
7 Iteration 1. Prepare Interactions. Analyze Start-up meeting withpartners. Write on report. in order to create Questionnaire guide.Understand technical tools, without working on an app solution- the goal is to get familiar with the tools.
8 Iteration 1. Travel for Interactions. Do 8 face-to-face interviews,with no digital focus, hypothetical situations. Do minimum 2field visits to understand the coach’s situation, ideally living inKamuli or Tororo a couple of days. This is a good opportunity tolearn coaches how the tablets and smartphones work.
9 Iteration 1. Analysis & Compilation. Thursday: Expert meeting(March 3rd, 6-7 PM). Friday: Partner meeting (March 4th, 11-12AM).Iteration 2. Determine Needs. Ideation. Create low-fi Triggermaterial (pen and paper) and determine what the hi-fi (digitalapp) material should be.
10 Iteration 2. Design and Develop the hi-fi trigger material. Half-time check-up with examiner.
11 Iteration 2. Interactions, control group #1 & #2.12 Iteration 2. Interactions, control group #1 & #2.13 Vacation.14 Iteration 2. Analysis #2 (What choices needs to be made? What
path should be taken? Start formulate Customer path. If needed,document how people see apps, document limitations, documentexperience needs, document risks.) & Compilation. Thursday:Expert meeting (April 7th, 4 PM). Friday: Partner meeting (April8th, 11-12 AM). Continued Development Creative Brief. Deter-mine what actions needs to be taken outside of the developmentof the app. Create Behovsgrupper.
15 Iteration 3. Develop and Modifications phase.16 Iteration 3. Develop and Modifications phase. Interactions: App
Tests with Interviews & Measurements (with time allocated forlate arrivals and missing participants).
17 Iteration 3. Interactions: App Tests with Interviews & Measure-ments. Analysis & Compilation. Friday: Partner meeting (April29th, 11 AM) & Expert meeting (April 29th, 4 PM).
18 Final analysis. Finalize the app. Travel back to Sweden.

C.2 Revised Time Plan and Activities 149
C.1.3 After Uganda
Week Focus19 Write on Master thesis report. Attend Auscultations.20 Write on Master thesis report. Attend Auscultations.21 Write on Master thesis report. Attend Auscultations. Find oppo-
nent for Master thesis.22 Submission of report to examiner, after approval by supervisor.
Examiner decides on date and time for presentation. Send reportto opponent, and get the opponent’s report.
C.1.4 After Semester
Week Focus35 Presentation of Master thesis, with supervisor, examiner and op-
ponent. Hand over publication approval to the administrator.36 Opposition of another person’s Master thesis.37 Do changes to report if requested. Upload report to X-sys for ap-
proval (within 10 days). Write Reflections document and submiton X-sys within the 10 days. Publish master thesis in X-sys.
C.2 Revised Time Plan and Activities
When the possibility of attending the YoungDrive Zambia training appeared,week 10-18 of the original time plan needed to be revised. These were the changesmade, which were also approved by the examiner during the half-time evaluationof the master thesis:
Week Focus10 Iteration 2 Trigger material & Prepare Interactions11 Iteration 2: Interactions (at YoungDrive Zambia)12 Vacation in Uganda13 Iteration 3: Insights14 Iteration 3: Ideation & Trigger material15 Iteration 3: Interactions (in Tororo) & Insights16 Iteration 4: Ideation & Trigger material17 Iteration 4: Interactions (in Tororo) & Insights18 Final analysis. Finalize the app.
Below, the activities for the interactions of each iteration is presented.
C.2.1 Iteration 1: Uganda Coach Visit
In iteration 1, the following activities were carried out and then analysed:
• Stakeholder interview (for Need groups)
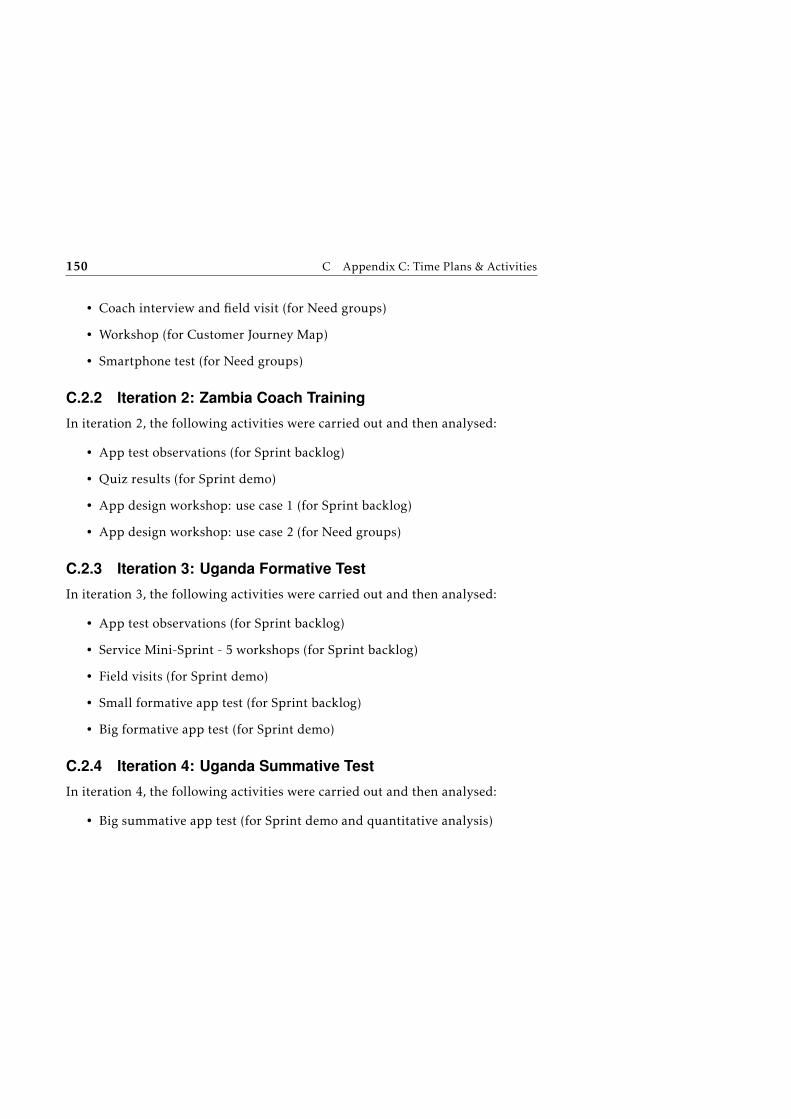
150 C Appendix C: Time Plans & Activities
• Coach interview and field visit (for Need groups)
• Workshop (for Customer Journey Map)
• Smartphone test (for Need groups)
C.2.2 Iteration 2: Zambia Coach Training
In iteration 2, the following activities were carried out and then analysed:
• App test observations (for Sprint backlog)
• Quiz results (for Sprint demo)
• App design workshop: use case 1 (for Sprint backlog)
• App design workshop: use case 2 (for Need groups)
C.2.3 Iteration 3: Uganda Formative Test
In iteration 3, the following activities were carried out and then analysed:
• App test observations (for Sprint backlog)
• Service Mini-Sprint - 5 workshops (for Sprint backlog)
• Field visits (for Sprint demo)
• Small formative app test (for Sprint backlog)
• Big formative app test (for Sprint demo)
C.2.4 Iteration 4: Uganda Summative Test
In iteration 4, the following activities were carried out and then analysed:
• Big summative app test (for Sprint demo and quantitative analysis)
Upphovsrätt
Detta dokument hålls tillgängligt på Internet — eller dess framtida ersättare —under 25 år från publiceringsdatum under förutsättning att inga extraordinäraomständigheter uppstår.
Tillgång till dokumentet innebär tillstånd för var och en att läsa, ladda ner,skriva ut enstaka kopior för enskilt bruk och att använda det oförändrat för icke-kommersiell forskning och för undervisning. Överföring av upphovsrätten viden senare tidpunkt kan inte upphäva detta tillstånd. All annan användning avdokumentet kräver upphovsmannens medgivande. För att garantera äktheten,säkerheten och tillgängligheten finns det lösningar av teknisk och administrativart.
Upphovsmannens ideella rätt innefattar rätt att bli nämnd som upphovsmani den omfattning som god sed kräver vid användning av dokumentet på ovanbeskrivna sätt samt skydd mot att dokumentet ändras eller presenteras i sådanform eller i sådant sammanhang som är kränkande för upphovsmannens litteräraeller konstnärliga anseende eller egenart.
För ytterligare information om Linköping University Electronic Press se förla-gets hemsida http://www.ep.liu.se/
Copyright
The publishers will keep this document online on the Internet — or its possi-ble replacement — for a period of 25 years from the date of publication barringexceptional circumstances.
The online availability of the document implies a permanent permission foranyone to read, to download, to print out single copies for his/her own use andto use it unchanged for any non-commercial research and educational purpose.Subsequent transfers of copyright cannot revoke this permission. All other usesof the document are conditional on the consent of the copyright owner. Thepublisher has taken technical and administrative measures to assure authenticity,security and accessibility.
According to intellectual property law the author has the right to be men-tioned when his/her work is accessed as described above and to be protectedagainst infringement.
For additional information about the Linköping University Electronic Pressand its procedures for publication and for assurance of document integrity, pleaserefer to its www home page: http://www.ep.liu.se/
© Marcus Nygren