developing a population genomic approach for indicators of environmental condition … ·...
TRANSCRIPT

Developing a Population Genomic Approach for Indicators of Environmental Condition in the Lake Eyre Basin
Luciano B. Beheregaray and Catherine R. M. Attard
Goyder Institute for Water Research
Technical Report Series No. 15/22
www.goyderinstitute.org

Page ii of 31
Goyder Institute for Water Research Technical Report Series ISSN: 1839-2725
The Goyder Institute for Water Research is a partnership between the South Australian Government through the Department of Environment, Water and Natural Resources, CSIRO, Flinders University, the University of Adelaide and the University of South Australia. The Institute will enhance the South Australian Government’s capacity to develop and deliver science-based policy solutions in water management. It brings together the best scientists and researchers across Australia to provide expert and independent scientific advice to inform good government water policy and identify future threats and opportunities to water security.
Enquires should be addressed to: Goyder Institute for Water Research
Level 1, Torrens Building 220 Victoria Square, Adelaide, SA, 5000 tel: 08-8303 8952 e-mail: [email protected]
Citation Beheregaray LB, Attard CRM (2015) Developing a Population Genomic Approach for Indicators of Environmental Condition in the Lake Eyre Basin. Goyder Institute for Water Research Technical Report Series No. 15/22, Adelaide, South Australia. Copyright ©2015 Flinders University. To the extent permitted by law, all rights are reserved and no part of this publication covered by copyright may be reproduced or copied in any form or by any means except with the written permission of Flinders University. Disclaimer The Participants advise that the information contained in this publication comprises general statements based on scientific research and does not warrant or represent the completeness of any information or material in this publication.

Page iii of 31
Acknowledgements We acknowledge the contribution of many researchers and their institutions that provided or assisted with the provision of fish samples or participated in field expeditions. The researchers include Peter Unmack, Dean Gilligan, Leanne Faulks, Dale McNeil, Michael Hammer, Mark Adams, Rupert Mathwin, David Cheshire, David Schmarr, Gabriel Shepherd, David Sternberg, Kim Shaddick, Jonathan Sandoval-Castillo and Chris Brauer. The institutions include the University of Canberra, South Australian Museum, Museum and Art Gallery of the Northern Territory, NSW Department of Primary Industries (NSW DPI), Department of Environment, Water and Natural Resources SA (DEWNR SA), South Australian Research and Development Institute (SARDI), Department of Natural Resources and Mines (QLD), Macquarie University and Flinders University. We also thank Minami Sasaki and Lauren Pfeiffer for assisting with tissue dissections and DNA extractions, Chris Brauer for helping with riverscape distances and Jonathan Sandoval-Castillo for bioinformatics support. Collections were obtained under permits from various state fisheries agencies and research is under Flinders University Animal Welfare Committee approvals E313 and E342. Around 60% of the data reported here were generated in early 2015 with funding to LBB from an ARC Future Fellowship (FT130101068) and an ARC Discovery (DP150102903).
Page iv of 31
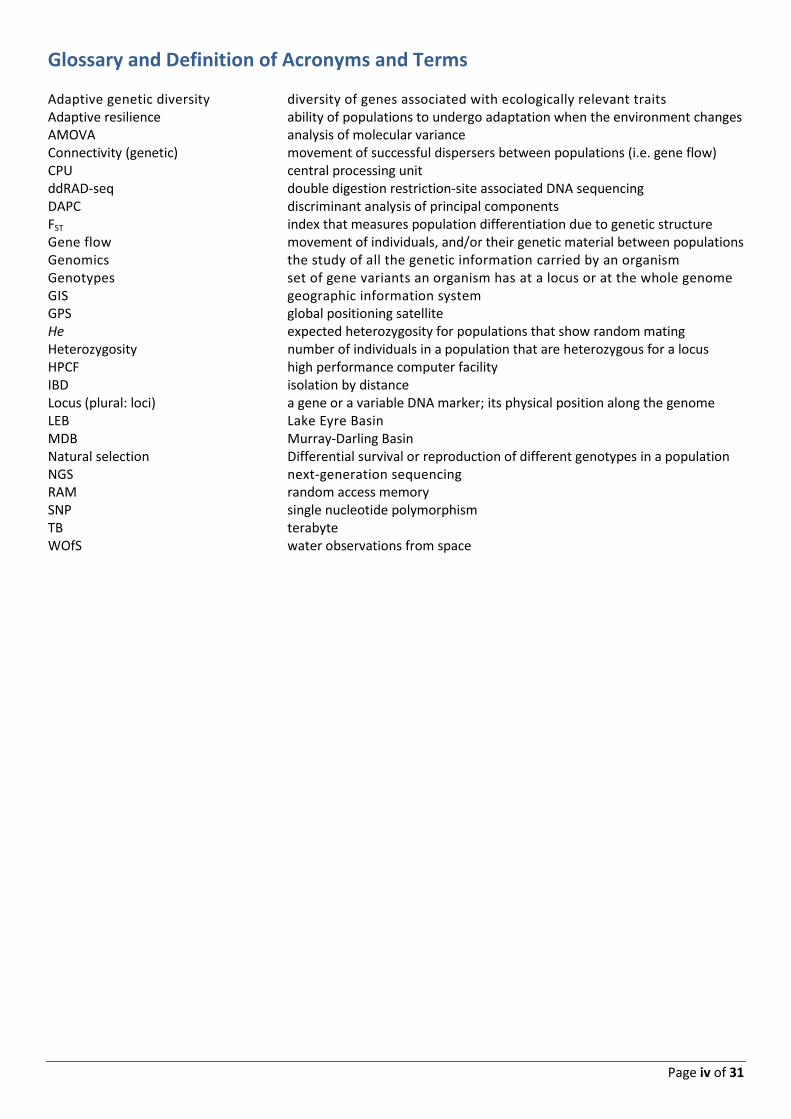
Glossary and Definition of Acronyms and Terms Adaptive genetic diversity diversity of genes associated with ecologically relevant traits Adaptive resilience ability of populations to undergo adaptation when the environment changes AMOVA analysis of molecular variance Connectivity (genetic) movement of successful dispersers between populations (i.e. gene flow) CPU central processing unit ddRAD-seq double digestion restriction-site associated DNA sequencing DAPC discriminant analysis of principal components FST index that measures population differentiation due to genetic structure Gene flow movement of individuals, and/or their genetic material between populations Genomics the study of all the genetic information carried by an organism Genotypes set of gene variants an organism has at a locus or at the whole genome GIS geographic information system GPS global positioning satellite He expected heterozygosity for populations that show random mating Heterozygosity number of individuals in a population that are heterozygous for a locus HPCF high performance computer facility IBD isolation by distance Locus (plural: loci) a gene or a variable DNA marker; its physical position along the genome LEB Lake Eyre Basin MDB Murray-Darling Basin Natural selection Differential survival or reproduction of different genotypes in a population NGS next-generation sequencing RAM random access memory SNP single nucleotide polymorphism TB terabyte WOfS water observations from space

Page 5 of 31
Executive Summary
Our subproject aims to generate and analyse large-scale population genomic datasets to provide indicators of environmental condition across the Lake Eyre Basin (LEB). The study systems are two widespread LEB fish species that have contrasting hydrological requirements: the golden perch (a migratory large-sized species) and the desert rainbowfish (a non-migratory small-sized species).
We successfully optimized and implemented novel protocols in next-generation DNA sequencing (ddRAD-seq) that disclosed information about connectivity and adaptive diversity (the diversity of genes associated with ecologically relevant traits) across all major catchments of the LEB. We initially formed a network of collaborators and amassed samples from 385 golden perch collected from 24 LEB localities and 452 desert rainbowfish collected from 29 LEB localities.
DNA extractions were performed for all samples and a subset was chosen for population genomic analysis. Approximately 2.1 billion DNA sequences were generated for 242 golden perch collected from across the range of the species in the LEB, whereas 200,000 sequences were generated for 45 desert rainbowfish from a smaller number of locations. These sequences were used to characterise DNA markers in the form of SNPs (single nucleotide polymorphisms): 29,008 SNPs for golden perch and 11,429 SNPs for desert rainbowfish.
Levels of genetic diversity in LEB golden perch were lower than those found in other river basins (e.g. MDB), suggesting that the persistence of this migratory species in the LEB is influenced by the contribution of a small number of individuals found in key riverine locations. Golden perch from ‘western’ catchment divisions (Diamantina, Georgina, Neales and Warburton Rivers) showed higher levels of genome-wide diversity, and theoretically, larger population sizes, than golden perch from the ‘eastern’ catchment divisions (Cooper, Thomson and Barcoo Rivers). For the desert rainbowfish, levels of genome-wide diversity were generally high, except for the Finke River population, which showed low diversity.
The overall results indicate that the eastern and western catchment divisions of the LEB are effectively isolated and that no contemporary connectivity takes place across the Lake Eyre. In contrast, high levels of connectivity were found within both the western and the eastern catchment divisions. For golden perch, high connectivity is evident along the same river, but also between distant localities found in different rivers – as long as those rivers belong to the same catchment division. Desert rainbowfish showed nil connectivity across different rivers; except between the Macumba and Neales Rivers, which appeared connected. Particularly remarkable was the high genetic divergence in desert rainbowfish between the Finke and all other riverine samples, which is consistent with the Finke’s geographic (and perhaps hydrological) isolation. The genomic results matched the general predictions based on life-history attributes of the two species: the large and migratory golden perch showed greater connectivity than the small and non-migratory desert rainbowfish.
For golden perch, a subset of 169 SNPs was identified as strong candidate of markers under selection in relation to environmental variability across the LEB. These SNPs are expected to be located in regions of the genome that are associated with adaptive (i.e. ecologically relevant) traits. Analysis of the SNPs under selection indicated greater levels of adaptive resilience in the western population of golden perch. The results also suggest that very different selective environments exist across the LEB. Our working hypothesis is that the greater aridity and environmental instability in the western LEB has promoted the selection of more diverse adaptive genotypes and the formation of spatial gradients of adaptive diversity.
An examination of the drainage network and the hydrological characteristics of the LEB provided insights into the processes behind the major patterns observed in our study. In addition, by collaborating with

Page 6 of 31
researchers from Task 3a, we highlighted the value of integrating population genomics and spatial mapping of hydrological variation to explain patterns underpinning environmental condition in the LEB.
We propose that further integrative analyses using spatial modeling and population genomic datasets are needed. In addition, the generation and analysis of population genomic data for the available samples of desert rainbowfish would provide an extremely informative comparative dataset for the LEB project, and potentially, for other Goyder research initiatives as well.

Page 7 of 31
Contents Acknowledgements .............................................................................................................................................. iii
Glossary and Definition of Acronyms and Terms ................................................................................................. iv
Executive Summary .............................................................................................................................................. 5
Background .......................................................................................................................................................... 8
Aims and relationships to other research projects .......................................................................................... 8
Materials and Methods ........................................................................................................................................ 9
Sampling populations of golden perch and desert rainbowfish ...................................................................... 9
DNA extractions, quality assessment and preparation of genomic libraries ................................................... 9
Bioinformatics: filtering DNA sequences and characterising SNP datasets ..................................................... 9
Data analysis: population diversity, population differentiation and tests for selection ............................... 10
Samples amassed for population genomic studies of LEB fishes .................................................................. 11
Results and Discussion ....................................................................................................................................... 13
Golden perch .................................................................................................................................................. 13
Desert rainbowfish ......................................................................................................................................... 22
Conclusions ........................................................................................................................................................ 26
Future directions ................................................................................................................................................ 27
References ......................................................................................................................................................... 28
Appendices ......................................................................................................................................................... 30
Appendix 1 ..................................................................................................................................................... 30
Appendix 2 ..................................................................................................................................................... 30

Page 8 of 31
Background
In this Task 5 subproject we successfully generated genomic indicators about population connectivity and adaptive diversity to inform on the ecological condition of the Lake Eyre Basin (LEB) aquatic biota.
Population connectivity is one of the major factors shaping the distribution and persistence of biodiversity. Well-connected populations tend to display larger sizes, higher levels of genetic diversity, and lowered risk of extinction (Spielman et al. 2004; Allendorf et al. 2010). In addition to maintaining natural levels of connectivity among populations, management decisions should also consider the adaptive genetic diversity of natural populations (Allendorf et al. 2010). Adaptive genetic diversity (also known as functional diversity) is the diversity of genes associated with ecologically relevant traits. It underpins the way an organism adapts to changes in the environment and thus relates directly to the retention of individual fitness and population viability.
Projects that generate indicators about the connectivity and the adaptive diversity of populations can substantially enhance ecosystem management. Such projects can identify refuges of adaptive diversity and vulnerable biotas and provide a set of valuable indicators for monitoring ecological condition under a range of scenarios of environmental change (Losos et al. 2013; Hoffmann & Sgro 2011; Allendorf et al. 2010). Genomic approaches that use next-generation sequencing (NGS) technology provide powerful, efficient and relatively low-cost ways to measuring population connectivity and adaptive diversity in wild populations (Mardis 2008; Hoffmann & Willi 2008; Allendorf et al. 2010).
Aims and relationships to other research projects
Our subproject aims to generate and analyse large-scale NGS datasets to provide population genomic indicators of environmental condition for the LEB. The study systems are two widespread LEB fish species that have contrasting hydrological requirements: the golden perch Macquaria ambigua and the desert rainbowfish Melanotaenia spendida tatei. These species were selected because they have contrasting life-history strategies and are expected to respond differently to hydrological variability.
Hydrological variability over time and space is a fundamental characteristic of arid zone ecosystems, having a profound effect on the dynamics of freshwater communities (Balcombe & Arthington 2009). Golden perch is a relatively large fish that requires increases in flow volume to stimulate recruitment booms and dispersal (Faulks et al. 2010a). The focus of this subproject is on golden perch, for which a larger population dataset were generated. Patterns of connectivity and adaptive diversity in golden perch will be compared with those shown by desert rainbowfish, a small non-migratory species predicted to show relatively poor dispersal. This comparative approach covers a range of life-history requirements of the LEB biota and therefore should provide more realistic genomic-based indicators of ecological condition.
This subproject also aims to provide data to be analysed in conjunction with GIS databases and spatial approaches developed by Task 3a (“Development of integrated spatial indicators of condition for Lake Eyre Basin at multiple scales”). Examples about this integration are briefly discussed here; these are presented in detail in Task 3a’s final report.
In addition, our subproject capitalises on datasets, extensive technical resources, and expertise in genomic assessments of population connectivity and adaptive diversity available at the Molecular Ecology Laboratory at Flinders University (MELFU). Specifically, most of the data reported here were generated in recent months by the MELFU during ongoing genomic studies of perches (funded by an ARC Future Fellowship FT130101068) and of rainbowfishes (funded by an ARC Discovery DP150102903). These two projects focus on hydrological variability and aquatic biotic response in the Murray-Darling Basin (MDB), but also include relatively small comparisons with species distributed in the LEB. The modest funding provided by the Goyder Institute for this task covered around 50% of the collection of the golden perch dataset presented in this report. The rest of the golden perch dataset and the rainbowfish dataset were covered by ARC FT130101068 and ARC DP150102903, respectively.

Page 9 of 31
Materials and Methods
Sampling populations of golden perch and desert rainbowfish We established a large collaborative network of field ichthyologists in early 2014 to obtain samples from localities covering the range of the two species in the LEB. The collaborators (named in the Acknowledgments section) include researchers based at University of Canberra, South Australian Museum, Museum and Art Gallery of the Northern Territory, NSW Department of Primary Industries (NSW DPI), Department of Environment, Water and Natural Resources SA (DEWNR SA), South Australian Research and Development Institute (SARDI), Department of Natural Resources and Mines (QLD), Macquarie University and Flinders University. In addition, we conducted field expeditions to the LEB in October 2014 to sample key populations from central Australia. Samples were collected using non-destructive methods such as electrofishing and netting. A piece of caudal fin tissue of approximately 5 mm2 was taken from each fish, placed in liquid nitrogen or in 100% ethanol in the field and later permanently stored at -80°C in the laboratory. Global Positioning Satellite (GPS) coordinates were taken from each sampled site for spatial analyses.
DNA extractions, quality assessment and preparation of genomic libraries
Genomic DNA was extracted from fin clips or from skeletal muscle using a modified salting out method (Sunnucks & Hales 1996) or DNeasy Blood and Tissue Kit (Qiagen). The genomic DNA was assessed for quality using a spectrophotometer (NanoDrop, Thermo Scientific), integrity using 2% agarose gels (produced in-house), and quantity using a fluorometer (Qubit, Life Technologies). Only DNA of high quality, integrity, and quantity were used due to the stringent requirements of genomic library preparation for sequencing.
The ddRAD-seq (double digestion restriction-site associated DNA sequencing) genomic libraries were prepared following the method of Peterson et al. (2012). RAD-seq methods are rapidly becoming very popular for producing high-density genetic marker datasets, for identifying signatures of selection, and for assisting genome assembly (Mardis 2008; Peterson et al. 2012). Library preparation involved double restriction enzyme digestion of the genomic DNA into DNA fragments, and then ligation of adapters, size selection using Pippin Prep (Sage Science), cleaning using magnetic beads (Agencourt AMPure XP, Beckman Coulter), and PCR amplification on a Mastercycler Pro (Eppendorf) of the DNA fragments. Resulting libraries were assessed for fragment size range using electrophoresis and flow cytometry via a Bioanalyzer (Agilent). The quantity of libraries was assessed using real-time PCR (StepOne, Applied Biosystems) and the quality using the spectrophotometer NanoDrop (Thermo Scientific). Only libraries with an appropriate fragment size range, average fragment size, quantity, and quality were sequenced. The libraries were pooled in groups of 48 samples and paired-end sequenced (100 bp) on an Illumina HiSeq 2000 next-generation genome platform at the Génome Québec Innovation Centre, in Montreal.
Bioinformatics: filtering DNA sequences and characterising SNP datasets
The resulting sequences produced by Illumina HiSeq 2000 were cleaned and analysed using the Stacks software pipeline (Catchen et al. 2011) to filter sequences and identify single nucleotide polymorphisms (SNPs). SNPs are the most common type of DNA variation. They are substitutions of one base pair (A, T, C or G) for another that occur in more than one percent of the general population. The Stacks pipeline uses the common restriction enzyme cut sites across individuals as anchors to pile up reads from each individual locus. It then uses a maximum likelihood statistical model to call genotypes based on the probability that a given polymorphism is real and not a sequencing artifact. The advantage of the Stacks approach is that it can be performed de novo without the need for a reference genome and is easily integrated into an analysis pipeline for population genomics.
Unique stacks were compiled de novo using the core program component ustacks. Sequences were initially only accepted based on a minimum stack depth of 4 reads in an individual with no more than 4 base pair

Page 10 of 31
mismatches between stacks in an individual. The deleveraging algorithm was used to resolve multiply merged reads and the removal algorithm was implemented to drop highly repetitive stacks. Loci identified for each individual were merged into an overall catalogue of loci for all samples using the pipeline component cstacks. Loci were accepted and merged with mismatches at up to 5 positions in the read. Individuals were then matched against the catalogue using the pipeline component sstacks. Finally, the population component of Stacks was used to generate the list of SNP loci to be used for population level analyses. Usable loci were selected based on the requirements that they appear in more than 80% of the individuals across all sampled populations and that the minor allele frequency was above 0.05. Loci were only accepted in individuals if the read depth was greater than 5.
Analyses were performed using the centralized high performance computer facility (HPCF) Colossus from Flinders University, a cluster of 1,160 CPU cores and 4.25TB (4,250 GB) of RAM or Phoenix, a HPCF based at the MELFU with 40 cores and 0.6 TB of RAM. These HPCFs are needed to handle the analysis of the very large ddRAD-seq datasets produced in this project (details below).
Data analysis: population diversity, population differentiation and tests for selection
Population level statistics describing genetic diversity within each locality (i.e. site where fish were sampled) and the genetic differentiation between localities were estimated using the software ARLEQUIN 3.5 (Excoffier & Lischer 2010). These statistics include nucleotide diversity (π), expected heterozygosity (He), percentage of polymorphic SNPs (% poly) and population differentiation (FST). Presence of genetic structure within our dataset was tested using a complementary set of analytical approaches. Firstly, genetic differentiation was assessed using a discriminant analysis of principal components (DPCA) in the R package Adegenet (Jombart T & Ahmed 2011), which represents genetic diversity among sampled individuals and populations (i.e. localities). We also built a neighbor-joining tree based on population genetic distances using MEGA 6 (Tamura et al. 2013). Finally, we conducted population pairwise comparisons of genetic differentiation based on FST, which were displayed for ease of visualisation via a heatmap.
We also tested whether any inferred genetic differentiation between localities fits a population model of isolation by distance (IBD). The IBD model of population structure predicts that levels of genetic differentiation between populations are correlated with the spatial distance separating them. For studies where sampling is carried out over spatial scales that extend beyond the dispersal potential of an individual, a statistical fit to IBD predictions is often considered as a null hypothesis of population structure. The IBD analysis was carried out for the golden perch dataset using a Mantel test implemented in GENODIVE (Meirmans & Van Tienderen 2004), which assesses the correlation between a geographic and a genetic distance matrix (FST). For this test we used a riverscape distance estimated in ArcGIS, which the shortest possible distances the fish can travel along all possible waterways, operating under the assumption that none of the waterways are dried up (Appendix 1). These analyses were also conducted with log riverscape distance and/or log genetic distance, which resulted in the same outcome.
Hierarchical patterns of genetic structure (i.e. larger differentiation between catchments than within) are common in riverine systems. We used the golden perch dataset (which was represented by a larger number of localities) to assess for hierarchical population differentiation via the AMOVA function in ARLEQUIN 3.5 based on FST. The latter was done by comparing localities across two groups of catchments, localities within catchments and, finally, assessing differentiation within localities.
Evidence for natural selection operating on the SNP markers was assessed via tests for outlier detection. Outlier markers are regions of the DNA that show excessively high genetic differentiation between populations because they are under selection or are physically linked to other DNA regions under selection. Outlier tests face many challenges relating to limited sensitivity, population stratification and hierarchical genetic structure leading to false positives. To minimise these issues we used two different methods to detect outlier loci, and only considered a locus to be under selection if that locus (in this case a SNP) was detected in both approaches. First, we used a FST outlier approach implemented in ARLEQUIN that models

Page 11 of 31
the expected distribution of the relationship between FST and He (expected heterozygosity) under a hierarchical model of migration with neutral markers. The expected distribution is compared to the observed distribution to identify outlier loci that have excessively high FST. We also tested for outliers using the Bayesian method implemented in BAYESCAN (Foll & Gaggiotti 2008) to estimate the probability that each locus is subject to selection. Here, model choice is based on the posterior model probabilities (Bayes factors) and three independent runs were performed to check the consistency between detected outliers. All tests for selection were generated only for the golden perch dataset.
Graphics were generated by a series of scripts triggered by the Rcmd button of the R package.
Samples amassed for population genomic studies of LEB fishes
In total we amassed samples of 385 golden perch collected in 24 localities (Table 1) and of 452 desert rainbowfish collected in 29 localities (Table 2). In a few occasions we obtained samples collected from the same site over multiple years, which allowed tests for temporal variation in population structure.
Table 1. Samples of golden perch amassed for this project from 24 localities in the LEB. DNA extractions were carried out for all samples.
Region Date collected Locality name Latitude Longitude # samples
Neales Mar/Apr-02 Steward, Algebuckina & Tardetakarinna WH -27.8922 135.8222 16
Warburton Apr-02 Koonchera WH -26.6883 139.5055 25
Warburton May-14 Koonchera WH -26.6883 139.5055 28
Diamantina 2014 Davenport Downs -24.1560 141.1006 20
Diamantina Oct-06 Nth Davenport Downs -22.9314 141.8633 34
Georgina Oct-06 Georgina -23.0717 139.5128 35
Cooper Apr-02 Lake Toontoowaranie & NW branch -27.2000 140.1400 9
Cooper Apr-11 Gidgealpa WH -27.8250 140.1516 19
Cooper May-14 Cullyamurra WH -27.7047 140.8692 13
Cooper 2014 Durham Downs -27.0382 141.9029 15
Cooper May-14 Currareva WH -25.3700 142.7446 37
Cooper Oct-06 Windorah & Hammond Downs -25.3167 142.8333 30
Thomson Oct-06 Noonbah -24.2256 143.2997 20
Barcoo Oct-06 Avington WH -24.0833 144.9667 40
Kalaweerina NA See GPS -27.9166 137.3860 3
Cooper 1980s Coongie Lake NA NA 1
Warburton Apr-14 Tepamimi Waterhole NA NA 9
Warburton Apr-14 Pandie Pandie NA NA 3
Thomson Oct-06 Longreach NA NA 7
Cooper May-14 Kyabra Creek, Gummomo Waterhole -26.0974 143.4445 10
Warburton NA Warburton R -27.8731 137.9011 5
Warburton NA Moondanna WH Warburton R -27.8869 137.9203 1
Warburton NA Queerbidie WH, near Innamincka NA NA 4
Warburton Apr-02 Clifton Hills outstation Warburton R -26.5347 139.4515 1

Page 12 of 31
Table 2. Samples of desert rainbowfish amassed for this project from 29 localities in the LEB. DNA extractions were carried out for all samples.
Region Date collected
Locality name Latitude Longitude # samples
Finke River Nov-11 Snake Hole -24.5589 133.3109 21
Macumba River Dec-11 Eringa Waterhole -26.2873 134.7286 20
Neales River Nov-11 Algebuckina Waterhole -27.9001 135.8146 19
Cooper Nov-11 Cuttapirra Waterhole -28.5502 138.0811 15
Cooper Nov-11 Narie Waterhole -27.4541 140.0736 15
Macumba River Feb-14 Eringa Waterhole -26.2873 134.7286 20
Neales River Sep-14 Algebuckina Waterhole -27.9001 135.8146 16
NA 1987 Rocklands Stn -19.9931 137.7856 45
Finke River 1988 Idracowra Station -25.0025 133.7922 35
Neales River Nov-11 Warrarawoona Waterhole -28.0429 135.9036 20
Cooper May-14 Currareva Waterhole -25.3700 142.7446 30
Cooper May-14 Lake Dunn -22.6030 145.6747 23
Barcoo Jun-97 Blackall -24.4265 145.4595 30
Georgina Jul-97 Ranken, Soudan -20.0502 137.0178 30
NA 1988 Davenport Ranges -20.9292 135.2058 13
Finke River Jul-97 Henbury -24.5529 133.2390 30
Cooper Creek Nov-11 Tirawarra Waterhole -27.4335 140.1497 5
Georgina River 1987 Austral Downs Stn -20.3203 137.9489 8
NA 1987 Epenarra Stn -20.2358 135.5069 14
Roe Ck 1988 West MacDonnell Ranges NP -23.6819 132.7228 2
Roe Ck 1988 West MacDonnell Ranges NP -23.6336 132.7253 1
Roe Ck 1988 Owen Springs Station -23.8139 133.3828 5
NA 1988 Davenport Ranges NP -20.6478 134.7722 2
NA 1988 Owen Springs Station -23.7072 133.0683 2
Finke River 1988 Horseshoe Bend Stationtead -25.2158 134.2383 4
Frew River 1988 Murray Downs Station -20.9972 135.0244 2
Frew River 1988 Murray Downs Station -20.9972 135.0244 3
Coglin Ck 1988 New Crown Station -25.9494 135.0319 2
NA 1987 Rocklands Stn -20.0092 137.8336 20

Page 13 of 31
Results and Discussion
Golden perch
Samples used for genomic analysis
From the total number of DNA extractions that passed our quality control, we selected 242 golden perch samples for population genomic analysis. These samples include 13 sites representing 7 major waterways that together cover most of the natural range of the species in the LEB (Figure 1 and Table 3). These 13 sites correspond to 14 population samples since we were able to generate data from a temporally replicated sample for the Koonchera water hole, in the Warburton River (sampled in 2002 and in 2014). This is an extensive population genomic dataset, with the design spatially nested to assess dispersal potential at the local site (natal dispersal) and to assess environmental-species relationships (due to beyond natal dispersal).
We also included in our genomic analysis an additional 32 golden perch from the MDB, the Bulloo and the Fitzroy Basins to enable comparisons of the levels of genetic variation between the LEB lineage and golden perch lineages from adjacent river basins (ongoing taxonomic studies suggest that different river basins might house distinct species of golden perch; P. Unmack personal communication).
Figure 1. Golden Perch Macquaria ambigua. Photo credit: Peter Unmack.
Figure 2. The 14 localities of golden perch from the LEB used for genomic analysis (details in Table 3).
2,3
1
6
5
4
8
7
9
10
11 12
13 14

Page 14 of 31
A powerful population genomic resource for the LEB golden perch; the first for a LEB fish
The ddRAD-seq protocol optimised at the MELFU was successfully implemented for the LEB golden perch. We obtained ~2.1 billion DNA sequences for 274 golden perch (242 from the LEB; 32 from the MDB). We characterised 29,008 nuclear DNA markers for golden perch in the form of SNPs. To the best of our knowledge, this major resource represents the first population genomic dataset for an arid-zone Australian fish. For instance, the best resolving DNA dataset previously available for this species was that of Faulks et al. (2010a), which was based on 8 nuclear DNA markers. As shown below, the large SNP dataset has improved substantially our ability to test and address ecological questions, including fine-scale assessments of population connectivity and distribution of adaptive diversity.
The ~2.1 billion DNA sequences and 29,008 characterised SNPs can be used for a wide range of ecological, evolutionary and conservation management studies in golden perch. For addressing the questions in this subproject we used stringent criteria to select only SNPs present in more than 80% of individuals from each sampled locality, resulting in a subset of 5,648 SNPs. Unless stated otherwise, the results reported below are based on the 5,648 SNPs screened for 225 fish.
Moderate to low genetic diversity in the LEB compared to golden perch from other river basins
Genetic diversity in a population (e.g. as measured by population genetic parameters such as heterozygosity) is highly correlated which effective population size (Frankham 1995). Effective population size is the number of breeders that contribute to the next generation of a population.
Levels of genome-wide diversity in golden perch from the LEB were moderate to low (Table 3). We further assessed this pattern by comparing the LEB dataset with golden perch samples genotyped from the MDB, the Bulloo and the Fitzroy River Basins. The latter comparison, carried out using a subset of 11,969 SNP markers, consistently indicated that LEB fish had significantly lower genetic diversity (and in some cases around half) than golden perch lineages from other basins (Wilcoxon-sign ranked test P <0.01).
These results are consistent with those found in a previous population genetic analysis of golden perch based on 8 microsatellite DNA markers (Faulks et al. 2010a). These patterns suggest that golden perch, albeit having a widespread distribution in the LEB, is actually represented by a relatively small effective number of breeders in this arid-zone river basin. We propose that the higher environmental seasonality, higher disturbance and lower annual rainfall in the LEB compared to other basins where golden perch are distributed (Stein et al. 2009) influences the ability of the species to maintain large population sizes at a local scale (e.g. within waterholes) and to disperse and recruit large numbers of individuals. According to this hypothesis, the persistence of this migratory species in the LEB should be influenced substantially by the contribution of a small number of individuals from key local populations, which act as source of genetic diversity to populations found elsewhere in the basin.
Within the LEB, neutral genetic diversity varied moderately among locations. Lower genetic diversity was observed in the Cooper River, whereas the higher levels were found in the Diamantina River (Table 3). Overall, fish from ‘western’ LEB catchments (Diamantina, Georgina, Neales and Warburton) displayed relatively higher levels of genetic diversity, and possibly larger effective population sizes, compared to fish from the ‘eastern’ LEB catchments (Cooper, Thomson and Barcoo).
Page 15 of 31
High levels of population genetic differentiation (i.e. low to nil connectivity) between ‘western’ and ‘eastern’ catchment divisions
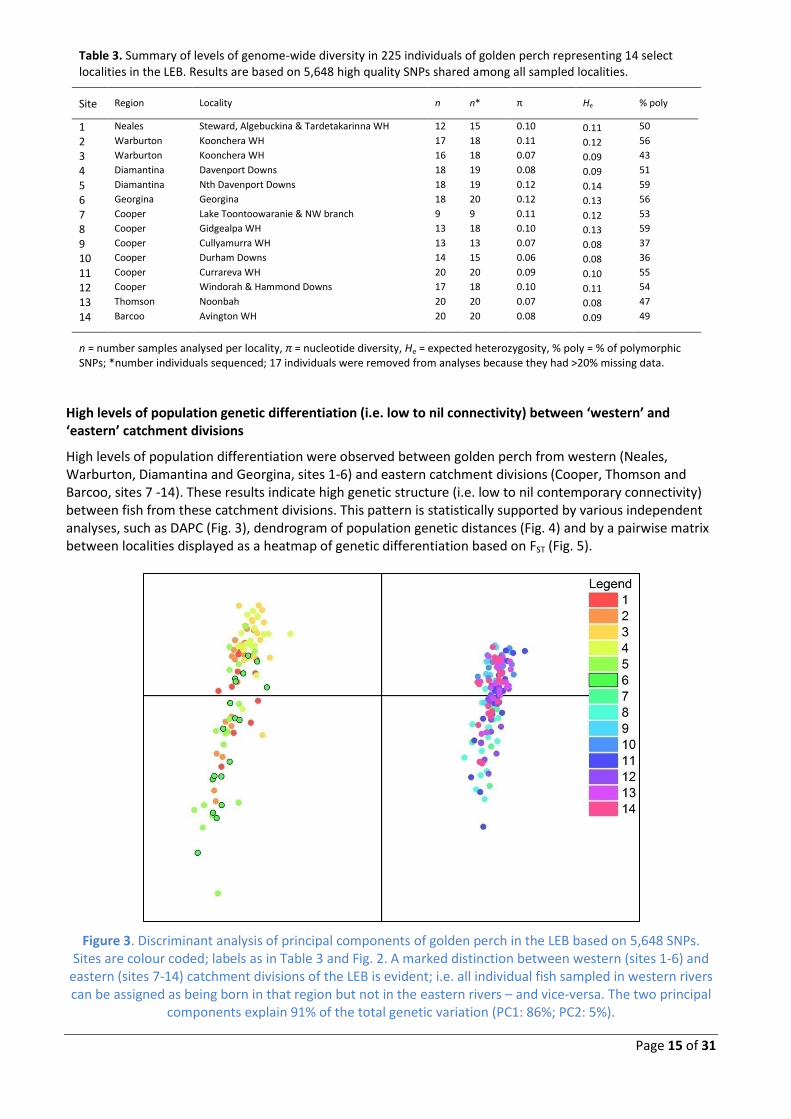
High levels of population differentiation were observed between golden perch from western (Neales, Warburton, Diamantina and Georgina, sites 1-6) and eastern catchment divisions (Cooper, Thomson and Barcoo, sites 7 -14). These results indicate high genetic structure (i.e. low to nil contemporary connectivity) between fish from these catchment divisions. This pattern is statistically supported by various independent analyses, such as DAPC (Fig. 3), dendrogram of population genetic distances (Fig. 4) and by a pairwise matrix between localities displayed as a heatmap of genetic differentiation based on FST (Fig. 5).
Figure 3. Discriminant analysis of principal components of golden perch in the LEB based on 5,648 SNPs. Sites are colour coded; labels as in Table 3 and Fig. 2. A marked distinction between western (sites 1-6) and
eastern (sites 7-14) catchment divisions of the LEB is evident; i.e. all individual fish sampled in western rivers can be assigned as being born in that region but not in the eastern rivers – and vice-versa. The two principal
components explain 91% of the total genetic variation (PC1: 86%; PC2: 5%).
Table 3. Summary of levels of genome-wide diversity in 225 individuals of golden perch representing 14 select localities in the LEB. Results are based on 5,648 high quality SNPs shared among all sampled localities.
Site Region Locality n n* π He % poly
1 Neales Steward, Algebuckina & Tardetakarinna WH 12 15 0.10 0.11 50
2 Warburton Koonchera WH 17 18 0.11 0.12 56
3 Warburton Koonchera WH 16 18 0.07 0.09 43
4 Diamantina Davenport Downs 18 19 0.08 0.09 51
5 Diamantina Nth Davenport Downs 18 19 0.12 0.14 59
6 Georgina Georgina 18 20 0.12 0.13 56
7 Cooper Lake Toontoowaranie & NW branch 9 9 0.11 0.12 53
8 Cooper Gidgealpa WH 13 18 0.10 0.13 59
9 Cooper Cullyamurra WH 13 13 0.07 0.08 37
10 Cooper Durham Downs 14 15 0.06 0.08 36
11 Cooper Currareva WH 20 20 0.09 0.10 55
12 Cooper Windorah & Hammond Downs 17 18 0.10 0.11 54
13 Thomson Noonbah 20 20 0.07 0.08 47
14 Barcoo Avington WH 20 20 0.08 0.09 49
n = number samples analysed per locality, π = nucleotide diversity, He = expected heterozygosity, % poly = % of polymorphic SNPs; *number individuals sequenced; 17 individuals were removed from analyses because they had >20% missing data.

Page 16 of 31
Figure 4. A neighbor-joining tree depicting the major pattern of genetic differentiation inferred for golden perch in the LEB based on 5,648 SNPs. Labels as in Table 3 and Fig. 2. The analysis splits golden perch from
western (Neales, Warburton, Diamantina and Georgina, sites 1-6) and eastern catchment divisions (Cooper, Thomson and Barcoo, sites 7 -14) into two separate groups with 100% bootstrap support.
Figure 5. Heat map representing levels of population genetic differentiation (based on the FST index estimated with 5,648 SNPs) between the 14 golden perch localities. Labels as in Table 3 and Fig. 2.
FST values in the matrix range from pale blue (i.e. the two sites belong to the same population) to red (i.e. each site belongs to a distinct population). Two examples of interpretation: this analysis shows effectively no
contemporary connectivity between locality 3 (Warburton) and localities 9 and 10 (Cooper). It also shows that locality 6 (Georgina) appears connected to localities 1 (Neales) and 2 (Warburton).

Page 17 of 31
Low to nil population genetic differentiation (i.e. high connectivity) within and between rivers of the same catchment division
In contrast to the genetic differences observed between different catchment divisions, all comparisons between localities within the same catchment division revealed low to nil genetic differentiation. This pattern was observed within both the western and the eastern catchment divisions. High population connectivity appears evident along the same river in the LEB, as is the case when comparing our various samples collected across the Cooper (localities 7 -12). Interestingly, we also disclosed high connectivity between distant localities found in different rivers, as long as they belong to the same catchment division. For instance, golden perch from the Georgina River (locality 6) appear highly connected to those from the Neales and Warburton Rivers (localities 1 and 2, respectively).
These results are well supported by all statistical analyses of population differentiation. For instance, the DAPC does not provide support for distinct groupings within each catchment division (Fig. 3), the neighbor-joining tree indicates only one major split separating the rivers into two groups, and all FST pairwise comparisons involving localities within the same division are zero or near zero, which indicates high gene flow and no population differentiation. No isolation by riverine distance in golden perch As expected based on the above results, no evidence for IBD (isolation by distance) was obtained within each catchment division (Fig. 6 B, P = 0.231; C, P = 0.393). The signal of IBD detected across the entire LEB (Fig. 6 A, P <0.001) is probably spurious due to the presence of two distinct population groups in the data (i.e. due to hierarchical differentiation). This possibility was assessed using a stratified Mantel test, in which samples were permutated within each of the two groups: this test provided no evidence for IBD in the LEB.
A B
C
Figure 6. Results of analyses of isolation by distance (IBD) for all localities (A), and separately for the eastern (B) and western (C) localities of golden perch. Correlation tests compared matrices of riverscape distance versus matrices of genetic distance between localities (details in the text).

Page 18 of 31
Hierarchy in the LEB: a simple model of catchment structure does not explain genetic differentiation
The results of hierarchical AMOVA (Table 4) support the previous analyses of population structure and provide statistical support for inferring hierarchical differentiation in LEB golden perch. The AMOVA shows that a much greater amount of genetic variation across the entire dataset is explained by differences between western and eastern catchment systems (14.2%), than by differences among localities within catchment systems (0.82%). As theoretically expected, the greatest amount of genetic variation was explained by differences among individuals (85%). Overall, this indicates that a simple model of catchment structure within a single river basin does not explain the pattern observed for golden perch in the LEB.
Table 4. Results of the hierarchical analysis of molecular variance (AMOVA) for the 14 localities of golden perch.
df Sum of Squares
Variance components
% of variation
P-value
Localities between western and eastern catchment divisions
1 9911.047 43.148 14.18 <0.001
Among localities within catchments 12 4062.759 2.507 0.82 <0.001 Within localities (i.e. among individuals) 436 112724.979 258.544 85 <0.001
Tests of selection detect putatively adaptive genetic variation in golden perch from the LEB
The tests of selection based on the hierarchical method identified 252 outlier SNPs out of the 5,648 SNPs (Fig. 7). These markers showed significantly different FST values compared to the simulated ‘neutral’ FST (false discovery rate = 0.01). The BAYESCAN method on the other hand suggested 298 outlier SNPs (results not shown). The number of outlier SNPs commonly identified across both approaches was 169 (3% of the entire SNP dataset). Markers identified as outliers in two independent analyses are unlikely to represent type I errors. Therefore, we consider these 169 SNPs as strong candidates for loci under selection in relation to environmental variability across the LEB. These SNPs are expected to be located in regions of the genome that are associated with adaptive (i.e. ecologically relevant) traits. All results described below are based on these 169 SNPs only, with the other 5,479 ‘neutral’ SNPs not included in these analyses.
Figure 7. Candidate outlier SNPs under selection in LEB golden perch loci identified based on a hierarchical test in ARLEQUIN 3.5. The x-axis is heterozygosity and the y-axis is population differentiation (FST). The black
dots represent neutrally evolving SNPs, whereas the red dots exceeded the 99th quantile and therefore represent candidate ‘outlier SNPs’ under divergent selection. Also shown in red are SNPs with very low FST
that likely represent markers under balancing selection (not targeted in this study).

Page 19 of 31
Levels of adaptive diversity differ remarkably between western and eastern golden perch
Surprisingly, estimates of adaptive genetic diversity based on the candidate dataset varied remarkably between samples from the two catchment divisions. The average heterozygosity of the western population group was almost five times higher than that of the eastern population group (He=0.38 vs. 0.078, respectively). Similarly, percentage of polymorphic SNPs and nucleotide diversity were both much higher in western than in eastern golden perch (Table 5; Wilcoxon-sign ranked test P <0.01 for all comparisons).
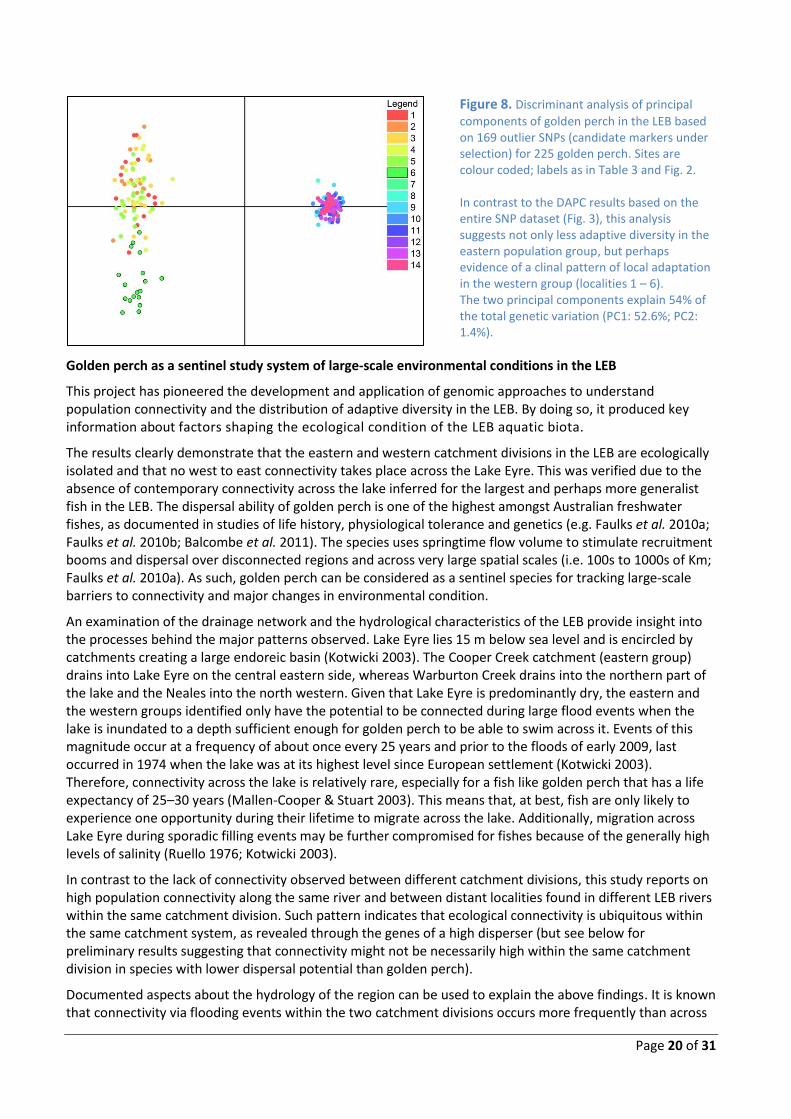
This pattern is unexpected considering the minor differences in genome-wide diversity between these populations estimated with the entire SNP dataset (Table 3). On the other hand, these results indicate greater adaptive resilience in the western population group, as demonstrated by their higher diversity in gene regions potentially associated with ecologically relevant traits. Interestingly, the DAPC results based on the adaptive SNPs also disclosed contrasting patterns, with a likely clinal pattern of local adaptation in the western but not in the eastern group (Fig. 9). Overall, our results suggest that dramatically different selective environments exist across the LEB. We propose, as a working hypothesis, that the more arid conditions in the west show greater efficiency in driving the selection of more diverse genotypes and the formation of steeper spatial gradients of localised adaptive diversity than conditions in the eastern LEB.
Table 5. Summary of levels of potentially adaptive genetic diversity based on 169 outlier SNPs (candidate markers under selection) for 225 golden perch. Highlighted are the diversity values found in the western population group.
Site Region Site π He % poly
1 Neales Steward, Algebuckina & Tardetakarinna WH 0.36 0.39 96 2 Warburton Koonchera WH 0.36 0.39 98 3 Warburton Koonchera WH 0.32 0.38 96 4 Diamantina Davenport Downs 0.34 0.39 98 5 Diamantina Nth Davenport Downs 0.34 0.38 98 6 Georgina Georgina 0.31 0.37 95 7 Cooper Lake Toontoowaranie & NW branch 0.08 0.08 31 8 Cooper Gidgealpa WH 0.06 0.07 31 9 Cooper Cullyamurra WH 0.08 0.09 38 10 Cooper Durham Downs 0.06 0.07 32 11 Cooper Currareva WH 0.08 0.08 42 12 Cooper Windorah & Hammond Downs 0.07 0.08 37 13 Thomson Noonbah 0.07 0.08 38 14 Barcoo Avington WH 0.07 0.08 41
π = nucleotide diversity, He = expected heterozygosity, % poly = % of polymorphic SNPs.
Page 20 of 31
Figure 8. Discriminant analysis of principal
components of golden perch in the LEB based on 169 outlier SNPs (candidate markers under selection) for 225 golden perch. Sites are colour coded; labels as in Table 3 and Fig. 2. In contrast to the DAPC results based on the entire SNP dataset (Fig. 3), this analysis suggests not only less adaptive diversity in the eastern population group, but perhaps evidence of a clinal pattern of local adaptation in the western group (localities 1 – 6). The two principal components explain 54% of the total genetic variation (PC1: 52.6%; PC2: 1.4%).
Golden perch as a sentinel study system of large-scale environmental conditions in the LEB
This project has pioneered the development and application of genomic approaches to understand population connectivity and the distribution of adaptive diversity in the LEB. By doing so, it produced key information about factors shaping the ecological condition of the LEB aquatic biota.
The results clearly demonstrate that the eastern and western catchment divisions in the LEB are ecologically isolated and that no west to east connectivity takes place across the Lake Eyre. This was verified due to the absence of contemporary connectivity across the lake inferred for the largest and perhaps more generalist fish in the LEB. The dispersal ability of golden perch is one of the highest amongst Australian freshwater fishes, as documented in studies of life history, physiological tolerance and genetics (e.g. Faulks et al. 2010a; Faulks et al. 2010b; Balcombe et al. 2011). The species uses springtime flow volume to stimulate recruitment booms and dispersal over disconnected regions and across very large spatial scales (i.e. 100s to 1000s of Km; Faulks et al. 2010a). As such, golden perch can be considered as a sentinel species for tracking large-scale barriers to connectivity and major changes in environmental condition.
An examination of the drainage network and the hydrological characteristics of the LEB provide insight into the processes behind the major patterns observed. Lake Eyre lies 15 m below sea level and is encircled by catchments creating a large endoreic basin (Kotwicki 2003). The Cooper Creek catchment (eastern group) drains into Lake Eyre on the central eastern side, whereas Warburton Creek drains into the northern part of the lake and the Neales into the north western. Given that Lake Eyre is predominantly dry, the eastern and the western groups identified only have the potential to be connected during large flood events when the lake is inundated to a depth sufficient enough for golden perch to be able to swim across it. Events of this magnitude occur at a frequency of about once every 25 years and prior to the floods of early 2009, last occurred in 1974 when the lake was at its highest level since European settlement (Kotwicki 2003). Therefore, connectivity across the lake is relatively rare, especially for a fish like golden perch that has a life expectancy of 25–30 years (Mallen-Cooper & Stuart 2003). This means that, at best, fish are only likely to experience one opportunity during their lifetime to migrate across the lake. Additionally, migration across Lake Eyre during sporadic filling events may be further compromised for fishes because of the generally high levels of salinity (Ruello 1976; Kotwicki 2003).
In contrast to the lack of connectivity observed between different catchment divisions, this study reports on high population connectivity along the same river and between distant localities found in different LEB rivers within the same catchment division. Such pattern indicates that ecological connectivity is ubiquitous within the same catchment system, as revealed through the genes of a high disperser (but see below for preliminary results suggesting that connectivity might not be necessarily high within the same catchment division in species with lower dispersal potential than golden perch).
Documented aspects about the hydrology of the region can be used to explain the above findings. It is known that connectivity via flooding events within the two catchment divisions occurs more frequently than across

Page 21 of 31
the two systems. Annual seasonal flows can connect waterholes within a reach and major flooding events within the catchments generally occur once a decade (Kotwicki 2003), facilitating the upstream migration of fish into isolated waterholes in the upper reaches of catchments. This would explain the high connectivity observed between the Neales and Georgina Rivers.
Integrating population genomics and spatial mapping of hydrological variation in the LEB
Results provided by our task subproject were analytically integrated with GIS databases and spatial approaches developed by Task 3a (“Development of integrated spatial indicators of condition for Lake Eyre Basin at multiple scales”). That integration is discussed in detail in the Task 3a final report. Below we briefly illustrate two specific examples of how integrating spatial and population genomic datasets can improve interpretation of project findings: one relates to identifying a hydrological barrier for connectivity between western and eastern catchment divisions; the other about understanding connectivity via flooding events within a catchment division.
The work conducted in Task 3a mapped flow paths using WOfS (Water Observations from Space) and compared characteristics of landscape function with genetic patterns in golden perch (this task) using temporal greenness classes (details in Task 3a final report).
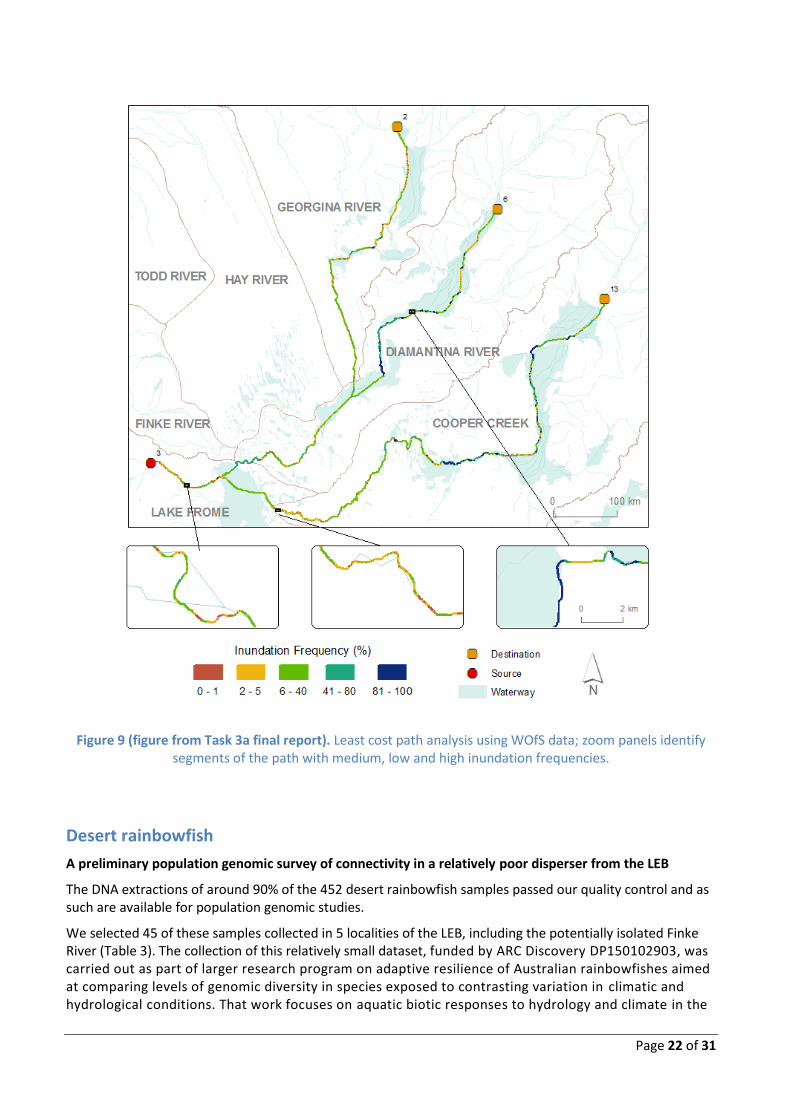
One of the mapping outcomes is shown below (Fig. 9). The central zoom panel shows a potential hydrological barrier for genetic connectivity located between the western and eastern catchment divisions. This region has had very low inundation frequency over a 25-year period (1987 – 2011), which potentially accounts for the major genetic differentiation observed in our study. Their mapping of inundation frequency in the LEB also provides evidence for seasonal flows within and between catchment divisions (e.g. right zoom panel and entire Fig. 9) that underpin patterns of high population connectivity detected in our subproject.
Page 22 of 31
Figure 9 (figure from Task 3a final report). Least cost path analysis using WOfS data; zoom panels identify segments of the path with medium, low and high inundation frequencies.
Desert rainbowfish
A preliminary population genomic survey of connectivity in a relatively poor disperser from the LEB
The DNA extractions of around 90% of the 452 desert rainbowfish samples passed our quality control and as such are available for population genomic studies.
We selected 45 of these samples collected in 5 localities of the LEB, including the potentially isolated Finke River (Table 3). The collection of this relatively small dataset, funded by ARC Discovery DP150102903, was carried out as part of larger research program on adaptive resilience of Australian rainbowfishes aimed at comparing levels of genomic diversity in species exposed to contrasting variation in climatic and hydrological conditions. That work focuses on aquatic biotic responses to hydrology and climate in the

Page 23 of 31
MDB and in eastern coastal basins of Australia, and to a lesser extent in the LEB. The inclusion of this preliminary desert rainbowfish genomic dataset in this report enabled comparisons of realised connectivity between LEB species with contrasting life-history strategies and dispersal capacities.
Figure 10. Desert rainbowfish (male) Melanotaenia spendida tatei. Photo credit: Peter Unmack.
Figure 11. The 5 localities of desert rainbowfish from the LEB used for genomic analysis (details in Table 6). Moderate to high genetic diversity in desert rainbowfish from the LEB; low diversity in the Finke River
The ddRAD-seq protocol was successfully implemented for the desert rainbowfish. We collected ~200,000 DNA sequences for 45 individuals in 5 of the 29 localities sampled for desert rainbowfish. We characterised 39,013 DNA markers based on these samples in the form of SNPs. The preliminary results here are based on our best quality 11,429 SNPs.
Levels of genome-wide diversity in desert rainbowfish from the LEB ranged from high to moderate (Table 6), except for the sample from the Finke River (Northern Territory; western LEB). Although genetic diversity
1
2
3
4
5

Page 24 of 31
varied moderately among locations, the small sample used for some localities (n = 5) precludes inferences about differences in population sizes across the basin. Nonetheless, it is apparent from these dataset that desert rainbowfish from the Finke River show remarkably low genetic diversity, a result that could be attributed to the impact of genetic drift (i.e. random fluctuations in genetic diversity due to chance events during reproduction), which might have reduced population genetic diversity in this isolated river system.
Table 6. Summary of levels of genome-wide diversity in 45 individuals of desert rainbowfish representing 5 select LEB localities. Results are based on 11,429 high quality SNPs shared among all sampled localities.
Site Region Locality n π He % poly
1 Finke Snake Hole 5 0.07 0.08 19
2 Macumba Eringa Waterhole 5 0.18 0.20 49 3 Neales Algebuckina Waterhole 5 0.16 0.18 45 4 Cooper Cuttapirra Waterhole 15 0.17 0.20 73 5 Cooper Narie Waterhole 15 0.12 0.20 63
n = number samples analysed, π = nucleotide diversity, He = expected heterozygosity, % poly = % of polymorphic SNPs
High levels of population genetic differentiation among rivers (except between Macumba and Neales); no differentiation within the same river
High to very high levels of population differentiation were observed in desert rainbowfish found in different rivers; except for samples from the Macumba and Neales (localities 2 and 3), which show high connectivity. These results indicate high genetic structure (i.e. low to nil contemporary connectivity) between most river populations of desert rainbowfish. In contrast to the differences observed between rivers, comparisons within the Cooper (localities 4 and 5) revealed nil genetic differentiation and high population connectivity, a result consistent with patterns observed for golden perch. These inferences are statistically supported by the DAPC (Fig. 12) and by the heatmap of population genetic differentiation based on FST (Fig. 13).
Figure 12. Discriminant analysis of principal
components of desert rainbowfish in select localities of the LEB based on 11,429 SNPs for 45 individuals. Sites are colour coded; labels as in Table 6 and Fig. 11. The two principal components explain 100% of variation (PC1: 87%, PC2: 13%).
The Finke River, a largely isolated hydrological system in the LEB?
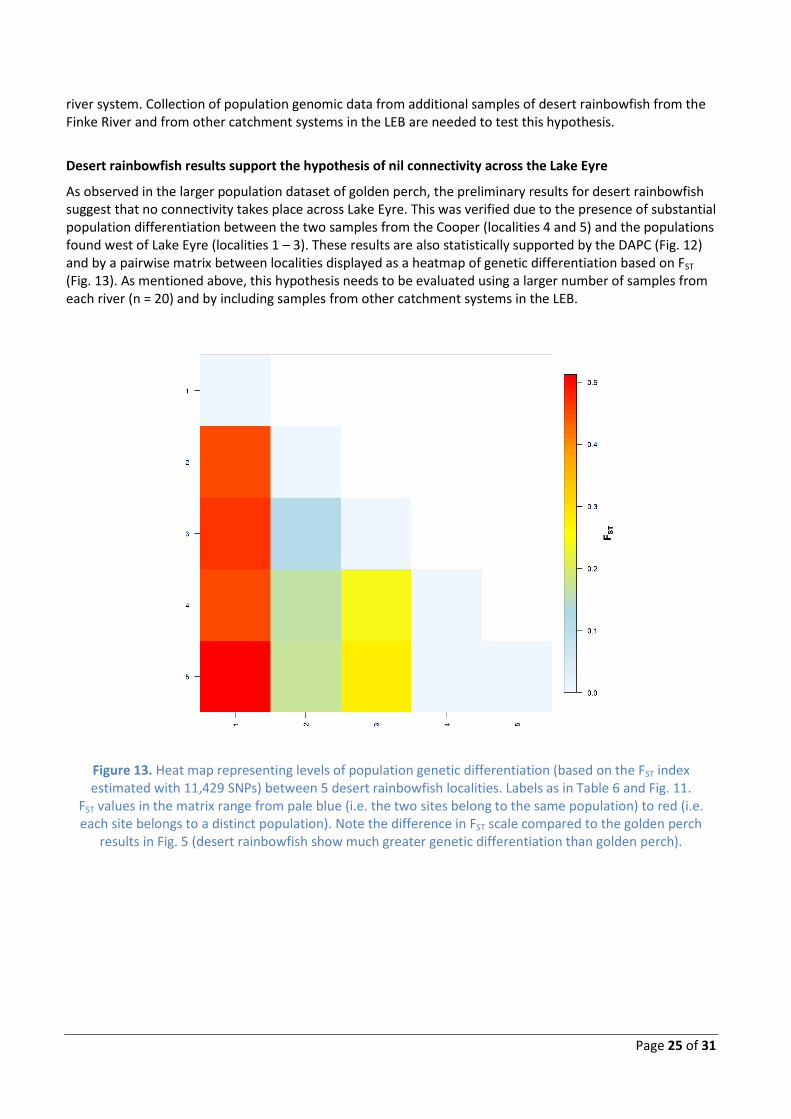
Particularly remarkable was the distinction between the Finke and all other riverine samples of desert rainbowfish. Population comparisons with the Finke sample resulted in FST values of around 0.5 or 50% (Fig. 13) – such high values are normally found between highly isolated populations or even when comparing population samples between different species of freshwater fishes (e.g. Beheregaray et al. 2002). This finding is consistent with the low genetic diversity found in the Finke (Table 6) and with the hypothesis that genetic drift due to geographic and perhaps hydrological isolation has driven population divergence in this peripheral
Page 25 of 31
river system. Collection of population genomic data from additional samples of desert rainbowfish from the Finke River and from other catchment systems in the LEB are needed to test this hypothesis.
Desert rainbowfish results support the hypothesis of nil connectivity across the Lake Eyre
As observed in the larger population dataset of golden perch, the preliminary results for desert rainbowfish suggest that no connectivity takes place across Lake Eyre. This was verified due to the presence of substantial population differentiation between the two samples from the Cooper (localities 4 and 5) and the populations found west of Lake Eyre (localities 1 – 3). These results are also statistically supported by the DAPC (Fig. 12) and by a pairwise matrix between localities displayed as a heatmap of genetic differentiation based on FST (Fig. 13). As mentioned above, this hypothesis needs to be evaluated using a larger number of samples from each river (n = 20) and by including samples from other catchment systems in the LEB.
Figure 13. Heat map representing levels of population genetic differentiation (based on the FST index estimated with 11,429 SNPs) between 5 desert rainbowfish localities. Labels as in Table 6 and Fig. 11.
FST values in the matrix range from pale blue (i.e. the two sites belong to the same population) to red (i.e. each site belongs to a distinct population). Note the difference in FST scale compared to the golden perch
results in Fig. 5 (desert rainbowfish show much greater genetic differentiation than golden perch).

Page 26 of 31
Conclusions
Genomic indicators of population connectivity and adaptive diversity to inform o n the ecological condition of the LEB biota were generated and analysed for two fish species with contrasting hydrological requirements and dispersal capacity, the golden perch (a migratory large-sized species) and the desert rainbowfish (a non-migratory small-sized species);
Samples were amassed for 385 individual golden perch collected from 24 LEB localities and 452 individual desert rainbowfish collected from 29 LEB localities;
DNA extractions were performed for all 837 samples; around 90% of the samples showed the quality and quantity required for genomic analysis and are now available for population genomic studies;
Protocols for a next-generation DNA sequencing method (ddRAD-seq) were optimised and successfully implemented for both the golden perch and the desert rainbowfish;
Approximately 2.1 billion DNA sequences were generated for 242 golden perch collected from across the LEB. The sequences were used to characterise 29,008 DNA markers in the form of SNPs. These SNPs provide an extremely powerful dataset for a range of ecological, evolutionary and conservation management studies. To the best of our knowledge, this major resource represents the largest population genomic dataset for a LEB species;
For desert rainbowfish, a smaller dataset of 200,000 sequences were generated for 45 individuals from the LEB. The sequences were used to characterise 11,429 SNP markers;
Levels of genetic diversity in LEB golden perch were lower than those found for golden perch in other river basins (e.g. MDB), suggesting that the persistence of this migratory species in the LEB is due to the contribution of a relatively small number of individuals found in key riverine locations;
Golden perch from ‘western’ catchment divisions (Diamantina, Georgina, Neales and Warburton Rivers) have higher levels of genetic diversity, and theoretically larger effective population sizes, than golden perch from the ‘eastern’ catchment divisions (Cooper, Thomson and Barcoo Rivers);
Levels of genome-wide diversity in LEB desert rainbowfish were generally high, except for the Finke River population which had much lower diversity potentially due to its geographic isolation;
Golden perch from western catchment divisions are not connected to those from the eastern catchment divisions; these two populations show high levels of genetic differentiation;
In contrast to the above results, high levels of connectivity were found within both the western and the eastern catchment divisions. High contemporary connectivity is evident along the same river, but also between distant localities found in different rivers – as long as the rivers belong to the same catchment division;
Desert rainbowfish showed nil connectivity across different rivers; except for samples from the Macumba and Neales, which show high connectivity. Particularly remarkable was the very high distinction between the Finke and all other riverine samples, which is consistent with the hypothesis that genetic drift due to geographic (and perhaps hydrological isolation) has driven population divergence in this peripheral river system;
Golden perch are structured hierarchically in the LEB, with genetic differentiation better explained by differences between the two major catchment divisions (western versus eastern). On the other hand, geographic or riverscape distance between localities does not explain the patterns observed;
The genomic results matched the general predictions based on life-history attributes of the two species: the larger migratory golden perch showed comparatively greater connectivity than the smaller non-migratory desert rainbowfish;

Page 27 of 31
For golden perch, a subset of 169 SNPs were identified as strong candidate of markers under selection in relation to environmental variability across the LEB. These SNPs are expected to be located in regions of the genome that are associated with adaptive (i.e. ecologically relevant) traits;
Analyses of the SNPs under selection indicated greater adaptive resilience in the western population of golden perch. The results suggest that substantially different selective environments exist across the LEB. Our working hypothesis is that the greater aridity and environmental instability in the western LEB has driven the selection of more diverse genotypes and the formation of steeper spatial gradients of localised adaptive diversity;
The overall results demonstrated that the eastern and western catchment divisions in the LEB are isolated. No west - east or east - west connectivity takes place across the Lake Eyre;
An examination of the drainage network and the hydrological characteristics of the LEB provided insights into the processes behind the major patterns detected with the genomic data. In addition, by collaborating with researchers from Task 3a, we demonstrated the value of integrating population genomics and spatial mapping of hydrological variation to explain patterns underpinning environmental condition in the LEB.
Future directions
The generation and analysis of population genomic data for the available samples of desert rainbowfish would provide an extremely informative comparative dataset for the LEB project, and potentially, for other Goyder research initiatives. That dataset could be readily contrasted with the large golden perch genomic dataset generated here to advance our understanding of environmental condition in the LEB. Specifically, this would enable powerful comparative surveys that explore natural replicates of the adaptation process: comparisons of distantly related lineages in shared environments. These surveys should provide robust contexts to disclose adaptations to hydrological variability and increase power to detect indicators of environmental condition in the LEB;
Further integrative analyses using recent developments in spatial modeling and population genomic datasets (e.g. the golden perch dataset) are needed. This integration provides an environmental angle to disclose associations between landscape features, hydrological variation and ecological processes. Specifically, GIS datasets can be used to characterise environmental heterogeneity and this can be statistically compared with spatially-explicit modeling and simulation approaches in population genomics (for an example see integrated framework described in Beheregaray et al. 2015).

Page 28 of 31
References
Allendorf FW, Hohenlohe PA, Luikart G (2010) Genomics and the future of conservation genetics. Nature Reviews Genetics 11, 697-709.
Balcombe SR, Arthington AH (2009) Temporal changes in fish abundance in response to hydrological variability in a dryland floodplain river. Marine and Freshwater Research 60, 146–159.
Balcombe SR, Sheldon F, Capon SJ, Bond NR, Hadwen WL, Marsh N, Bernays SJ (2011) Climate-change threats to native fish in degraded rivers and floodplains of the Murray–Darling Basin, Australia. Marine and Freshwater Research 62, 1099–1114.
Beheregaray LB, Cooke GM, Chao NL, Landguth EL (2015) Ecological speciation in the tropics: insights from comparative genetic studies in Amazonia. Frontiers in Genetics 5, 477.
Beheregaray LB, Sunnucks P, Briscoe DA (2002) A rapid fish radiation associated with the last sea level changes in southern Brazil: the silverside Odontesthes perugiae complex. Proceedings of the Royal Society of London B 269, 65-73.
Catchen JM, Amores A, Hohenlohe P, Cresko W, Postlethwait JH (2011) Stacks: building and genotyping loci de novo from short-read sequences. Genes, Genomes, Genetics. 1, 171-187.
Clarke K, Raja Segaran R, White D, Lewis MM (2015) Spatial Indicators of Ecological Condition for Lake Eyre Basin Task 3a “Development of integrated spatial indicators of condition for Lake Eyre Basin at multiple scales”.
Excoffier L, Lischer HEL (2010) Arlequin suite ver 3.5: a new series of programs to perform population genetics analyses under Linux and Windows. Molecular Ecology Resources 10, 564-567.
Faulks LK, Gilligan DM, Beheregaray LB (2010a) Islands of water in a sea of dry land: hydrological regime predicts genetic diversity and dispersal in a widespread fish from Australia’s arid zone, the golden perch (Macquaria ambigua). Molecular Ecology 19, 4723-4737
Faulks LK, Gilligan DM, Beheregaray LB (2010b) Clarifying an ambiguous evolutionary history: range-wide phylogeography of an Australian freshwater fish, Golden Perch (Macquaria ambigua). Journal of Biogeography 37, 1329–1340.
Foll, M, O Gaggiotti (2008) A genome-scan method to identify selected loci appropriate for both dominant and codominant markers: a Bayesian perspective. Genetics 180, 977–993.
Frankham R (1995). Effective population size/adult population size ratios in wildlife: a review. Genetical Research 66, 95-107.
Hoffmann AA, Willi Y (2008) Detecting genetic responses to environmental change. Nature Reviews Genetics 9, 421-432.
Hoffmann AA, Sgro CM (2011) Climate change and evolutionary adaptation. Nature 470, 479–485
Jombart T, Ahmed I (2011) Adegenet 1.3-1: new tools for the analysis of genome-wide SNP data. Bioinformatics. 27, 3070-3071.
Kotwicki V (2003) Floods of Lake Eyre.k26 Group Pty Ltd, Queensland, Australia.
Losos JB, Arnold SJ, Bejerano G, Brodie ED III, Hibbett D, et al. (2013) Evolutionary Biology for the 21st Century. PLoS Biology 11, e1001466.
Mallen-Cooper M, Stuart IG (2003) Age, growth and non-flood recruitment of two potamodromous fishes in a large semiarid ⁄ temperate river system. River Research and Applications 19, 697–719.
Mardis ER (2008) Next-generation DNA sequencing methods. Annual Review of Genomics and Human Genetics 9, 387–402.

Page 29 of 31
Meirmans PG, Van Tienderen PH (2004) GENOTYPE and GENODIVE: two programs for the analysis of genetic diversity of asexual organisms. Molecular Ecology Notes 4, 792-794.
Ruello NV (1976) Observations on some massive fish kills in Lake Eyre. Australian Journal of Marine and Freshwater Research 27, 667–672.
Spielman D, Brook BW, R Frankham (2004) Most species are not driven to extinction before genetic factors impact them. PNAS 42, 15261-15264.
Stein JL, Hutchison MF, Stein JA (2009) Development of a Continent-Wide Spatial Framework for the Ecohydrological Classification. Australian National University, Canberra, Australia.
Tamura K, Stecher G, Peterson D, Filipski A, Kumar S (2013) MEGA6: Molecular Evolutionary Genetics Analysis Version 6.0. Molecular Biology and Evolution 30, 2725-2729.

Page 30 of 31
Appendices Appendix 1
Minimum pairwise riverscape distances between golden perch localities in km, assuming no waterways are dry. Localities 2 and 3 are combined as they are the same site. Labels as in Table 3.
1 2&3 4 5 6 7 8 9 10 11 12 13 14
1 0 2&3 677 0 4 1020 411 0 5 1198 589 181 0 6 1215 730 1073 1251 0 7 1054 1181 1525 1703 1720 0 8 898 1025 1369 1547 1564 252 0 9 1014 1142 1485 1663 1680 144 212 0 10 1204 1332 1675 1853 1870 334 402 190 0 11 1439 1566 1910 2088 2104 568 636 425 235 0 12 1453 1581 1925 2103 2119 583 651 440 250 24 0 13 1595 1723 2066 2245 2261 725 793 581 392 156 148 0 14 1757 1885 2228 2407 2423 887 955 743 554 326 310 404 0
Appendix 2
Probability values of pairwise comparisons between localities of golden perch estimated by FST based on 5,648 SNPs. Labels as in Table 3.
1 2 3 4 5 6 7 8 9 10 11 12 13 14
1 2 0.045 3 0.003 0.167 4 0.007 0.907 0.660 5 0.013 0.143 <0.001 <0.001 6 <0.001 <0.001 <0.001 <0.001 0.021 7 <0.001 <0.001 <0.001 <0.001 <0.001 <0.001 8 <0.001 <0.001 <0.001 <0.001 <0.001 <0.001 0.170 9 <0.001 <0.001 <0.001 <0.001 <0.001 <0.001 <0.001 <0.001 10 <0.001 <0.001 <0.001 <0.001 <0.001 <0.001 0.004 <0.001 0.202 11 <0.001 <0.001 <0.001 <0.001 <0.001 <0.001 0.195 <0.001 0.085 0.516 12 <0.001 <0.001 <0.001 <0.001 <0.001 <0.001 0.554 0.001 <0.001 0.006 0.268 13 <0.001 <0.001 <0.001 <0.001 <0.001 <0.001 0.011 <0.001 0.020 0.002 0.895 <0.001 14 <0.001 <0.001 <0.001 <0.001 <0.001 <0.001 0.288 <0.001 0.001 0.004 0.333 0.004 0.847

Page 31 of 31
The Goyder Institute for Water Research is a partnership between the South Australian Government through the
Department of Environment, Water and Natural Resources, CSIRO, Flinders University, the University of Adelaide and the University of South Australia.