developing bond markets in asia: motivation, obstacles and achievements so far
TRANSCRIPT

Developing Bond Markets in Asia: Developing Bond Markets in Asia: Motivation, Obstacles and Motivation, Obstacles and
Achievements So FarAchievements So Far
OutlineOutline
• Motivation to develop bond markets
• Recent developments in the region
• Hong Kong’s experience
• Lessons and impediments

What motivates the authorities What motivates the authorities in the region to develop their in the region to develop their
local bond markets?local bond markets?
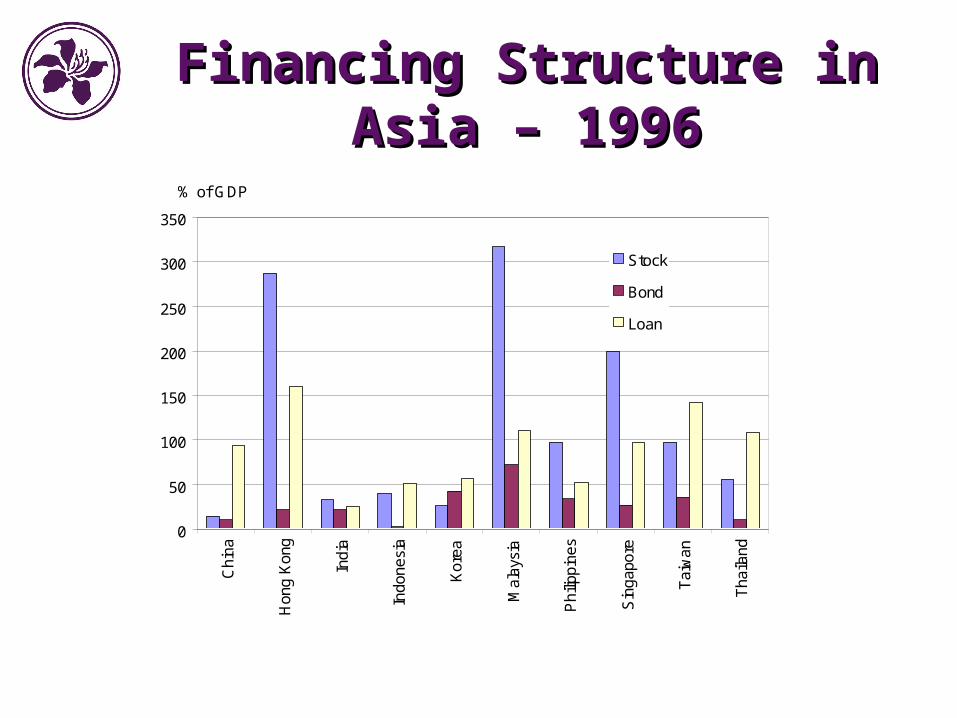
Financing Structure in Asia – 1996Financing Structure in Asia – 1996
0
50
100
150
200
250
300
350
Chi
na
H
ong
Kon
g
In
dia
In
done
sia
K
orea
M
alay
sia
P
hilip
pine
s
S
inga
pore
T
aiw
an
T
haila
nd
Stock
Bond
Loan
% of GDP

Motivation of the AuthoritiesMotivation of the Authorities
• Lessons from the Asia financial crisis
– Currency and maturity mismatches
– Prone to sudden capital reversal
• To foster financial stability
– As back-up facilities
– Diversity in financial intermediation

The Role of the StateThe Role of the State
• A multifaceted role:– Investor protection– Innovation– Provision of market infrastructure
• Positive non-interventionism– Facilitating, not forcing!

What has happened in the region What has happened in the region and what have the authorities and what have the authorities
done since the Asia crisis?done since the Asia crisis?
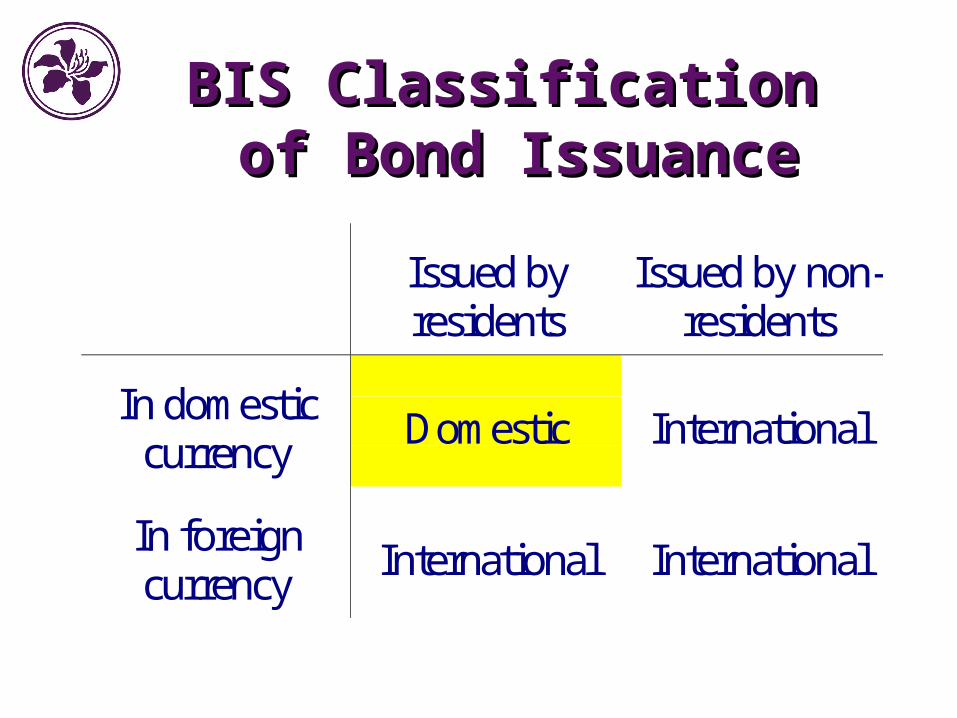
BIS Classification BIS Classification of Bond Issuanceof Bond Issuance
Issued byresidents
Issued by non-residents
In domesticcurrency
Domestic International
In foreigncurrency
International International
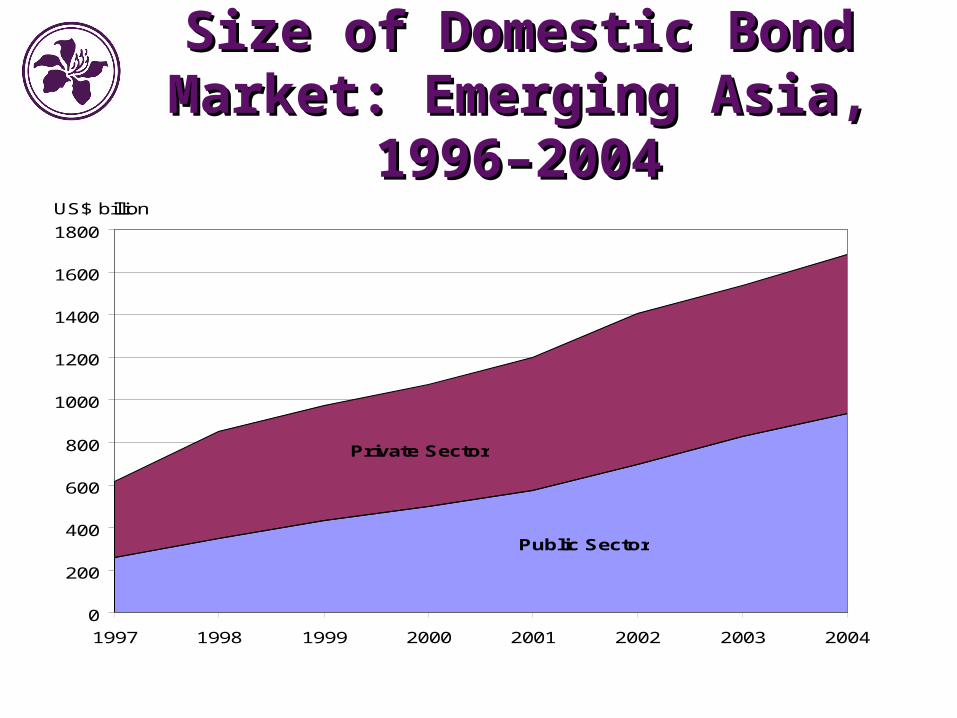
Size of Domestic Bond Market: Size of Domestic Bond Market: Emerging Asia, 1996–2004Emerging Asia, 1996–2004
0
200
400
600
800
1000
1200
1400
1600
1800
1997 1998 1999 2000 2001 2002 2003 2004
Private Sector
Public Sector
US$ billion

Structure of Asian Structure of Asian Bond Market (end-2004)Bond Market (end-2004)
CountryTotal bond outstanding US$, bn % US$, bn % US$, bn % US$, bn %
China 521.2 320.7 61.5 163.6 31.4 12.2 2.3 24.7 4.7Hong Kong 99.3 15.6 15.7 24.3 24.5 5.3 5.3 54.1 54.5India 226.8 216.6 95.5 1.1 0.5 2.5 1.1 6.6 2.9Indonesia 63.6 47.1 74.1 2.7 4.2 3.5 5.5 10.3 16.2Korea 565.3 146.7 26.0 194.0 34.3 150.2 26.6 74.4 13.2Malaysia 135.3 45.2 33.4 16.4 12.1 45.0 33.3 28.7 21.2Philippines 55.0 26.7 48.5 0.1 0.2 0.0 0.0 28.2 51.3Singapore 93.9 41.4 44.1 16.1 17.1 5.3 5.6 31.1 33.1Taiwan 198.9 85.3 42.9 29.6 14.9 59.5 29.9 24.5 12.3Thailand 72.1 34.5 47.9 7.2 10.0 20.3 28.2 10.1 14.0Subtotal 2,031.4 979.8 48.2 455.1 22.4 303.8 15.0 292.7 14.4
Source: Bank for International Settlement.
Domestic InternationalGovernment Financial Institutions Corporate

Growth in Government BondsGrowth in Government Bonds
• Regular issuance programmes
• Benchmark yield curves
• Improving market infrastructure
• The need to finance infrastructure investment

Government InitiativesGovernment Initiatives
• Domestic development– Relaxing investment restrictions
• Regional cooperation – APEC Initiative on the Development of Securitisation
and Credit Guarantee Markets
– Asian Bond Market Initiative (ABMI)
– Asian Bond Fund (ABF)
– Infrastructure initiatives

The Asian Bond FundThe Asian Bond Fund
• An EMEAP initiative
• ABF1 (2003)– Closed-end: confined to investment of the central banks
only
– USD-denominated sovereign and quasi sovereign bonds in the region
• ABF2 (2005)– Open to private sector investors
– Domestic currency-denominated bonds in the region

The Hong Kong experienceThe Hong Kong experience

OverviewOverview
• Bond market development is high on the policy agenda– streamlining issuance procedures
– tax concessions
– improving infrastructure
• Rapid growth over the past decade– Outstanding HK$-denominated bond reaching US$80
billion at end-2004
– Almost 50% of GDP

Growth of Hong Kong Dollar Growth of Hong Kong Dollar Bond MarketBond Market
0
10
20
30
40
50
60
70
80
1991 1992 1993 1994 1995 1996 1997 1998 1999 2000 2001 2002 2003 2004
US$, bn
0
10
20
30
40
50
60%
Others (lhs)
Public sector (lhs)
Total outstanding as a %of GDP (rhs)
Sources: HKMA and HK Census and Statistics Department.

Growth By IssuerGrowth By Issuer
Source: HKMA.
0
10
20
30
40
50
60
70
80
90
1997 1998 1999 2000 2001 2002 2003 2004
0
10
20
30
40
50
60
70
80
90US$, bn US$, bn
Non-MDB overseas
MDBs
Banks
Local Corporates
Exchange Funds
Government and statutory bodies
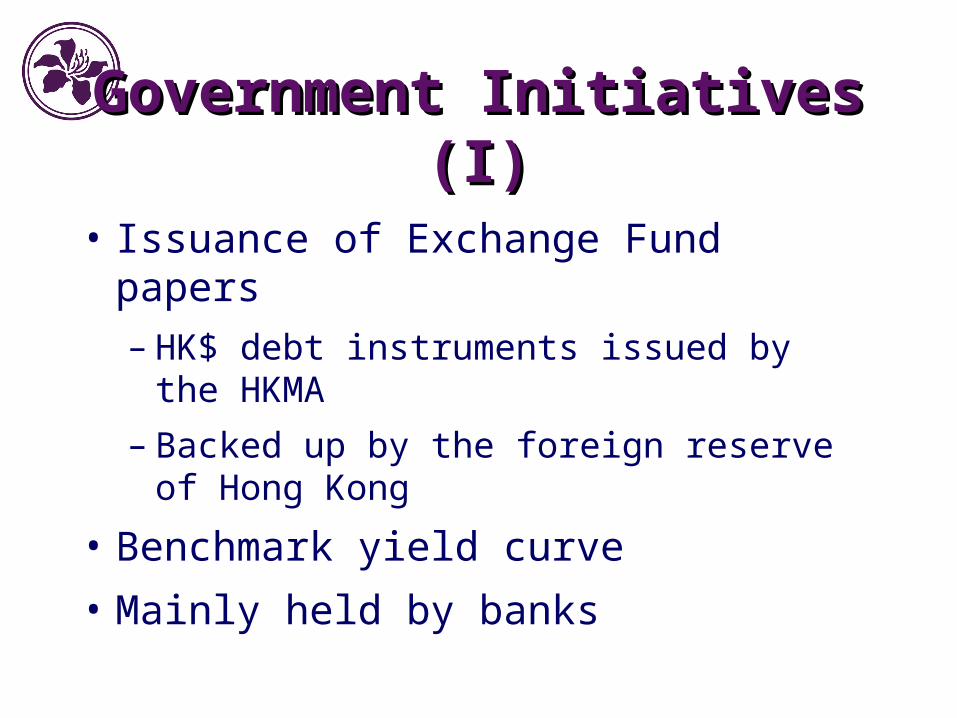
Government Initiatives (I)Government Initiatives (I)
• Issuance of Exchange Fund papers
– HK$ debt instruments issued by the HKMA
– Backed up by the foreign reserve of Hong Kong
• Benchmark yield curve
• Mainly held by banks

Government Initiatives (II)Government Initiatives (II)
• Government bond issuance– first global bond offering in 2004
• Securitised bond– The Hong Kong SAR Government
– Hong Kong Mortgage Corporation
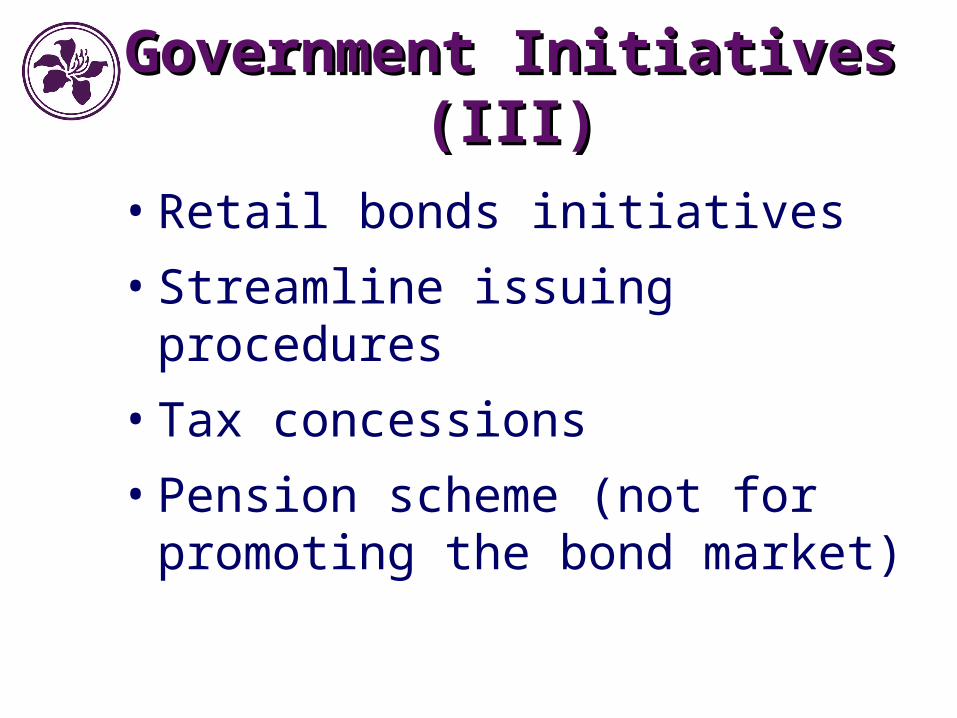
Government Initiatives (III)Government Initiatives (III)
• Retail bonds initiatives
• Streamline issuing procedures
• Tax concessions
• Pension scheme (not for promoting the bond market)
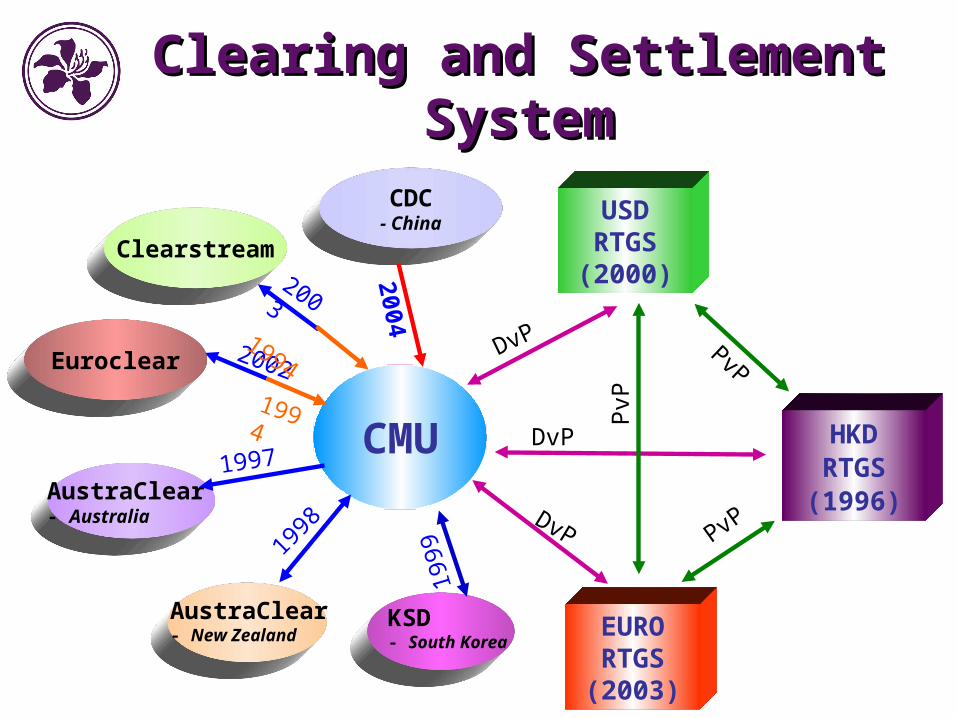
Clearing and Settlement SystemClearing and Settlement System
USDRTGS(2000)
DvP
CMU HKDRTGS(1996)
Clearstream
AustraClear- Australia
AustraClear- New Zealand EURO
RTGS(2003)
DvP
KSD- South Korea
PvP
PvP
PvP
DvP
Euroclear
2003
2002
1997
1998
1999
1994
1994
CDC- China
2004

After all these…After all these…

Market Composition:Market Composition: Pre-Crisis and Now Pre-Crisis and Now
100 80 60 40 20 0% of GDP
1996
0 20 40 60 80 100
Average
Indonesia
Hong Kong
Mainland
Philippines
India
Thailand
Singapore
Taiwan
Korea
Malaysia
Public
Private
% of GDP
2004

Comparing the Financing Structure: Comparing the Financing Structure: Emerging Asia vs. Advanced EconomiesEmerging Asia vs. Advanced Economies
0
20
40
60
80
100
120
140
160
Euro area UnitedKingdom
UnitedStates
J apan Non-J apanAsia
% of GDP
0
20
40
60
80
100
120
140
160
% of GDP
Bank loans Stock market capitalisation
0
20
40
60
80
100
120
140
160
Euro area UnitedKingdom
UnitedStates
J apan Non-J apanAsia
% of GDP
0
20
40
60
80
100
120
140
160
% of GDP
Bond market (public) Bond market (private)
1996 2004

Lessons and impediments: Lessons and impediments: anything we can do?anything we can do?
More Work to Do?More Work to Do?
• Macroeconomic policies
• Government bonds
• Banking sector soundness
• Corporate governance
• Regulatory framework
• Tax treatment / incentives
• Investor base
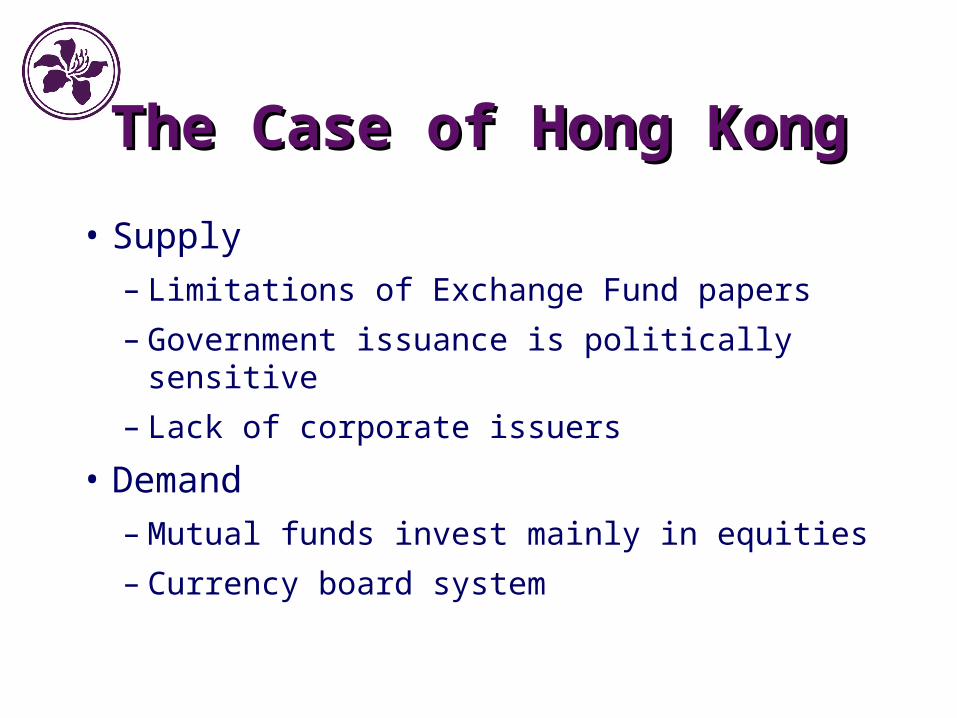
The Case of Hong KongThe Case of Hong Kong
• Supply
– Limitations of Exchange Fund papers
– Government issuance is politically sensitive
– Lack of corporate issuers
• Demand
– Mutual funds invest mainly in equities
– Currency board system

Retail Demand for BondsRetail Demand for Bonds
• Transaction cost is high for individuals
• Increased competition between banks made deposits fiercely competitive
• Attraction is mainly on medium term papers
• There is more interest in holding bonds via other investment vehicles
• Any more room for ABF2-typed initiatives?
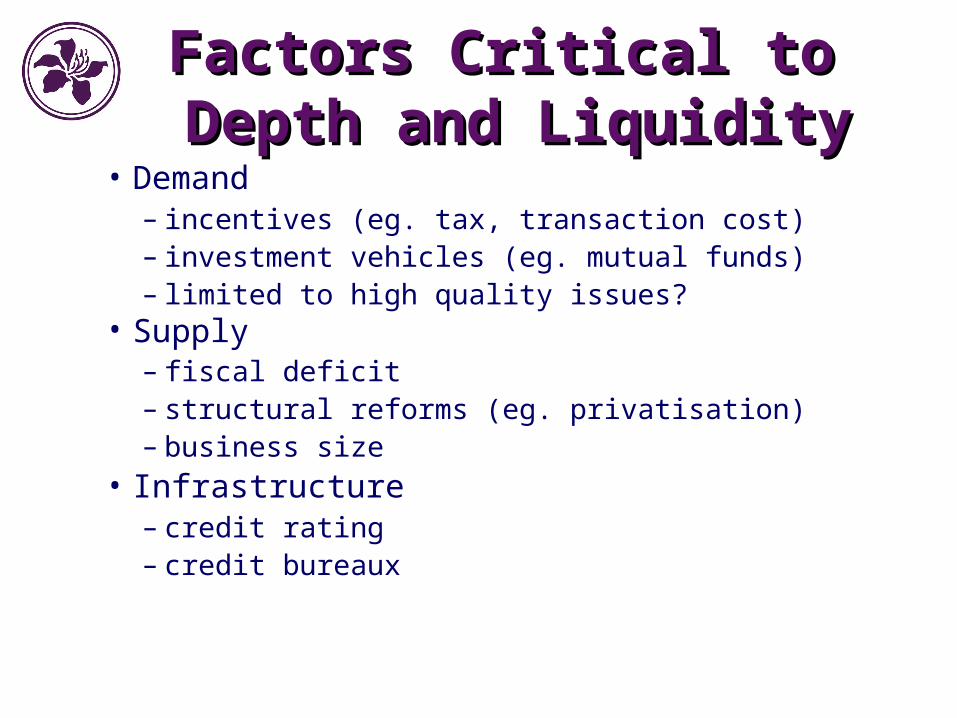
Factors Critical to Factors Critical to Depth and LiquidityDepth and Liquidity
• Demand– incentives (eg. tax, transaction cost)– investment vehicles (eg. mutual funds)– limited to high quality issues?
• Supply– fiscal deficit– structural reforms (eg. privatisation)– business size
• Infrastructure– credit rating– credit bureaux
ConclusionConclusion
• The Asian Bond market has grown steadily since crisis
• Structure of financing still tilted towards loans
• Scope for improvements