developing decision support tools for the … · the implementation of bicycle and pedestrian...
TRANSCRIPT

DEVELOPING DECISION SUPPORT TOOLS FOR
THE IMPLEMENTATION OF BICYCLE AND
PEDESTRIAN SAFETY STRATEGIES
Deo Chimba, PhD., P.E., PTOEAssociate Professor
Civil Engineering DepartmentTennessee State University
3500 John A. Merritt Blvd, Nashville, TN 37209Phone: 615-963-5430
Email: [email protected]

STATEMENT OF THE PROBLEM• Tennessee Department of Transportation (TDOT) has an extensive road safety audit program which uses criteria based on the ratio of crashes to average daily traffic but does not target locations with a high number of bike/pedestrians crashes since there are no bicycle and pedestrian counts.
• A robust methodology is not currently available to identify bicycle and pedestrian high-crash locations in Tennessee.
• The challenge is allocating funds, from TDOT’s Highway Safety Improvement Program (HSIP), equitably among rural and urban areas in a way that is most effective at reducing bicycle and pedestrian fatalities and incapacitating injuries.

Research Questions?
Are there spatial variations in pedestrianand bicycle crashes?
How do spatial variations in pedestrian andbicycle crashes associate withsocioeconomic and demographic factors?
What framework can be adopted toimplement bicycle and pedestrian safetystrategies?

Develop Data-Driven Policy Framework Develop criteria and conditions for the systematic identification of
bicycle and pedestrian high-crash locations in the state.
These criteria will rate each crash-prone location based on injuries and
fatalities, coupled with exposure.
Develop a systematic framework and rating system for future years’ so
that the analysis can be replicated in the future with less effort.
Prioritize funding for improvements. To support the development of a
data-driven draft policy for prioritizing and maximizing the effectiveness
of HSIP fund allocation.
The policy framework will be developed with the support of TDOT staff.
This policy framework will direct current and future decision makers at
TDOT and other agencies in the prioritization of funding.

Study ApproachDeveloped a framework to identify bicycle and pedestrian high crash locations for
safety improvement prioritization focusing on Population, Demographic and Socioeconomic Spectra in Tennessee
Research approach comprised in-depth analysis using a combination of existing data, literature review, GIS, cluster analysis, and advanced statistical modeling to examine and identify bicycle and pedestrian high-crash locations.
Relevant data from each of the selected study locations was integrated into a Geographic Information System (GIS).
The data included crashes, roadway geometry, population, demographics and economic, and traffic.
The study used the gathered data and information to develop safety performance functions (SPF) to identify magnitude and characteristics of variables associated with pedestrian and bicycle safety hazardous locations (black spots).
From the SPF, the research developed tool to evaluate the expected number of crashes at block and county levels for given set of population, demographics and socioeconomic data in Tennessee

Data
Three types of data were used;
Crash data
Socioeconomic data
Demographic data

TDOT Crash Database-TRIMS

Socioeconomic and Demographic data
TIGER Products
( Topologically Integrated Geographic Encoding and Referencing)
https://www.census.gov/geo/maps-data/data/tiger-data.html

Data
• Obtained from TDOT traffic crash database
• 5 years 2008-2012 data: 5,845 pedestrian crash records
• 5 years 2008-2012 data: 2,185 bicycle crash records
Crash data
• US census bureau,2006-2010 America Community Survey
• Block group data for Tennessee
• Income, Car ownership, poverty status, Transport mode to work
Socioeconomic data
• US census bureau,2006-2010 America Community Survey
• Block group data for Tennessee
• Population counts, age , race
Demographic data

Crash Data StatisticsYear of Crash Pedestrian Bicyclist
2008 1091 450
2009 1101 405
2010 1185 385
2011 1241 487
2012 1227 458
Grand Total 5845 2185
Type of Crash Pedestrian Bicyclist
Fatal 389 33
Incapacitating Injury 1109 279
Non- Incapacitating Injury 4051 1603
Prop Damage (over) 118 115
Prop Damage (under) 178 155
Grand Total 5845 2185

Spatial distribution of crashes

Variable Mean Std. Dev. Min Max
Population density (1000 per sq. Mile) 1.62 2.53 0.00 89.44
Population below 15 years of age (%) 19.02 7.76 0.00 59.33
Population from 15 to 64 years of age (%) 66.98 8.36 11.80 100.00
Population commuting to work by private cars (%) 95.84 5.81 0.00 100.00
Population commuting to work by walking (%) 0.83 2.89 0.00 100.00
Median household income ("000" $) 45.42 24.35 0.00 247.36
Housing units with no vehicles (%) 6.94 9.47 0.00 83.97

Cluster Analysis

Cluster Analysis

Where are high risk census block groups?

High crash census block groups High crash census block groups

Where are these clusters?

The process of Pedestrian/Bicycle-vehicle crashes


Developing Safety Performance Functions (SPFs)
• For crash data the mean ≠ Variance
• VAR (𝑦𝑖) > E (𝑦𝑖) — Overdispersion
• α is the overdispersion factor
• µ is the mean of crashes
𝒚𝒊 number of crashes occurring in a certain period
at a site i
𝝀𝒊 is the Poisson parameter for site i, which is
equal to site expected number of crashes at a
period, E (𝑦𝑖). Poisson assumes the mean =Variance
Negative Binomial
Poisson

What are the associated factors-Block Group?
Variable Coefficient Z p-value
Population density (1000 per sq. mile) 0.117 7.77 0.000
Population below 15 years of age (%) -0.008 -2.08 0.037
Population from 15 to 64 years of age (%) 0.014 3.76 0.000
Population commuting to work by private cars (%) -0.038 -7.12 0.000
Population commuting to work by walking (%) 0.0298 2.34 0.019
Median household income ("000" $) -0.0108 -7.34 0.000
Housing units with no vehicles (%) 0.0308 8.86 0.000
Constant -4.4198 -7.14 0.000
Population Exposure
alpha 1.586

What are the associated factors-County?
Variable Coefficient z P-value
Population below 15 years of age (%) -0.0281 -0.91 0.362
Population from 15 to 64 years of age (%) 0.0231 0.91 0.364
Population of White (%) -0.0461 -2.08 0.038
Population of African American (%) -0.0368 -1.6 0.109
Population of Hispanic (%) 0.0546 1.64 0.101
Population commuting to work by private cars (%) -0.0705 -1.13 0.257
Population commuting to work by walking (%) -0.2909 -1.64 0.102
Median household income ("000" $) -0.0025 -1.91 0.056
Housing units with no vehicles (%) 0.0848 2.37 0.018
Constant 1.9170 0.3 0.768
Population Exposure
alpha 0.11

Developed Crash Prediction Model (SPF)
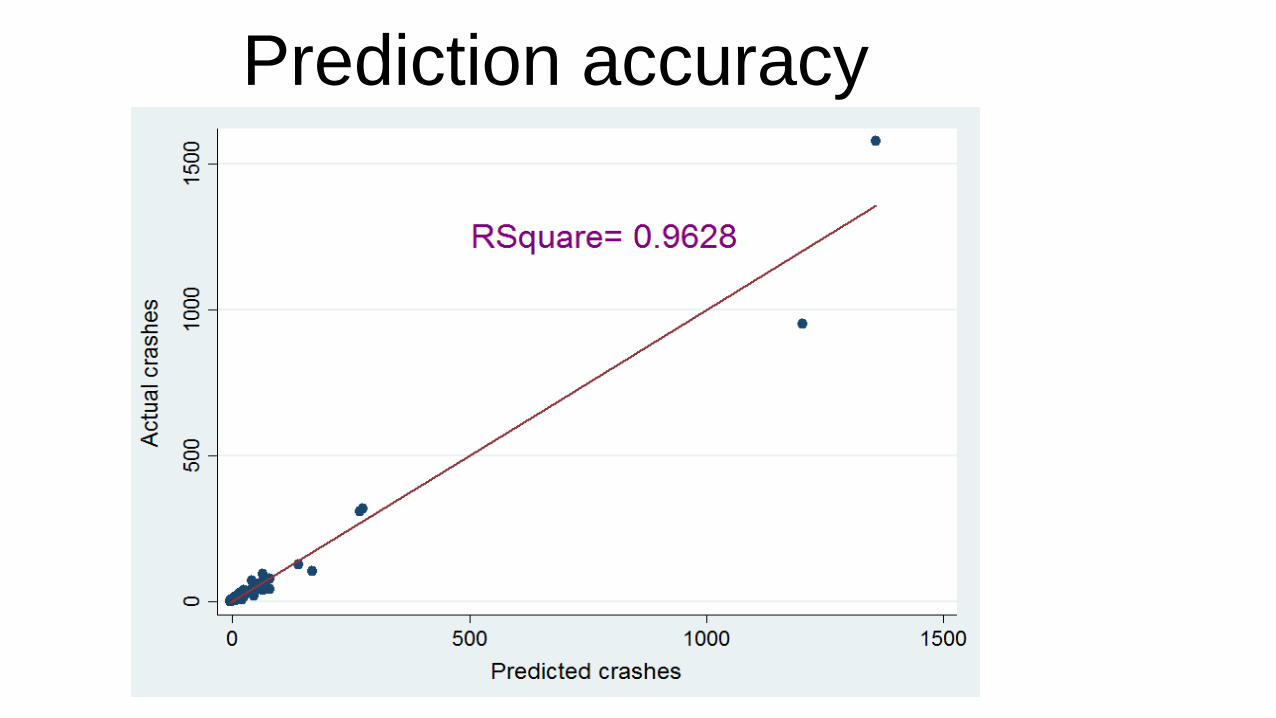
Prediction accuracy

Integrating SPFs with Access Database
• User friendly: Unlike crash prediction models that are expressed in form of complicated equations and time consuming; this tool simplifies this process.
• It is built in form of a database: With huge amounts of data now available, local and national agencies are now building their database.
• It helps users to gain more insight into the relationships between crashes and sociodemographic factors by varying the values of contributing factors.

Flow Chart of the Decision Support Tool

Interface of Decision Support system


Let’s look at it
..\TOOL\Decision Support Tool.accdb
Applications?

DeliverablesConference proceedings and presentations
1. Musinguzi, A and Chimba, D. “Spatial variation in local road pedestrian and bicycle crashes”. Presented and published in proceedings of ESRI International User annual Conference, San Diego, CA, 7/21/2015.
2. Musinguzi, A and Chimba, D. “Using Spatial Statistical Tools to correlate Bicycle and Pedestrian Crashes with Socio- demographics”. Presented at “TSU 37th Annual University-Wide Research Symposium, 2015; 4/2/2015”
3. Musinguzi, A and Chimba, D. “Bayesian logistic regression analysis of socioeconomic and demographic factors and pedestrian crash counts”. Presented at “ Southern District ITE Annual Meeting, MS, 4/19/ 2015”
4. Kidando, E, Musinguzi, A and Chimba, D. “Bayesian hierarchical analysis of pedestrian crashes and socio-demographic factors” Presented at the 2nd Summer Conference on Livable Communities, Kalamazoo, MI, 7/23/2015. Award of best Student poster presentation
5. Musinguzi, A and Chimba, D. “An Access-Based Decision Support Tool for Assessing Bicycle and Pedestrian Safety”. Presented at “TSU 38th Annual University-Wide Research Symposium, 2016
Papers under peer review
7. Musinguzi , A and Chimba D. “Using kernel density to evaluate dependence of pedestrian crashes on demographic and socioeconomic factors”.
8. Musinguzi, A and Chimba, D “Adaptive neuro-fuzzy inference system (ANFIS) approach for pedestrian injury analysis”.
9. Musinguzi, A, Chimba, D and Kidando, E. “A Regression-Bayesian network hybrid approach for pedestrian injury analysis”.