developing oral reading fluency among hispanic high school
TRANSCRIPT

APPROVED: Kathleen A.J. Mohr, Major Professor Scott Warren, Minor Professor Carol Wickstrom, Committee Member Margaret Compton, Committee Member Nancy Nelson, Chair of the Department of
Teacher Education and Administration Jerry Thomas, Dean of the College of
Education Mark Wardell, Dean of the Toulouse Graduate
School
DEVELOPING ORAL READING FLUENCY AMONG HISPANIC HIGH SCHOOL
ENGLISH-LANGUAGE LEARNERS: AN INTERVENTION USING SPEECH
RECOGNITION SOFTWARE
Russell Ruffu, B.A., M.Ed.
Dissertation Prepared for the Degree of
DOCTOR OF EDUCATION
UNIVERSITY OF NORTH TEXAS
August 2012

Ruffu, Russell. Developing Oral Reading Fluency Among Hispanic High School
English-Language Learners: An Intervention Using Speech Recognition Software. Doctor
of Education (Reading), August 2012, 149 pp., 19 tables, 26 illustrations, references, 90
titles.
This study investigated oral reading fluency development among Hispanic high
school English-language learners. Participants included 11 males and 9 females from first-
year, second-year, and third-year English language arts classes. The pre-post experimental
study, which was conducted during a four-week ESL summer program, included a
treatment and a control group. The treatment group received a combination of components,
including modified repeated reading with self-voice listening and oral dictation output from
a speech recognition program. Each day, students performed a series of tasks, including
dictation of part of the previous day’s passage; listening to and silently reading a new
passage; dictating and correcting individual sentences from the new passage in the speech
recognition environment; dictating the new passage as a whole without making corrections;
and finally, listening to their own voice from their recorded dictation. This sequence was
repeated in the subsequent sessions. Thus, this intervention was a technology-enhanced
variation of repeated reading with a pronunciation dictation segment.
Research questions focused on improvements in oral reading accuracy and rate,
facility with the application, student perceptions toward the technology for reading, and the
reliability of the speech recognition program. The treatment group improved oral reading
accuracy by 50%, retained and transferred pronunciation of 55% of new vocabulary, and
increased oral reading rate 16 words-correct-per-minute. Students used the intervention
independently after three sessions. This independence may have contributed to students’
self-efficacy as they perceived improvements in their pronunciation, reading in general, and

reported an increased liking of school. Students initially had a very positive perception
toward using the technology for reading, but this perception decreased over the four weeks
from 2.7 to 2.4 on a 3 point scale. The speech recognition program was reliable 94% of the
time. The combination of the summer school program and intervention component stacking
supported students’ gains in oral reading fluency, suggesting that further study into
applications of the intervention is warranted.
Acceleration of oral reading skills and vocabulary acquisition for ELLs contributes
to closing the reading gap between ELLs and native-English speakers. Fluent oral reading
is strongly correlated with reading comprehension, and reading comprehension is essential
for ELLs to be successful in school. Literacy support tools such as this intervention can
play a role in ameliorating English acquisition faster than the rate attained through
traditional practices.

ii
Copyright 2012
by
Russell Ruffu

iii
TABLE OF CONTENTS
Page
LIST OF TABLES. ............................................................................................................ vi LIST OF ILLUSTRATIONS ............................................................................................ vii INTRODUCTION ...............................................................................................................1
Significance of Study
Study Purpose
Study Hypotheses
Delimitations
Limitations
Terms and Definitions
Summary LITERATURE REVIEW ..................................................................................................14
Dual Coding Theory
Information Processing Theory
Common Underlying Proficiency
Language Models and Speech Recognition
Studies of Computer-Assisted Reading Development
Summary INSTRUCTIONAL DESIGN ............................................................................................40
Methodology
Accuracy Training with DNS
Basic Speech Recognition Training
Basic Speech Recognition Engineering
Initial DNS Accuracy and Rate Training
Information Processing and Internal Events
iv
Attribution and Self-Efficacy
Summary PROCEDURES..................................................................................................................55
Participants
Time-Frames and Session Labels
Intervention Procedures
Computer Setup and Software
School Campus Classroom
Oral Reading Fluency Measurement
Interrater Calibration
LMNOP Perception Assessment
Data Collection and Word Counts
Data Treatment RESULTS ..........................................................................................................................79
Hypotheses Testing
Oral Reading Fluency: Pre-Post Assessment
Oral Reading Accuracy
Software Accuracy
Student Assistance
Student Learning Perceptions
Summary DISCUSSION ..................................................................................................................120
Passage Selections and Readability Levels
Vocabulary Development
Speech Recognition Accuracy
Student Independence with Program Use
Perception Assessment
Future Research
Summary

v
APPENDIX: SUPPLEMENTAL TABLES ....................................................................135 REFERENCES ................................................................................................................142

vi
LIST OF TABLES
Page
3.1 Common Elements for Instructional Design...............................................................43
4.1 Assessment and Intervention Days with Time Allotments .........................................71
5.1 Group Divisions by Summer School Terms and Sub-Groups Analyzed ....................82
5.2 First Two Weeks, ORF Assessment Result ................................................................85
5.3 ORF Performance Values for the Short and Long group: First Two Weeks ..............87
5.4 ORF Assessment Scores: Long Control vs. Long Treatment: Four Weeks ...............89
5.5 Pre & Post Error Percentage & Lexile Levels by ELA Course: Short & Long ..........96
5.6 Passage WPM Mean Comparisons by Long, Short and Combined Groups ............101
5.7 DNS Word and Error Counts ....................................................................................109
5.8 Perception Assessment Means ..................................................................................110
5.9 Bivariate Correlations of Study Variables ................................................................113
5.10 Perception Assessment Responses: Long Group Changes, Weeks 1 through 4 ......116
5.11 Perception Assessment Means for Short Group: 2 Weeks ......................................117
A.1 Perception Assessment Responses: Long group Changes, Weeks 1 through 4 .......136
A.2 Perception Assessment for Short group: Two Weeks ..............................................137
A.3 Passage Selections for ELA I with Lexile Ratings (1) .............................................138
A.4 Passage Selections for ELA I with Lexile Ratings (2) .............................................139
A.5 Passage Selections for ELA II with Lexile Ratings (1) ...........................................140
A.6 Passage Selections for ELA II with Lexile Ratings (2) ...........................................141

vii
LIST OF ILLUSTRATIONS
Page
Figure 3.1. English sentences in the speech recognition environment ..............................44
Figure 3.2. Repeated listening-while-reading of sentence series ......................................45
Figure 3.3. Reading and correcting inaccurate speech ......................................................46
Figure 3.4. Mismatch between attempt and actual word ...................................................46
Figure 3.5. Highlighting the target error ...........................................................................46
Figure 3.6. Positive feedback between speech-to-text ......................................................47
Figure 3.7. Self-voice listening-while-reading the dictation .............................................48
Figure 4.1. Warm-up target text with dictation output ......................................................62
Figure 4.2. Paragraph division into sentences ...................................................................63
Figure 4.3. Target text with end-of-session dictation output.............................................64
Figure 4.4. Warm-up dictation selection and word count .................................................65
Figure 4.5. Speech recognition program voice commands ...............................................66
Figure 4.6. LMNOP perception assessment .....................................................................71
Figure 4.7. LMNOP session worksheet spreadsheet .........................................................75
Figure 4.8. Coding details for participant 101T ................................................................76
Figure 4.9. Summary details worksheet ...........................................................................77
Figure 5.1. Slope differences for short vs. long groups: first two weeks ..........................88
Figure 5.2. ORF performances, treatment and control for four weeks ..............................90
Figure 5.3 Accuracy error-percentages for warm-up and end-of-session dictations: four weeks..................................................................................................................................92
viii
Figure 5.4. Accuracy error percentages for warm-up and end-of-session dictations: short group ..................................................................................................................................95
Figure 5.5. ELA groups: error percentage vs. lexile levels, first two weeks ...................97
Figure 5.6. Oral reading accuracy error vs. lexile level: last two weeks .........................100
Figure 5.7. Wpm gains for first two weeks: short and long groups ...............................102
Figure 5.8. Warm-up dictation rates, short and long groups: first two weeks ...............103
Figure 5.9. Warm-up and end-of-session dictations: wpm gains for four weeks: long group ................................................................................................................................104
Figure 5.10. Accuracy vs. wpm: warm-up and end-of-session dictations: short and long groups ...............................................................................................................................106

1
INTRODUCTION
Over the past half-century, teaching English as a second language has remained
an urgent matter for economic, political, and social reasons. While there have been
successful endeavors with technology in literacy education since the early 1960s, such as
Omar Moore's autolectic voice-typewriter approach for teaching phonics and sight words
(Chall, 1967), or the Stanford computer-aided language instruction (CAI) project for
developing literacy skills (Atkinson & Hansen, 1966), the promise for second language
literacy acquisition through technology remains largely unfulfilled. As technology
evolves, educators continue to develop and refine processes, programs, and computer
applications for language learning while the need for competency in English continues to
expand around the world (Snyder & Joyce, 1998). Improvements in speech recognition
software over the past decade and successful applications in studies using speech
recognition for native language literacy signal that technology may have caught up with
the needs of the English language learner.
Computer applications for speech recognition software targeting many languages
exhibit remarkable advancements over the past decade and continue to be refined (Segura
et al., 2007). At present, these programs have robust markets in medical, legal, political,
commercial and other professional areas. Applications for second language learning are
growing as evidenced through uses in business-language schools, intensive post-
secondary programs, second-language programs, and uses for language-challenged
students exhibiting a variety of language disabilities such as dyslexia and deafness.

2
There is some mention of these technologies being applied in elementary and secondary
classrooms, but few empirical studies have been conducted in spite of the call for
research in this arena over the past decade (August, 2003; Goldenberg, 2008; National
Reading Panel, 2000; Poulsen, Hastings & Allbritton, 2007). The Report of the National
Reading Panel notes “Particularly striking in its absence is research on . . . the use of
computer technology to perform speech recognition. Although great strides have been
made…there have been no recent studies of speech recognition applied to reading
instruction…” (National Reading Panel, 2000, p. 6-2).
Significance of Study
Acceleration of literacy skills for English language learners (ELLs) is a concern
reflected in the extant literature (August & Shanahan, 2008; Goldenberg, 2008: Lesaux &
Geva, 2008). Oracy, vocabulary acquisition, and reading comprehension are three major
components of high interest to language and reading teachers, researchers, textbook
publishers, and policy makers. The achievement gap between native English speakers
and ELLs is large and persistent (Goldenberg, 2008). ELL dropout rates are high,
especially among the Latino population (Ochoa & Cadiero-Kaplan, 2004). Some
applications that are promising for native-English speakers appear in research related to
self-learning, assisted and repeated readings, and self-voice feedback, and such
instructional applications may facilitate acceleration of English literacy skills for ELLs.
Automatic speech recognition is an amenable environment for applying each of these
approaches as reflected in the research (Blok, Oostdam, Otter, & Overmaat, 2002; Kartal,
2006; McCleod, McMillan, & Norwich, 2007; Poulsen et al., 2007). However, the

3
effects of these applications on secondary ELLs have received very little attention, and
research on these effects is sorely needed.
English language learners (ELLs) are often limited in the time in which they
receive instructional support to become proficient in English—in some cases as little as
one year (e.g., California and Arizona). The urgency for speeding up the acquisition of
English literacy is clear (Goldenberg, 2008; Ochoa & Cadiero-Kaplan, 2004). Without
sufficient literacy skills in the mainstream classrooms, ELLs struggle and, far too often,
do not learn the core content nor the academic language needed to do well in school.
These students tend to fall behind their cohorts and ultimately drop-out of school (Ochoa
& Cadiero-Kaplan, 2004) at alarming rates. Ochoa and Cadiero-Kaplan report a 37.7%
drop-out rate for 1999, and Fry (2010) reports a 41% drop-out rate for Hispanics in 2008.
Oral reading fluency, or proficiency in accuracy and rate, and its relationship to
vocabulary development and reading comprehension has received a great deal of
attention and is well documented in the literature for elementary grade English speakers;
however, important aspects of accuracy and rate are not clearly understood for ELLs and
little research has been conducted on fluency among ELLs (August & Shanahan, 2008;
Geva & Zadeh, 2006; Goldenberg, 2008). Furthermore, the use of student voice in
instructional settings may be underutilized, yet its critical role in language acquisition is
evident in the literature and theoretical models (Adams, 1994; August & Shanahan, 2008;
Macleod et al., 2007; Poulsen et al., 2007; Sadoski & Pavio, 2004; Samuels, 1997).
Investigation into student-voice as a central element in English language attainment for
ELLs is sparse. The role that fluency has in the development of vocabulary, while clear

4
for native English speakers, needs to be better understood and applied in learning
environments to accelerate English acquisition among ELLs. The current study
investigates the effects of stacking the components of assisted and repeated readings,
self-regulated learning, and self-voice feedback within a speech recognition environment
to develop the fundamental skills of oral reading accuracy and rate.
Study Purpose
The use of computer aided instruction by some schools has accomplished
acceleration of literacy skills for some learners, but much more research in the effects of
technology integration is needed (Blok et al., 2002). The purpose of this study was to
investigate the acceleration effects on oral reading fluency using a combination of
technologies, labeled as LMNOP, for secondary ELLs. The aim of this study was multi-
faceted. First, it was designed to quantify the effect LMNOP had on accelerating oral
reading rates for ELL students. Secondly, it sought to determine the reliability of speech
recognition software in identifying pronunciation errors in comparison to human
evaluators (i.e., teachers). The third aim was to determine the efficacy of students in use
of the program. Fourthly, the study sought to identify students’ perceptions toward the
use of the technology, along with their perceptions and attitudes toward learning with the
program. Accordingly, the following research questions were examined.
R1: What is the effectiveness of LMNOP at increasing ELL participants’ oral reading accuracy over a four-week instructional period as assessed by curriculum-based measurement?
R2: What is the effectiveness of LMNOP at increasing ELL participants’ oral reading rate over a four-week instructional period as assessed by curriculum-based measurement?
5
R3 How accurate is current speech recognition software in identification of ELL utterances?
R4 How much human support is solicited by ELL participants using the LMNOP program over a four-week instructional period?
R5 In what ways do participant attitudes/perceptions change regarding reading and the use of the LMNOP program over a four-week instructional period?
Study Hypotheses
The following hypotheses were tested to provide evidence necessary to answer
the above research questions:
H1: ELL participants in English language-arts classes who receive LMNOP intervention will increase their oral reading fluency more over a four-week instructional period than participants in English language arts classes without this intervention.
H2: ELL participants in English language-arts classes who receive the LMNOP intervention will increase their oral reading accuracy over a four-week instructional period.
H3: ELL participants in English language-arts classes who receive the LMNOP intervention will increase their oral reading rate over a four-week instructional period.
H4: Speech recognition software word identification will correlate with human raters at a coefficient of r = .80 or higher after a four-week intervention using LMNOP.
H5: Solicitation for help from teaching assistants by ELL participants who receive the LMNOP intervention will decrease during the instructional period.
H6: The LMNOP program will have positive effects on participant perceptions of language learning, reading and practicing with the aid of technology.
Assumptions
Students selected for this study were assumed to be neurologically normal; that is,
to be of normal intelligence for the age group and not inhibited by learning disabilities.

6
While it might be of interest in future studies, the sample for this study excluded students
with known learning disabilities. It was also assumed that the majority of English words
in the selected reading passages could be accurately produced within a few computer
assisted training sessions. Because of the exploratory nature of the study, little
information was available for how much assistance students would require to produce
word accuracy for the initial training on the speech recognition program for the English
version. For example, according to Adamson (2004), there are some graphophonic
representations that English and Spanish do not share, such as /j/, /dg/, /sh/, /th/, and /z/.
Tutors/trainers were available to help maximize production accuracy, but it was assumed
that mastery of some words would lie beyond the more immediate abilities of some
students and keyed-in representations were constructed as an alternative in these
instances.
Delimitations
A brief assessment addressed changes in student perception/attitude with a
minimal number of statements pertaining to how students perceived the use of the
LMNOP program, and whether they recognized changes in their oral reading skills,
reading in general, and attitude toward school. The perception assessment was designed
as a quick self-report that should take less than a minute to complete. As such, the
statements were broad and did not seek responses into specific items such as perceptions
toward paralinguistic speech elements, or particular program navigation issues.
The selection of passages used in the intervention was based on the trade books
used in the summer school curriculum. The order of use in the intervention was

7
determined through random selection rather than a controlled sequence whereby
readability levels would be presented with increasing difficulty. Readability level is not
controlled sequentially in trade books, and there is wide variability in the readability
levels among the paragraphs of the books used in the ELA classes. Random selection of
the passages used in the intervention provides a more natural sequence and reduces the
effects that controlled readability levels might have on fluency development.
Limitations
The foremost limitation of the study was the sample size. While the study was
originally developed and approved by the school district to be composed of 50 or more
students who might participate during the Spring semester, circumstances beyond the
control of the researcher led to a more homogenous population in a remedial summer
school program. About 100 students were expected to enroll in the ESL summer school
program, and it was anticipated that at least 50 students would volunteer to participate in
the study. Due to changes in policy and enrollment in the summer program, only 20
students participated in this study.
A second limitation to the study was the limited amount of time available. The
original study was planned for six weeks, five days per week for 35 minutes each day.
The summer school program was four weeks long, four days per week. The teaching
staff did not feel they could afford to have their students out of class for more than 20
minutes; therefore, the daily time allotment for the study was 20 minutes. Furthermore,
the four-week summer school plan consisted of two two-week summer school sessions.
Eleven of the participating students attended summer school for the first two-week

8
session only, leaving only nine participants for the last two weeks of the study. The time
limitation also affected the study design. The focus of the study was on students’ oral
reading fluency more-so than comprehension. Because of the time limit, comprehension
of the oral readings was not measured, and time was used for the intervention and
assessments of fluency.
A third limitation to the study is that it used a commercially available speech
recognition program that, while effective, proved somewhat costly. Dragon Naturally
Speaking, v. 11 retailed at an electronics retail store for $200, but was purchased on sale
for $100. Site licenses are available through Nuance, but such licensing was not viable
for this study due to the uncertainty of the location of the study, control of computers, and
the normal restrictions of downloading software on school computers. These
circumstances were unique to this study, and might be circumvented in a more stable
environment, such as a teacher implementing a program in the classroom or school
environment. Other commercial speech recognition programs, as well as freeware, need
to be investigated for their effectiveness with the LMNOP program. It may be that open-
source speech recognition technologies could work as effectively, thus considerably
lowering the implementation costs.
Participants’ comfort and competency in using the computer may have had an
effect on the outcomes because attention was divided among literacy tasks that involved
language and technology. It was hoped that after a short amount of time working with
the technology that students would be accustomed to the changes technology brought to
the learning environment. This has been the case in several of the CAI/CALL studies

9
that reported on this issue (Hitchcock, Dorwick, & Prator, 2003; Poulsen et. al., 2007).
Novelty effects on the acquisition of newly encountered words have been related
to episodic memory, but semantic items are generally learned through familiarity gained
through multiple encounters rather single instance encounters (Logan, 1997). Logan
claims that automaticity, in LaBerge and Samuels’ (1974) terms of word recognition, is
“memory-based processing and automatization is a shift from algorithmic processing…to
memory retrieval,” and “automaticity can occur after a single trial” (p. 10). Automatic
word recognition after a single encounter with a novel word is possible if the word is
affiliated with the stimulus that was encountered during the episode. Most often,
however, memory of semantic items relates to familiarity and repeated encounters with
words rather than novelty (Logan, 1997). According to Poppenk, Kohler, and
Moscovitch (2010) memory of episodic, novel events is seldom associated with the
acquisition of new items (p. 1327). While it is a possibility that participants in the study
gained automaticity of new vocabulary during a single session, it is more likely that the
achievement was due to either the multiple readings called for in the intervention, or the
synergistic effects of component stacking (Mohr, Dixon & Young, 2012; Slavin &
Calderon, 2001).
Novelty effects are viewed in a different light regarding the use of unfamiliar or
new technology. Once new technology is no longer novel to the user, motivation to use
the technology tends to decline. Consequently, gains from the use of the technology can
also decline. Sokal and Katz (2008) report that “positive achievement effects of computer
use decline over time, suggesting a novelty effect” associated with reading (p. 84).

10
Poulsen et al. (2005) aver the possibility that after “the initial excitement of using the new
technology wears off…learning gains would fall off” (p. 212).
Terms and Definitions
• Acceleration of literacy skills: Increase of literacy skills manifested over time
from a known baseline trajectory. Baseline skills are manifested in the literacy tests
given at the beginning of the study. Acceleration of language skills is manifested in
effect size and in slope differentials between treatment and control groups, calculated by
statistical treatments, thus indicating the acceleration of the acquisition of the literacy
components investigated in the study.
• Computer-aided instruction (CAI): The use of a computer to facilitate
learning of any kind.
• Computer assisted language learning (CALL): The use of a computer
specifically to facilitate any language learning.
• Decoding: The processes required when a non-phonological stimulus, such as
a written word or picture, is converted to phonological input.
• Encoding: The processes required to perceive and understand the meaning of
phonological and non-phonological input and to change this stimulus into a form that can
be stored in the memory.
• English language learner (ELL): A student rated below “English proficient”
through normalized language proficiency tests or by an expert language proficiency
assessment committee.

11
• Fluency: The accurate, comprehensible pronunciation of words, phrases, and
sentences at a rate that maintains the integrity of speech. Oral reading fluency is typically
measured as the number of words read accurately within one minute, providing a words-
per-minute (wpm) rate.
• Literacy: A collection of cultural and communicative practices shared among
members of a particular group (National Council of Teachers of English, 2008).
• Oracy: The proficient ability to speak and listen in a language.
• Oral language proficiency: The combined proficiency of speaking and
listening with comprehension as measured in context-embedded environments.
• Orthography: A method of representing a language or the sounds of language
by written symbols.
• Phonological awareness: The ability to consciously attend to the sounds of
language as distinct from meaning (Lesaux et al., 2008, p. 29).
• Phonological processing: The ability to use the sounds of the language to
process oral and written language (Lesaux et al., 2008, p. 29).
• Phonological recoding: The processes required when a non-phonological
stimulus, such as a written word or picture, is converted to phonological output (Lesaux
et al., 2008, p. 30).
• Phonology: The ability to recognize and produce the sounds and sound
sequences that make up language (Lesaux et al., 2008, p. 29).
• Productive vocabulary: Vocabulary well known by a speaker and used in the
production of spoken or written text. This contrasts with receptive vocabulary, which is
12
vocabulary that is recognized when encountered but not used in language production
(Fox, 1987).
• Reading comprehension: Understanding of words, phrases, sentences, or
passages as measured through valid and reliable oral or written questioning, or retelling.
• Vocabulary acquisition: The fluent production of and surface-level
comprehension of previously unfamiliar words learned either directly through instruction
or incidentally through visual, phonatory, and auditory channels.
• Voice/speech recognition programs: Software programs developed to
recognize, record, print to screen, and play back an individual’s speech productions. This
is abbreviated as SR for speech recognition or ASR for automatic speech recognition in
the text of this document. The acronyms are interchangeable.
Summary
The literature suggests that many secondary ELL students are well behind their
English speaking cohorts in language and literacy development (Goldenberg, 2008;
Lesaux & Geva, 2008; Ochoa & Cadiero-Kaplan, 2004). Related literature voices a need
to accelerate ELLs’ phonology, vocabulary, and reading comprehension skills to help
reduce the persistent achievement gap between native-English speakers and ELLs.
Studies of these literacy components for native speakers provide insights that self-
modeling, assisted and repeated readings, and self-voice feedback can often overcome the
difficulties native speakers encounter while developing literacy skills (Ecalle, Magnan, &
Calmus, 2008; Hitchcock et al., 2003; Macleod et al., 2007; Poulsen et al., 2007;
Samuels, 1997; Stahl & Kuhn, 2002). Speech recognition programs have been found to

13
be useful platforms for implementing these instructional approaches (Cordier, 2006;
Husni & Jamaludin, 2009), and similar approaches applied to pedagogies directed
towards ELLs may be equally beneficial.
14
LITERATURE REVIEW
Literacy development for English language learners (ELLs) generally follows the
same processes as native English speakers (August & Shanahan, 2008; Goldenberg,
2008). Best practices for literacy development in general apply to ELLs as well.
Likewise, the underlying cognitive processes have been found to be generally the same
for primary language (L1) and second language (L2) learning. Learning to read precedes
reading to learn, and there is a consensus among many researchers that the bottom-up
processes described for L1 development involving phonemic and phonological
awareness, phonics, and vocabulary hold true for L2 as well (August & Shanahan, 2008;
Goldenberg, 2008). Goldenberg (2008) writes “the NLP [National Literacy Panel] found
that ELLs learning to read in English . . . benefit from explicit teaching of the
components of literacy, such as phonemic awareness, phonics, vocabulary,
comprehension, and writing” (p. 17). Additionally, many researchers believe the end-
goal of reading comprehension is derived using a bottom-up and top-down interactive
processing system, albeit with variations among the interactive theories (Adams, 2003;
Chall, 1983; Everson, 1998; Kyte & Johnson, 2006; Pikulski, 2005; Rumelhart, 1994;
Sadoski & Pavio, 2004).
Dual Coding Theory
Sadoski and Paivio’s (2004) dual coding theory (DCT) offers explanations of how
the components of reading interact and culminate in comprehension. The theory presents
two types of code used in processing input from the five senses: verbal and nonverbal.
15
The verbal code represents and processes language and the nonverbal code represents and
processes nonlinguistic objects and events. Each of these mental codes has subsets, or
modes. Sensory input — visual, auditory, or haptic — provide information that can be
coded in the subsets of verbal, nonverbal, or both representations. As an example, the
authors identify baseball bat as a visual representation as words, and in the nonverbal
form as imagery of a wooden or aluminum bat. The phonemes making up the phrase
baseball bat and the sounds remembered of a bat hitting an object are associated with the
phrase, which are the auditory representations for the example (Sadoski & Paivio, 2004,
p. 4).
Sadoski and Paivio (2004) identify the basic units in verbal codes as logogens,
and units in nonverbal codes as imagens. A logogen is “anything learned as a unit of
language in some sense modality . . . That is, a phoneme may be represented as a physical
articulation of the speech organs as well as an auditory sound” (p. 7). Imagens are
described as being “modality-specific and vary in size as well, and they tend to be
perceived in nested sets. That is, mental images are often embedded in larger mental
images” (p. 1332). Logogens and imagens can be activated through direct sensory input,
as through attending to print or by seeing objects. They can also be activated through
indirect means, such as when a word group is triggered by an encounter with bat, the
words baseball, helmet, uniform, and glove may be generated, which consequentially
activate sets of associated imagens. “Both bottom-up and top-down inputs can activate
mental representations in interactive ways” (p. 1333).
The processes of synthesizing sensory input is described in DCT at three levels:

16
representational, associative, and referential. The authors define representational
processing as the “initial activation of logogens or imagens” and point out that it is
“recognizing something as familiar” without regard to meaningful comprehension (p. 11).
Associative processing refers to an expansion of activation within the verbal, nonverbal
or both codes. Associative processing may or may not involve meaningful
comprehension. Activating an association between a logogen in its phonological
recoding form and its visual form (a word), for instance, may not involve meaning.
Associating the phonological recoding in the verbal code (a logogen) with an imagen
from the nonverbal code, however, does involve meaning. Referential processing is an
expansion of activation between verbal and nonverbal codes that produces meaningful
comprehension. For example, baseball bat may activate visual and auditory logogens that
activate word groups. At nearly the same time, these logogens activate nested sets of
imagens embedded in larger sets of imagens that may also become activated.
Information Processing Theory
The automatic information processing model developed by LaBerge and Samuels
(1974) presents a theory of the reading process in which lower-level reading skills
interact with the upper level reading skills. The notion of attention is a focal point in the
model. According to the authors, attention is limited but can be deftly controlled by the
individual. Executive functions at the individual’s internal control directs attention to
“solve the problem” required of the task. As suggested by Gagne, Briggs, and Wager
(1992) all learning is dependent on internally stored memory (p. 6), and LaBerge and
Samuels (1974) identify four component memories: visual, phonological, episodic, and
17
semantic to which control is directed. In reading, visual memory processing relates to
print. Phonological memory relates to “acoustic” (auditory) and “articulatory” (speech)
processing. Episodic memory “records contextual details pertaining to time and place”
and semantic memory is where “knowledge of all kinds is stored” (p. 824). During the
reading process, attention is switched among these memory centers as needed to gain
meaning from informational input.
Common Underlying Proficiency
The application of these models to ELLs’ cognitive processing in their L2 must
address the issues of which imagens and logogens are stored in memories. The nonverbal
codes for ELLs are the same, whether processing logogens in the L1 or L2, according to
Cummins (1991). Cummins argues that rather than developing separate underlying
proficiencies (SUP) for L1 and L2, there is a common underlying proficiency (CUP)
shared between the two languages. The common underlying proficiency can be viewed
in terms of Sadoski and Pavio’s (2004) verbal and nonverbal codes. The “common cross-
lingual proficiencies” (p. 25) referred to by Cummins correspond to imagens as well as
the units of language/logogens that have been shown to transfer between L1 and L2
(August, 2003; Cummins, 2005; Meirer, 2010). The common cross-lingual proficiencies
corresponding to the LaBerge and Samuels (1974) model are the contents held in
memory for visual, episodic, semantic, and phonological encoding. These can also be
viewed in terms of logogens and imagens. As ELLs attend to the various elements of
English, they draw from the stored memories of logogens and imagens activated by
written and oral language, along with associated images that become activated.

18
What happens when an ELL student encounters unfamiliar English text for which
there are no associative or referential values? That is, what happens when the ELL
student can articulate (recode) a word, but no connections exist for meaningful
comprehension? Where there is no phonological memory established, sounding the word
out contributes to forming a connection between the phonologic and orthographic/visual
representations, but contributes little to meaningful comprehension. Verbal
representations (without regard to meaningful comprehension) may be present, but the
nonverbal representative is missing. To complete a unit with comprehension, according
to DCT, at least one imagen often needs to be associated with the word.
Teachers who work with ELL students are encouraged to use visual aids and
bring in realia related to language and instructional content (Slavin, 1991). These are
examples that contribute to the consolidation of language through the development of
imagens. Teachers are also encouraged to point out cognates (words in different
languages of similar appearance or sound with similar meanings) to their students
(Rodriguez, 2001). Cognates directly connect to L1 and, therefore, connect the words to
the associated imagens in L1, as pointed to by Cummins (1991). Where these are
missing or infeasible due to instructional time constraints, the ancient, but still pervasive,
practice of translation can serve meaningful comprehension. However, as argued by
Sadowski and Pavio (2004) and further avowed by Gee (2004) and others, imagen
representations contribute more effectively to language acquisition than mere logogen
representations. It is through the well-established L1 where most imagens are developed
in the primary language for older students that connections to new learning and language

19
acquisition may be most fluently generated. The point here is that, as postulated by
Cummins (1991), input from an ELL’s L1 is considerable in the processes of attaining
L2, and such attainment essentially involves both verbal and nonverbal input.
Language Models and Speech Recognition
Hutchins (2007), Rumelhart (1994), Sadowski and Pavio (2004) and other noted
researchers have pointed out the relationship between the development of speech
recognition engines and language models. The history of the development of speech
recognition engines begins in the 1940s and is very complex and can be very technical.
Speech recognition engines have been developed in concert with computer technology
and linguistics experts (Hutchins, 2007). The products developed from these
cooperatives present cutting-edge opportunities for educators and researchers. Speech
recognition programs align closely with lower-level processing where clear articulation
of words is required and visual checks of the computer text output for accuracy are
needed. Articulation can be manifested, modified and measured through speech
recognition technologies. The above synopsis serves to state that a significant
relationship exists between linguistics, language models and speech recognition software.
Studies of Computer-Assisted Reading Development
Two studies from the 1960s previously discussed provide useful findings related
to computer assisted language learning (CALL). Both the Moore (Chall, 1967) and
Atkinson and Hansen (1966) studies demonstrated early-on the power of technology to
accelerate the acquisition of foundational components of reading with the advantage of
students working independently after initial training with the programs. While both of

20
these programs were discontinued because they were deemed impractical and relatively
expensive, the constructs that drove the studies remain and technological developments
over the past 45 years have not only resolved issues of expense, but have also generated
additional applications and cutting-edge refinements to the early visions.
Moore’s autoletic system for teaching phonics and sight words was highly
successful but considered eccentric and unnecessary for the population at the time, and it
was scuttled by traditional methods and expense (Chall, 1967). The system involved
children working on their own after brief initial instructions, discovering the alphabetic
principle by striking a key on an electric typewriter and receiving auditory feedback of
the sound of the letter, blend, or cluster. The discovery experience led to experimenting
with letter strings which produced recognizable words and developed into a list of sight
words for these students. A second stage of the system was conducted with the use of a
monitor and typewriter in which students were provided some structure that led to the
production of student-generated typewritten sentences and paragraphs. The process took
place over a period of a few weeks and is classified as student discovery learning and
self-teaching because the system employed only initial instructions of what to do on the
electric typewriter. These instructions most often were provided by student peers who
were already proficient with the system. Although the work was not formalized as a
study and statistical data were not reported, summary observations were made and report
that phonics mastery and sight word development occurred at an astounding rate, mostly
without teacher support.
The Stanford Project (Atkinson & Hansen, 1966) implemented a complex system

21
of instruction and record keeping in a series of one-year experiments focusing on “(1)
letter discrimination and identification; (2) initial vocabulary acquisition; (3) word
decoding tasks; (4) syntactic and intonation practice with phrases and sentences; (5)
syntactic and semantic practice with phrase and sentence material; and (6) information-
processing tasks” (p. 17). The primary objectives were feasibility tests of computer-
assisted instruction (CAI) and to gather data on “a wide range of reading tasks such as
letter-string discriminations, acquisition of an initial reading vocabulary, transfer effects
on new vocabulary items, and comprehension of phrases, sentences, and stories” (p. 20).
The first experiment began in September 1966 using 100 first-graders from a low
SES, racially mixed section of East Palo Alto, California. Two hundred lessons were
designed for self-paced work that accommodated learning rates for advanced students, as
well as struggling students and the curriculum covered the entire school year. The
findings showed that all groups (lowest, median, and highest scoring) made considerable
progress and followed parallel linear growth throughout the year.
Following in this chapter is a review of the literature that supports the current
study regarding phonology, vocabulary, and reading comprehension. Self-learning,
assisted and repeated reading, and self-voice feedback are discussed as instructional
approaches conducive to automatic speech recognition (ASR) environments. Language
of instruction is presented in relation to connectionist theory (Cummins, 2007).
Phonology for ELLs as a Prerequisite for Reading
Phonology includes phonemic awareness, phonological awareness, and phonics
(encoding, recoding, decoding). Phonemic awareness leads to learning the alphabetic

22
code that is “the system of grapheme-phoneme correspondences that links the spellings of
words to their pronunciations” (Ehri, Nunes, Stahl, & Willows, 2001, p. 394).
Phonological awareness is the ability to consciously attend to the sounds of language as
distinct from its meaning (Lesaux & Geva, 2008). Phonological awareness, in turn, leads
to facility with phonological skills, which enable encoding, decoding, and recoding that
are necessary for acquisition of vocabulary. Bus and IJzendoorn (1999) concluded from
their meta-analysis of experimental training studies that “phonological training reliably
enhances phonological and reading skills….phonological awareness should be considered
a causal factor in learning to read” (p. 411).
In their meta-analysis, Lesaux and Geva (2008) found that the competencies
needed for word reading are “essentially identical” for L1 and L2. The nine studies they
reviewed for word reading “identified a cluster of competencies underlying initial word
reading development among language-minority students: second-language phonological
awareness, knowledge of second language sound-symbol correspondence rules, second-
language letter knowledge, and working memory measured in the second language”
(p.42). They also report that phonological awareness skills in either L1 or L2 “predicted
aspects of language-minority students’ later second-language reading development” (p.
36). Regarding the contribution of phonological awareness to oral proficiency, Lesaux
and Geva (2008) say it is “important to determine how much emphasis should be placed
on developing oral proficiency among second-language learners. Only if we examine the
relationship between second-language oral proficiency and second-language literacy in
language-minority students will we know for sure” (p. 28).
23
As recognized in the literature, bottom-up skills combined with effective top-
down skills are required, and instruction needs to focus on all of these (Adams, 1990;
Chall, 1983; Juel & Minden-Cupp, 2004; Rumelhart, 1994). As pointed out by Lesaux et
al. (2008), the distribution of this focus for ELLs is not clear; but it is clear that all of the
skills must work in concert.
Oral Language Proficiency
Although there is a lack of consensus of what precisely constitutes oral
proficiency, oracy is broadly considered as the fluent, expressive and receptive use of
oral language. Lesaux and Geva (2008) describe oral language proficiency as “a complex
construct that . . . includes both receptive and expressive skills and can also encompass
knowledge or use of specific aspects of oral language, including phonology, vocabulary,
morphology, grammar, and discourse features, as well as pragmatic skills” (p. 29). Evans
and Jones (2008) equate oral language proficiency with oracy, spoken language, and oral
competencies. Goldenberg (2008) explains that ELLs go through a “series of levels . . .
the exact nature of this progression has not been fully mapped out, but generally we think
of four or five levels of English language development, from total lack of English to
native-like proficiency” (p. 12). Goldenberg also raises the question of whether oral
language proficiency can be accelerated, and he stresses that it is “evident that improving
oral English proficiency is a must” (p. 22) because vocabulary and content knowledge
become critical beyond the third grade for reading success.
Oral language proficiency reflects automatic information processing in that the
underlying components of phonological processing are manifested through fluent

24
utterances. Fluent speech, or the expression of the speaker’s thoughts, is indicative of
knowing and comprehension. Some apparent requirements for oral proficiency include
depth and breadth of vocabulary; sufficient, comprehensible pronunciation; adequate
grammatical and syntax usage; and paralinguistic features such as prosody and intonation
(Geva & Zadeh, 2006). Fluent oral reading, on the other hand, is indicative of efficient
recoding processes, but does not necessarily mean that the reader understands what is
being read (Tovani, 2000). ELLs who generate fluent speech and oral reading show that
they have developed the lower-level skills. Regarding reading, however, comprehension
has been shown time and again to be lacking for ELLs in spite of fluent readings (Geva &
Zadeh, 2006; Goldenberg, 2008; Tovani, 2000). Goldenberg (2008) says that effective
L2 instruction,
provides a combination of a) explicit teaching that helps students directly and efficiently learn…syntax, grammar, vocabulary, pronunciation…and b) ample opportunities to use the second language in meaningful and motivating situations. We do not know whether there is an ‘optimal’ balance, much less what it might be . . .What we need is a new generation of second language research that examines the nature of this balance and addresses whether, and what kind of, instruction can shorten the time required for ELLs to gain native English proficiency. (p. 13)
Poulsen et al. (2007) investigated the benefits of developing reading skills for
ELLs with regular use of the Project LISTEN Reading Tutor. LISTEN is an acronym for
“Literacy Innovation that Speech Technology ENables.” The project began in 1992 at
Carnegie Mellon University and focuses on a computerized model of expert teachers.
Until 2002, the project had primarily been used with native English-speaking elementary
students and had achieved significant gains over control groups in comprehension
measured on the Woodcock Reading Mastery Test (WRMT) as compared to studies

25
conducted earlier by the authors. Gains in other reading skills such as word
identification, word attack, fluency, rapid automatic naming (RAN), and spelling
generally favored the treatment group; however, some studies reported no significant
difference for fluency, word identification, and word attack.
Poulsen et al. (2007) highlighted a 2002 study involving 35 Canadian ELLs in
Grades 1-6 that found the ELLs could interact with the Reading Tutor, but “whether the
ELLs would be able to benefit from the Reading Tutor in its current form” (p. 195) was
questionable and became a central focus for the 2007 study. The intervention centered on
oral reading tasks with the computerized tutor daily for a four-week period. The authors
report significant gains compared to the control group in fluency (ES = 1.16, p <.05), and
sight words timed (ES = .58, p <.05) and described the gains as “dramatic” over the four-
week treatment, leading the authors to conclude that automated speech recognition (ASR)
“may have much to offer English language learners” (p. 191).
The project employs the Sphinx II speech recognition program which analyzes
oral reading, traces the location at which the student is reading, and provides prompt
feedback when difficulties arise. Participants were 34 Hispanic second through fourth
graders from suburban Chicago. A crossover model was implemented in which half
participated in four weeks of intervention and the other half in the control condition. The
groups were reversed for the second month of the study. Even very low English
proficiency students were able to operate the Reading Tutor program in spite of their
teachers’ concern about their abilities to do so. Students worked independently on
English-based oral reading assignments for 25 minutes each day. The program contained
26
hundreds of texts from various sources “including Weekly Reader, public domain Web
sources like www.gutenberg.net and stories written specifically for the Reading Tutor”
(p. 203). The “dramatic” gains in fluency and sight words suggest that the technology
can accelerate language acquisition for elementary-aged students. The authors note that
the effects on comprehension were not significant, but predict that with increased time
using the program, significant gains in comprehension should be expected as
phonological skills increase and cognitive resources are directed toward comprehension
rather than decoding.
In a related study focused on accurate decoding, a pre-test/post-test experiment
assessed the improvement in pronunciation for middle-aged, immigrant professionals
learning English in Stockholm (Hincks, 2002). The Talk to Me ASR program was used
outside of formal classes for 12.5 hours on average during the ten-week period of the
Technical English for Immigrants course at the Royal Institute of Technology. Hours of
use ranged from 2 to 48 with a standard deviation of 15. The pre-post tests on the
PhonePass automated SET-10 (Ochoa & Cadiero-Kaplan, 2008) provides an overall
score and five sub-scores, one being pronunciation. Overall, neither the treatment nor the
control group reached significance. However, grouped by initial pronunciation
proficiency levels, significance was attained for the treatment group with “poor
proficiency” initially while the poor proficiency control group decreased somewhat in
their pronunciation performance. In spite of not controlling for time engaged in the
intervention, the positive finding with the treatment group does encourage the use of CAI

27
for the development of L2 pronunciation, and illustrates a potential for improving
phonemic processing for L2 adult students.
Oracy and Language Deficiency
CAI and CALL are increasingly being used in applications to help language
disabled students. The studies on CAI and CALL for language disabled students can
inform research and intervention designs for students who are not disabled. Yang and
Lay (2005) investigated the benefits of computer-aided phoneme training on Mandarin
hearing-impaired and deaf secondary students, noting that most cannot learn to speak due
to the inability to hear their own voices. In the application of the CAI intervention,
instant feedback in visual mode was a primary feature. The advantages of real-time
feedback, undisturbed learning environment, self-pacing, and reduced teacher time are
also noted. Additionally, they note the systems function as “extra tools for enhancing
study skills and motivation” (p. 538), supporting the notion that technology is best used
as an addition to regular instruction, and it is engaging for students.
Yang and Lay (2005) devised a system of visually representing Mandarin
phonemes as scored “maps” or orthographic representations. The subjects’ oral
productions were trained to their personal speech qualities and identified with the
mapping object, or specific phoneme, which can be manipulated to produce meaningful
words and combinations. The Yang and Lay study underscores that CAI can facilitate
mastery of phonemes and words. Subjects mastered 95% of the Mandarin phonemes
over a five-month period of self-paced intervention. By selecting the correct grapheme
from a range of similar graphemes, or Mandarin “maps,” and repeating the correct

28
matched phoneme, the subjects were able to rehearse and gain control over the precise
pronunciations that resulted in producing the desired grapheme that was presented on-
screen. The Yang and Lay (2005) study shows that phonetic encoding is important
before spoken words can be produced. Further, language comprehension flows
sequentially from phoneme mastery to conceptual-semantic knowledge (decoding, word
production, etc.).
Repeated Readings and Fluency Development
Fluency, and hence a degree of reading comprehension, is facilitated through
repeated reading (Kuhn & Stahl, 2003). Samuels (1997) describes a repeated reading
method that has been shown to increase fluency, word recognition, automaticity, and
eventually reading comprehension, noting that “comprehension may be poor with the first
reading of the text, but with each additional rereading, the student is better able to
comprehend because the decoding barrier to comprehension is gradually overcome”
(p. 378). The target skill of the procedure, however, is fluency which he describes as
“accuracy of word recognition and reading speed” (p. 377). Of these, Samuels stresses
speed over accuracy because over-emphasis on accuracy significantly affects speed as
students slow down to attend to error-free pronunciations. For ELLs, however, error-free
pronunciations might be stressed initially, then speed after pronunciation has been
mastered.
The repeated reading procedure requires that a short passage, preferably of some
interest to the student, of between 50-200 words (depending on the student’s skill level),

29
be read multiple times until a criterion of fluency is reached. In an early study, Samuels
had students:
read the short selection to an assistant, who recorded the reading speed and number of word recognition errors on a graph….The student then returned to his/her seat and practiced reading the selection while the next student read to the assistant. When the first student’s turn came again, the procedure was repeated until an 85-word-per-minute criterion rate was reached. (p. 377)
The procedure is repeated with a new passage. Samuels (1997) reports that
fluency is increased within each repeated passage and subsequently, greater fluency is
reflected on new passages; that is, initial rates of new passages are higher. Samuels
suggests that repeated reading might benefit from audio support, suggesting that students
listen to recordings through earphones until audio support is no longer needed.
Stahl and Kuhn (2002) found that unassisted repeated reading have little impact
on children’s oral reading or comprehension, speculating that modeling and scaffolding
were missing factors. That is, simply having children read a passage for a second or third
time did not lead to improvements. Underscoring the need for scaffolding, Stahl and
Kuhn found that assisted repeated reading had clear positive effects on both oral reading
and comprehension. They contend that “modeling, as well as teacher monitoring, is
helpful in promoting both oral reading and comprehension” (p. 583). In an earlier study,
Kuhn and Stahl (2000) reviewed six classroom studies in which assisted repeated reading
was adapted. All six studies reported gains in oral reading and comprehension. The
subjects included at-risk struggling second-graders who received the intervention for two
years. The authors report “results from both years were extremely positive. Children
gained an average of nearly 2 years reading growth . . . it allowed the children who were

30
already falling behind their peers and in danger of losing even more ground to catch up”
(p. 583). The scaffolding provided during assisted reading seems to be a major part of
advancing student literacy at the foundational level.
Stahl and Nagy (2006) describe a parallel approach used in their reading clinic.
They suggest a 100-word selection of grade-level reading material for struggling readers.
The reading is audio-recorded which is analyzed for speed and errors. This audio-
recording of the student’s reading is an addition to the Samuels procedure. The criterion
is 100 words-per-minute, and if the criterion is not met within seven readings, an easier
passage is selected. The authors present some cautions about repeated reading, however.
They say that repeated reading has not been found as “effective as assisted reading. One
reason is that repeated reading does not ordinarily have enough “teacher monitoring”
(p. 106). On the other hand, they point out that the procedure described incorporates
monitoring when errors are checked via audio-recordings. The procedure presented by
Samuels (1997) entails close individual monitoring as the passage is read to an assistant
(e. g., class peers, teacher, teacher’s aides, parents).
It should be noted that repeated reading has been used with a wide range of
learners, from mentally challenged elementary students to university level English
language learners. Another important note given by Samuels (1997) is that repeated
reading “is not a method for teaching all beginning reading skills. Rather, it is intended
as a supplement in a developmental reading program” (p. 377).
Self-Voice Feedback
Audio-recordings of student productions may have more utility in literacy

31
development than simply as a means of monitoring student production and progress. One
use in literacy development has been to collect data for analysis of rate, error, self-
correction, word-substitution, deletion, and other elements involved in miscue analysis
and fluency study (Samuels, 1997; Stahl & Nagy, 2006; Zimmerman & Schunk, 2001).
Recordings are also used as a means of providing real-time, individualized feedback for
the student to observe aurally. As students listen to their recordings, they are often
directed to attend to the errors, thereby raising their awareness of which words they need
to improve on. While the student is attending to accurate productions of the words
viewed in text, attention is often toward speech accuracy and rate (fluency) rather than
comprehension. Students who are asked to read orally have often been found to attend to
fluency features rather than comprehension. Although effective at the word production
level, some students are unable to retell the content or answer questions about what was
just read (Samuels, 1997; Tovani, 2000). In these instances, cognitive energies were
presumably directed toward the oral production task as the audio-recording was taking
place. Performances have even included commendable prosody that is often taken as an
indicator of good comprehension; but this is not always the case (Kuhn & Stahl, 2003).
As students listen to their audio-recordings, their attention can be directed to
assessing their oral production, directed to comprehension, or both. When listening to a
recorded playback, the student is free to attend to meaning rather than phonological
processing (Samuels, 1997). Listening to self-voice playback seems to lead to
improvement in fluency, as well as comprehension (Macleod et al., 2007).
In addition to DCT (Sadowski & Pavio, 2003) and automatic processing theory
32
(LaBerge & Samuels, 1994), other theories also have merit in explaining why self-voice
listening improves literacy. One is socio-cognitive theory (SCT) (Bandura, 1977).
From the SCT perspective, self-voice modeling is steeped in self-modeling that is
derived from Bandura’s social learning theory (1997). According to Bandura, learning
will most likely occur if there is a close identification between the learner and the model.
The identification establishes a one-on-one connection with the person being emulated.
The self-as-model makes the ultimate connection with the person being imitated: the self.
Bandura (1997) explains the strengths of social learning theory. “Seeing oneself perform
successfully . . . provides clear information on how best to perform skills, and it
strengthens beliefs in one’s capability” (p. 94).
Drawing on social learning theory and hypotheses of self-monitoring, regulation,
awareness and observation, Macleod et al. (2007) investigated the effect of self-voice on
the acceleration of phonological development and word recognition in order to address
reading failure of students aged 6-13 who were one or more years behind their cohorts.
The sample was drawn from six primary schools and one secondary school in
southwestern England. The intervention had two components in three phases. First,
students recorded their own voices producing multiple sentences that targeted a specific
corpus after the words were practiced through segmenting, then blended using either
synthetic or analytic phonics. Secondly, the same procedure ensued but used research
assistants’ voices rather than the learners’ voices. A third phase of the study switched the
control group into the intervention group role. Findings were reported as strongly
significant in the acceleration of word recognition gains for the self-voice intervention

33
over a five-week period. Macleod et al. (2007) state “According to Vygotsky (1978),
observing or listening to a superior performance would indicate future mastery as a
transformation, facilitated through the guidance of a more skilled person” (p. 642). This
stance is further supported by Dowrick’s (1999) position that individual future success is
created through images of self-performance. Going a step beyond and moving from the
imagined to the real by hearing and viewing themselves in video recordings also provides
supported literacy acquisition for students as found in studies on video self-modeling.
Hitchcock and colleagues (2003) reviewed 18 studies focused on the use of video
with self-modeling interventions for behavioral and academic purposes. The 129 subjects
ranged from pre-school through high school. Eleven studies were interventions to
modify behavior, 5 to improve language skills, and 2 to improve math skills. Moderate to
strong outcomes for all of the studies indicate that video self-modeling is effective in
developing academic, communicative, and behavioral skills for PK through high-school
students. Hitchcock et al. suggest that future studies be conducted with older students
using video self-modeling with reading instruction. They suggest comparing hardcopy
books to computer animated books, or using self-modeling in comprehension and reading
fluency studies.
Another socio-cognitive theory that may help explain the gains made by the
students in the McCleod et al. (2007) study is self-regulated learning theory.
Self-regulated Learning
Self-regulated learning theory focuses on a person’s belief of his/her own agency
in controlling learning. Klassen (2010) describes this agency as “the ability to regulate

34
cognition, motivation, affect, and behavior in a learning context” (p. 19) noting self-
efficacy in control over pursued activities, persistence toward goals, and responses to
failures and challenges. Zimmerman and Schunk (2001) provide a similar definition:
“learning that results from students’ self-generated thoughts and behaviors that are
systematically oriented toward the attainment of their learning goals” (p. 125). Students
may be performance-oriented in that they compete against a norm (performance of
others) and are extrinsically motivated, or goal oriented in that students strive for task
mastery for intrinsic reasons such as curiosity, need or desire of knowing, or interest.
In attribution theory (Weiner, 1974), students may attribute success or failure to
their perception of the “locus of control;” whether within themselves (internal) or through
outside sources (external). Attributions of ability, effort, task difficulty, and luck
contribute to a student’s sense of control and play a major role in achievement. With a
belief system weighted on external attributions, older students (beyond second grade)
position success and failure according to their perceived performance as compared to
their peers through normative evaluations (either self- or other evaluation). With a belief
system weighted on internal attributions, older students should perceive their
performance compared to mastery of the chosen goal without regard to what others might
think or do. Effort in achieving mastery of a task is often determined by the self-
assignment of performing toward normative goals or performing toward mastery goals
(Bandura, 1997; Paris, Byrnes, & Paris, 2001). In other words, whether a student is
successful or not depends to a large extent on whether the student is competing to
outperform peers or to receive an external reward, such as a passing grade, or whether the

35
student is striving for mastery of an outcome for internal, self-motivated needs or desires.
Paris et al. aver that “mastery goal orientation focus on developing new abilities,
enhancing self-competence, mastering challenging tasks, and trying to gain
understanding” (p. 269). Research provides substantial evidence that mastery-oriented
students tend to be self-regulated learners (Bandura, 1997; Guthrie, Wigfield, &
VonSecker, 2000; Klassen, 2010; Wigfield & Guthrie, 2004).
Self-efficacy and intrinsic motivation offer some explanation as to why listening
to self-voice enhances learning at the phonological, word, and text levels of reading
development. As demonstrated in the studies above, student performances increased
significantly at the phonological and word levels, and reading comprehension increased
to lesser degrees when students were afforded the formats and opportunities for self-voice
feedback. In the conditions provided in the studies, students were not offered external
rewards, such as grades, but were directed toward mastery of the identified goals such as
phoneme or word production. By listening to themselves perform, students may have
attributed their successes more to effort which is under their control, rather than ability.
However, they also developed a sense that in spite of past failures and the perceived task
difficulty, they have the ability to master the goals (Macleod et al., 2007).
Referring to Bandura’s (1997) sources of self-efficacy, Klassen (2010) states
“The first and most powerful source is individuals' interpretations of their mastery
experiences [original authors’ emphasis], or previous successful experiences. In
educational settings, the successes students experience typically build their self-efficacy,
whereas failure experiences undermine it” (p. 28). However, Bandura (1997) notes that

36
student failures can contribute to future success. “Self-modeling of deficiencies . . . loses
its negative impact when the deficiencies occur early in the process of gaining mastery”
(p. 94). Klassen also suggests that “Future research should explore the effectiveness of
self-regulation interventions provided to adolescents with LD, with a particular focus on
how self-regulation strategies influence their confidence to use those strategies” (p. 29).
Mace, Belfiore, and Hutchinson (2001) identify four classes of self-regulated
learning: self-monitoring, instruction, evaluation, and reinforcement. Self-evaluation and
self-correction (as a sub-dimension of self-evaluation) involves students comparing their
performance to a standard or criterion. The standards refer to both accuracy and
improvement of performance. Self-correction “requires a student to self-evaluate
performance. . . . Whereas self-evaluation requires a discrimination to be made between
some standard or required performance and a person’s performance, self-correction
requires a modification of performance to more closely approximate the standard”
(p. 51). This self-correction feature offers yet another explanation for the effects of
listening to oneself from audio recordings.
The use of speech recognition programs can be less amenable to extrinsic
performance motivation and centered on mastery goals. A user of speech recognition,
whether a native English speaking professional or a second-language learner, may persist
in achieving high rates of mastery of accuracy through fluent speech production for
personal or professional reasons. Competition and comparison with others is minimized
because the focus is on personal production of machine-recognized language. The
instructional advantage of speech recognition software at the phonological, word, and

37
text levels is that learners produce the sounds and words (speech/phonotory channel), see
the words (visual channel), and hear the words (auditory channel), potentially all within
very close proximity to one another. Strong and obvious connections among the various
cognitive modes are reinforced, such as when students say a word and then actually see
the product of their oral production printed. Another advantage is that ownership of the
word is somewhat literal: it becomes part of the corpus stored in the speech recognition
program for the individual and is added to the computer-based word file constructed on
the unique wave production and is brought forward when the student repeats the word in
later use of the program.
Summary
The preceding review of the literature provides background and a framework for
this study. The theoretical framework for this study is embedded in the interactive
reading models that view reading comprehension from dual coding and automatic
information processing constructs. Cummins’ (1991) common underlying proficiency
theory addressed the idea that nonverbal memories, along with verbal associative
memories, from L1 contribute to reading in L2. As such, comprehensible input from L1
in both logogen and imagen forms are theoretically and practically considerable;
therefore, consideration of the languages of instruction are critical. Connections among
the three major components of phonology, word acquisition, and reading comprehension
are viewed to operate in parallel where connections exists, but these are influenced by
learner efficacy, as well as external factors such as instructional focus and environmental
conditions.

38
In the computerized speech recognition environment, attention to instructional
tasks involving accurate pronunciation, fluency, word comprehension and reading
comprehension are dependent on a student’s competency level. Increased competency is
expected as the student repeatedly encounters vocabulary in either the same passage or in
new passages. Listening to the passage read in the student’s own voice has been shown
to be a factor in fluency and word acquisition. As discussed, several theories which are
applicable to the speech recognition environment, potentially explain the effects of self-
voice feedback. Findings from numerous studies that applied computer technologies for
literacy acquisition have also been reported. Overall, these findings suggest that a
moderate to strong effect size exists for applied interventions. Studies of the
effectiveness of self-voice feedback for secondary ELLs were not found in the literature,
nor were there studies for the use of speech recognition technologies for secondary ELLs.
The current study sought to address this void in the literature, while providing some
insight into the effects that speech recognition and self-voice feedback have on improving
fluency for secondary ELLs.
The following chapter discusses the instructional design affiliated with the use of
speech recognition engines. Speech recognition software is fixed in the sense that the
computer demands are somewhat inflexible beyond the options provided in the
programming; thus, conceptualized instructional design remain static for speech
recognition applications in general. The INSTRUCTIONAL DESIGN chapter addresses
the conceived design for using technology in isolation from the intervention procedures
and methodology discussed in the PROCEDURES chapter. The intent is to make clear

39
how instructional design fits with speech recognition parameters before introducing the
intervention processes used in this study.

40
INSTRUCTIONAL DESIGN
Methodology
Reading rate and accuracy are sub-components that combine with prosody to
form the reading sub-component of fluency (National Reading Panel, 2000). Rate and
accuracy are conceptualized on a continuum that manifest latent cognitive skills of
encoding, recoding, and decoding processing skills as delineated in Samuels’ (2004,
1994) information processing theory. As rate and accuracy move toward automaticity,
attention to upper-level processing skills can become intensified (Adams, 1990; LaBerge
& Samuels, 1974). That is, while rate and accuracy are relatively low, prosody remains
limited and native-like speech production is hindered resulting in reduced fluency and
reading comprehension. As overall fluency increases, comprehension increases (Fuchs,
2001; Osborne et al., 2003). Measurements for native English speakers at the elementary
school level have shown high correlations between rate, accuracy, and reading
achievement across grade levels, and in some instances, high correlations between rate,
accuracy, and reading achievement for English language learners (ELLs) as well (Fuchs,
2007). Parallel findings for secondary limited-English proficiency students are not
reported extensively in the extant literature.
The current study focuses on accuracy and rate development among secondary
ELLs effected through automatic speech recognition (ASR) software, specifically Dragon
Naturally Speaking (DNS Version 11; Nuance, 2011). Speech recognition software was
not originally developed as a language teaching tool but can be conceptualized as such.

41
The remainder of this chapter focuses on instructional design in the use of DNS as an
intervention to improve oral reading accuracy and rate among secondary ELLs. The
proposed instructional design follows information processing theory (LaBerge &
Samuels, 1974; Samuels, 2004) structured on instructional design principles set forth by
Gagne, Briggs, and Wager (1992).
Information processing theory (LaBerge & Samuels, 1974; Samuels, 2004)
presents a sequence of events that occurs internally and generally follows the sequence
presented by Gagne et al. (1992). Gagne points out that learning does not necessarily
involve each and every step in the sequence, nor is the sequence locked. Many
researchers, in fact, propose that reading involves parallel processing, rather than serial
processing. However, the sequence presented by Gagne et al. (1992) is typical in many
learning environments and presents a model that fits both the internal and external events
taking place as ELLs use DNS.
The LaBerge-Samuels model of automatic information processing provides a
description of the reading process in which lower-level reading skills interact with the
upper-level reading skills. The notion of attention is a focal point in the model.
According to LaBerge and Samuels (1992), attention is limited but can be deftly
controlled by the individual. Executive functions at the individual’s internal control
direct attention to solve the problem required of a task. As suggested by Gagne, all
learning is dependent on internally stored memories. During the reading process,
attention is switched among memory centers as needed to gain meaning from
informational input (Adams, 1994; Samuels, 2004). Because this study focused on oral
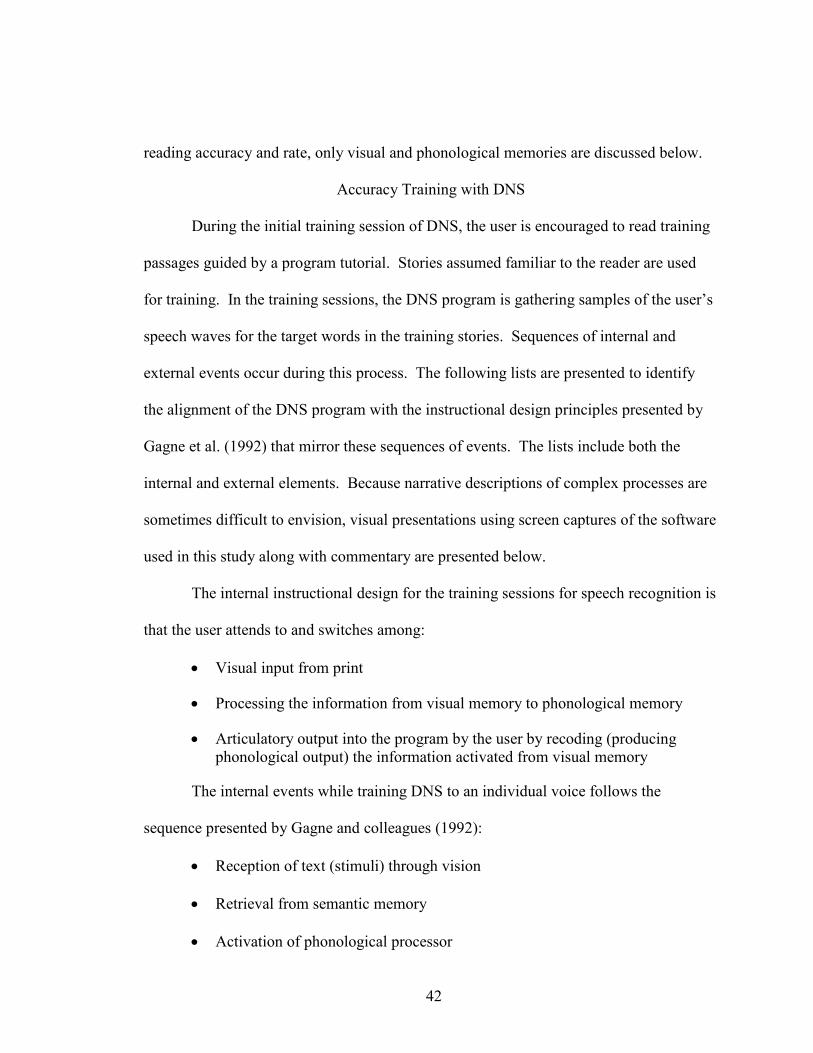
42
reading accuracy and rate, only visual and phonological memories are discussed below.
Accuracy Training with DNS
During the initial training session of DNS, the user is encouraged to read training
passages guided by a program tutorial. Stories assumed familiar to the reader are used
for training. In the training sessions, the DNS program is gathering samples of the user’s
speech waves for the target words in the training stories. Sequences of internal and
external events occur during this process. The following lists are presented to identify
the alignment of the DNS program with the instructional design principles presented by
Gagne et al. (1992) that mirror these sequences of events. The lists include both the
internal and external elements. Because narrative descriptions of complex processes are
sometimes difficult to envision, visual presentations using screen captures of the software
used in this study along with commentary are presented below.
The internal instructional design for the training sessions for speech recognition is
that the user attends to and switches among:
• Visual input from print
• Processing the information from visual memory to phonological memory
• Articulatory output into the program by the user by recoding (producing phonological output) the information activated from visual memory
The internal events while training DNS to an individual voice follows the
sequence presented by Gagne and colleagues (1992):
• Reception of text (stimuli) through vision
• Retrieval from semantic memory
• Activation of phonological processor

43
• Articulation of the word, phrase, or sentence
• Immediate visual feedback on oral production through speech-to-text output
• Evaluation of speech-to-text output compared to the standard
• Recoding of unacceptable production to more closely match the standard
The internal events are actuated through a series of external stimuli that also
follow the instructional features presented in Table 3.1.
Table 3.1
Common Elements for Instructional Design
Type Elements
External Learning Events
Stimulation to gain attention to ensure the reception of stimuli Informing learners of the learning objective, to establish appropriate expectancies Reminding learners of previously learned content for retrieval from long-term memory (LTM) Clear and distinctive presentation of material to ensure selective perception Guidance of learning by suitable semantic encoding Eliciting performance, involving response generation Providing feedback about performance Assessing the performance, involving additional response feedback occasions Arranging variety of practice to aid future retrieval and transfer
Internal Learning Events
Reception of stimuli by receptors Registration of information by sensory registers Selective perception for storage in short-term memory (STM) Rehearsal to maintain information in STM Semantic encoding for storage in LTM Retrieval from LTM to working memory (WM) Response generation to effectors (muscles) Performance in the learner’s environment Control of processes through executive strategies
By matching internal features with external stimuli, speech recognition training parallels

44
Gagne and colleagues instructional design and is illustrated in the following example
using Tuck Everlasting (Babbitt, 1975). The figure title is a brief description of what is
taking place in the DNS program and relates directly to the external learning event. The
captioned text is a brief explanation of the intervention procedures that are described in
greater detail in the PROCEDURES chapter. Intervention procedures are briefly
presented here to answer question that may naturally arise while viewing the figures such
as “why so much white space?”
Figure 3.1 shows how the text is presented to gain student attention. Sentences
are presented individually with space between them for students’ dictation output.
Figure 3.1. English sentences in the speech recognition environment. Selections of English text is taken from ESL curriculum for beginner, intermediate, or advanced students. Participants work with passages from their instructional level. Passages are divided into sentences with ample white space between for speech-to-text input with close proximity to stimulus.

45
Learners are then given the learning objective to establish appropriate
expectancies. Participants are told to “exactly match the model sentences through your
speech.” Figure 3.2 shows the previously learned content that is reviewed by the student
to aid in LTM recall. This and several previous sentences were read together at the end
of the previous session. These sentences are repeated at the beginning of the lesson. If
errors occur in subsequent lessons, they are corrected by the participant and the sentences
are repeated to train the participant and DNS. Thus, participants are reminded of
previously learned content and transitioned to new content.
Figure 3.2. Repeated listening-while-reading of sentence series.
Figure 3.3 illustrates how material in the learning session is presented in a clear
and distinctive manner to ensure selective perception.

46
Figure 3.3. Reading and correcting inaccurate speech. Story reading focuses on correcting inaccurate speech productions. “And so, at dawn bad day in the first week of August.” has 11/12 words articulated correctly. The error is on that which sounded like bad.
Figure 3.4 shows that student learning is guided by suitable semantic encoding.
The student recognizes that dads is not the target word presented in the sentence.
Figure 3.4. Mismatch between attempt and actual word. Highlighting of acceptable speech production indicates that the student is attending to the mismatch between phonological attempt and the actual word. The actual word “bad” is recoded as “dads.” The student detects error by scanning output and chooses to hear model with “read that” option for target /that/. Figure 3.5 highlights performance by eliciting response generation.
Figure 3.5. Highlighting the target error. The student highlights the target error for recoding after listening to model.

47
Figure 3.6 shows how feedback regarding performance is presented to each
student. Assessment of the performance involves additional response feedback
occasions.
Figure 3.6. Positive feedback between speech-to-text. Correct speech production results in positive feedback provided through speech-to-text production of the target word after participant generates correction within the speech recognition program’s tolerance.
Students assess their productions to see if what they dictated matches the on-
screen product. The dictated text is highlighted and played back in the student’s own
voice. (See Steps 3-7 above.)
Figure 3.7 illustrates how a variety of practice can aid future retrieval and
transfer. This process demonstrates principles of instructional design used with DNS
software conceptualized to develop fluency for ELLs. In addition to these instructional
design principles, other instructional elements that may contribute to oral reading fluency
for ELLs are also occurring with the use of DNS. These are assisted repeated readings,
self-efficacy development, and listening to text in the user’s own voice.

48
Figure 3.7. Self-voice listening-while-reading the dictation. Sentence sequence is read by participant without interruption for corrections as a final session phase. Selection is highlighted and listened to in participants own voice. The tracking arrow follows speech production. This selection forms the beginning of the next session where the selection is listened to, reminding participants of previous learning, then corrected as a transition to new learning, and reinforcement of prior learning.
Basic Speech Recognition Training
Speech recognition developers have established formulas for speech wave
identification. A speech recognition program analyzes a user’s speech waves and
compares them to a set of known waves for specific words. If the wave forms produced

49
by the user are within the set of waves defined for that word, the word is printed to
screen. If not, the speech engine prints to screen another word that is recognized by the
speech engine based on the speech wave. When the computer senses a delay in
producing a word, or detects an abnormal pause in phoneme productions within the
presented word, it flags the word for repetition or presents a query. The user must repeat
the word until a speech wave that falls within the parameters for the standard is matched
to produce the targeted word. A basic understanding of this process may be helpful in
order to see how speech recognition training correlates with the theories and principles
presented above.
Basic Speech Recognition Engineering
Speech recognition engines have been designed to accept a wide range of
pronunciations for a given word. Yet, there are limitations. Pronunciations of a word
that fall outside the limitations are not recognized as the target word. Speech productions
falling within the parameter even if they are only marginally comprehensible to a listener
may be accepted by the computer. In subsequent uses of the speech recognition program,
each time that the user produces the speech waves for the word accepted and recorded by
the computer as the representation of that word, the computer will call up that specific
word. It will also call up that word if the speech waves most closely match that specific
word so that variations in the pronunciation, such as improvements in pronunciation, will
still produce a speech-to-text output of the desired word. In this way, subsequent uses
and repetition of words are improved, or polished.
For example, if a speaker encounters an unknown lower-frequency word such as

50
bestride, and says the word as /best/ /ride/ with the stress on the first syllable, the
computer will reject the production and require another attempt. The same will happen
for /be/ /stride/ as a second attempt. Not until the speaker shifts the accent to the second
syllable in either segmented form, /best/ /ride/ or /be/ /stride/ does the computer recognize
the oral production as acceptable, so long as the juncture/pause between the two syllables
is not too long. Either of the last two productions will fall within the accepted
parameters, although neither is actually correct. With future practice and perhaps
scaffolding from an expert, the user should eventually acquire the correct pronunciation
of bestride.
Initially, the production of bestride is not expected to be fluent because accurate
production of the word will be at the phonological level where resources are attending to
(in IPT terms) articulatory productions of the logogen. As the speaker receives feedback
from the speech recognition system that the speech production has failed to meet a
minimal standard by printing out a different word, the speaker must attend to
phonological trials to progress to a successful form of the word. Once successful, the
speaker moves on in the text. When the word is encountered again, the process is
repeated, but most likely at a faster rate (Kuhn & Stahl, 2003). Eventually, the
phonological production of bestride will become automatic and fluent. Throughout the
process, the speech recognition program is refining the word to the latest and most used
production of the word by the user which in the end should be the most standardized form
of the word for the user.
51
Initial DNS Accuracy and Rate Training
When participants engage in training with speech recognition in their first
language, the scaffolding afforded through the speech recognition training modules is
typically enough to achieve a level of accuracy to make the programs useful. The degree
of accuracy, however, varies by speech recognition software. Accuracy rate reported for
Dragon Naturally Speaking is up to 96% (Nuance, 2011). Accuracy rates are dependent
on many variables such as the speaker’s accent, pronunciation, and the number of low
frequency words not in the speech engines corpus, such as proper nouns or uncommon
jargon. Rate can also be a factor if speech is halting or so fast that the onsets cannot be
discerned by the computer. The rate of 96% is for normal native speakers of English.
The typical initial first language training assumes accuracy and rate (fluency) for
the program user (participant). Word automaticity and automatic retrieval from long-
term memory in the phonological recoding process should be fast and accurate for normal
speakers. The initial training session for DNS can be as short as 4 minutes with varying
degrees of accuracy if the short training session is selected as the initial training option.
The selection of the longer training session that employs the story of Pinocchio, for
example, takes about 15 minutes without pauses. This type of reading assumes fluent
reading with or without comprehension. As Lesaux and Geva (2008) define,
phonological encoding may or may not entail comprehension.
Information Processing and Internal Events
Using the above example to demonstrate the underlying learning processes
presented by Gagne (1992), training and using speech recognition programs can be

52
viewed as following the same dimensions operating in parallel as the underlying learning
processes presented in dual coding theory and information processing theory described in
the LITERATURE REVIEW chapter. Where automaticity has been achieved, speech
recognition training is smooth and fairly effortless with the exceptions noted above
(Samuels, 2004). When new vocabulary is encountered, processing and attention are
shifted from a comprehension/communicative mode to a representational level in order to
produce phonological connections between the logogen (visual), auditory and
phonatory/articulatory representations.
As a logogen is processed by the visual receptors, articulatory processing takes
place to construct phonatory memory and simultaneously produce an inner or sub-
vocalized speech for auditory conditioning. The word may be rehearsed several times in
short-term memory until a satisfactory production is created that is tested against some
standard. In the case of speech recognition program use, the standard is set within the
parameters used in the speech corpus of the speech engine. The visual, phonatory, and
auditory information is then, at least weakly, stored in the individual’s memory. With
repeated readings of the words, the information is reinforced and, with enough use or
encounters with the word, eventually becomes automatic and effortless in production
(Thomas & Johnson, 2008). Associations and references, in DCT terms, are theoretically
put aside until a satisfactory articulation of the word is at least temporarily achieved.
Attribution and Self-Efficacy
The failure to produce adequate word productions on the first or subsequent tries
is a pivotal juncture in the instructional design of the intervention. As stated by Bandura

53
(1997), focusing attention on a failed attempt early in a sequence of learning events can
lead to positive self-efficacy development and achievement. With effort and persistence
in hypothesis testing, the speaker develops strategies for producing accurate word
productions and fluency in reading. With this progress, and following Weiner’s
attribution theory (1974), the speaker can attribute the successful production of speech
represented as text on-screen to both effort and ability. Through continued successes,
ELLs can hear and see their efforts transformed into skill sets and recognize their ability,
as opposed to luck, to accurately produce English words and sentences. The locus of
control is internal, and the control of the speech recognition program is with the speaker.
Self-efficacy also contributes to self-modeling (Bandura, 1997) which is framed in IPT
and this instructional design.
Self-as-Model
Successful productions of oral readings that meet at least the marginal standards
demanded from speech recognition programs create printed text and audio recordings that
can be accessed by the speaker through saved files. For ELLs, listening to themselves
speaking acceptable English presents a self-model that may contribute to their self-
confidence and knowledge of their abilities with the English language. These self-models
may boost achievement in oral reading rate and accuracy (Bandura, 1997; Ecalle et. al.,
2008; Hitchcock et. al., 2003; Klassen, 2010; MacCleod et. al., 2007). When listening to
the audio recordings of self-voice, participants should see themselves as successful,
capable learners who have mastered phonological elements of targeted text. The
development of self-efficacy has been shown to transfer to future tasks, thus sustaining

54
learning and leading toward success in school (Ecalle et. al., 2008; Hitchcock et. al.,
2003; Klassen, 2010; MacCleod et. al., 2007).
As was shown in Figure 3.7, a final phase of the intervention asks participants to
read in sequence, without pausing, all of the target sentences worked on during the
session. In the final phase, participants highlight the final session’s reading and play it
back in their own voice at least once, thereby having an opportunity to monitor their
uninterrupted speech production. Research supports that listening to their own voice,
rather than a computer or other voice, will connect them most strongly to the learning
objectives, thus producing or leading toward the desired outcomes of accelerated
proficiency in oral reading rate and accuracy (McCleod, 2007).
Summary
The instructional design for the intervention in this study followed information
processing theory (LeBarge & Samuels, 1974; Samuels, 2004) and the instructional
principles designated by Gagne et al. (1992). The design used is supported by research in
repeated readings (Kuhn & Stahl, 2003; Samuels, 2004), self-modeling studies (Bandura,
1997; Ecalle et. al., 2008; Hitchcock et. al., 2003; Klassen, 2010; MacCleod et. al.,
2007), and self-efficacy research (Bandura, 1997; Weiner, 1974). Based on the design
factors and supporting evidence from previous research, it was expected that positive
trends in oral reading accuracy and rate would be achieved. On the other hand, because
of the dearth of research conducted with secondary ELL students and because the
intervention was new, this study was exploratory and yielded unexpected results.
55
PROCEDURES
Technology configured as Language input → Matched English text → NOrmed
into a speech recognition engine by user → Played back in a user’s own voice” as used in
this study is referred to as the LMNOP model or system. The LMNOP model was
designed by the author to provide a format for oral reading accuracy and rate training.
Speech-to-text production using speech recognition engines requires relatively accurate
phoneme articulation at a rate fluid enough to create unity among the phonemes. To gain
this skill, English language learners (ELLs) need practice and usually some form of
feedback and support. The use of speech recognition engines in a second language can
present the learning challenges and support that may be needed by many language
learners.
Participants
Students participating in the study were solicited from a population of high school
ELL students enrolled in a summer school program, Grades 9-12, from three campuses
with a total of approximately 5600 students located in a mid-sized, North Central Texas,
community. Hispanics make up approximately 30% of the district’s high school
population, and about 40% of the Hispanic students is classified limited-English
proficiency (LEP). All LEP students enrolled in the summer school English language
arts classes formed the population from which students for this study were solicited, and
all are Hispanic.

56
A power analysis conducted prior to the study estimated that if the LMNOP
program produced moderate effect sizes of .4, and an alpha of p <.05 was used, a sample
size of 23 treatment group participants would be needed to achieve 80% power for this
study. About 100 students enrolled in the ESL summer school program, and it was
anticipated that at least 50 students would volunteer to participate in the study. Due to
changes in policy and enrollment in the summer program, only 20 students participated in
this study. Post hoc power for the dependent samples t-test used to compare control
participants to those who received the LMNOP intervention was .53 using an alpha of p <
.05, and an estimated effect size of ES = .4. Stated differently, this study with 20
participants had a better than 50% probability of finding an effect size of ES = .4 in the
population if such an effect actually exists.
To support the study, the district’s ESL High School Coordinator offered to
implement this study during a summer school program for ELL students who did not pass
courses during the regular school year. The students came from high school campuses
within the district, and the courses included English Language Arts (ELA) I, II and III.
This summer school program lasted four weeks, with classes taught Monday through
Thursday from 8:00 a.m. to 2:30 p.m. The ESL coordinator approached the ELA summer
school teachers with this study, and the teachers agreed to allow their students to
participate provided the daily session time be reduced from 35 minutes to 20 minutes.
At the beginning of the summer school session, a four-minute video
demonstrating the intervention process using the LMNOP was shown to each ELA class.
The details of the control and treatment groups, perception (attitude) assessment, and oral

57
reading fluency assessment procedures were presented and informed consent forms were
distributed to all the students who volunteered for the study. Of the 22 students who
offered to participate, 2 did not return parental consent forms, which resulted in a final
sample size of N = 20. Students were randomly assigned to either the control group
(n=10) or the treatment group (n=10) through a name-drawing procedure. The researcher
assigned each participant an identification code in order to protect the personal
information of the participants. Participants in the treatment group were coded as 101T,
102T, 201T, 202T, 203T, 204T, 301T, 302T, 303T, and 304T. Control group participants
were coded 123C, 124C, 223C, 224C, 225C, 323C, 324C, 325C, 326C and 327C. The
first number in the coding identifies the ELA class level—ELA I, II or III. The letter “T”
or “C” identifies the group that the participants were assigned to: control or treatment.
ELA I consisted of three males and one female. ELA II consisted of two males and five
females. ELA III consisted of six males and three females.
Time-Frames and Session Labels
The study was conducted from June 6 through June 30, 2011, Monday through
Thursday. The researcher had access to the students for 16 days for an allotted 20
minutes per day. The first day was used to solicit participants and distribute consent
forms. The second day was used mostly for benchmark oral reading fluency assessment
for the control and treatment participants. The third day consisted of orientation to the
study expectations, instructions, computer arrangements and voice recognition program
navigation. Participants performed actual dictation and corrections of dictation errors for
less than five minutes on the third day. These dictations did not produce data considered

58
valid for the study. The last day of the study consisted of a final oral reading fluency
measurement and debriefing. The number of sessions that provided reliable data was 12.
The sessions are labeled 1 through 12 and refer to sessions that produced usable data
rather than to the day of the 16-day study sequence. In short, the study was conducted for
12 days consisting of a total of 240 minutes (4 hours).
Intervention Procedures
The procedures for the intervention are fairly complex due to the numerous facets
and options available in Dragon Naturally Speaking. Therefore, the following overview
is a discussion of the major components, applications, and practices of the intervention
rather than a detailed account that includes explanations of how the DNS program is
operating and all of the possible routes afforded to achieve accuracy on target words.
Prior to initiation of the daily intervention sessions, the participants completed an oral
reading fluency assessment (described below). Thereafter, each daily session followed
this sequence of reading tasks:
1. Dictation of part of the previous day’s passage
2. Listening to and silently reading a new passage
3. Dictating and correcting individual sentences from the new passage in the speech recognition environment
4. Dictating the new passage as a whole without making corrections
5. Listening to their own voice from their recorded dictation
Assessment Text Selection and Preparation
Procedures for preparing an oral reading fluency assessment are described in
Curriculum-Based Measurement: A Manual for Teachers (Wright, 1992) in greater detail

59
than in the following brief overview. However, the process begins with the random
selection of texts taken from the curriculum at a presumed instructional level.
Curriculum-based measurement (CBM) assumes that students are placed at appropriate
levels, (e.g., ELA I, II or III) and that basal and trade book selections are appropriately
selected or leveled for target groups. Deno (1985) suggests reading passages of about
250 words be prepared for each CBM reading beyond the second grade. Passages are
selected from pooled readings of approximately equivalent reading levels.
This study measured fluency in oral reading using texts from the summer school
ELA curriculum. All three ELA courses included two trade books as part of their
curricula. ELA I students studied John Steinbeck’s The Pearl (1945) and Robert
Cormier’s The Chocolate War (1974); ELA II students studied John Steinbeck’s Of Mice
and Men (1937) and Sandra Cisneros’s The House on Mango Street (1994); ELA III
students studied Laurie Anderson’s Speak (1999) and Gary Soto’s Afterlife (2003). The
researcher visually scanned each of the texts for passages of approximately 200 words
that contained few or no proper nouns. Proper nouns were considered detrimental for the
study because of their general low frequency, possible exclusion from the speech
recognition corpus, and the hesitation caused for participants in intervention pilot trials.
During pilot trials, participants frequently spent several seconds to come up with possible
pronunciations of proper nouns and these were most often not recognized by the speech
recognition software. Where proper nouns could not be avoided, they were replaced by
the first letter of the proper noun. For example, Esperanza was changed to E. Proper

60
nouns that are also common words such as Candy, Slim, Curly and Crystal were retained
in the passages.
Eleven passages were selected from each book. Each passage was analyzed
through the Lexile Framework for Reading at http://www.lexile.com/analyzer/ to get a
leveling score. Passages were then grouped, low to high, by their lexile scores to form a
set of readings to be used in the intervention as well as measurements of oral reading
fluency. The lexiles for ELA I ranged from 570 to 1190 with a mean of 981; ELA II’s
passages ranged from 570 to 1150 with a mean of 874; and the ELA III text set ranged
from 400 to 1130 with a mean of 690. Lower lexile values equate with easier reading.
Tables in the appendix report passage selections, their respective lexiles, and their use
either as a passage for the oral reading fluency measurement or for use in the intervention
sessions.
As suggested by Deno and Marston (2006), passages used to measure oral reading
fluency should be about the same length and level. Passages for the pre-post assessments
were selected based on the lexile values that were closest to the mean for the texts used
for each ELA class. The ELA I passage mean is 1002; the ELA II mean is 773, and the
ELA III mean is 695. While the lexile levels for ELA I and III seem inversed, trade
books may have been selected as traditional texts for those grades or because the story
content was deemed more suitable for those grade levels.
Intervention Text Selection and Preparation
The passage selection process described above for the assessment text selection
and preparation processes produced 22 passages for each ELA class, or a total of 66

61
passages. The researcher selected 27 of these passages to form sets for oral reading
fluency assessments. The remaining 39 passages were used as passages for the
intervention. There were 13 passages prepared for each ELA class level. The summer
school program held classes only four days per week and resulted in only 12 sessions as
explained previously. Therefore, not all of the passages were used during the study. The
order of passage presentation in the intervention was determined through random
drawings.
The next step was to prepare word documents for the intervention using the
selected passages and individually label them for each participant. For example, a word
document for the fourth session was prepared for a participant in ELA I using a passage
from page 49 in The Chocolate War (Cormier, 1974). The document was labeled
102TSes4 Eng I_Chocolate p.49. Figure 4.1 shows the text for the repeated reading using
the target text from the previous session’s final reading (in Times New Roman 12 point
font) and the dictation results (Arial Bold 12 point font). The passage was dictated by the
participant at the end of the previous session. The passage (target text) was re-read
(dictated) at the beginning of the current session and was output in Arial bold font.

62
Session 4 English I
Instructions: Dictate the following sentences, then highlight the sentences that you dictated. Right click and choose "Play That Back" to listen to your dictation. DO NOT MAKE CORRECTIONS.
He took the knife and left her. He stumbled toward the beach and he came to his canoe. And when the light broke through again he saw that a great hole had been knocked in the bottom. And a searing rage came to him and gave him strength. Now the darkness was closing in on his family; now the evil music filled the night, hung over the mangroves, skirled in the wave beat. The canoe of his grandfather, plastered over and over, and a splintered hole broken in it. This was an evil beyond thinking. The killing of a man was not so evil as the killing of a boat. It could, knife and left. He stumbled toward the beach and he came to his canoe and when light broke through again he saw the great hole had been not in the bottom and a searing rage came to him and gave him strength. Now the darkness was closing in on his family. Now the evil music filled the night he is hung over the man groups, skirled in the wave beat the canoe of his grandfather, plastered over and over and a splintered hole broke any this was an evil beyond thinking the killing of a man was not so evil of the killing of boat. __________________________________________________________________
Figure 4.1. Warm-up target text with dictation output. The session title, instructions and target passage from previous session in Times Roman 12 point font are included. Dictated oral reading is in Arial 12, Bold.
Neither the previous nor current dictations were corrected for errors. The primary
purpose of this “warm-up” dictation was to sample reading rate, but it also served as a
repeated reading. It was not intended for speech recognition training.
Figure 4.2 shows individual sentences from the session passage and the resulting
corrected dictation (Arial Bold, 12 point font). The dictated sentences usually contained
errors that the participants corrected. Participants were instructed to make their dictated
sentences match the target sentences by using the “Correct That,” “Train That” or other
DNS feature. The final phase of the training sessions required that each participant return
to the target paragraph, highlight and copy all of the sentences that were focused on for

63
mastery through dictation correction, and paste them toward the bottom of the page for a
final dictation and a concluding listening of the dictation in their own voice.
(The Chocolate War, p. 49. Word count=202, Flesch Reading Ease=81.2 gl 5.5, 820L)
That was the last moment of intimacy he and his father had shared. That was the last moment of intimacy he and his father had shared The routine of school for himself, and work for his father, had been taken up and they both threw themselves into it. The routine of school for himself and work for his father had been taken up and they both threw themselves into it His father sold the house and they moved to a garden apartment where no memories lurked around corners. His father sold the house and they moved to a garden apartment where no memories lurked around corners
______________________________________________________________________ Figure 4.2. Paragraph division into sentences. Individual sentences from the passage target text provided in Times Roman 12 point font. Participants corrected dictation errors so that the final dictated sentence matched the target sentence. The dictation was output in Arial Bold 14 point font. The word and phrase training was intended to achieve pronunciation mastery and promote oral reading fluency. The word count (202) is the total number of words in the target passage, the Flesch Reading Ease and gl (grade level) were calculated as potential metrics for identifying leveled reading sets, and the “820L” is the lexile value for the target passage used to group leveled reading sets.
In the example shown in Figure 4.3, all of the target text was trained so the entire
target passage was copied, pasted, and dictated by the participant. The dictated passage
was then used for self-voice playback. After listening to the self-voice recording by
highlighting the dictated text and clicking the “Play That Back” option from the pop-up
menu, participants were dismissed to return to class. Once the participants left the room,
the researcher or assistant would highlight and copy approximately 100 words of the
target text used in the final dictation. They opened the pre-prepared session document for
the following session, (e.g., 102TSes5 Eng I_Pearl p.42) and pasted the selected words

64
in the space below the instructions for the following session’s “warm up” passage. This
was done immediately at the end of the day’s session and before the arrival of the next
group of participants.
____________________________________________________________
_____________________________________________________________ Figure 4.3. Target text with end-of-session dictation output. All of the sentences from the target passage were dictated and corrected by the participant. Output errors in the final dictation, read as connected sentences, were not corrected. The primary purpose of the end-of-session dictation was to sample reading rate, but it also served as a repeated reading. It was not intended for speech recognition training nor student pronunciation training. The final dictation (bold text) was highlighted and played back in the participant’s own voice as the final activity of the session.
The number of words contained in highlighted text is shown at the bottom of the
word document illustrated in Figure 4.4. These selected words formed the first passage
for dictation in the following session. Adobe Audition sessions were set-up to
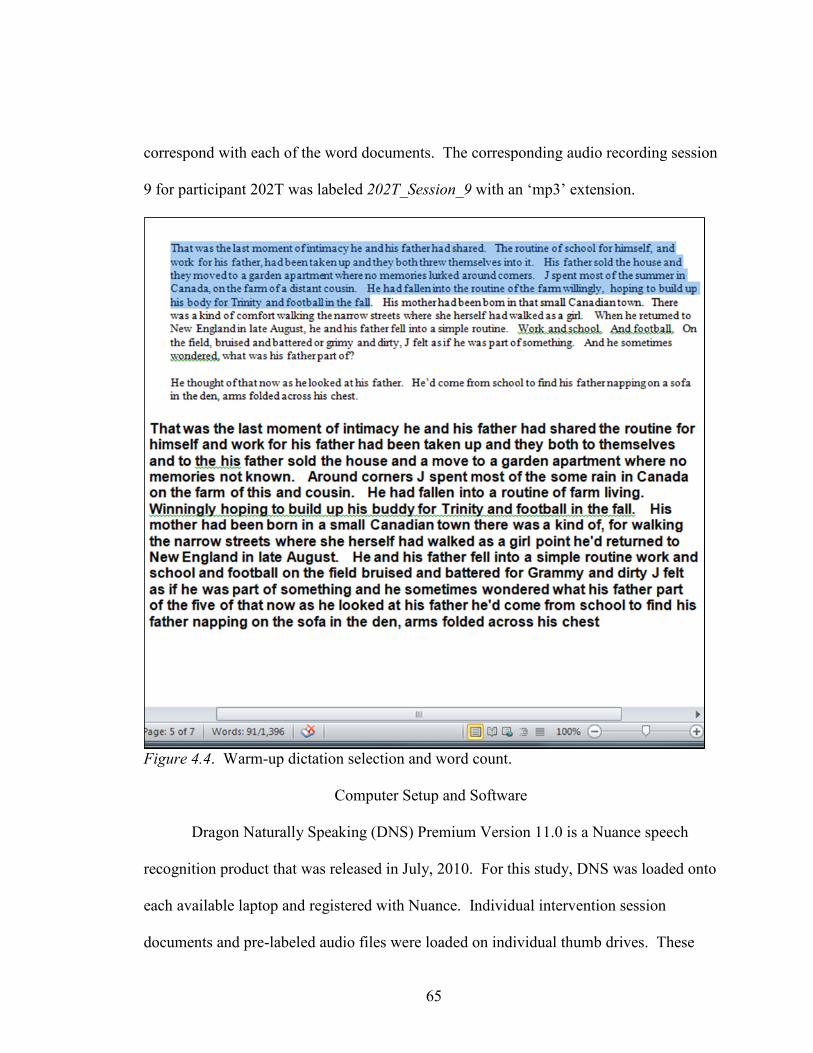
65
correspond with each of the word documents. The corresponding audio recording session
9 for participant 202T was labeled 202T_Session_9 with an ‘mp3’ extension.
Figure 4.4. Warm-up dictation selection and word count.
Computer Setup and Software
Dragon Naturally Speaking (DNS) Premium Version 11.0 is a Nuance speech
recognition product that was released in July, 2010. For this study, DNS was loaded onto
each available laptop and registered with Nuance. Individual intervention session
documents and pre-labeled audio files were loaded on individual thumb drives. These

66
flash drives were used on designated laptops to record each session’s data files (i.e., the
dictation word files and the corresponding audio files). This study utilized Lenovo
ThinkPad laptops with AMD II P340 Dual-Core Processors, 4.0 GB RAM with a 64 bit
operating systems running Windows 7 Professional. The computers came pre-loaded
with Microsoft Office Starter that served as the word document environment. Adobe
Audition, a large capacity speech recording program, was loaded on each machine for
audio data collection. The commands glued to each laptop are shown in Figure 4.5.
Figure 4.5. Speech recognition program voice commands. Voice commands from Dragon Naturally Speaking were provided to participants on placards glued to the laptops. Participants dictated punctuation at their discretion. Participants primarily used the “Correct That,” “Scratch That” and “Train That” commands during the intervention sessions.
The headsets used in the intervention were Plantronics 655 DSP digital headsets.
These headsets have flexible booms (microphones) that allow the microphone to be
positioned about one inch away from the mouth and just below the lower corner of the
mouth as recommended in the instructions for DNS. Microphone socks (foam rubber)
covered the microphones to further dampen extraneous noises and sounds. Such noises
were potentially distracting and would occasionally be recorded as dictated output. The
DNS Voice Commands English Spanish Correct That Corregir Eso Scratch That Borrar Eso Train That Entrenar Eso Period Punto
Comma Coma Question Mark Signo de Interrogación Exclamation Mark Signo de Exclamación Dash Guión Next Line Siguiente Línea
Microphone: On ‘Wake Up’ OFF= ‘Go To Sleep’

67
use of the digital headsets reduced the distractions, eliminated the extraneous sounds as
input into the dictations, and improved the recording and playback quality.
School Campus Classroom
The study was conducted on the first floor of a local high school. All of the ELA
classrooms were located next to or across the corridor from one another. With
permission, the researcher used a language lab that was not being used during the
summer. The lab was situated near the ELA classrooms and provided quick and efficient
movement of the participants to and from the computers. The language lab consisted of
30 carrels that included dividers between each of the learning stations. A space of about
six feet separated each row of carrels. The laptops were set up then removed from the
campus each day for security purposes. The researcher and assistant arrived at the
campus at about 7:30 a.m. to set up and test the computer and program functions. The
session schedules were Monday through Thursday, as follows: ELA II: 8:10 to 8:30 a.m.;
ELA III: 8:50 a.m. to 9:10 a.m.; ELA I: 9:30 to 9:50 a.m.
Oral Reading Fluency Measurement
Curriculum based measurement (CBM) was selected because it has been shown to
be valid and reliable measure of oral reading accuracy and rate since 1985. It can be used
repeatedly over a very short period of time, even daily, the measure is sensitive to small
gains in fluency, and the results can be normed at the classroom level (Deno & Marston,
2006; Wright, 1992). Curriculum based oral reading fluency measurements do have
some drawbacks, however. Deno and Marston (2006) note that measurements need to
recur over a period of time, meaning that several measurements are needed to get a

68
reliable indication of a student’s fluency rate. Scott and Weishaar (2003) suggest that
health, events at home, behavioral problems, readability levels, or other “unusual
circumstances” can affect a student’s reading rate. Samuels (2006) suggests that
comprehension measures should be included with fluency measures to get a more reliable
measurement of a student’s fluency level. He claims that without a comprehension
measure, students may “bark at words,” thereby sacrificing comprehension simply to
demonstrate speed. Valencia, Smith, Reece, and Wixon (2010) provide evidence that
longer readings (e.g., reading orally for three minutes) decreases fluency. These factors
contribute to an individual’s variance in oral reading fluency.
Curriculum-based measurements of fluency in oral reading were administered to
treatment and control group participants as pre- and post-test measures. The oral reading
fluency measure suggested by Deno and Marston (2006) requires that participants orally
read three passages for one minute each to generate the necessary data for measuring the
number of correct words read (accuracy) per minute (rate). The median accuracy count is
then taken as the most reliable measurement (Wright, 1992).
Using a modified CBM procedure, participant progress in fluency was tracked for
all members of the treatment group. The modifications to the CBM procedure were that
1) oral readings were produced without a test administrator directing the assessment and
therefore without words being told to the participant after three seconds as directed in the
normal CBM procedure, and 2) passages had been practiced and were familiar to the
participants. Measurements were taken for the first (warm-up dictation) and the final
readings (end-of-session dictation) of each session thus providing about 75 data points for

69
the pre-dictation and 75 data points for the end-of-session dictation readings.
The researcher made two hardcopies of each passage. The researcher and
research assistant used these to mark participant errors on the oral reading fluency
assessment. The assessment recordings were played in Audition and the researcher and
research assistant noted on the hardcopy any words that were mispronounced. If both the
researcher and the assistant recognized that an error was committed, then the word was
marked as an error. If either rater was unsure of whether an error occurred or not, the
part of the passage containing the word was re-played, frequently multiple times, until the
raters could agree on the utterance. Although it was determined prior to the study that a
third rater would be brought in if numerous inter-rater disagreements occurred,
unresolved disagreements occurred for fewer than 20 words overall, thus a third rater was
not needed. The last word read in the 60-second time-frame coincided with the timer
alarm that was audible in all of the recordings. This word was marked on the hardcopy as
the last word read. The number of errors was subtracted from the overall word count to
produce a final words-per-minute rating for the passage.
Interrater Calibration
Prior to the start of the study, and following procedures similar to Rasinski’s
(2003) assessment of oral reading fluency, the researcher and research assistant listened
to several recordings from the pilot trials and marked hardcopies for reading accuracy of
the passages in order to gauge the degree of inter-rater agreement in assessing oral
reading recordings. The research assistant received training in what constituted deletions,
substitutions, and insertions. These kinds of miscues were noted on the hardcopy and
70
then listened to again in order to accept or reject what the raters heard. Initial agreement
was about 90%, with missing or altered inflections such as /s/, /ed/ and /ing/ being the
source for most of the disagreement. By the end of the inter-rater calibration session,
inter-rater agreement was near 100%. Because ratings of participant utterances were
conducted in tandem (both raters always working together) calibration was reinforced
throughout the assessment procedures and all disputed utterances cross-checked. The
word was counted as correct in the few instances that inter-rater disagreement persisted
(fewer than 20 of 21,915 words).
LMNOP Perception Assessment
To assess the students’ perceptions or attitudes, the researcher used an eight-item
instrument at the end of each week. Participants typically spent less than two minutes
completing the eight-item perception assessment. Assessment responses were recorded
and analyzed for changes in participant perception or attitude toward the item targets.
Self-efficacy is often predicated on student perception of the value assigned to the
activity in which the student is engaged (Bandura, 1997). An informal perception
assessment was administered to gain a sense of participants’ self-efficacy, engagement,
and value assigned to the use of the LMNOP program. The assessment was given at the
end of each week of the study. The assessment instrument is displayed in Figure 4.6.
The Perception Assessment responses were correlated to the oral reading fluency
changes over Weeks 1-4. Statement 1 solicited a general perception of school and was
examined for changes during the study. Statements 2 and 3 solicited participants’
perceptions toward using computer based programs for reading. Changes in these

71
responses were compared to Statements 4-8 to gain a sense of whether participating in the
intervention contributed to or detracted from an appreciation of computer technology.
Participant ID#: 12 1 2 3
I enjoy school I like practicing reading on the computer Using the computer helps me learn I need help from someone when using this program
My English pronunciation is getting better My reading speed in English is getting faster Using this speech recognition program is difficult I am becoming a better reader of English
Figure 4.6. LMNOP perception assessment. The instructions read “Instructions: Put a checkmark in the box that shows how you feel about the statement.” Participants responded by indicating their agreement with each statement based on a Likert scale of 1-3 with 1 being negative and 3 being positive.
This provides some insight into whether participants found the program
engaging or not. Table 4.1 shows the assessment and intervention schedule and the time
scheduled for each administration of the assessments.
Table 4.1
Assessment and Intervention Days with Time Allotments
Day *CBM English **LMNOP Perception Assess. Total time (min)
2 5 minutes 5
3-15 Intervention 20 min/session, ~ four sessions per week for four weeks 320
4 3 minutes 3 8 2 minutes 2 minutes 4 12 2 minutes 2 minutes 4 16 5 minutes 2 minutes 7
Note. *CBM recordings on computers. Recordings were assessed outside of intervention sessions using criteria described by Wright (1993).**LMNOP Perception Assessment is also computer-based and the inventory was recorded at the end of intervention sessions.

72
Statements 4 and 7 solicited responses that reflect self-efficacy in using the
program. Statements 5, 6 and 8 solicited responses that reflect participants’ perception of
the benefits of using the program, specifically for improvement in pronunciation, reading
speed, and reading in general.
Data Collection and Word Counts
Deno (1985) suggests that frequent and possibly daily words-per-minute
measurements be charted to track student progress for native speakers. The LMNOP
intervention tracks student oral reading production for each session by recording
participant input in Adobe Audition. This is a large capacity speech recording program.
The final phase of each session required participants to orally read the session’s target
sentences without pause or interruption. These final readings were analyzed for accuracy
and wpm rate by counting the number of correct words minus errors as formulated by
Deno (1985) and described by Wright (1992). Participant productions for each session
were also saved as word documents, thus providing written data for analyses to answer
Research Question 3 that compared DNS to human evaluations. These data were
recorded in an Excel spreadsheet which was formatted to calculate numbers of interest
such as word counts, dictation errors, speech recognition errors, and words-per-minute
rates.
Data Treatment
Each audio recording with its corresponding dictation output text was examined
and coded for accuracy. The output text was copied from the word document and
transposed into an Excel worksheet in a column format. The target text was copied and

73
transposed in a column to the left of the dictation text for comparison purposes. The
worksheet variable headings, from left to right, are:
A. “ses#_pre ID Code” where “ses#” identifies the session,( e.g., ses4,) and “pre”
identifies the text as the first dictation of the session which is also called “warm-up.” The
ID Code identifies a specific participant, (e.g., 102T) is an ELA I participant in the
treatment group. The text in this column is the target text.
B. “DICTATION” identifies the column as the text generated by the participant
during the “warm-up” dictation.
C. “OK ADD” is used to insert codes of 1 and -1 to count a DNS “error.” A code
of 1 indicates that the DNS program did not detect an accurate representation of the target
word, but the raters did hear an accurate representation of the target word. A code of -1
indicates that the DNS program detected an accurate representation of the target word,
but the raters did not hear an accurate representation of the target word. The numbers
were summed and the sum was entered into the spreadsheet in a cell labeled “CREDITS.”
The CREDITS were added to the word count of the DICTATION represented in the
spreadsheet in a cell labeled “DICTATED.”
D. “MATCH” identifies whether the dictation text matches the target text. If the
paired words match, the target word is posted in the corresponding MATCH column cell.
If not, the word “FALSE” is posted in the corresponding MATCH column cell.
E. “OKAY” is a dummy column inserted for optional analyses. This column was
not used in the analyses even though the spreadsheet was programed to post “OK” if the
OK ADD column was coded with 1.

74
F. “DNS ERR” is coded 1 if a 1 or -1 is posted in the OK ADD column. The
DNS ERR column was summed to count the number of words generated by DNS did not
match with the raters’ assessment of the dictated word.
G. “Rater” identifies the word that the rater(s) heard if it differs from the word
generated by DNS.
H. “ses#_post ID Code” #” identifies the session, (e.g., ses4,) and “post”
identifies the text as the final dictation of the session. The columns appearing afterwards
are identical to those used for the “ses#_pre ID Code.”
Figure 4.7 provides an example of the spreadsheet, variable headings and coding
with explication. The “warm-up” dictations and the end-of–session dictations are of
particular interest in the study. The text from each session’s dictations were transposed
into an Excel spreadsheet and assessed by the raters for error through the same
procedures described for error detection for the oral reading fluency assessments
described previously. An adjusted wpm rate was calculated for the “warm up” (pre-
dictation) and the “end-of-session” (post-dictation) dictations. The wpm rates provided
data for the formation of regression curves and ANOVA statistics. Figure 4.8 presents a
detailed look at a portion of a spreadsheet, its headings and coding.
Below the text columns of the spreadsheet are summary data as shown in Figure
4.9. The data include the number of words in the target text, words dictated, inserted off-
target words, inaccurately dictated words (errors), credits, adjusted words, duration of
dictation (seconds and minutes), DNS errors and DNS error percent based on ratio
between DNS errors and number of target-text words, and words-per-minute. The words-

75
per-minute rate was calculated by dividing the number of adjusted words by minutes.
Figure 4.7. LMNOP session spreadsheet. The target text is shown as ses4_pre column. The warm-up dictation target text in column B, and the dictated text is in column D. End-of-session dictation target text is in column L, dictated text in column N. Columns F and P calculate match/mismatch between target text and dictated text. The last 16 rows are summary data calculated by Excel formulas. Values shown are for the truncated example worksheet and not the full session dictation.

76
__________________________________________________________________
_____________________________________________________________________ Figure 4.8. Coding details for participant 101T. The OK ADD column coded 1 corrects for participant’s accurate production of target text when DNS does not output participant utterance. These DNS errors are likely due to lack of training for these words. Raters heard 3 correct productions here while DNS output non-target words. The -1 corrects for a word output by DNS that matched the target text, but the raters heard a word not matching the target text. If the MATCH column contains “FALSE” with no correction in OK ADD column, then a dictation error was made by the participant.
Figure 4.9 illustrates the summary word counts, word insertion counts, DNS error
counts, word counts credited for correction, adjusted word total, and corrected words-per-
minute rate. The coding entered in the worksheet and brief explanations of what the
numbers in the sheet entail are also included. Setting up worksheets in this manner
facilitated word and error counts, along with other calculations such as averages and
percentages for various statistics.

77
Figure 4.9. Summary details worksheet. Formulas are embedded in most of the cells with numbers to facilitate calculation of summary information. “Adj Words” is the total dictated word count adjusted for errors. “DNS PERCENT” is the ratio between “DNS ERROR” and “text words.” “CREDITS” adjust for accurate pronunciation where DNS output a different word. “Inserts” are words uttered by the participant that are not part of the target text. Technical Difficulties
Technical problems were encountered in two sectors: headset functionality and
failed response from DNS during sessions. The use of digital headsets with socks
resolved the problem of picking up extraneous noises and sounds, and produced higher
quality input and output. Another problem, however, was encountered during the pilot
trials: the headphones simply would not work no matter what settings were configured. It
was found that the computer “remembers” the specific port that a digital headset is
initially connected. The Lenovo ThinkPads used in the study have four USB ports.
Connecting a digital headset into any port other than the original port rendered the
headset unusable. Connecting the headsets to the original port resolved the problem. The
USB port used to initially set up a headset were identified and marked with a letter over

78
it. The headset used on a specific computer was labeled with a matching letter. This
promoted the use of the same headset connected to the correct USB port and
circumvented the problem during the study.
Toward the end of Session 3, DNS stopped operating for two participants. The
problem for one participant could not be determined in situ and the program operated
correctly once it was restarted. The other participant had opened Adobe Audition while
the microphone was on. This caused the DNS program to freeze up. Due to these
interruptions, the participants did not complete the session dictations and data were not
collected. The following day, the same problem occurred again for one participant
toward the end of the session and data were not collected. On this same day, a participant
from a different class using a different laptop encountered the same problem. The
researcher could not determine the problems and contacted technical support at Nuance.
Using the same computers that froze up, the intervention process was conducted with
technical support on the phone. No problems were experienced, no possible explanations
were provided and no suggestions were given. The problem did not occur for the
remainder of the study. A possible explanation, though not confirmed for two occasions,
may be related the simultaneous operation of DNS and Adobe Audition.
DNS is designed to operate in a variety of program environments. During the
pilot trials, DNS would “try” to operate in the Audition environment whenever the
microphone was on. Inadvertently dictating in Audition causes DNS to freeze up. To
reduce the chances of this happening during the study, Audition was minimized after it
was started by the researcher so that participants would not accidently select Audition.

79
RESULTS
This study examined the effects of the LMNOP program--the combined
components of repeated reading, self-voice listening, and viewing of dictation output--on
oral reading accuracy and rate. Additionally, the effect of the program on participant
perceptions, and the speech recognition software’s accuracy were examined. In sum, the
treatment group reduced oral reading errors by 50%, reduced mispronunciation of new
vocabulary by 55%, and increased oral reading rate by 16 words-per-minute (wpm). The
speech recognition software was 90% accurate in its identification of participant
utterances. Participant perceptions toward developing reading skills and using technology
for reading were generally positive, with a couple of notable exceptions.
The findings from the study are reported under the general headings of oral
reading accuracy, oral reading rate, voice recognition software accuracy, participant need
for assistance, and participant perceptions. The findings correspond to the study’s
hypotheses, which were all accepted. The major groups were the control and treatment
groups. The participants were further divided into the short group (students who
participated for two weeks) and the long group (students who participated for four
weeks). These two sub-groups were further separated into groups based on their English
language arts (ELA) class levels: ELA I, ELA II, and ELA III.
Due to the complexities of the groupings and the various elements that produced
data, it is important to differentiate the terms used in the report. Most of the terms were
presented in the INSTRUCTIONAL DESIGN and PROCEDURES chapters but are

80
reiterated here to clarify the elements that are discussed below. The oral reading fluency
assessment refers to the pre- and post-assessment of the control and treatment groups.
Because the phrase “oral reading fluency” is used under various conditions, the pre-post
assessment of oral reading fluency will be identified as the acronym ORF to differentiate
it from references to the warm-up and end-of-session dictations that are affiliated with the
intervention sessions. (The end-of-session dictation is referred to as such and should not
be confused with references to the ORF post-test. The warm-up dictation is called the
same and should not be confused with the ORF pre-test.) The ORF assessments are
discussed separately from the assessments from the intervention sessions.
Accuracy errors refer to oral reading accuracy errors in general. Pronunciation
errors are also discussed as a sub-group of oral reading error types. In this discussion,
error reporting mostly follows a format of “error percentage” rather than words-correct-
per-minute (wcpm). The terms ‘warm-up dictation” and “end-of-session” dictation are
used in reference to their position in the intervention sessions. For each session, the
warm-up dictation occurred first, and the end-of-session dictation occurred at the end of
each session. Because the warm-up dictation utilized the passage from the previous day’s
end-of-session dictation, it is conceptually an end-of-session dictation itself, which can be
confusing. Rates and errors were compared for the end-of-session dictation and warm-up
dictations of the same passages. That is, wpm rates and errors were counted for the end-
of-session dictation and compared to the wpm rates and errors for the same passage
dictated 24 hours later for the warm-up dictation.

81
Hypothesis Testing
Data analyses included paired samples t-tests of the oral reading fluency
assessment (ORF), an analysis of the trends for oral reading accuracy and rates for the
intervention group, followed by an evaluation of the software error rate over the four-
week intervention period. The assistance required by the students during the intervention
and student attitudes toward using technology to learn language skills are also presented
in this section.
Oral Reading Fluency Assessment
The results from the study’s ORF assessment for the control and treatment groups
were examined at three levels based on the configuration of the ESL summer school
program described in the PROCEDURES chapter. To reiterate, the summer school
program consisted of two terms, two weeks each, in which students could earn credit for
courses failed during the regular school year. Students could earn course credit after two
weeks of summer school then terminate their summer school studies, or they could
choose to continue for a second two-week term for additional credit. The effect of this
summer school configuration on the current study was that the study had two segments:
one segment with 20 participants covering a two-week period, and a second segment with
9 participants covering a four-week period. Because of this division, four sets of data
were derived from the oral reading fluency assessments that were examined for the two-
week period and the four-week period.
The first data set includes ORF scores from all participants over the first two
weeks of the study and is labeled Level 1. A total of 20 participants were included in the

82
analysis at this level: 10 participants in the control group and 10 participants in the
treatment group. The control group mean for the ORF was compared to the treatment
group means.
Level 2 separated the fluency scores of participants into two sub-groups:
participants who did not continue summer school for the second summer term, and
participants who continued summer school for the second term. These two groups are
labeled short and long respectively. The short sub-group had a total of 11 participants: 6
in the control group, and 5 in the treatment group. The long sub-group had 4 members in
the control group and 5 members in the treatment group.
Level 3 examines the oral reading fluency performances of the long sub-group
over the full four-week study. The mean for the 4 control sub-group participants was
compared to the mean of the 5 treatment sub-group participants. One other data sub-set
came from the long sub-group. Oral reading fluency scores for Weeks 3 and 4 were
added to the data for Weeks 1 and 2 for the long control and treatment groups to allow for
further comparison of the respective means. Table 5.1 shows the number of control and
treatment-group participants separated into sub-groups over the two summer school
terms.
Table 5.1
Group Divisions by Summer School Terms and Sub-Groups Analyzed
Weeks One & Two Weeks Three & Four # Control # Treatment # Control # Treatment
ALL 10 10 short group 6 5 long group 4 5 4 5

83
Oral Reading Fluency: Pre-Post Assessment
Level 1 Analyses
Hypothesis 1 states “ELL participants in English language-arts classes who
receive LMNOP intervention will increase their oral reading fluency more than
participants in English language arts classes without this intervention.” For Level 1, the
control and treatment groups each had 20 data points at the end of the first two weeks of
the ESL Summer School Program. The paired samples t-test (2-tailed, df = 9) was used
to test Hypothesis 1 and the results indicated the treatment group increased their oral
reading rate, on average, by 10 words-per-minute, t = 2.40, p = .04. A similar t-test (2-
tailed, df = 9) was used to test the data collected for the control group which indicated an
increase in the oral reading rate, on average, by 19 words-per-minute. The control group
increase was not statistically significant, t = 2.15, p = .064. The control group’s baseline
rate was 110 wpm, and the treatment group’s baseline rate was 124 wpm. The post-test
rate for the control group was 129 wpm, and the treatment group’s post-test rate was 134
wpm. The control group showed a mean gain of 19 wpm on the post-test. The treatment
group showed a mean gain of 10 wpm. The range between scores for the treatment group
was closer than the control, and the initial t-test found that the treatment group made
statistically significant progress, p= .04, whereas the broader range for the control group
was not found to be statistically significant (p= .064) at p= .05. However, the difference
between .064 (control group) and .04 (treatment group) is rather small.
Because a 19-word increase in oral reading fluency over a four-week period is
considerable in comparison to normal gains over a school year as reported by Hiebert

84
Hiebert, Samuels, and Rasinski (2010), and Rasinski (2003), and because the study
sample was smaller than expected, the data were re-run using a bootstrap statistical
procedure. The bootstrap procedure for the paired samples t-test comparison of oral
reading rate (2-tailed, df = 9) found p = .073 for the treatment group and (2-tailed, df = 9)
p = .062 for the control group with an alpha of p< .05. Neither the control nor the
treatment group reached significance at an alpha level of p<.05, which is not surprising
considering the small sample size.
An examination of the oral reading fluency means for the control and treatment
groups reveals that while the overall gains by the control group were twice that of the
treatment group, the treatment group had an oral reading fluency rate that was 4.1 wpm
higher than the control group at the end of the first two weeks. The control group started
with a benchmark of 111 words-per-minute (wpm) and a final mean of 130 wpm, a gain
of 19.3 wpm over the two-week term. The treatment group started with a higher
benchmark of 124 wpm and ended with a mean of 134 wpm, a gain of 9.8 wpm over the
two-week period. Using this metric, it appears that the control group gained 9.5 wpm
more than the treatment group.
However, a look at the radical changes in wpm performances by some members
of each group, as found in Table 5.2, revealed that the oral reading fluency measurements
may have been subject to factors that influence oral reading rates such as whether the
participant was focused on accuracy or on rate (Samuels, 2003), or some other factor(s)
as discussed in the PROCEDURES chapter. The benchmark mean was 117.6 wpm for all
20 participants and provided the most reliable reading rate for the participants as a whole.
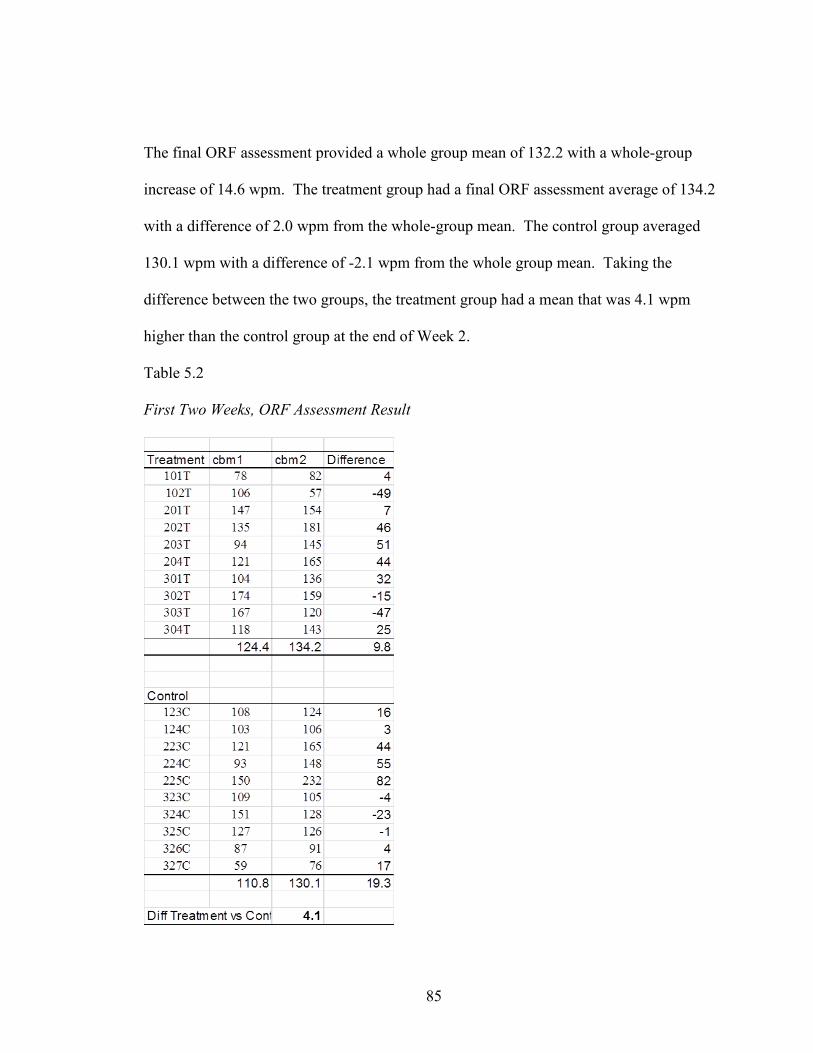
85
The final ORF assessment provided a whole group mean of 132.2 with a whole-group
increase of 14.6 wpm. The treatment group had a final ORF assessment average of 134.2
with a difference of 2.0 wpm from the whole-group mean. The control group averaged
130.1 wpm with a difference of -2.1 wpm from the whole group mean. Taking the
difference between the two groups, the treatment group had a mean that was 4.1 wpm
higher than the control group at the end of Week 2.
Table 5.2
First Two Weeks, ORF Assessment Result

86
The ORF performances discussed above are not very reliable considering that
there were only two assessments and a total of 20 data points for each group available for
comparisons. As Wright (1992) explains, it takes many assessments to get an adequate
estimate of reading rate. Two assessments are not enough to yield a reliable, comparable
measure. An analysis of the treatment and control groups at Level 2 provide a different
perspective of the reading rates for the groups.
Level 2 Analyses
The division of the whole group into sub-groups of short and long was prompted
by the presence of very large increases and decreases in wpm within each group over the
first two weeks. Fluctuations are attributed primarily to locus of attention, although
changes in goals or text familiarity could have influenced the increases, as well as other
factors discussed previously. In other words, the fluctuations exhibited through the oral
reading fluency measurements were possibly due to whether the participant was focused
on accuracy or whether the focus was on rate (Samuels, 2003). This raised a question of
whether there was a fundamental difference---such as reading skill level or course
enrollment ---between the participants who stayed for two weeks as opposed to those
who remained for four weeks.
Table 5.3 shows the performance values for the oral reading fluency assessments
for the short and long sub-groups. For the short sub-group, a difference of 4.8 wpm
favoring the treatment group was found with a baseline of 105 wpm for both the
treatment and control groups.

87
Table 5.3
ORF Performance Values for the Short and Long Group: First Two Weeks
A very different story appears for the long sub-group. The nine students in the
long group, as a whole, had a baseline mean of 132.8 and a final mean of 154.3. The
treatment group was 2.5 wpm below the whole-group mean. The control group was 3.2
wpm above the whole-group mean. The difference between the control and treatment
groups was 5.7 wpm favoring the control group. Figure 5.1 provides a visual summary of
the first two-week findings.
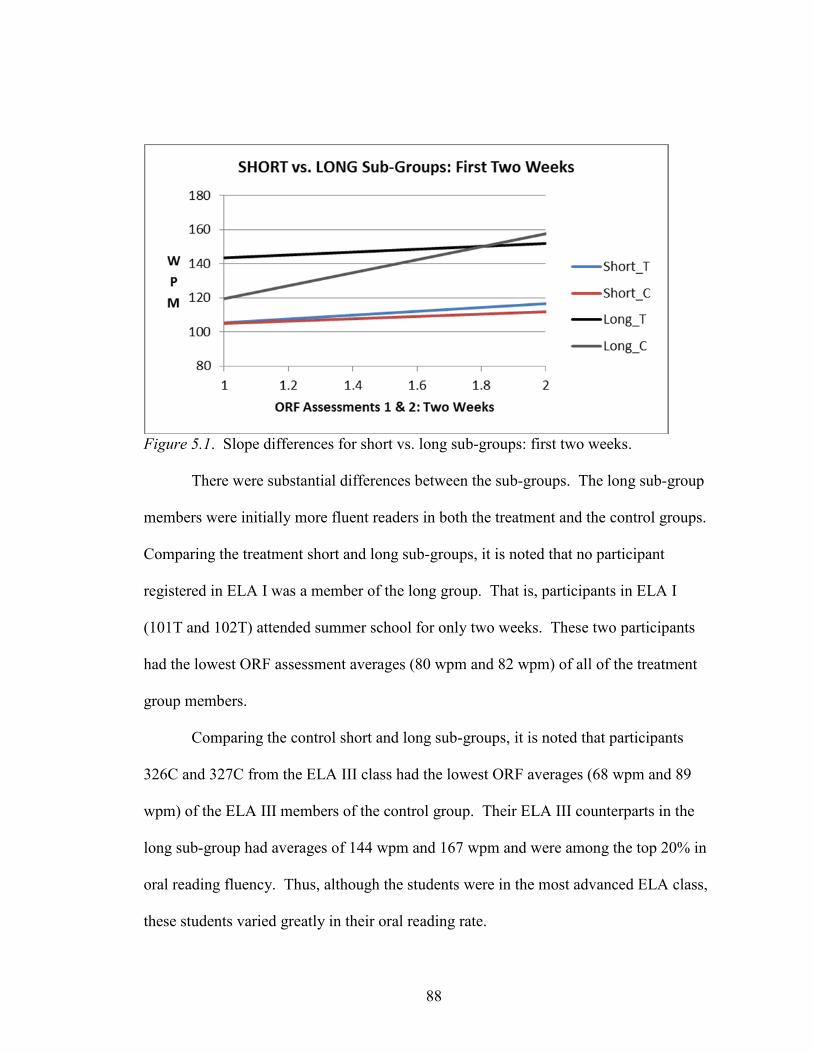
88
Figure 5.1. Slope differences for short vs. long sub-groups: first two weeks.
There were substantial differences between the sub-groups. The long sub-group
members were initially more fluent readers in both the treatment and the control groups.
Comparing the treatment short and long sub-groups, it is noted that no participant
registered in ELA I was a member of the long group. That is, participants in ELA I
(101T and 102T) attended summer school for only two weeks. These two participants
had the lowest ORF assessment averages (80 wpm and 82 wpm) of all of the treatment
group members.
Comparing the control short and long sub-groups, it is noted that participants
326C and 327C from the ELA III class had the lowest ORF averages (68 wpm and 89
wpm) of the ELA III members of the control group. Their ELA III counterparts in the
long sub-group had averages of 144 wpm and 167 wpm and were among the top 20% in
oral reading fluency. Thus, although the students were in the most advanced ELA class,
these students varied greatly in their oral reading rate.

89
Level 3 Analyses
The third level of analysis consists of the second two-week period in which
students could earn additional credit for failed courses. The total number of participants
for this period of summer school is nine: five participants in the treatment group and four
participants in the control group. The individual scores and the group means were useful
in understanding the oral reading rate gains of the members in this sub-group. Table 5.4
presents the oral reading rates for the long group.
Table 5.4
ORF Assessment Scores: Long Control vs. Treatment: Four Weeks
Note. The differences between the treatment and control at the end of Weeks 2 and 4 were calculated by subtracting the long C group averages for CBM 2 and CBM 4 from the long T group averages for CBM 2 and CBM 4. The column “diff” is the difference between CBM 1 and 2, and CBM 3 and 4 for each individual participant.
For the first two weeks, the control group showed greater gains in oral reading
rate than the treatment group. This is most likely an artifact of the performances of a
couple of students in the control group during the first oral reading assessment. Notice
Long_T cbm1 cbm2 diff cbm3 cbm4 diff201T 147 154 7 157 163 6202T 135 181 46 150 173 23203T 94 145 51 121 129 8302T 174 159 -15 174 201 27303T 167 120 -47 158 175 17Average 143.4 151.8 8.4 152 168.2 16.2
Long_C123C 108 124 16 158 135 -23224C 93 148 55 125 141 16225C 150 232 82 210 205 -5325C 127 126 -1 158 170 12Average 119.5 157.5 38 162.75 162.75 0
Diff Treat vs Control -5.7 5.45
LONG ONLY ORF SCORES: 2 Weeks & 4 Weeks

90
the 82 wpm increase for participant 225C, and also 55 wpm increase for 224C. The final
performances on CBM4 averaged 168 wpm for the treatment group and 163 wpm for the
control group. The treatment group averaged 5.5 wpm more than the control group at the
end of the study. Figure 5.2 provides a graphic look at the data for the treatment group
over the four-week study.
The precipitous, early rise of the control group’s (long C) wpm rate may have
been due to the control group participant’s initially focusing on accuracy, and then more
on rate for the second ORF assessment. As seen in Figure 5.2 over the last three weeks,
the control group’s reading rate was fairly consistent at about 163 wpm. The participants
in the control group were initially 11 wpm faster in oral reading than the treatment group.
Figure 5.2. ORF performances, treatment & control for four weeks.
The LMNOP participants, however, showed a surge in reading rate between
Weeks 3 and 4, the last week of the study, with an final rate that was 5.5 wpm greater
than the control group. The treatment group’s mean increase in the last week was 16
100
110
120
130
140
150
160
170
180
1 2 3 4
WPM
ORF Assessment
Long Treatment & Control ORF Values: 4 Weeks
LongT
LongC

91
wpm. In comparison to the annual wpm gains of 10-20 wpm typically achieved by
native-English speaking eighth-grade students (Kuhn et al., 2010; Rasinski, 2003), the
fluency gains among ELLs associated with the intervention support the use of the
LMNOP program.
Hypothesis 1 states “ELL participants in English language-arts classes who
receive LMNOP intervention will increase their oral reading rate more over a four-week
instructional period than participants in English language arts classes without this
intervention.” Hypothesis 1 is accepted. Students in both the short and long groups
achieved roughly 5 wpm more in oral reading rate than the control group.
Oral Reading Accuracy
Hypotheses 2 predicted that ELL participants in English language-arts classes
who received the LMNOP intervention would increase their oral reading accuracy over
the four weeks included in the instructional period covered by this study. Four sets of
data pertaining to oral reading accuracy were derived in this study: 1) the pre-post oral
reading fluency assessments 2) the pre-dictation accuracy error percentages for 12
sessions, 3) the end-of-session dictation accuracy error percentages for 12 sessions, and
4) the mean percentage of the combined pre- and end-of-session dictation accuracy
errors.
The initial overall error-percentage average, counting both the warm-up (pre-
dictation) and final dictation (end-of-session dictation) errors for each session, was .13,
meaning that as a group and averaging errors for the pre-dictation and end-of-session
dictation, 13 % of the participant utterances did not match the target words presented in

92
the passages for Session 1. By the final session (session 12) the error percentage dropped
to .06 for both the warm-up and end-of-session dictation. The warm-up dictation errors
decreased significantly, on average, from 15% to 6%, R =.72, F(1,10) = 10.93, p < . 01.
The end-of-session dictation error percentage dropped significantly from 11% to 6%, R
=.72, F(1, 10) =10.5, p <.01. Figure 5.3 shows the accuracy-error percentages trendlines
for the pre- and end-of-session dictation averages. Greater improvement in accuracy was
achieved on the end-of-session dictation. The warm-up dictation trended 2% higher in
error-percentage.
Figure 5.3. Accuracy error-percentages for warm-up and end-of-session dictation for four weeks. The logarithmic curve provided the best fit to the data in comparison to quadratic and exponential curves. By Session 12, both the warm-up and final dictation pronunciation-accuracy errors had dropped to 6% trending downward. Passages 1-5 include data from short and long groups; thereafter, only long group metrics are represented. Pronunciation Accuracy
An analysis of the results regarding pronunciation accuracy for the first two

93
weeks of the study suggested that participants focused on newly encountered words and
phrases more than words and phrases that were more familiar to them. Participants
demonstrated accurate pronunciation of the vast majority of the text during the individual
sentence training, and focused mostly on training unfamiliar words before dictating the
end-of-session dictation. New vocabulary included words such as pigeons, salamanders,
velvety, pale, anemic, taloned, wisps, mangers, talcum, burlap, panes, charades,
twitched, riveter, looping, and sloping. Approximately 54% of the newly encountered
words (as determined by warm-up dictation mispronunciations) that participants trained
on did not appear as errors on the end-of-session dictation.
Word-reading accuracy errors entailed substitutions (including non-word
substitutions resulting from mispronunciations), omissions, and partials (deleted bound
morphemes, prefixes and suffixes) as described by Goodman, Watson and Burke (1987).
About 80% of the miscues were related to familiar text which were replaced with
substitutions, for the most part, or omitted.
Retention and transfer of word learning was demonstrated by participants on the
following day’s warm-up dictations. Approximately 56% of the newly encountered
words from the previous day’s session did not appear as errors on the warm-up dictation.
This was a 2% improvement over the end-of-session dictation from the previous day.
The short group had the greatest percentage of pronunciation errors at 34% and
35% for the post- and warm-up dictations, relative to the total number of oral reading
errors over the first two weeks. Sixty percent of the pronunciation errors were
remediated during the session training periods. That is, 40 of the 67 mispronounced

94
words were pronounced correctly during the end-of-session dictation. Correct
pronunciation of 38 of those words was retained and transferred to the warm-up dictation
24 hours later. While the short group gained the most in this area, the 39% pronunciation
error reduction for the long group was also notable. Pronunciation error reduction
improved even more for the long group during the second two-week period, reaching
49% by the end of the study.
Accuracy Percentage for the Short group, Two-Week Period
The accuracy-error percentages for the warm-up and final dictations for the short
sub-group were analyzed to estimate the effect of the LMNOP program on the sub-group
with the lowest ORF performances. The initial accuracy error-percentage mean was 19%
for the ELA short groups (in aggregate) on the warm-up dictation. The error-percentage
dropped from session 1 through session 4 reaching a low-point of 8% at session 4. The
error-percentage curiously rose to 12%, an increase of 4%, for the last session of the first
two-week period (Session 5). Equally curious was a parallel rise between sessions 4 and
5 for the final dictation as seen in Figure 5.4. A review of the lexile levels for the reading
passages revealed that the reading passages for both the Session 5 warm-up and the final
dictations were the most difficult passages used in the intervention for ELA I and II. The
readability levels seemed to account for the sharp rise in accuracy. This same decrease in
accuracy was also evident in the long group’s performance.
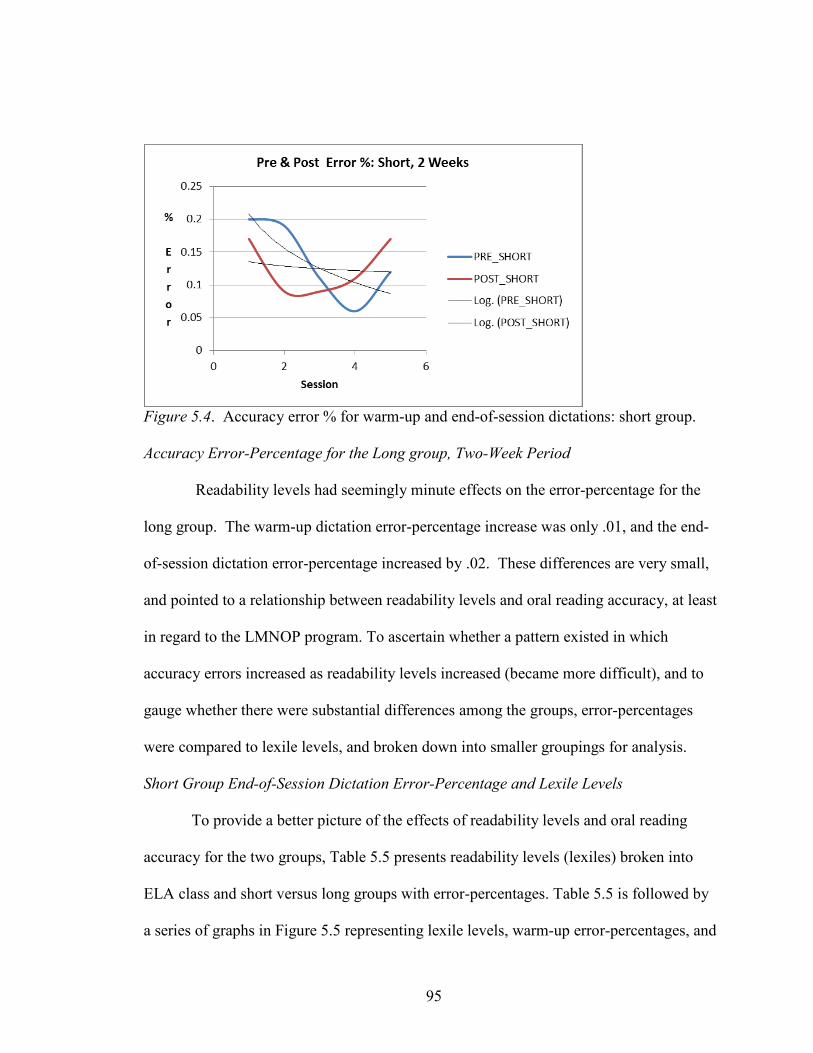
95
Figure 5.4. Accuracy error % for warm-up and end-of-session dictations: short group. Accuracy Error-Percentage for the Long group, Two-Week Period
Readability levels had seemingly minute effects on the error-percentage for the
long group. The warm-up dictation error-percentage increase was only .01, and the end-
of-session dictation error-percentage increased by .02. These differences are very small,
and pointed to a relationship between readability levels and oral reading accuracy, at least
in regard to the LMNOP program. To ascertain whether a pattern existed in which
accuracy errors increased as readability levels increased (became more difficult), and to
gauge whether there were substantial differences among the groups, error-percentages
were compared to lexile levels, and broken down into smaller groupings for analysis.
Short Group End-of-Session Dictation Error-Percentage and Lexile Levels
To provide a better picture of the effects of readability levels and oral reading
accuracy for the two groups, Table 5.5 presents readability levels (lexiles) broken into
ELA class and short versus long groups with error-percentages. Table 5.5 is followed by
a series of graphs in Figure 5.5 representing lexile levels, warm-up error-percentages, and

96
end-of-session error-percentages.
An examination of the graphs for the short group in the first column of Figure 5.5
shows a positive correlation between the lexile levels and end-of-session dictation error-
percentages over the first three sessions. As lexile levels increased or decreased, the end-
of-session dictation error-percentages increased or decreased accordingly for each ELA
class. Session 4 showed a reversal of the pattern for each ELA class.
Table 5.5
Warm-Up & End-of-Session Error Percentage & Lexile Levels by ELA Course: Short & Long
Passage Lexile End-of-Session Accur Warm-Up Accur End-of-Session Accur Warm-Up AccurELA 1 Short
1 1240 0.31 0.292 870 0.17 0.343 830 0.08 0.074 820 0.10 0.085 1350 0.11 0.08
ELA2 Short ELA2 Long1 430 0.07 0.17 0.06 0.052 570 0.11 0.01 0.10 0.073 560 0.03 0.13 0.06 0.084 1090 0.01 0.02 0.08 0.065 1130 0.09 0.07 0.11 0.086 940 0.11 0.077 410 0.06 0.098 420 0.04 0.059 1130 0.06 0.10
10 1000 0.06 0.0911 760 0.06 0.1012 1070 0.08 0.06
ELA3 Short ELA3 Long1 910 0.21 0.10 0.05 0.132 810 0.21 0.12 0.05 0.043 530 0.18 0.15 0.05 0.074 710 0.13 0.15 0.05 0.065 450 0.17 0.20 0.04 0.076 1130 0.05 0.067 600 0.06 0.078 480 0.05 0.079 940 0.05 0.09
10 400 0.07 0.0711 470 0.06 0.0512 700 0.05 0.06

97
Figure 5.5. ELA groups: error percentage vs. lexile levels, first two weeks
In Session 4, the ELA I passage decreased in difficulty and oral reading errors
increased. The ELA II passage increased in difficulty, but oral reading accuracy rates
errors decreased. The same was true for ELA III. Lexile levels increased as did oral
reading errors for each ELA class in Session 5, except for ELA III. Oral reading errors
increased, yet the passage had the lowest lexile level of all of the ELA III passages. In
sum, there was variance in the relationship between reading errors and text difficulty, but
in general as text became more challenging, these ELLs made more pronunciation errors.
This was expected and aligns with current reading research with native speakers.
0
200
400
600
800
1000
1200
1400
1600
0.00
0.05
0.10
0.15
0.20
0.25
0.30
0.35
0.40
0 1 2 3 4 5 6
Lexile
Passage
ELA 1 Short Error% & Lexile Levels
Post Accuracy
Pre Accuracy
Lexile
0
200
400
600
800
1000
1200
1400
0.000.020.040.060.080.100.120.140.160.18
0 1 2 3 4 5 6
Lexile
Passage
ELA 2 Short Error % & Lexile Levels
Post Accuracy
Pre Accuracy
Lexile
01002003004005006007008009001000
0.00
0.05
0.10
0.15
0.20
0.25
0 1 2 3 4 5 6
Lexile
Passage
ELA 3 Short Error% & Lexile Levels
Post Accuracy
Pre Accuracy
Lexile
0
200
400
600
800
1000
1200
1400
0.00
0.02
0.04
0.06
0.08
0.10
0.12
0 1 2 3 4 5 6
Lexile
Passage
ELA 2 Long Error% & Lexiles: 2 Weeks
Post Accuracy
Pre Accuracy
Lexile
01002003004005006007008009001000
0.00
0.02
0.04
0.06
0.08
0.10
0.12
0.14
0 1 2 3 4 5 6
Lexile
Passage
ELA 3 Long Error % & Lexiles: 2 Weeks
Post Accuracy
Pre Accuracy
Lexile

98
Long Group End-of-Session Dictation Error-Percentage and Lexile Levels
An examination of the ELA II graph for the long group in the second column of
Figure 5.5 shows that a positive correlation exists between the lexile levels and end-of-
session dictation error-percentages over all five of the sessions. The ELA III chart for the
long group, however, shows only a 1% drop in oral reading error in Session 5, thus
indicating that lexile levels had little effect on oral reading errors for these more
advanced readers. (Note: The curve in the chart rises at passage 3 but should not because
the error-percentages for passages 1-4 are all 5%. Excel charts are imprecise and should
be interpreted cautiously). Because the pattern differs dramatically from all of the other
group patterns, it might be concluded that the more advanced readers were less affected
by readability levels. However, there is another factor that needs to be considered. The
ELA III passages from the texts selected for this summer school program had the lowest
lexile levels among the three ELA classes. Advanced readers should be expected to have
higher fluency rates on easier texts.
Warm-Up Dictation Error-Percentage and Lexile Levels
Regarding the error-percentages for the warm-up passages, an overall opposite
effect was found in comparison to the end-of-session dictation findings. In general, the
easier passages resulted in higher oral reading errors, while the difficult passages had
lower errors after 24 hours of reading the same text as an end-of-session dictation.
Passages with lower lexiles contained words and phrases that participants were
comfortable with, and they did not attend as strictly to the accuracy of these utterances
when read at higher rates. Errors due to substitutions and omissions of known, higher

99
frequency words account for the increased error percentage. New words and phrases,
such as those found in passages with higher lexiles, were addressed more stringently by
the participants and resulted in fewer errors on the more difficult passages. Essentially,
students did better the next day on words that they had focused on during the previous
day’s dictations. This is an expected training effect.
Long Group Dictations and Lexile Levels, Last Two Weeks
Error percentages and lexile levels for the long group exhibited stronger
relationships over the final two weeks of the study. As seen in Figure 5.6, the curves for
the lexile levels, warm-up and end-of-session dictation error-percentages were generally
parallel (except for the ELA III end-of-session dictation, addressed below). This
indicated that the more advanced readers showed greater accuracy for both the familiar
and less familiar text during the last two weeks of the study. It can be inferred that longer
use of the LMNOP program supported accuracy improvements not only for new words,
but for familiar words and phrases as well.
As discussed previously, ELA III passages had lower lexile levels, and error-
percentages stayed within a very narrow range. Over the entire study, the error-
percentage remained between 5% and 7% for the end-of-session dictation measurements.
Readability levels had little effect on accuracy for the end-of-session dictations after
these participants trained with the words and phrases presented during the intervention
sessions. That is, the training afforded through the intervention may have reduced the
effect that lexile level had on oral reading accuracy. The same was not true for the warm-
up dictation.

100
In the last two weeks, the warm-up error-percentages closely paralleled the lexile
levels, evincing that lexile levels may have affected accuracy for these more advanced
readers. This is a typical pattern. Practice during the intervention session reduced the
effect that passage readability had on the end-of-session dictation, but the training did not
transfer to the following session’s warm-up dictation.
Figure 5.6. Oral reading accuracy error vs. lexile level: last two weeks. Rate Gains during the Intervention
Gains in oral reading rate for the warm-up and end-of-session dictation were
examined to identify the effects of the LMNOP program on participants after 24 hours or
more. Table 5.6 provides a summary of the data collected for the warm-up and end-of-
session dictations across the study including the warm-up and end-of-session dictation
averages for the short and long groups combined over the first two weeks. As described
in the PROCEDURES chapter, the warm-up dictation segments consisted of roughly the
0
200
400
600
800
1000
1200
1400
0.00
0.02
0.04
0.06
0.08
0.10
0.12
5 7 9 11 13
Lexile
Passage
ELA 2 Long Error % & Lexiles: Last 2 Weeks
Post Accuracy
Pre Accuracy
Lexile
0
200
400
600
800
1000
1200
0.000.010.020.030.040.050.060.070.080.09
5 7 9 11 13
Lexile
Passage
ELA 3 Long Error % & Lexiles: Last 2 Weeks
Post Accuracy
Pre Accuracy
Lexile
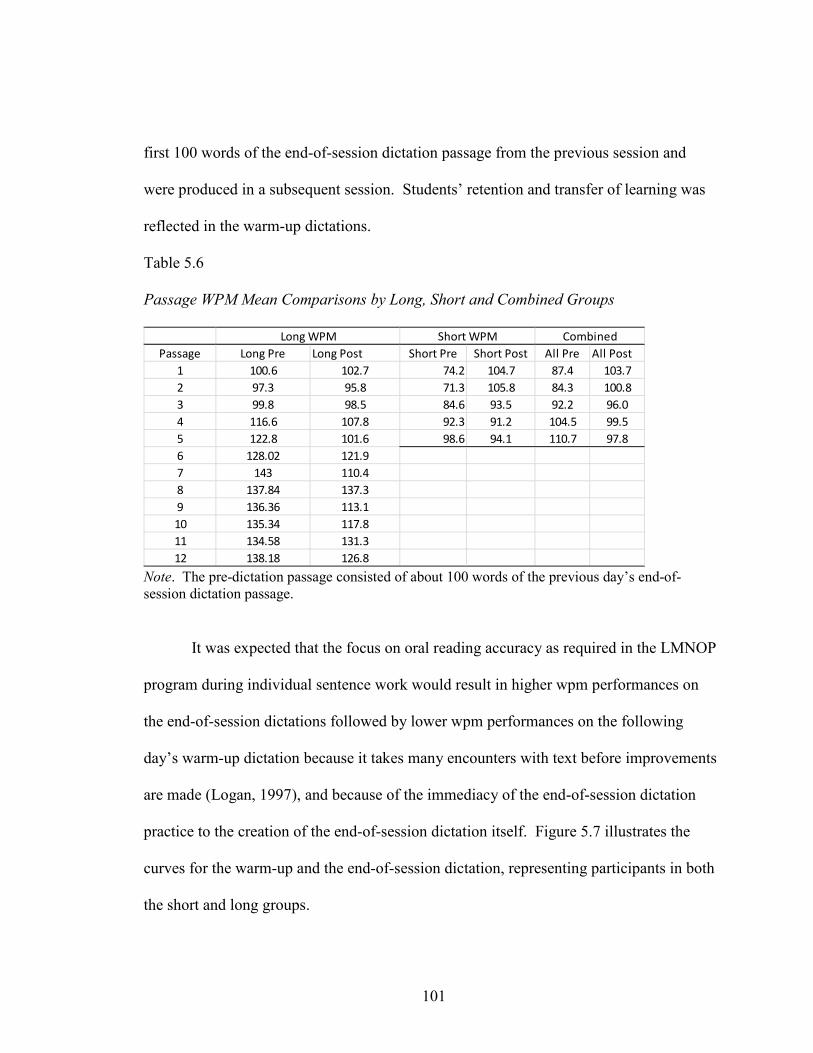
101
first 100 words of the end-of-session dictation passage from the previous session and
were produced in a subsequent session. Students’ retention and transfer of learning was
reflected in the warm-up dictations.
Table 5.6
Passage WPM Mean Comparisons by Long, Short and Combined Groups
Note. The pre-dictation passage consisted of about 100 words of the previous day’s end-of-session dictation passage.
It was expected that the focus on oral reading accuracy as required in the LMNOP
program during individual sentence work would result in higher wpm performances on
the end-of-session dictations followed by lower wpm performances on the following
day’s warm-up dictation because it takes many encounters with text before improvements
are made (Logan, 1997), and because of the immediacy of the end-of-session dictation
practice to the creation of the end-of-session dictation itself. Figure 5.7 illustrates the
curves for the warm-up and the end-of-session dictation, representing participants in both
the short and long groups.
Passage Long Pre Long Post Short Pre Short Post All Pre All Post1 100.6 102.7 74.2 104.7 87.4 103.72 97.3 95.8 71.3 105.8 84.3 100.83 99.8 98.5 84.6 93.5 92.2 96.04 116.6 107.8 92.3 91.2 104.5 99.55 122.8 101.6 98.6 94.1 110.7 97.86 128.02 121.97 143 110.48 137.84 137.39 136.36 113.110 135.34 117.811 134.58 131.312 138.18 126.8
Long WPM CombinedShort WPM

102
Figure 5.7. WPM gains for first 2 weeks: all.
Initially, the expected pattern was exhibited where practice and immediacy
contributed to higher rates on the end-of-session dictation readings. This was not the
case after the first three sessions, as seen in Figure 5.7. In Session 4, the warm-up
dictation rate was 5 wpm higher than the end-of-session dictation rate. For example, the
warm-up performance on Passage 5 was 10 wpm greater than the end-of-session dictation
performance. As shown in Figure 5.7, the pattern was the same for the short and long
groups.
It was expected that improvements in oral reading fluency would manifest after
many encounters with the texts as suggested by Logan (1997), and Kuhn et al. (2010).
As seen in Figures 5.8 and 5.9, the average warm-up dictation wpm rates continuously
increased from Session 3 through Session 7, at which point the rate leveled out at around
138 wpm for the final week of the study. It was over this final week of the study that the
treatment group showed a significant acceleration in word reading rate on the ORF

103
assessment, gaining 16 wpm and surpassing the control group’s performance by 5 wpm.
Figure 5.8. Warm-up dictation rates, short and long groups: first two weeks.
At the end of Week 2, the long group participants averaged 123 wpm in oral
reading fluency. By the end of Week 4, the group average was 138 wpm, an additional
increase of 15 wpm. This gain closely matches the ORF gain of 16 wpm over the last
two weeks, thus providing a second set of data to support the claim that the LMNOP
program contributed to a 16 wpm increase in oral reading rate over the last two weeks of
the study for the long group. The long group progressed from 101 wpm to 123 wpm over
the first two weeks, a gain of 22 wpm. The short group gained 25 wpm in the same
period.

104
Figure 5.9. Warm-up (pre) and end-of-session (post) dictations: rate gains over four weeks: long group.
Hypothesis 3 states “ELL participants in English language-arts classes who
receive the LMNOP intervention will increase their oral reading rate over a four-week
instructional period.” Findings from both the ORF assessments and the intervention
session data support the hypothesis, which is accepted.
Correlation between Accuracy Error-Percentage and WPM Rates
According to Samuels (2004), rate increases as word recognition becomes
automatic. In other words, as accuracy increases and becomes automatic (an indication
of word recognition), rate is expected to increase. If cognitive resources (attention) are
required to achieve accuracy, then rate is expected to be inhibited. Similarly, Logan
(1997) and Kuhn et al. (2010) note that accurate recognition is not expected until after
many encounters with new words or phrases. Results from this study indicate that
changes in rate corresponded with changes in error-percentages in different ways,

105
according to whether the dictation was an end-of-session dictation or a warm-up
dictation, and by group (i.e., students in the two-week versus four-week programs). On
average, both groups increased in rate about equally on the warm-up dictation over the
first two weeks of summer school. The students in the short groups also made
considerable gains in accuracy. While it appears that slower readers benefited most from
use of the intervention, the gains in rate for the faster readers were also considerable even
though improvements in accuracy were slight. The students in the long groups also made
considerable gains in rate during the second two weeks of summer school.
Short Group Error Percentages and Rate Correlations
Figure 5.10 is a series of charts that compare error-percentages to wpm at a more
discrete level than previously discussed. Side-by-side comparisons between the short and
long groups for the first two weeks of summer school are shown. This affords insight
into how the LMNOP program affected the short and long groups differently regarding
error percentages and wpm rates, and whether the correlations between error and wpm
rates were consistent for both groups.
For the first two sessions of the warm-up dictation, the short group had an average
oral reading rate of 77 wpm. For the last three sessions, the group improved on the target
texts to a great degree and oral reading rate increased to a mean of 100 wpm. As errors
decreased, rates increased, thereby indicating that the participants had achieved a level of
automaticity on the texts after 24 hours of practicing the passages. On the end-of-session
dictation, accuracy errors and wpm rates were relatively high for Passage 1 as illustrated
in the graphs presenting the curves for the end-of-session dictation in Figure 5.10.

106
Figure 5.10. Accuracy vs. wpm: pre- & post dictations, short & long groups. The Log. is the logarithmic trendline (black line) for the percentage of oral reading accuracy errors.
With a focus on accuracy during the intervention sessions, error-percentages fell
consistently through Passage 4. As errors decreased, rate also consistently decreased,
demonstrating that automaticity had not been achieved, and that the participants were
cautious with their pronunciation. While automaticity was not expected on newly
encountered words and phrases, a continuous reduction in rate was not expected, either.
Participants appeared to have had increasingly heightened awareness of their
0.0
20.0
40.0
60.0
80.0
100.0
120.0
0.00
0.05
0.10
0.15
0.20
1 2 3 4 5 6
Error
%
Passage
2 Week Short Accuracy vs WPM: Warm-Up Dictation
Pre Accuracy
Pre WPM
Log. (Pre Accuracy)
90.092.094.096.098.0100.0102.0104.0106.0108.0
0.000.020.040.060.080.100.120.140.160.180.20
1 2 3 4 5 6
Error
%
Passage
2 Week Short Accuracy vs WPM: Post Dictation
Pre Accuracy
Post WPM
Log. ( Post WPM)
020406080100120140160
0.00
0.02
0.04
0.06
0.08
0.10
1 3 5 7 9 11 13
Error
%
Passage
4 Week Long Accuracy vs WPM: Warm-Up Dictation
Long Pre Accur
Long Pre WPM
Log. (Long Pre Accur)
0
20
40
60
80
100
120
140
160
0.000.010.020.030.040.050.060.070.080.09
1 3 5 7 9 11 13
Error
%
Passage
4 Week Long Accuracy vs WPM: Post-dictation
Long Post Accur
Long Post WPM
Log. (Long Post Accur)
94
96
98
100
102
104
106
108
110
0.000.010.020.030.040.050.060.070.080.09
1 2 3 4 5 6
Error
%
Passage
2 Week Long Accuracy vs WPM: Post Dictation
Post Accuracy
Post WPM
Log. (Post Accuracy)
0
20
40
60
80
100
120
140
0.00
0.02
0.04
0.06
0.08
0.10
1 2 3 4 5 6
Error
%
Passage
2 Week Long Accuracy vs WPM: Warm-Up Dictation
Pre Accuracy
Pre WPM
Log. (Pre Accuracy)

107
pronunciation difficulties and slowed their speech rates during the end-of-session
dictations in order to achieve accuracy on the oral reading. This, theoretically, led to
retention and transfer of learning as reflected on the following day’s warm-up dictation.
Long Group Accuracy Error and WPM Correlations
The long group’s mean performance on the end-of-session dictation over the first
two-week period consistently followed an expected inverse correlation between oral
reading rate and oral reading errors. As error-percentage increased, wpm decreased and
vice versa. On the warm-up dictations, the wpm rate remained constant over the first
three passages while the error-percentage oscillated slightly. Afterwards, improvements
were 9 wpm and 21 wpm on passages 4 and 5 respectively, mirroring the gains achieved
by the short group on the warm-up dictation.
In short, there was an inherent difference between the short and long groups. The
short group students exhibited greater caution on the end-of-session dictation and read at
slower rates even though the students reduced their error percentages through practice
during the sessions. The long group, however, increased in oral reading rate as error
percentages decreased. This difference between the short and long groups essentially
disappeared on the warm-up dictation where both groups demonstrated high gains in rate
as errors decreased for the short groups, and fluctuated only slightly for the long group.
So in spite of reading slower as they focused on accuracy during the end-of session
dictations, the students showed rate increases that were equal to the more advanced
readers on the warm-up dictation. The careful attention given to accuracy apparently
provided high returns in rate the following day.

108
Over the last two weeks, the end-of-session dictation for the long group
essentially continued the inverse correlation. The warm-up dictation pattern of
oscillations in error-percentage and continuous increases in rate through Passage 7. At
that point, wpm rates leveled out at around 138 wpm. The error-percentage spiked on
Passage 9, then consistently fell through Passage 12 to about 138 wpm. As discussed
previously, Passage 9 had high lexile levels for both ELA II and ELA III passages. The
lexile levels account for the spike on passage 9.
The leveling of wpm rate over the last four passages suggests that the students in
the long group had reached their developmental ceiling of 138 wpm. This ceiling
represents a comfortable, natural speech rate for oral reading. It was seen on the ORF
assessment that the students could achieve higher, but these higher rates represent rates
that were achieved in a testing environment and may not reflect a more relaxed, daily,
oral reading rate such as that found for the warm-up dictation.
Overarching conclusions regarding accuracy and rate among students in this study
are that accuracy gains were more pronounced for the less skilled readers in the short
group, and oral reading rate increased about equally for both the short and long groups
over the first two weeks of the study. Attention to accuracy on the end-of-session
dictation coincided with lexile levels for both the short and long groups, and attention to
accuracy on the end-of-session dictation resulted in lower wpm rates on the first seven
passages. Lower error percentages led to increased wpm rates over the last five passages
on the end-of-session dictation for the students in the long group. Performances on the
warm-up dictations indicated that the LMNOP program supported students in their oral

109
reading rate after 24 hours, and that rate increase occurred regardless of shifts in error-
percentages. An apparent ceiling was reached on Passage 7 for the warm-up dictation,
and this mean of about 138 wpm was maintained for the remaining duration of the study.
Software Accuracy
Hypothesis 4 predicted that the speech recognition software would achieve a high
correlation with human evaluators as the software was “trained” by participants as
individual users across the four-week instructional period. Word identification of the
speech-recognition software matched with human evaluations at 90% at the end of the
study. The mean for the pre- and end-of-session dictation DNS errors together was .10.
The number of dictated words and DNS errors for the pre- and post-sessions are
presented in Table 5.7.
Hypothesis 4 states that “Speech recognition software word identification will
correlate with human raters at 80% or higher after a four-week intervention using
LMNOP” and was supported by evidence in the study.
Table 5.7.
DNS Word and Error Counts
# of words # of errors % of errors Total Pre 7600 Pre Errors 955 0.12 Total Post 14315 Post Errors 1232 0.08 Overall 21915 a Overall 2187 b 0.1
a Pre-dictation passages were approx. 100 words in length, and end-of-session dictation passages were approx. 200 words long, which accounts for the difference in total number of words between the pre- and end-of-session dictation. b Errors in dictations were not corrected because of time constraints, and this most likely contributed to an increase in DNS errors that resulted in a lower accuracy percentage.

110
Student Assistance
The perception assessment included statements regarding each participant’s
perception toward LMNOP usability and the need for assistance in using the technology
during each session. The assessment was given at the end of each school week totaling
four assessments. Participant responses were examined according to membership in the
short or long group as described previously, or as an average for both groups together.
Table 5.8 provides the mean scores across four weeks.
Statements 4 and 7 of the perception instrument relate to students’ perceived use
of the LMNOP technology. These items are discussed before those that relate to
students’ perceptions of their learning experience.
Table 5.8
Perception Assessment Means
Week Item 1 2 3 4 Diff.*
Q1 2.11 2.11 2.40 2.75 0.64
Q2 2.66 2.44 2.40 2.40 -0.27
Q3 2.11 2.11 2.40 2.20 0.07
Q4 1.77 1.77 1.20 1.00 -0.78
Q5 2.11 2.33 2.60 2.40 0.29
Q6 1.33 1.55 1.20 1.20 -0.13
Q7 1.44 1.44 1.00 1.20 -0.24
Q8 2.44 2.11 2.40 2.80 0.36
Note. * Week 4 minus Week 1
Responses to Statement 4, I need help from someone when using this program,

111
remained the same for the first two weeks for both the short and long groups. The short
group had a moderate mean response of 2.0 and the long group had a moderately low
mean response of 1.4. At the end of the study, the long group registered a response of
1.0.
Statement 7 stated Using this speech recognition program is difficult. Initially,
participants on average reported moderately low difficulty at 1.44, but by Week 3, the
long group response was 1.0, but rose slightly to 1.2 by the final session.
Taken together, responses to Statements 4 and 7 indicated that participants found the
LMNOP program easy to use by the end of Week 3.
During the first three intervention sessions, all participants asked for clarification
or confirmation of their understanding of the instructions, directions in navigating the
program, or positioning the headsets. Nearly all of the participants also asked for
assistance in pronunciation of words appearing in the passages. While pronunciation was
modeled for the participants by the researcher and the assistant, use of the “Read That”
feature of DNS was demonstrated to encourage participants to seek pronunciation support
from the computer. Some participants asked for help with pronunciation during
Sessions 5 and 6. Participants were reminded to us the “Read That” function after being
told how a word was pronounced.
After session 6, solicitation for assistance with pronunciation was virtually absent
from the remaining participants (long group). However, assistance with the “Train That”
and “Correct That” functions of DNS became prevalent in sessions 6-8 when participants
were not successful in producing the correct target words, even with the aid of computer

112
modeling of a word. Teaching participants to use these two features to meet the objective
of producing accurate word output in their dictations was usually achieved within two to
three applications of the “Train That” and “Correct That” functions.
Toward the end of Week 3 and throughout Week 4, participants functioned
independently when using the program. The reported lack of difficulty in using the
LMNOP and the absence of requests for assistance in Week 4 provide evidence that
Hypothesis 5 was supported. Hypothesis 5 predicted that “Solicitation for help from
teaching assistants by ELL participants who receive the LMNOP intervention will
decrease during the instructional period.”
Student Learning Perceptions
Hypothesis 6 stated that “The LMNOP program will have positive effects on
participant perceptions of language learning, reading and practicing with the aid of
technology.” Statements 1, 2, 3, 5, 6 and 8 of the perception assessment address these
perceptions. Responses on all but Statement 2 increased across the study. The changes
between Week 1 and Week 4 were .64, –.27, .07, .29, .13 and .36 respectively. Although
the sample was very small, many of the changes were found to be statistically significant,
as shown in Table 5.9. Together, they provided reasonable evidence that Hypothesis 6
was supported.
Participant responses indicated an increase in their enjoyment of school and
recognition of an increase in pronunciation accuracy. Recognition of an increase in oral
reading rate remained static. However, findings from the oral reading fluency measures
confirm that oral reading rate as well as accuracy increased significantly. It can be
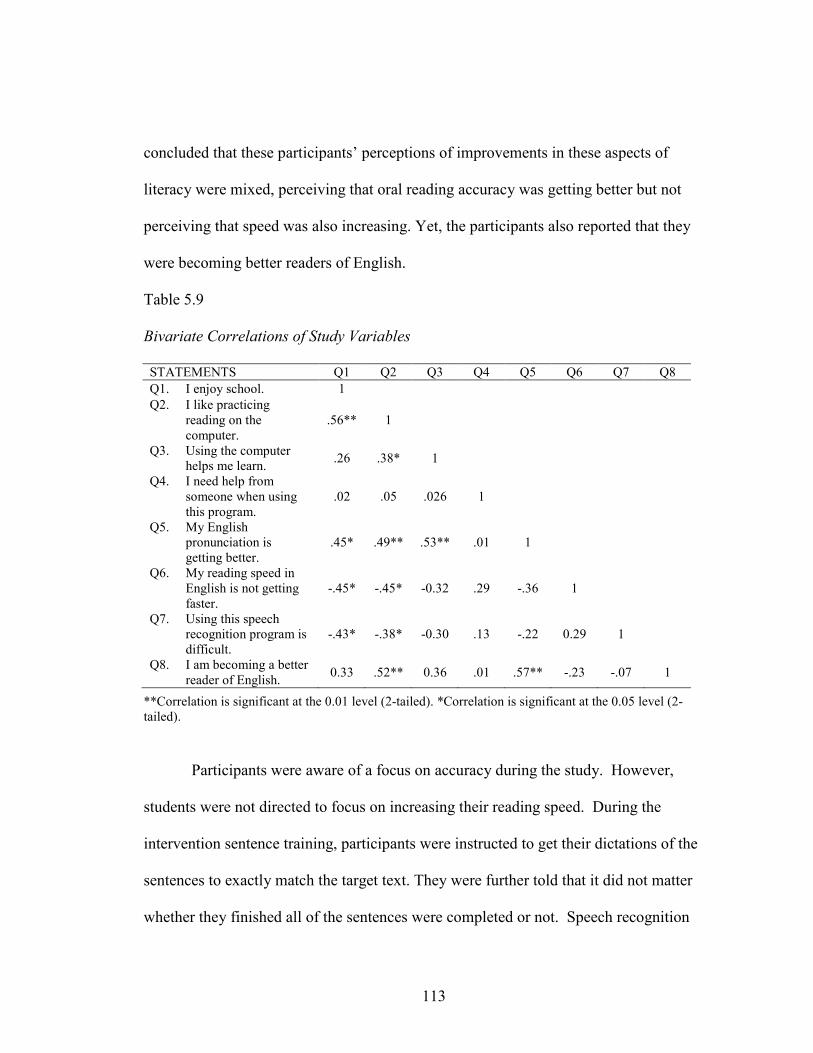
113
concluded that these participants’ perceptions of improvements in these aspects of
literacy were mixed, perceiving that oral reading accuracy was getting better but not
perceiving that speed was also increasing. Yet, the participants also reported that they
were becoming better readers of English.
Table 5.9
Bivariate Correlations of Study Variables
STATEMENTS Q1 Q2 Q3 Q4 Q5 Q6 Q7 Q8 Q1. I enjoy school. 1 Q2. I like practicing
reading on the computer.
.56** 1
Q3. Using the computer helps me learn. .26 .38* 1
Q4. I need help from someone when using this program.
.02 .05 .026 1
Q5. My English pronunciation is getting better.
.45* .49** .53** .01 1
Q6. My reading speed in English is not getting faster.
-.45* -.45* -0.32 .29 -.36 1
Q7. Using this speech recognition program is difficult.
-.43* -.38* -0.30 .13 -.22 0.29 1
Q8. I am becoming a better reader of English. 0.33 .52** 0.36 .01 .57** -.23 -.07 1
**Correlation is significant at the 0.01 level (2-tailed). *Correlation is significant at the 0.05 level (2-tailed).
Participants were aware of a focus on accuracy during the study. However,
students were not directed to focus on increasing their reading speed. During the
intervention sentence training, participants were instructed to get their dictations of the
sentences to exactly match the target text. They were further told that it did not matter
whether they finished all of the sentences were completed or not. Speech recognition

114
training is amenable to accuracy training, with rate increases expected after accuracy has
been attained. Under these conditions, participants probably monitored their progress in
oral reading accuracy and paid less attention to their increases in rate. Oral-reading
accuracy may have produced a sense of improvement in becoming a better reader of
English overall even without the realization of improvement in reading speed.
While enjoyment of school increased, enjoyment of reading on the computer (Q2)
dropped from 2.67 to 2.40 indicating that participants did not like using the intervention
quite as much at the end of the intervention as they did at the beginning. The initial
response reflected a liking of reading on the computer, including the speech recognition
technology that none of the participants had used before. At the end of Week 1, Q2 had
the most positive response of the eight statements. The high initial response of 2.67 and
the .27 drop signify that a novelty effect may have initially influenced participant
responses. The response dropped to 2.4 in Week 2 remained there. As Sokal and Katz
(2008) explain that “positive achievement effects of computer use decline over time,
suggesting a novelty effect” associated with reading (p. 84). Still, the constant rate of 2.4
from Week 2 and thereafter is considered high and may be due to a real liking of using
the computer for reading. On the other hand, it may be that four weeks (240 minutes) is
too short a time for the novelty effect to wear off.
Although perceptions of enjoyment of practicing reading on the computer
decreased to a moderately-strong level, this item correlated moderately with perceptions
of improvements in speaking and reading. In short, participants reported enjoying
reading on the computer, and they were cognizant of their improvements in accuracy and

115
reading in general. However, they did not associate the use of the computer with their
literacy improvements. The participants’ perception that “Using the computer helps me
learn” (Q3) rose only slightly, from 2.13 to 2.2 and indicated only a slight increase in
recognition of benefits of the intervention. The response had the lowest degree of change
at .07 and was the most neutral response at 2.2 on the 3.0 scale. Although Q3 correlated
moderately with “My English pronunciation is getting better” (Q5) as discussed above,
the small change of .07 indicates some ambivalence among these students as to whether
using the computer contributed to their learning.
An examination of Table 5.10 reveals that Q1, Q4, and Q8 exhibited the greatest
changes and reached the most extreme response levels. I like school” increased from
2.11 to 2.75, I need help from someone when using this program dropped from 1.78 to 1,
and I am becoming a better reader of English changed from 2.44 to 2.8. By the end of
the study, participants’ enjoyment of school increased dramatically; they did not need
help using the LMNOP program; and they strongly perceived improvement in reading.
However, as noted, use of the computer as a contribution to learning remained static for
the first two weeks and changed only slightly by Week 4. It is conjectured that
participants attributed learning to an internal locus of control (their own effort and
abilities) rather than an external locus of control (the computer program).
The internal validation of oneself for learning accomplishment as discussed by
Bandura (1997), Klassen (2010), Weiner (1974) and others is a powerful asset that
propagates motivation and self-reliance. Participants took ownership of the LMNOP
program and ownership of the skills mastered through the program. It was through their

116
own effort, persistence and mastery of the program that they achieved accurate output of
the target words and phrases. Along with ownership of the program, participants
recognized their progress in pronunciation accuracy as well as an improvement in reading
overall.
Table 5.10
Perception Assessment Responses: Long Group Changes, Weeks 1 through 4
The attribution to oneself of mastery of learning goals elevates the drive to
continue mastering target goals. On several occasions, the researcher and research
assistant observed participants continuing work with the LMNOP program after the 10-
minute period allotted for word/sentence training ended. The 10-minute period was
controlled through a timer that beeped loudly and was easily heard by the participants.
Participants had to be “forced” to end the individual training session and move on to the
final dictation phase of the intervention session. The implications here are 1) ownership
and control of the program were in the hands of the participants, and 2) engagement with
the program was strong.

117
Perception Differences between the Long and Short Groups
Disaggregating the perceptions between the short and long groups revealed
differences between the groups on several statements. Short group responses are
presented in Table 5.11 and are compared to the long group responses. The most salient
response item countering the discussion above was Q8, “I am becoming a better reader of
English” in which the short group shifted negatively by .4 on the scale of 3. The long
group response shifted negatively by .2, from an initial 2.6 to 2.4 for the first two weeks.
By Week 4, the long group reported a very strong positive shift to 2.8 on the item.
Table 5.11
Perception Assessment Means for Short Group: 2 Weeks
Although neither group recognized their notable increase in oral reading rate, the
short group’s responses were twice as strong as the long group’s responses, reporting
shifts of .4 compared to the .2 shift reported by the long group over the first two weeks.
In conjunction with their non-persistence in the summer school program, their lack of
cognition of their improvements in language skills could speculatively indicate a
1 2 Diff.*2.2 2.2 02.4 2.4 02.4 2.2 -0.2
I need help from someone when using this program. 2 2 02.2 2.2 01.4 1.8 0.41.6 1.4 -0.22.4 2 -0.4
* Week 2 minus Week 1
Perception Assessment Means for Short Group: 2 WeeksWeek
ItemI enjoy school.I like practicing reading on the computer.Using the computer helps me learn.
My English pronunciation is getting better.My oral reading speed in English is not getting faster.Using this speech recognition program is difficult.I am becoming a better reader of English

118
tendency toward a sense of disenfranchisement from school and learning, especially in
contrast with the long group.
Similarly, it was noted that the short group response to “Using the computer helps
me learn” was -.2 while the long group response was +.2; “I like practicing reading on the
computer was static at 2.4 for the short group but fell by .4 for the long group (over the
first two weeks); and “I enjoy school” remained static at 2.2 for the short group but
dropped for the long group in Week 2. Taken together, the short group was neutral or
negative in their responses which seem indicative of a degree of disconnection from
school. On the other hand, the students in the long group had stronger reactions to the
statements and reported positive responses by the end of the study.
Summary
The main objectives of this study were to explore the effects on oral reading
fluency, including accuracy and rate, for high school English language learners. Other
major objectives were to measure the accuracy of the speech recognition program in
determining participant utterances, estimate a degree of participant engagement and self-
efficacy in the use of the program, and assess the impact of the LMNOP program on
participants’ perceptions of the English literacy development. To summarize,
participants’ oral reading fluency increased about 16 words-per-minute. Accuracy
increased by about 50% with the oral reading error rate falling from 15% to 6%. The
speech recognition program was accurate 90% of the time in identifying ELL productions
of English words. Participants were highly engaged, used the program independently
after five sessions, had a mix of positive and negative perceptions of their improvements

119
in reading, and found the LMNOP program easy to use by the end of the second week of
the study. Discussion of the study and its findings follow in the DISCUSSION chapter.
120
DISCUSSION
The LMNOP program as implemented in this study was conceived as technology
that would ultimately contribute to English language learners’ (ELLs) reading
development. The development of the integrated components was based on several
theories and the hopes of a synergistic effect from combining self-voice listening with a
modified form of assisted reading. The study targeted five research questions, two of
which focused on oral reading fluency. The remaining questions focused on the
functionality of the intervention. The results discussed in the RESULTS chapter
regarding oral reading accuracy and rate for the constituent groups of English language
arts (ELA) I, II, and III, (which were further separated into the short group and the long
group) supported the six hypotheses. Additional data afforded insight regarding Research
Questions 3-5. As evidenced, speech recognition software can readily be used by
Spanish-speaking, ELL, high-school students with a high degree of accuracy. Students
in the study learned to use the speech recognition program quickly, were highly engaged
and internally motivated.
Although implementation of the program was altered by school personnel,
restricting its use to a brief summer-school program and fewer students than anticipated
in the study, several aspects of using voice recognition software to support oral reading
became evident. Insights into the implementation of computer-based interventions to
support ELL high schoolers as gleaned from this study can be discussed under several
121
categories. The following paragraphs will relate the salient findings as they evidence key
issues and insights for researchers and educators.
Passage Selections and Readability Levels
The effects of lexile levels on student oral reading accuracy and rate varied
among the students as discussed in RESULTS chapter. It is clear that lexile levels
affected fluency for most of the students, but the affects were somewhat surprising and
unanticipated. It was expected that more difficult passages would result in more oral
reading errors or slower rates. This was not always the case. Lower proficiency students
who read more difficult passages, such as those taken from The Chocolate War (Cormier,
1974) and The Pearl (Steinbeck, 1945), gained the most in oral reading accuracy. Kuhn
and Stahl (2003) say that students may gain more from reading challenging, even
frustration level, text than reading easier text. It seems that the ELA I students improved
in oral reading accuracy from reading passages that might typically be considered beyond
their grade level. The passages that these 9th grade students worked on had a lexile
average of 1022L, with two of the five passages leveled at 1240L and 1350L.
MetaMetrics (2012) reports a typical range for 9th grade text to be between 855L and
1165L. This text leveling is for native-English speaking students. On the other hand,
most of the participants in the ELA II and ELA III classes improved their fluency while
working with easier passages. It is not clear whether more challenging passages would
have led to greater gains for these students or not. Future studies using a similar
intervention should address this issue.

122
The random presentation of reading passages and the corresponding results made
it clear that readability levels were not the primary determinants of fluency in this study.
The wide variability among the participants substantiate that other factors affected
fluency more, as evidenced by higher accuracy and higher rates on difficult passages,
lower accuracy and rates on easier passages, and a mix of the two on a variety of text
complexities. Presenting the passages in a sequence of easier to more difficult lexile
levels may have led to other conclusions, possibly finding that text readability has a more
direct effect on fluency than was found in the current study.
Vocabulary Development
Vocabulary development is one of the more manageable, concrete variables that
might be controlled in a computer-aided intervention. It was found that the pronunciation
of 56% of the words that the students struggled with during the segmented readings was
mastered, retained and transferred to the following day’s warm-up dictation. Gains in
pronunciation were fairly consistent across grade and proficiency levels. The computer-
generated word and phrase modeling sufficiently supported pronunciation training,
retention and transfer of the pronunciation of new vocabulary for the students in this
study.
The rapid improvement on words and phrases that presented difficulty on the end-
of-session dictations was somewhat surprising. Kuhn et al. (2010) write “most of the
gains made with repeated readings, both in terms of accuracy and automaticity, occur
between the third and the fifth repetition” (p. 233). As explained in the PROCEDURES
chapter, the LMNOP intervention requires three encounters with the same text during a

123
single session, with a fourth reading the next day. Therefore, it may be these multiple
encounters in a single session that account for the rapid improvements in oral reading
accuracy, as well as retention and transfer of new vocabulary. Contributions of self-voice
listening and viewing the dictation output could also have made a difference in how
quickly students improved in accuracy and rate, but this was not measured in the current
study.
It might be assumed that students studying under normal school-year conditions
would make gains similar to those made by the summer-school students in this study. It
might also be assumed that ELLs in normal class conditions would learn to use an
intervention such as the one used in this study just as easily as the students in the summer
school program. It is also expected that ELLs could use the program independently to
supplement vocabulary instruction during the regular school year, perhaps on a daily
basis, in order to accelerate vocabulary acquisition. It is not known, however, whether the
students in this study comprehended the new words that they encountered in the
intervention passages. Future use of this feature of the speech recognition intervention
will need to include a measure for word comprehension.
Speech Recognition Accuracy
This study’s third research question focused on the efficacy of speech recognition
software to provide students with feedback on their oracy skills. As noted before for this
study’s sample of ELL participants, DNS word identification initially matched the raters’
word identification about 94%. The students started with the DNS program through a
short 4 minute session from which the program collected wave samples from the

124
individuals for the words provided in the training text. The students were then able to use
the program with the intervention format. The speech recognition program’s high
accuracy percentage combined with the short amount of time needed for initiating the
program are advantageous for teachers and students who wish to implement speech
recognition for oral reading applications. Little instructional time is consumed with
preparing the speech recognition program for use, and the accuracy of the program seems
high enough that the students in this study did not become frustrated with making
corrections on words that they said correctly.
However, it was expected that DNS word recognition would improve during the
study, but it was found that DNS errors increased slightly over the four-week period. At
the end of the study, the accuracy rate was 90%. The increase in DNS errors is related to
the intervention set-up and time restrictions that did not afford corrections by the students
to dictation errors. If time could have been afforded for students to make corrections to
the dictations, DNS accuracy probably would have improved, perhaps even approaching
the 98% accuracy rate found by the author in some pre-study trials with native English
speakers. But even if the speech recognition engine is found to be reliable 96% of the
time, as reported by Nuance (2011) for native-English speakers, then teachers and
students could still use a report based on the program’s output. They would need to be
cognizant that the report may be off by 4%.
The intervention program could be further developed to incorporate such an error
and rate report at the end of each session so that users (students and teachers) could
receive immediate performance feedback. Such a report could serve student and teacher

125
needs by 1) reducing the time that teaching personnel might spend with the tedious task
of repeatedly listening to student recordings in order to get a corrected count of the
students’ oral reading fluency, and 2) provide students with immediate performance
feedback. As discussed previously, some of the students in the study did not perceive
that they were making progress in their pronunciation and reading while, in fact, they
were. An end-of-session report could provide the students with the data that show that
they are making progress. These reports could contribute to the students’ sense of self-
efficacy and confidence, as well as motivation to persist in their oral reading
improvements.
Student Independence with Program Use
The fourth research question considered how much teacher support was solicited
by ELL participants using the LMNOP program during the four-week instructional
period. Programs that students can operate on their own frees up teaching personnel to
attend to other educational needs, such as small group work, literature circles, or other
one-on-one instruction. In this study, solicitation for help not only decreased but became
virtually absent by the end of Week 3. For the most part, independence in program use
essentially took under 2 hours of implementation. The relative ease of use of this program
is a strength of this intervention design and contributes to its promise for other
applications.
Perception Assessment
The last research question asks whether the students who used the LMNOP
intervention during the summer-school program changed their attitudes and perceptions
126
towards reading and use of the technology during this study. The student perception
assessment was intended to gauge changes in students’ perceptions or attitudes toward
reading and their use of the computer-based intervention for reading improvement. The
findings from the perception assessment are interesting because students seemingly
attributed their learning more to their personal dispositions, such as “I like school; I like
practicing reading on the computer,” rather than to the technology, (i.e., “using the
computer helps me learn”). The students reported that they did not need help using the
program, they perceived improvement in their pronunciation and in reading, and their
enjoyment of school increased dramatically. These were achievements that the students
gained through their own efforts. The students controlled the technology, and met the
challenges presented through the use of speech recognition. They took ownership of the
program.
Computer-aided programs such as Read Naturally and Rosetta Stone do not carry
the personalization that accompanies students’ dictations. Based on the author’s
observations in classrooms where Read Naturally Speaking, Rosetta Stone and other
similar programs were used, students did not seem to take as much ownership of the
programs. However, these programs do not have a dictation feature. Dictations are
physical and personal in that they are derived from the student’s own vocalizations.
Training the speech recognition program to recognize the student’s voice and print out
the intended words and phrases is personalized, physical input into the program. It may
be this element of personalization that contributed to the internalization of motivation that
supported their successes. In turn, student success with the intervention contributed to

127
positive perceptions toward school and reading in general.
The five students in the long group initially reported 3 on a scale of 3 for “I like
practicing reading on the computer.” At the end of the study, these students had a
reported mean of 2.4, which is a 20% decrease in liking to practice reading on the
computer. It could be that the students actually had a greater dislike of using the
intervention in comparison to other computer-aided reading programs. Or this could be
an incidence of the novelty effect in which the newness of the technology wore off over
the four weeks. However, in spite of these reported decreases, participants pursued
mastery of the target texts. It is speculated that the computer-based reading programs
used by these students prior to the current study may have contained some gaming
features and may have been perceived, in part, as entertainment. Programs that involve
academic work and challenging, even frustrating, tasks might not be expected to receive a
perfectly high rating of 3 out of 3.
This finding from the perception assessment implies that the students did not see
the LMNOP program as entertainment, but found high expectations from the researcher
and research assistant that they could be successful in using the intervention. They were
successful in the use of the program and recognized academic progress under their own
control which led to perceptions of reading improvement and pronunciation accuracy.
Sokal and Katz (2008) report that ‘’‘Hot Links‘ and animation features in CD-ROM
books tend to distract readers and increase reading time, leading to reader fatigue.” They
further report that the “interactive nature of computerized books creates greater interest in
boys…(but) it may foster over-dependence on features that decode words rather than

128
focusing independent meaning-making skills and strategies in readers” (p. 84).
Maintaining the academic orientation of the LMNOP program may benefit users by
avoiding the distractions, reducing reading fatigue, and fostering a self-reliance that
drives internal motivation for achievement.
Students who persisted through the second two weeks of the summer school
program showed more ownership of the program and attributed their successes to
themselves, in comparison to students who attended summer school for only the first two-
week period. Students who did not persist in summer school did not recognize that they
were becoming better readers although the session data provided overwhelming evidence
to the contrary. Regarding the LMNOP program itself, these findings imply that on-
going progress reporting may be beneficial as an engagement factor so that participants
can monitor their improvements in learning. A progress report would be a self-report
(internal) rather than a report for external evaluation by others.
Based on their responses to the perception assessment, the students in the short
group did not take ownership of the program, nor attribute their successes to their own
abilities and effort as strongly as the students in the long group. Had the improvements
been calculated and presented to these students, their responses might have been different
because they would have had statistical evidence that they were improving.
Based on researcher observations, the participants in the short group exhibited
behaviors and engagement with the LMNOP program that could not be distinguished
from the behaviors and engagement of the long group. The intensity of their engagement
with the program and their persistence in mastering the words and phrases presented in

129
the target text were outwardly similar. It can be concluded from the present discussion
that the short group differed in their attitude towards school and may have maintained a
greater disconnect from school than the long group. Yet, both the short and long groups
exhibited gains despite not being aware of their gains in oral reading rate, especially over
the first two weeks of the study.
Keeping in mind that the participants came from a summer school program
designed to help students make up failed courses, it is important to underscore the gains
supported through the summer school program and the intervention, and to point out that
the students perceived the program as something other than entertainment. They found
the program challenging, recognized their progress in pronunciation and reading, and
perceived that learning was under their control. In short, the students perceived their
work with the intervention as a serious academic endeavor that led to high levels of
engagement and language skill development. It can be assumed that high school ELLs
studying during the regular school year might achieve similar gains in fluency and
vocabulary. However, this will not be known with any degree of certainty until future
research is completed.
Future Research
Future research with speech recognition programs might be designed to address
specific needs of students in order to determine whether speech recognition is an
effective tool to aid students in particular aspects of their literacy development. ELL
students have numerous areas that they need to develop in order to read fluently in
English, and high school ELLs vary tremendously in their oral reading skills. Some ELL

130
students who are in the beginning stages of reading English orally may need to develop
word-level skills in which clear articulation of syllables is addressed, followed by
appropriate blending of the syllables in the formation of spoken words. Other students
may need to focus more on phrasing and attending to prosodic features such as pitch and
juncture in their oral reading. Some students may need to focus on developing rate of
oral reading, while others might find speech recognition as an effective means of learning
new vocabulary.
Planning interventions in concert with the classroom teachers who know their
students well could lead to precise uses of speech recognition applications, close
matching of intervention applications to student needs, knowledge of background and
profile information about students, and reveal special concerns about students that might
be addressed in a study’s design to yield focused support for student literacy
development.
Student language proficiency might be predetermined and based on data collected
over a period of time, thus providing refined baselines on which progress could be
compared. Additionally, classroom practices and instructional methods might be
incorporated into studies that feature speech recognition, thereby reinforcing teacher
efforts and objectives, while informing the field about effects of speech recognition on
literacy development. Collaboration should also lead toward sustainability of an
intervention, which in turn could lead to longer-term study of speech recognition uses in
ELL literacy development.
Studies that present text as complete sentences, phrases or individual words could

131
help identify intervention formatting that is most productive for students. Beginning ELL
students might be supported best by being presented with segmented text rather than
complete sentences or word lists. However, the use of complete sentences as presented in
the current study appears to have supported fluency growth for nearly all of the students
who used the intervention. The manner in which text is presented to students could make
a difference in how well or how quickly students master the text. Determining which
format works best for different students would provide direction in how students might
best use speech recognition with target text to maximize their learning.
Beginning students might benefit by focusing on the variety of sounds associated
with particular graphemes in English such as the three different /ch/ sounds represented
in much, machine and character. For Hispanic students, graphemes not found in Spanish
(/j/, /dg/, /sh/, /th/, and /z/), might be focal points for use with speech recognition.
Mastery of these sounds in high-frequency words or common sentences, should
contribute to oral reading fluency. An intervention that presents words containing /j/,
rather than short reading passages as used in the current study, could be developed. For
example, “Jerry just jumped out of the jeep” might be one of many target sentences that
students master using speech recognition. The sentence might be grouped with others as
an end-of-session dictation, then assessed (possibly automatically) for accuracy and rate.
Text complexity is an issue that needs to be addressed in passage selections that
may be used with the intervention. The current study found that lexile levels seemed to
affect students’ oral reading accuracy, rate or both for most of the students in the study.
The more proficient readers in the study, however, did not seem to be affected by text
132
complexity. Studies designed to distinguish the roles that text complexity plays in
fluency development for students at different proficiency levels would be helpful in
selecting passages that may be most productive for the students who are at different
proficiency levels. Student progress in accuracy and rate might be assessed using
passages that are presented with increasing difficulty over time. This progress might be
compared to student progress for students who are presented with passages that are
consistently at independent or instructional levels to estimate which is most productive
for less advanced readers.
The current study found that 56% of new vocabulary was learned (measured by
reading accuracy) and transferred to subsequent dictations. A study focused on
vocabulary acquisition for students at multiple levels of English language development
needs to be conducted in order to determine whether the finding in the current study was
due to factors unrelated to the intervention, to assisted repeated readings, to self-voice
listening, or to the synergistic effects of component stacking (Mohr et al., 2012; Slavin &
Calderon, 2001). The intervention might be manipulated by removing components from
the intervention, like the self-voice listening, to see whether this affects vocabulary gain
or not, when compared to gains made with the use of the intervention in its current form.
Passages that are at an instructional level and contain numerous target vocabulary
identified by the classroom teacher might be used in the intervention in a modified form
that includes the addition of word and passage comprehension measures. Although
fluency correlates highly with comprehension, student gains in fluency with
comprehension needs to be measured with respect to the intervention. Fluency gains

133
assessed with an instrument that includes a comprehension measure will provide a more
definitive picture of how the intervention may have supported student vocabulary
acquisition.
Ways that teachers and students use speech recognition to advance reading skills
should be contingent on student needs, and investigation into applications of speech
recognition is relatively new. The potential future studies outlined above are far from
exhaustive, and other innovative ways of applying the technology are open for
development.
Summary
The study was intended to explore student improvement in oral reading fluency
through the use of speech recognition technology. The National Reading Panel (2000)
recognized the potential of this technology to contribute to student learning over a decade
ago, yet few empirical studies have focused on how the technology might be used to
support literacy. This application of speech recognition technology that leveraged
assisted repeated reading, self-voice listening, and dictation viewing and correction as a
hopefully synergistic combination has provided some insight into the potential benefits
for students. The study also resulted in implications that may contribute to future
research and classroom applications of speech recognition in support of student literacy.
Student attitudes and perceptions toward their progress and the use of the
technology may have been contributing causes in the students’ successes. Students
learned to use the speech technology quickly and did not need outside support in the
navigation of the program. The students did not need human modeling of words, and

134
could function independently with the text modeling provided from the speech
recognition program. The students reported an increased liking of school and a
recognition that their pronunciation and reading skills were improving. However, they
did not attribute their progress to the intervention, but their responses to the perception
inventory imply that they attributed their progress to their own efforts and abilities. In
sum, they had an internal locus of control, and had a sense of self-efficacy in their
achievements.
Each student who used the intervention varied from the others in his or her oral
reading fluency gains. Part of the variation can be explained by the different passages
and lexile levels used for the different ELA classes, but the difficulty of the passages
affected the students’ oral reading accuracy and rates in different ways, even though the
students may have been in the same ELA class. These observations point to the
complexities of oral reading fluency, and raise questions about the influences of text
readability levels. In spite of the fluctuations in readability levels, student fluency as a
whole increased notably across the study. An implication is that speech recognition
might be used to specifically support student oral reading development in more refined
ways, depending on the specific literacy needs of the individual. Speech recognition as
an instrument for supporting literacy is still relatively new and creative uses of the
technology will surely lead to enhanced methods and practices that may contribute to
accelerated learning for ELL students.

135
APPENDIX
SUPPLEMENTAL TABLES

136
Table A.1
Passage Selections for ELA I with Lexile Ratings (1)
Text/Passage # Lexile Page Flesch GL # Words
Choco War 1 920 18 70.5 7.1 195
Choco War 2 810 41 79.4 4.9 202
Choco War 3 820 49 81.2 5.5 202
Choco War 4 690 52 79.6 5.3 194
Choco War 5 1190 57 55.7 10.1 207
Choco War 6 910 90 74.9 6.3 198
Choco War 7 400 128 89 2.8 222
Choco War 8 570 138 80.8 4.0 193
Choco War 9 870 139 70.4 6.4 222
Choco War 10 990 156 70.7 6.4 220
Choco War 11 720 163 80.4 4.5 216
808.2 mean 75.7 mean 5.75 mean 206.5 mean
Note. Highlighted lexile indicates passage selection used for pre- and post- assessments. Flesch and GL (grade level) values were not used in the intervention. Other passage selections were pooled for use as intervention passages.

137
Table A.2
Passage Selections for ELA I with Lexile Ratings (2)
Text/Passage # Lexile Page Flesch GL # Words
Pearl 1 1450 8 60.6 12.8 227
Pearl 2 1020 9 85.5 5.9 221
Pearl 3 1190 10 73.5 8.7 230
Pearl 4 1240 13 73.0 8.6 226
Pearl 5 1430 16 68.3 10.8 231
Pearl 6 1040 39 83.7 6.0 233
Pearl 7 1130 41 75.5 7.9 212
Pearl 8 1350 42 65.8 10.9 221
Pearl 9 680 52 93.3 3.2 221
Pearl 10 830 61-62 85.8 4.9 221
Pearl 11 1320 78 68.5 10.4 218
1152.8 mean 75.8 mean 8.19 mean 223.7 mean
Overall 981 75.8 7.0
Note. Highlighted lexile indicates passage selection used for pre- and post- assessments. Flesch and GL (grade level) values were not used in the intervention. Other passage selections were pooled for use as intervention passages.

138
Table A.3
Passage Selections for ELA II with Lexile Ratings (1)
Text/Passage # Lexile Page Flesch GL # Words
Mango 1 890 xiii 78.4 5.6 202
Mango 2 740 11 83.8 4.6 202
Mango 3 1090 22 83.8 6.0 197
Mango 4 940 28 86 5.3 233
Mango 5 1150 35 81.3 6.4 219
Mango 6 1070 46 81.7 6.3 197
Mango 7 760 52-53 84.6 4.6 209
Mango 8 1120 65-66 83.7 7.2 207
Mango 9 570 77-78 89.7 3.2 220
Mango 10 420 90-91 97.5 1.7 195
Mango 11 940 116 79.3 5.5 218
880.9 mean 84.5 mean 5.1 mean 209 mean
Note. Highlighted lexile indicates passage selection used for pre- and post- assessments. Flesch and GL (grade level) values were not used in the intervention. Other passage selections were pooled for use as intervention passages.

139
Table A.4
Passage Selections for ELA II with Lexile Ratings (2)
Text/Passage # Lexile Page Flesch GL # Words
Mice 1 900 2 79.4 5.8 223
Mice 2 1130 17 76.3 7.3 211
Mice 3 940 33-34 79.6 5.9 201
Mice 4 430 45-46 97.4 2.0 189
Mice 5 410 47-48 76.3 7.3 231
Mice 6 1130 66-67 79.8 5.8 224
Mice 7 940 67 84.2 5.7 207
Mice 8 1000 84 85.6 5.3 227
Mice 9 930 92-93 93.1 2.6 193
Mice 10 560 98 82.6 5.9 206
Mice 11 1020 99 87.5 5.3 217
Mice 12 1010 100 87.5 5.3 217
866.7 mean 84.1 mean 5.35 mean 212.2 mean
Overall 874 84.3 5.2 211
Note. Highlighted lexile indicates passage selection used for pre- and post- assessments. Flesch and GL (grade level) values were not used in the intervention. Other passage selections were pooled for use as intervention passages.

140
Table A.5
Passage Selections for ELA III with Lexile Ratings (1)
Text/Passage # Lexile Page Flesch GL # Words
Speak 1 660 3 89.9 3.5 202
Speak 2 710 6 82.8 4.3 201
Speak 3 710 9-10 87.1 3.8 199
Speak 4 510 13 84.8 3.5 199
Speak 5 700 73 87.9 3.6 212
Speak 6 470 81 97.2 1.6 201
Speak 7 930 112 73.5 6.3 204
Speak 8 810 116-117 73.9 5.9 215
Speak 9 680 120 87.5 3.8 205
Speak 10 710 129 88.5 3.3 197
Speak 11 480 187 95.3 1.9 205
670 mean 86.22 mean 3.77 mean 203.6 mean
Note. Highlighted lexile indicates passage selection used for pre- and post- assessments. Flesch and GL (grade level) values were not used in the intervention. Other passage selections were pooled for use as intervention passages.

141
Table A.6
Passage Selections for ELA III with Lexile Ratings (2)
Text/Passage # Lexile Page Flesch GL # Words
Afterlife 1 940 22 80.3 5.7 208
Afterlife 2 1130 29-30 77.2 7.4 218
Afterlife 3 910 36 79.4 6.0 236
Afterlife 4 600 43 91.9 2.9 225
Afterlife 5 450 47 93.6 2.4 203
Afterlife 6 660 56 87.9 3.9 213
Afterlife 7 690 64 81.0 4.7 206
Afterlife 8 720 66 83.9 4.4 199
Afterlife 9 400 78 87.9 3.2 220
Afterlife 10 530 86-87 96.1 2.1 201
Afterlife 11 780 108 84.1 4.4 217
710 mean 85.76 mean 4.28 mean 213.3 mean
Overall 690 4.0
Note. Highlighted lexile indicates passage selection used for pre- and post- assessments. Flesch and GL (grade level) values were not used in the intervention. Other passage selections were pooled for use as intervention passages.
142
REFERENCES
Adams, M.J. (1994). Modeling the connections between word recognition and reading. In R. B. Ruddell, M. R. Ruddell, & H. Singer (Eds.), Theoretical models and processes of reading (4th ed., pp. 838-863). Newark, DE: International Reading Association.
Adams, M.J., (1990). Beginning to read: Thinking and learning about print. Cambridge, MA: MIT Press.
Adamson, P.M. (2004). Phonics for English: Reading, spelling & writing express. Red Lodge, MT: YesPhonics Publishing.
Atkinson, R.C., & Hansen, D.N. (1966). Computer-assisted instruction in initial reading: The Stanford project. Reading Research Quarterly, 2(1), 5-25. Retrieved from http://www.jstor.org/stable/747037
Anderson, L.H. (1999). Speak. New York, NY: Penguin Group.
August, D. (2003). Supporting the development of English literacy in English language learners: Key issues and promising practices. Center for Research on the Education of Students Placed At Risk, Baltimore, MD. Office of Educational Research and Improvement (ED), Washington, DC.
August, D., & Shanahan, T. (2008). Developing reading and writing in second-language learners: Lessons from the report of the national literacy panel on language-minority children and youth. Center for Applied Linguistics & the International Reading Association. New York, NY: Routledge.
Babbitt, N. (1975). Tuck everlasting. New York, NY: Farrar, Straus and Giroux.
Bandura, A.J. (1997). Self-efficacy: The exercise of control. New York, NY: Freeman.
Bandura, A.J. (1977). Social learning theory. Englewood Cliffs, NJ: Prentice Hall.
Blok, H., Oostdam, R., Otter, M.E., & Overmaat, M. (2002). Computer-assisted instruction in support of beginning reading instruction: A review. Educational Research, 72(1), 101-130.
Bus, A.G., & van IJzendoorn, M.H. (1999). Phonological awareness and early reading: A meta-analysis of experimental training studies. Journal of Educational Psychology, 91(3), 403–414.

143
Chall, J.S. (1983). Stages of reading development. New York, NY: McGraw-Hill.
Chall, J.S. (1967). Learning to read: The great debate. New York, NY: McGraw-Hill.
Cisneros, S. (2006). The house on mango street. New York, NY: Alfred A. Knopf.
Cordier, D. (2006). Speech recognition software for teaching foreign language---student perceptions of production ability. Retrieved from http://[email protected]
Cormier, R. (1974). The chocolate war. New York, NY: Dell.
Cummins, J. (2007). Rethinking monolingual instructional strategies. Canadian Journal of Applied Linguistics, 10(2), 221-240.
Cummins, J. (1991). Interdependence of first- and second-language proficiency in bilingual children. In E. Bialystock (Ed.), Language processing in bilingual children (pp. 70-89). Cambridge, England: Cambridge University Press.
Cummins, J. (1991). Language development and academic learning. In L. Malave and G. Duquette (Ed.), Language, culture and cognition (pp. 161-175). Philadelphia, PA: Multilingual Matters.
Deno, S.L. (1985). Curriculum-based measurement: The emerging alternative. Exceptional Children, 52, 219-232.
Deno, S. L., and Marston, D. (2006). Curriculum based measurement of oral reading: An indicator of growth in fluency. In S. J. Samuels & A. E. Farstrup (Eds.), What research has to say about fluency instruction (pp. 179-203). Newark, DE: International Reading Association.
Dowrick, P. W. (1999). A review of self- modeling and related interventions. Applied and Preventive Psychology, 8, 23-39.
Ecalle, J., Magnan, A., & Calmus, C.L. (2008). Lasting effect on literacy skills with a computer-assisted learning using syllabic units. Computers & Education, 52, 554-561.
Ehri, L.C., Nunes, S.R., Stahl, S., & Willows, D.M. (2001). Systematic phonics instruction helps students learn to read: Evidence from the National Reading Panel's meta-analysis. Review of Educational Research, 71(3), 393-447.
Evans, R., & Jones, D. (2008). Perspectives on oracy--towards a theory of practice. Early Child Development and Care, 177(6-7), 557-567.

144
Everson, M.E. (1998). Word recognition among learners of Chinese as a foreign language: Investigating the relationship between naming and knowing. The Modern Language Journal, 82, (2), pp. 194-204.
Fry, R. (2008). Hispanics, high school dropouts and GED. Washington, DC: PEW Hispanic Center. Retrieved from http://www.pewhispanic.org/files/reports/122.pdf
Fox, L. (1987). On acquiring an adequate second language vocabulary. In M.H. Long & J.C. Richards (Eds.), Methodology in TESOL: A book of readings (pp. 307-311). New York, NY: Newbury House.
Fuchs, D., Fuchs, L.S., Compton, D.L., Bouton, B., Caffrey, E., & Hill, L. (2007). Dynamic assessment as responsiveness to intervention. Council for Exceptional Children, 39(5), 58-63.
Fuchs, L.S., Fuchs, D., Hosp, M.K., & Jenkins, R. (2001). Oral reading fluency as an indicator of reading competence: A theoretical, empirical, and historical analysis. Scientific Studies of Reading, 5(3), 239-256.
Gagne, R.M., Briggs, L.J., & Wager, W.W. (1992). Principles of instructional design. Orlando, FL: Harcourt Brace Jovanovich.
Gee, J. P. (2004). Reading as situated language: A sociocognitive perspective. In R.B. Ruddell & N. J. Unrau (Ed.), Theoretical models and processes of reading (5th ed., pp. 116-132). Newark, DE: International Reading Association.
Geva, E., & Zadeh, Z.Y. (2006). Reading efficiency in native English-speaking and English-as-a second-language children: The role of oral proficiency and underlying cognitive-linguistic processes. Scientific Studies of Reading, 10(1), 31-57.
Goldenberg, C. (2008). Teaching English language learners: What the research does—and does not—say. American Educator (Summer), 8-44.
Goldenberg, C., Rueda, R.S., & August, D. (2008). Sociocultural contexts and literacy development. In D. August & T. Shanahan (Eds.), Developing reading and writing in second-language learners (pp. 95-130). Newark, DE: Routledge and International Reading Association.
Goodman, Y.M., Watson, D.J., & Burke, C.L. (1987). Reading miscue inventory: Alternative procedures. New York, NY: Richard C. Owen.
145
Guthrie, J.T., Wigfield, A., & VonSecker, C. (2000). Effects of integrated instruction on motivation and strategy use in reading. Journal of Educational Psychology, 92(2), 331-341.
Hiebert, E.H., Samuels, S.J., & Rasinski, T.V. (2012). Comprehension-based silent reading rates: What do we know? What do we need to know? Literacy Research & Instruction, 51(2), 110-124.
Hincks, R. (2002). Speech recognition for language teaching and evaluating: A study of existing commercial products. Centre for Speech Technology Department of Speech, Music and Hearing, KTH, Stockholm, Sweden; 1-4. Retrieved from http://www.speech.kth.se/~hincks/papers/icslp02xxx.pdf
Hitchcock, C.H., Dowrick, P.W., & Prater, M.A. (2003). Video self-modeling intervention in school-based settings. Remedial and Special Education, 24(1), 36-46.
Husni, H., & Jamaludin, Z. (2009). ASR technology for children with dyslexia: Enabling immediate intervention to support reading Bahasa Melayu. US-China Education Review, 6(6), 64-70.
Hutchins, J.W. (2007). Machine translations: A concise history. Retrieved from http://www.hutchinsweb.me.uk/cuhk-2006.pdf
Juel, C., & Minden-Cupp, C. (2004). Learning to read words: Linguistic units and instructional strategies. In R.B. Ruddell & N. J. Unrau (Eds.), Theoretical models and processes of reading (5th ed., pp. 313-359). Newark, DE: International Reading Association.
Kartal, G. (2006). Working with an imperfect medium: Speech recognition technology in reading practice. Journal of Educational Multimedia and Hypermedia, 15(3), 303-328.
Klassen, R.M. (2010). Confidence to manage learning: The self-efficacy for self-regulated learning of early adolescents with learning disabilities. Learning Disability Quarterly, 33, 19-30.
Kuhn, M., & Stahl, S. (2003). Fluency: A review of developmental and remedial practices. Journal of Educational Psychology, 95, 3–21.
Kuhn, M.R., Schwanenflugel, P.J., Meisinger, E.B., & Levy, B.A. (2010). Aligning theory and assessment of reading fluency: Automaticity, prosody, and definitions of fluency. Reading Research Quarterly, 45(2), 230-251.

146
Kyte, C.S., & Johnson, C.J. (2006). The role of phonological recoding in orthographic learning. Journal of Experimental Child Psychology, 93, 166-185.
LaBerge, D., & Samuels, S.J. (1974). Toward a theory of automatic information processing in reading. Cognitive Psychology, 35(6), 293-323.
Lesaux, N. K., & Geva, E., (2008). Development of literacy in second-language learners. In D. August & T. Shanahan (Eds.), Developing reading and writing in second-language learners (pp. 27-59). Newark, DE: Routledge and International Reading Association.
Logan, G.D. (1997). Automaticity and reading: Perspectives from the instance theory of automatization. Reading & Writing Quarterly, 13(2), 123-146.
Mace, F.C., Belfiore, P.J., & Hutchinson, J.M. (2001). Operant theory and research on self-regulation. In B.J. Zimmerman & D.H. Schunk, (2001) Self-regulated learning and academic achievement (pp. 39-66). Mahwah, NJ: Lawrence Erlbaum.
Macleod, F.J., Macmillan, P., & Norwich, B. (2007). ‘Listening to myself’: Improving oracy and literacy among children who fall behind. Early Child Development and Care, 177 (6 & 7), 633-644.
MetaMetrics (2012). The lexile framework for reading. [A text leveling, text analysis company]. Retrieved from http://www.lexile.com/about-lexile/grade-equivalent/grade-equivalent-chart/
Mohr, K.A.J., Dixon, K., & Young, C. (2012). Effective and efficient: Maximizing literacy assessment and instruction. In E. Ortlieb & E. Cheek, Jr. (Eds.), Literacy research, practice, and evaluation, volume 1: Using informative assessments towards effective literacy instruction (pp. 293-324). Bingley, UK: Emerald.
National Reading Panel (2000). Report of the National Reading Panel: Teaching children to read: An evidence-based assessment of the scientific research literature on reading and its implications for reading instruction (Report of the subgroups). Washington, DC: National Institute of Child Health and Human Development.
Nuance (2011). Dragon naturally speaking (Version 11). Burlington, MA.
Ochoa, A.M., & Cadiero-Kaplan (2004). Towards promoting biliteracy and academic achievement: Educational Programs for high school latino English language learners. The High School Journal, (Feb/Mar), pp. 27-43. Retrieved from www.Ordinate.com (2008).

147
Osborne, J., Lehr, F., & Hiebert, E.H. (2003). A focus on fluency. Research-Based Practices in Early Reading Series, Honolulu, HI: Pacific Resources for Education and Learning, 1-20. Retrieved from www.prel.org/products/re/fluency-1.htm
Paris, S.G., Byrnes, J.P., & Paris, A.H. (2001). Constructing theories, identities, actions. In B.J. Zimmerman & D.H. Schunk (Eds.), Self-regulated learning and academic achievement: Theoretical perspectives, (pp. 253-287). Mahwah, NJ: Lawrence Erlbaum.
Pikulski, J. J., & Chard, D.J. (2005). Fluency: Bridge between decoding and reading comprehension. Reading Teacher, 58(6), 510-519.
Poppenk, J., Kohler, S., & Moscovitch, M. (2010). Revisiting the novelty effect: When familiarity, not novelty, enhances memory. Journal of Experimental Psychology, 36(5), 1321-1330.
Poulsen, R., Hastings, P., & Allbritton, D. (2007). Tutoring bilingual students with an automated reading tutor that listens. Journal of Educational Computing Research, 36(2), 191-221.
Rasinski, T.V. (2003). Assessing reading fluency. Pacific Resources for Education and Learning. Retrieved from www.prel.org/programs/rel/rel.asp.
Rodriguez, T.A. (2001). From the known to the unknown: Using cognates to teach English to Spanish-speaking literates. Reading Teacher, 54(8), 744-746.
Rumelhart, D. E. (1994). Toward an interactive model of reading. In R. B. Ruddell, M.R. Ruddell & H. Singer (Ed.), Theoretical models and processes of reading (4th ed., pp. 864-894). Newark, DE: International Reading Association.
Sadoski, M., & Pavio, A. (2004). A dual coding theoretical model of reading. In R. B. Ruddell & N.J. Unrau (Ed.), Theoretical models and processes of reading (5th ed., pp. 1329-1362). Newark, DE: International Reading Association.
Samuels, S.J. (2004). Toward a theory of automatic information processing in reading, revisited. In In R. B. Ruddell & N.J. Unrau, (Eds.), Theoretical models and processes of reading (5th ed., pp. 1127-1148). Newark, DE: International Reading Association.
Samuels, S.J. (1997). The method of repeated readings. The Reading Teacher, 50(5), 376-381.
Samuels, S.J. (1994). Word recognition. In In R. B. Ruddell & N.J. Unrau, (Eds.), Theoretical models and processes of reading (4th ed., pp. 313-359). Newark, DE: International Reading Association.

148
Scott, V.G., & Weishaar, M.K. (2003). Curriculum-based measurement for reading progress. Intervention in School and Clinic, 38, 15-19.
Segura, J.C., Ehrette, T., Potamianos, A., Fohr, D, Illina, I, Breton, P-A., Clot, V., Gemello, R. Matassoni, M., & Maragos, P. (2007). The HIWIRE database, a noisy and non-native English speech corpus for cockpit communication. Retrieved from http://www.hiwire.org
Short, D. (1991). Integrating language and content instruction: Strategies and techniques. NCBE Program Information Guide Series, 7 (Fall). Retrieved from http://www.ncbe.gwu.edu/ncbepubs/pigs/pig7.html.
Slavin, R.E., & Calderon, M. (Eds.) (2001). Effective programs for Latino students. Mahwah, NJ: Lawrence Erlbaum.
Snyder, I., & Joyce, M. (1998). Page to screen: Taking literacy into the electronic era. New York, NY: Routledge.
Sokal, L., & Katz, K. (2008). Effects of technology and male teachers on boys’ reading. Australian Journal of Education, 52(1), 81-94.
Soto, G. (2003). Afterlife. Oralando, FL: Harcourt.
Stahl, S.A., & Kuhn, M.R. (2002). Making it sound like language: Developing fluency. The Reading Teacher, 55(6), 582-584.
Stahl, S.A., & Nagy, W.E. (2006). Teaching word meanings. Mahwah, NJ: Lawrence Erlbaum.
Steinbeck, J. (1945). The pearl. New York, NY: Penguin Group.
Steinbeck, J. (1937). Of mice and men. New York, NY: Penguin Group.
Thomas, S.C., & Johnson, M.H. (2008). New advances in understanding sensitive periods in brain development. Current Directions in Psychological Science. 17(1), 1-5.
Tovani, C. (2000). I read it, but I don’t get it: Comprehension strategies for adolescent readers. Portland, ME: Stenhouse.
Valencia, S.W., Smith, A.T., Reece, A.M., Li, M., Wixson, K., et. al. (2010). Oral reading fluency assessment: Issues of construct, criterion, and consequential validity. Reading Research Quarterly, 45(3), 270-291.
Weiner, B. (1974). Achievement motivation and attribution theory. Morristown, N.J.: General Learning Press.

149
Wigfield, A., Guthrie, J.T., Tonks, S., & Perencevich, K. (2004). Children’s motivation for reading: Domain specificity and instructional influences. The Journal of Educational Research, 97(6), 299-309.
Wright, J. (1992). Curriculum-based measurement: A manual for teachers. Syracuse, NY. Retrieved from http://www.jimwrightonline.com/pdfdocs/cbaManual.pdf
Yang, H., & Lay, Y. (2005). Implementation and evaluation of computer-aided Mandarin phonemes training system for hearing-impaired students. British Journal of Educational Technology; 36(35); 537–551.
Zimmerman, B.J., & Schunk, D.H. (2001). Self-regulated learning and academic achievement: Theoretical perspectives. Mahwah, NJ: Lawrence Erlbaum.