developing policy inputs for efficient trade and ... · developing policy inputs for efficient...
TRANSCRIPT

Shyam S. Salim and R.Narayanakumar, (2012). Manual on World Trade Agreements and Indian Fisheries Paradigms: A Policy Outlook.
403
Developing Policy Inputs for Efficient Trade and Sustainable Development Using Data Analysis Mini.K.G Senior Scientist, Fisheries Resources Assessment Division Central Marine Fisheries Research Institute, Kochi Email: [email protected]
Introduction
Trade forms a vital part of the world economy. The analysis of data on trade and
related parameters plays a pivotal role in developing policy inputs for efficient trade and sustainable development. It is evident that the success of any type of analysis depends on the availability of the suitable type of data. In general, time series, cross sectional and pooled data are the three types of data available for trade analysis. Time series data are characterized by observations collected at regular intervals over a period of time while cross-sectional data are data on one or more variables collected at the same point of time. The pooled data is a combination of time series and cross-sectional data. For example, panel data, which is a special type of pooled data is used to study the relationship between trade flows and trade barriers over time. In recent years, the quantitative and qualitative analysis of trade and the effects of policies have grown sharply. This was due to the advances in the theoretical and analytical techniques as well as increased computational and data processing power of computers.
A multitude of analysis tools are available in today’s world for a thorough and scientifically valid analysis of data. There are several choices available for the user to choose from – ranging from the general public license packages, analysis packages with statistical add-ons, general purpose languages with statistics libraries to the advanced proprietary packages. Of late, the spreadsheet packages like Microsoft Excel, Corel Quattro Pro etc. have been upgraded to a great extent and as a result, have become quite popular as a data analysis tools. Though the spreadsheet packages provide easy methods for data access and manipulation, but they are not equipped to handle large data sets and advanced statistical data analysis methods.
Statistical Packages
A good statistical software package is one which is compatible with the operating system of the user and strategically addresses the needs of the user with respect to data management and analysis for an affordable cost. There are many proprietary and freeware
404 Central Marine Fisheries Research Institute, Kochi : Cadalmin, 458 pp.
Mini.K.G
statistical software packages designed for different statistical applications, depending on the user's needs. This lecture note will take a look at some of them listed below which are most commonly used among social science workers.
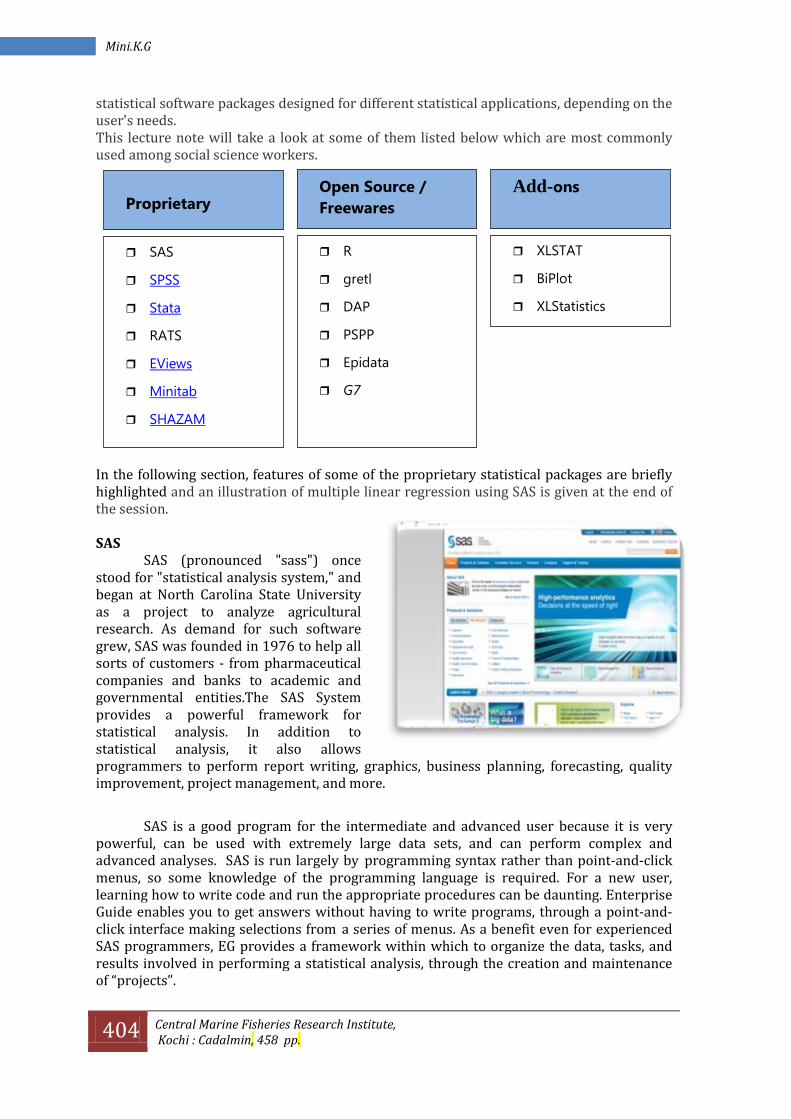
In the following section, features of some of the proprietary statistical packages are briefly highlighted and an illustration of multiple linear regression using SAS is given at the end of the session. SAS
SAS (pronounced "sass") once stood for "statistical analysis system," and began at North Carolina State University as a project to analyze agricultural research. As demand for such software grew, SAS was founded in 1976 to help all sorts of customers - from pharmaceutical companies and banks to academic and governmental entities.The SAS System provides a powerful framework for statistical analysis. In addition to statistical analysis, it also allows programmers to perform report writing, graphics, business planning, forecasting, quality improvement, project management, and more.
SAS is a good program for the intermediate and advanced user because it is very powerful, can be used with extremely large data sets, and can perform complex and advanced analyses. SAS is run largely by programming syntax rather than point-and-click menus, so some knowledge of the programming language is required. For a new user, learning how to write code and run the appropriate procedures can be daunting. Enterprise Guide enables you to get answers without having to write programs, through a point-and-click interface making selections from a series of menus. As a benefit even for experienced SAS programmers, EG provides a framework within which to organize the data, tasks, and results involved in performing a statistical analysis, through the creation and maintenance of “projects”.
Proprietary
Open Source /
Freewares
R
gretl
DAP
PSPP
Epidata
G7
Add-ons
XLSTAT
BiPlot
XLStatistics
SAS
SPSS
Stata
RATS
EViews
Minitab
SHAZAM

Shyam S. Salim and R.Narayanakumar, (2012). Manual on World Trade Agreements and Indian Fisheries Paradigms: A Policy Outlook. 405
Developing Policy Inputs for Efficient Trade and Sustainable Development Using Data Analysis
The web site at http://www.sas.com/, gives complete information about SAS. SAS is fully supported on Windows and on UNIX/Linux, and is fully up to date on these two operating systems. SPSS
SPSS, is the one among the popular statistical analysis software used in social science research. Originally it is an acronym of Statistical Package for the Social Science but now it stands for Statistical Product and Service Solutions. The web site at http://www.spss.com has got lot of information about SPSS. It is comprehensive and flexible and can be used with almost any type of file. It can be used to generate tabulated reports, charts, and plots of distributions and trends, as well as generate descriptive statistics and more complex statistical analyses. SPSS provides a user interface that makes it very easy and intuitive for all levels of users. Menus and dialogue boxes make it possible to perform analyses without having to write command syntax, like in other programs. It is also simple and easy to enter and edit data directly into the program. SPSS consists of four windows. A Data Editor, an Output window, a Syntax window, and a Chart Editor. The Data Editor is further divided into a Data view and a Variable view. In the Data Editor you can manipulate data and make commands. In the Output window you can read the results of the analysis and see graphs and then it also works as a log-window. In the Chart Editor you can manipulate your graphs while the syntax window is used for coding your analysis manually. There are a few drawbacks, for example, there is a limit on the number of cases you can analyze.

406 Central Marine Fisheries Research Institute, Kochi : Cadalmin, 458 pp.
Mini.K.G
STATA
Stata is a full-featured statistical programming language that runs on a variety of platforms such as Windows, Mac OS X, Unix and Linux. It can be used for both simple and complex statistical analyses. The web site at http://www.stata.com has quite a lot of information about Stata. STATA uses a point-and-click interface as well as command syntax, which makes it easy to use. STATA also make it easy to generate graphs and plots of data and results. Analysis in STATA is centered around four windows: the command window, the review window, the result window, and the variable window. Analysis commands are entered into the command window and the review window records those commands. The variables window lists the variables that are available in the current data set along with the variable labels, and the results window is where the results appear.
RATS
RATS (Regression Analysis of Time Series) is an econometrics and time-series analysis software package used worldwide by economists and others for analyzing time series and cross sectional data, developing and estimating econometric models, forecasting, and much more. Estima develops and sells RATS. The current release of RATS is Version 8.1, is easier to use than earlier version and offers the most advanced tools available for econometrics research. RATS provides all the basics, including linear and non-linear least squares, forecasting, SUR, and ARIMA models. It support techniques like GMM, ARCH and GARCH models, state space models, and more. RATS also offers support for Vector Autoregression models, and is it also offers spectral analysis capabilities. RATS is available for Windows, Macintosh, UNIX, and Linux, with complete compatibility across platforms. The programs, data files, output, and graph files across any of these platforms can be shared without any translation.

Shyam S. Salim and R.Narayanakumar, (2012). Manual on World Trade Agreements and Indian Fisheries Paradigms: A Policy Outlook. 407
Developing Policy Inputs for Efficient Trade and Sustainable Development Using Data Analysis
E Views ;
EViews, which stands for Econometric Views, is a new version of a statistical package for analysing time series data. The current version EViews 7 offers an extensive array of powerful features for data handling, statistics and econometric analysis, forecasting and simulation, data presentation, and programming. It makes use of the user-friendly windows environment; most of its operations can be done with the drop-down menus. The information on EViews is given at http://www.eviews.com. In general, EViews can perform the following jobs: Interpolation tools, Whitening,Long-run variances and covariances, Variance ratio tests, Instrumental Variables & GMM, Single-Equation Cointegration, Generalized Linear Models and Diagnostics. Minitab
Minitab is a statistics package developed at the Pennsylvania State University. The latest version of the software is Minitab 16. Some of the features of Minitab are logically arranged menus and tools, project Manager, ReportPad™ for generating reports, Easily export output to PowerPoint and Word, Clear, comprehensive Help system, StatGuide™ explains output, Tool-specific tutorials, Glossary of statistical terms, Smart Dialog Boxes™ remember recent settings and available in 7 languages. Minitab provides facilities like Data and File Management, Basic Statistics, Graphics, Regression Analysis, Analysis of Variance, Statistical Process Control, Multivariate Analysis, Time Series and Forecasting, Non-parametrics and Simulation and Distributions. SHAZAM
SHAZAM is comprehensive software for econometrics, statistics and analytics. The primary strength of SHAZAM is the estimation and testing of many types of econometric and statistical models. SHAZAM 11 includes the fully searchable electronic version of the SHAZAM Reference Manual.

408 Central Marine Fisheries Research Institute, Kochi : Cadalmin, 458 pp.
Mini.K.G
The next
section gives highlight on some of the commonly used open source and freeware statistical softwares. The Open source software is one which must comply with certain criteria (defined by the Open Source Initiative (www.opensource.org/docs/definition.php)). Notably, the software must be distributed free of charge and the source code must remain public for study and adaptation to other open source uses. If the open source code is used in the development of other software, that software cannot become proprietary. Free statistical software is a practical alternative to commercial packages. In general, free statistical software gives results that are the same as the results from commercial programs, and many of the packages are fairly easy to learn, using menu systems, although a few are command-driven. These packages come from a variety of sources, including governments, non-governmental organisations and also developed by individuls.
R, an open source software for statistical computing and graphics. R provides a wide
variety of statistical and graphical techniques, including linear and nonlinear modeling, classical statistical tests, time-series analysis, classification, clustering, and others. R is easily
extensible through functions and extensions. Many of R's standard functions are written in R itself, which makes it easy for users to follow the algorithmic choices made. R is highly extensible through the use of user-submitted packages for specific functions or specific areas of study. R is an implementation of the S programming language and due to the S heritage; R has stronger object-oriented programming facilities than most statistical
computing languages. The static graphics, which can produce publication-quality graphs, including mathematical symbols is another strength of R. Dynamic and interactive graphics are available through additional packages. R compiles and runs on a wide variety of UNIX platforms, Windows and MacOS. The CRAN page offers a window into the world of R (http://cran.r-project.org). GRETL
Gretl is a cross-platform software package for econometric analysis, written in the C programming language. It is free, open-source software. Gretl is very similar to EViews. Some of the features of gretl are listed below.
A wide variety of estimators: least squares, maximum likelihood, GMM; single-equation and system methods

Shyam S. Salim and R.Narayanakumar, (2012). Manual on World Trade Agreements and Indian Fisheries Paradigms: A Policy Outlook. 409
Developing Policy Inputs for Efficient Trade and Sustainable Development Using Data Analysis
Time series methods: ARMA, GARCH, VARs and VECMs, unit-root and cointegration tests, etc.
Limited dependent variables: logit, probit, tobit, interval regression, models for count and duration data, etc.
Integrated scripting language: enter commands either via the gui or via script Command loop structure for Monte Carlo simulations and iterative estimation
procedures Epidata
EpiData Entry is used for simple or programmed data entry and data documentation. Entry handles simple forms or related systems Optimised documentation and error detection features. EpiData Analysis performs basic statistical analysis, graphs, and comprehensive data management.
G7
G7 is an econometric regression and model-building program for Windows. G7 is developed by Inforum, or the Inter-industry Forcasting Project at the University of Maryland. Inforum provides a wide variety of economic forecasts tailored to the needs of its research sponsors. Forecasts include macroeconomic, industry, demographic, occupational, and international. Inforum also provides models which includes macroeconomic models, macro-industry models,
international models, and a demographics model.
XLSTAT
The XLSTAT statistical analysis add-in offers a wide variety of functions to enhance the analytical capabilities of Excel, making it the ideal tool for everyday data analysis and statistics requirements. The multivariate statistical tools available in XLSTAT are given in the figure.
n Illustration The aim of the analysis is to study the determinants of export volume. The dependent (endogenous) variable is export volume and the independent (exogenous) variables are Transport cost, Exchange rate and Distance. The SAS codes for fitting a multiple linear regression are as follows. data example; /*Reading data in SAS*/ proc reg data=example; /*Fitting multiple linear regression model*/ model expvol = Transport_cost Exchange_rate Distance; run;

410 Central Marine Fisheries Research Institute, Kochi : Cadalmin, 458 pp.
Mini.K.G
AS Computer Output - Interpretation
Parameter Estimates Model Coef Std Error t Sig.
Constant - 29.45 6.00 - 4.91 0.00
Transport_cost 1.38 0.09 14.87 0.01
Exchange_rate - 2.31 0.33 - 6.95 0.00
Distance 4.21 0.75 5.59 0.03
Exports = -29.45 + 1.38*Transport cost – 2.31*Exchange rate+ 4.21*Distance + εit
The above regression equation tells that export volume is expected to increase by 1.38 when the transport cost goes up by one unit while controlling the effects of exchange rate and distance in the model. Similarly, export volume is expected to decrease by 2.31 when exchange rate goes up by one unit and increase by 4.21 when the distance goes up by one unit.
*********
The t values test the hypothesis that
the coefficient is different from zero.
The higher the t value, the higher the
significance of the variable.