developing synthetic well logs for the upper …shahab.pe.wvu.edu/publications/pdfs/spe98013.pdf ·...
TRANSCRIPT
RolonRolon, L. F., , L. F., MohagheghMohaghegh, S. D., , S. D., AmeriAmeri, S. and , S. and GaskariGaskari, R. , R.
West Virginia UniversityWest Virginia UniversityMcDaniel, B. A. McDaniel, B. A.
Dominion E&PDominion E&P
Morgantown, September 16th 2005
SPE 98013SPE 98013
Developing Synthetic Well Logs for Developing Synthetic Well Logs for the Upper Devonian Units in the Upper Devonian Units in
Southern PennsylvaniaSouthern Pennsylvania

ObjectiveObjective
To develop a methodology to generate synthetic wireline logs using an Artificial Neural Network in conjunction with data from conventional wireline logs.
Synthetic logs can help analyze the reservoir properties in areas where the set of logs that are necessary, are absent or incomplete .

OutlineOutline
• Introduction• Location• Geology
• Methodology• Results• Conclusions

OutlineOutline
• Introduction• Location• Geology
• Methodology• Results• Conclusions

LocationLocation
Southwestern Pennsylvania, Southwestern Pennsylvania, Armstrong Co.Armstrong Co.
Armstrong Co.Armstrong Co.
174174
169169
168168
157157
1 mile
A
A’
CrossCross--Section A Section A –– A’A’

StratigraphyStratigraphy
Up
perm
ost
Devo
nia
n
362 m.y.
367 m.y.
Cat
skill
Del
ta Ven
ango P
lay
Bra
dfo
rd
Play
2nd Bradford2nd Bradford
SpeechleySpeechley
GordonGordon
100 Foot100 Foot
MurrysvilleMurrysville

CrossCross--section Lower Zonesection Lower Zone
SW (A) NE (A’)
174 168 169 157
2350
2450
2400
3400
3450
3500
3200
3250
3300
3350
2950
3000
2900
3150
3050
3100
2850
2800
2750
2700
2650
2600
2550
2500
2nd Bradford
2450
2400
3400
3450
35003550
3200
3250
3300
3350
2950
3000
2900
3150
3050
3100
2850
2800
2750
2700
2650
2600
2550
25002450
2400
3400
3450
35003550
3200
3250
3300
3350
2950
3000
2900
3150
3050
3100
2850
2800
2750
2700
2650
2600
2550
2500
3400
3450
35003550
3600
3650
3200
3250
3300
3350
2950
3000
2900
3150
3050
3100
2850
2800
2750
2700
2650
2600
2550
2500
Speechley
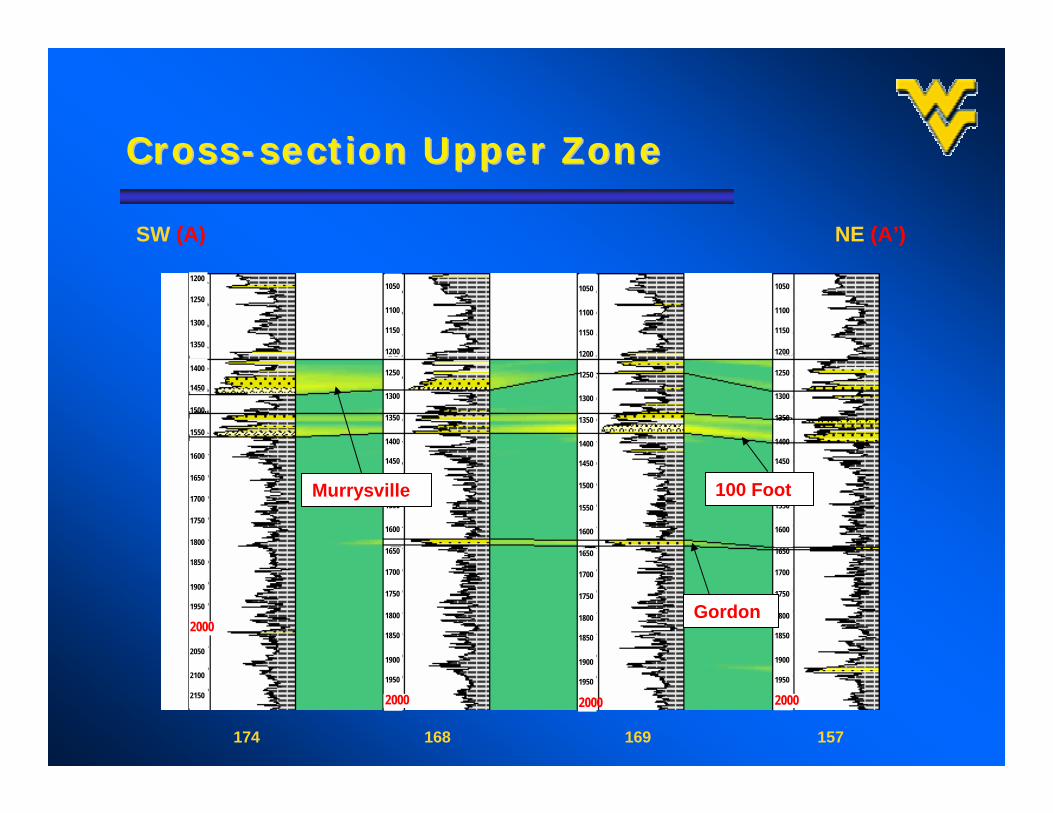
CrossCross--section Upper Zonesection Upper Zone
SW (A) NE (A’)
Murrysville 100 Foot
Gordon
174 168 169 157
1900
1950
2000
1050
1100
1150
1700
1750
1800
1850
1450
1500
1400
1650
1550
1600
1350
1300
1250
1200
1900
1950
20002050
2100
2150
1700
1750
1800
1850
1450
1500
1400
1650
1550
1600
1350
1300
1250
1200
1900
1950
2000
1050
1100
1150
1700
1750
1800
1850
1450
1500
1400
1650
1550
1600
1350
1300
1250
1200
1900
1950
2000
1050
1100
1150
1700
1750
1800
1850
1450
1500
1400
1650
1550
1600
1350
1300
1250
1200
Murrysville 100 Foot
Gordon

StructureStructure
Murrysville Anticline

StructureStructure
Murrysville Anticline

OutlineOutline
• Introduction• Location• Geology
• Methodology• Results• Conclusions

• The neural network model to create synthetic logs was developed in NeuroShell®2.
• The algorithm used to build the model was General Regression
• The architecture used consisted of three layers: • input layer - 7 neurons• hidden layer - 7000 neurons• output layer - 1 neuron
MethodologyMethodology

DATA MATRIXDATA MATRIX
ID DEPTH LAT LONG RILD DEN NPRL GRGC DNND157 2000 40.5859 79.4719 32.87 2.7 8.79 144.66 15775.31157 2000 40.5859 79.4719 31.73 2.71 9.08 145.1 15718.19157 1999 40.5859 79.4719 30.91 2.71 9.38 142.85 15628.33157 1999 40.5859 79.4719 30.82 2.71 9.58 141.16 15647.24157 1998 40.5859 79.4719 31.57 2.71 9.61 142.1 15765.67157 1998 40.5859 79.4719 32.53 2.69 9.43 142.63 15928.85
ID DEPTH LAT LONG RILD DEN NPRL GRGC DNND157 2000 40.5859 79.4719 32.87 2.7 8.79 144.66 15775.31157 2000 40.5859 79.4719 31.73 2.71 9.08 145.1 15718.19157 1999 40.5859 79.4719 30.91 2.71 9.38 142.85 15628.33157 1999 40.5859 79.4719 30.82 2.71 9.58 141.16 15647.24157 1998 40.5859 79.4719 31.57 2.71 9.61 142.1 15765.67157 1998 40.5859 79.4719 32.53 2.69 9.43 142.63 15928.85
XYZ RESISTIVITY
DENSIITY GAMMA RAY
NEUTRON

Combination of Inputs/OutputsCombination of Inputs/Outputs
I A
DEN GRRE S NEU XYZ
X
Y
Z
I I I
DEN GRRES NEU XYZ
X
Y
Z
IA I I I
I A
DEN GRRE S NEU XYZ
X
Y
Z
I I I
A
I
= Actual Output
= Inputs
RES = Resistivity
DEN = Density
GR = Gamma Ray
NEU = Neutron
XYZ = Coordinates and Depths
Combination A
Combination B
Combination C
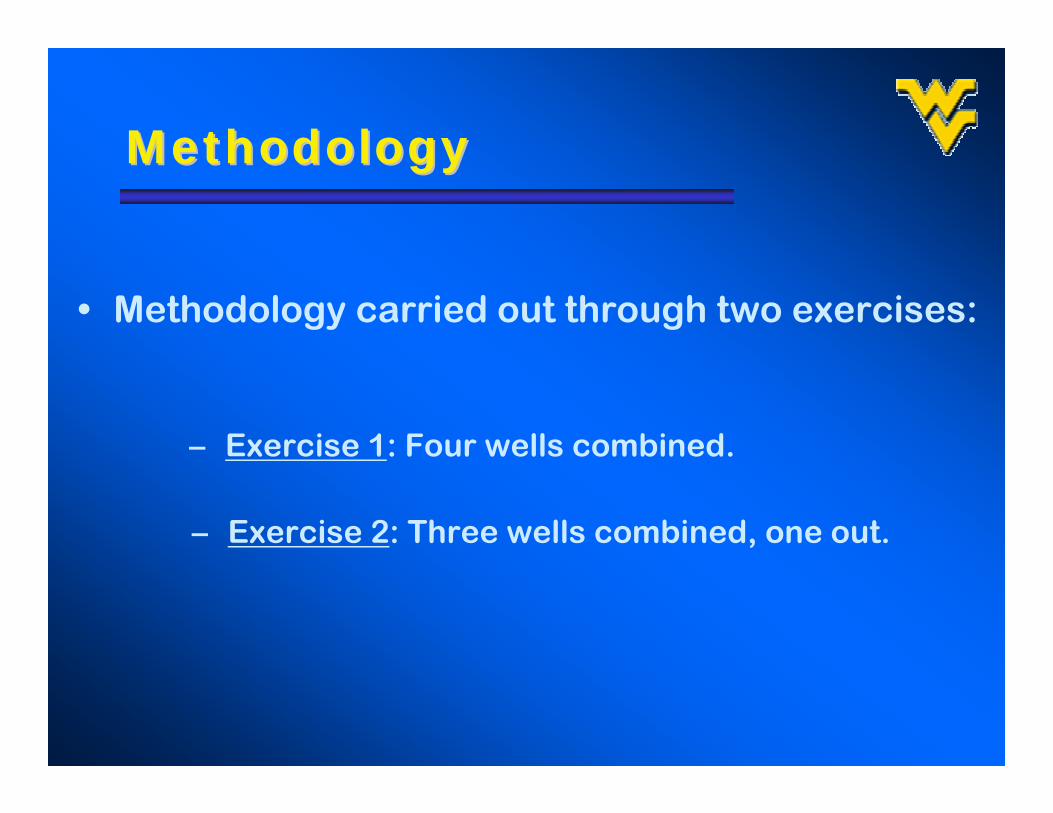
• Methodology carried out through two exercises:
– Exercise 1: Four wells combined.
– Exercise 2: Three wells combined, one out.
MethodologyMethodology

11STST EXERCISE EXERCISE -- Four Wells CombinedFour Wells Combined
• Four wells were used for development and training of the network
Training and
testingwells
157
168
169
174
Verification wells
157
168
169
174
• Then each one of these wells was used for verification of the trained network.
Pro
duct
ion
Set

Training and
calibrationwells
157
168
169
Verificationwell
174
Training and
calibrationwells
174
169
168
Verificationwell
157
Verificationwell
169
Training and
calibrationwells
157
168
174
168
Verificationwell
Training and
calibrationwells
157
174
169
22NDND EXERCISE EXERCISE -- Three wells combined, one outThree wells combined, one out
• Three wells were used for development and training of the network.
• A fourth well, never used during training and calibration, was selected for verification of the network.

First Attempt First Attempt -- Buffalo Valley FieldBuffalo Valley Field
NEW MEXICO
TEXAS
OKLAHOMA
MEXICO
321321
1 mile
219219 754754665665

OutlineOutline
• Introduction• Location• Geology
• Methodology• Results• Conclusions
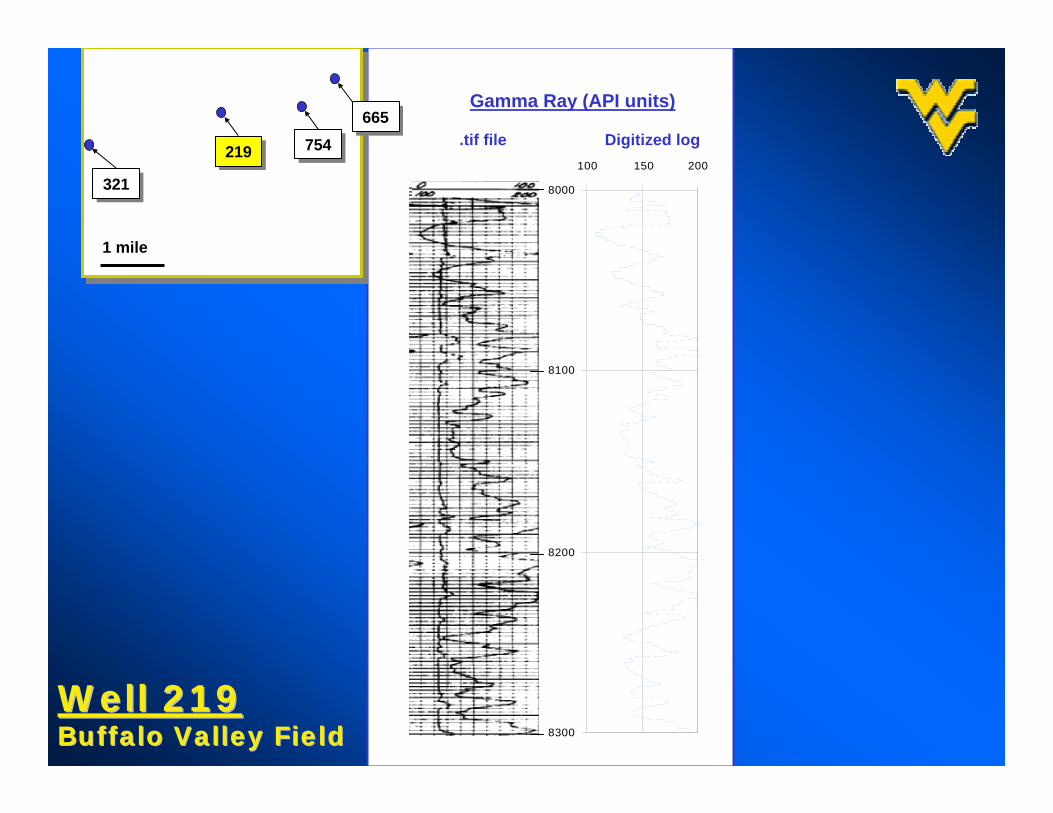
8000
8100
8200
8300
100 150 200
.tif file Digitized log
Gamma Ray (API units)
Well 219Well 219Buffalo Valley FieldBuffalo Valley Field
321321
1 mile
219219 754754665665

8000
8100
8200
8300
2.0 2.5 3.0
.tif file Digitized log
Density (g/ccm)
Well 219Well 219Buffalo Valley FieldBuffalo Valley Field
321321
1 mile
219219 754754665665

8000
8100
8200
8300
-200 0 200 400
.tif file Digitized log
Resistivity (ohm-m)
Well 219Well 219Buffalo Valley FieldBuffalo Valley Field
321321
1 mile
219219 754754665665

Data Set R2 Data Set R2 Data Set R2
TRN 0.9555 TRN 0.9715 TRN 0.8664TST 0.9377 TST 0.9603 TST 0.8254
PRO well 754 -0.4601 PRO well 754 -0.1129 PRO well 754 -0.1082
Data Set R2 Data Set R2 Data Set R2
TRN 0.9619 TRN 0.9858 TRN 0.8059TST 0.9627 TST 0.98 TST 0.803
PRO well 665 0.3422 PRO well 665 -1.4643 PRO well 665 0.2685
Data Set R2 Data Set R2 Data Set R2
TRN 0.9459 TRN 0.8674 TRN 0.9504TST 0.9249 TST 0.801 TST 0.8546
PRO well 321 -11.5431 PRO well 321 -2.6582 PRO well 321 -0.2056
Data Set R2 Data Set R2 Data Set R2
TRN 0.7571 TRN 0.9688 TRN 0.8401TST 0.7162 TST 0.9766 TST 0.807
PRO well 219 -139.6099 PRO well 219 -0.9922 PRO well 219 -1.3319
COMBINATION A COMBINATION B COMBINATION CTraining wells: 219, 321, 665 Training wells: 219, 321, 665 Training wells: 219, 321, 665Verification well: 754 Verification well: 754 Verification well: 754
Training wells: 219, 321, 754 Training wells: 219, 321, 754 Training wells: 219, 321, 754Verification well: 665 Verification well: 665 Verification well: 665
Training wells: 219, 754, 665 Training wells: 219, 754, 665 Training wells: 219, 754, 665Verification well: 321 Verification well: 321 Verification well: 321
Training wells: 754, 665, 321 Training wells: 754, 665, 321 Training wells: 754, 665, 321Verification well: 219 Verification well: 219 Verification well: 219
Exercise 2 Exercise 2 -- Buffalo Valley FieldBuffalo Valley Field

Verification data set well 219
7900
8000
8100
8200
8300
8400
8500
10 100 1000 10000
Resistivity (ohm-m)
Dep
th (f
eet)
ActualNetwork
Well 219Well 219Buffalo Valley FieldBuffalo Valley Field
321321
1 mile
219219 754754665665
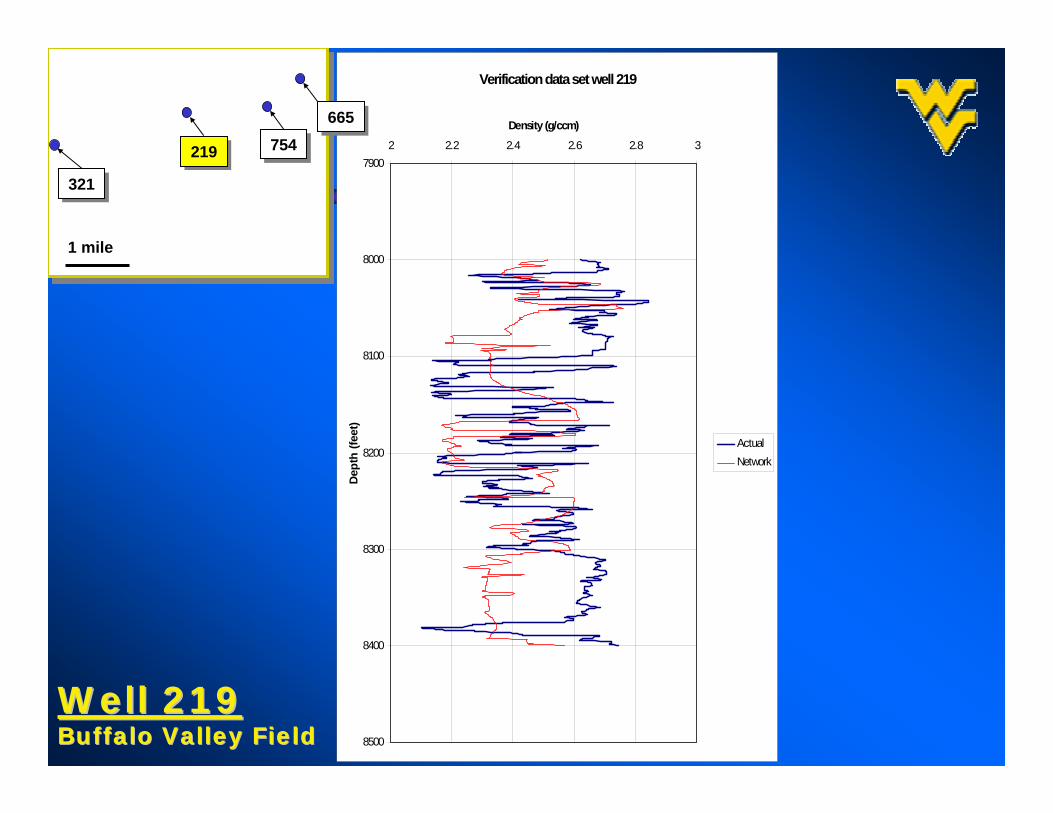
Verification data set well 219
7900
8000
8100
8200
8300
8400
8500
2 2.2 2.4 2.6 2.8 3
Density (g/ccm)
Dep
th (f
eet)
ActualNetwork
Well 219Well 219Buffalo Valley FieldBuffalo Valley Field
321321
1 mile
219219 754754665665

Southern Pennsylvania AreaSouthern Pennsylvania Area
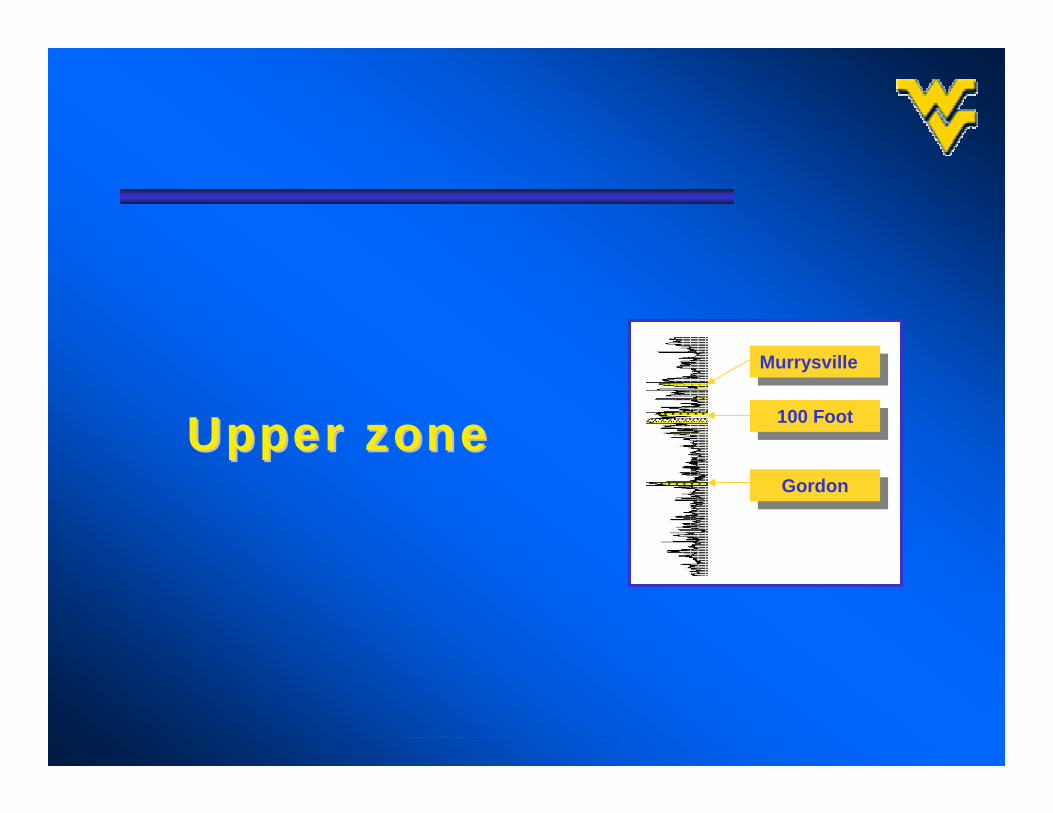
Upper zoneUpper zoneGordonGordon
100 Foot100 Foot
MurrysvilleMurrysville
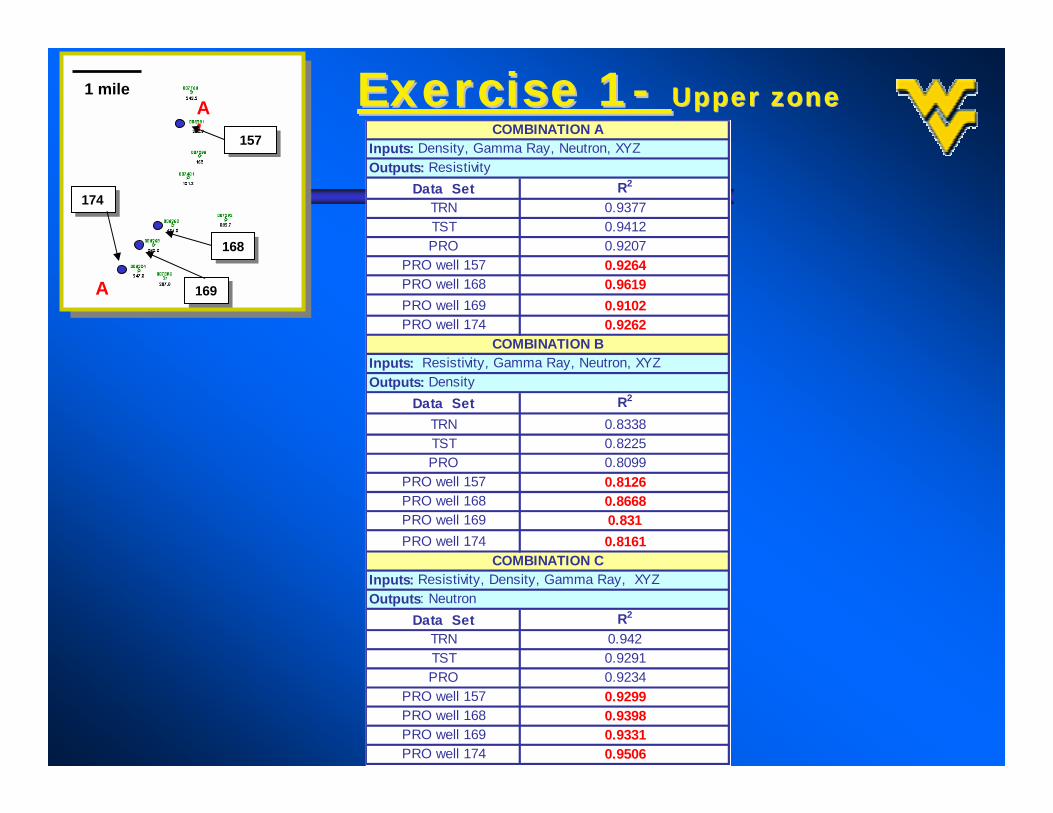
Exercise 1Exercise 1-- Upper zoneUpper zone
174174
169169
168168
157157
1 mile
A
A’
Data Set R2
TRN 0.9377TST 0.9412PRO 0.9207
PRO well 157 0.9264PRO well 168 0.9619PRO well 169 0.9102PRO well 174 0.9262
Data Set R2
TRN 0.8338TST 0.8225PRO 0.8099
PRO well 157 0.8126PRO well 168 0.8668PRO well 169 0.831PRO well 174 0.8161
Data Set R2
TRN 0.942TST 0.9291PRO 0.9234
PRO well 157 0.9299PRO well 168 0.9398PRO well 169 0.9331PRO well 174 0.9506
Outputs: Neutron
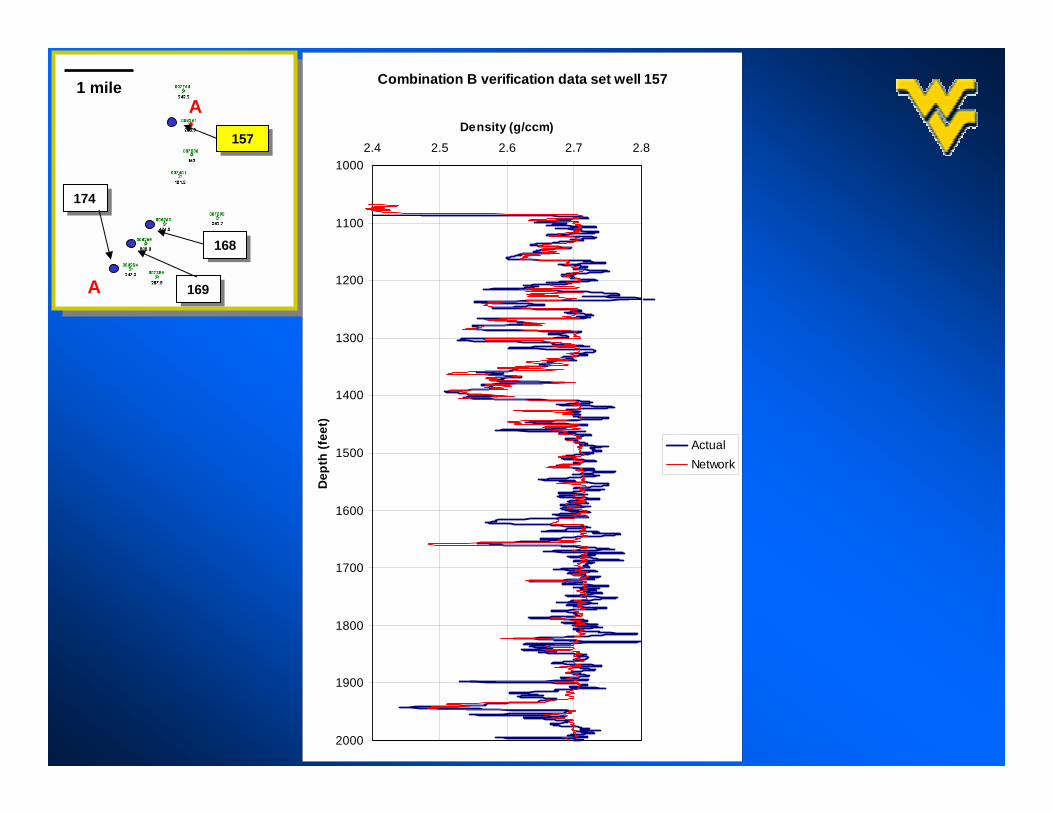
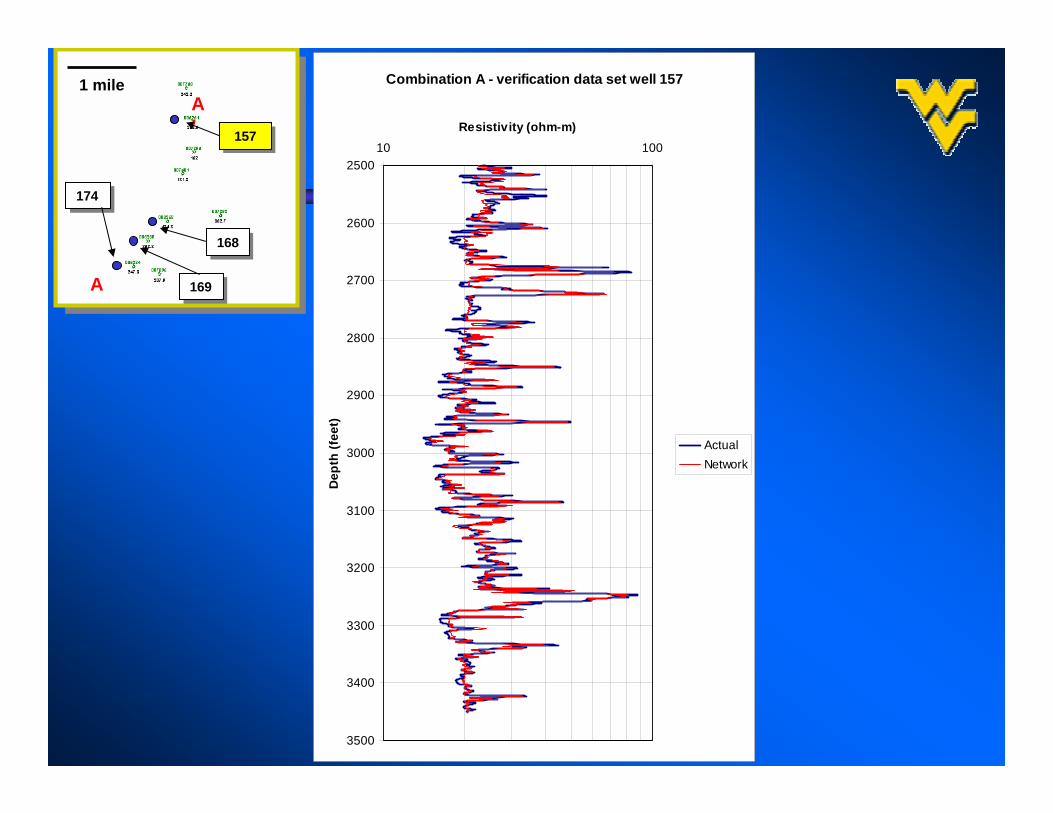
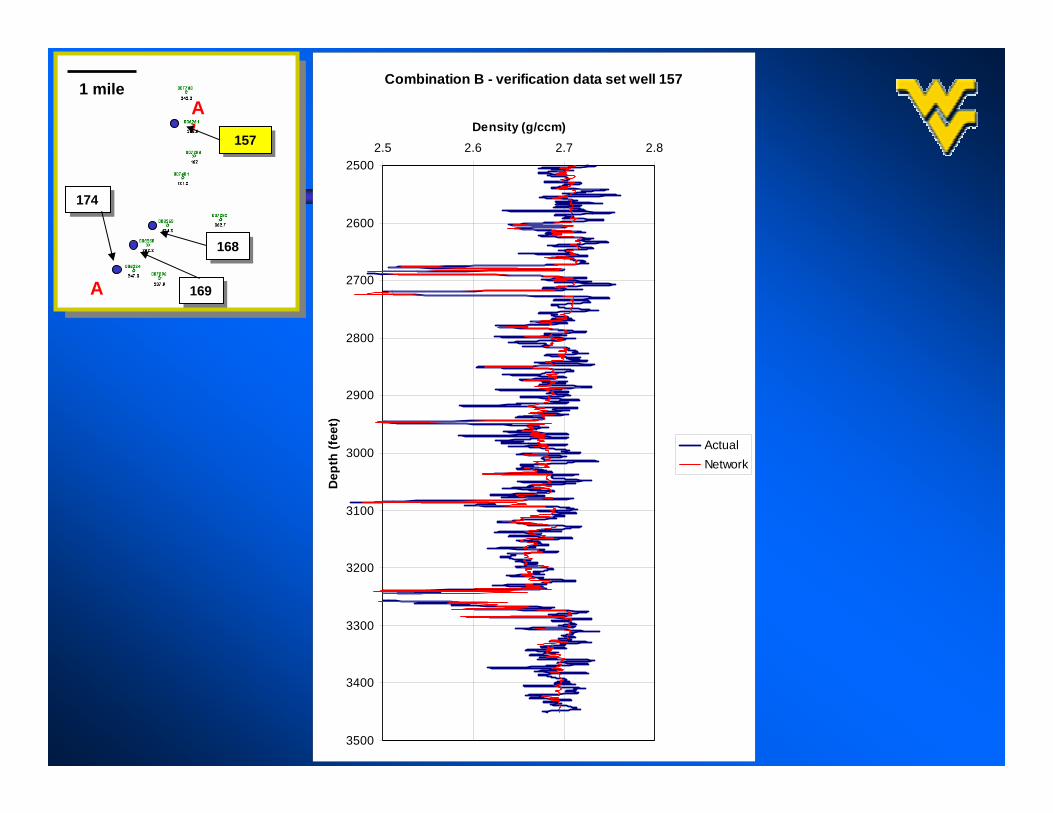
Inputs: Resistivity, Gamma Ray, Neutron, XYZOutputs: Density
COMBINATION CInputs: Resistivity, Density, Gamma Ray, XYZ
COMBINATION AInputs: Density, Gamma Ray, Neutron, XYZOutputs: Resistivity
COMBINATION B

174174
169169
168168
157157
1 mile
A
A’
Combination A - verification dataset well 157
1200
1300
1400
1500
1600
1700
1800
1900
2000
10 100 1000
Resistivity (ohm-m)
Dep
th (f
eet)
ActualNetwork

174174
169169
168168
157157
1 mile
A
A’
Combination B - verification data set well 157
1100
1200
1300
1400
1500
1600
1700
1800
1900
2000
2.5 2.6 2.7 2.8
Density (g/ccm)
Dep
th (f
eet)
ActualNetwork

174174
169169
168168
157157
1 mile
A
A’
Combination C - verification data set well 157
1100
1200
1300
1400
1500
1600
1700
1800
1900
2000
15000 20000 25000
Neutron (snu)
Dep
th (f
eet)
ActualNetwork
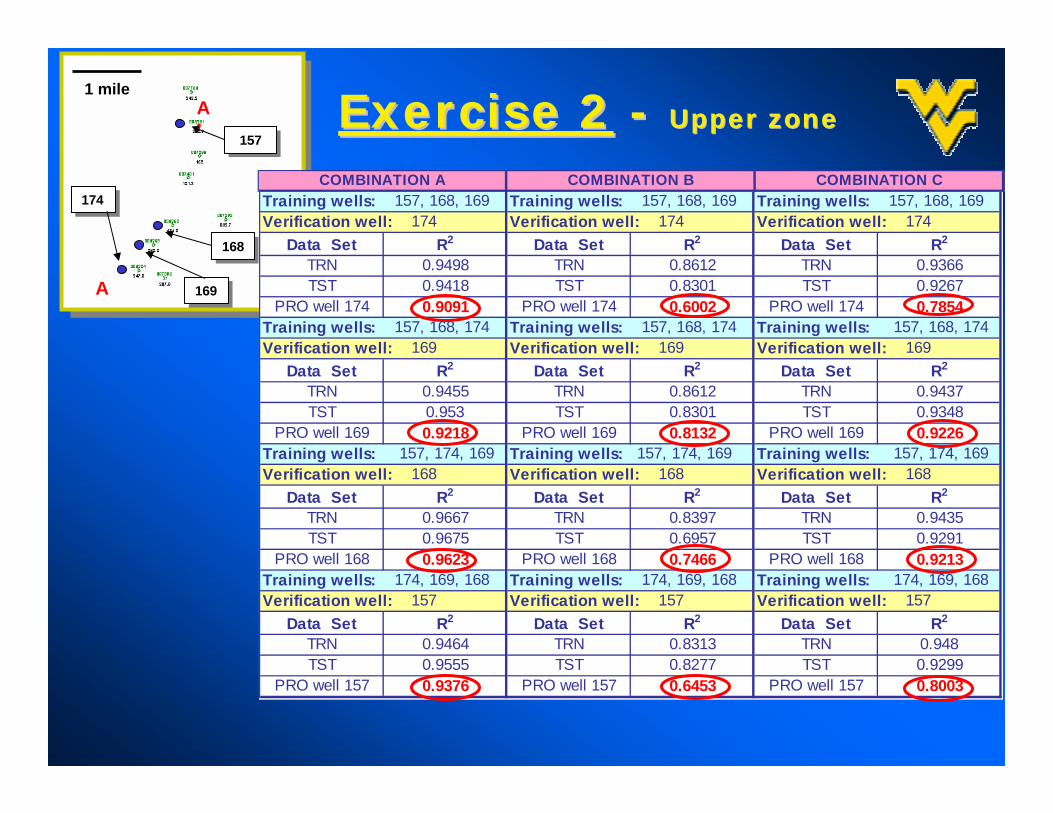
Exercise 2Exercise 2 -- Upper zone Upper zone
174174
169169
168168
157157
1 mile
A
A’
Data Set R2 Data Set R2 Data Set R2
TRN 0.9498 TRN 0.8612 TRN 0.9366TST 0.9418 TST 0.8301 TST 0.9267
PRO well 174 0.9091 PRO well 174 0.6002 PRO well 174 0.7854
Data Set R2 Data Set R2 Data Set R2
TRN 0.9455 TRN 0.8612 TRN 0.9437TST 0.953 TST 0.8301 TST 0.9348
PRO well 169 0.9218 PRO well 169 0.8132 PRO well 169 0.9226
Data Set R2 Data Set R2 Data Set R2
TRN 0.9667 TRN 0.8397 TRN 0.9435TST 0.9675 TST 0.6957 TST 0.9291
PRO well 168 0.9623 PRO well 168 0.7466 PRO well 168 0.9213
Data Set R2 Data Set R2 Data Set R2
TRN 0.9464 TRN 0.8313 TRN 0.948TST 0.9555 TST 0.8277 TST 0.9299
PRO well 157 0.9376 PRO well 157 0.6453 PRO well 157 0.8003
Verification well: 157 Verification well: 157 Verification well: 157
Verification well: 168 Verification well: 168 Verification well: 168
Training wells: 174, 169, 168 Training wells: 174, 169, 168 Training wells: 174, 169, 168
Verification well: 169 Verification well: 169 Verification well: 169
Training wells: 157, 174, 169 Training wells: 157, 174, 169 Training wells: 157, 174, 169
Verification well: 174 Verification well: 174 Verification well: 174
Training wells: 157, 168, 174 Training wells: 157, 168, 174 Training wells: 157, 168, 174
Training wells: 157, 168, 169 Training wells: 157, 168, 169 Training wells: 157, 168, 169COMBINATION A COMBINATION B COMBINATION C

174174
169169
168168
157157
1 mile
A
A’
Combination A verification data set well 157
1000
1100
1200
1300
1400
1500
1600
1700
1800
1900
2000
10 100 1000
Resistivity (ohm-m)
Dep
th (f
eet)
ActualNetwork
174174
169169
168168
157157
1 mile
A
A’
Combination B verification data set well 157
1000
1100
1200
1300
1400
1500
1600
1700
1800
1900
2000
2.4 2.5 2.6 2.7 2.8
Density (g/ccm)
Dep
th (f
eet)
ActualNetwork

174174
169169
168168
157157
1 mile
A
A’
Combination C verification data set well 157
1000
1100
1200
1300
1400
1500
1600
1700
1800
1900
2000
14000 16000 18000 20000 22000
Neutron (snu)
Dep
th (f
eet)
ActualNetwork

Lower zoneLower zone
2nd Bradford2nd Bradford
SpeechleySpeechley

Exercise 1Exercise 1-- Upper zoneUpper zone
Data Set R2
TRN 0.9536TST 0.9388PRO 0.9426
PRO well 157 0.9582PRO well 168 0.955PRO well 169 0.9199PRO well 174 0.9568
Data Set R2
TRN 0.8118TST 0.7946PRO 0.8336
PRO well 157 0.8229PRO well 168 0.816PRO well 169 0.7911PRO well 174 0.8064
Data Set R2
TRN 0.9313TST 0.9133PRO 0.9311
PRO well 157 0.9087PRO well 168 0.94PRO well 169 0.9215PRO well 174 0.9354
Outputs: Neutron
Inputs: Resistivity, Gamma Ray, Neutron, XYZOutputs: Density
COMBINATION CInputs: Resistivity, Density, Gamma Ray, XYZ
COMBINATION AInputs: Density, Gamma Ray, Neutron, XYZOutputs: Resistivity
COMBINATION B
174174
169169
168168
157157
1 mile
A
A’
174174
169169
168168
157157
1 mile
A
A’
Combination A - verification data set well 157
2500
2600
2700
2800
2900
3000
3100
3200
3300
3400
3500
10 100
Resistivity (ohm-m)
Dep
th (f
eet)
ActualNetwork
174174
169169
168168
157157
1 mile
A
A’
Combination B - verification data set well 157
2500
2600
2700
2800
2900
3000
3100
3200
3300
3400
3500
2.5 2.6 2.7 2.8
Density (g/ccm)
Dep
th (f
eet)
ActualNetwork

174174
169169
168168
157157
1 mile
A
A’
Combination C - verification data set well 157
2500
2600
2700
2800
2900
3000
3100
3200
3300
3400
3500
15000 16000 17000 18000 19000 20000
Neutron (snu)
Dep
th (f
eet)
ActualNetwork

Exercise 2 Exercise 2 -- Upper zoneUpper zone
174174
169169
168168
157157
1 mile
A
A’
Data Set R2 Data Set R2 Data Set R2
TRN 0.9511 TRN 0.9511 TRN 0.9303TST 0.9352 TST 0.8882 TST 0.9185
PRO well 174 0.8628 PRO well 174 0.5844 PRO well 174 0.8447
Data Set R2 Data Set R2 Data Set R2
TRN 0.9704 TRN 0.8244 TRN 0.9354TST 0.9413 TST 0.7873 TST 0.9138
PRO well 169 0.8815 PRO well 169 0.6898 PRO well 169 0.8869
Data Set R2 Data Set R2 Data Set R2
TRN 0.9531 TRN 0.8155 TRN 0.9301TST 0.9416 TST 0.7754 TST 0.9014
PRO well 168 0.8945 PRO well 168 0.76 PRO well 168 0.8811
Data Set R2 Data Set R2 Data Set R2
TRN 0.9671 TRN 0.81 TRN 0.9461TST 0.9564 TST 0.8103 TST 0.9328
PRO well 157 0.8825 PRO well 157 0.7172 PRO well 157 0.742
Verification well: 157
Combination ATraining wells: 157, 168, 169Verification well: 174
Verification well: 169
Verification well: 174 Verification well: 174
Training wells: 157, 168, 174 Training wells: 157, 168, 174 Training wells: 157, 168, 174
Combination B Combination CTraining wells: 157, 168, 169 Training wells: 157, 168, 169
Training wells: 174, 169, 168 Training wells: 174, 169, 168 Training wells: 174, 169, 168
Verification well: 169 Verification well: 169
Training wells: 157, 174, 169 Training wells: 157, 174, 169Training wells: 157, 174, 169Verification well: 168
Verification well: 157 Verification well: 157
Verification well: 168 Verification well: 168

174174
169169
168168
157157
1 mile
A
A’
Combination A - verification data set well 157
2500
2600
2700
2800
2900
3000
3100
3200
3300
3400
3500
10 100
Resistivity (ohm-m)
Dep
th (f
eet)
ActualNetwork

174174
169169
168168
157157
1 mile
A
A’
Combination B - verification data set well 157
2500
2600
2700
2800
2900
3000
3100
3200
3300
3400
3500
2.5 2.55 2.6 2.65 2.7 2.75 2.8
Density (ccm)
Dept
h (fe
et)
ActualNetwork

174174
169169
168168
157157
1 mile
A
A’
Combination C - verification data set well 157
2500
2600
2700
2800
2900
3000
3100
3200
3300
3400
3500
14000 16000 18000 20000 22000
DNND (snu)
Dep
th (f
eet)
ActualNetwork
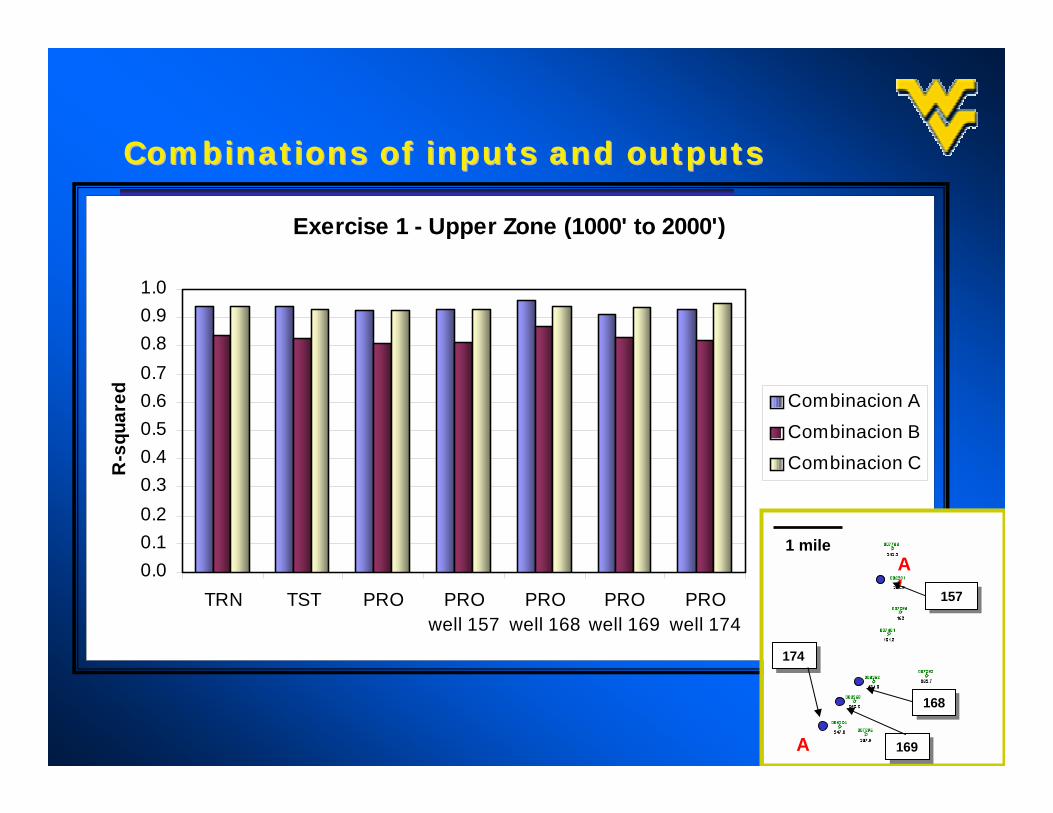
Exercise 1 - Upper Zone (1000' to 2000')
0.00.10.20.30.40.50.60.70.80.91.0
TRN TST PRO PROwell 157
PROwell 168
PROwell 169
PROwell 174
R-s
quar
ed Combinacion A
Combinacion B
Combinacion C
Combinations of inputs and outputs Combinations of inputs and outputs
174174
169169
168168
157157
1 mile
A
A’
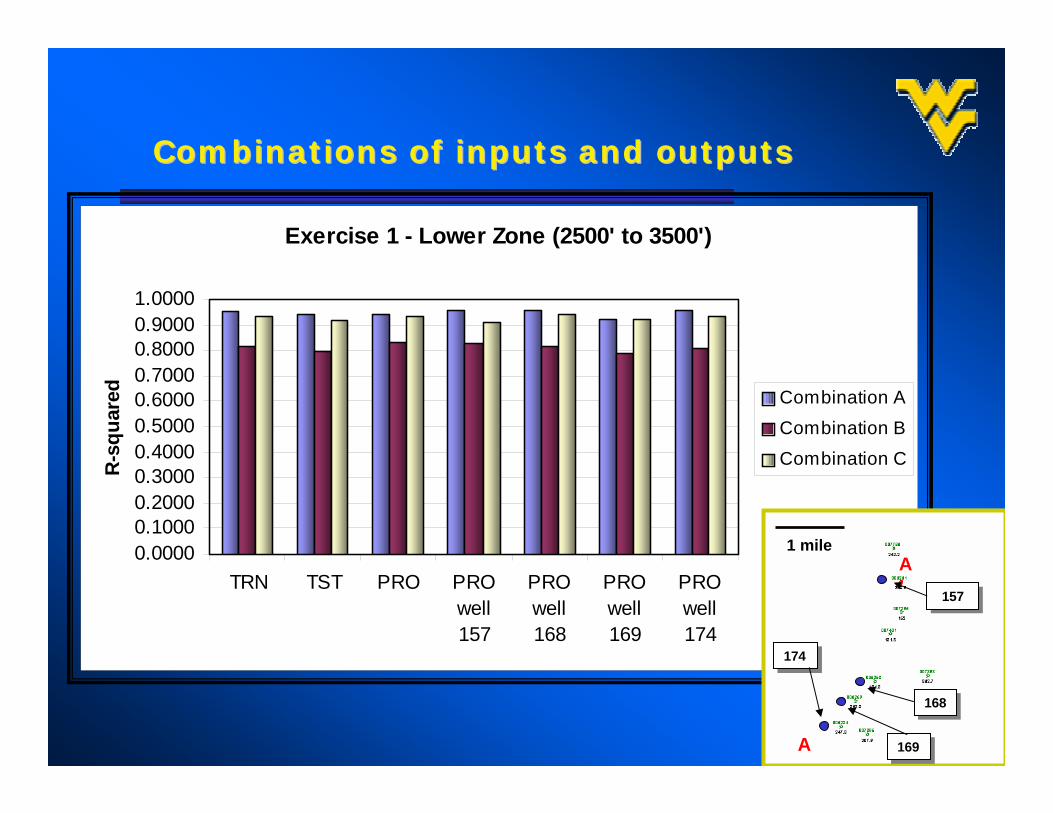
Exercise 1 - Lower Zone (2500' to 3500')
0.00000.10000.20000.30000.40000.50000.60000.70000.80000.90001.0000
TRN TST PRO PROwell157
PROwell168
PROwell169
PROwell174
R-sq
uare
d Combination A
Combination B
Combination C
Combinations of inputs and outputs Combinations of inputs and outputs
174174
169169
168168
157157
1 mile
A
A’
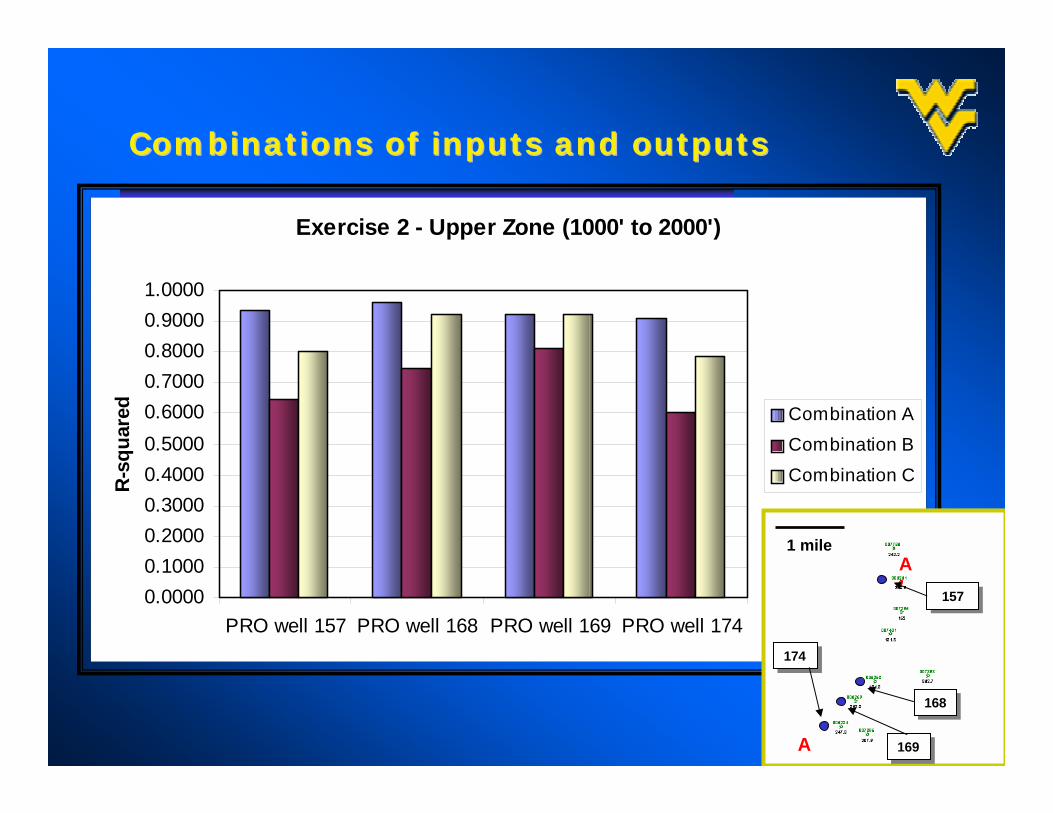
Exercise 2 - Upper Zone (1000' to 2000')
0.00000.10000.20000.30000.40000.50000.60000.70000.80000.90001.0000
PRO well 157 PRO well 168 PRO well 169 PRO well 174
R-s
quar
ed Combination A
Combination B
Combination C
Combinations of inputs and outputs Combinations of inputs and outputs
174174
169169
168168
157157
1 mile
A
A’
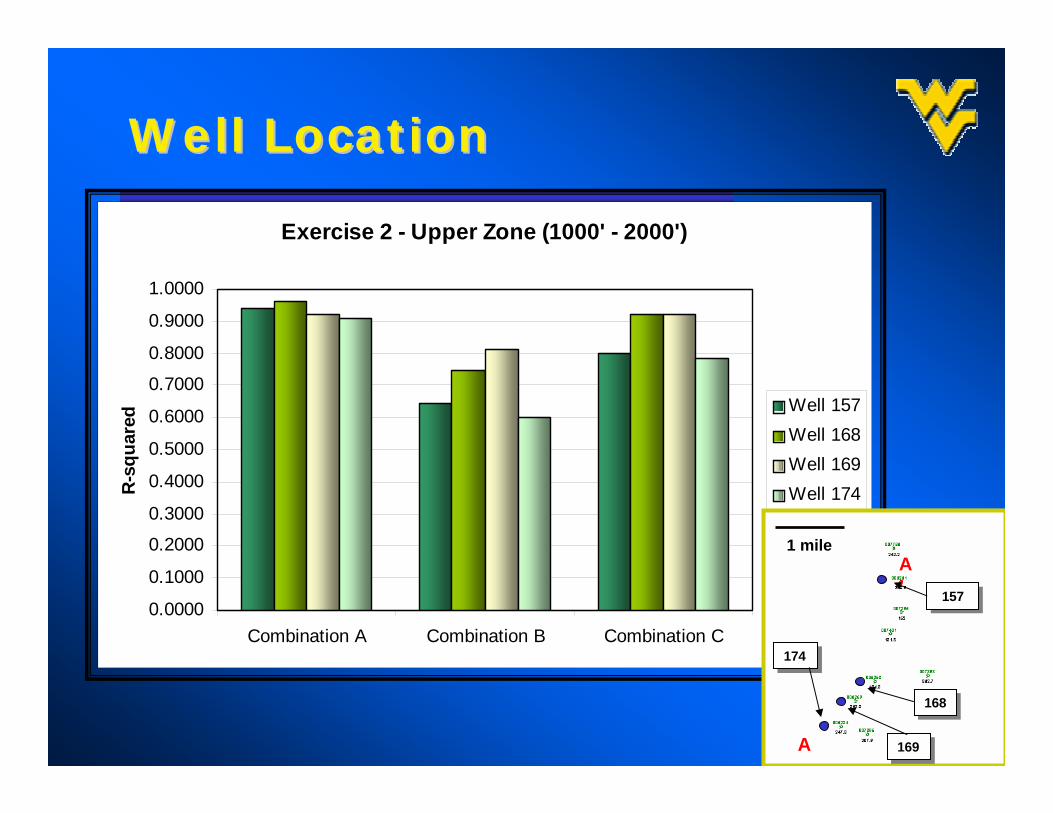
Exercise 2 - Upper Zone (1000' - 2000')
0.0000
0.1000
0.2000
0.3000
0.4000
0.5000
0.6000
0.7000
0.8000
0.9000
1.0000
Combination A Combination B Combination C
R-s
quar
ed
Well 157Well 168Well 169Well 174
Well Location Well Location
174174
169169
168168
157157
1 mile
A
A’

Exercise 2 - Lower Zone (2500' to 3500')
0.00000.10000.20000.30000.40000.50000.60000.70000.80000.90001.0000
PRO well 157 PRO well 168 PRO well 169 PRO well 174
R-sq
uare
d Combination A
Combination B
Combination C
Combinations of inputs and outputs Combinations of inputs and outputs
174174
169169
168168
157157
1 mile
A
A’

Exercise 2 - Lower Zone
0.0000
0.1000
0.2000
0.3000
0.4000
0.5000
0.6000
0.7000
0.8000
0.9000
1.0000
Combination A Combination B Combination C
R-s
quar
ed
Well 157Well 168Well 169Well 174
Well Location Well Location
174174
169169
168168
157157
1 mile
A
A’

OutlineOutline
• Introduction• Location• Geology
• Methodology• Results• Conclusions
Conclusions Conclusions
• Synthetic logs with a reasonable degree of accuracy were generated through the approach before described.
• Best performance was obtained for combination A of inputs and outputs, then for combination C, and finally for combination B.
• Accuracy of synthetic logs may be favored by interpolation of data.

• Quality of data plays a very important role in developing of a neural network model.
Conclusions Conclusions
• A recommendation for future works is to do a very careful quality control of the data before a neural network model is build.
• Lithologic heterogeneities in the reservoir do not affect significantly performance of a neural network model in generation of synthetic logs.