developing system based leading indicators
DESCRIPTION
Good HSSETRANSCRIPT

Developing System-Based Leading Indicators for Proactive Risk Management in the
Chemical Processing Industry
by
Ibrahim A. Khawaji
B.S., Chemical Engineering, Colorado School of Mines, 2001
SUBMITTED TO THE ENGINEERING SYSTEMS DIVISION IN PARTIAL
FULFILLMENT OF THE REQUIREMENTS FOR THE DEGREE OF
MASTER OF SCIENCE IN ENGINEERING SYSTEMS
AT THE
MASSACHUSETTS INSTITUTE OF TECHNOLOGY
JUNE 2012
© 2012 Massachusetts Institute of Technology. All rights reserved.
Signature of Author: ____________________________________________________________
Engineering Systems Division
May 4, 2012
Certified by: ___________________________________________________________________
Nancy G. Leveson
Professor of Aeronautics and Astronautics and Engineering Systems
Thesis Supervisor
Accepted by: __________________________________________________________________
Olivier de Weck
Associate Professor of Aeronautics and Astronautics and Engineering Systems
Chair, ESD Education Committee

2
[This page is intentionally left blank]
3
Developing System-Based Leading Indicators for Proactive Risk Management in the
Chemical Processing Industry
by
Ibrahim A. Khawaji
Submitted to the Engineering Systems Division on May 4th
, 2012 in Partial Fulfillment of the
Requirements for the Degree of Master of Science in Engineering Systems
ABSTRACT
The chemical processing industry has faced challenges with achieving improvements in safety
performance, and accidents continue to occur. When accidents occur, they usually have a
confluence of multiple factors, suggesting that there are underlying complex systemic problems.
Moreover, accident investigations often reveal that accidents were preventable and that many of
the problems were known prior to those accidents, suggesting that there may have been early
warning signs.
System-based analysis addresses systemic aspects and leading indicators enable the detection of
ineffective controls and degradation of the system. Together, they could enable taking needed
actions before an incident or a loss event. To develop process safety indicators, the chemical
processing industry currently uses guidelines that are mainly based on the concepts of the “Swiss
Cheese Model” and the “Accident Pyramid.” The current guidelines lack a systemic approach
for developing process safety indicators; the guidelines view indicators as independent measures
of the safety of a system (e.g. a failure of a barrier), which can be misleading because it would
not identify ineffective controls, such as those associated with the migration of the system
towards an unsafe state, or associated with interdependencies between barriers. Moreover,
process safety indicators that are currently used in the chemical industry are more focused on
lagging as opposed to leading indicators.
This main objective of this thesis is to develop a structured system-based method that can assist a
hydrocarbon/chemical processing organization in developing system-based process safety
leading indicators. Building on developed safety control structures and the associated safety
constraints, the proposed method can be used to develop both technical and organizational
leading indicators based on the controls, feedbacks, and process models, which, ultimately, can
ensure that there is an effective control structure.
Thesis Supervisor: Nancy G. Leveson
Title: Professor of Aeronautics and Astronautics and Engineering Systems

4
[This page is intentionally left blank]

5
ACKNOWLEDGEMENTS
I would like to express my sincere appreciation to Professor Leveson first for believing in me
and for believing that I could contribute to her research group. Working with her has been an
inspiration and I am very blessed that I got the opportunity to work with such world-known
expert in system safety that continuously works at the forefront of the field and continuously
challenges the forefront for more breakthroughs and more innovative ways to make the world a
safer place. During my time here, I have had a complete paradigm shift in my understanding of
system safety. Many thanks go to Professor Leveson for her open-mind attitude, continued
guidance and support, inspiration to join the “system thinkers club,” and more importantly for
the opportunity given to me to be here.
I wish also to express my sincere utmost thanks Professor de Weck. He has certainly inspired
me into the Engineering Systems world. His remarkable knowledge, enthusiastic attitude, and
willingness to share were incredible. To all of the Complex Systems Research Lab (CSRL) team
members, without exception, being around you has been a critical part of my learning experience
at MIT. I have learned so much from you and I am delighted to have had the opportunity to
work with such highly talented and intelligent team that has diverse background. This has
certainly broadened my knowledge by learning from you about other industries: food, nuclear,
software, aero/astro, automotive, medical/healthcare, financial, etc.
To my dad and mom, I hope that I can make you proud, and thanks for encouraging me
throughout, for your immense support, and for the ever-lasting love. To my wife, without your
incredible support, I would not have made it through MIT. I am forever grateful for your
patience with my long hours studying and extended time outside home. I could not have done
this without you. To my kids, Abdullah, Danyah, Rana, and Laura you being around is a
blessing and has made a difference, and I wish that you achieve more than this in your future.
To all my sisters and brothers, you made me who I am today.
I would also like to thank Anwar Haque, Abdullah Al-Ghamdi, William Kochinski, and Hameed
Kassem (my managers and mentors at Saudi Aramco) who continue to believe in me and
continue to give me all the support I need.
Thanks to all my friends at MIT and in Boston that were around through my time here.

6
[This page is intentionally left blank]
7
TABLE OF CONTENTS
ABSTRACT ................................................................................................................................. 3
ACKNOWLEDGEMENTS ............................................................................................................ 5
TABLE OF CONTENTS ............................................................................................................... 7
LIST OF FIGURES ....................................................................................................................... 9
LIST OF TABLES ...................................................................................................................... 10
LIST OF ACRONYMS ................................................................................................................ 11
1.0 INTRODUCTION ................................................................................................................. 13
1.1 THE PROBLEM 13 1.2 BACKGROUND: TECHNIQUES CURRENTLY USED 14 1.3 RESEARCH GOAL AND HYPOTHESIS: WHAT SHOULD BE DONE DIFFERENTLY? 15 1.4 RESEARCH APPROACH 15
2.0 BACKGROUND AND LITERATURE REVIEW ..................................................................... 16
2.1 SYSTEMS THEORY 16 2.1.1 Chemical Processes as Complex Engineering and Socio-Technical Systems .................... 16 2.1.2 Systems Safety and Safety as a Control Problem ............................................................... 17 2.1.3 Control and Plant States ...................................................................................................... 18
2.2 LEADING INDICATORS 21 2.3 TECHNIQUES CURRENTLY USED FOR DEVELOPING LEADING INDICATORS 23
2.3.1 UK HSE Guidance for Developing Process Safety Indicators; HSG254 (2006) ................ 24 2.3.2 OECD Guidance on Developing Safety Performance Indicators (2008) ............................ 25 2.3.3 Center of Chemical Process Safety Guidance ..................................................................... 26 2.3.4 API 754 “Process Safety Performance Indicators” (2010) ................................................. 27 2.3.5 Shortcomings and Summary ............................................................................................... 28
3.0 SYSTEMS MODELING AND LEADING INDICATORS ......................................................... 31
3.1 ACCIDENT MODELS AND LEADING INDICATORS 31 3.1.1 Approaches to Accident Models ......................................................................................... 31 3.1.2 Introduction to STAMP ...................................................................................................... 32 3.1.3 Safety Control and Leading Indicators ............................................................................... 33
3.2 ADDRESSING THE SYSTEM DYNAMICS 34 3.2.1 Introduction to System Dynamics ....................................................................................... 34 3.2.2 Incorporating the System Dynamics ................................................................................... 35 3.2.3 Feedback Loops .................................................................................................................. 36
3.3 ACCIDENTS AND INEFFECTIVE CONTROL – CASE STUDY 40 3.3.1 Description of the System ................................................................................................... 40 3.3.2 System Hazards, Safety Constraints, and Risk Control ...................................................... 41 3.3.3 Control Structure ................................................................................................................. 42
4.0 SYSTEM-BASED METHOD ................................................................................................. 48
4.1 OBJECTIVES 48 4.2 DEVELOPING A SYSTEM-BASED METHOD 50
4.2.1 Leading Indicators Goals .................................................................................................... 50

8
4.2.2 Achieving the Goals – Leading Indicators Development Process ...................................... 51 4.2.3 Proposed Method ................................................................................................................ 54 4.2.4 Description of the Method .................................................................................................. 57
4.3 APPLYING THE METHOD - EXAMPLE 60
5.0 SUMMARY, FUTURE RESEARCH, AND CONCLUSION ...................................................... 67
5.1 SUMMARY 67 5.2 LIMITATIONS AND FUTURE RESEARCH 68 5.3 CONCLUSION 69
6.0 DEFINITIONS ...................................................................................................................... 71
APPENDIX A – ACCIDENTS AND INEFFECTIVE CONTROL .................................................... 73
REFERENCES ........................................................................................................................... 78

9
LIST OF FIGURES
Figure 2.1: Traditional Risk Reduction Principle ........................................................................ 18
Figure 2.2: Systems View of Controls to Reduce Risk ................................................................ 19
Figure 2.3: Risk Reduction Impact .............................................................................................. 19
Figure 2.4: Plant States: Modes of Operation and Control .......................................................... 20
Figure 2.5: Loss of Control Snapshot ........................................................................................... 21
Figure 2.6: Timeline for Developed Process Safety Performance Indicators Guidance used in the
Process Industry ............................................................................................................................ 24
Figure 2.7: James T. Reason‟s “Swiss Cheese Model” and Christopher A. Hart‟s “Spinning
Disks Model” ................................................................................................................................ 28
Figure 2.8: H.W. Heinrich‟s “Accident Pyramid” ........................................................................ 29
Figure 3.1: Generic STAMP Control Structure ............................................................................ 33
Figure 3.2: System Dynamics Loops ............................................................................................ 37
Figure 3.3: System Dynamics Model............................................................................................ 38
Figure 3.4: Raffinate Splitter and the Blowdown Drum ............................................................... 40
Figure 3.5: Simple Control Structure; Controller: Operator ......................................................... 43
Figure 3.6: BP Texas City Incident – Ineffective Control ............................................................ 47
Figure 4.1: Process for Ensuring Effective Control ...................................................................... 52
Figure 4.2: Leading Indicators Development Process (Engine) ................................................... 52
Figure 4.3: Leading Indicators Development Method .................................................................. 56
Figure 4.4: Typical Separation Unit.............................................................................................. 60
Figure 4.5: Separation Unit Control Loop and Causal Factors of Inadequate Control................. 61
Figure 4.6: Developing Leading Indicators for the Separation Unit ............................................ 63
Figure A1: Simple Control Structure; Controller: Maintenance and Inspection Staff ................. 73
Figure A2: Simple Control Structure; Controller: Engineering Staff ........................................... 75
Figure A3: Simple Control Structure; Controller: Line Managers ............................................... 76
10
LIST OF TABLES
Table 2.1: Summary of the Guidelines for Developing Process Safety Indicators ..................... 30
Table 3.1: Mapping Safety Constraints to System Components .................................................. 41
Table 3.2: Physical Controls for the Blowdown Drum................................................................. 42
Table 3.3: Inadequate Control: Operator ...................................................................................... 43
Table 3.4: BP Texas City case study- Examples of ineffective controls that existed prior to the
incident .......................................................................................................................................... 44
Table 4.1: Goals for Leading Indicators ....................................................................................... 49
Table 4.2: Summary of how the goals for leading indicators can be achieved using the leading
indicators development process “engine.” .................................................................................... 53
Table 4.3: Leading Indicators for the Separation Unit ................................................................. 64
Table 4.4: Additional Leading Indicators for Monitoring Progress at the Facility Level ............ 66
Table A1: Inadequate Control: Maintenance and Inspection Staff ............................................... 74
Table A2: Inadequate Control: Engineering Staff ........................................................................ 75
Table A3: Inadequate Control: Line Managers ............................................................................ 76
11
LIST OF ACRONYMS
AICHE: American Institute of Chemical Engineers
API: American Petroleum Institute
BLEVE: Boiling Liquid Expanding Vapor Explosion
CCPS: Center of Chemical Process Safety
EPA: Environmental Protection Agency
HSE: Health and Safety Executive
LPG: Liquefied Petroleum Gas
LOC: Loss of Containment
LOD: Lines of Defense
NFPA: National Fire Protection Agency
NIOSH: National Institute of Occupational Safety and Health
NPRA: National Petroleum Refiners Association
OECD: Organization for Economic Coordination and Development
OSHA: Occupational Safety and Health Administration
PRV: Pressure Relief Valve
PSM: Process Safety Management
RMP: Risk Management Plan
STAMP: Systems Theoretic Accident Model and Processes
STPA: STAMP Based Process Hazard Analysis
VCE: Vapor Cloud Explosion

12
[This page is intentionally left blank]
13
1.0 INTRODUCTION
The chemical processing industry has changed considerably over the past several decades, and
has become more advanced and complex. Technology has focused on safer designs, companies
have established operating procedures and safety management systems, and best practices are
being shared between companies. To further enable and make standards and procedures more
effective, companies have attempted to tackle cultural norms in an effort to promote healthier
safety cultures, and, thus, improve safety performance. However, companies continue to
struggle with achieving improvements in safety performance, and accidents continue to occur.
When accidents occur, they usually have a confluence of multiple factors, suggesting that there
are underlying complex systemic problems. Moreover, accident investigations often reveal that
accidents were preventable and that many of the problems were known prior to those accidents,
suggesting that there may have been early warning signs.
System-based analysis addresses systemic aspects and process safety indicators enable the
detection of ineffective controls and degradation of the system. Together, they could enable
taking needed actions before an incident or a loss of containment event happens in a complex
system. It is vital that process safety indicators focus on leading indicators rather than lagging
ones. Lagging indicators measure incidents after they occur, while leading indicators are
proactive and forward looking measures that can identify performance degradation or
deterioration of the system prior to an incident. These indicators go hand-in-hand. However, this
research is focused on leading indicators that enable proactive risk management. This Chapter
discusses the problem, current techniques that are used, and what is proposed to be done
differently to improve the process.
1.1 THE PROBLEM
Process safety indicators that are currently used in the chemical processing industry are more
focused on lagging as opposed to leading indicators. There have been attempts in the industry to
develop leading indicators, but these efforts have fallen short of addressing the systemic aspects
that can enable the possibility of predicting potential incidents before they occur or detecting the

14
migration of a system to an unsafe state. Most companies have established risk management
programs that are either reactive (lack a forward-looking approach), or fragmented (system-
based models are not used). A risk management program and the associated decision-making
can only be effective if it considers the system as a whole and its dynamics, and if it is proactive
enough to enable early actions.
1.2 BACKGROUND: TECHNIQUES CURRENTLY USED
To develop process safety indicators, the chemical processing industry currently uses guidelines
provided by government regulators or professional organizations such as the UK HSE, OECD,
API and CCPS. These guidelines are mainly based on the concepts of the “Swiss Cheese
Model” by James T. Reason and the “Accident Pyramid” by H. W. Heinrich. The current
guidelines used by the industry lack a systemic approach for developing process safety
indicators; the guidelines view indicators as independent measures of the safety of a system (e.g.
a failure of a barrier), which can be misleading because it would not identify ineffective controls,
such as those associated with the migration of the system towards an unsafe state, or associated
with interdependencies between barriers.
There have been several attempts in the process industry to improve the way process safety
leading indicators are developed to monitor and improve safety performance. Recently, the
process industry collectively began to place a significant focus on process safety indicators, and
redefined how indicators should be developed by issuing a series of guidelines. These guidelines
lack the systems approach, particularly involving the following aspects:
They lack a structured systematic framework that can systemically facilitate obtaining
feedback on the state of the system during the different phases of the lifecycle or during
the different states of operations.
Although the new guidelines have clarified the differences between personal versus
process safety indicators, as well as leading versus lagging indicators, there are still
vague definitions of their application.
Organizational aspects are covered by some of the guidelines, but not in a systematic
way. Moreover, addressing interdependences of system components is not covered.

15
Current guidelines rely on hazard identification techniques that consider only linear
chains of events.
The guidelines do not provide a framework for monitoring the performance of the system
as a whole. They provide significant focus on individual indicators versus aggregate ones.
In summary, these guidelines do not provide a structured mechanism for developing process
safety indicators that can proactively detect system performance degradation.
1.3 RESEARCH GOAL AND HYPOTHESIS: WHAT SHOULD BE DONE DIFFERENTLY?
The primary aim of this research thesis is to answer the following question: “How can a
hydrocarbon/chemical processing organization develop system-based process safety leading
indicators for the purpose of systematically and proactively managing risk?”
The objective of this research is to develop a method that can assist managers and decision-
makers in proactively managing risk in their organizations by identifying better means for
developing leading indicators that can monitor systemic factors and, thus, prevent incidents
before they occur. A more systematic review that would enable a better understanding of the
system, as well as the complex interactions within its subsystems, and external factors is needed
to provide better risk management. The hypothesis used in this research is that STAMP-based
modeling concepts can be used to achieve this objective. This provides for a better
understanding of the system, helps in identifying better means for developing leading indicators,
assists in monitoring a system‟s status, and, thus, helps in making timely informed decisions to
prevent accidents from occurring or to identify needs for safety improvements.
1.4 RESEARCH APPROACH
In order to answer the research question, this research involves reviewing the literature and
current practices, defining gaps particularly in the use of a systems approach for developing
leading indicators in the process industry, exploring means for building on safety control
structures, and developing a system-based method that can be used to develop leading indicators
to proactively manage risk.

16
2.0 BACKGROUND AND LITERATURE REVIEW
This Chapter provides background information on some of the essential concepts that are related
to systems theory, systems safety, and leading indicators. The latter part of the Chapter
summarizes the findings from a literature review, which include descriptions of the current state
of the techniques used, their new contributions, and their shortcomings particularly as they relate
to the systems approach.
2.1 SYSTEMS THEORY
Systems theory is the “interdisciplinary study of systems in general, with the goal of elucidating
principles that can be applied to all types of systems at all nesting levels in all fields of research
[1].” Booton and Ramo defined systems engineering as the design of the whole rather than the
individual parts. They state that the “systems engineer harmonizes optimally an ensemble of
subsystems and components [2].”
Systems theory is based on non-linear events and dynamics as well as feedback or feed-forward
control. It also includes cognitive, psychological, organizational, and social aspects. The
systems approach involves defining goals, formulating the problem, developing objectives,
developing alternatives, and selecting the best alternatives [3]. The concepts of systems theory
and the implementation of systems engineering date back to the mid-1900s, with major
applications of the associated concepts during the development of railroad systems and telephone
systems, as well as applications in World War II [2].
2.1.1 Chemical Processes as Complex Engineering and Socio-Technical Systems
Leveson states that, “while abstractions and simplifications are useful in dealing with complex
systems and problems, those that are counter to reality can hinder us from making forward
progress [4].” Complex systems are different from traditional systems in that they involve a high
level of automation, social aspects, and complex internal and external interactions. System
engineering concepts based on reductionism, like those developed in earlier times, may not be
appropriate for complex systems. This is due to the intersection of natural science and human

17
social systems, as was recognized by Bertalanffy in the General Systems Theory [5]. C. Perrow
has described some attributes of socio-technical complex systems [6]:
Large problem space Dynamic properties
Social interaction Hazards in operations
Heterogeneous perspectives Automation
Distributed nature Uncertainty in the data
These attributes apply equally well to processing facilities in the chemical processing industry.
2.1.2 Systems Safety and Safety as a Control Problem
Checkland suggested that “systems thinking is founded upon two pairs of ideas, those of
emergence and hierarchy, and communication and control [7].” Leveson also suggested that
safety is an emergent system property and that safety should be treated as a control problem for
complex systems [8]. Systems safety concepts extends to addressing complex interactions, and
in complex systems, according to Leveson, analyzing the system can not only prevent similar
accidents, but also other types of future accidents by evaluating dysfunctional interactions
between system components [4]. Investigations of catastrophic incidents such as Longford,
Piper Alpha, and BP Texas City have identified multiple systemic flaws and common safety
culture weaknesses. “Process safety1 incidents are rarely caused by a single catastrophic failure,
but rather by multiple events or failures that coincide and collectively result in an incident [9].”
Risk management efforts should not only focus on addressing previous accidents, because
different interactions of the system and the social aspects may result in unforeseen inadequate
control.
1 The term “process safety” is used more widely than “system safety” in the chemical process industry. The process
safety concept probably began in the early 19th century in a du Pont black powder plant [10]. However, this was a
self-regulated effort on the part of du Pont, and regulations of the chemical process industry most likely began to be
formalized following the 1974 Flixborough disaster. Since then, process safety technology has advanced and loss
prevention principles have been formulated in an effort to prevent loss of containment of hazardous material. In the
1980s, the industry recognized that technology alone would not result in process safety improvements and that there
is a need for process safety management. “The evolution of process safety from a purely technical issue to one that
demanded management approaches was essential to continued process safety improvement [11].” Process safety has
been addressed through prescriptive and performance based regulations. Regulations in the chemical processing
industry vary from country to country and they are often a combination of prescriptive and performance-based
regulations. In the U.S., regulations are largely prescriptive and partly performance-based with the introduction of
OSHA‟s Process Safety Management (PSM) requirements in 1991 [12].
18
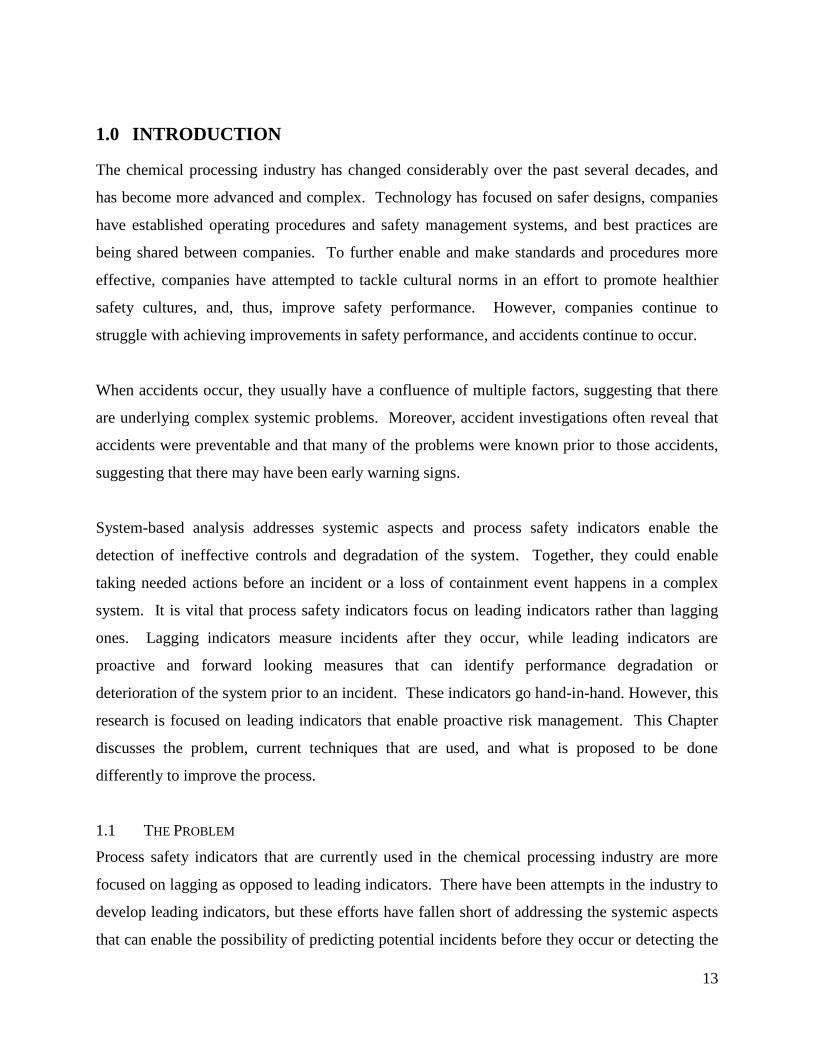
2.1.3 Control and Plant States
The traditional view of risk control or risk reduction strategies are based on a linear view of the
barriers that are in place [13]. This begins with a certain risk level and layers of protection are
added to reduce the level of risk, as seen in Figure 2.1.
Figure 2.1: Traditional Risk Reduction Principle
(Adopted from IEC 61508 [14])
This traditional view relies heavily on the chain of events model. However, a systems view of
risk reduction requires treating safety as a control problem. Controls can be physical,
organizational, or social, as seen in Figure 2.2.

19
Figure 2.2: Systems View of Controls to Reduce Risk
Such controls can have varying degrees of impact on risk reduction. It can be argued that
addressing systemic aspects can have a greater effect on risk reduction, while addressing specific
physical or component failures may not be as effective. These effects on risk reduction are
demonstrated in Figure 2.3.
Figure 2.3: Risk Reduction Impact

20
Accidents occur due to ineffective controls, including those that gradually develop over time and
involve the combinations of smaller failures caused by people and failures of the physical
equipment [15]. Processing plants gradually change their states from normal to emergency
modes of operations, as illustrated in Figure 2.4.
Figure 2.4: Plant States: Modes of Operation and Control
It can begin to drift from normal operations and, if no controls are in place, it will begin drifting
towards abnormal operations, subsequently followed by critical operations and, finally, an
emergency situation where loss of containment hazards can occur. Safety controls prevent a
system from moving towards an abnormal state. Moreover, controls can bring the system back
to normal operations, which can vary depending on the state of the plant, from mitigation,
prevention, control, or optimization.
Even for incidents that occur outside the chemical processing domain, socio-technical complex
systems involved in major accidents often have similar causes associated with inadequate
controls. At the different states from normal to abnormal, as well as from abnormal to
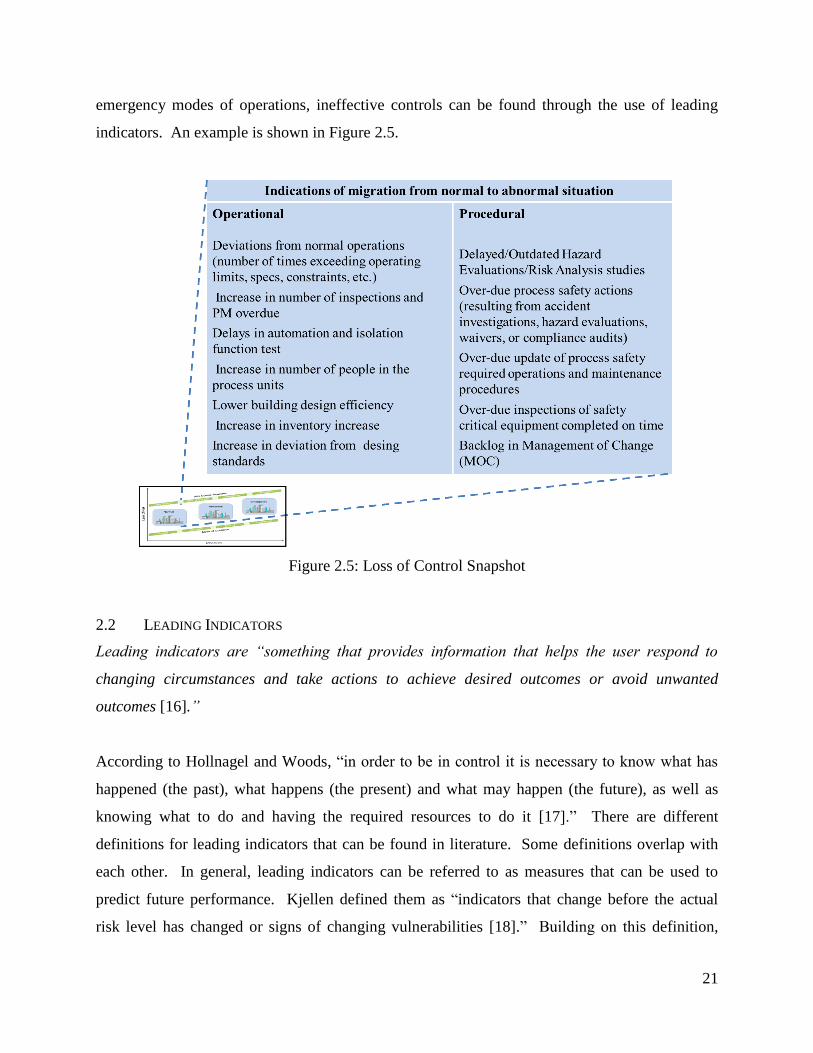
21
emergency modes of operations, ineffective controls can be found through the use of leading
indicators. An example is shown in Figure 2.5.
Figure 2.5: Loss of Control Snapshot
2.2 LEADING INDICATORS
Leading indicators are “something that provides information that helps the user respond to
changing circumstances and take actions to achieve desired outcomes or avoid unwanted
outcomes [16].”
According to Hollnagel and Woods, “in order to be in control it is necessary to know what has
happened (the past), what happens (the present) and what may happen (the future), as well as
knowing what to do and having the required resources to do it [17].” There are different
definitions for leading indicators that can be found in literature. Some definitions overlap with
each other. In general, leading indicators can be referred to as measures that can be used to
predict future performance. Kjellen defined them as “indicators that change before the actual
risk level has changed or signs of changing vulnerabilities [18].” Building on this definition,
22
leading indicators will be defined for the purposes of this research, as measures that detect
ineffective control well before the risk level increases. Moreover, the terms “metric” and
“indicator” have been used interchangeably in many cases. This research thesis will use the term
“metric” for the process of how an indicator is developed, and the term “indicator” for what
needs to be measured.
The objective of developing leading indicators is to enable detecting ineffective controls early
enough before an accident occurs. This requires implementing a set of performance goals, so
that safety performance can be measured, monitored, and analyzed and corrective actions can be
taken. This can be achieved by instituting a program for process safety indicators with its
associated processes, conducting reviews periodically, evaluating and applying the required
process adjustments and corrective actions. Leading indicators should be developed part of a
continuous improvement program that has a component relating to developing and monitoring
leading indicators.

23
2.3 TECHNIQUES CURRENTLY USED FOR DEVELOPING LEADING INDICATORS
Historically, there have been several attempts in the process industry to use process safety
indicators to monitor and improve safety performance. Early attempts to develop process safety
metrics guidance by the CCPS go back to the mid-1990‟s with the subsequent release of software
tools for performance measurements. In 2000, the BP Grangemouth Major Incident Investigation
report recommended that “companies should develop key performance indicators for major
hazards and ensure that process safety performance is monitored [19].” That report highlighted
key questions regarding the need for performance indicators for safety culture, leadership,
employee participation, as well as more specific processes such as management of change. It
also suggested that industries may have a false sense of safety performance due to their focus on
managing personal safety rates rather than process safety.
In 2003, the Working Group on Chemical Accidents (WGCA), chaired by the U.S. EPA, has
introduced “Guidance on Developing Safety Performance Indicators [20].” This was developed
by using the best practices implemented by different organizations. This document was
classified as an interim guidance report so that it could be tested in pilot programs. However,
industry implementation of these recommendations and the associated guidelines was limited to
some extent.
Only after the BP Texas City incident in 2005 did the process industry for the first time
collectively begin to place a significant focus on process safety indicators and subsequently
redefine how indicators should be developed. The Baker Panel Report recommended that “BP
should develop, implement, maintain, and periodically update an integrated set of leading and
lagging performance indicators for more effectively monitoring the process safety performance
[21].” The U.S. Chemical Safety and Hazard Investigation Board (CSB) issued a
recommendation to develop “performance indicators for process safety in the refinery and
petrochemical industries to ensure that the standard identifies leading and lagging indicators for
nationwide public reporting as well as indicators for use at individual facilities, which should
include methods for the development and use of the performance indicators [22].”

24
A series of documents and guidelines have been issued since then. The following timeline (in
Figure 2.6) shows the release of key guidance documents that should pave the way forward for
the implementation of process safety indicators and should influence their application in the
process industry.
Figure 2.6: Timeline for Developed Process Safety Performance Indicators Guidance used in the
Process Industry
To develop leading process safety indicators, the process industry currently uses guidelines
primarily provided by UK HSE, OECD, API and CCPS. The following sections discuss some of
the key documents used by the process industry, and provide some background information on
the basis of these documents, their new contributions to the process industry, as well as the areas
that they did not address.
2.3.1 UK HSE Guidance for Developing Process Safety Indicators; HSG254 (2006)
These guidelines were developed by the UK HSE and the Chemical Industries Association (CIA)
in collaboration with the process industry [23]. It outlines a six-stage process: establish a team;
develop the scope; identify risk controls; identify controls critical elements; collect data; and
review the results.
2005 2006 2007 2008 2009 2010
UK HSE Guide
HSG254
API754 “Process Safety
Performance Indicators”
OECD “Guidance on Safety
Performance Indicators”
CCPS “Guidelines for Process
Safety Metrics”
BP Baker Panel
Report
CCPS “Process Safety Leading
and Lagging Metrics”
BP Texas
City Incident

25
The guidelines recommend starting by identifying “what can go wrong?” using traditional hazard
identification techniques, followed by defining each Risk Control System (RCS) that control
each of these hazards. In this document, each RCS represents a barrier based on the “Swiss-
Cheese” model, which, if it fails, can give rise to an accident. Leading indicators are developed
based on the barriers‟ failures, i.e., “holes” that are discovered during reviews, while lagging
indicators are developed based on “holes” that are discovered after an incident or near-miss
occurring.
The main new contribution of this document was its focus on leading indicators. Although
limited to some extent, it suggests using these indicators to provide early warnings against
deterioration or degradation. Another key addition was introducing the “dual assurance” concept
of leading and lagging indicators to ensure that safety controls were functioning as expected. It
also introduced the concept of using a hierarchical approach, where lower level indicators would
feed into higher level indicators in an organization with an emphasis on senior management
involvement. The suggested hierarchal approach is limited to communicating information from
an individual site level to higher levels in the organization using more generic indicators. They
suggest that this can be achieved through indexing and weighting low level indicators into higher
level indicators based on the importance of an individual site in the overall organization.
2.3.2 OECD Guidance on Developing Safety Performance Indicators (2008)
These guidelines were developed by the Environment, Health and Safety (EHS) Division of the
OECD in collaboration with the process industry [24]. It outlines a seven-stage process:
establish a team; identify key issues of concern; define lagging indicators; define leading
indicators; identify risk controls; identify controls critical elements; collect data and report
results; act on findings; and review performance and indicators. Unlike the UK HSE‟s document,
it provided more guidance on developing leading and lagging indicators. It also distinguishes
„act on recommendations‟ as a separate step.
The guidelines recommend starting by identifying critical potential hazards using, for example,
Process Hazard Analysis (PHA), which could include “What-If” Analysis, Layers of Protection
26
Analysis, Checklist Reviews, Quantitative Risk Analysis, etc. This is followed by defining areas
of concern, i.e. processes, procedures, etc. that are most critical to control risk. According to this
document, failure of such risk controls would result in an accident. Indicators are, then,
developed based on potential failures in the areas of concerns, or where there are ineffective
barriers. For each area of concern, the document provides a predetermined list or a “menu” for
potential lagging “outcome” or leading “activities” indicators. The lists are intended to support
organizations in identifying which ones are of particular interest to them.
The main new contributions of this document were differentiating outcome indicators (lagging)
from activities indicators (leading) along with additional details on their development. This
document provided guidance for setting priorities and ranking indicators as an aid to monitoring
and reducing the scope of indicators‟ development. It suggests that prioritization can be
achieved by assessing the potential consequences of failures of processes, procedures, etc. and
the likelihood of that happening. The document also provided guidance for setting targets,
monitoring policies‟ performance, and safety management. It highlighted the importance of
engaging the stakeholders and sharing knowledge within and outside a company as well as
monitoring performance early in a project lifecycle (i.e., in R&D, standards development, design
and inherent safety).
2.3.3 Center of Chemical Process Safety Guidance
The American Institute of Chemical Engineers (AIChE), Center of Chemical Process Safety
(CCPS), issued a series of guidelines:
Risk Based Process Safety (2007) [25]
Process Safety Leading and Lagging Metrics (2008) [26]
Guidelines for Process Safety Metrics (2010) [27]
The guidelines recommend categorization of indicators based on the “Accident Pyramid” and the
selection of indicators based on the “Swiss-Cheese” model. It refers to other guidelines, e.g.
HSG254, for identifying hazards and selecting indicators, and provides a list of suggested
leading indicators that can be used, which are based on process safety elements and based on
indicators‟ lists provided by other organizations. The main new contributions of these guidelines

27
were that they highlighted the importance of communication and provided more guidance for
developing metrics based on targeted audiences within and outside an organization, as well as
the type of indictors to be reported and the frequency of reporting. They promoted the
development of consensus metrics and knowledge sharing among companies, as well as
promoting social interests, such as sustainability (reporting performance progress towards
sustainability) and demands for public transparency. They also addressed the need for a
performance-based safety management system.
2.3.4 API 754 “Process Safety Performance Indicators” (2010)
The guidelines were developed by the American Petroleum Institute. The purpose of this API is
to identify process safety leading and lagging indicators in the refining and petrochemical
industries [28]. Other personal safety and health safety indicators are not part of this
recommended practice. This API provides a framework for measuring activity, status or
performance that can be used to classify process safety indicators into four tiers of leading and
lagging indicators.
The guidelines recommend identifying leading indicators based traditional Process Hazard
Analysis (PHA) and risk assessments to define what can go wrong?, what are the consequences?,
what is the likelihood?, what are the most critical barriers?, etc. Alternatively, it recommends
using incident investigation findings to identify barriers that contributed to the incident, or using
what other have successfully used to develop leading indicators. The guidelines are based on the
assumptions of the “Swiss-Cheese” model that incidents result from failures of the barriers, and
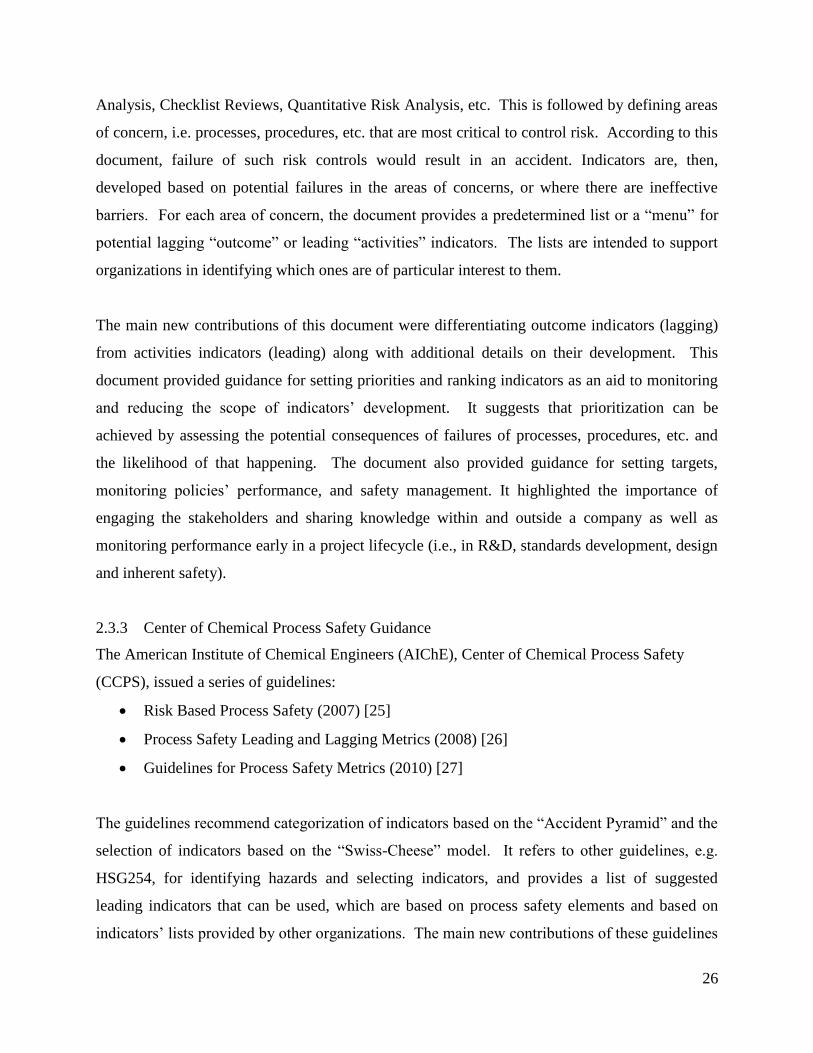
it recommends categorization of indicators into tiers based on the “Accident Pyramid”. The
document provides a set of leading indicators examples that can be used.
The main new contribution of this API is the tiering process for developing process safety
indicators. For example, it defines Tier 1 and 2 indicators which are somewhat lagging and
include, injury and/or fatality, fire or explosion, as well as flammable or toxic releases. On the
other hand, Tier 3 and 4 indicators are more leading indicators that can be indicative of process
safety system weaknesses that can lead to Tier 1 or Tier 2 incidents. Examples of Tier 3 and 4
are the number of training completed, inspections overdue, etc.

28
2.3.5 Shortcomings and Summary
The problems with these guidelines are that they are primarily based on the concepts of James T.
Reason‟s “Swiss Cheese Model” and Christopher A. Hart‟s “Spinning Disks Model (Figure 2.7)
[28]. These models assume linear chains of events in accidents and do not address the complex
systemic causes of incidents. According to Reason in Managing the Risks of Organizational
Accidents, “major accidents result when a series of failings within several critical risk control
systems materialize concurrently [15].”
Figure 2.7: James T. Reason‟s “Swiss Cheese Model” and Christopher A. Hart‟s “Spinning
Disks Model”
(From API 754 [28])
Also, most of these guidelines are based on the H. W. Heinrich accident pyramid. For example,
the latest API uses this pyramid and groups accidents depending on their impact, into four tiers,
representing a continuum of process safety indicators, varying from leading to lagging. It starts
with Tier 1 as the most lagging and ends with Tier 4 as the most leading (Figure 2.8). While this
provides a logical differentiation between leading and lagging indicators and while it suggests
that high impact incidents are associated with precursor low impact incidents, there is no proof
that this pyramid applies to process safety or to complex systems.
29
Figure 2.8: H.W. Heinrich‟s “Accident Pyramid”
(From API 754 [28])
While the concept that preventing a loss of containment is proactive, and mitigating the loss is
reactive, the concept still assumes linear chains of events. Because incidents occur when there
are complex interactions among events, there is a need for a more systematic view to account for
these nonlinear factors. In addition, these guidelines use risk and reliability as parts of their
recommendations. Most of them suggest using the likelihood of failures to reduce the scope of
development, which can be deceiving as this may result in overlooking low likelihood events.
The Heinrich proposal describes indicators as a continuum or time dependent, while the Swiss
Cheese model suggests that lagging indicators precede harm and focuses on the functionalities of
the safety barriers. Rather than discussing failures, near misses, incidents, or events, a complex
sociotechnical system must be reviewed to determine whether or not it is functioning safely.
Moreover, although some guidelines provide the means to address culture, policies, and
management system, integration and providing for feedback is lacking. Also, there is vague
guidance on how individual plants or different processing facilities in an organization should be
treated. For example, they do not cover transportation risks and do not fully address industrial
parks, as they suggest applying these concepts individually and not to a site as a whole.

30
To summarize, Table 2.1 lists the new contributions of the previously discussed guidelines that
were developed for process safety indicators development in the process industry, as well as
those areas that they did not fully address.
Table 2.1: Summary of the Guidelines for Developing Process Safety Indicators
Guidance Main Difference/ Addition/ Contribution Main Shortcomings
UK HSE “Step-by-Step
Guide to Developing
Process Safety Performance
Indicators, HSG254”
The focus on leading indicators
The introduction of the “dual assurance”
concept
The introduction of the concept of using a
hierarchical approach and emphasis on senior
management involvement
Mainly based on the
“Swiss Cheese Model”
Mainly based on the
concepts of the “Swiss
Cheese Model” and
the “Accident
Pyramid”
System-based methods
are not used
There is a lack of
integrating indicators
and providing
feedback to the
different lifecycle
phases
They suggest using
likelihood to reduce
the scope
They suggest using
risk and reliability as
part of their
recommendations
Vague definition of
the scope of
application
OECD, “Guidance on
Safety Performance
Indicators”
The differentiation between outcome indicators
(lagging) and activities indicators (leading)
It provides guidance in setting priorities,
ranking indicators, and for setting targets
It highlights the importance of engaging
stakeholders and sharing knowledge within and
outside a company as well as monitoring
performance early in a project lifecycle, i.e. in
R&D, Standards Development, Design and
Inherent safety
CCPS, “Guidelines for Risk
Based Process Safety,”
“Process Safety Leading
and Lagging Metric,” and
“Guidelines for Process
Safety Metrics”
It highlights the importance of communication,
developing consensus metrics, and social
aspects
It addressed the need for a performance based
safe management system
API 754, “Process Safety
Performance Indicators for
the Refining and
Petrochemical Industries”
The introduction of a tiering process of
developing process safety indicators

31
3.0 SYSTEMS MODELING AND LEADING INDICATORS
3.1 ACCIDENT MODELS AND LEADING INDICATORS
3.1.1 Approaches to Accident Models
Because the goal of developing early warnings is to prevent accidents from occurring, it is
important to understand how accidents develop. Leveson [8], [30], [31], Hollnagel [32], and
Qureshi [33] have discussed different accident models and approaches to accident management.
In general, accident causality models are grouped into two main categories: traditional and
modern. Traditional accident models involve sequential, chain of events models. In contrast,
modern models involve systematic analyses in which complex interactions and structural
hierarchies in complex socio-technical systems are addressed.
Traditional sequential models were developed in the early 1940s by Heinrich [34] and later by
Reason‟s proposed “Swiss Cheese” Model [15]. As discussed by Leveson, these models have
limitations with regard to analyzing and understanding complex socio-technical systems [8],
[30], [31]. Although they provide simple graphical representation for developing scenarios, they
oversimplify causality and do not address interactions and complexities. Without addressing
system complexity, leading indicators would not properly detect ineffective controls. By
comparison, systemic models are intended to address the system as whole, rather than specific
component failures or deviations. Therefore, system-based accident analyses are more
appropriate to address system risk; accordingly, these were used in this research.
It is important that system-based models are used (i.e. STAMP, as in this research) to develop
leading process safety indicators that are appropriate to address ineffective controls. This is
important because most installations in the chemical processing industry are considered to be
complex engineered systems involving internal and external interactions among physical
equipment, people, and social aspects (discussed in Section 2.1.1). Leveson suggested that
system-based models (i.e. STAMP) would address such complexities [8], [30], [31]. Also,
catastrophic incidents in the chemical industry involve complex, multiple factors; there are
frequently couplings between different systems components and decisions are made under
certain operational pressures. The Piper Alpha and the BP Texas City incidents are notable
32
examples of how accidents occur as a result of multiple independent events stemming from
system design flaws.
3.1.2 Introduction to STAMP
Safety is an emergent property of a system based on systems theory concepts and principles, as
discussed in Section 2.1.2. This emergent property results from the enforcement of safety-
related constraints on the behavior of the system components through design and operation [8].
Loss of containment in chemical processing complex socio-technical system results from
inadequate controls or lack of safety control enforcement. Systems Theoretic Accident Model
and Processes (STAMP) is a systemic accident model. It can be considered a comprehensive
model that addresses complex socio-technical systems, and with which proactive safety and risk
management strategies can be developed. Unlike traditional accident models that address
component failures and analyze accidents using the chain of events approach, STAMP treats
safety as a safety control problem in which enforcement of system safety constraints involve
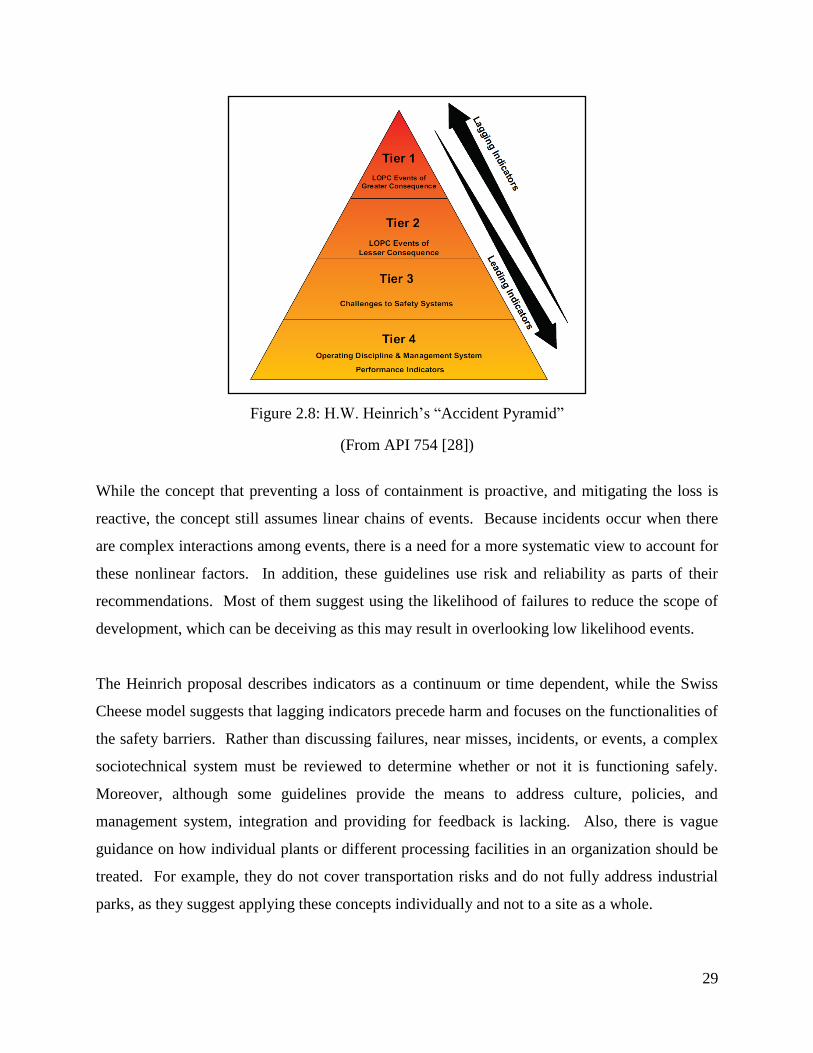
physical, organizational, and/or social elements, as illustrated in Figure 3.1 [8].
33
Figure 3.1: Generic STAMP Control Structure
(Developed by Leveson [8])
Control structures are based on controls and feedback. Using STAMP, the higher level control
components are analyzed to determine how the physical system controls might be violated.
Feedback comes in the form of communications with the higher levels of the hierarchy.
Feedback from physical systems derives from process parameter indicators, inspection test
results, preventive maintenance, and so on. Feedback from the staff to the line and higher
management levels, and to external bodies, drives from reports, data, etc.
3.1.3 Safety Control and Leading Indicators
To enable developing process safety leading indicators, safety needs to be addressed as a control
problem. Systems and their subsystems interact in unwanted ways, which result in conditions of
34
inadequate control. It is important to identify these interactions and controls as a means to
develop proactive process safety indicators. Charles Perrow illustrated how unplanned and
tightly-coupled nonlinear complex interactions are characteristics that could make a socio-
technical system susceptible to degradation, increased level of risk, and potential accidents [6].
He stressed the time-dependence of coupling (i.e. the criticality of how coupled non-linear events
vary with the time available or slack time). In addition, it is necessary to establish indicator
targets at the different levels of a hierarchy, operating windows or envelopes, where the system
can operate safely.
Leading indicators can be developed by analyzing the safety controls at the different levels of the
hierarchy. An approach that can be taken is that if system safety constraints are violated and
inadequate controls results, then this would be an indication of system degradation that could
lead to a loss. By using STAMP, the control theory concepts are addressed by defining the
objectives/constraints, structure, functions/process, as well as the context in a holistic approach.
3.2 ADDRESSING THE SYSTEM DYNAMICS
STAMP-based modeling addresses the static safety control of the system, and does not address
the dynamics involved. The dynamics of the system needs to be analyzed so that the different
reinforcing pressures, feedbacks, expectations, etc. are incorporated to get a better understanding
of the dynamics of ineffective control, and, thus, having better decision-making. This will help
in evaluating what needs to be done for more proactive risk management, i.e. enabling early
actions to take corrective actions. The objective is to determine possible decisions that could
have a positive impact on the safety state of the system over time and to assess whether or not
these decisions reinforce safety improvement efforts.
3.2.1 Introduction to System Dynamics
The system dynamics field was created by Jay Forrester, an MIT Professor, in the 1950s.
System dynamics modeling is a tool that can help with understanding and evaluating complex
systems, as it addresses the technical, organizational, and social aspects of systems. It also helps
by assisting managers and decision makers in evaluating policies and their impacts over time.
The model is based on the non-linear dynamics of systems, as well as on the feedback and
35
control concepts. Change, policy resistance, and response in a complex system can be analyzed
in a system dynamics modeling [35].
In system dynamics, a system is modeled using flows, stocks, and causal loops. The system
behavior and interactions (technical, organizational, and social), in addition to the associated
non-linearities are addressed by reinforcing (positive) feedback loops and balancing (negative)
feedback loops. The former results in positive reinforcing effects on the system‟s behavior,
while the latter results in negative, counter effects. The system can be analyzed, understood, and
explained by the behavior resulting from the interactions among these loops. “The most
complex behaviors usually arise from the interactions (feedbacks) among the components of the
system, not from the complexity of the components themselves [35].” Modeling can also
incorporate delays, which can introduce instability in the behavior of a system.
3.2.2 Incorporating the System Dynamics
The system dynamics model can be developed by tying, linking and mapping its components to
the developed STAMP control structure [36]. This can be achieved by navigating through the
different levels of the control structure to develop input information, internal variables, and
output information for each level, as well as interactions, information, feedback, and control
across the defined boundaries.
The model can be developed further by building on earlier developed archetypes or models.
There were a number of system dynamics modeling efforts, where reference modes, causal loop
diagrams, etc. were developed for either analyzing actual accidents or for developing safety
archetypes. They are based on conceptual understanding or theoretical foundations supported
with findings from actual loss incidents, which is referred to by Goh et al. as “theorizing-to-
practice” models [37]. Marais et al. provided a set of six system safety archetypes that could be
used for modeling common system dynamics behaviors that could lead to accidents [38]. The
archetypes developed by Marais et al. can be used to describe the qualitative nature of the
complexity of interactions and feedback, and to get insight on the underlying structure and
behavior of the system under study. Moreover, Rudolph and Repenning have studied
organizational collapses by discussing and simulating how systems under control respond to

36
disturbances [39] through the use of system dynamics models. System dynamic modeling of
actual accidents or archetype models of accidents also offer a great learning opportunity for
modeling.
3.2.3 Feedback Loops
Feedback loops will influence whether or not system degradations would result in an increased
level of facility risk. Using safety monitoring in addition to reporting proves that, given the same
time allocation, hazards can be effectively controlled both in the long- and short-terms [40].
Based on this concept, two of the most important feedback loops that must be considered are:
Proactive Risk Reduction: This loop addresses taking corrective actions when there is an
increase in the leading indicators. The ability to detect degradation can be accomplished by
proactively detecting possible degradation of the system before an incident occurs. Therefore,
this loop captures system degradation through the proactive risk reduction loop, which has the
leading indicators feeding into it to detect degradation of the system or to detect an increased
level of risk.
Incident Learning: This loop addresses taking corrective actions based on lessons learned from
other incidents. Kletz highlighted that, for accidents in the chemical industry, there would be
similar incidents that have occurred a number of times in an organization prior to that accident‟s
occurrence [41]. The same conclusion was drawn by independent investigation reports of major
accidents. The investigation report of the Piper Alpha disaster [42] and those for the BP Texas
City Refinery accident in 2005 [21], [22] indicated that similar incidents had occurred, or that
problems were known prior to the occurrence of those accidents. “BP Texas City lacked a
reporting and learning culture. Reporting bad news was not encouraged and often Texas City
managers did not effectively investigate incidents or take appropriate corrective action [21].”
This suggests that incident learning could have been limited in those organizations. Cooke and
Rohleder suggested that, in order to reduce accidents, an organization incident learning system is
needed [43]. Therefore, using incident learning to prevent accidents could be used as a loop in
the model.

37
Learning may not prevent all potential accidents, but it will uncover many of them and could
provide more insights into the chemical process or system that is being managed. This loop
complements the proactive risk reduction loop, as safety performance improvement could have
some limitations as the system becomes more complex. Amalberti indicated that reporting could
become less relevant for predicting major disasters in complex systems [44]. The two feedback
loops can be demonstrated in the following graph (Figure 3.2).
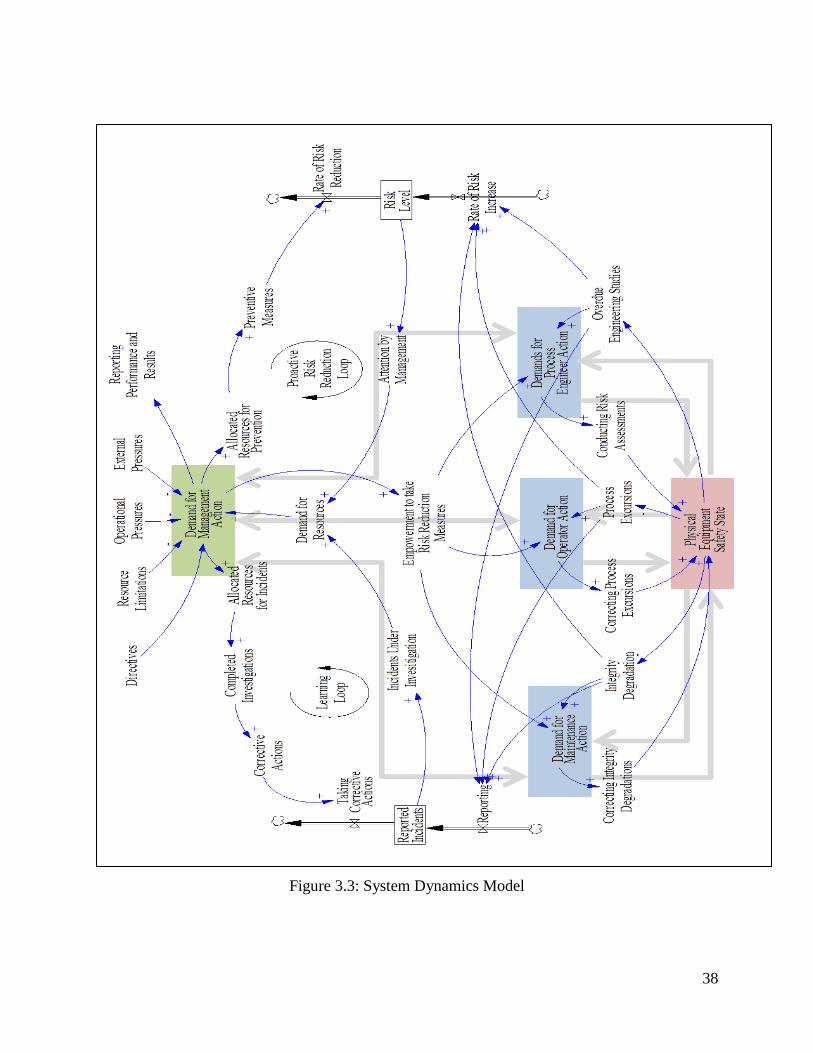
Figure 3.2: System Dynamics Loops
These feedback loops can be integrated into a system dynamics model if developed based on the
STAMP control structure. Figure 3.3 demonstrates incorporating these loops in the control of
process excursions, integrity degradation, and overdue risk assessment.
SystemDegradation
PreventiveMeasures
Attention byManagement
Risk DuringAbnormalOperations
+
- Demand forResources
AllocatedResources
+
++
+
Rate of Risk Increasefor Operations
+
<Commitment toSafety>
+
<ResourceAllocation>
<CompetentResources>
<Quality Reviews andProcedures> +
+-
B
Proactive RiskReduction Loop
<Proactive RiskManagement>
+
Duration
ReportedIncidents
Incidents UnderInvestigation
InvestigationLearnings
+
CompletedInvestigations
+
+
<ReportingCulture>
+
B
LearningsLoop
B
38
Figure 3.3: System Dynamics Model

39
System degradations part of the structure of the model were broken down and grouped into
process-related excursions, integrity-related degradation, and overdue risk assessments.
Process excursions: corresponds to an increased level of risk due to demands and
activations of alarms, safety instrumented systems, relief valves, etc.
Integrity degradation: corresponds to an increased level of risk due to inspections found
to be outside the limits, defective safety critical equipment, etc.
Risk assessments: covers delays in engineering studies and reviews
These groups can, thus, be linked to the level of risk of the facility. They impact the system
degradation and level of risk, which can be improved if actions are taken to address any
deviations. Taking the necessary corrective actions, however, depends on the ability of the
organization to detect and acknowledge the information provided by leading indicators to
prevent degradations. This requires management commitment, and the organizational safety
culture, which can be addressed by other loops.
40
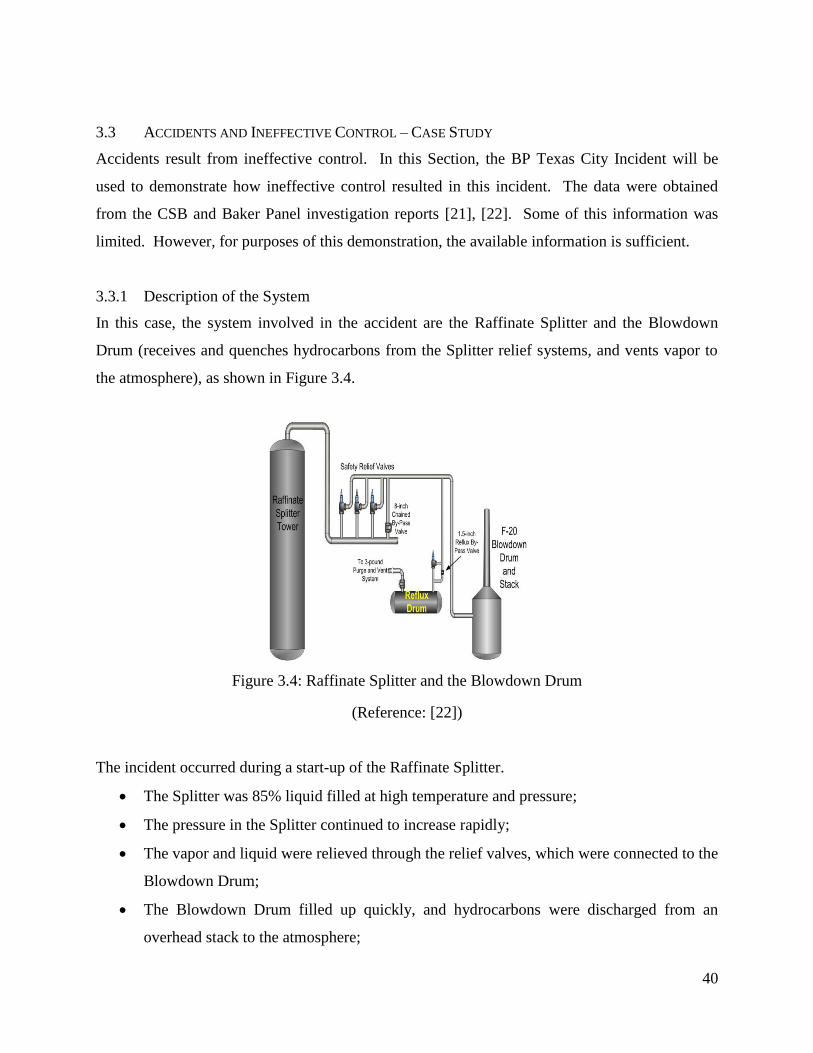
3.3 ACCIDENTS AND INEFFECTIVE CONTROL – CASE STUDY
Accidents result from ineffective control. In this Section, the BP Texas City Incident will be
used to demonstrate how ineffective control resulted in this incident. The data were obtained
from the CSB and Baker Panel investigation reports [21], [22]. Some of this information was
limited. However, for purposes of this demonstration, the available information is sufficient.
3.3.1 Description of the System
In this case, the system involved in the accident are the Raffinate Splitter and the Blowdown
Drum (receives and quenches hydrocarbons from the Splitter relief systems, and vents vapor to
the atmosphere), as shown in Figure 3.4.
Figure 3.4: Raffinate Splitter and the Blowdown Drum
(Reference: [22])
The incident occurred during a start-up of the Raffinate Splitter.
The Splitter was 85% liquid filled at high temperature and pressure;
The pressure in the Splitter continued to increase rapidly;
The vapor and liquid were relieved through the relief valves, which were connected to the
Blowdown Drum;
The Blowdown Drum filled up quickly, and hydrocarbons were discharged from an
overhead stack to the atmosphere;

41
Liquids formed a pool on the ground;
Vapors and aerosols/mist created a Vapor Cloud;
The Vapor Cloud was ignited in a nearby congested area and was ignited, resulting in a
Vapor Cloud Explosion (VCE);
Temporary trailers nearby were destroyed;
People in or near the temporary trailers were injured or killed.
This processing unit was equipped with level and pressure controls, a shutdown system, and
overpressure protection. Overfills or overpressures would result in relieving hydrocarbons
through the relief valves, which are sent to the atmosphere in this case.
3.3.2 System Hazards, Safety Constraints, and Risk Control
In this case, the hazard can be defined as an uncontrolled release of hydrocarbons from the
Blowdown Drum. Considering the following safety constraints:
SC. 1: Control the process within its design pressure,
SC. 2: Control the flow, accumulation, and level within the design limits, and
SC. 3: Maintain the integrity of the vessel and its associated accessories within the targets,
Responsibilities can be mapped to system components, as shown in Table 3.1:
Table 3.1: Mapping Safety Constraints to System Components
Responsibility System Component
SC1. Control the process within its
design pressure
SC2. Control the flow, accumulation,
and level within the design limits
Physical System:
Vessel: Vessel Mechanical Design
Instrumentation: Level and pressure sensors, alarms, control
system, shutdown system, and the relief valves
Operator and Engineers
SC.3 Maintain the integrity of the
vessel and its associated accessories
within the targets
Maintenance Staff: Instrumentation technicians, electrical
technicians, and mechanics
Inspection Staff: Mechanical inspectors and instrumentation
inspectors
Engineers and Line Managers

42
The primary physical controls to prevent hazards from occurring are the level and pressure
controls, alarms, shutdown system(s), and the relief valves. Loss could occur if these physical
controls fail to function as expected. Some of the physical controls are listed in Table 3.2.
Table 3.2: Physical Controls for the Blowdown Drum
Detection Mean Cause
Level and Pressure
Indication
Level indicators both local and at the control room
High Level/Pressure
Alarms
Requires action by the operator to reduce or shutdown inflow
Level/Pressure Control
Reducing or stopping inflow by means of automatic control
Emergency Shutdown
System
An instrumented system (with final shutdown devices) that shutdown
automatically and diverts excess flow to the relief/flare system
Overpressure Protection Relief valves that opens when pressure/level increases sending
hydrocarbons to the relief/flare system or the atmosphere if safe
Passive Systems In case of overflow, dikes and containment shall be used to prevent
liquids from traveling to other areas
Active Systems Detection of gas will activate alarms, and fire detection will activate fire
protection systems
3.3.3 Control Structure
The control structure consists of the controls that are intended to prevent hazards from occurring.
By the dissection of BP‟s accident reports and from general knowledge of BP and the refining
industry in general, specific STPA-based control loops and the associated inadequate controls
can be developed for the following system components (controllers): operator, maintenance and
inspection staff, engineering staff, and line manager.
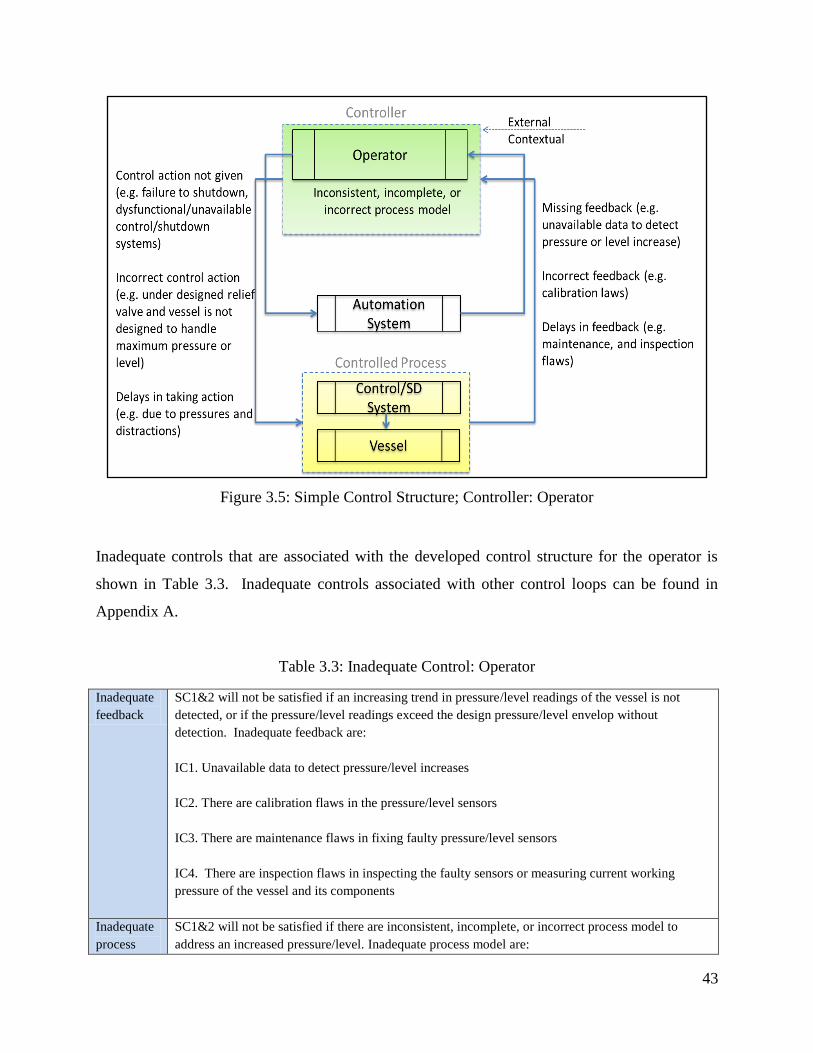
A simplified specific STPA-based control loop for the operator is shown in Figure 3.5. Other
control loops can be found in Appendix A.
43
Figure 3.5: Simple Control Structure; Controller: Operator
Inadequate controls that are associated with the developed control structure for the operator is
shown in Table 3.3. Inadequate controls associated with other control loops can be found in
Appendix A.
Table 3.3: Inadequate Control: Operator
Inadequate
feedback
SC1&2 will not be satisfied if an increasing trend in pressure/level readings of the vessel is not
detected, or if the pressure/level readings exceed the design pressure/level envelop without
detection. Inadequate feedback are:
IC1. Unavailable data to detect pressure/level increases
IC2. There are calibration flaws in the pressure/level sensors
IC3. There are maintenance flaws in fixing faulty pressure/level sensors
IC4. There are inspection flaws in inspecting the faulty sensors or measuring current working
pressure of the vessel and its components
Inadequate
process
SC1&2 will not be satisfied if there are inconsistent, incomplete, or incorrect process model to
address an increased pressure/level. Inadequate process model are:

44
model
IC5. Operational procedures have incorrect or missing pressure/level set points, particularly high
and critical pressures/levels
IC6. Previous increases of pressure/level that did not require taking actions, and did not result in any
consequences
IC7. Periodic reviews and updates of operational procedures are not conducted and the procedures
do not address updated operational pressure/level envelopes
IC8. Flaws in the automation system logic
Inadequate
control
actions
SC1&2 will not be satisfied if inadequate actions are taken when there is a pressure/level increase.
Inadequate control actions are:
IC9. The controller fails to timely shutdown on high pressure/level
IC10. The shutdown systems is dysfunctional
IC11. The relief valves are under-designed, and/or the vessel is not designed to handle the increased
pressure/level
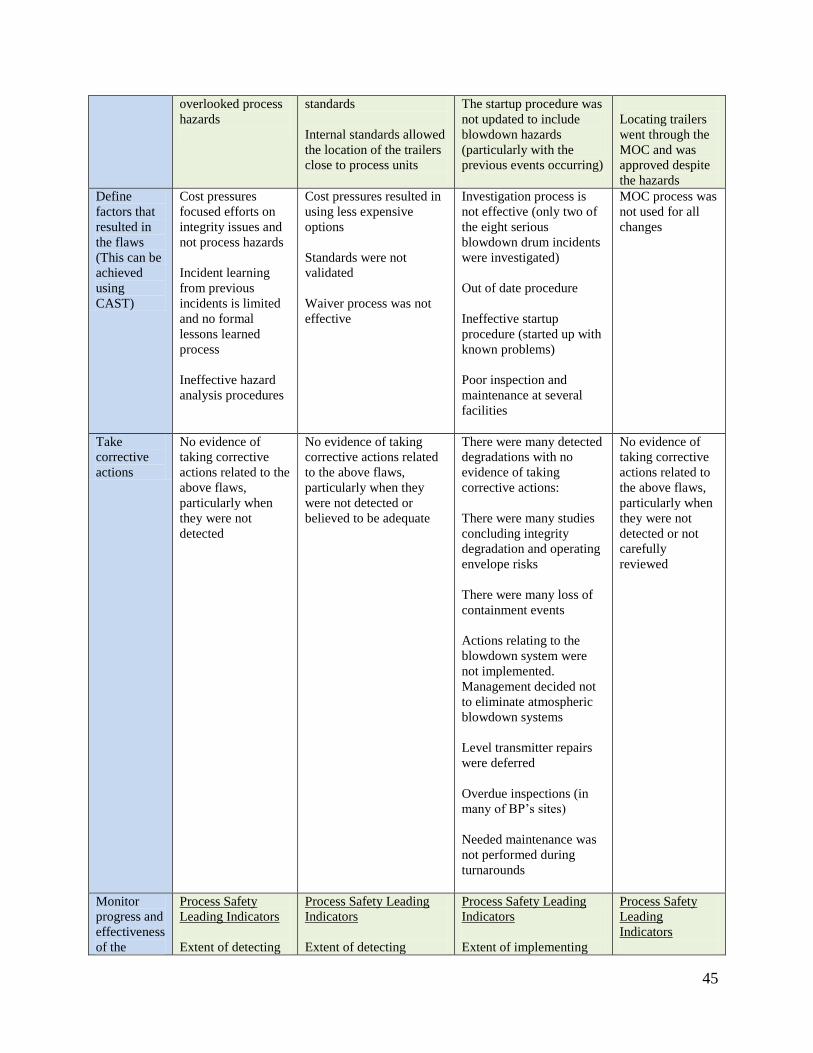
There are many indications that the above inadequate controls and those listed in Appendix A
existed at BP Texas City Refinery prior the accident as summarized in Table 3.4.
Table 3.4: BP Texas City case study- Examples of ineffective controls that existed prior to the
incident
Comprehensiveness
of controls (i.e.
covering all
hazards)
Adequacy of controls (i.e.
using the appropriate
controls)
Functionality of controls
(i.e. ensuring they are
implemented and not
degraded)
Adaptability of
controls (i.e.
controls address
changes in the
system)
Detect flaws
(Feedback)
Not detecting
missing constraints:
Hazards analysis
overlooked some
hazards (e.g. H2S
hazards)
Hazards analysis
overlooked previous
blowdown drum
overfill incidents
Decisions
Not detecting
inadequate constraints:
Used atmospheric venting
instead of a closed system
for the blowdown drum
Used inadequate
redundancy for level
indication
No waivers were used for
the blowdown drum and
stack as they did not meet
Not detecting degraded
safety constraints:
No data available for the
operators to know about
overfills
The set-points were not
known to operations. The
optional procedures or
training materials did not
have these data
Not detecting
changes
impacting safety
constraints:
Introducing more
people during
startup was not
evaluated
Pressure Control
Valve was
chained with no
MOC
45
overlooked process
hazards
standards
Internal standards allowed
the location of the trailers
close to process units
The startup procedure was
not updated to include
blowdown hazards
(particularly with the
previous events occurring)
Locating trailers
went through the
MOC and was
approved despite
the hazards
Define
factors that
resulted in
the flaws
(This can be
achieved
using
CAST)
Cost pressures
focused efforts on
integrity issues and
not process hazards
Incident learning
from previous
incidents is limited
and no formal
lessons learned
process
Ineffective hazard
analysis procedures
Cost pressures resulted in
using less expensive
options
Standards were not
validated
Waiver process was not
effective
Investigation process is
not effective (only two of
the eight serious
blowdown drum incidents
were investigated)
Out of date procedure
Ineffective startup
procedure (started up with
known problems)
Poor inspection and
maintenance at several
facilities
MOC process was
not used for all
changes
Take
corrective
actions
No evidence of
taking corrective
actions related to the
above flaws,
particularly when
they were not
detected
No evidence of taking
corrective actions related
to the above flaws,
particularly when they
were not detected or
believed to be adequate
There were many detected
degradations with no
evidence of taking
corrective actions:
There were many studies
concluding integrity
degradation and operating
envelope risks
There were many loss of
containment events
Actions relating to the
blowdown system were
not implemented.
Management decided not
to eliminate atmospheric
blowdown systems
Level transmitter repairs
were deferred
Overdue inspections (in
many of BP‟s sites)
Needed maintenance was
not performed during
turnarounds
No evidence of
taking corrective
actions related to
the above flaws,
particularly when
they were not
detected or not
carefully
reviewed
Monitor
progress and
effectiveness
of the
Process Safety
Leading Indicators
Extent of detecting
Process Safety Leading
Indicators
Extent of detecting
Process Safety Leading
Indicators
Extent of implementing
Process Safety
Leading
Indicators

46
process
(Feedback)
unidentified
hazards, and
reviews of the risk
assessment process
Extent of
investigating factors
leading to this
inadequate controls, and
reviews of design
standards process
Extent of investigating
factors leading to this
controls
Extent of controls
degradations
Extent of reviews and
updates of operating
procedures
Extent of investigating
factors leading to this
Extent of changes
in controls based
on system
changes
Extent of reviews,
implementation of
the MOC process
Extent of
investigating
factors leading to
this
In summary, for the BP Texas City Incident, ineffective control resulted from the following.
Detection was not effective. There was ineffective detection of missing hazards, and
repeated incidents were not considered when designing controls.
Analysis was not effective. There were ineffective analyses of the flaws; some of the
problems were known, but were not investigated or analyzed.
Correcting flaws was not effective. There were ineffective interventions; some of the
problems were known, but the company did not take the necessary actions to correct
them.
Monitoring was not effective. This was due to ineffective monitoring of the extent to
which safety constraints were implemented, flaws that were found, how they were
analyzed, and the extent to which corrective actions were taken. Having feedback
(leading indicators) could have prevented this. These indicators could have been
developed based on the above analysis for detecting flaws and monitoring progress.
Figure 3.6 demonstrates the ineffective controls at the BP Texas City Refinery Incident.
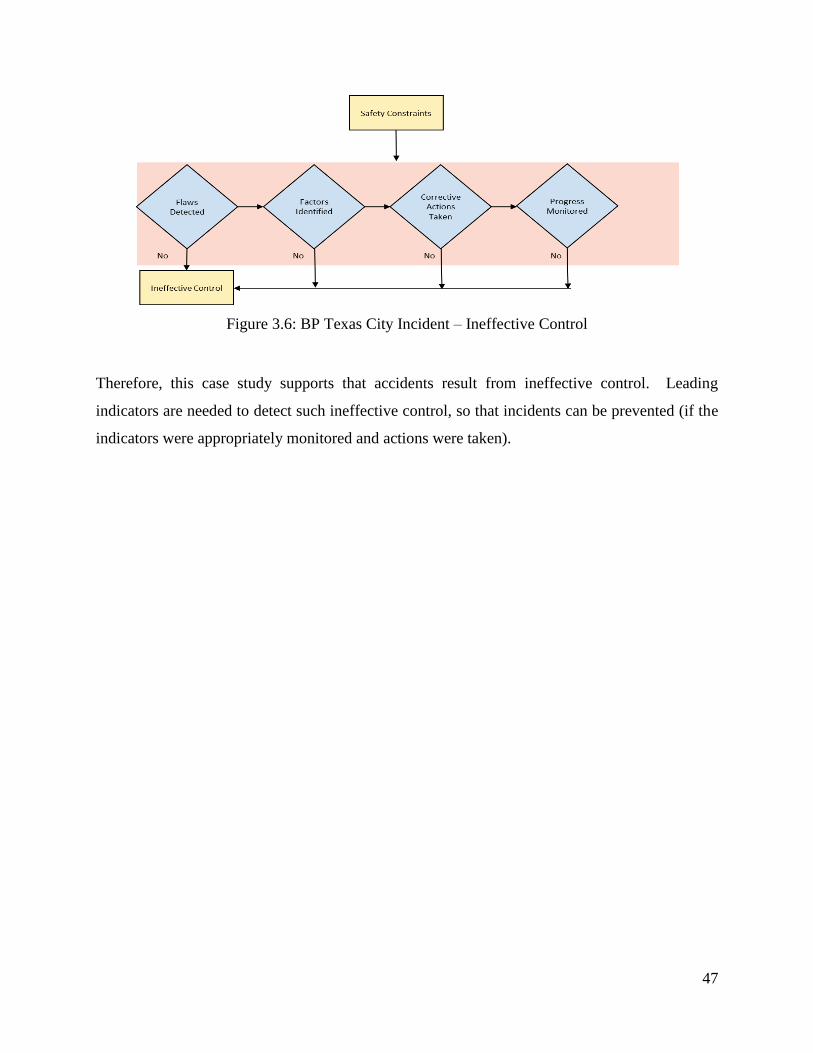
47
Figure 3.6: BP Texas City Incident – Ineffective Control
Therefore, this case study supports that accidents result from ineffective control. Leading
indicators are needed to detect such ineffective control, so that incidents can be prevented (if the
indicators were appropriately monitored and actions were taken).

48
4.0 SYSTEM-BASED METHOD
4.1 OBJECTIVES
The main objective of this Chapter is to develop a method that can assist a hydrocarbon/chemical
processing organization in developing system-based process safety leading indicators.
In this analysis it is assumed that organizations have already designed a good organizational
control structure, and that hazards have been identified, and associated controls are in place, and
that these organizations are continuing to look for ways to find weaknesses in their control
structure in order to improve it. Even with a presumably good control structure, accidents
continue to occur. This can be attributed to the following major reasons.
During the design and development phase of a facility, some hazards may not have been
identified and some risks may have been overlooked. There could also be design flaws
resulting from applying inadequate technologies to control the risks, or resulting from
using improper assumptions, such as assuming that certain scenarios are not likely to
occur and excluding them from design considerations. Additionally, system hazards
arising from complex system interactions may not have been fully understood or
anticipated at this phase.
During the construction and operational phases, hazard controls that have been designed
may not have been implemented or may not have been implemented as intended. Also,
implemented controls may become ineffective over time and safety constraints may be
violated2.
During the operational phase, new risks arise due to either (1) changes within the system
(physical or organizational), which could include complacency, personnel changes, etc.,
or (2) changes or influences from outside the system, which could include population
encroachment, pressures from government agencies, etc.
Therefore, to ensure that there is an effective control structure, it is important to have the means
to proactively correct flaws, uncover mistakes, and address changes in the control structure and
2 Leveson highlighted that “not only must the assumptions and design rationale be conveyed to those who will
operate the system, but there need to be safeguards against changes over time that violate those assumptions [31].”
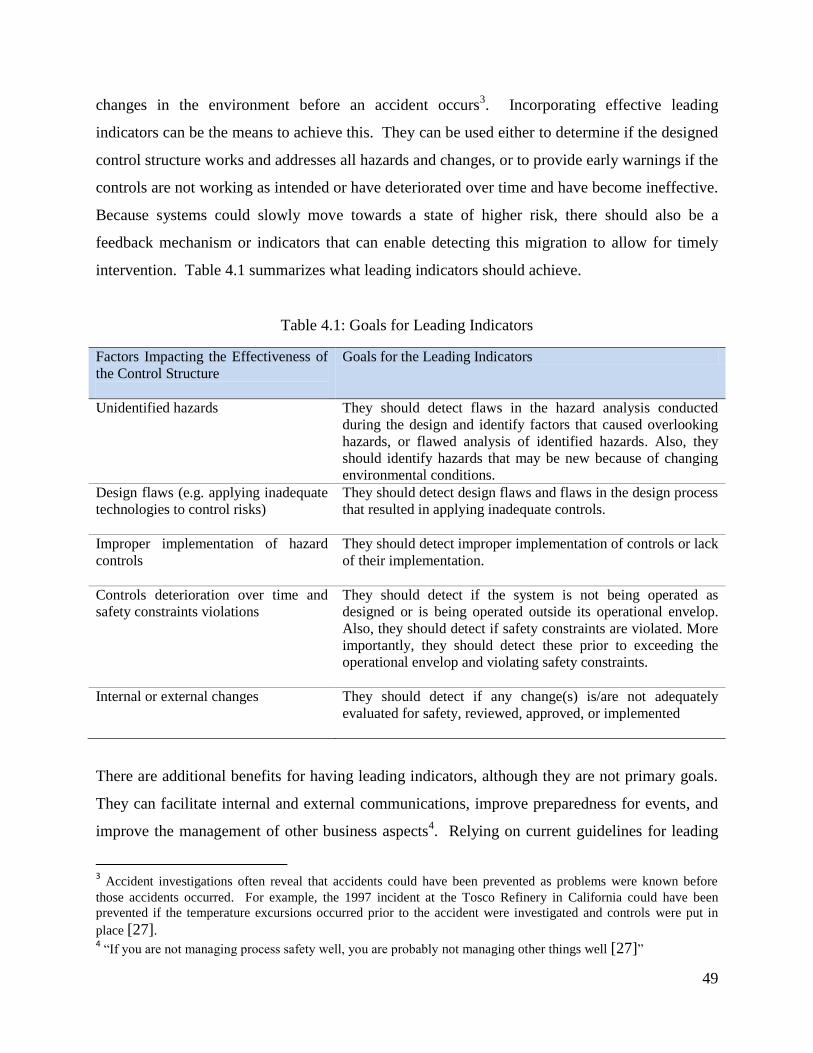
49
changes in the environment before an accident occurs3. Incorporating effective leading
indicators can be the means to achieve this. They can be used either to determine if the designed
control structure works and addresses all hazards and changes, or to provide early warnings if the
controls are not working as intended or have deteriorated over time and have become ineffective.
Because systems could slowly move towards a state of higher risk, there should also be a
feedback mechanism or indicators that can enable detecting this migration to allow for timely
intervention. Table 4.1 summarizes what leading indicators should achieve.
Table 4.1: Goals for Leading Indicators
Factors Impacting the Effectiveness of
the Control Structure
Goals for the Leading Indicators
Unidentified hazards
They should detect flaws in the hazard analysis conducted
during the design and identify factors that caused overlooking
hazards, or flawed analysis of identified hazards. Also, they
should identify hazards that may be new because of changing
environmental conditions.
Design flaws (e.g. applying inadequate
technologies to control risks)
They should detect design flaws and flaws in the design process
that resulted in applying inadequate controls.
Improper implementation of hazard
controls
They should detect improper implementation of controls or lack
of their implementation.
Controls deterioration over time and
safety constraints violations
They should detect if the system is not being operated as
designed or is being operated outside its operational envelop.
Also, they should detect if safety constraints are violated. More
importantly, they should detect these prior to exceeding the
operational envelop and violating safety constraints.
Internal or external changes
They should detect if any change(s) is/are not adequately
evaluated for safety, reviewed, approved, or implemented
There are additional benefits for having leading indicators, although they are not primary goals.
They can facilitate internal and external communications, improve preparedness for events, and
improve the management of other business aspects4. Relying on current guidelines for leading
3 Accident investigations often reveal that accidents could have been prevented as problems were known before
those accidents occurred. For example, the 1997 incident at the Tosco Refinery in California could have been
prevented if the temperature excursions occurred prior to the accident were investigated and controls were put in
place [27]. 4 “If you are not managing process safety well, you are probably not managing other things well [27]”
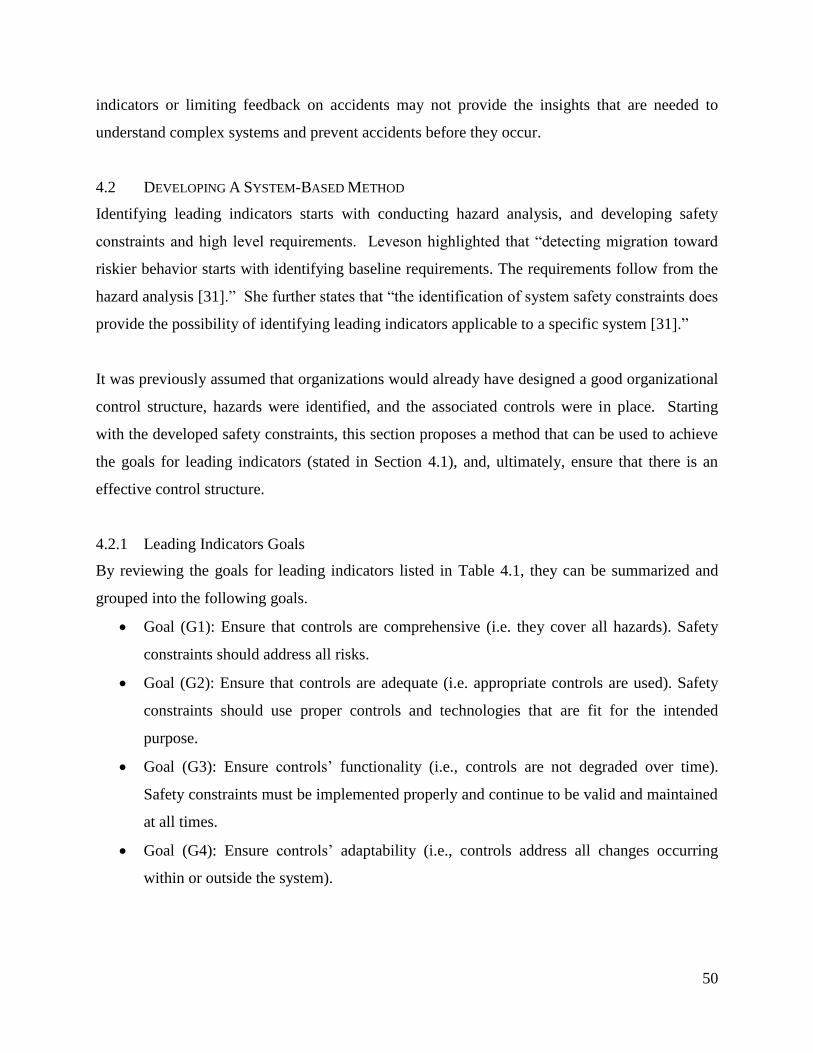
50
indicators or limiting feedback on accidents may not provide the insights that are needed to
understand complex systems and prevent accidents before they occur.
4.2 DEVELOPING A SYSTEM-BASED METHOD
Identifying leading indicators starts with conducting hazard analysis, and developing safety
constraints and high level requirements. Leveson highlighted that “detecting migration toward
riskier behavior starts with identifying baseline requirements. The requirements follow from the
hazard analysis [31].” She further states that “the identification of system safety constraints does
provide the possibility of identifying leading indicators applicable to a specific system [31].”
It was previously assumed that organizations would already have designed a good organizational
control structure, hazards were identified, and the associated controls were in place. Starting
with the developed safety constraints, this section proposes a method that can be used to achieve
the goals for leading indicators (stated in Section 4.1), and, ultimately, ensure that there is an
effective control structure.
4.2.1 Leading Indicators Goals
By reviewing the goals for leading indicators listed in Table 4.1, they can be summarized and
grouped into the following goals.
Goal (G1): Ensure that controls are comprehensive (i.e. they cover all hazards). Safety
constraints should address all risks.
Goal (G2): Ensure that controls are adequate (i.e. appropriate controls are used). Safety
constraints should use proper controls and technologies that are fit for the intended
purpose.
Goal (G3): Ensure controls‟ functionality (i.e., controls are not degraded over time).
Safety constraints must be implemented properly and continue to be valid and maintained
at all times.
Goal (G4): Ensure controls‟ adaptability (i.e., controls address all changes occurring
within or outside the system).
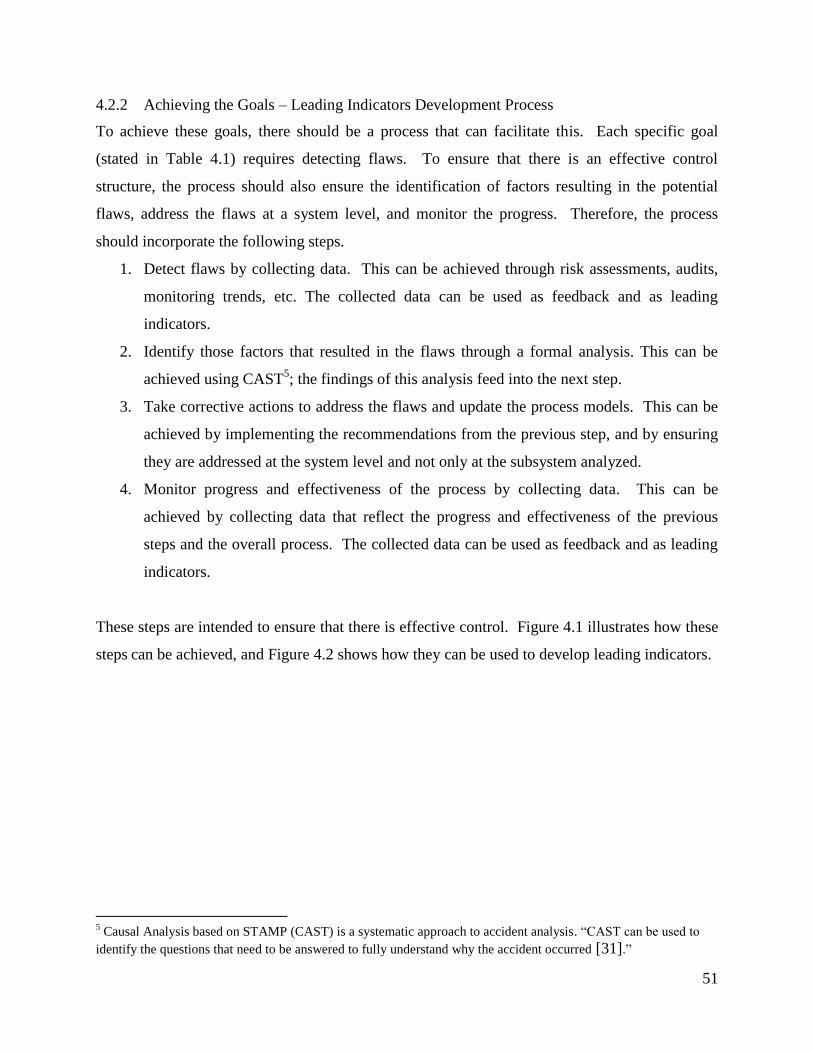
51
4.2.2 Achieving the Goals – Leading Indicators Development Process
To achieve these goals, there should be a process that can facilitate this. Each specific goal
(stated in Table 4.1) requires detecting flaws. To ensure that there is an effective control
structure, the process should also ensure the identification of factors resulting in the potential
flaws, address the flaws at a system level, and monitor the progress. Therefore, the process
should incorporate the following steps.
1. Detect flaws by collecting data. This can be achieved through risk assessments, audits,
monitoring trends, etc. The collected data can be used as feedback and as leading
indicators.
2. Identify those factors that resulted in the flaws through a formal analysis. This can be
achieved using CAST5; the findings of this analysis feed into the next step.
3. Take corrective actions to address the flaws and update the process models. This can be
achieved by implementing the recommendations from the previous step, and by ensuring
they are addressed at the system level and not only at the subsystem analyzed.
4. Monitor progress and effectiveness of the process by collecting data. This can be
achieved by collecting data that reflect the progress and effectiveness of the previous
steps and the overall process. The collected data can be used as feedback and as leading
indicators.
These steps are intended to ensure that there is effective control. Figure 4.1 illustrates how these
steps can be achieved, and Figure 4.2 shows how they can be used to develop leading indicators.
5 Causal Analysis based on STAMP (CAST) is a systematic approach to accident analysis. “CAST can be used to
identify the questions that need to be answered to fully understand why the accident occurred [31].”
52
Figure 4.1: Process for Ensuring Effective Control
Figure 4.2: Leading Indicators Development Process (Engine)
As a result of applying the above process to each of the goals, leading indicators can be
generated. Table 4.2 provides guidance and demonstrates how this can be achieved.
1. Detect Flaws 2. Define Factors Resulting in the
Flaws
3. Take Corrective Actions to
Address the Factors
4. Monitor Progress and
Effectiveness of the Process
Feedback (Leading Indicators)
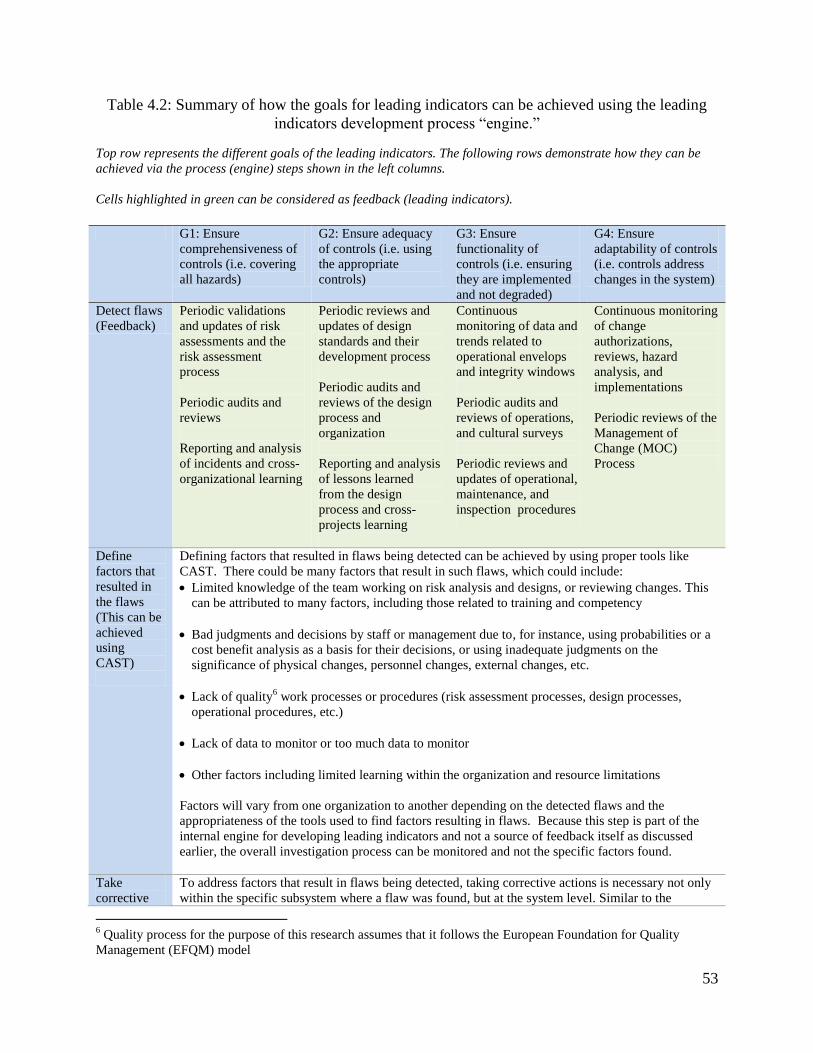
53
Table 4.2: Summary of how the goals for leading indicators can be achieved using the leading
indicators development process “engine.”
Top row represents the different goals of the leading indicators. The following rows demonstrate how they can be
achieved via the process (engine) steps shown in the left columns.
Cells highlighted in green can be considered as feedback (leading indicators).
G1: Ensure
comprehensiveness of
controls (i.e. covering
all hazards)
G2: Ensure adequacy
of controls (i.e. using
the appropriate
controls)
G3: Ensure
functionality of
controls (i.e. ensuring
they are implemented
and not degraded)
G4: Ensure
adaptability of controls
(i.e. controls address
changes in the system)
Detect flaws
(Feedback)
Periodic validations
and updates of risk
assessments and the
risk assessment
process
Periodic audits and
reviews
Reporting and analysis
of incidents and cross-
organizational learning
Periodic reviews and
updates of design
standards and their
development process
Periodic audits and
reviews of the design
process and
organization
Reporting and analysis
of lessons learned
from the design
process and cross-
projects learning
Continuous
monitoring of data and
trends related to
operational envelops
and integrity windows
Periodic audits and
reviews of operations,
and cultural surveys
Periodic reviews and
updates of operational,
maintenance, and
inspection procedures
Continuous monitoring
of change
authorizations,
reviews, hazard
analysis, and
implementations
Periodic reviews of the
Management of
Change (MOC)
Process
Define
factors that
resulted in
the flaws
(This can be
achieved
using
CAST)
Defining factors that resulted in flaws being detected can be achieved by using proper tools like
CAST. There could be many factors that result in such flaws, which could include:
Limited knowledge of the team working on risk analysis and designs, or reviewing changes. This
can be attributed to many factors, including those related to training and competency
Bad judgments and decisions by staff or management due to, for instance, using probabilities or a
cost benefit analysis as a basis for their decisions, or using inadequate judgments on the
significance of physical changes, personnel changes, external changes, etc.
Lack of quality6 work processes or procedures (risk assessment processes, design processes,
operational procedures, etc.)
Lack of data to monitor or too much data to monitor
Other factors including limited learning within the organization and resource limitations
Factors will vary from one organization to another depending on the detected flaws and the
appropriateness of the tools used to find factors resulting in flaws. Because this step is part of the
internal engine for developing leading indicators and not a source of feedback itself as discussed
earlier, the overall investigation process can be monitored and not the specific factors found.
Take
corrective
To address factors that result in flaws being detected, taking corrective actions is necessary not only
within the specific subsystem where a flaw was found, but at the system level. Similar to the
6 Quality process for the purpose of this research assumes that it follows the European Foundation for Quality
Management (EFQM) model

54
actions previous step, corrective actions will vary from one organization to another depending on the
detected flaws and the factors identified. Factors can include improving processes related to
training, incident reporting and investigation, resource allocation, decision making process, standard
developments and updates, risk assessment process, etc. Because this step is also part of the internal
engine for developing leading indicators and not a source of feedback itself as discussed earlier, the
overall implementation can be monitored and not the specific corrective actions needed.
Monitor
progress and
effectiveness
of the
process
(Feedback)
Extent of detecting
unidentified hazards,
and reviews of the risk
assessment process
Extent of investigating
factors leading to the
flaws
Progress of taking
relevant corrective
actions
Extent of detecting
inadequate controls,
and reviews of
standards and design
processes
Extent of investigating
factors leading to the
flaws
Progress of taking
relevant corrective
actions
Extent of
implementing controls
Extent of controls
degradations
Extent of inspection
and maintenance
backlog
Extent of reviews and
updates of operating
procedures
Extent of investigating
factors leading to the
flaws
Progress of taking
relevant corrective
actions
Extent of changes in
controls based on
system changes
Extent of reviews,
implementation of the
MOC process
Extent of investigating
factors leading to the
flaws
Progress of taking
relevant corrective
actions
4.2.3 Proposed Method
The leading indicators development process “engine” must be implemented within a structured
method to ensure its effectiveness. The following proposed method can be used to assist a
hydrocarbon/chemical processing organization in developing system-based process safety
leading indicators.
1. Establish a team, define the scope, and identify system boundaries.
2. Collect data for system hazards, requirements, safety constraints, and risk controls, as
well as for the developed control structure with responsibilities and feedback.
3. Use the leading indicators development process “engine” in conjunction with Table 4.2 to
develop leading indicators that are specific for the system under study to test if the
system-specific safety constraints are comprehensive, adequate, functional, and
adaptable. Particular focus should be given to the following areas.
a. Detecting flaws (feedback): The extent to which an organization detects missing,
inadequate, or degraded safety constraints.

55
b. Monitoring progress (feedback): The extent to which an organization detects,
addresses and corrects flaws, or (more specifically) the extent to which
component responsibilities within an organization are updated based on detected
flaws.
4. Screen the leading indicators to determine the most relevant and important indicators:
a. Based on the degree of impact they have on the system (e.g. low impact: only a
single component is impacted; high impact: multiple subsystems are impacted).
b. Based on short term, intermediate term, and long term impacts.
c. Based on the sensitivity of the leading indicator.
5. Use measurable metrics for the developed leading indicators, collect data, evaluate and
monitor performance, and take corrective actions when necessary.
6. Repeat Steps 3-5 periodically, and whenever there are system changes.
This proposed method is demonstrated in Figure 4.3.
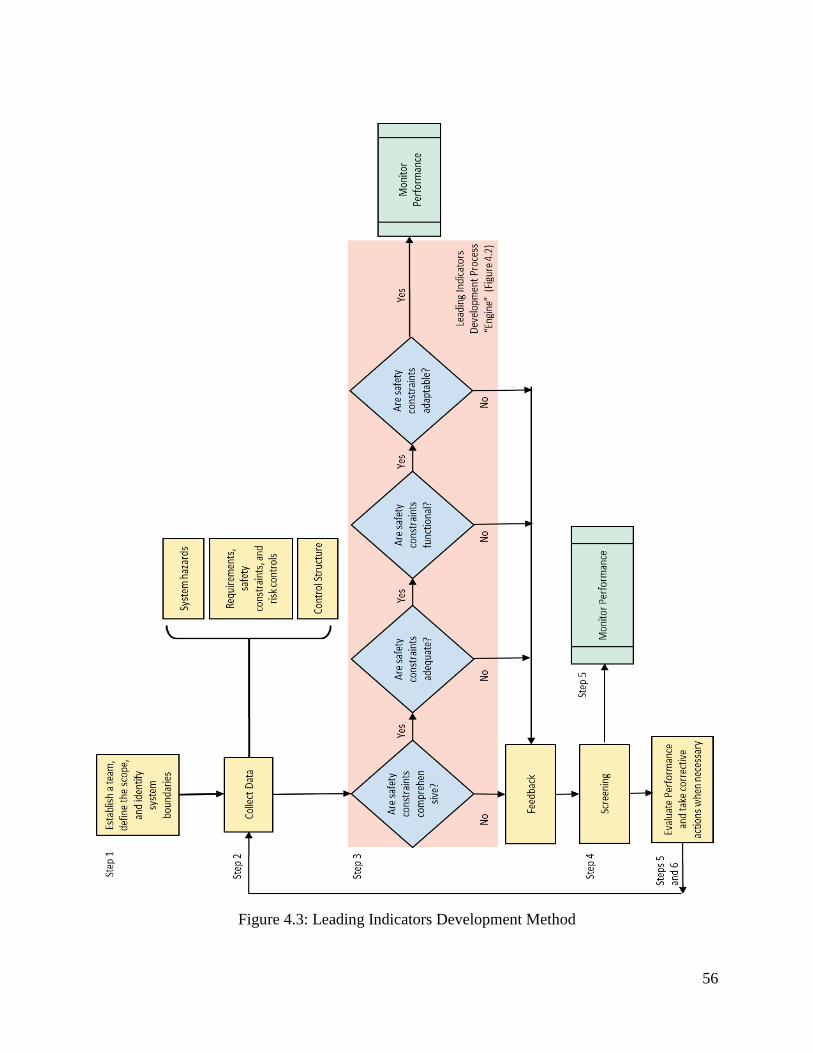
56
Figure 4.3: Leading Indicators Development Method
57
4.2.4 Description of the Method
Step 1: Establish a team, define the scope, and identify system boundaries.
In this step, a multi-disciplinary team needs to be established, the scope needs to be defined, and
system boundaries need to be defined. Input(s) and output(s) to and from the system need to be
defined as well to ensure that the interactions are captured.
Step 2: Collect data for system hazards, requirements, safety constraints, and risk controls, as
well as for the developed control structure with responsibilities and feedbacks.
This step can be achieved using STAMP based process hazard analysis (STPA). Refer to
Section 3.1.2 for an introduction to STAMP.
System Hazards: System hazards need to be identified, which are “system states or sets of
conditions that, together with a particular set of worst-case environment conditions, will lead to
an accident (loss) [30].” The general hazards in the process industry can be defined as loss of
containment events, which can lead to death or injury to people, harm to the environment, asset
damage, and/or an operational/business loss. These need to be systematically identified at the
different stages of the facility life cycle. More specific hazards can be developed depending on
the system under study.
Particular focus should be given to loss of containment of flammable, combustible, unstable,
corrosive, asphyxiating, reactive, toxic, and/or pyrophoric hydrocarbons that could result in any
type of adverse consequence. The specific system hazards can be defined depending on the
initial state of the hydrocarbon, ignition, wind, congestion etc. At an initial state, i.e. the source,
hydrocarbons can be in the form of liquids at atmospheric pressure, pressurized liquids, or
pressurized gas. Hydrocarbons can be flammable, toxic, or both. In general, consequences
could be fires, explosions or flammable/toxic clouds. Process hazards are the major hazards of
concern in a chemical plant, which could involve:
Gas releases, which could result in gas dispersion of flammable and toxic material, jet
fires if ignited immediately, flash fires if there is a delayed ignition, and/or vapor cloud
explosions if there is a delayed ignition and a congested area;
58
Liquid releases, which could result in flammable liquid pools, jet fires if aerosolized and
ignited immediately, and pool fires if there is a delayed ignition;
Two-phase releases, which can result in combinations of the scenarios described above;
Pressurized gas vessels, which could result in Boiling Liquid Expanding Vapor
Explosions (BLEVE) if exposed to external fires.
Safety Constraints: Risk controls need to be established, starting with the physical system and its
associated control(s), and moving up in the hierarchy to other organizational, management and
social aspects. Risk controls enforce safety constraints. In the process industry, the primary
safety constraints at the physical level are associated with establishing the operational window,
where safety constraints specify the boundaries within which the system and its subsystems must
operate. These boundaries are specified based on what the system or its subsystems can
withstand and on risk assessment findings. The operational window includes pressure,
temperature, flow, and level specifications in which the process must be controlled. Physical
controls to prevent hazards from occurring are the operational parameter controls, (pressure,
temperature, etc.), alarms, shutdown system(s), and relief valves. A loss could occur if these
physical controls fail to function as expected. The operational window and the associated
controls are subsequently governed through the management of change procedures and updates
of operational procedures.
The other main safety constraints are associated with establishing the integrity window, where
safety constraints specify the minimum level of integrity required for equipment (pumps,
compressors, valves, etc.), pipes, tanks, vessels, and so on. Minimum integrity levels are
specified based on the metallurgy used, service, and lifetime of the unit. Maintenance,
inspection, and testing procedures are used to manage integrity, and procedures are updated
through the management of change procedures when changes occur.
Operations staff monitors and control the process by observing deviations and taking the
necessary actions to prevent hazards from occurring. Mitigative controls such as firefighting and
emergency response, although important, are not part of this research as they are reactive in
nature, and the focus of this research is proactive risk management.

59
Control Structure: The control structure incorporates the controls and feedback needed to
prevent losses. These controls need to be translated into leading indicators so that they can be
monitored and corrective actions can be taken in those cases when these controls were not
successful in controlling hazards. Figure 3.1 demonstrates a generic STAMP safety control
structure and organizations need to have such control structure in place before developing
leading indicators; this also includes organizational aspects to be taken into consideration with
respect to the complexity and interactions of the system.
Step 3: Use the leading indicators development process “Engine” together with Table 4.2 to
develop leading indicators
The goal of this step is to test if the system specific safety constraints are comprehensive,
adequate, functional, and adaptable. Particular focus should be given to detecting flaws and
monitoring progress.
To this point, the STPA should have already defined hazardous states in the system that would
allow a hazard to occur (loss of containment), and the hazardous states would already have been
translated into safety constraints with the safety control structure (showing feedback and
controls). To detect violations of the safety constraints and hazardous states, leading indicators
can be developed to detect ineffective control(s) based on STPA-based control loops. Ineffective
control can result from inadequate or missing feedback, flaws in the process model, or
inadequate execution of the control actions. Leading indicators can be developed using the
leading indicators development process and associated supporting table, as demonstrated in the
example in Section 4.3.
Step 4: Screen the leading indicators for those that are relevant and important
It is likely that when the above steps are applied, a long list of leading indicators will be found.
Some of these indicators will be more important than others and monitoring them will be more
effective for proactively addressing risk.

60
4.3 APPLYING THE METHOD - EXAMPLE
Step 1: Establish a team, define the scope, and identify system boundaries.
Consider the following example for a typical separation unit used in many chemical processing
installations (Figure 4.4) to demonstrate how the safety constraints can be translated into leading
indicators.
Figure 4.4: Typical Separation Unit
Step 2: Collect data for system hazards, requirements, safety constraints, and risk controls, as
well as for the developed Control Structure with responsibilities and feedback.
System Hazards: In this example the hazard is defined as a loss of containment of hydrocarbons.
Safety Constraints: To prevent loss of containment, safety constraints (physical controls) for this
specific example are:
SC. 1: Control the process within its design pressure, both high and vacuum;
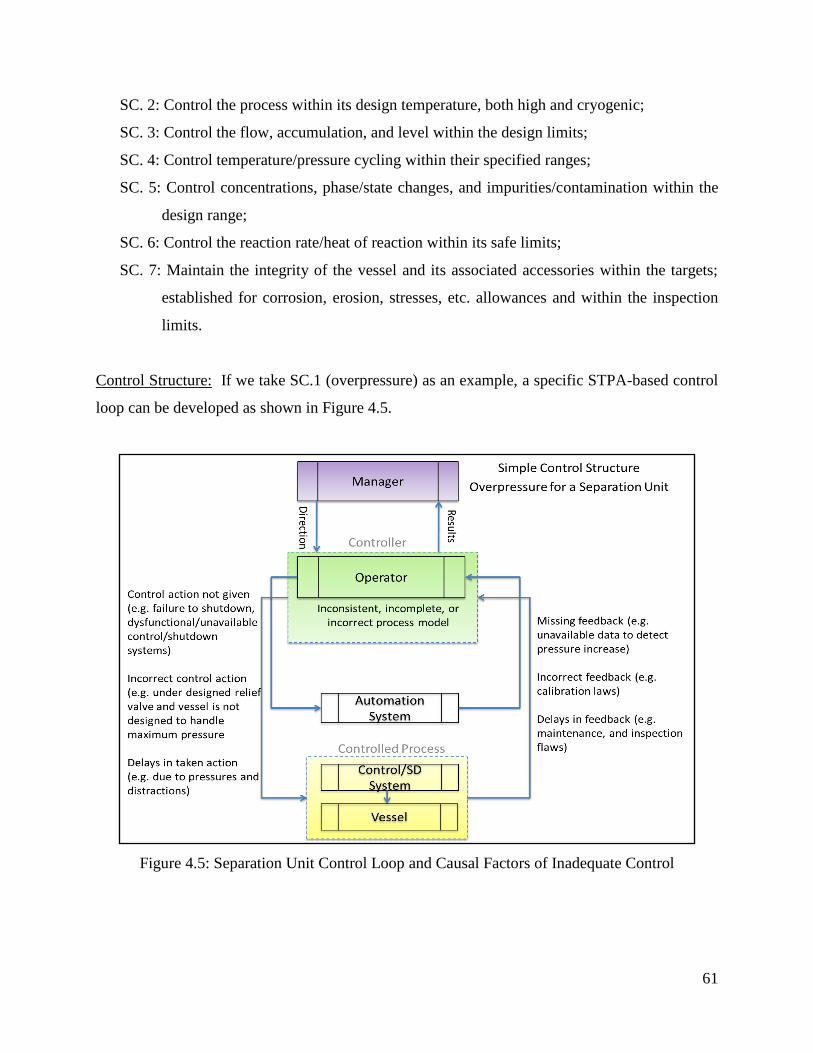
61
SC. 2: Control the process within its design temperature, both high and cryogenic;
SC. 3: Control the flow, accumulation, and level within the design limits;
SC. 4: Control temperature/pressure cycling within their specified ranges;
SC. 5: Control concentrations, phase/state changes, and impurities/contamination within the
design range;
SC. 6: Control the reaction rate/heat of reaction within its safe limits;
SC. 7: Maintain the integrity of the vessel and its associated accessories within the targets;
established for corrosion, erosion, stresses, etc. allowances and within the inspection
limits.
Control Structure: If we take SC.1 (overpressure) as an example, a specific STPA-based control
loop can be developed as shown in Figure 4.5.
Figure 4.5: Separation Unit Control Loop and Causal Factors of Inadequate Control
62
Assumptions:
It is assumed for this example and this particular overpressure hazard that the unit would have
pressure control, shutdown and relief systems, the technologies used are adequate, and that there
are no changes in the system. Loss could occur if these physical controls fail to function as
expected, and overpressure would result in a release of hydrocarbons. Leading indicators will be
needed to detect if the controls are functional or not.
Step 3: Use the leading indicators development process “Engine” together with Table 4.2 to
develop leading indicators
Ineffective control can result from inadequate or missing feedback, flaws in the process model,
or inadequate execution of the control actions. It is important to highlight that the controller
receives input from other internal or external components. In this example, only those coming
from components in the immediate higher hierarchy are shown for illustration purposes. For
each of the safety constraints and associated inadequate controls, leading indicators can be
developed using the leading indicators development process and associated supporting table, as
shown in Figure 4.6.

63
Figure 4.6: Developing Leading Indicators for the Separation Unit
The previous table summarized the safety constraints, high level requirements, and inadequate
controls associated with overpressure hazards. Leading indicators were developed based on the
leading indicators development process and the associated supporting table (the results are
shown in Table 4.3.)
Hazard: Loss of Containment
Causes: Process Excursions:
Overpressure
Safety Constraint: System should be
operated within the design allowable
pressure
High Level Requirements (Avoid
Overpressure)
Provide control system, detection
system, emergency shutdown and
isolation systems, depressurizing
system, relief valves, etc.
Active and passive protection
systems should be provided
Systems should be maintained
and inspected periodically
Risk analysis should evaluate
overpressure scenarios and
develop means to correct them
Inadequate Feedback
Missing feedback (e.g.
unavailable data to detect
pressure increase)
Incorrect feedback (e.g.
calibration flaws)
Delays in feedback (e.g.
maintenance, and inspection
flaws)
Inadequate Process Model
Inconsistent, incomplete, or
incorrect process model
Inadequate Control
Control action not given (e.g.
failure to shutdown,
dysfunctional/unavailable
control/shutdown systems)
Incorrect control action (e.g.
under designed relief valve and
vessel is not designed to handle
maximum pressure
Delays in taking action (e.g.
due to pressures and
distractions)
Leading Indicators
(Monitor Process
Excursions:
Overpressure)
Leading indicators are
developed based on the
leading indicators
development process and
associated supporting table.
The results are shown in
Table 4.3.

64
Table 4.3: Leading Indicators for the Separation Unit7
Safety
Constraint
SC1. System should be operated within the design allowable pressure
Controller Operator
Inadequate
Control
SC1 will not be satisfied if controls are not effective in enforcing it, which can occur if there are
inadequate feedback, inadequate process model, and/or inadequate control actions.
Leading Indicators of inadequate control: Indications that controls of overpressure are not functioning as they
should.
Inadequate
feedback
SC1 will not be satisfied if an increasing trend in
pressure readings of the vessel is not detected, or
if the pressure readings exceed the design
pressure envelop without detection.
Inadequate feedback (from the STPA-based
control loop)
1. Unavailable data to detect pressure increases
2. There are calibration flaws in the pressure
sensors
3. There are maintenance flaws in fixing faulty
pressure sensors
4. There are inspection flaws in inspecting or
measuring current working pressure of the
vessel and its components
Flaws Detection Leading Indicators; Controller:
Operator
LI1. Number of requests made by the operator
for providing pressure measurements
LI2. Frequency of verifications of pressure
sensors measurements against local actual
readings
LI3. Frequency of operations certifications of
completed maintenance work
LI4. Frequency of inspections of vessel and
associated pipe wall thickness, and frequency of
updates of required operating parameters
Inadequate
process
model
SC1 will not be satisfied if there are
inconsistent, incomplete, or incorrect process
model to address an increased pressure.
Inadequate process model (from the STPA-
based control loop)
5. Operational procedures have incorrect or
LI5. Number of reported incorrect or missing
7 No applicable leading indicators are identified here since it is assumed for this example and this particular
overpressure hazard that the unit would have pressure control, shutdown and relief systems, the technologies used
are adequate, and that there are no changes in the system. Note that if there are missing safety constraints or if
inadequate constraints are used (other than those relating to controlling pressure in this example), they will be
identified when a full analysis is conducted; this could highlight other problems in the overall control structure.

65
missing pressure set points, particularly high and
critical pressures
6. Previous increases of pressure that did not
require taking actions, and did not result in any
consequences
7. Periodic reviews and updates of operational
procedures are not conducted and the procedures
do not address updated operational pressure
envelopes
8. Flaws in the automation system logic
parameters by the operator
LI6. Number of pressure increases without the
operator‟s action
LI7. Frequency of updates of operational
procedures and operational window parameters
LI8. Number of reported flaws of the
automation system made by the operator
Inadequate
control
actions
SC1 will not be satisfied if inadequate actions
are taken when there is a pressure increase.
Inadequate control actions (from the STPA-
based control loop)
9. The controller fails to timely shutdown on
high pressure
10. The shutdown systems is dysfunctional
11. The relief valves are under-designed, and/or
the vessel is not designed to handle the increased
pressure
LI9. Number of historical delays in taken action
on high pressure by the operator
LI10. Frequency of preventive maintenance of
the shutdown systems
LI11. Frequency of design re-ratings and
verifications of existing protection systems

66
Table 4.4: Additional Leading Indicators for Monitoring Progress at the Facility Level
Leading indicators for detecting dysfunctional or degraded controls at the facility level
Rationale: Since it is important that leading indicators detect problems at the facility level, and not only on this
particular system, additional leading indicators are needed. For example, if there are maintenance and/or inspection
flaws at the facility level or at another unit, this is an indication that any system in the facility (including this
separation unit) could be subject to these flaws.
Inadequate feedback the facility level
12. SC1 may not be satisfied if there are overdue safety
critical inspections and maintenance work orders at the
facility level
Inadequate process models at the facility level
13. SC1 may not be satisfied if there are out of date
operating procedures, and backlog in their review at the
facility level
Inadequate control actions at the facility level
14. SC1 may not be satisfied if there are a high number
of process excursions at the facility level
LI12. Number of overdue safety critical inspections and
maintenance work orders
LI13. Percentage of updated operating procedures
LI14. Number of activations of alarms, shutdown
system, and relief valves
Leading indicators for identifying factors resulting in the flaws and correcting these flaws at the facility level
Rationale: If the flaws that resulted in inadequate control in the separation unit are not investigated and corrected at
the system level, this is an indication that this particular system as well as others in the facility could have other
incidents.
15. SC1 may not be satisfied if the factors causing
overpressure scenarios are not investigated, and/or there
are a number of investigations that were not completed
at the facility level
16. SC1 may not be satisfied if corrective actions to
address the factors that result in overpressure increases
are not taken, and/or there are a number of corrective
actions that are not taken
LI15. Percentage of completed investigations
LI16. Percentage of completed actions items (resulting
from investigations)
A similar analysis can be conducted for possible violations of other safety constraints associated
with process excursions (e.g. temperature, level, etc.) or violations of integrity degradation
constraints. These excursions can be monitored collectively rather than individually to
determine if problems exist. For example, if there is a defective temperature feedback, there
could also be defective pressure readings, or process monitoring in general that needs to be
added to the above analysis table. This analysis could also be applied to other organizational
safety constraints, depending on the specific system analyzed and the associated specific
constraints and control structure(s). These analyses will vary from one system to another; thus,
they will be the developed leading indicators.

67
5.0 SUMMARY, FUTURE RESEARCH, AND CONCLUSION
5.1 SUMMARY
In this research, a system-based method was developed to assist a hydrocarbon/chemical
processing organization in developing system-based process safety leading indicators. The
purpose of this method is to assist managers and decision-makers in proactively managing risk in
their organizations by identifying better means for developing leading indicators that can monitor
system flaws and, thus, prevent incidents before they occur.
This research involved reviewing the literature and current practices, and defining gaps
particularly in the use of a systems approach for developing leading indicators in the process
industry. It was found that current guidance fall short of addressing the systemic aspects that can
enable the possibility of predicting potential incidents before they occur or detecting the
migration of a system to an unsafe state. Current risk management programs are either reactive
(lack a forward-looking approach), or fragmented (system-based models are not used).
Since chemical processing facilities could gradually change their states from a normal state to an
unsafe state if no effective controls are in place and accidents could occur due to ineffective
controls, treating safety as control problem [8] is necessary. Starting with this concept, and
building on safety control structures and the associated safety constraints, the proposed leading
indicators development method was developed to enable detecting ineffective controls with the
objective of facilitating a more systematic review that would enable a better understanding of the
system, as well as the complex interactions within its subsystems, and external factors. It
suggests that leading indicators can be developed by analyzing the safety controls at the different
levels of the hierarchy, and the approach that can be taken is that if system safety constraints are
violated and inadequate control results, then this would be an indication of ineffective control or
system degradation that could lead to a loss.
To ensure that there is an effective control, it is important to have the means to proactively
correct flaws in the designed control structure, and address changes in the control structure and
changes in the external environment. The proposed method can be the means to achieve this. It
68
starts with conducting hazard analysis, and developing safety constraints, and systematically
ensures that the designed control structure works and addresses all hazards and changes, or
provides early warnings if the controls are not working as intended or have deteriorated over
time and have become ineffective. The method facilitates the systematic review of safety
constraints to ensure that controls are comprehensive, adequate, functional, and adaptable. To
ensure that there is an effective control structure, the method calls for detecting flaws, ensuring
the identification of factors resulting in the potential flaws, addressing the flaws at a system
level, and monitoring progress.
5.2 LIMITATIONS AND FUTURE RESEARCH
This method should be used as a tool to assist in developing leading indicators systematically,
and it assumes that organizations have a risk management program in place, have already
designed an organizational control structure, hazards have been identified, and associated
controls have been put in place. If organizations do not have a safety control structures, and
safety constraints are not developed, the method cannot be used.
Further validation, testing, and adjustment of the method can be an area of future research. The
current research focused testing on its applicability on a single unit during the operational phase,
and the examples were intended for demonstration purposes and are not considered
comprehensive. Further validation would be needed to test its applicability when it is applied at
a facility level, and when it is applied at the different phases of a facility‟s lifecycle. Particular
focus can be given to the systematic handling of additional ineffective control, or to grouping of
repeated similar leading indicators. Moreover, the method can be tested for its applicability in
other industries.
Another potential area of future research is data visualization and handling of developed leading
indicators. Different sets of leading indicators would be developed for each controller in the
control structure, and the mechanism of transmitting and displaying relevant and important
indicators to the appropriate level and relevant decision-makers based on their control
responsibilities can be researched further.
69
Time-sensitivity and lag time between having an indication of ineffective control and the time it
takes to see the impact of actions if taken to address the higher risk. Future research can address
the dynamics of the system. STAMP-based modeling in this research addressed the static safety
control of the system, and did not address the dynamics involved. The dynamics of the system
could be analyzed so that the different reinforcing pressures, feedbacks, expectations, etc. are
incorporated to get a better understanding of the dynamics of ineffective control, and, thus,
having better decision-making. This will help in determining possible decisions that could have
a positive impact on the safety state of the system over time and to assess whether or not these
decisions reinforce safety improvement efforts. Future work can include developing such
models and calibrating them based on plant-specific data.
5.3 CONCLUSION
Although current practices address process safety indicators, system-based leading indicators are
not fully addressed. A more systematic way using STAMP was applied to develop leading
indicators that can uncover system aspects. STAMP-based modeling can be used as a basis for
developing leading indicators as it treats safety as control problem, and it addresses the systemic
aspects rigorously. It helps in identifying ineffective controls, including those associated with
the migration of the system towards an unsafe state, or associated with interdependencies
between barriers. Using STAMP facilitated addressing leading indicators more systematically
and clarified the interactions among the subsystems. The proposed method provides for the
following:
More focus on the system rather than its components;
More careful reviews of the controls, integration, and interactions between the
subsystems;
Clearer definitions of safety-related constraints;
Better identification and understanding of the interactions between the physical system,
people, the organization, and social aspects;
Better understanding of how inadequate controls can occur;
Better reformulation of the problem using a system control structure;
Uncovering more important roles of the industry and external agencies.

70
Using current practices may result in improved safety performance. However, better safety
performance can be achieved by focusing on systems aspects. Safety indicators should garner
information regarding how well the organizational functions meet the desired outcomes.
Monitoring trends, taking actions, or investigating deviations should take place continuously.

71
6.0 DEFINITIONS
Accident: An undesired and unplanned (but not necessarily unexpected) event that results in an
(unacceptable) level of loss [30].
Consequence: The outcome arising from an event. There may be one or more consequences that
arise from an event. Consequences may be positive or negative. However, for the purposes of
this thesis, a consequence will mean a negative outcome of any event.
Event: The occurrence of a single or multiple set of circumstances.
Failure: The nonperformance or inability of the system or component to perform its intended
function for a specified time under specified environmental conditions [30].
Hazard: A state or set of conditions of a system (or an object) that, together with other conditions
in the environment of the system (or object), will lead inevitably to an accident (loss event) [30].
Hazard Analysis: The identification of hazards and the assessment of hazard levels [30].
Incident: A near miss or incident is an event that involves no loss (or only minor loss) but with
the potential for loss under different circumstances [30].
Process Safety: A disciplined framework for managing the integrity of hazardous operating
systems and processes by applying good design principles, engineering, and operating and
maintenance practices [28].
Process Safety Event: An unplanned or uncontrolled LOPC of any material including non-toxic
and non-flammable materials from a process, or an undesired event or condition that, under
slightly different circumstances, could have resulted in a LOPC of a material [28].
72
Process Safety Hazards: Hazards that can result in major accidents involving the release of
potentially dangerous materials [28].
Process Safety Incidents: Incidents that can have catastrophic effects such as multiple injuries
and fatalities, as well as substantial economic, property, and environmental damage; can also
affect workers inside the facility and members of the public who reside or work nearby [28].
Reliability: The probability that a piece of equipment or component will perform its intended
function satisfactorily for a prescribed time and under stipulated environmental conditions [30].
Risk Control: The process of decision-making for reducing risk through elimination, prevention,
mitigation, and treatment. It involves the implementation, enforcement and re-evaluation from
time to time of the controls [45].
Risk Management: The systematic application of management policies, procedures and practices
to the tasks of analyzing, evaluating, and controlling risk. Risk management is the coordinated
activities to direct and control an organization with regard to risk [45].
Safety: Freedom from accidents [30].
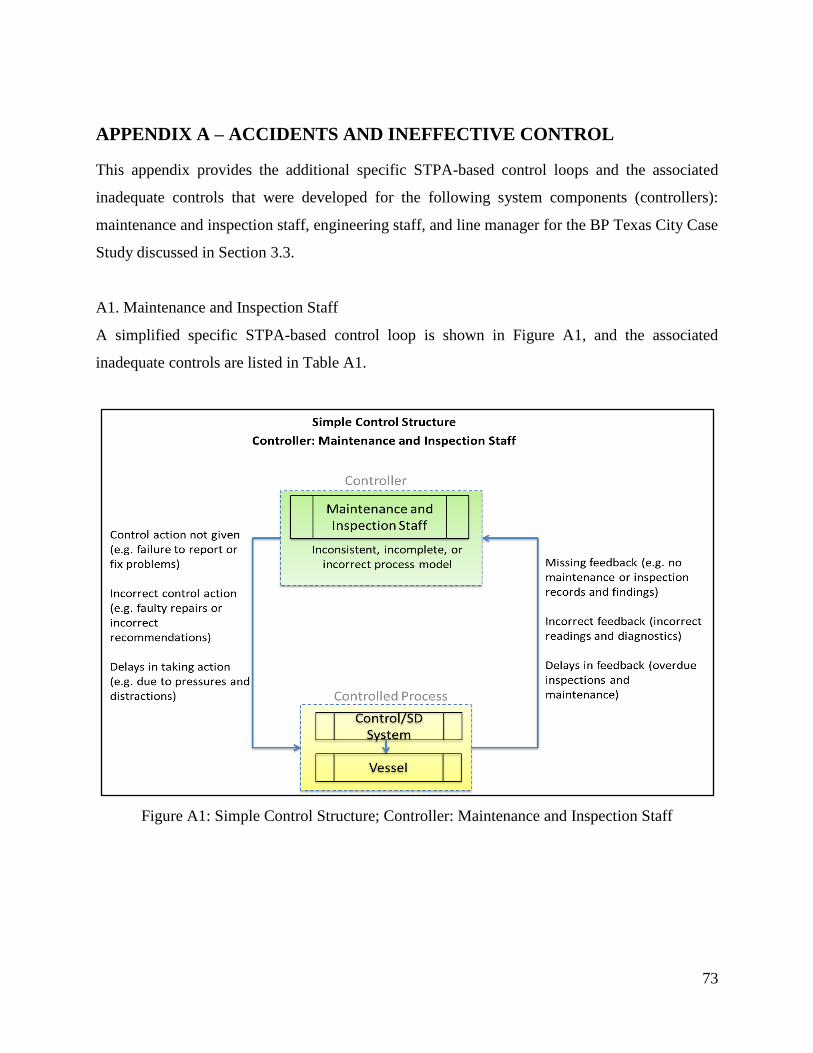
73
APPENDIX A – ACCIDENTS AND INEFFECTIVE CONTROL
This appendix provides the additional specific STPA-based control loops and the associated
inadequate controls that were developed for the following system components (controllers):
maintenance and inspection staff, engineering staff, and line manager for the BP Texas City Case
Study discussed in Section 3.3.
A1. Maintenance and Inspection Staff
A simplified specific STPA-based control loop is shown in Figure A1, and the associated
inadequate controls are listed in Table A1.
Figure A1: Simple Control Structure; Controller: Maintenance and Inspection Staff

74
Table A1: Inadequate Control: Maintenance and Inspection Staff
Inadequate
feedback
SC3 will not be satisfied if integrity degradation of the vessel is not detected. Inadequate feedback
are:
IC1. Overdue inspections and maintenance
IC2. Incorrect inspection readings or diagnostics
IC3. Lack of inspection and maintenance records and findings
Inadequate
process
model
SC3 will not be satisfied if there are inconsistent, incomplete, or incorrect process model to address
integrity degradation. Inadequate process model are:
IC4. Incorrect or missing maintenance and inspection procedures
IC5. Previous overdue inspections and maintenance did not result in any consequences
IC6. Periodic reviews and updates of inspection and maintenance procedures are not conducted
IC7. Flaws in the inspection or maintenance equipment
\
Inadequate
control
actions
SC3 will not be satisfied if inadequate actions are taken when there is integrity degradation.
Inadequate control actions are:
IC8. The controller fails to timely report or fix problems
IC9. Faulty repairs or incorrect recommendations
A2. Engineering Staff
A simplified specific STPA-based control loop is shown in Figure A2 and the associated
inadequate controls are listed in Table A2.
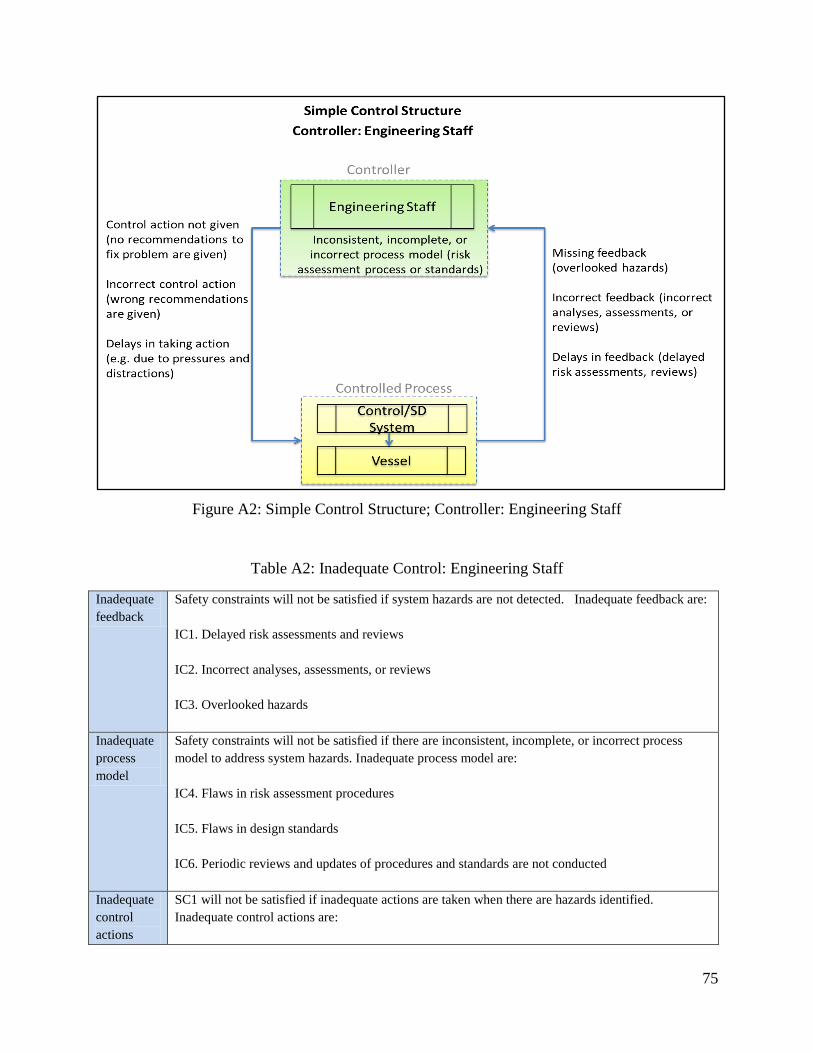
75
Figure A2: Simple Control Structure; Controller: Engineering Staff
Table A2: Inadequate Control: Engineering Staff
Inadequate
feedback
Safety constraints will not be satisfied if system hazards are not detected. Inadequate feedback are:
IC1. Delayed risk assessments and reviews
IC2. Incorrect analyses, assessments, or reviews
IC3. Overlooked hazards
Inadequate
process
model
Safety constraints will not be satisfied if there are inconsistent, incomplete, or incorrect process
model to address system hazards. Inadequate process model are:
IC4. Flaws in risk assessment procedures
IC5. Flaws in design standards
IC6. Periodic reviews and updates of procedures and standards are not conducted
Inadequate
control
actions
SC1 will not be satisfied if inadequate actions are taken when there are hazards identified.
Inadequate control actions are:

76
IC7. No recommendations to address hazards are given
IC8. Incorrect technologies are recommended to address hazards
A3. Line Managers
A simplified specific STPA-based control loop is shown in Figure A3, and the associated
inadequate controls are listed in Table A3.
Figure A3: Simple Control Structure; Controller: Line Managers
Table A3: Inadequate Control: Line Managers
Inadequate
feedback
Safety constraints will not be satisfied if hazards are not timely and correctly reported. Inadequate
feedback are:
IC1. Delayed reports
IC2. Incorrect reports

77
IC3. Missing Reports
Inadequate
process
model
Safety constraints will not be satisfied if there are inconsistent, incomplete, or incorrect process
model to address reported hazards. Inadequate process model are:
IC4. Inadequate reporting procedures
IC5. Inadequate prioritization
Inadequate
control
actions
Safety constraints will not be satisfied if inadequate actions are taken when there are reported
hazards. Inadequate control actions
IC6. No resources or authorization given
IC7. Incorrect decisions
78
REFERENCES
[1] Wikipedia. (Date last accessed 2012, March 20). Systems Theory [Online]. Available:
http://en.wikipedia.org/wiki/Systems_theory.
[2] R. C. Booton and S. Ramo, “The Development of Systems Engineering,” IEEE
Transactions on Aerospace and Electronic Systems, vol. AES-20, no. 4, Jul 1984.
[3] R. F. Miles, Systems Concepts: Lectures on Contemporary Approaches to Systems. New
York: John Wiley & Sons, 1972.
[4] N. G. Leveson, “Applying Systems Thinking to Analyze and Learn from Events,”
NeTWorK 2008: Event Analysis and Learning from Events, Berlin, Aug 2008.
[5] L. von Bertalanffy, General System Theory: Foundations, Development, Applications.
New York: George Braziller, 1969.
[6] C. Perrow, Normal Accidents: Living with High-Risk Technologies. New York: Basic
Books, 1984.
[7] P. Checkland, Systems Thinking, Systems Practice. New York: John Wiley, 1981.
[8] N. Leveson, “A New Accident Model for Engineering Safer Systems,” Safety Science,
vol. 42, no. 4, 2004.
[9] American Institute of Chemical Engineers, Center for Chemical Process Safety Center of
Chemical Process Safety, Guidelines for Process Safety Metrics. New Jersey: Wiley &
Sons, 2010.
[10] American Institute of Chemical Engineers, Center for Chemical Process Safety Center of
Chemical Process Safety. (Date last accessed 2012, March 20). What is the origin of
Process Safety? [Online]. Available: http://www.aiche.org/ccps/Students/GetSmart.aspx.
[11] American Institute of Chemical Engineers, Center for Chemical Process Safety Center of
Chemical Process Safety. (Date last accessed 2012, March 20). [Online]. Available:
www.aiche.org/ccps
[12] Process Safety Management of Highly Hazardous Chemicals Regulation, The U.S.
Occupational Safety and Health Administration (OSHA), Title 29 of CFR Section
1910.119, 1991.
[13] American Institute of Chemical Engineers, Center for Chemical Process Safety Center of
Chemical Process Safety, Layer of Protection Analysis. New York: Wiley & Sons, 2001.
[14] Functional Safety: Safety Related Systems, IEC 61511, 2008.
79
[15] J. T. Reason, Managing the Risks of Organizational Accidents. Aldershot, UK: Ashgate,
1997.
[16] Leading Performance Indicators: A Guide for Effective Use, Step-Change in Safety,
2001.
[17] D. D. Woods and E. Hollnagel, Epilogue – Resilience Engineering Precepts. Aldershot,
UK: Ashgate, 2006.
[18] U. Kjellen, “The Safety Measurement Problem Revisited,” Safety Science, vol. 47, pp.
486-489, 2009.
[19] The BP Grangemouth Major Incident Investigation Report, UK Health and Safety
Executive, August 2003.
[20] Guidance on Developing Safety Performance Indicators, OECD Working Group on
Chemical Accidents, 2003.
[21] The BP U.S. Refineries Independent Safety Review Panel, January 2007.
[22] U.S. Chemical Safety and Hazard Investigation Board, Investigation Report, “Refinery
Explosion and Fire,” Report No. 2005-04-I-TX, March 2007.
[23] Step-by-Step Guide to Developing Process Safety Performance Indicators, the UK Health
and Safety Executive, HSG254, 2006.
[24] Organization for Economic Coordination and Development (OECD), Guidance on Safety
Performance Indicators. Environment, Health and Safety Publications, 2008.
[25] American Institute of Chemical Engineers, Center for Chemical Process Safety Center of
Chemical Process Safety, Guidelines for Risk Based Process Safety. New Jersey: Wiley
& Sons, 2007.
[26] American Institute of Chemical Engineers, Center for Chemical Process Safety Center of
Chemical Process Safety, Process Safety Leading and Lagging Metrics. 2008.
[27] American Institute of Chemical Engineers, Center for Chemical Process Safety Center of
Chemical Process Safety, Guidelines for Process Safety Metrics. New Jersey: Wiley &
Sons, 2010.
[28] Process Safety Performance Indicators for the Refining and Petrochemical Industries,
the American Petroleum Institute, ANSI/API 754, First Edition, April 2010.
[29] Guide to Report Process Safety Incidents, the American Petroleum Institute, 2008.

80
[30] N. Leveson, Safeware: System Safety and Computers. Mass.: Addison-Wesley Publishing
Company, 1995.
[31] N. Leveson, Engineering a Safer World. Cambridge: MIT Press, 2012.
[32] Hollnagel, E., Barrier Analysis and Accident Prevention. Aldershot, UK: Ashgate, 2004.
[33] Z. Qureshi, “A Review of Accident Modeling Approaches for Complex Critical
Sociotechnical Systems,” Command, Control, Communications and Intelligence
Division, Defense Science and Technology Organization (DSTO), Australia.
[34] H. Heinrich, Industrial Accident Prevention. New York: McGraw-Hill, 1931.
[35] J. D. Sterman, Business Dynamics: Systems Thinking and Modeling for a Complex
World. Boston: Irwin/McGraw-Hill, 2000.
[36] N. Dulac, “A Framework for Dynamic Safety and Risk Management Modeling in
Complex Engineering Systems,” Ph.D. dissertation, Dept. of Aeronautics and
Astronautics Engineering, MIT, Cambridge, MA, 2007.
[37] Y. M. Goh, Peter E.D. Love, and Daniel Lo, “System Dynamics Analysis of
Organizational Accidents: A Review of Current Approaches,” at the International
Conference of the System Dynamics Society, July, 2010.
[38] K. Marais and N. Leveson, “Archetypes for Organizational Safety,” Safety Science, vol.
44 (7): pp. 565-582, Aug., 2008.
[39] J. W. Rudolph and N. P. Repenning, “Disaster Dynamics: Understanding the Role of
Quantity in Organizational Collapse,” Administrative Science Quarterly, vol. 47, pp. 1-
30, 2002.
[40] Jonathan Moizer, Safety hazard Control in the Workplace: a Dynamic Model, at the
International System Dynamics Conference, Information Systems, pp. 46, 1994.
[41] Trevor Kletz, Lessons from Disaster. [Google Books], Houston: Gulf Publishing, 1993.
[42] American Institute of Chemical Engineers, Center for Chemical Process Safety Center of
Chemical Process Safety, Piper Alpha Case Study. New York, 2005.
[43] D. L. Cooke and T. R. Rohleder, “Learning From Incidents: From Normal Accidents to
High Reliability,” System Dynamics Review, vol. 22 (3), pp. 213-239, 2006.
[44] R. Amalberti, “The Paradoxes of Almost Totally Safe Transportation Systems,” Safety
Science, vol. 37, pp. 109-126, 2001.
[45] Risk Management Framework: Principles and Guidelines, ISO 31000, 2009.