leading indicators gn e
TRANSCRIPT

7/28/2019 Leading Indicators GN e
http://slidepdf.com/reader/full/leading-indicators-gn-e 1/78
Guidance Notes on Safety Culture and Leading Indicators of Safety
GUIDANCE NOTES ON
SAFETY CULTURE AND LEADING INDICATORS OFSAFETY
JANUARY 2012
American Bureau of ShippingIncorporated by Act of Legislature of the State of New York 1862
Copyright © 2012American Bureau of ShippingABS Plaza16855 Northchase DriveHouston, TX 77060 USA

7/28/2019 Leading Indicators GN e
http://slidepdf.com/reader/full/leading-indicators-gn-e 2/78
ii ABS GUIDANCE NOTES ON SAFETY CULTURE AND LEADING INDICATORS OF SAFETY . 2012
F o r e w o r d
Foreword
The mission of ABS is to serve the public interest, as well as the needs of its clients, by promoting thesecurity of life, property, and the natural environment.
The importance of the development of a positive safety culture has been recognized for some time, particularlyin large-scale systems where the consequences of losses can be severe.
In safety-critical systems, the use of leading indicators has been proposed to identify areas of weakness inadvance of adverse events, affording the possibility of taking action to avoid losses. This is in contrast tolagging indicators, such as numbers of accidents or incidents, which give indications of past performance.
Based on work with ABS clients, these Guidance Notes provide guidance on the self-assessment of a marineorganization’s Safety Culture, and the development of a Leading Indicators Program.
These Guidance Notes are applicable to all cargo-carrying commercial vessels. Guidance is provided in theform of questionnaires, datasheets, techniques of analysis, and worked examples.
These Guidance Notes become effective on the first day of the month of publication.
Users are advised to check periodically on the ABS website www.eagle.org to verify that this version of these Guidance Notes is the most current.
We welcome your feedback. Comments or suggestions can be sent electronically by email to [email protected] .

7/28/2019 Leading Indicators GN e
http://slidepdf.com/reader/full/leading-indicators-gn-e 3/78
ABS GUIDANCE NOTES ON SAFETY CULTURE AND LEADING INDICATORS OF SAFETY . 2012 iii
Table of Contents
GUIDANCE NOTES ON
SAFETY CULTURE AND LEADING INDICATORS OFSAFETY
CONTENTS
CHAPTER 1 Introduction ............................................................................................ 1Section 1 General ..................................................................................2
CHAPTER 2 Safety Culture................... ...................... ...................... ...................... .... 8Section 1 Safety Factors......................................................................10
Section 2 Administering the Survey.....................................................12
Section 3 Analyzing the Responses ....................................................15
CHAPTER 3 Leading Indicators of Safety ................... ...................... ...................... 22Section 1 The Leading Indicators Program .........................................24
Section 2 Safety Metrics ......................................................................26
Section 3 Safety Performance Data ....................................................30
Section 4 Identifying Objective Leading Indicators..............................32Section 5 Identifying Subjective Leading Indicators ............................40
CHAPTER 4 Next Step............. ...................... ...................... ..................... ................. 43Section 1 Interpreting the Results........................................................45
Section 2 Presenting the Findings.......................................................47
Section 3 Utilizing the Findings............................................................50
APPENDIX 1 Shipboard Safety Culture Questionnaire ...................... ..................... 57
APPENDIX 2 Shoreside Safety Culture Questionnaire................. ....................... .... 60
APPENDIX 3 Questionnaires and Safety Factors .................... ..................... ........... 63
APPENDIX 4 Safety Performance Datasheets ......................................................... 68
APPENDIX 5 Electronic Distribution........... ...................... ...................... .................. 73
APPENDIX 6 References ..................... ..................... ...................... ...................... ...... 75

7/28/2019 Leading Indicators GN e
http://slidepdf.com/reader/full/leading-indicators-gn-e 4/78
This Page Intentionally Left Blank

7/28/2019 Leading Indicators GN e
http://slidepdf.com/reader/full/leading-indicators-gn-e 5/78
ABS GUIDANCE NOTES ON SAFETY CULTURE AND LEADING INDICATORS OF SAFETY . 2012 1
Chapter 1: Introduction
C H A P T E R 1 Introduction
CONTENTS
SECTION 1 General .................... ...................... ...................... ..................... ............... 2 1 Purpose............................................................................................... 2
2 Background......................................................................................... 2 2.1 Safety Performance........................................................... .............. 2
2.2 Safety Culture.............................................. .................................... 2
2.3 Lagging Indicators of Safety ....................................................... ..... 3
2.4 Leading Indicators of Safety ....................................................... ..... 3 2.5 Key Performance Indicators ....................................................... ..... 3
3 The ABS Safety Culture and Leading Indicators Model ..................... 3
4 Scope of the Guidance Notes............................................................. 4
5 Contents of the Guidance Notes......................................................... 5
6 Definitions ........................................................................................... 5
FIGURE 1 The ABS Safety Culture and Leading Indicators Model ........... 4
7/28/2019 Leading Indicators GN e
http://slidepdf.com/reader/full/leading-indicators-gn-e 6/78
2 ABS GUIDANCE NOTES ON SAFETY CULTURE AND LEADING INDICATORS OF SAFETY . 2012
Section 1: General
C H A P T E R 1 Introduction
S E C T I O N 1 General
1 Purpose
This document has been developed with the objective of improving safety performance in the managementand operation of cargo-carrying commercial vessels. ABS provides this guidance in recognition of the beneficialeffect that a positive safety culture can have on safety performance, and the part played by leading indicatorsin guiding action to improve safety performance. This document provides:
i) Guidance to maritime organizations on the survey and assessment of their organizational safety culture, both onshore and at sea.
ii) A process for identifying an organization’s leading indicators of safety performance. Leadingindicators are safety metrics associated with safety performance. Tracking and improving thesemetrics may help to maintain and improve safety performance.
The results from the survey, and/or any leading indicators, can be incorporated into the organization’s ongoingcontinual improvement program.
2 Background
2.1 Safety PerformanceThe goal of the International Safety Management (ISM) Code, and of Safety Management Systems (SMSs)is the attainment of peak safety performance (i.e., no operational incidents, no personal injuries, and no harmto the environment), but the maritime industry is still some way from achieving this goal. Tools such as theISM Code and SMSs undoubtedly aid compliance with regulation, but they do not necessarily improvesafety culture.
There is a general recognition in the industry that encouraging safe working practices does not requiremore rules, regulations, and procedures. Instead, the industry needs a better understanding of the social andorganizational factors that foster professionalism in the seafarer in routine and emergency situations.
2.2 Safety CultureOriginal attempts to improve workplace safety, or to minimize risks, focused on the technical and engineering
aspects of a system. The focus widened as the role of human error became clear and broadened even further with the publication of the report into the Chernobyl disaster (UNSCEAR, 1988). This report identified theabsence of a safety culture as the major contributor to the disaster, and defined safety culture as “That assemblyof characteristics and attitudes in organizations and individuals which establishes that, as an overriding priority,[nuclear plant] safety issues receive the attention warranted by their significance”.
Subsequent reports into other major disasters produced similar findings. They too recognized the impact of safety culture on the outcome of safety performance, noting that most operational incidents are not solely theresult of human error, technical failures, or environmental factors. Often there are more systemic organizationalor managerial flaws (e.g., a fatal combination of failure of management, employees not performing their duties,and a breakdown in documented systems).

7/28/2019 Leading Indicators GN e
http://slidepdf.com/reader/full/leading-indicators-gn-e 7/78
Chapter 1 IntroductionSection 1 General 1-1
ABS GUIDANCE NOTES ON SAFETY CULTURE AND LEADING INDICATORS OF SAFETY . 2012 3
In all hazardous industries, it is now accepted good practice to have in place an SMS and to institutionalizesafe working practices and attitudes through the development of a positive safety culture. There is a closerelationship between an organization’s safety culture and an SMS. An effective SMS has to take into accountall factors that impact safety including the human and organizational; and conversely, the safety cultureinfluences the way in which the SMS is implemented. Consequently, the assessment of safety culture and
the SMS are complementary.
2.3 Lagging Indicators of SafetySafety performance has traditionally been measured by ‘after the loss’ type of measurements such as accidentand injury rates, incidents, and dollar costs. Lagging indicators characteristically:
• Identify trends in past performance
• Assess outcomes and occurrences
• Have a long history of use, and so are an accepted standard
• Are easy to calculate
In the aftermath of catastrophes, it is common to find prior indicators, missed signals, and dismissed alertswhich, if they have been appropriately managed at the time, may have averted the disaster.
2.4 Leading Indicators of SafetyOver the past couple of decades, improved safety performance has been associated with a number of measurableactivities in various industries, opening up the possibility that some of these metrics may be leadingindicators for safety performance. Examples of metrics for these activities are size of safety budget, safetyaudit scores, number of safety inspections, number of safety meetings involving management, etc.
Leading indicators are safety culture metrics that are associated with, and precede, an undesirable/unexpectedconsequence such as an operational incident, near miss or personal injury. They can:
• Reveal areas of weakness in advance of adverse events
• Be associated with proactive activities that identify hazards• Aid risk assessment and management
Leading Indicators are the most important safety culture metrics for the organization as they correlate withthe organization’s safety performance. ABS has developed a method for identifying potential leading indicatorsfor improving safety performance.
2.5 Key Performance IndicatorsLeading indicators are frequently confused with key performance indicators (KPIs). KPIs are stronglyassociated with organizational peak performance which may, or may not, be safety-related. Examples of KPIs are: budgetary control per vessel, dry-docking planning performance, and vessel availability (Sleire,1982). KPIs may be leading or lagging indicators. In contrast, leading indicators are always associated withsafety.
3 The ABS Safety Culture and Leading Indicators Model
The central premise of the ABS Model, shown in 1-1/Figure 1, “The ABS Safety Culture and LeadingIndicators Model”, is that improvements in organizational safety culture can lead to enhanced safety
performance. The first step is an assessment of the existing safety culture to identify areas of strength,weaknesses of defenses, and opportunities for improvement against operational incidents, personal injuries, etc.
This can be done using the ABS safety culture questionnaires supplied in these Guidance Notes in Appendices 1and 2. Details of how to administer the survey and conduct the analysis are supplied in Chapter 2. The findingsmay reveal strengths which can be built upon, and any weaknesses that need rectifying. Chapter 4, Section 3
provides suggestions for utilizing the results in the organization’s continual improvement program.

7/28/2019 Leading Indicators GN e
http://slidepdf.com/reader/full/leading-indicators-gn-e 8/78
Chapter 1 IntroductionSection 1 General 1-1
4 ABS GUIDANCE NOTES ON SAFETY CULTURE AND LEADING INDICATORS OF SAFETY . 2012
FIGURE 1The ABS Safety Culture and Leading Indicators Model
The ABS Model also incorporates a process for identifying an organization’s potential leading indicatorsof safety. There are two ways of conducting this process:
i) By the identification of objective leading indicators. This is done by correlating safety culture metrics
with safety performance data. This is the preferred approach because of its objectivity; because itutilizes metrics that the organization has collected; and it does not require a survey of the workforce,which can be time-consuming. This can be done at three levels:
• At the Organizational level
• Across Business Units
• Across the Fleet
ii) By the identification of subjective leading indicators from a safety culture survey. These indicatorsare based on the values, attitudes, and observations of employees. This method may identify potentially
beneficial safety culture metrics not yet tracked by the organization. This approach may be usedwhen the organization lacks sufficient metrics to use the objective leading indicators process.
There are a number of criteria for undertaking a Leading Indicators Program, and for each type of assessment.For example, to undertake the organizational level analysis, the organization must have been collectingsafety metrics for at least five years. The criteria are discussed fully in the appropriate sections.
4 Scope of the Guidance Notes
The focus of these Guidance Notes is on the self-assessment of an organization’s safety culture and theidentification of that organization’s potential leading indicators of safety (i.e., a set of safety metrics that arecorrelated with safety performance in that organization.) Guidance is also provided on utilizing the findingsas part of an organization’s ongoing continual improvement program.

7/28/2019 Leading Indicators GN e
http://slidepdf.com/reader/full/leading-indicators-gn-e 9/78
Chapter 1 IntroductionSection 1 General 1-1
ABS GUIDANCE NOTES ON SAFETY CULTURE AND LEADING INDICATORS OF SAFETY . 2012 5
5 Contents of the Guidance Notes
These Guidance Notes are organized as follows:
Chapter 2: Safety Culture• Section 1 Safety Factors defines the safety factors (aspects of safety culture) such as communication
and mutual trust, used in the assessment of safety culture in the ABS survey.
• Section 2 Administering the Survey outlines the planning and preparation to be undertaken.
• Section 3 Analyzing the Responses describes the data analysis to be done, with a worked example.
Chapter 3: Leading Indicators of Safety• Section 1 The Leading Indicators Program provides background information about leading indicator
of safety assessments.
• Section 2 Safety Metrics describes and categorizes the metrics used in the Leading Indicators Program.
• Section 3 Safety Performance Data describes and categorizes the safety performance data used inthe Leading Indicators Program.
• Section 4 Identifying Objective Leading Indicators, presents the data analysis (correlation of safetymetrics with safety performance data), with worked examples.
• Section 5 Identifying Subjective Leading Indicators, presents the data analysis (correlation of surveyresults with safety performance data), with a worked example.
Chapter 4: Next Step• Section 1 Interpreting the Results discusses how to interpret the results obtained from the safety culture
survey and from the leading indicators exercises.
• Section 2 Presenting the Findings presents basic information about presentation formats.
• Section 3 Utilizing the Findings provides guidance on interpreting the results and including them ina continual improvement program.
Appendices• Appendix 1 Presents the shipboard safety culture questionnaire .
• Appendix 2 Presents the shoreside safety culture questionnaire.
• Appendix 3 Presents the questionnaires categorized by safety factors, and the questions per safety factor.
• Appendix 4 Presents the safety performance datasheets used the in Leading Indicators assessments.
• Appendix 5 Provides summary guidance on how to distribute the safety culture survey electronically.
6 Definitions
These definitions were used in the development and piloting of the safety culture survey and Leading IndicatorsProgram described in these Guidance Notes.
Accidents: Undesired events that result in personal injury.
Conditions of Class: The number of deficiencies identified, or recommendations made, by the classificationsociety’s surveyor on a vessel.
Conditions of Class (Frequencies): The total number of conditions of class multiplied by 100, divided bythe number of port calls of that vessel in the last year.
Data Sub-Setting: The reduction of large datasets to subsets that are more manageable and/or contain onlythe data that an analyst needs to perform a particular analysis.

7/28/2019 Leading Indicators GN e
http://slidepdf.com/reader/full/leading-indicators-gn-e 10/78
Chapter 1 IntroductionSection 1 General 1-1
6 ABS GUIDANCE NOTES ON SAFETY CULTURE AND LEADING INDICATORS OF SAFETY . 2012
Kruskal-Wallis Test: This is an extension of the Mann–Whitney U Test to three or more groups. It is usedas an alternative to one-way analysis of variance when the data is not normally distributed.
Lagging Indicators: Measures of a system taken after events to assess outcomes and occurrences, such asaccident and injury rates, operational incidents, and dollar costs.
Leading Indicators: The National Academy of Engineering defines leading indicators as conditions, events,and sequences that precede and lead up to accidents (NAE, 2004). In essence, leading indicators are definedas conditions, events or measures that precede an undesirable event, and have some value in predicting thearrival of the event, whether it is an accident, incident, near miss, or undesirable safety state (Toellner, 2001).
Likert: The most widely used scale in survey research. Respondents indicate their level of agreement witha statement, usually on a five-point scale.
Lost Time Incident of 24 Hours or More (LTI ≥ 24 hrs): Any work-related injury other than a fatal injury thatresults in a person being unfit for work for a period of 24 continuous hours immediately after the occurrenceof the incident.
Lost Time Incident Frequency (LTIF): The total Lost Time Incidents multiplied by 1 million, divided bythe number of exposure (working) hours in the last year.
Mann-Whitney U Test: This is a non-parametric test to determine whether two samples of data could havecome from the same population. The Mann-Whitney U test determines the number of times a score fromone of the samples is ranked higher than a score from the other sample.
Medical Treatment Case (MTC): Work-related injuries that are not severe enough to be reported as fatalities,Lost Time Incident, or Restricted Work Accident cases but are more severe than requiring simple first aidtreatment; however the injured person is able to carry out all his duties after treatment.
Medical Treatment Case Frequency (MTCF): The total medical treatment cases multiplied by 1 million,divided by the number of exposure (working) hours in the last year.
Metrics: A set of measurements that quantify or qualify aspects of a system (here, organizational safety performance).
Near Miss (NM): An event, or a chain of events, that under slightly different circumstances could haveresulted in an accident, injury, damage, or loss of personnel, equipment, or the vessel.
Near Miss Frequency (NMF): The total number of near miss cases multiplied by 1 million, divided by thenumber of exposure (working) hours in the last year.
Non-parametric Test: A non-parametric statistical test that does not require scores on the outcome variableto be normally distributed.
Operational Incidents: Events that include steering failures, propulsion failures, navigational equipmentfailures, collisions, groundings, or other navigational or equipment failures.
Operational Incidents (Frequency): The total number of operational incidents multiplied by 100, divided by thenumber of port calls in the last year.
Port State Deficiencies: The number of deficiencies on a vessel identified by Port State Control.
Port State Deficiences: (Frequency): The total number of port state deficiencies multiplied by 100, divided by the number of port calls of that vessel in the last year.
Principal Components Analysis (PCA): A statistical technique used to reduce the number of variables to asubset that retains most of the substantive information in the original set.
Restricted Work Accident (RWA): Any work-related injury (other than a fatality or lost time incident) thatresults in a person being unfit to perform all of his/her regular job after the accident.
Restricted Work Accident Frequency (RWAF): The total restricted work accident cases multiplied by 1 million,divided by the number of exposure (working) hours in the last year.

7/28/2019 Leading Indicators GN e
http://slidepdf.com/reader/full/leading-indicators-gn-e 11/78
Chapter 1 IntroductionSection 1 General 1-1
ABS GUIDANCE NOTES ON SAFETY CULTURE AND LEADING INDICATORS OF SAFETY . 2012 7
Safety Culture: 1. That assembly of characteristics and attitudes in organizations and individuals whichestablishes that, as an overriding priority, [nuclear plant] safety issues receive the attention warranted bytheir significance. (UNSCEAR, 1988). 2. The safety culture of an organization is the product of individual andgroup values, attitudes, perceptions, competencies, and patterns of behavior that determine the commitmentto, and the style and proficiency of, an organization’s health and safety management. (ACSNI, 1991).
Safety Climate: A snapshot of the organization taken at a certain point in time, usually obtained by a safetyculture survey. Safety climate sometimes refers to local (group) subculture.
Spearman Rank Correlation: The Spearman’s rank correlation coefficient, or Spearman’s rho, is designedto measure the relationship between two ordered sets of ranks. It is similar to Pearson’s Correlation, exceptPearson’s uses values instead of ranks.
Total Recordable Cases (TRC): The sum of all work-related fatalities, lost time incidents, restricted work accidents and medical treatment cases. TRCs = LTIs + RWAs + MTCs.
Total Recordable Case Frequency (TRCF): The total recordable cases multiplied by 1 million, divided bythe number of exposure (working) hours in the last year.
Within Groups Analysis: An analysis of a subset of the study participants. For example, an analysis of the
differences in job position of one nationality.

7/28/2019 Leading Indicators GN e
http://slidepdf.com/reader/full/leading-indicators-gn-e 12/78
8 ABS GUIDANCE NOTES ON SAFETY CULTURE AND LEADING INDICATORS OF SAFETY . 2012
Chapter 2: Safety Culture
C H A P T E R 2 Safety Culture
CONTENTS
SECTION 1 Safety Factors...... ...................... ..................... ..................... ................. 10 1 Introduction ....................................................................................... 10
2 Safety Factor Descriptions................................................................ 10 2.1 Communication.............................................................................. 10
2.2 Empowerment ........................................................... .................... 10
2.3 Feedback....................................................................................... 10
2.4 Mutual Trust................................ ................................................... 11 2.5 Problem Identification ................................................ .................... 11
2.6 Promotion of Safety .................................................... ................... 11
2.7 Responsiveness ...................................................... ...................... 11
2.8 Safety Awareness.......................................... ................................ 11
3 Safety Factor Codes ......................................................................... 11
TABLE 1 Safety Factors and Their Codes ............................................. 11
SECTION 2 Administering the Survey ................... ...................... ..................... ...... 12 1 Introduction ....................................................................................... 12
2 Planning ............................................................................................ 12 2.1 Costs and Benefits................................................................. ........ 12
2.2 Distribution Issues ...................................................... ................... 12
3 Preparation........................................................................................ 13 3.1 Prepare Employees ........................................................... ............ 13
3.2 Prepare the Questionnaires..................... ...................................... 13
3.3 Distribute the Questionnaires ........................................................ 14
3.4 Collect Completed Questionnaires ................................................ 14
SECTION 3 Analyzing the Responses .................... ..................... ...................... ..... 15 1 Introduction ....................................................................................... 15
2 Analyses............................................................................................ 15 2.1 Demographic Analysis ........................................................... ........ 15
2.2 Shipboard versus Shoreside Analysis ........................................... 15
2.3 Within Groups Analysis.................................................................. 15
2.4 Qualitative Analysis of the Free Text Questions ............................ 16
3 Preparation........................................................................................ 16
4 Statistical Testing.............................................................................. 16 4.1 Outline of Method ................................................................ .......... 16
4.2 The Mann Whitney U Test ............................................................. 17
7/28/2019 Leading Indicators GN e
http://slidepdf.com/reader/full/leading-indicators-gn-e 13/78
ABS GUIDANCE NOTES ON SAFETY CULTURE AND LEADING INDICATORS OF SAFETY . 2012 9
5 Worked Example............................................................................... 18
TABLE 1 The Mann Whitney U Test ...................................................... 17
TABLE 2 Critical Values for Larger n...................................................... 21

7/28/2019 Leading Indicators GN e
http://slidepdf.com/reader/full/leading-indicators-gn-e 14/78
10 ABS GUIDANCE NOTES ON SAFETY CULTURE AND LEADING INDICATORS OF SAFETY . 2012
Section 1: Safety Factors
C H A P T E R 2 Safety Culture
S E C T I O N 1 Safety Factors
1 Introduction
Safety factors are important dimensions of a safety culture, such as effective communications or safetyawareness. There is no agreed way to segment safety culture and so no definitive set of safety factors exists.Many sets have been developed; all unique in some way, but broadly similar. Examples include: Ryan (1991);The International Civil Aviation Organization (1993); Dufort & Infante-Rivard, (1998); Zimolong & Elke,(2006).
The set of eight safety factors used in the ABS Safety Culture Survey and the Leading Indicators Programdescribed in these Guidance Notes was derived during ABS-funded research conducted with leading clientsin the maritime industry.
The ABS safety culture questionnaire contains forty statements; five statements about each safety factor which participants are asked to rate. The responses are analyzed for differences (or agreement) by job position,age, length of service, shoreside staff versus shipboard crews, etc. Suggestions for improving aspects of safety culture (safety factors) are presented in Chapter 4, Section 3, “Utilizing the Findings”.
2 Safety Factor Descriptions
The different safety factors used in ABS’ research are listed below along with descriptions of the intent of each safety factor.
2.1 CommunicationCommunications are open and effective: Healthy communication channels exist vertically and horizontallywithin the organization. Managers and masters are prepared to listen as well as speak. Everyone has, andunderstands, all the information required for safe operations. Communication channels are monitored for their effectiveness.
2.2 Empowerment Individuals feel empowered to successfully fulfill their safety responsibilities: The organization providesclear delegation of, and accountability for, safety-related responsibilities. Each member of the workforce is
provided the authority and resources to allow success in his/her assigned roles. Each member of the workforceaccepts and fulfills his/her individual safety responsibilities. Management expects and encourages the sharingof safety concerns by everyone in the organization.
2.3 Feedback Management responses to safety issues and concerns are timely: Priority is placed on the timelycommunication of, and response to, outcomes of incident investigations, audits etc., to the workforce.Mismatches between practices and procedures (or standards) are resolved in a timely manner to preventnormalization of deviance. The workforce is encouraged to raise safety concerns, which are resolved in atimely manner.

7/28/2019 Leading Indicators GN e
http://slidepdf.com/reader/full/leading-indicators-gn-e 15/78
Chapter 2 Safety CultureSection 1 Safety Factors 2-1
ABS GUIDANCE NOTES ON SAFETY CULTURE AND LEADING INDICATORS OF SAFETY . 2012 11
2.4 Mutual Trust Relationships are characterized by mutual trust: Members of the workforce trust managers to “do the rightthing” in support of safety, and are expected to shoulder their share of responsibility for performance, andto report potential problems and concerns. Employees trust the motivations and behaviors of peers. There
is confidence that a just system exists where honest errors can be reported without fear of reprisals.2.5 Problem Identification
Potential problems are readily identified: Each member of the workforce has experience, and/or training,in how to recognize unsafe acts and conditions, and how to take steps to avoid or mitigate them.
2.6 Promotion of Safety Managers promote safety as a core value: Managers lead in promoting safety as a core value in theorganization. Visible, active, and consistent support for safety programs and objectives exists at all levels of management within the organization. Managers are seen to be committed to doing what is right, demonstratingtheir values through their communications, actions, priorities, and provision of resources. This value cascadesdown through all levels of the organization.
2.7 ResponsivenessCrew members are responsive to the demands of the job, including unexpected events and emergencies: Crewmembers are encouraged to get adequate rest between shifts to maximize their alertness and readiness torespond during their work periods. All crew members are provided with emergency preparedness trainingand full personal protection equipment (PPE).
2.8 Safety Awareness A strong sense of safety awareness pervades the organization: Each member of the workforce has an awarenessof his/her responsibilities with regard to safety to self, co-workers, the organization, and to the environment.All employees feel accountable for their own actions, and collectively for the actions of their colleagues/crew.There is a strong individual and group intolerance for violations of established safety performance norms.
3 Safety Factor Codes
The codes for each safety factor are shown in 2-1/Table 1, “Safety Factors and Their Codes”.
TABLE 1Safety Factors and Their Codes
Safety Factor Codes
Communication COM
Empowerment EMP
Feedback FDB
Mutual Trust MTR
Problem identification PID
Promotion of safety POS
Responsiveness RSP
Safety awareness SAW
In Appendix 3, “Questionnaires and Safety Factors”, the statements are presented with their correspondingsafety factor codes; and shown in their safety factor groupings.

7/28/2019 Leading Indicators GN e
http://slidepdf.com/reader/full/leading-indicators-gn-e 16/78
12 ABS GUIDANCE NOTES ON SAFETY CULTURE AND LEADING INDICATORS OF SAFETY . 2012
Section 2: Administering the Survey
C H A P T E R 2 Safety Culture
S E C T I O N 2 Administering the Survey
1 Introduction
This Section of these Guidance Notes details the planning and preparation required for successful administrationof the safety culture survey to crew on board vessels, and to employees who are shoreside.
2 Planning
These are the issues that should be considered during the decision-making process of determining whether or not to proceed with a safety culture survey.
2.1 Costs and BenefitsUndertaking a survey can be costly, so the costs and benefits should be carefully appraised before proceeding.
2.1.1 CostsThis is a labor-intensive exercise, which requires a particular skill-set, including:
• Good organizational and administrative skills to supervise the process
• Purchase of software tools and statistics packages (if required)
• Knowledge of social science statistics, especially the Mann-Whitney U Test• Experience of using statistics packages and/or spreadsheets
• Cost of employees’ time completing the survey
2.1.2 Benefits• The identification of areas of excellence
• The identification of areas where there are opportunities for improvement
• Foundation for a program to address areas where there are opportunities for improvement
• Public demonstration of management commitment to safety
2.2 Distribution IssuesOnce the decision has been made to carry out a survey, the distribution format needs to be determined. Thechoices are paper-based, electronic, or a mixture of both (e.g., a web-based electronic distribution for shoresidestaff and paper-based for vessels). Appendix 5, “Electronic Distribution” discusses the issues of electronicdistribution. The considerations for paper-based distribution include:
i) Decide when to run the survey. It is inadvisable to launch a safety culture survey when the organizationis in a state of flux (e.g., during company acquisitions or mergers, as the culture will be affected),or in the aftermath of fatalities or serious injuries. The survey should be allowed to run for at leastfour weeks.
ii) Determine who will be taking the survey, and which ships and offices to include. The Shoreside
Safety Culture Questionnaire should be answered by staff who work on the Operations Desks, or in the Fleet Management Department, or who are knowledgeable about fleet management.

7/28/2019 Leading Indicators GN e
http://slidepdf.com/reader/full/leading-indicators-gn-e 17/78
Chapter 2 Safety CultureSection 2 Administering the Survey 2-2
ABS GUIDANCE NOTES ON SAFETY CULTURE AND LEADING INDICATORS OF SAFETY . 2012 13
iii) Determine the purpose of the survey. Aim to include as many employees as possible, includingcrew on shore-leave. However, note that where the survey responses are used for a Subjective LeadingIndicators Program, only crew responses from vessels are used. Responses from crew on shore-leave,and shoreside employees are NOT included as the correlations for leading indicators are done bythe vessel, not by individuals.
iv) Estimate the number of copies required; and where and when they are to be printed.
v) Decide who is to be responsible for the distribution.
vi) Determine how the questionnaires will be distributed to the ships and offices, and how they will be collected.
vii) Consider confidentiality issues such as the provision of envelopes for sealed responses, and whowill have access to the responses, etc.
3 Preparation
Once a decision has been made to proceed, detailed preparations are required to facilitate a smooth process.
3.1 Prepare Employeesi) Employees should be given at least four weeks’ advance notice of the safety culture survey and
encouraged to participate. This applies to crew on board vessels as well as shoreside.
ii) Ideally, the announcement should come from senior management, and the importance of participationshould be reinforced via other communications. For example, place an interview with senior management in the company newsletter.
iii) It is important that the masters understand the importance of the survey, as it will be their responsibilityto announce, explain, and encourage participation in the survey.
iv) The workforce should be told that the reason for the survey is to find out where the organizationshould focus on making improvements to its safety culture.
v) Let the workforce know that the survey can be completed in fifteen minutes.
vi) Let the workforce know what to expect (e.g., that it covers safety culture on board vessels, healthand safety, and job characteristics, plus some demographic questions necessary for conducting theanalysis).
vii) Employees should be told that participation in the survey is voluntary and it will be undertakenduring working time at the organization’s expense.
viii) Let employees know that their replies are anonymous and treated confidentially.
3.2 Prepare the QuestionnairesThe survey is undertaken using the questionnaires shown in Appendix 1, “Shipboard Safety Culture
Questionnaire” and Appendix 2, “Shoreside Safety Culture Questionnaire”.i) Determine that the terminology in the questionnaires is familiar to the workforce. The definitions
of terms used in the questionnaires are provided in Section 1, “Introduction”. It may be beneficialto provide definitions and examples with the questionnaire to prevent any misunderstanding.
ii) Provide a list of departments, job positions etc. to standardize choice.
iii) Each ship will need a unique identifier for Section D Question 6 (Shipboard Safety CultureQuestionnaire). This could be ship name or ship email address.
iv) Crew who are on shore leave should be told to answer Section D Question 6 with “SL” indicatingthey are currently ashore.
v) Print sufficient numbers of copies of each questionnaire.

7/28/2019 Leading Indicators GN e
http://slidepdf.com/reader/full/leading-indicators-gn-e 18/78
Chapter 2 Safety CultureSection 2 Administering the Survey 2-2
14 ABS GUIDANCE NOTES ON SAFETY CULTURE AND LEADING INDICATORS OF SAFETY . 2012
vi) Prepare a covering letter for the survey. This letter should include instructions such as the need toanswer ALL questions; direction to choose the “Don’t Know” response where a question is unclear or inapplicable, and the end date for the survey. Emphasize that the questionnaire can be answeredin fifteen minutes.
vii) Provide a large self-sealing envelope for the return of each questionnaire.
3.3 Distribute the Questionnairesi) Include the covering letter with the instructions.
ii) There are two questionnaires in the survey, which are complementary. The questions cover thesame ground but are framed differently. The questionnaires are shown in Appendix 1, “ShipboardSafety Culture Questionnaire” and Appendix 2, “Shoreside Safety Culture Questionnaire”.
iii) Allow one month for responses.
iv) Ten days before the end of the survey, send a reminder.
v) Be prepared to extend the deadline, if more time is needed.
3.4 Collect Completed Questionnairesi) Somebody in each office should be given responsibility for the collection of the sealed envelopes
shoreside and for sending them to the analyst.
ii) Provide clear instructions to the ships as to where to send the responses.

7/28/2019 Leading Indicators GN e
http://slidepdf.com/reader/full/leading-indicators-gn-e 19/78
ABS GUIDANCE NOTES ON SAFETY CULTURE AND LEADING INDICATORS OF SAFETY . 2012 15
Section 3: Analyzing the Responses
C H A P T E R 2 Safety Culture
S E C T I O N 3 Analyzing the Responses
1 Introduction
This Section describes the analysis methodology step-by-step. Worked examples are included to aidunderstanding of principles but it is recommended that a statistics package, or other computer support, isutilized as undertaking statistics by hand can be very laborious.
2 AnalysesThere are two questionnaires, one for the shoreside staff and one for crew members. Each questionnairecontains forty statements that are identical, or equivalent. Respondents indicate their level of agreement toa statement on a five-point scale, known as a Likert scale.
2.1 Demographic AnalysisThis analysis is performed to determine any difference in responses on the basis of:
• Age
• Gender
• Nationality
• Job position
• Experience with this organization
• Experience in the maritime industry
• Experience in your current position
2.2 Shipboard versus Shoreside AnalysisThis analysis is performed to determine any perceived safety culture difference (i.e., difference in responsesto the forty Likert statements) between crew on vessels and shoreside staff.
2.3 Within Groups AnalysisThis analysis is performed to determine any difference in responses within each demographic group identified in2-3/2.1, “Demographic Analysis”. For example, statistical analysis may indicate safety culture differences
between crewmembers based on nationality. However, further analysis may need to be performed to determineif this difference is a function of nationality per se or some other factor such as job position. Within groupanalyses include:
• Job position within nationality
• Job position within experience level
• Job position within age group
• Job position within gender
• Nationality within experience level

7/28/2019 Leading Indicators GN e
http://slidepdf.com/reader/full/leading-indicators-gn-e 20/78
Chapter 2 Safety CultureSection 3 Analyzing the Responses 2-3
16 ABS GUIDANCE NOTES ON SAFETY CULTURE AND LEADING INDICATORS OF SAFETY . 2012
• Nationality within age group
• Nationality within gender
• Age group within experience level
• Age group within gender
• Gender within experience level
2.4 Qualitative Analysis of the Free Text QuestionsThe questionnaires conclude with four questions asking for suggestions to improve safety culture. As theresponses are free text, statistical analysis cannot be done. The responses should be carefully collated interms of recurring themes, good ideas, etc. These findings should be presented to senior management together with the main findings from the statistical analysis.
3 Preparation
The following list contains actions which should be included in preparation for data analysis.
i) After receiving raw data, develop a plan to format data based on spreadsheet (or statistical package)requirements for analyses.
ii) Import the response data into spreadsheet software.
iii) Keep original raw dataset intact and use a copy for sanitization, (i.e., removing any identifyinginformation).
iv) Sanitize the copy to remove any reference to vessel name, office, and individual employee or crewmember.
v) Keep sanitized dataset intact, and use another copy for analysis.
vi) Have as few analysts as possible handling the data to reduce error and promote consistent methods
and analyses.vii) Keep number of dataset files to a minimum, use proper and standardized folder/file names, and have
dates on all files.
viii) Assign one individual to keep all files (‘central storage’).
ix) Do not assign one analysis to more than one individual.
4 Statistical Testing
4.1 Outline of MethodA Mann-Whitney U Test is performed for each comparison of the demographic factors: age, gender, nationality,
job position, and length of time in the organization, in the maritime industry, in the current job, and two groupsof workers (shipboard and shoreside). An extension of the Mann-Whitney U Test, called a Kruskal-WallisTest, can be used for the Within Groups Analysis.
The example described here is for two groups of workers (shipboard and shoreside) and the sixth Likertstatement. The steps are repeated for each of the remaining thirty-nine Likert statements. When all responses tothe forty Likert statements have been analyzed in terms of shipboard and shoreside workers, the responses tothe Likert statements are analyzed in terms of another demographic factor (e.g., nationality).
i) Establish the hypothesis for the test. The null hypothesis is that there is no difference in shipboardand shoreside response to the statement: “This company has excellent maintenance standards”.
ii) Subset the data in spreadsheet or statistical package of choice. Data sub-setting reduces large datasetsto subsets that are more manageable or contain only the set of data that an analyst needs to perform a
particular analysis.

7/28/2019 Leading Indicators GN e
http://slidepdf.com/reader/full/leading-indicators-gn-e 21/78

7/28/2019 Leading Indicators GN e
http://slidepdf.com/reader/full/leading-indicators-gn-e 22/78
Chapter 2 Safety CultureSection 3 Analyzing the Responses 2-3
18 ABS GUIDANCE NOTES ON SAFETY CULTURE AND LEADING INDICATORS OF SAFETY . 2012
TABLE 1 (continued)The Mann Whitney U Test
Step Instructions
8 Use this step when samples sizes are large and there are no ties ( n1 > 20 or n2 > 20). U approaches anormal distribution, so the U value can be transformed into a Z value by using the following formula:
Z =12/)]1)([(
2/)(
2121
21
++××−
nnnn
nnU
Where U is the smaller of the two values.
9 Use this step when there are many ties of ranks in the two samples. Z should include the correction factor:
∑ ∑ −=
12
3ii t t
T
where t is the number of scores for a given rank.
If, for example, there are two scores of rank 4, three scores of rank 2, and four scores of rank 1, thent i = 2, 3, and 4. This correction factor is incorporated into the equation for the Z transformation.
Z =
12)()(
)()(
2
213
21
212
21
21
21
−
+−+
+−+×
×−
∑T nnnn
nnnn
nn
nnU
The correction factor raises the value of Z by a small amount, which may be important when thesample statistic is near a critical value.
10 Because the test statistic U is the smaller U of the two samples, the null hypothesis is rejected whenthe specific value of z is smaller than the critical value in the left tail of the Z distribution (< – z α for aone-tailed test or z * < – z α /2 or z * >– z α /2 for a two tailed test) where z * stands for the calculated value and
z α is the tabulated value. Normal distribution table can be used for comparison.
5 Worked Example
A safety culture survey is undertaken in a marine organization. Two groups of workers (shipboard andshoreside) participate in this survey. Responses to the statement, “This company has excellent maintenancestandards” are tabulated on a five-point Likert scale as:
Disagree Slightly Disagree Neutral Slightly Agree Agree Don’t Know
1 2 3 4 5 0

7/28/2019 Leading Indicators GN e
http://slidepdf.com/reader/full/leading-indicators-gn-e 23/78
Chapter 2 Safety CultureSection 3 Analyzing the Responses 2-3
ABS GUIDANCE NOTES ON SAFETY CULTURE AND LEADING INDICATORS OF SAFETY . 2012 19
There are 21 responses from the ships and 6 responses from the shoreside:
Shipboard Shoreside
5 3
3 2
3 4
4 1
2 5
1 4
2
3
5
4
5
4
3
2
3
1
5
5
3
2
4
The objective is to test if there is a difference in the shoreside and shipboard responses (at a 95%
confidence level) that cannot attributed to chance.Steps 1, 2, 3: Rank the scores of both the samples together, using rank 1 for the lowest score, rank 2 for the next lowest score and so on.
Step 4: Average the ranks where the same value occurs more than once.
For example, in the table below, there are three scores of 1, corresponding to ranks 1, 2, and 3. The sum of 1, 2, and 3, is 6. Since there are three scores, divide 6 by 3, resulting in 2. Assign a new “averaged” score(for the purpose of statistical computation) of 2 to each of these (raw score = 1).
Similarly, for raw scores of 2, add the corresponding ranks (4 through 8) to get a sum of 30, divide this by 5(since there are 5 scores of 2). Each raw score has a corresponding “averaged” score of 6.

7/28/2019 Leading Indicators GN e
http://slidepdf.com/reader/full/leading-indicators-gn-e 24/78
Chapter 2 Safety CultureSection 3 Analyzing the Responses 2-3
20 ABS GUIDANCE NOTES ON SAFETY CULTURE AND LEADING INDICATORS OF SAFETY . 2012
Raw Score Rank Averaged
1 1 2
1 2 2
1 3 2
2 4 6
2 5 6
2 6 6
2 7 6
2 8 6
3 9 14
3 10 14
3 11 14
3 12 14
3 13 14
3 14 14
3 15 144 16 18.5
4 17 18.5
4 18 18.5
4 19 18.5
4 20 18.5
4 21 18.5
5 22 24.5
5 23 24.5
5 24 24.5
5 25 24.5
5 26 24.55 27 24.5
Step 5: Sum the ranks for the smaller sample (shoreside).
Shoreside Scores Averaged Ranks
3 14
2 6
4 18.5
1 2
5 24.5
4 18.5
Sum of ranks = 83.5
Step 6: The Mann-Whitney U statistic is calculated by the following formula where n1 represents the smaller sample size and n2 the larger sample size:
U = (n1 × n2) +2
)1( 11 +× nn– summed rank of n1
For this example:
U = (6 × 21) +2
)7(6 ×– 83.5
U = 63.5

7/28/2019 Leading Indicators GN e
http://slidepdf.com/reader/full/leading-indicators-gn-e 25/78
Chapter 2 Safety CultureSection 3 Analyzing the Responses 2-3
ABS GUIDANCE NOTES ON SAFETY CULTURE AND LEADING INDICATORS OF SAFETY . 2012 21
Step 7: Calculate the U value for the second sample using the following formula:
U of second sample = ( n1 × n2) – U for first sample
U of second sample = (6 × 21) – 63.5 for first sample = 62.5
Step 8: This step is not necessary because there are many ties.Step 9: Calculate the Z -statistic using formula given in step 9. In this example, ∑T = 75 results in:
Z =
7512
)216()216(
)216()216(
216
2216
5.62
3
2
−+−+
+−+×
×−
= –0.02985
Step 10: Consider a two-tailed test with a 95% confidence level z α /2 = 1.96 (see 2-3/Table 2). Since theobtained z (–0.02985) is larger than the value of z in the normal distribution table, it can be concluded that
there is insufficient evidence to reject the null hypothesis. Therefore, a statistically significant differencehas not been found between the shoreside and the shipboard staff in their perception that the company hasexcellent maintenance standards.
TABLE 2Critical Values for Larger n
Level of Confidence z α /2
0.80 1.28
0.85 1.44
0.90 1.645
0.95 1.96
0.98 2.330.99 2.575
Section 4 will help in interpreting the results of this analysis.

7/28/2019 Leading Indicators GN e
http://slidepdf.com/reader/full/leading-indicators-gn-e 26/78
22 ABS GUIDANCE NOTES ON SAFETY CULTURE AND LEADING INDICATORS OF SAFETY . 2012
Chapter 3: Leading Indicators of Safety
C H A P T E R 3 Leading Indicators of Safety
CONTENTS
SECTION 1 The Leading Indicators Program........................ ..................... ............ 24 1 Introduction ....................................................................................... 24
2 Criteria for Undertaking a Leading Indicators Program.................... 24
3 Costs and Benefits............................................................................ 24 3.1 Costs .................................................... ......................................... 24
3.2 Benefits.......................................................................................... 25
4 Types of Leading Indicators.............................................................. 25 4.1 Objective Indicators ............................................................. .......... 25
4.2 Subjective Indicators............................................................ .......... 25
TABLE 1 Advantages and Disadvantages of Objective LeadingIndicators................................................................................. 25
TABLE 2 Advantages and Disadvantages of Subjective LeadingIndicators................................................................................. 25
SECTION 2 Safety Metrics ................... ..................... ..................... ..................... ..... 26
1 Introduction ....................................................................................... 26 2 Types of Safety Metrics .................................................................... 26
7.1 Baseline Metrics ....................................................... ..................... 26
7.2 Subsidiary Metrics ............................................................... .......... 26
7.3 Core Metrics ............................................................ ...................... 26
TABLE 1 Safety Factors and Baseline Metrics ...................................... 27 TABLE 2 Safety Factors and Subsidiary Metrics ................................... 28 TABLE 3 Safety Factors and Core Metrics ............................................ 28
FIGURE 1 The Metrics Hierarchy............................................................. 26
SECTION 3 Safety Performance Data .................... ..................... ..................... ......... 30 1 Introduction ....................................................................................... 30
2 Organizational Level Safety Performance Data................................ 30
3 Business Unit Safety Performance Data .......................................... 30
4 Vessel Safety Performance Data...................................................... 31
TABLE 1 Safety Performance Data for the Organization....................... 30 TABLE 2 Safety Performance Data for the Business Units (BUs) ......... 31 TABLE 3 Safety Performance Data for Each Vessel ............................. 31 TABLE 4 Normalizing Safety Performance Data.................................... 31
7/28/2019 Leading Indicators GN e
http://slidepdf.com/reader/full/leading-indicators-gn-e 27/78
ABS GUIDANCE NOTES ON SAFETY CULTURE AND LEADING INDICATORS OF SAFETY . 2012 23
SECTION 4 Identifying Objective Leading Indicators ................... ....................... . 32 1 Introduction ....................................................................................... 32
2 General Approach............................................................................. 32 2.1 Safety Metrics.................................................................. .............. 32
2.2 Safety Performance Data .............................................................. 32 2.3 Correlating Safety Metrics with Safety Performance Data............. 33
2.4 Assessing Significance................................... ............................... 33
2.5 Delayed Effect Variations .............................................................. 34
3 Worked Examples............................................................................. 34 3.1 Organizational Analysis Over Time ............................................... 34
3.2 Across Business Units................................. .................................. 37
3.3 Across the Fleet ...................................................... ...................... 38
TABLE 1 Instructions for Spearman’s Rho Correlation.......................... 33
TABLE 2 Critical Values of Spearman’s Rho (Two-Tailed).................... 34 TABLE 3 Correlation at the Organizational Level ( n =10, no ties) ......... 35
TABLE 4 Correlation at the Organization Level ..................................... 36
TABLE 5 Critical Values for Larger n (Spearman Rho Coefficient)........ 37
TABLE 6 Correlation Across Business Units.......................................... 38
TABLE 7 Correlation Across the Fleet ................................................... 39
SECTION 5 Identifying Subjective Leading Indicators ....................... .................. 40 1 Introduction ....................................................................................... 40
2 Method .............................................................................................. 40 2.1 Average the Responses for Each Vessel ...................................... 40
2.2 Prepare the Safety Performance Data .......................................... 40
2.3 Correlate the Responses and Safety Performance Data............... 40
3 Worked Example............................................................................... 40 3.1 Average the Responses for Each Vessel ...................................... 41
TABLE 1 Likert Scale ............................................................................. 41
TABLE 2 Subjective Leading Indicators Example.................................. 42

7/28/2019 Leading Indicators GN e
http://slidepdf.com/reader/full/leading-indicators-gn-e 28/78
24 ABS GUIDANCE NOTES ON SAFETY CULTURE AND LEADING INDICATORS OF SAFETY . 2012
Section 1: The Leading Indicators Program
C H A P T E R 3 Leading Indicators of Safety
S E C T I O N 1 The Leading Indicators Program
1 Introduction
The purpose of a Leading Indicators Program is to identify which safety metrics are most strongly associatedwith safety performance in a particular organization. This information can be used to guide actions to improvefuture safety performance. This Section introduces the basic concepts and principles of a Leading IndicatorsProgram.
2 Criteria for Undertaking a Leading Indicators Program
The Leading Indicators approach to improving safety performance is likely to be most effective when thetechnical aspects of safety are performing adequately and the majority of operational incidents and accidentsappear to be due to human error or organizational factors. The Leading Indicators approach is therefore onlyopen to organizations that fulfill a number of specific criteria:
• The organization is compliant with all relevant regulations.
• Human error or organizational factors are causing the majority of operational incidents or personal injuries.
• The organization has a genuine desire to prevent operational incidents and personal injuries and is notsolely driven by the avoidance of prosecution.
• The organization is relatively stable, not in the middle of mergers, acquisitions or significant reorganizations.
If an organization does not meet these criteria, then it is not ready for a Leading Indicators Program. In addition,the organization must also meet one of the following criteria, depending on which leading indicators assessmentis to be undertaken:
• An objective leading indicators assessment of the organization requires that safety metrics must have been collected for some time: at least five years for an organizational level analysis, and at least one year for the business unit level, or across the fleet.
• A subjective leading indicators assessment requires that a safety culture survey is performed and the resultsutilized.
3 Costs and BenefitsAs with the safety culture survey, a Leading Indicators Program also needs adequate resources. Some of the associated costs and benefits are discussed below.
3.1 Costs• Resources to retrieve the safety metrics and safety performance data
• Employees’ time
• Knowledge of Spearman’s rho statistics test
• Extensive experience of using statistics packages or spreadsheets
• Purchase of statistics package, if necessary

7/28/2019 Leading Indicators GN e
http://slidepdf.com/reader/full/leading-indicators-gn-e 29/78
Chapter 3 Leading Indicators of SafetySection 1 The Leading Indicators Program 3-1
ABS GUIDANCE NOTES ON SAFETY CULTURE AND LEADING INDICATORS OF SAFETY . 2012 25
3.2 Benefits• Helps to identify what actions have been, or could be, successful in improving safety
• Can improve understanding of whether or not goals are being met
• Provides a tool for prioritization and a basis for improving effectiveness of safety-related expenditureand allocation of resources
• Raises employee awareness of safety-related issues
• Can identify areas of strength and weakness
4 Types of Leading Indicators
Leading indicators are safety metrics that correlate with safety performance for a given organization. Theycan be objective or subjective measures.
4.1 Objective Indicators
These are safety metrics that are objective measures, numbers, frequencies, etc. 3-1/Table 1, “Advantagesand Disadvantages of Objective Leading Indicators” shows the advantages and disadvantages of this approach.
TABLE 1Advantages and Disadvantages of Objective Leading Indicators
Advantages Disadvantages
Utilizes metrics that have been collected by theorganization
Does not identify new metrics for collection
Analysis is relatively straightforward May not be suitable to capture the quality of thesafety system in place
At the organizational level analysis, at least five years of data is required. Analysis can also be undertakenat the business unit level, and the fleet level with only one year’s data.
4.2 Subjective IndicatorsThese are crew values, attitudes, and opinions correlated with safety performance across the fleet. 3-1/Table 2,“Advantages and Disadvantages of Subjective Leading Indicators” shows the advantages and disadvantagesof this approach.
TABLE 2Advantages and Disadvantages of Subjective Leading Indicators
Advantages Disadvantages
May give rise to new metrics that were not previously collected.
Requires a safety culture assessment as it utilizes theresponses.
Can be identified even though the organizationhas not collected any metrics.
The responses require conversion to metrics suitablefor inclusion in a Continual Improvement Program
They are subjective which makes them difficult toquantify

7/28/2019 Leading Indicators GN e
http://slidepdf.com/reader/full/leading-indicators-gn-e 30/78
26 ABS GUIDANCE NOTES ON SAFETY CULTURE AND LEADING INDICATORS OF SAFETY . 2012
Section 2: Safety Metrics
C H A P T E R 3 Leading Indicators of Safety
S E C T I O N 2 Safety Metrics
1 Introduction
Objective leading indicators are identified by correlating safety metrics with safety performance data. The process is detailed in Chapter 3, Section 4, “Identifying Objective Leading Indicators”. This Section introducesdifferent types of safety metrics.
2 Types of Safety MetricsABS research has identified three types of metrics that have different levels of usefulness for inclusion in aleading indicators program. These are shown in 3-2/Figure 1, “The Metrics Hierarchy”.
FIGURE 1The Metrics Hierarchy
7.1 Baseline Metrics
Baseline metrics form the backbone of a safety culture and should be collected. However, because they areexpressed as absolutes – the presence or absence of an activity (and not as ratios, frequencies, etc.), theyare unsuitable for inclusion in a Leading Indicators Program. They are shown in 3-2/Table 1, “Safety Factorsand Baseline Metrics”.
7.2 Subsidiary MetricsSubsidiary metrics, shown in 3-2/Table 2, “Safety Factors and Subsidiary Metrics”, are useful in a leadingindicators program until they peak, which they may do as the safety culture takes root. For example, once“Percentage of crew who have PPE” consistently attains 100%, it is no longer useful as a metric for correlatingwith safety performance.
7.3 Core MetricsThe core set of metrics, shown in 3-2/Table 3, “Safety Factors and Core Metrics”, are eminently suitablefor inclusion in a Leading Indicators Program by all organizations ready to initiate such a program.

7/28/2019 Leading Indicators GN e
http://slidepdf.com/reader/full/leading-indicators-gn-e 31/78
Chapter 3 Leading Indicators of SafetySection 2 Safety Metrics 3-2
ABS GUIDANCE NOTES ON SAFETY CULTURE AND LEADING INDICATORS OF SAFETY . 2012 27
TABLE 1Safety Factors and Baseline Metrics
Safety Factors Baseline Metrics
Communication Provision of a communications training program
Provision of a company newsletter Provision of bulletins, toolbox talks, or similar regarding lessons learned or alerts regardingincidents that could have fleet-wide applicationProvision for making safety communications available in native languagesProvision of an anonymous reporting systemProvision of communications of safe work practicesProvision of two-way communication
Provision of new hire trainingEHS policy and goals are communicated with the crew
Empowerment Presence of clear documented accountabilit ies for safetyPresence of a means for crew involvement in safety improvement
Presence of a means for crew influence in safety improvementPresence of an off-the-job safety training programEstablishment of a safety committee that includes a vertical slice of the organization
Feedback Presence of an employee suggestion/feedback programPresence of a crew feedback system concerning near misses and hazard identificationsPresence of a feedback system to crew on safety audits, issues and concernsPeriodic employee opinion/attitude surveys
Presence of a crew feedback system concerning shipboard meetings concerning safety
Mutual Trust Presence of documented policies that prevent unethical behavior in the organization
Establishment of a fair system for incident investigationPresence of an internship training programPresence of a documented hiring policy and proceduresPresence of an interviewer training program
Problem Identification A policy in place mandating safety procedures, instructions, or rules for all jobsA policy and/or procedures for reporting unsafe conditionsUpdate period policy for safety checklists
Policy to complete pre-operational checks exist
Promotion of Safety Presence of safety budgetSafety budget is not reduced due to operational budgetPresence of safety goals
Presence of a procedure that makes all incident investigation findings available to employeesPresence of an induction training program that meets the requirements of the STCW codeProcedures to identify and impart any training required in support of safety management systemsSenior management attend safety meetings
Presence of maintenance budgetMaintenance budget is not reduced due to operational budget
Responsiveness Provision of PPE for crew
Presence of a training program for emergenciesCreation of metrics for resolution of safety concernsProcedures to enable crew to get scheduled rest/time off duty
Safety Awareness Documented procedures for effective ship and watch hand-oversProvision of a training program for hazard/risk assessment

7/28/2019 Leading Indicators GN e
http://slidepdf.com/reader/full/leading-indicators-gn-e 32/78
Chapter 3 Leading Indicators of SafetySection 2 Safety Metrics 3-2
28 ABS GUIDANCE NOTES ON SAFETY CULTURE AND LEADING INDICATORS OF SAFETY . 2012
TABLE 2Safety Factors and Subsidiary Metrics
Safety Factors Subsidiary Metrics
Communication Number of mechanisms for communicating safety to employees (e.g., newsletters, toolbox talks,
meetings, training, incident findings)Percentage of safety training in native languagesFrequency of safety meetingsFrequency of toolbox talks
Empowerment Number of job procedures that require modification due to safety concerns, per employeePercentage of employees receiving ALL safety training
Feedback Percentage of safety reports on which feedback was provided Number of mechanisms by which safety is communicated from employees to management (e.g.,suggestion boxes)Percentage of safety suggestions on which feedback was provided
Percent of employees who have their performance appraised annually
Mutual Trust Percentage of employees receiving ethics trainingPercentage of procedures provided in native language of crew, as well as English
Problem Identification Number of hazard analysis techniques utilizedPercentage of jobs that have safety checklistsAverage update period of safety checklistsAverage update period of standard operating procedures
Number of safety inspections per annumPercentage of jobs requiring pre-operational checks if pre-operational check is required
Number of corrective action reports (CARs) originating from audits
Promotion of Safety Frequency of safety meetings attended by senior managementPercentage of crew receiving feedback on safety audits, issues, and concernsPercentage of new hires put through a formal induction processPercentage of time schedules affect crew/vessel safetyPercentage of safety meetings attended by senior management
Number of safety management meetings
Responsiveness Percentage of correction action reports (CARs) closed out within 6-9 monthsPercentage of employees provided with ALL PPE
Percentage of safety concerns that are addressed within 3 months
Safety Awareness Number of safety performance indicators utilizedPercentage attendance at safety meetings
TABLE 3
Safety Factors and Core MetricsSafety Factors Core Metrics
Communication Percentage of employees receiving communication trainingBudget for communicating safety to employees (e.g., newsletters, toolbox talks, meetings, training,incident findings)
Empowerment Percentage of employees with accident investigation training
Percentage of safety training that includes competency testing
Feedback Percent of performance appraisal based on safety related matters
Mutual Trust Average turnover rate (%)
Average length of stay in organizationAverage absenteeism
Percent increase in crew staffing per vessel

7/28/2019 Leading Indicators GN e
http://slidepdf.com/reader/full/leading-indicators-gn-e 33/78
Chapter 3 Leading Indicators of SafetySection 2 Safety Metrics 3-2
ABS GUIDANCE NOTES ON SAFETY CULTURE AND LEADING INDICATORS OF SAFETY . 2012 29
TABLE 3 (continued)Safety Factors and Core Metrics
Safety Factors Core Metrics
Problem Identification Percentage of accidents reported per employee
Number of safety audits completed per year Number of safety inspections per year Percentage of incident reports on which causal analysis was undertaken
Number of completed safety inspection/monitor/audit/review activities vs. planned in the pastyear
Promotion of Safety Percentage increase in annual safety budgets from previous year Percentage of employees receiving onboard or in-service trainingPercentage of closure for CARs over three months’ oldPercentage of total operational budget allocated to safety items
Number of training hours loggedAverage number of safety training sessions logged per employee
Responsiveness Average time to implement action on complaints or suggestions Number of safety audit recommendations closed out in timePercentage of maintenance items completed on time in the past year Percentage of maintenance items that have been postponed in the past year
Safety Awareness Number of safety suggestions submitted per employeePercentage of incidents reported per employee
Number of job hazard analyzes conducted per employeePercentage of time a Job Safety Analysis (JSA), Project Safety and Health Review (PSHR) (or similar) was conducted when there were changes to jobs, tasks, or equipment in the past year
Number of near misses reported per employee

7/28/2019 Leading Indicators GN e
http://slidepdf.com/reader/full/leading-indicators-gn-e 34/78
30 ABS GUIDANCE NOTES ON SAFETY CULTURE AND LEADING INDICATORS OF SAFETY . 2012
Section 3: Safety Performance Data
C H A P T E R 3 Leading Indicators of Safety
S E C T I O N 3 Safety Performance Data
1 Introduction
Objective leading indicators are identified by correlating safety metrics with safety performance data. The process is detailed in Chapter 3, Section 4, “Identifying Objective Leading Indicators”. This Section introducesthe safety performance data required. The safety performance datasheets, for collection of the safety
performance, are in Appendix 4, “Safety Performance Datasets”.
All of the safety performance data requires normalization before statistical analysis, to enable valid comparisonsof vessels on different routes, etc. This is shown in 3-3/Table 4 “Normalizing Safety Performance Data”.
2 Organizational Level Safety Performance Data
The safety performance data for the organizational level covers both operational data and health and safety;this is shown in 3-3/Table 1 “Safety Performance Data for the Organization”. Raw data can be normalizedusing 3-3/Table 4 “Normalizing Safety Performance Data”.
TABLE 1Safety Performance Data for the Organization
Operations Data for the Organization Health and Safety Data for the Organization
Operational Incidents Frequencies Total Recordable Cases Frequency for the fleet
Near Miss Frequencies Lost Time Incidents Frequency for the fleet
Conditions of Class Frequencies Medical Treatment Case Frequency for the fleet
Port State Deficiencies Frequencies Restricted Work Accident Frequency for the fleet
3 Business Unit Safety Performance Data
The safety performance data for the business units covers both operational data and health and safety. This isshown in 3-3/Table 2 “Safety Performance Data for the Business Units (BUs)”. Raw data can be normalizedusing 3-3/Table 4 “Normalizing Safety Performance Data”.

7/28/2019 Leading Indicators GN e
http://slidepdf.com/reader/full/leading-indicators-gn-e 35/78

7/28/2019 Leading Indicators GN e
http://slidepdf.com/reader/full/leading-indicators-gn-e 36/78
32 ABS GUIDANCE NOTES ON SAFETY CULTURE AND LEADING INDICATORS OF SAFETY . 2012
Section 4: Identifying Objective Leading Indicators
C H A P T E R 3 Leading Indicators of Safety
S E C T I O N 4 Identifying Objective Leading Indicators
1 Introduction
Objective leading indicators are identified by correlating safety metrics with safety performance data. Thisapproach is the preferred approach because it is objective, and it does not rely on survey responses whichare needed for the subjective leading indicators approach described in Chapter 3, Section 5, “IdentifyingSubjective Leading Indicators”.
The objective leading indicators program can be done at three levels:• The organization
• The business units (or other appropriate units such as offices, countries, regions)
• The fleet
The methods for each are described below, together with worked examples to aid understanding.
2 General Approach
The organization’s safety metrics are correlated with its safety performance data using the Spearman’s rhotest. Significant safety metrics are the organization’s leading indicators. Each safety metric belongs to a
safety factor grouping. Suggestions for improving safety factors in the organization are given in Chapter 4,Section 3, “Utilizing the Results”.
2.1 Safety Metrics• Choose safety metrics from the Core Metrics set and the Subsidiary set in Chapter 3, Section 2,
“Safety Metrics”.
• Baseline metrics are not suitable for a leading indicators exercise.
• Other metrics that the organization has collected may also be suitable; as the lists in Chapter 3, Section 2,“Safety Metrics”, are not exhaustive.
2.2 Safety Performance Data• Collect safety performance data. This is detailed in Chapter 3, Section 3, “Safety Performance Data”.
• The datasheets for data collection are presented in Appendix 4, “Safety Performance Datasheets”.
• Normalize all data as shown in Chapter 3, Section 3, “Safety Performance Data”.
• The safety metrics and safety performance data must cover the same time period.

7/28/2019 Leading Indicators GN e
http://slidepdf.com/reader/full/leading-indicators-gn-e 37/78
Chapter 3 Leading Indicators of SafetySection 4 Identifying Objective Leading Indicators 3-4
ABS GUIDANCE NOTES ON SAFETY CULTURE AND LEADING INDICATORS OF SAFETY . 2012 33
2.3 Correlating Safety Metrics with Safety Performance DataThe statistical testing is undertaken to ascertain which (if any) of the safety metrics are significantly correlatedwith the safety performance data. As the data does not come from a normal distribution, the non-parametricmeasure of statistical dependence between two variables (Spearman’s rank correlation coefficient) is used.
The steps of this test are outlined in 3-4/Table 1, “Instructions for Spearman’s Rho Correlation”.
TABLE 1Instructions for Spearman’s Rho Correlation
Step Instructions
1 Construct a table with two sets of categories (e.g., number of safety meetings andTRCF), and rank the order of each category in an adjacent column.
2 Subtract the ranks and enter the difference in the next column under d i (differences)
3 Square the differences (to eliminate negatives) and enter the products (values) in another
column under d i2 (squared differences)
4 Sum the squared differences (sum column 7)
5 Insert ∑d i2 (the value obtained from Step 4) and n (numbers of subjects) in the formula
provided to compute the coefficient.
ρ = 1 – ( )1
62
2
−
∑nn
d i
6 To determine if the rho coefficient is statistically significant compare the magnitude of rho versus the value obtained from the look-up table (3-4/Table 2). A worked example is
attached for n = 10.7 When the number of pairs ( n) is > 30, the look-up table cannot be used. This formula is
used instead:
ρ =1−
±
n
z
where the value of z corresponds to the standard normal confidence level. For example, if the confidence level is 95%, z will equal 1.96. If the obtained rho is larger than thecritical rho (in 3-4/Table 2), reject the null hypothesis and conclude that there is asignificant relationship between the two variables at the 95% confidence level. A workedexample is presented for n = 39.
2.4 Assessing SignificanceCompare the obtained value for rho with the value in the appropriate column, taking into account the number of paired scores. When n is not mentioned in the table, use the nearest smaller n (e.g., for 17, use 16).

7/28/2019 Leading Indicators GN e
http://slidepdf.com/reader/full/leading-indicators-gn-e 38/78
Chapter 3 Leading Indicators of SafetySection 4 Identifying Objective Leading Indicators 3-4
34 ABS GUIDANCE NOTES ON SAFETY CULTURE AND LEADING INDICATORS OF SAFETY . 2012
TABLE 2Critical Values of Spearman’s Rho (Two-Tailed)
Number of Pairs (n) 95% Confidence Level
5 1
6 0.8867 0.786
8 0.738
9 0.683
10 0.648
12 0.591
14 0.544
16 0.506
18 0.475
20 0.450
22 0.428
24 0.409
26 0.392
28 0.377
30 0.364
2.5 Delayed Effect VariationsIt is possible to try to ascertain if the introduction of an action or activity correlates with a decrease inaccidents or operational incidents, etc., in the following year. In this case, the Spearman’s rho rank correlationtest should be performed on each year’s safety metrics with the following year’s safety performance data. Aneven greater delayed effect can be investigated, for example two years’ delay, where the metrics and safety
performance data are available.
3 Worked Examples
3.1 Organizational Analysis Over TimeOrganizational analysis over time is the primary application of the Objective Leading Indicators Assessmentmethod.
3.1.1 Select Safety Culture Metrics Safety culture metrics to be analyzed were selected from the Core Metrics and Subsidiary Metricslists in Chapter 3, Section 2, “Safety Metrics”.
3.1.2 Collect Organizational Safety Performance Data Safety performance data for the organization was collected using the organizational safety performancedatasheet provided in Appendix 4, “Safety Performance Datasheets”. The data was normalized using3-3/Table 4, “Normalizing Safety Performance Data”. The metrics and safety performance datacovered the same timeframe.
3.1.3 Correlate Metrics with Safety Performance DataStep 1: Populate column 2 with the first metric: Number of safety management meetings; and
ranks in column 3.
Populate column 4 with the first safety performance data (3-3/Table 4): Total RecordableCase Frequency (TRCF) and ranks in column 5.
Step 2: Subtract the ranks (column 5 from column 3) and enter the difference in column 6 under d i (differences).

7/28/2019 Leading Indicators GN e
http://slidepdf.com/reader/full/leading-indicators-gn-e 39/78
Chapter 3 Leading Indicators of SafetySection 4 Identifying Objective Leading Indicators 3-4
ABS GUIDANCE NOTES ON SAFETY CULTURE AND LEADING INDICATORS OF SAFETY . 2012 35
Step 3: Square the differences (to eliminate negatives) and enter the products in column 7.
Step 4: Sum the squared differences (in column 7). Sum d i2 = 328
TABLE 3Correlation at the Organizational Level ( n =10, no ties)
Column 1 Column 2 Column 3 Column 4 Column 5 Column 6 Column 7
Date (i) No. of meetings Rank TRCF Rank d i d i2
2009 52 10 5.3 2 8 64
2008 50 9 5.2 1 8 64
2007 44 7 6.1 4 3 9
2006 47 8 6.0 3 5 25
2005 32 4 7.2 7 –3 9
2004 36 5 7.0 6 –1 1
2003 38 6 6.6 5 1 1
2002 25 2 7.7 9 –7 49
2001 26 3 7.4 8 –5 25
2000 22 1 7.8 10 –9 81
Total 328
Step 5: Insert the values for d i2 (328) and n (10) in the formula provided to compute the coefficient.
ρ = 1 – ( )1
62
2
−
∑nn
d i= 1 – ( )11010
32862 −
×
The resulting coefficient is –0.9879
Step 6: With a sample of size 10, the critical value (in 3-4/Table 2, “Critical Values of Spearman’sRho”) for rejecting the null hypothesis at the 0.05 level is 0.648. The obtained value for the Spearman rho is –0.9879. Ignore the sign and compare absolute values only. As ρ (0.9879) > ρ (0.648) reject the null hypothesis. That is, a significant (inverse) relationshipexists between these two variables; as one variable increases the other decreases.
Using the same safety metric, the statistical analysis is repeated with the rest of the safety performancedata. Once all of the safety performance data has been correlated with the first safety metric, thesecond safety metric is used, until all safety metrics have been tested with all safety performance data.
3.1.4 Worked Example ( n > 30)As stated in Step 7 of 3-4/Table 1, “Instructions for Spearman Rho Correlation”, when n > 30, aformula is used to compute the critical value to assess the statistical significance of the rhocoefficient. In this example, there are ties in the data, and n = 39.
Follow Steps 1 to 5 in the instructions in 3-4/Table 1, “Instructions for Spearman Rho Coefficient”.Using the formula ∑ d i
2 = 11254, the resulting coefficient = –0.13907.
Skip Step 6 and instead use the formula provided in Step 7 to compute the critical rho value.
For instance, for a level of confidence of 95%, z will = 1.96 and ρ =139
96.1−
= 0.31.
Since (calculated) < (critical value in 3-4/Table 2) the null hypothesis must be accepted. Thismeans that the two variables are not significantly related.
For additional critical values of level of confidence, please refer to 3-4/Table 5, “Critical Valuesfor Larger n (Spearman Rho Coefficient)”.

7/28/2019 Leading Indicators GN e
http://slidepdf.com/reader/full/leading-indicators-gn-e 40/78
Chapter 3 Leading Indicators of SafetySection 4 Identifying Objective Leading Indicators 3-4
36 ABS GUIDANCE NOTES ON SAFETY CULTURE AND LEADING INDICATORS OF SAFETY . 2012
TABLE 4Correlation at the Organization Level
Column 1 Column 2 Column 3 Column 4 Column 5 Column 6 Column 7
Date (i) No. of meetings Rank TRCF Rank d i d i2
2009 52 39 5.3 2 37 13692008 50 38 5.2 1 37 1369
2007 44 36 6.1 5.5 30.5 930.25
2006 47 37 6 3.5 33.5 1122.25
2005 32 26.5 7.2 17.5 9 81
2004 36 33.5 7 13 20.5 420.25
2003 38 35 6.6 9.5 25.5 650.25
2002 25 14 7.7 22 –8 64
2001 26 16.5 7.4 20.5 –4 16
2000 22 7 7.8 23 –16 256
1999 22 7 6 3.5 3.5 12.25
1998 21 4 6.1 5.5 –1.5 2.25
1997 20 2 6.2 7 –5 25
1996 18 1 6.4 8 –7 49
1995 23 10 6.6 9.5 0.5 0.25
1994 21 4 6.8 11 –7 49
1993 25 14 7 13 1 1
1992 30 21.5 7.1 15.5 6 36
1991 32 26.5 7.4 20.5 6 36
1990 31 23.5 7.3 19 4.5 20.25
1989 32 26.5 7.2 17.5 9 81
1988 33 29.5 7.1 15.5 14 1961987 34 31 7 13 18 324
1986 35 32 8 24.5 7.5 56.25
1985 36 33.5 8.1 26 7.5 56.25
1984 21 4 8.2 27.5 –23.5 552.25
1983 22 7 8.3 29.5 –22.5 506.25
1982 23 10 8.4 31.5 –21.5 462.25
1981 23 10 8.5 33.5 –23.5 552.25
1980 24 12 8.6 35 –23 529
1979 25 14 8.7 36 –22 484
1978 26 16.5 8 24.5 –8 64
1977 27 18 8.2 27.5 –9.5 90.251976 28 19 8.3 29.5 –10.5 110.25
1975 29 20 8.4 31.5 –11.5 132.25
1974 30 21.5 8.5 33.5 –12 144
1973 31 23.5 9 37 –13.5 182.25
1972 32 26.5 9.1 38 –11.5 132.25
1971 33 29.5 9.2 39 –9.5 90.25
Total 11254
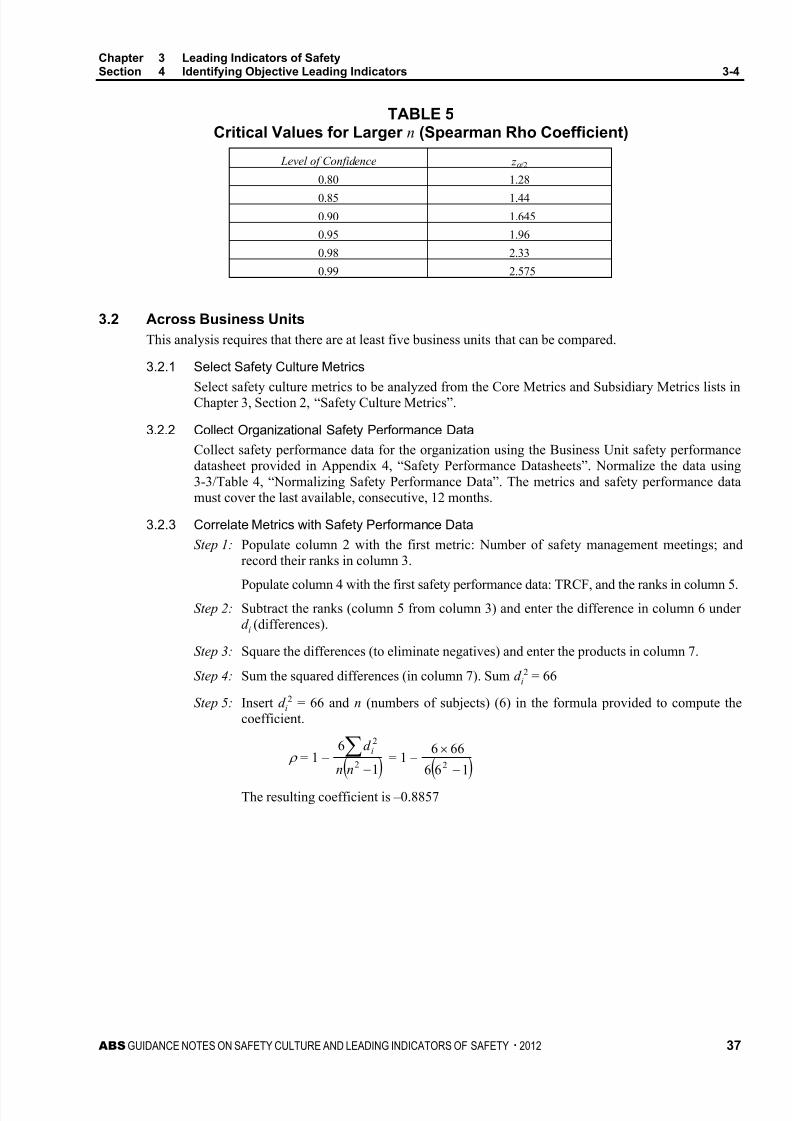
7/28/2019 Leading Indicators GN e
http://slidepdf.com/reader/full/leading-indicators-gn-e 41/78
Chapter 3 Leading Indicators of SafetySection 4 Identifying Objective Leading Indicators 3-4
ABS GUIDANCE NOTES ON SAFETY CULTURE AND LEADING INDICATORS OF SAFETY . 2012 37
TABLE 5Critical Values for Larger n (Spearman Rho Coefficient)
Level of Confidence z α /2
0.80 1.28
0.85 1.440.90 1.645
0.95 1.96
0.98 2.33
0.99 2.575
3.2 Across Business UnitsThis analysis requires that there are at least five business units that can be compared.
3.2.1 Select Safety Culture Metrics
Select safety culture metrics to be analyzed from the Core Metrics and Subsidiary Metrics lists inChapter 3, Section 2, “Safety Culture Metrics”.
3.2.2 Collect Organizational Safety Performance DataCollect safety performance data for the organization using the Business Unit safety performancedatasheet provided in Appendix 4, “Safety Performance Datasheets”. Normalize the data using3-3/Table 4, “Normalizing Safety Performance Data”. The metrics and safety performance datamust cover the last available, consecutive, 12 months.
3.2.3 Correlate Metrics with Safety Performance DataStep 1: Populate column 2 with the first metric: Number of safety management meetings; and
record their ranks in column 3.
Populate column 4 with the first safety performance data: TRCF, and the ranks in column 5.Step 2: Subtract the ranks (column 5 from column 3) and enter the difference in column 6 under
d i (differences).
Step 3: Square the differences (to eliminate negatives) and enter the products in column 7.
Step 4: Sum the squared differences (in column 7). Sum d i2 = 66
Step 5: Insert d i2 = 66 and n (numbers of subjects) (6) in the formula provided to compute the
coefficient.
ρ = 1 – ( )1
62
2
−
∑nn
d i= 1 – ( )166
6662 −
×
The resulting coefficient is –0.8857
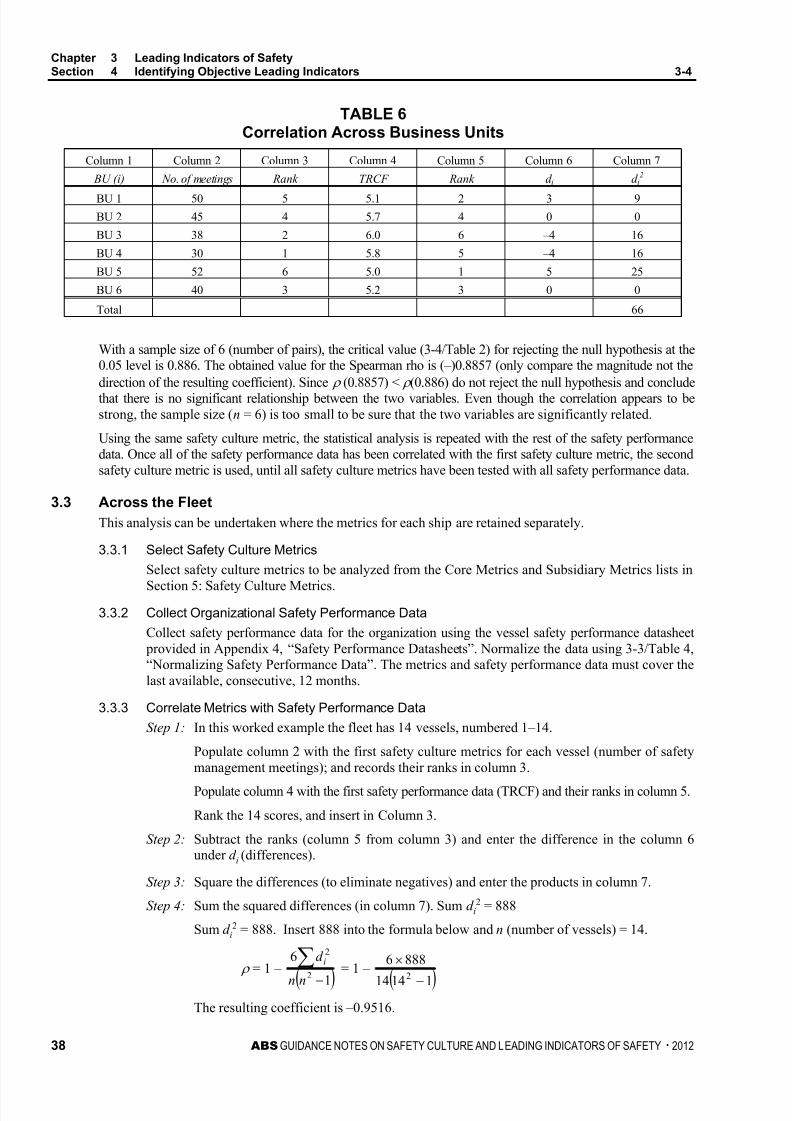
7/28/2019 Leading Indicators GN e
http://slidepdf.com/reader/full/leading-indicators-gn-e 42/78
Chapter 3 Leading Indicators of SafetySection 4 Identifying Objective Leading Indicators 3-4
38 ABS GUIDANCE NOTES ON SAFETY CULTURE AND LEADING INDICATORS OF SAFETY . 2012
TABLE 6Correlation Across Business Units
Column 1 Column 2 Column 3 Column 4 Column 5 Column 6 Column 7
BU (i) No. of meetings Rank TRCF Rank d i d i2
BU 1 50 5 5.1 2 3 9BU 2 45 4 5.7 4 0 0
BU 3 38 2 6.0 6 –4 16
BU 4 30 1 5.8 5 –4 16
BU 5 52 6 5.0 1 5 25
BU 6 40 3 5.2 3 0 0
Total 66
With a sample size of 6 (number of pairs), the critical value (3-4/Table 2) for rejecting the null hypothesis at the0.05 level is 0.886. The obtained value for the Spearman rho is (–)0.8857 (only compare the magnitude not thedirection of the resulting coefficient). Since ρ (0.8857) < ρ (0.886) do not reject the null hypothesis and concludethat there is no significant relationship between the two variables. Even though the correlation appears to bestrong, the sample size ( n = 6) is too small to be sure that the two variables are significantly related.
Using the same safety culture metric, the statistical analysis is repeated with the rest of the safety performancedata. Once all of the safety performance data has been correlated with the first safety culture metric, the secondsafety culture metric is used, until all safety culture metrics have been tested with all safety performance data.
3.3 Across the FleetThis analysis can be undertaken where the metrics for each ship are retained separately.
3.3.1 Select Safety Culture MetricsSelect safety culture metrics to be analyzed from the Core Metrics and Subsidiary Metrics lists in
Section 5: Safety Culture Metrics.3.3.2 Collect Organizational Safety Performance Data
Collect safety performance data for the organization using the vessel safety performance datasheet provided in Appendix 4, “Safety Performance Datasheets”. Normalize the data using 3-3/Table 4,“Normalizing Safety Performance Data”. The metrics and safety performance data must cover thelast available, consecutive, 12 months.
3.3.3 Correlate Metrics with Safety Performance DataStep 1: In this worked example the fleet has 14 vessels, numbered 1–14.
Populate column 2 with the first safety culture metrics for each vessel (number of safetymanagement meetings); and records their ranks in column 3.
Populate column 4 with the first safety performance data (TRCF) and their ranks in column 5.
Rank the 14 scores, and insert in Column 3.
Step 2: Subtract the ranks (column 5 from column 3) and enter the difference in the column 6under d i (differences).
Step 3: Square the differences (to eliminate negatives) and enter the products in column 7.
Step 4: Sum the squared differences (in column 7). Sum d i2 = 888
Sum d i2 = 888. Insert 888 into the formula below and n (number of vessels) = 14.
ρ = 1 –
( )1
62
2
−
∑nn
d i= 1 –
( )11414
88862
−
×
The resulting coefficient is –0.9516.

7/28/2019 Leading Indicators GN e
http://slidepdf.com/reader/full/leading-indicators-gn-e 43/78
Chapter 3 Leading Indicators of SafetySection 4 Identifying Objective Leading Indicators 3-4
ABS GUIDANCE NOTES ON SAFETY CULTURE AND LEADING INDICATORS OF SAFETY . 2012 39
TABLE 7Correlation Across the Fleet
Column 1 Column 2 Column 3 Column 4 Column 5 Column 6 Column 7
Vessel No. (i) No. of meetings Rank TRCF Rank d i d i2
1 21 3 5.0 11 -8 642 38 14 1.0 3 11 121
3 35 12 0.75 2 10 100
4 20 2 6.5 14 -12 144
5 36 13 0.5 1 12 144
6 18 1 6.0 13 -12 144
7 29 8 4.0 9 -1 1
8 32 10 1.5 4 6 36
9 22 4 5.5 12 -8 64
10 28 7 3.0 7 0 0
11 25 5 3.5 8 -3 9
12 33 11 2.0 5 6 36
13 26 6 4.5 10 -4 16
14 31 9 2.5 6 3 9
Total 888
3-4/Table 2 shows that the critical value for rejecting the null hypothesis for a sample size of 14 is 0.544.The obtained value for the Spearman rho is (–)0.9516. Ignore the minus sign as it is the magnitude not thedirection that is of interest here. As 0.9516 > 0.544, reject the null hypothesis. This means that a significantrelationship exists between these two variables. The minus sign means that the relationship is inverse, so asthe number of safety meetings increases, the number of TRCF decreases.
Using the same safety metric, the statistical analysis is repeated with the rest of the safety performancedata. Once all of the safety performance data has been correlated with the first safety metric, the secondsafety culture metric is used, until all safety metrics have been tested with all safety performance data.

7/28/2019 Leading Indicators GN e
http://slidepdf.com/reader/full/leading-indicators-gn-e 44/78
40 ABS GUIDANCE NOTES ON SAFETY CULTURE AND LEADING INDICATORS OF SAFETY . 2012
Section 5: Identifying Subjective Leading Indicators
C H A P T E R 3 Leading Indicators of Safety
S E C T I O N 5 Identifying Subjective Leading Indicators
1 Introduction
Subjective leading indicators are identified by correlating survey responses with safety performance datafor the last twelve months. This Section details the method and a worked example to aid comprehension.
This method can be undertaken if the organization does not have sufficient safety metrics to look for objective leading indicators. The identification of objective leading indicators is the preferred approach.
The subjective leading indicators approach is more speculative and so should only be undertaken followinga survey, with the responses readily available. This approach does offer the possibility of identifying newmetrics for the organization to collect.
2 Method
2.1 Average the Responses for Each VesselFind the arithmetic mean for the responses to the statements. Do this for all of the forty statements, for each and every vessel. Treat missing responses as “don’t know” for up to 5% of the total responses. Wheremissing responses comprise more than 5% of the responses, exclude that individual’s response for thatquestion from the analysis.
2.2 Prepare the Safety Performance Data At the same time, collect the safety performance data. One year’s data is required. This should be the mostrecent data available, preferably for the last twelve months, averaged to yield a single annual figure. Usethe safety performance datasheet for Vessels. The safety performance sheet is in Appendix 4, “SafetyPerformance Datasheets”. All data should be normalized as shown in 3-3/Table 4, “Safety PerformanceData”.
2.3 Correlate the Responses and Safety Performance Data Once all of the safety culture responses and safety performance data are prepared, the statistical analysiscan begin. The data does not come from a normal distribution, so the non-parametric test Spearman’s rhofor ranked correlations is used. The steps used for the correlation are the same as those shown in 3-4/Table 1,
“Instructions for Spearman’s Rho Correlation”.Spearman correlation analysis should be performed for each averaged vessel safety culture question responsewith each variable of the collected safety performance data.
3 Worked Example
The crews aboard a fleet of 14 vessels were given the safety culture questionnaire. In principle, this is howthe results would be analyzed. In practice, this labor-intensive exercise would be undertaken with the aid of electronic tools.

7/28/2019 Leading Indicators GN e
http://slidepdf.com/reader/full/leading-indicators-gn-e 45/78
Chapter 3 Leading Indicators of SafetySection 5 Identifying Subjective Leading Indicators 3-5
ABS GUIDANCE NOTES ON SAFETY CULTURE AND LEADING INDICATORS OF SAFETY . 2012 41
3.1 Average the Responses for Each VesselStep 1: Construct a table as shown in 3-5/Table 2, “Subjective Indicators’ Example”.
Populate column 2 with the average (arithmetic mean) of the responses to the first statement. Letus assume that the results for Vessel No. 13 are returned first. Vessel No. 13 has a crew of 20(who all completed the survey) so there are 20 responses to Statement No. 1:“When ship management is told about accidents, incidents or near misses, corrective action is taken
promptly.”
These 20 responses are shown on the 5-point Likert Scale in 3-5/Table 1, “Likert Scale”. Note thevalue of the ratings for each category, shown in brackets in the top row. In this example:
• 1 crew member disagreed with the statement
• 5 crew members slightly disagreed with the statement
• 3 crew members were neutral about the statement
• 7 crew members slightly agreed with the statement
• 4 crew members agreed with the statement, and
• None of the crew chose “don’t know”
TABLE 1Likert Scale
Disagree(1)
Slightly Disagree (2)
Neutral (3)
Slightly Agree (4)
Agree(5)
Don’t Know(0)
Row 1 1 5 3 7 4 0
Row 2 1 10 9 28 20 0
Row 1 shows the ratings given by the 20 crew members.
Row 2 shows those ratings multiplied by the value of their position on the Likert scale (1 × 1; 5 × 2;3 × 3; 7 × 4; 4 × 5).
The arithmetic mean is found by adding the scores in Row 2 (1 + 10 + 9 + 28 + 20) = 68, anddividing by the number of crew members (20). Mean = 3.4
Insert those results in the 2 nd column of the table below, for Vessel No. 13. Find the arithmeticmean for statement No. 1 for the rest of the fleet and finish populating Column 2.
Rank the 14 scores, and insert in Column 3. The ranking used here runs from low to high. Either rankings (low-to-high or high-to-low) can be used, but whichever way is chosen must be appliedequally to both variables.
At the same time, collect the safety performance data for the most recent twelve months. Use thesafety performance datasheet for Vessels. Average the twelve month’s data to give one annual figurefor each entry. Normalize the data using 3-3/Table 4, “Normalizing Safety Performance Data”.
Start the analysis with (normalized) Total Recordable Case Frequency (TRCF) for the previous 12months. Insert those results in column 4, and their ranks in column 5.
Step 2: Subtract the ranks (column 3 – column 5) and enter the difference in column 6 under d i (differences).
Step 3: Square the differences (to remove negative numbers) and enter the products in d i2 (column 7).
Step 4: Sum the squared differences (in column 7). Sum d i2= 888.

7/28/2019 Leading Indicators GN e
http://slidepdf.com/reader/full/leading-indicators-gn-e 46/78
Chapter 3 Leading Indicators of SafetySection 5 Identifying Subjective Leading Indicators 3-5
42 ABS GUIDANCE NOTES ON SAFETY CULTURE AND LEADING INDICATORS OF SAFETY . 2012
TABLE 2Subjective Leading Indicators Example
Column 1 Column 2 Column 3 Column 4 Column 5 Column 6 Column 7
Vessel No. (i) 1 st Statement Rank TRCF Rank d i d i 2
1 3.25 3 5.0 11 –8 642 3.90 14 1.0 3 11 121
3 3.70 12 0.75 2 10 100
4 3.20 2 6.5 14 –12 144
5 3.80 13 0.5 1 12 144
6 3.15 1 6.0 13 –12 144
7 3.50 8 4.0 9 –1 1
8 3.60 10 1.5 4 6 36
9 3.30 4 5.5 12 –8 64
10 3.45 7 3.0 7 0 0
11 3.35 5 3.5 8 –3 9
12 3.65 11 2.0 5 6 36
13 3.40 6 4.5 10 –4 16
14 3.55 9 2.5 6 3 9
Total 888
Insert 888 (for d i2) and 14 (for n, number of vessels) into the formula below.
ρ = 1 – ( )1
62
2
−
∑nn
d i= 1 – ( )11414
88862 −
×
The resulting coefficient is –0.9516.
With a sample of size of 14, the critical value for rejecting the null hypothesis at the 0.05 level is 0.544. Theobtained value for the Spearman rho is (–)0.9516 (compare only the magnitude not the direction of resultingcoefficient). As 0.9516 > 0.544 reject the null hypothesis. That is, a significant (inverse) relationship betweenthese two variables. This means that as the belief that corrective action is taken promptly when shipmanagement is told about accidents, incidents or near misses, increases so the TRCF decreases for thoseships.
Staying with Question 1 on the safety culture survey, this exercise is repeated with the next safety performanceresults (e.g., accidents), (i.e., delete the entries in columns 4-7 and populate the accident data, ranks,differences and sum of differences). Use the formula to find the coefficient.
When all of the safety performance results have been correlated with Question 1 on the safety culture survey,repeat all of this analysis on Statement No. 2 of the safety culture survey. Repeat with the rest of thestatements until all forty statements on the safety culture survey have been analyzed. This labor-intensiveexercise is greatly facilitated by the use of a statistics package.

7/28/2019 Leading Indicators GN e
http://slidepdf.com/reader/full/leading-indicators-gn-e 47/78
ABS GUIDANCE NOTES ON SAFETY CULTURE AND LEADING INDICATORS OF SAFETY . 2012 43
Chapter 4: Next Step
C H A P T E R 4 Next Step
CONTENTS
SECTION 1 Interpreting the Results .................... ...................... ...................... ....... 45 1 Introduction ....................................................................................... 45
2 Interpreting the Safety Culture Results............................................. 45
3 Interpreting the Leading Indicators Results ...................................... 45
SECTION 2 Presenting the Findings .................... ..................... ..................... ........ 47 1 Introduction ....................................................................................... 47
2 Presentation Formats........................................................................ 47 2.1 Pie Charts............................................................. ......................... 47
2.2 Bar Charts ........................................................... .......................... 48
2.3 Interval Plots............................................. ..................................... 48
2.4 Line Graphs.............. ................................................................ ..... 49
FIGURE 1 Example of a Pie Chart (LOcation on Ship)............................ 47
FIGURE 2 Example of a Bar Chart (Job Position) ................................... 48
FIGURE 3 Example of Interval Plots (Shipboard vs. ShoresideResponses)............................................................................. 48
FIGURE 4 Example of a Line Graph (Showing Leading Indicator Findings) ................................................................................. 49
SECTION 3 Utilizing the Findings .................. ..................... ..................... ............... 50 1 Introduction ....................................................................................... 50
2 Action Plan........................................................................................ 50
3 Communication ................................................................................. 51 3.1 Desired Activities, Attitudes, and Behaviors .................................. 51
3.2 Possible Activities for Improvement............................................... 51
4 Empowerment................................................................................... 52 4.1 Desired Activities, Attitudes, and Behaviors .................................. 52
4.2 Possible Activities for Improvement............................................... 52
5 Feedback .......................................................................................... 52 5.1 Desired Activities, Attitudes, and Behaviors .................................. 52
5.2 Possible Activities for Improvement............................................... 52
6 Mutual Trust ...................................................................................... 53 6.1 Desired Activities, Attitudes, and Behaviors .................................. 53
6.2 Possible Activities for Improvement............................................... 53
7 Problem Identification ....................................................................... 54 7.1 Desired Activities, Attitudes, and Behaviors .................................. 54
7.2 Possible Activities for Improvement............................................... 54

7/28/2019 Leading Indicators GN e
http://slidepdf.com/reader/full/leading-indicators-gn-e 48/78
44 ABS GUIDANCE NOTES ON SAFETY CULTURE AND LEADING INDICATORS OF SAFETY . 2012
8 Promotion of Safety .......................................................................... 54 8.1 Desired Activities, Attitudes, and Behaviors .................................. 54
8.2 Possible Activities for Improvement..................... .......................... 54
9 Responsiveness................................................................................ 55
9.1 Desired Activities, Attitudes, and Behaviors .................................. 55 9.2 Possible Activities for Improvement..................... .......................... 55
10 Safety Awareness ............................................................................. 55 10.1 Desired Activities, Attitudes, and Behaviors .................................. 55
10.2 Possible Activities for Improvement.................... ........................... 56

7/28/2019 Leading Indicators GN e
http://slidepdf.com/reader/full/leading-indicators-gn-e 49/78
ABS GUIDANCE NOTES ON SAFETY CULTURE AND LEADING INDICATORS OF SAFETY . 2012 45
Section 1: Interpreting the Results
C H A P T E R 4 Next Step
S E C T I O N 1 Interpreting the Results
1 Introduction
This Section discusses how to interpret the significance of the results obtained for both the safety culturesurvey and the leading indicators analysis. Statistical hypothesis testing is stated in terms of the null hypothesis.
The null hypothesis for a test of difference (here the Mann Whitney U Test) is that there is no difference between the two groups being investigated. If the null hypothesis is disproved, then there is a significant
difference between the two groups. The groups under investigation are any of the demographic factors listedin 2-3/2.1.
The null hypothesis for a test of correlation (here the Spearman’s rho Test) is that the two groups beinginvestigated are not correlated. If the null hypothesis is disproved, then there is a statistically significantcorrelation between the two groups.
In the case of the Objective Leading Indicators, the two groups are safety metrics and safety performance data.
In the case of the Subjective Leading Indicators, the two groups are responses on the safety culture surveyaveraged for each vessel, and each vessel’s safety performance data for the previous twelve months.
2 Interpreting the Safety Culture Results
In the safety culture survey, the responses of various demographic groups are subjected to statistical analysisto see if they are significantly different. The null hypothesis is that the groups’ responses are similar and anydifferences are due to chance.
Since the data is non-normal, a non-parametric test known as Mann-Whitney test has been used to analyzethe safety culture data. Considering a two-tailed test with a 95% confidence level, the obtained value of z has been compared with the tabulated value. The null hypothesis is accepted when the obtained z is larger than the value of z in the normal distribution table, and it is rejected when the obtained value of z is smaller than the tabulated value.
3 Interpreting the Leading Indicators Results
The purpose of a correlation test is to determine if the ordering of the two columns of data (safety metricsor safety culture responses to safety performance data) is significant. The null hypothesis states that thereis no significant association of the ordering.
The test used is the Spearman’s rho test as the data is non-parametric. The sign of the Spearman correlationindicates the direction of association between X (the independent variable) and Y (the dependent variable).If Y tends to increase when X increases, the Spearman correlation coefficient is positive. If Y tends to decreasewhen X increases, the Spearman correlation coefficient is inverse.
A Spearman correlation of zero indicates that there is no tendency for Y to either increase or decrease when X increases. The Spearman correlation increases in magnitude as X and Y become closer to being perfectlycorrelated. When X and Y are perfectly correlated, the Spearman correlation coefficient becomes 1 for a perfect
positive correlation and –1 for a perfect inverse correlation.

7/28/2019 Leading Indicators GN e
http://slidepdf.com/reader/full/leading-indicators-gn-e 50/78
Chapter 4 Next StepSection 1 Interpreting the Results 4-1
46 ABS GUIDANCE NOTES ON SAFETY CULTURE AND LEADING INDICATORS OF SAFETY . 2012
An inverse correlation is usually meaningful in this analysis as it indicates that the intervention (denoted bythe metric) has a beneficial effect on safety performance data (accidents, incidents, etc.) as the interventionincreases, so the accidents, incidents, etc., decrease.
A graphic example of this may be found in 4-2/Figure 4, “Example of Line Graph (Showing Leading Indicator Finding)”.
However, occasionally a positive relationship between the two variables may be beneficial. For example,increased near miss reporting may indicate increased safety awareness and increased reporting.
As a rule of thumb, the following guidelines on strength of relationship may be useful for deciding whichresults warrant attention.
Strength of Relationship Value of r (positive)
Value of r (inverse)
Strong 1.0 to 0.5 –1.0 to –0.5
Moderate 0.5 to 0.3 –0.5 to –0.3
Weak 0.3 to 0.1 –0.3 to –0.1
None 0.1 –0.1

7/28/2019 Leading Indicators GN e
http://slidepdf.com/reader/full/leading-indicators-gn-e 51/78
ABS GUIDANCE NOTES ON SAFETY CULTURE AND LEADING INDICATORS OF SAFETY . 2012 47
Section 2: Presenting the Findings
C H A P T E R 4 Next Step
S E C T I O N 2 Presenting the Findings
1 Introduction
Presenting the findings from both the safety culture and the leading indicators analyses can be done in a varietyof formats. The report or presentation should include:
i) Summary information (outlining what was done, where, number of participants, response ratio, etc.)
ii) An overview of the results
iii) Statistically significant findings
iv) The implications of the results, especially any unexpected or unusual findings.
2 Presentation Formats
Detailed results should be shown in a variety of formats (e.g., bar charts, pie charts, tables, interval plots,graphs) to maintain interest and to facilitate the communication of a large volume of data.
2.1 Pie Charts This is a good way to show demographic data where there are a small number of groups.
FIGURE 1Example of a Pie Chart (Location on Ship)
5 8 1 7 / 6 3 %
3 7 %
4 4 6 / 6 3 %4.73%
58.27%
37.00%
Location on Ship
Deck
Engine
Galley

7/28/2019 Leading Indicators GN e
http://slidepdf.com/reader/full/leading-indicators-gn-e 52/78
Chapter 4 Next StepSection 2 Presenting the Findings 4-2
48 ABS GUIDANCE NOTES ON SAFETY CULTURE AND LEADING INDICATORS OF SAFETY . 2012
2.2 Bar Charts FIGURE 2
Example of a Bar Chart (Job Position)
Collapsed Job Positions - Sh ipboard
12%
4%
16%
12%
21%
1%
5%
12%
10%
1%
2%
4%
0.00%
5.00%
10.00%
15.00%
20.00%
25.00%
A / B C o o k s
E n g i n e e
r M a s
t e r O f f i
c e r
S t e w a r
d s R a t
i n g C a d e t
R e p a i r G P x M o x O t h
e r
2.3 Interval Plots Interval plots are useful for showing the strength of association between two or more variables, and indicatingwhich group responded more positively (or negatively).
FIGURE 3Example of Interval Plots (Shipboard vs. Shoreside Responses)
Disagree
Slightly Disagree
Neutral
Slightly Agree
Agree
Q 3
Shipboard Shoreside
Shipboard vs. Shoreside
4.22
3.07
Interval Plot for Shipboard vs. Shoreside95% CI for the Mean
Questions Q3P-Value 0
Shoreside managers never put schedule or costs above safety (POS)

7/28/2019 Leading Indicators GN e
http://slidepdf.com/reader/full/leading-indicators-gn-e 53/78
Chapter 4 Next StepSection 2 Presenting the Findings 4-2
ABS GUIDANCE NOTES ON SAFETY CULTURE AND LEADING INDICATORS OF SAFETY . 2012 49
2.4 Line Graphs Line graphs are particularly useful for presenting Leading Indicator results (i.e., safety metrics vs. safety
performance data). They can show increasing and decreasing trends of safety metrics versus safety performancedata on the same graph.
Although line graphs are visually explicit, they can be difficult to read. For example, in Section 4, Figure 4, itis important to associate the line with the square marker (number of safety management meetings) with they-axis on the left of the graph, and the line with the diamond marker (restricted work accident frequency)with the y-axis on the right of the graph.
FIGURE 4Example of a Line Graph (Showing Leading Indicator Findings)
2003 20082007200620052004Year
1800
1600
1400
1200
1000
800
600
400
200
5
4.5
4
3.5
3
2.5
2
1.5
1
Number of SafetyManagement Meetings
Restricted Work Accident Frequency
M e a s u r e s
Number of Safety Management Meetings and Restricted Work AccidentFrequency Correlation (2003 - 2008)
The line graph in Section 4, Figure 4 shows that as the number of safety management meetings increasedfrom over 200 in 2003 to over 1,600 in 2008, the restricted work accident frequency dropped fromapproximately 4.7 in 2003 to approximately 1.7 in 2008.

7/28/2019 Leading Indicators GN e
http://slidepdf.com/reader/full/leading-indicators-gn-e 54/78
50 ABS GUIDANCE NOTES ON SAFETY CULTURE AND LEADING INDICATORS OF SAFETY . 2012
Section 3: Utilizing the Findings
C H A P T E R 4 Next Step
S E C T I O N 3 Utilizing the Findings
1 Introduction
This Section of these Guidance Notes provides guidance on how to use the results of the safety culturesurvey or the leading indicators assessment. The value of either exercise cannot be fully realized until theresults are incorporated into the organization’s continual improvement program.
2 Action PlanThe following steps should be taken to benefit from a safety culture survey or leading indicators assessment:
i) Study the findings, and note the safety factors (categories of statements or metrics) that need to beaddressed. The safety factors for the questionnaire statements are shown in Appendix 3,“Questionnaires and Safety Factors”. The safety factors for the metrics are shown in 3-2/Table 2,“Safety Factors and Subsidiary Metrics” and 3-2/Table 3, “Safety Factors and Core Metrics”.
ii) Look at the appropriate safety factor detailed in this Section which contains desired activities,attitudes, and behaviors as well as possible activities for improvement.
iii) Consider if the findings (i.e., significant questions in the safety culture survey, or leading indicators)could relate to a different safety factor, as there is some overlap. In that case, consider the desired
activities, attitudes, and behaviors and possible activities for improvement for that safety factor too.iv) Communicate the results to the workforce. Feedback should include strengths as well as areas of
weakness. This can be done in a variety of ways (e.g., written reports, team briefings).
v) Let the workforce know how weak areas will be addressed and monitored. This feedback is importantfor buy-in to safety culture improvement.
vi) Prioritize the opportunities for improvement. Initially identify three to five key areas to focus onand develop an action plan.
vii) Consider how those key areas align with other initiatives/needs. Focus on strategies that may addressmore than one area or need.
viii) Consider if there are areas that are drivers of the safety culture practices in your organization (e.g.,
leadership, feedback, communication openness, safety awareness, and training).ix) Engage key shipboard personnel (front-line personnel) in the planning and the trialing of process
changes. Action plan development and implementation are typically more successful if these personnelare able to be included.
x) Keep all personnel informed of next steps and progress. They were asked for their input – let themknow what is being done with it, or next time they may not participate or trust that managementtakes safety culture practices seriously.
xi) Celebrate success, and look for continuous input on challenges. Open communication is one of thecornerstones of safety culture. Use your response and actions relating to survey results to modelthe behavior you are seeking in your personnel.
xii) Track changes for continual improvement efforts.

7/28/2019 Leading Indicators GN e
http://slidepdf.com/reader/full/leading-indicators-gn-e 55/78
Chapter 4 Next StepSection 3 Utilizing the Findings 4-3
ABS GUIDANCE NOTES ON SAFETY CULTURE AND LEADING INDICATORS OF SAFETY . 2012 51
The desired activities, attitudes and behaviors and possible activities for improvement for each safetyfactor are described in this Section. It should be noted that this is not an exhaustive list, but is presented tohelp stimulate discussion of ideas.
Once the findings have been presented to senior management, staff and participants, an action plan needsto be developed in line with organization’s business plan, vision, and mission. This action plan should include:
• Action items
• Established responsibilities
• Completion dates
• Unambiguous milestones that are attainable
Within three years, a follow-up safety culture assessment should be performed to measure improvement.
3 Communication
3.1 Desired Activities, Attitudes, and Behaviors i) Managers and masters listen as well as speak.
ii) All of the workforce (both crew and shoreside staff) are provided with all necessary information todo their jobs safely.
3.2 Possible Activities for Improvement • Increase the number of mechanisms for communicating safety to employees (e.g., newsletters, toolbox
talks, meetings, training, incident findings).
• Increase safety training (including printed formats) in native languages.
• Provide a mechanism for anonymous input to management so that those fearful of reprisal have analternate communication pathway.
• Emphasize the importance of, and management’s expectations for, timely and effective communicationthroughout the chain of command.
• Provide positive public reinforcement of communications – even the “bad news”. Do not shoot themessenger.
• Provide communications training to everyone.
• Create newsletters and other modes of management communication.
• Include safety messages in periodic newsletters or other communications.
• Provide access to internet sites that have regulatory activity that affects the organization.
• Disseminate relevant information from Masters’ and management reviews which indicate continuanceor change of direction in policies and/or procedures.
• Increase safety and/or information meeting frequency and effectiveness.
• Distribute summaries of external incidents and communicate how the lessons learned from them mightapply locally.
• Disseminate organizational policies for quality, health, safety, and environment (QHSE).
• Disseminate bulletins throughout the organization regarding lessons learned or alerts regarding incidentsthat could have fleet-wide application.

7/28/2019 Leading Indicators GN e
http://slidepdf.com/reader/full/leading-indicators-gn-e 56/78
Chapter 4 Next StepSection 3 Utilizing the Findings 4-3
52 ABS GUIDANCE NOTES ON SAFETY CULTURE AND LEADING INDICATORS OF SAFETY . 2012
4 Empowerment
4.1 Desired Activities, Attitudes, and Behaviors i) Every employee has the authority and responsibility to terminate a task or activity if there are
legitimate safety concerns.
ii) All crew feel able to voice concerns and to make suggestions to improve safety.
iii) Every employee tries to improve safety.
4.2 Possible Activities for Improvement• Check that all employees know how to voice concerns, whether proactively as an opportunity for
improvement or reactively as notice of deficiency.
• Solicit workforce opinions on effective communication means and frequency.
• Check that employees have the resources necessary to satisfy safety responsibilities.
• Clearly define accountability for safety systems.
• Celebrate employee safety decision/action successes.
• Institute an off-the-job safety program.
• Promote highlighting of employee safety concerns through formal and non-traditional means.
• See that employee safety concerns and suggestions are resolved in a credible, timely fashion.
• Establish safety committees that include a vertical slice of the organization.
• Establish clear, documented accountabilities for safety.
• Create an anonymous safety issue reporting system.
5 Feedback
5.1 Desired Activities, Attitudes, and Behaviors i) The workforce is informed of outcomes of incident investigations, audits, etc., in a timely manner.
ii) Mismatches between practices and procedures (or standards) are quickly resolved to preventnormalization of deviance.
iii) Employee concerns are resolved quickly.
5.2 Possible Activities for Improvement• Implement an employee suggestion/feedback program.
• Increase the number of mechanisms by which safety is communicated to employees and encouragetheir usage.
• Increase the percentage of employees who have their performance appraised annually.
• Establish a feedback system to crews on safety audits, issues, and concerns.
• Encourage suggestions from employees for improvements through the corrective/preventative actionsystem, with corresponding follow-up for effectiveness once decisions are made and plans implemented.
• Establish and communicate a policy from the top management to all levels of the organization that it isacceptable and encouraged that people appropriately question safety issues.
• Discuss QHSE policies, objectives, and progress made during QHSE meetings.
• Communicate lessons learned from internal and external audits.

7/28/2019 Leading Indicators GN e
http://slidepdf.com/reader/full/leading-indicators-gn-e 57/78
Chapter 4 Next StepSection 3 Utilizing the Findings 4-3
ABS GUIDANCE NOTES ON SAFETY CULTURE AND LEADING INDICATORS OF SAFETY . 2012 53
• Provide frequent status updates on lengthy projects that are important to employees, so they are awareof progress.
• Implement periodic employee opinion/attitude surveys to identify any concerns not making their waythrough normal channels.
6 Mutual Trust
6.1 Desired Activities, Attitudes, and Behaviors i) There is a good understanding of individual and crew responsibility for safety.
ii) Relationships are characterized by respect.
iii) Employees trust managers to “do the right thing” in support of safety.
iv) Managers trust employees to shoulder their share of responsibility for performance, and to report potential problems and concerns.
v) Peers trust the motivations and behaviors of peers.
vi) Employees have confidence that a just system exists where honest errors can be reported withoutfear of reprisals.
6.2 Possible Activities for Improvement • Document policies that prevent unethical behavior throughout the organization.
• Establish a training program and targets for ethics training.
• Communicate the need/expectation for reporting all incidents and near misses.
• Institute a blameless system for incident investigation, unless willful policy or procedure violationsoccurred.
•
Establish a system that provides fair, consistent treatment of parties involved in incidents.• Enforce the expectation that the workforce will be dealt with even-handedly.
• Document hiring policy and procedures, and implement them.
• Institute an internship training program.
• Initiate an interviewer training program.
• Provide attractive terms and conditions.
• Provide training matrices to persons involved in new-hires or in transfers of crew between ships toshow adequate competency.
• Adopt an employee-driven behavior-based safety program including peer observations.
• Provide appropriate accommodation for different faiths and customs.
• Provide all procedures in native language of the crew members (as well as English).
• See that management response to acceptable and unacceptable safety performance is timely, consistent,and fair.

7/28/2019 Leading Indicators GN e
http://slidepdf.com/reader/full/leading-indicators-gn-e 58/78
Chapter 4 Next StepSection 3 Utilizing the Findings 4-3
54 ABS GUIDANCE NOTES ON SAFETY CULTURE AND LEADING INDICATORS OF SAFETY . 2012
7 Problem Identification
7.1 Desired Activities, Attitudes, and Behaviors i) All parts of the organization are vigilant for indications of weakness in the system that could lead
to significant safety events.
ii) Avoidance of complacency – there are constant efforts to avoid the complacency that could accompanygood safety records.
iii) The organization always places the burden of proof on determining that activities are safe rather than unsafe.
7.2 Possible Activities for Improvement • Provide safety checklists for all jobs.
• Provide safety procedures, instructions or rules for all jobs.
• Provide policy/procedures for reporting unsafe conditions – and encourage their usage.
• Set targets for the number of jobs with hazard assessments.• Set targets for the number of hazard analysis techniques utilized.
• Set targets for the number of safety inspections.
• Set targets for the number of corrective action reports originating from audits.
• Set targets for the percentage of incident reports which have causal analysis.
• Investigate and communicate lessons learned from recent accidents and incidents.
• Provide hazard/risk awareness training.
• Provide causal factor training to all employees.
• Modify the incident investigation system to more fully address “what could have happened” (potentialconsequences) instead of only the actual incident consequences.
8 Promotion of Safety
8.1 Desired Activities, Attitudes, and Behaviorsi) Develop a vision statement for safety culture.
ii) Establish a continual improvement program as a core value, and a campaign to communicate it toall levels of the organization.
iii) Visible, active, consistent support for safety programs from all levels of management through
communications, actions, priorities, provision of resources, etc.iv) Management commitment to doing what is right is demonstrated through decisions and actions.
v) Openness, honesty, firmness, and flexibility are qualities of the management team.
8.2 Possible Activities for Improvement • Increase the annual safety budget so that there are sufficient resources for safety systems.
• Provide onboard or in-service training for all employees.
• Set new targets and controls for prompt closure of corrective action reports.
• Set new targets and controls for the number of safety audit recommendations closed out in time.
• Increase number of safety meetings senior management must attend.

7/28/2019 Leading Indicators GN e
http://slidepdf.com/reader/full/leading-indicators-gn-e 59/78
Chapter 4 Next StepSection 3 Utilizing the Findings 4-3
ABS GUIDANCE NOTES ON SAFETY CULTURE AND LEADING INDICATORS OF SAFETY . 2012 55
• Increase targets for the frequency of safety management meetings.
• Set new targets for time to implement action on complaints or suggestions.
• Set new targets for employee attendance at safety meetings.
• Set new targets for increasing the percentage of new hires put through an induction training programthat meets the requirements of the STCW code.
• Set good quality safety goals that are measurable.
• Improve the method of how incident investigation findings are made available to employees.
• Establish procedures to identify and impart any training required in support of safety management systems.
• Institute periodic safety culture evaluations.
• Highlight safety culture as an evaluation area in audits, incident investigations, etc. Look for and correctcausal factors of incidents and safety performance problems.
• Hold regular safety management reviews.
• Establish annual safety objectives/goals throughout the organization.• Implement a policy of zero tolerance for willful violation of safety policies and procedures.
• Effectively communicate expectations by training employees in safety policies and procedures.
• Make safety performance and safety culture a part of every worker’s performance evaluation.
9 Responsiveness
9.1 Desired Activities, Attitudes, and Behaviors i) Adequate and timely actions are taken in response to unexpected situations in order to prevent
potential hazard consequences and to preserve safety.
9.2 Possible Activities for Improvement • Check that all crew have PPE.
• Improve training for emergency procedures.
• Establish a system for ensuring that crew’s time off-duty is observed.
• Determine a performance standard on action item completion.
• Do a survey of all safety-related action items to determine their status and due dates.
• Create metrics to measure the organization’s performance regarding the resolution of safety concerns,recommendations, lessons learned, and audit findings. Monitor these metrics during regular managementreviews.
10 Safety Awareness
10.1 Desired Activities, Attitudes and Behaviors i) All members of the workforce exhibit a high standard of safety performance.
ii) The workforce will not tolerate willful violation of safety standards, rules or procedures.
iii) Watch-handovers are careful and unhurried.

7/28/2019 Leading Indicators GN e
http://slidepdf.com/reader/full/leading-indicators-gn-e 60/78
Chapter 4 Next StepSection 3 Utilizing the Findings 4-3
56 ABS GUIDANCE NOTES ON SAFETY CULTURE AND LEADING INDICATORS OF SAFETY . 2012
10.2 Possible Activities for Improvement • Establish effective and efficient procedures for ship and watch hand-overs.
• Establish a training program for safety awareness.
• Establish a training program and targets for safety investigation.
• Provide training matrices to persons involved in new-hires or in transfers of personnel between shipsto show adequate competency.
• Provide training in analysis of job tasks and associated hazards, including hazards affecting quality,(e.g., using cranes with wires that are beyond their useful life for cargo movements wherein a loadcould be dropped and cargo subsequently damaged or destroyed).
• Provide awareness training on workplace hazards/risks and accident statistics.
• Set targets for number of near misses reported per employee.

7/28/2019 Leading Indicators GN e
http://slidepdf.com/reader/full/leading-indicators-gn-e 61/78
ABS GUIDANCE NOTES ON SAFETY CULTURE AND LEADING INDICATORS OF SAFETY . 2012 57
Appendix 1: Shipboard Safety Culture Questionnaire
A P P E N D I X 1 Shipboard Safety Culture Questionnaire
Please indicate the extent to which you agree with the following statements by choosing a number from thescale below. If you don’t know please choose ‘0’.
Disagree SlightlyDisagree
Neutral SlightlyAgree
Agree Don’t Know
1 2 3 4 5 0
SECTION AThis section is about ship safety (i.e., the policies, procedures, attitudes and actions that are taken to mitigate risk and prevent collisions, groundings, loss of life, or major injuries).
1. When ship management is told about accidents, incidents, or near misses, corrective action is taken promptly.
2. Shoreside managers never put schedule or costs above safety.
3. Ship management is personally involved in safety activities on a routine basis.
4. Management places a high priority on safety training.
5. Crew members are actively encouraged to improve safety.
6. This company has excellent maintenance standards.
7. Our crew has adequate training in emergency procedures.
8. People are hired for their ability and willingness to work safely.
9. Language differences in multi-cultural crews are not a threat to safety.
10. There are no differences in the performance of crew members from different cultures.
11. There is good communication on this ship about safety issues.
12. I am always informed about the outcome of shipboard meetings that address safety.13. Watch hand-overs are thorough and not hurried.
14. When I joined this ship I received a proper hand-over, including familiarization with any new tasks.
15. Safety is the top priority for crew on board this ship.

7/28/2019 Leading Indicators GN e
http://slidepdf.com/reader/full/leading-indicators-gn-e 62/78
Appendix 1 Shipboard Safety Culture Questionnaire A1
58 ABS GUIDANCE NOTES ON SAFETY CULTURE AND LEADING INDICATORS OF SAFETY . 2012
16. Whenever I see safety regulations being broken, I report it.
17. The crew is expected to adhere to the work/rest cycle.
18. There is a system in place for observing my time off-duty.
19. I get adequate rest on the work/rest cycle that I work.
20. I am confident that I can operate the automated equipment within my area of responsibility.
21. I am very satisfied with the follow-up measures taken after accidents, incidents, and near misses.
22. Mistakes are corrected without punishment and treated as a learning opportunity.
23. The crew is always given feedback on accidents, incidents, or near misses that occur on board this ship.
24. I am encouraged to conduct risk assessments and report near misses.
25. An effective anonymous reporting system exists in this company.
SECTION BThis section is about occupational health and safety (i.e., about protecting your physical and mental health andwelfare in the workplace).
26. This company cares about my health and safety.
27. Suggestions to improve health and safety are welcomed.
28. I fully understand my responsibilities for health and safety.
29. The crew is always given feedback on injuries that occur on board this ship.
30. The crew has access to all necessary personal protective equipment (PPE).
31. I am always informed about the outcome of shipboard meetings that address health and safety.
SECTION CThis section is about your job.
32. If I am interrupted whilst carrying out a task, I carefully check what I did, or start again, before resumingthe task.
33. Safety briefings and training are never overlooked.
34. I have good control over the safety outcomes of my job.
35. I am usually consulted on matters that affect how I do my job.
36. The crew is not encouraged to break the rules to achieve a target.
37. I am comfortable asking for help when unsure how to do a task.
38. Pre-job assessments are completed for all jobs that need them.
39. I always give proper instructions when I initiate any work.
40. I always ask questions if I do not understand the instructions given to me, or I am unsure of the relevantsafety precautions.

7/28/2019 Leading Indicators GN e
http://slidepdf.com/reader/full/leading-indicators-gn-e 63/78
Appendix 1 Shipboard Safety Culture Questionnaire A1
ABS GUIDANCE NOTES ON SAFETY CULTURE AND LEADING INDICATORS OF SAFETY . 2012 59
SECTION DThis section collects personal information so that differences in responses can be analyzed.
1. What is your age?
2. What is your gender?
3. What is your nationality?
4. Which department are you in?
5. What is your position aboard this ship?
6. What is the email address of your ship?
7. How many years have you been working in the maritime industry?
8. How many years have you worked for your current employer?
9. How many years have you been in your present position?
SECTION EAnd finally, please take a moment to answer the following questions before submitting your questionnaire.
1. What could this company do to improve occupational health and safety?
2. What could this company do to improve ship safety?
3. What could this company do to improve shore-to-ship safety?
4. What questions were not asked in this survey, but should have been?
THANK YOU FOR YOUR HELP
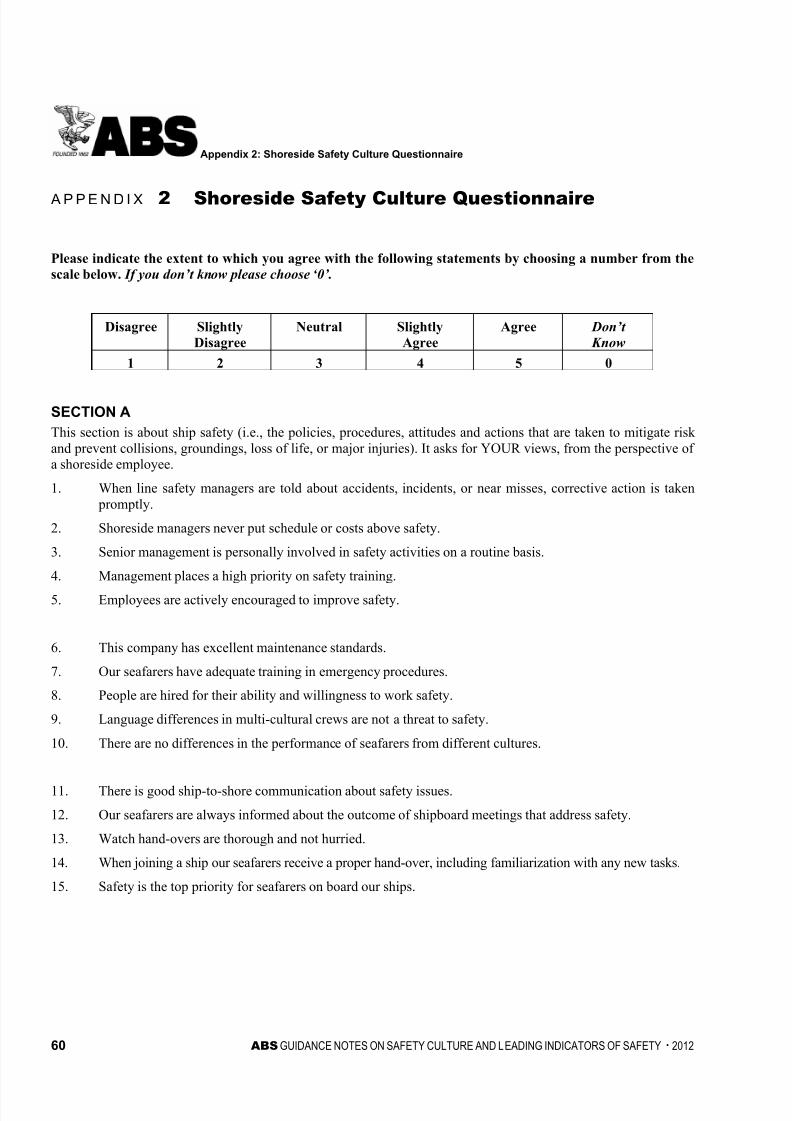
7/28/2019 Leading Indicators GN e
http://slidepdf.com/reader/full/leading-indicators-gn-e 64/78
60 ABS GUIDANCE NOTES ON SAFETY CULTURE AND LEADING INDICATORS OF SAFETY . 2012
Appendix 2: Shoreside Safety Culture Questionnaire
A P P E N D I X 2 Shoreside Safety Culture Questionnaire
Please indicate the extent to which you agree with the following statements by choosing a number from thescale below. If you don’t know please choose ‘0’.
Disagree SlightlyDisagree
Neutral SlightlyAgree
Agree Don’t Know
1 2 3 4 5 0
SECTION AThis section is about ship safety (i.e., the policies, procedures, attitudes and actions that are taken to mitigate risk and prevent collisions, groundings, loss of life, or major injuries). It asks for YOUR views, from the perspective of a shoreside employee.
1. When line safety managers are told about accidents, incidents, or near misses, corrective action is taken promptly.
2. Shoreside managers never put schedule or costs above safety.
3. Senior management is personally involved in safety activities on a routine basis.
4. Management places a high priority on safety training.
5. Employees are actively encouraged to improve safety.
6. This company has excellent maintenance standards.
7. Our seafarers have adequate training in emergency procedures.
8. People are hired for their ability and willingness to work safety.
9. Language differences in multi-cultural crews are not a threat to safety.
10. There are no differences in the performance of seafarers from different cultures.
11. There is good ship-to-shore communication about safety issues.
12. Our seafarers are always informed about the outcome of shipboard meetings that address safety.
13. Watch hand-overs are thorough and not hurried.
14. When joining a ship our seafarers receive a proper hand-over, including familiarization with any new tasks.
15. Safety is the top priority for seafarers on board our ships.

7/28/2019 Leading Indicators GN e
http://slidepdf.com/reader/full/leading-indicators-gn-e 65/78
Appendix 2 Shoreside Safety Culture Questionnaire A2
ABS GUIDANCE NOTES ON SAFETY CULTURE AND LEADING INDICATORS OF SAFETY . 2012 61
16. All violations of safety regulations are reported.
17. Our seafarers are expected to adhere to their work/rest cycle.
18. There is a system in place for observing seafarers’ time off-duty.
19. Our seafarers get adequate rest on their work/rest cycle.
20. Our seafarers are competent to operate their automated equipment.
21. This company has good follow-up measures after accidents, incidents, and near misses.
22. Mistakes are corrected without punishment and treated as a learning opportunity.
23. Our seafarers are always given feedback on accidents, incidents, or near misses that occur on board ships.
24. Our seafarers are encouraged to conduct risk assessments and report near misses.
25. An effective anonymous reporting system exists in this company.
SECTION BThis section asks about YOUR understanding of this company’s health and safety responsibilities.
26. This company cares about health and safety.
27. Suggestions to improve health and safety are welcomed.
28. I fully understand my line responsibilities for shipboard health and safety.
29. Our crews are always given feedback on injuries that occur on board their ship.
30. I have the right equipment to do my job safely.
31. I am always informed about the outcome of shore meetings that address health and safety.
SECTION CThis section asks about your own shoreside job.
32. If I am interrupted whilst carrying out a task, I carefully check what I did, or start again, before resumingthe task.
33. Safety briefings and training are never overlooked.
34. I have good control over the safety outcomes of my job.
35. I am usually consulted on matters that affect how I do my job.
36. Our seafarers are not encouraged to break the rules to achieve a target.
37. I am comfortable asking for help when unsure how to do a task.
38. Pre-job assessments are completed for all jobs that need them.
39. I always give proper instructions when I initiate any work.
40. I always ask questions if I do not understand the instructions given to me, or I am unsure of the relevantsafety precautions.

7/28/2019 Leading Indicators GN e
http://slidepdf.com/reader/full/leading-indicators-gn-e 66/78
Appendix 2 Shoreside Safety Culture Questionnaire A2
62 ABS GUIDANCE NOTES ON SAFETY CULTURE AND LEADING INDICATORS OF SAFETY . 2012
SECTION DThis section collects personal information so that differences in responses can be analyzed.
1. What is your age?
2. What is your gender?
3. What is your nationality?
4. Which department are you in?
5. What is your job title?
6. Which office do you work in?
7. How many years have you been working in the maritime industry?
8. How many years have you worked for your current employer?
9. How many years have you been in your present position?
SECTION EAnd finally, please take a moment to answer the following questions before submitting your questionnaire.
1. What could this company do to improve occupational health and safety?
2. What could this company do to improve ship safety?
3. What could this company do to improve shore-to-ship safety?
4. What questions were not asked in this survey, but should have been?
THANK YOU FOR YOUR HELP

7/28/2019 Leading Indicators GN e
http://slidepdf.com/reader/full/leading-indicators-gn-e 67/78
ABS GUIDANCE NOTES ON SAFETY CULTURE AND LEADING INDICATORS OF SAFETY . 2012 63
Appendix 3: Questionnaires and Safety Factors
A P P E N D I X 3 Questionnaires and Safety Factors
Safety Factors and Their Codes
Safety Factor Codes
Communication COM
Empowerment EMP
Feedback FDB
Mutual Trust MTR
Problem identification PID
Promotion of safety POS
Responsiveness RSP
Safety awareness SAW
1 Statements (on Shipboard Questionnaire) by Safety Factor
Communication (COM)
Statement Number Statement
9 Language differences in multi-cultural crews are not a threat to safety.
11 There is good communication on this ship about safety issues.
25 An effective anonymous reporting system exists in this company.
39 I always give proper instructions when I initiate any work.
40 I always ask questions if I do not understand the instructions given to me, or I am unsure of the relevant safety precautions.
Empowerment (EMP)
Statement Number Statement
5 Crew members are actively encouraged to improve safety.
27 Suggestions to improve health and safety are welcomed.
34 I have good control over the safety outcomes of my job.35 I am usually consulted on matters that affect how I do my job.
37 I am comfortable asking for help when unsure how to do a task.
Feedback (FDB)
Statement Number Statement
12 I am always informed about the outcome of shipboard meetings that address safety.
21 I am very satisfied with the follow-up measures taken after accidents, incidents and near misses.
23 The crew is always given feedback on accidents, incidents or near misses that occur on board this ship.
29 The crew is always given feedback on injuries that occur on board this ship.
31 I am always informed about the outcome of shipboard meetings that address health and safety.

7/28/2019 Leading Indicators GN e
http://slidepdf.com/reader/full/leading-indicators-gn-e 68/78
Appendix 3 Questionnaires and Safety Factors A3
64 ABS GUIDANCE NOTES ON SAFETY CULTURE AND LEADING INDICATORS OF SAFETY . 2012
Mutual Respect (MTR)
Statement Number Statement
8 People are hired for their ability and willingness to work safely.
10 There are no differences in the performance of crew members from different cultures.22 Mistakes are corrected without punishment and treated as a learning opportunity.
26 This company cares about my health and safety.
28 I fully understand my responsibili ties for health and safety.
Problem Identification (PID)
Statement Number Statement
16 Whenever I see safety regulations being broken, I report it.
20 I am confident that I can operate the automated equipment within my area of responsibility.
24 I am encouraged to conduct risk assessments and report near misses.
32 If I am interrupted whilst carrying out a task, I carefully check what I did, or start again, before resuming the task.
38 Pre-job assessments are completed for all jobs that need them.
Promotion of Safety (POS)
Statement Number Statement
1 When ship management is told about accidents, incidents or near misses, corrective action is taken promptly.
2 Shoreside managers never put schedule or costs above safety.
3 Ship management is personally involved in safety activities on a routine basis.
4 Ship management places a high priority on safety training.
6 This company has excellent maintenance standards.
Responsiveness (RSP)
Statement Number Statement
7 Our crew has adequate training in emergency procedures.
17 The crew is expected to adhere to the work/rest cycle.
18 There is a system in place for observing my time off-duty.
19 I get adequate rest on the work/rest cycle that I work.
30 On this ship, the crew has access to all necessary personal protective equipment (PPE).
Safety Awareness (SAW)
Statement Number Statement
13 Watch hand-overs are thorough and not hurried.
14 When I joined this ship I received a proper hand-over, including familiarization with any new tasks.
15 Safety is the top priority for crew on board this ship.
33 Safety briefings and training are never overlooked.
36 The crew is not encouraged to break the rules to achieve a target.

7/28/2019 Leading Indicators GN e
http://slidepdf.com/reader/full/leading-indicators-gn-e 69/78
Appendix 3 Questionnaires and Safety Factors A3
ABS GUIDANCE NOTES ON SAFETY CULTURE AND LEADING INDICATORS OF SAFETY . 2012 65
2 Statements with Safety Factor Codes
Section A
No. Survey Statement SF Codes
Shipboard When ship management is told about accidents, incidents, or near misses, corrective actionis taken promptly.1
Shoreside When line safety managers are told about accidents, incidents, or near misses, correctiveaction is taken promptly.
POS
Shipboard Shoreside managers never put schedule or costs above safety.2
Shoreside Shoreside managers never put schedule or costs above safety.POS
Shipboard Ship management is personally involved in safety activities on a routine basis.3
Shoreside Senior management is personally involved in safety activities on a routine basis.POS
Shipboard Management places a high priority on safety training.4
Shoreside Management places a high priority on safety training.POS
Shipboard Crew members are actively encouraged to improve safety.5
Shoreside Employees are actively encouraged to improve safety.EMP
Shipboard This company has excellent maintenance standards.6
Shoreside This company has excellent maintenance standards.POS
Shipboard Our crew has adequate training in emergency procedures.7
Shoreside Our seafarers have adequate training in emergency procedures.RSP
Shipboard People are hired for their ability and willingness to work safely.8
Shoreside People are hired for their ability and willingness to work safely.MTR
Shipboard Language differences in multi-cultural crews are not a threat to safety.9
Shoreside Language differences in multi-cultural crews are not a threat to safety.COM
Shipboard There are no differences in the performance of crew members from different cultures.10
Shoreside There are no differences in the performance of seafarers from different cultures.MTR
Shipboard There is good communication on this ship about safety issues.11
Shoreside There is good shore-to-ship communication about safety issues.COM
Shipboard I am always informed about the outcome of shipboard meetings that address safety.12
Shoreside Our seafarers are always informed about the outcome of meetings that address safety. FDB
Shipboard Watch hand-overs are thorough and not hurried.13
Shoreside Watch hand-overs are thorough and not hurried.SAW
Shipboard When I joined this ship I received a proper hand-over, including familiarization with anynew tasks.
14
Shoreside When joining a ship our seafarers receive a proper hand-over, including familiarization withany new tasks.
SAW
Shipboard Safety is the top priority for crew on board this ship.15
Shoreside Safety is the top priority for seafarers on board our ships.SAW

7/28/2019 Leading Indicators GN e
http://slidepdf.com/reader/full/leading-indicators-gn-e 70/78
Appendix 3 Questionnaires and Safety Factors A3
66 ABS GUIDANCE NOTES ON SAFETY CULTURE AND LEADING INDICATORS OF SAFETY . 2012
No. Survey Statement SF Codes
Shipboard Whenever I see safety regulations being broken, I report it.16
Shoreside All violations of safety regulations are reported.PID
Shipboard The crew is expected to adhere to the work/rest cycle.17
Shoreside Our seafarers are expected to adhere to their work/rest cycle. RSP
Shipboard There is a system in place for observing my time off-duty.18
Shoreside There is a system in place for observing seafarers’ time off-duty. RSP
Shipboard I get adequate rest on the work/rest cycle that I work.19
Shoreside Our seafarers get adequate rest on their work/rest cycle.RSP
Shipboard I am confident that I can operate the automated equipment within my area of responsibility.20
Shoreside Our seafarers are competent to operate their automated equipment.PID
Shipboard I am very satisfied with the follow-up measures taken after accidents, incidents, and near misses.21
Shoreside This company has good follow-up measures after accidents incidents, and near misses.FDB
Shipboard Mistakes are corrected without punishment and treated as a learning opportunity.22
Shoreside Mistakes are corrected without punishment and treated as a learning opportunity.MTR
Shipboard The crew is always given feedback on accidents, incidents, or near misses that occur on board this ship.
23
Shoreside Our seafarers are always given feedback on accidents, incidents, or near misses that occur on board ships.
FDB
Shipboard I am encouraged to conduct risk assessments and report near misses.24
Shoreside Our seafarers are encouraged to conduct risk assessments and report near misses.
PID
Shipboard An effective anonymous reporting system exists in this company.25
Shoreside An effective anonymous reporting system exists in this company.COM
Section B
No. Survey Statement SF Codes
Shipboard This company cares about my health and safety.26
Shoreside This company cares about health and safety. MTR
Shipboard Suggestions to improve health and safety are welcomed.27
Shoreside Suggestions to improve health and safety are welcomed. EMP
Shipboard I fully understand my responsibili ties for health and safety.28
Shoreside I fully understand my line responsibili ties for shipboard health and safety. MTR
Shipboard The crew is always given feedback on injuries that occur on board this ship.29
Shoreside Our crews are always given feedback on injuries that occur on board their ship. FDB
Shipboard The crew has access to all necessary personal protective equipment (PPE).30
Shoreside I have all the right equipment to do my job safely. RSP
Shipboard I am always informed about the outcome of shipboard meetings that address health and safety.31
Shoreside I am always informed about the outcome of shore meetings that address health and safety. FDB

7/28/2019 Leading Indicators GN e
http://slidepdf.com/reader/full/leading-indicators-gn-e 71/78
Appendix 3 Questionnaires and Safety Factors A3
ABS GUIDANCE NOTES ON SAFETY CULTURE AND LEADING INDICATORS OF SAFETY . 2012 67
Section C
No. Survey Statement SF Codes
Shipboard If I am interrupted whilst carrying out a task, I carefully check what I did, or start again, before resuming the task.
32
Shoreside If I am interrupted whilst carrying out a task, I carefully check what I did, or start again, before resuming the task.
PID
Shipboard Safety briefings and training are never overlooked.33
Shoreside Safety briefings and training are never overlooked. SAW
Shipboard I have good control over the safety outcomes of my job.34
Shoreside I have good control over the safety outcomes of my job. EMP
Shipboard I am usually consulted on matters that affect how I do my job.35
Shoreside I am usually consulted on matters that affect how I do my job. EMP
Shipboard The crew is not encouraged to break the rules to achieve a target.36Shoreside Our seafarers are not encouraged to break the rules to achieve a target.
SAW
Shipboard I am comfortable asking for help when unsure how to do a task.37
Shoreside I am comfortable asking for help when unsure how to do a task. EMP
Shipboard Pre-job assessments are completed for all jobs that need them.38
Shoreside Pre-job assessments are completed for all jobs that need them. PID
Shipboard I always give proper instructions when I initiate any work.39
Shoreside I always give proper instructions when I initiate any work. COM
Shipboard I always ask questions if I do not understand the instructions given to me, or I am unsure of the relevant safety precautions.
40
Shoreside I always ask questions if I do not understand the instructions given to me, or I am unsure of the relevant safety precautions.
COM

7/28/2019 Leading Indicators GN e
http://slidepdf.com/reader/full/leading-indicators-gn-e 72/78
68 ABS GUIDANCE NOTES ON SAFETY CULTURE AND LEADING INDICATORS OF SAFETY . 2012
Appendix 4: Safety Performance Datasheets
A P P E N D I X 4 Safety Performance Datasheets
Definitions:Please use these definitions when completing the datasheets.
Accidents : Accidents are undesired events that result in personal injury.
Conditions of Class: Any deficiencies identified, or recommendations made, by the classification society’ssurveyor.
Conditions of Class (Frequencies): The total number of conditions of class in the last year, multiplied by100, divided by the number of port calls in the last year.
Lost Time Incident of 24 Hours or More (LTI ≥ 24 hrs): Any work related injury other than a fatalinjury which results in a person being unfit for work for a period of 24 continuous hours immediately after the occurrence of the incident.
Lost Time Incident Frequency – LTIF: The total Lost Time Incidents multiplied by 1 million, divided by the number of exposure (working) hours in the last year
Medical Treatment Case (MTC): Work-related injuries that are not severe enough to be reported as fatalitiesor Lost Time Incident cases or Restricted Work Accident cases but are more severe than requiring simplefirst aid treatment; however the injured person is able to carry out all his duties after treatment.
Medical Treatment Case Frequency (MTCF): The total medical treatment cases multiplied by 1 million,divided by the number of exposure (working) hours in the last year.
Near Misses (NM): Events or chain of events, which, under slightly different circumstances, could haveresulted in an accident, injury, damage, or loss of personnel, equipment, or the vessel.
Near Miss Frequency (NMF): The total number of near miss cases in the last year multiplied by 1 million,divided by the number of exposure (working) hours in the last year.
Operational Incidents : Operational incidents are events that include steering failures, propulsion failures,navigational equipment failures, collisions, groundings, or other navigational or equipment failures.
Operational Incidents (Frequency) : The total number of operational incidents in the last year, multiplied by 100, divided by the number of port calls of that vessel in the last year.
Port State Deficiencies: Any deficiencies identified by Port State Control.
Port State Deficiencies (Frequencies): The total number of port state deficiencies in the last year, multiplied
by 100, divided by the number of port calls of that vessel in the last year.Restricted Work Accident (RWA): Any work-related injury (other than a fatality or lost time incident)that results in a person being unfit to perform all of his/her regular job after the accident.
Restricted Work Accident Frequency (RWAF): The total restricted work accident cases in the last year,multiplied by 1 million, divided by the number of exposure (working) hours in the last year.
Total Recordable Cases (TRC): The sum of all work-related fatalities, lost time incidents, restricted work accidents and medical treatment cases. TRCs = LTIs + RWAs + MTCs.
Total Recordable Case Frequency (TRCF): The total recordable cases in the last year multiplied by1 million, divided by the number of exposure (working) hours in the last year.

7/28/2019 Leading Indicators GN e
http://slidepdf.com/reader/full/leading-indicators-gn-e 73/78
Appendix 4 Safety Performance Datasheets A4
ABS GUIDANCE NOTES ON SAFETY CULTURE AND LEADING INDICATORS OF SAFETY . 2012 69
Organizational Safety Performance Datasheet
Please provide the following data for at least the last five years.
1. Total Recordable Cases Frequency for the fleet.
2. Lost Time Incident Frequency for the fleet.
3. Medical Treatment Case Frequency for the fleet.
4. Restricted Work Accident Frequency for the fleet.
Operational Incidents5. Operational incidents frequency for the fleet.
Near Misses6. Near miss frequency for the fleet.
Conditions of Class7. Conditions of Class frequency for the fleet.
Port State Deficiencies8. Port State Deficiencies frequency for the fleet.
Additional Data9. Hours worked for the fleet.
10. Number of port calls for the fleet.

7/28/2019 Leading Indicators GN e
http://slidepdf.com/reader/full/leading-indicators-gn-e 74/78
Appendix 4 Safety Performance Datasheets A4
70 ABS GUIDANCE NOTES ON SAFETY CULTURE AND LEADING INDICATORS OF SAFETY . 2012
Business Units Safety Performance Datasheet
Please provide the following data for the last year. The data should be the most recent, preferably the last twelvemonths compounded to a single figure.
1. Total Recordable Cases Frequency for the fleet in the business unit.
2. Lost Time Incident Frequency for the fleet in the business unit.
3. Medical Treatment Case Frequency for the fleet in the business unit.
4. Restricted Work Accident Frequency for the fleet in the business unit.
Operational Incidents5. Operational incidents frequency in the business unit.
Near Misses6. Near miss frequency in the business unit.
Conditions of Class7. Conditions of Class frequency in the business unit.
Port State Deficiencies8. Port State Deficiencies frequency in the business unit.
Additional Data9. Hours worked for the business unit.
10. Number of port calls for the business unit.

7/28/2019 Leading Indicators GN e
http://slidepdf.com/reader/full/leading-indicators-gn-e 75/78
Appendix 4 Safety Performance Datasheets A4
ABS GUIDANCE NOTES ON SAFETY CULTURE AND LEADING INDICATORS OF SAFETY . 2012 71
Vessels Safety Performance Datasheet
Please provide the following data for the last year. The data should be the most recent, preferably the last twelvemonths compounded to a single figure.
1. Total Recordable Cases Frequency for the vessel.
2. Lost Time Incident Frequency for the vessel.
3. Medical Treatment Case Frequency for the vessel.
4. Restricted Work Accident Frequency for the vessel.
Operational Incidents5. Operational incidents frequency for the vessel.
Near Misses6. Near miss frequency for the vessel.
Conditions of Class7. Conditions of Class frequency for the vessel.
Port State Deficiencies8. Port State Deficiencies frequency for the vessel.
Additional Data9. Hours worked for the vessel.
10. Number of port calls for the vessel.
THANK YOU FOR YOUR HELP

7/28/2019 Leading Indicators GN e
http://slidepdf.com/reader/full/leading-indicators-gn-e 76/78
72 ABS GUIDANCE NOTES ON SAFETY CULTURE AND LEADING INDICATORS OF SAFETY . 2012
Appendix 5: Electronic Distribution
A P P E N D I X 5 Electronic Distribution
Electronic distribution is preferable to paper because it avoids the need to type responses into a spreadsheet or statistics package, which is labor-intensive and potentially error-prone. Reliable sophisticated web-basedsurvey tools are available. Use of such a tool is strongly recommended.
1 Consideration in Choice of Electronic Tool
The user should take into consideration the following questions before implementing an electronic surveyinstrument.
i) Size – is there any restriction on the number of questions?
ii) Does the tool enable encryption of data across the internet?
iii) Can the questionnaire be customized (e.g., allowing use of the company’s logo)?
iv) Once the questionnaire is inputted, can the look and feel be tailored to suit?
v) Is the tool easy to use?
vi) Does the tool allow for a crew member to halt a survey and resume at a later time, if necessary?
vii) Does the survey instrument support crew member confidentiality?
2 Shipboard Survey Considerations
The web-based survey tools usually do not work on ships because they require permanent access to theinternet. For this reason, some organizations have developed their own in-house survey tools, which should
be used for this survey. Note that the PC on which the survey is installed must be in a publicly-accessed part of the vessel as all crew will need to use it.
An alternative to an in-house survey tool is an email-embedded survey. However, these do have potentialdrawbacks that may preclude their use. The company’s information technology group will need to do athorough investigation of the viability of those tools, taking into account:
i) Email client MIME capabilities (the ability to embed or attach documents to emails)
ii) SMTP Server Configuration (for outgoing messages)
iii) The software has to be installed and configured on the survey administration PC
iv) Whether or not crew members have individual email addresses
3 Expertise Required• Basic knowledge of online surveys and HTML
• Knowledge of social science statistics especially the Mann-Whitney U Test and Spearman CorrelationTests
• Experience of using statistics packages

7/28/2019 Leading Indicators GN e
http://slidepdf.com/reader/full/leading-indicators-gn-e 77/78
Appendix 5 Electronic Distribution A5
ABS GUIDANCE NOTES ON SAFETY CULTURE AND LEADING INDICATORS OF SAFETY . 2012 73
4 Preparation of the Electronic Questionnaire
i) Terminology – is it correct for crew and shoreside staff? Note that the terms such as operationalincidents and accidents are used as defined in 1-1/6 of these Guidance Notes.
ii) Customize the Demographics section to the organization. Check department names, positions,ranges for experience and age, etc., are appropriate.
iii) Fill out all menu options such as office locations with the organization’s details
iv) Section D Question 6 asks for ship email address, but name of ship may be preferred, and can beused instead. Unique identifier for each ship is required.
v) Gain access to the electronic tool (e.g., sign up for use of the chosen web-based survey tool).
vi) Input the tailored questionnaire.
vii) Adjust look and feel to that required. For example, the Likert scale should always be visible on thescreen, the questions should be wrapped so they don’t spread across the screen cramping theresponse scale; questions should be clearly delineated (e.g., by highlighting alternate rows).
viii) Consider whether or not to allow users to save partial responses and continue later. This will be anissue if participants are sharing a computer unless they have unique email addresses – see below.
ix) Anonymity of data issues. It is possible to have a completely anonymous survey in which no datacan be traced to an individual, but this is achieved at a price. For example, where crew are sharinga PC, they must complete the questionnaire in one sitting if they wish to remain anonymous. If they cannot complete in one sitting they have to abort the survey and start again from the beginning.Also, reminders need to be sent towards the end of the survey. Anonymous responses preclude the
possibility of targeting those who have not responded – everyone will have to receive the reminder.Anonymity means that it is not possible to stop an individual from answering the survey more thanonce.
x) Confidentiality of responses issues. Consider who is going to see the responses before they arerendered anonymous.
xi) Use drop-down lists where appropriate.
xii) Provide a front page explaining the purpose of the survey, stating whether or not it is anonymous,the need to answer ALL questions, and end-date of survey.
xiii) Consider how to end the survey: The system should detect any unanswered questions, let the participant know that the survey cannot end because of unanswered questions and bounce to themso that the participant does not have to search for them. Participants should be thanked for their contribution, and receipt of their submission should be acknowledged. Consideration needs to begiven to the exit screen as the default will be to the service provider.
xiv) Pilot it with at least two crew onboard ship and two staff shoreside. Pilot every stage of the
process including the preliminary emails right through to checking that the returns are formattingcorrectly.
5 Collection of Responses
i) At the end of the survey, the web-based tool will automatically shut down and advise that collectionis ready.
ii) The data will be delivered in a format ready for analysis.

7/28/2019 Leading Indicators GN e
http://slidepdf.com/reader/full/leading-indicators-gn-e 78/78
Appendix 6: References
A P P E N D I X 6 References
ACSNI Study Group (1991) Study Group on Human Factors, report: Human Reliability Assessment – aCritical Overview. Advisory Committee on the Safety of Nuclear Installations .
Dufort, V. and Infante-Rivard, C. (1998). Housekeeping and Safety: An Epidemiological Review, SafetyScience. 28,127-138.
International Civil Aviation Organization (1993) Human Factors, Management and Organization. Human Factors Digest No.10. Montreal: ICAO.
National Academy of Engineering (NAE) (2004). Accident Precursor Analysis and Management: Reducing Technological Risk Through Diligence . Washington, D.C.: The National Academies Press.
Ryan, T.G. (1991) Organizational Factors Regulatory research Briefing to the ACSNI Study Group on Human Factors and Safety. London, July. Advisory Committee on the Safety of Nuclear Installations.
Sleire H. (2008) Shipping KPI: An Industry Initiative to Enhance Excellence in Ship Operation by Setting Standards for Corporate Governance . Marintek-Sintef Final Report. The Research Council of NorwayContract No. 175978. InterManager.
Toellner, J. (2001) Improving Safety & Health Performance: Identifying & Measuring Leading Indicators. Professional Safety, 46 (9), 42-47.
UNSCEAR (1988) Sources, Effect and Risks of Ionizing Radiation. United Nations Scientific Committeeon the Effects of Atomic Radiation, 1988 Report to the General Assembly with annexes. United Nations
sales publications E.88.IX.7 United Nations, New York.
Zimolong, B, and Elke, G. (2006). Occupational Health and Safety Management. In G. Salvendy (Ed), Handbook of Human Factors & Ergonomics. New York: Wiley, 1- 66.