development and evaluation of a small volume …
TRANSCRIPT

DEVELOPMENT AND EVALUATION OF A SMALL VOLUME LIQUID
IMPACTION SURFACE (SVLIS) IN THE NEXT GENERATION IMPACTOR
(NGI)
___________________________________
By
Nikita Deepak Navalkar
___________________________________
A THESIS
Submitted to the faculty of the Graduate School of the Creighton University in
partial fulfillment of the requirements for the Degree of Master of Science in the
Department of Pharmacy Sciences
_________________________________
Omaha, NE (August 2014)

© Nikita Deepak Navalkar, 2014
iii
ABSTRACT
The growing popularity of inhalation as a route of administration for local action in the
lungs as well as systemic effects has necessitated the development of in vitro models for
studying the deposition, dissolution and absorption of orally inhaled drug formulations.
Models that integrate the study of at least two of these processes would be better able to
simulate conditions in vivo. This thesis describes the design and evaluation of a Small
Volume Liquid Impaction Surface (SVLIS) in the Next Generation Impactor (NGI), a
cascade impactor for evaluation of aerodynamic particle size distribution. This SVLIS
modified NGI allowed for incorporation of lung cell cultures or drug dissolution of orally
inhaled powders following aerosolization.
A custom SVLIS was designed to accommodate a liquid volume of 5 mL for incorporation
in the NGI stages using the gravimetric cup. It allowed the growth of cells in a way as to
mimic the thin layer of fluid lining the lung. A549 cells were grown on the SVLIS and
saline administration through the NGI did not adversely affect the cells grown on the
SVLIS; though airflow alone decreased cell survival.
The SVLIS was incorporated in various stages of the NGI to study the effect of the
modification on aerosol deposition patterns of a nebulized model drug. Though significant
differences were seen in deposition at some of the stages, the deposition patterns and
aerodynamic properties of aerosols obtained in the SVLIS at stage 4 did not differ from
those in the unmodified NGI. A model dry powder for oral inhalation was aerosolized
through the stage 4 SVLIS modified NGI using a DPI, but the deposition at stage 4 was
seen to be different from that in unmodified NGI. A preliminary dissolution study of

iv
powdered theophylline was performed using the SVLIS modified NGI, which showed that
the SVLIS could be potentially used in in vitro dissolution models for inhaled drugs.
The results from all the studies showed that the SVLIS has potential applications in
studying inhaled drug absorption and dissolution following deposition in the NGI.

v
PREFACE
ABSTRACTS:
1. N. D. Navalkar, D. M. Patel, J. A. Tolman. ‘Evaluation of Modified Liquid Impaction
Surfaces in the Next Generation Impactor (NGI)’. American Association of
Pharmaceutical Scientists Annual Meeting and Exposition 2013, San Antonio, Texas.
2. Gharse Sachin, Navalkar Nikita, Fowler Randal, Hanson Nancy, Tolman Justin.
‘Creation and Validation of an enhanced in vitro model of the lung’. American
Association of Pharmaceutical Scientists Annual Meeting and Exposition 2012,
Chicago, Illinois.

vi
Dedicated to all my loved ones

vii
ACKNOWLEDGEMENTS
I would like to express my heartfelt thanks to my advisor Dr. Justin A. Tolman for his
invaluable guidance, constant encouragement and unfailing support throughout the course
of my Master’s program at Creighton University. I am sincerely grateful to him for teaching
me to approach the resolution of every scientific problem in a positive and enthusiastic
manner. I would further like to extend my thanks to Dr. Alekha Dash and Dr. Somnath
Singh for taking time out of their extremely busy schedules to be a part of my graduate
committee. Their suggestions and advice regarding both my research project and during
the writing of my thesis have proved truly invaluable. I would like to acknowledge our
former program director, Dr. Manzoor Khan for his guidance during the program.
I would like to specifically thank Dan Munt for his useful insights into any scientific
questions I might have as well as his guidance and training during usage of numerous lab
instruments and for cell culture studies. A special thanks to all my lab members Sachin
Gharse, Amruta Indapurkar, Dhwani Patel, Megan Derba, Rajvi Wani, Niranjan Kathe and
Amruta Sabnis for their help and timely scientific inputs. I would like to say a very heartfelt
thank you to Ms. Dawn Trojanowski for her prompt assistance with everything
administrative and to the entire Pharmacy Sciences department for their constant support.
A mere thank you is insufficient to express my gratitude to my parents Deepak Navalkar
and Sandhya Navalkar, for their unconditional love, encouragement and support have been
my source of strength and inspiration in the toughest of times. A big thank you to all my
family and friends back home and the family I have acquired here in Omaha for helping
make this a beautiful journey. Finally, I thank God for being blessed to be part of the
Creighton family.

viii
TABLE OF CONTENTS
Page Number
Abstract
Table of contents
List of figures
List of tables
List of abbreviations
iii
viii
xii
xiv
xvi
Chapter 1: Introduction
1. Introduction
1.1. Cascade impactors for studying drug deposition in the
lung
1.1.1. Next Generation Impactor (NGI)
1.2. In vitro cell based lung epithelial models
1.2.1. Aerosolization onto cell cultures
1.3. In vitro dissolution testing of inhaled drugs
1.4. Hypothesis and Specific Aims
1
2
5
7
11
13
17
21
Chapter 2: To design a small volume liquid impaction surface
(SVLIS) and incorporate lung cell cultures into the NGI using the
SVLIS
2. Background
2.1. Design of the Small Volume Liquid Impaction Surface
(SVLIS)
2.2. Cell growth on SVLIS
24
25
25
29
ix
2.2.1. Materials
2.2.2. Methods
2.2.2.1. Growth of cells on SVLIS
2.2.2.2. Assembly and operation of the NGI
2.2.2.3. Incorporation of cells in the NGI
2.2.3. Results and Discussion
2.2.3.1. Growth of cells on SVLIS
2.2.3.2. Incorporation of cells in the NGI
2.2.4. Summary of preliminary studies
2.2.4.1. Cell growth in LVLIS
2.2.4.2. Materials
2.2.4.3. Methods
2.2.4.4. Results and Discussion
30
31
31
31
32
35
35
35
38
38
38
39
39
Chapter 3: To evaluate the deposition patterns in a SVLIS
compared to normal impaction surfaces
3. Background
3.1. Selection of model drug
3.2. Method for detection of theophylline
3.2.1. Materials
3.2.2. Methods
3.2.3. Results and Discussion
3.3. Validation of unmodified NGI
3.3.1. Materials
41
42
42
43
43
43
44
45
45

x
3.3.2. Methods
3.3.2.1. Preparation of theophylline solutions
3.3.2.2. Assembly of the NGI
3.3.2.3. Nebulization of theophylline solution
3.3.2.4. Recovery and analysis of nebulized theophylline
3.3.3. Results and Discussion
3.4. Validation of the modified NGI
3.4.1. Materials
3.4.2. Methods
3.4.3. Results
3.4.3.1. Incorporation of SVLIS at stage 4
3.4.3.2. Incorporation of SVLIS at stage 5
3.4.3.3. Incorporation of SVLIS at stage 6
3.4.3.4. Incorporation of SVLIS at stage 7
3.4.4. Discussion
3.5. Validation of modified NGI using dry powder inhaler
(DPI)
3.5.1. Materials
3.5.2. Methods
3.5.3. Results and Discussion
3.6. Evaluation of effect of airflow on liquid height in SVLIS
3.6.1. Materials
3.6.2. Methods
46
46
46
46
46
48
49
50
50
51
51
52
54
55
56
59
59
60
61
62
63
63

xi
3.6.3. Results and Discussion
3.6.3.1. Evaporative loss at 15 L/min
3.6.3.2. Evaporative loss at 30 L/min
3.6.3.3. Evaporative loss at 60 L/min
64
64
67
68
Chapter 4: To study the dissolution profile of a powdered drug
using the SVLIS
4. Background
4.1. Dissolution study using SVLIS as the dissolution
chamber
4.1.1. Materials
4.1.2. Methods
4.1.3. Results and Discussion
4.2. Proposed study design for future dissolution testing
73
73
74
74
74
74
76
77
Chapter 5: Conclusions and Future Directions
5. Conclusions and future directions
5.1. Conclusions
5.2. Future directions
80
81
81
82
References 84

xii
LIST OF FIGURES
Figure 1 Anatomy of the Respiratory system. 2
Figure 2 Possible routes of elimination of drug from the lungs. 3
Figure 3 Next Generation Impactor in closed configuration. 7
Figure 4 NGI in open configuration. 8
Figure 5 Seal body of an NGI. 9
Figure 6 Cross-section of an NGI stage. 10
Figure 7 In vitro cell culture model to uptake, absorption and
metabolism across the pulmonary epithelium
11
Figure 8 Unmodified NGI collection cup (left); Large volume liquid
impaction surface (LVLIS) (center); Small volume liquid
impaction surface (SVLIS) (right)
27
Figure 9 Cross-sectional representation of (a) Unmodified NGI
collection cup; (b) LVLIS; (c) SVLIS
27
Figure 10 Design of SVLIS. (a) Cross-sectional view; (b) three-
dimensional view
28
Figure 11 Dimensions of SVLIS (Capacity: 5 mL) 28
Figure 12 Final design of the SVLIS insert. (a) Top view; (b) Side view 29
Figure 13 SVLIS insert assembled with the NGI gravimetric cup. (a)
Top view; (b) Side view
29
Figure 14 NGI cleaned, sanitized and taken inside cell culture hood. 32
Figure 15 'Controls' and 'Samples' plated in the SVLIS placed in petri
dishes.
33

xiii
Figure 16 Cell growth observed in SVLIS over 6 days. 35
Figure 17 Comparison of cells observed under microscope near
confluence; (a) Control; (b) Cells exposed to airflow; (c) Cells
treated with saline.
36
Figure 18 Cell survival in the SVLIS after 72 hours of treatment. 37
Figure 19 Cell survival 96 hours after exposure to metallic LVLIS. 40
Figure 20 Structure of theophylline. 42
Figure 21 Typical standard curve of theophylline. 45
Figure 22 Deposition pattern of nebulized theophylline in unmodified
NGI.
48
Figure 23 Stage-wise deposition for unmodified NGI and NGI with
SVLIS at stage 4 (n=3).
51
Figure 24 Stage-wise deposition for unmodified NGI and NGI with
SVLIS at stage 5 (n=3).
52
Figure 25 Stage-wise deposition for unmodified NGI and NGI with
SVLIS at stage 6 (n=3).
54
Figure 26 Stage-wise deposition for unmodified NGI and NGI with
SVLIS at stage 7 (n=3).
55
Figure 27 Stage-wise deposition for unmodified NGI and NGI with
SVLIS at stage 4 for DPI (n=3).
61
Figure 28 Loss in height of water and medium from stage 4 at different
flow rates.
72
Figure 29 Dissolution set up in the incubator-shaker. 75
Figure 30 SVLIS containing water inside petri dish. 75
Figure 31 In vitro dissolution profile of theophylline. 76

xiv
LIST OF TABLES
Table 1 Examples of cell culture studies reported in literature using
impactors. (PADDOCC: Pharmaceutical Aerosol Deposition
Device on Cell Cultures).
15
Table 2 Examples of dissolution studies for inhaled drugs in literature. 20
Table 3 Aerodynamic parameters for unmodified NGI and NGI with
SVLIS at stage 4 (n=3).
52
Table 4 Aerodynamic parameters for unmodified NGI and NGI with
SVLIS at stage 5 (n=3).
53
Table 5 Aerodynamic parameters for unmodified NGI and NGI with
SVLIS at stage 6 (n=3).
55
Table 6 Aerodynamic parameters for unmodified NGI and NGI with
SVLIS at stage 7 (n=3).
56
Table 7 Aerodynamic parameters for unmodified NGI and NGI with
SVLIS at stage 4 for DPI (n=3).
62
Table 8 Aerodynamic cutoff diameters for different stages and airflow
rates as per USP.
64
Table 9 Loss in height of water from different stages at 15 L/min after
10 minutes.
65
Table 10 Loss in height of medium from different stages at 15 L/min
after 10 minutes.
66

xv
Table 11 Loss in height of water from different stages at 30 L/min after
1 minute.
67
Table 12 Loss in height of medium from different stages at 30 L/min
after 1 minute.
68
Table 13 Loss in height of water from different stages at 60 L/min after
1 minute.
68
Table 14 Loss in height of medium from different stages at 60 L/min
after 1 minute.
69
Table 15 Density and viscosity for water and medium. 70

xvi
LIST OF ABBREVIATIONS
ACI Andersen Cascade Impactor
AIC Air-interfaced culture
ATI cells Alveolar type I cells
DDW Deionized distilled water
DMF Dimethylformamide
DPBS Dulbecco’s phosphate buffered saline
DPI Dry powder inhaler
ELF Epithelial lining fluid
FBS Fetal bovine serum
FPF Fine Particle Fraction
GIT Gastrointestinal tract
GSD Geometric Standard Deviation
LCC Liquid-covered culture
LVLIS Large volume liquid impaction surface
MDI Metered dose inhaler
MMAD Mean Median Aerodynamic Diameter
MOC Micro-orifice collector
MRI Magnetic resonance imaging
MSLI Multi Stage Liquid Impinger
MTT 3-(4,5-Dimethylthiazol-2-yl)-2,5-diphenyltetrazolium bromide

xvii
NEAA Non-essential amino acids
NGI Next Generation Impactor
PADDOCC Pharmaceutical Aerosol Deposition Device on Cell Cultures
PBS Phosphate buffer saline
PET Positron emission tomography
PLGA Poly (lactic-co-glycolic) acid
PVDF Polyvinylidene difluoride
QC Quality control
SDS Sodium dodecyl sulfate
SLF Simulated lung fluid
SPECT Single photon emission computed tomography
SVLIS Small volume liquid impaction surface
USP United States Pharmacopeia
UV Ultraviolet
VCI Viable cascade impactor

1
CHAPTER 1
Introduction

2
1. Introduction
In the past few decades, there have been many advances in the field of pulmonary drug
delivery, both for local action and for systemic effect. The human lungs are a complex
organ system in the human body comprising of 300-500 million alveoli and a total surface
area approximating 100 m2 [1]. Thus, the design and testing of formulations for inhalation
is challenging because of the various aspects that need to be controlled for delivering drugs
to the lung, such as its deposition, dissolution and absorption post inhalation. The
anatomical and physiological differences in the different regions of the lung only increase
the complexity of the puzzle that is the lung, making inhaled drug formulation development
that much more difficult.
Figure 1: Anatomy of the Respiratory system [2].
3
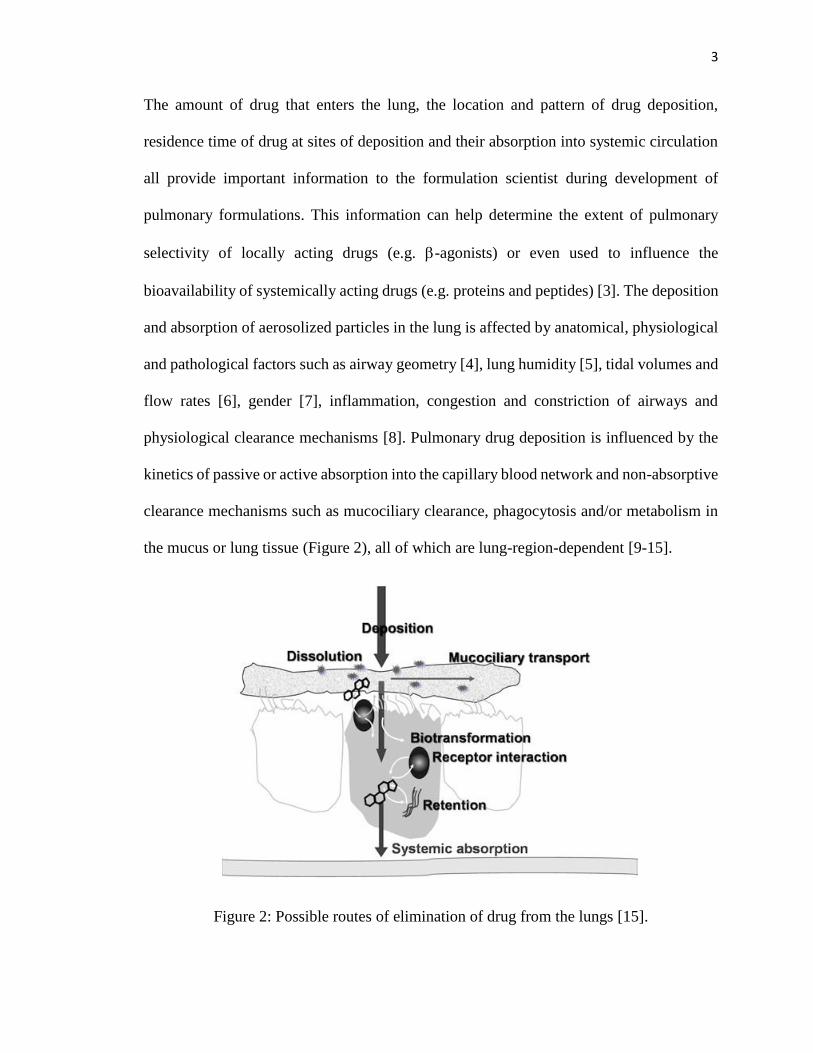
The amount of drug that enters the lung, the location and pattern of drug deposition,
residence time of drug at sites of deposition and their absorption into systemic circulation
all provide important information to the formulation scientist during development of
pulmonary formulations. This information can help determine the extent of pulmonary
selectivity of locally acting drugs (e.g. -agonists) or even used to influence the
bioavailability of systemically acting drugs (e.g. proteins and peptides) [3]. The deposition
and absorption of aerosolized particles in the lung is affected by anatomical, physiological
and pathological factors such as airway geometry [4], lung humidity [5], tidal volumes and
flow rates [6], gender [7], inflammation, congestion and constriction of airways and
physiological clearance mechanisms [8]. Pulmonary drug deposition is influenced by the
kinetics of passive or active absorption into the capillary blood network and non-absorptive
clearance mechanisms such as mucociliary clearance, phagocytosis and/or metabolism in
the mucus or lung tissue (Figure 2), all of which are lung-region-dependent [9-15].
Figure 2: Possible routes of elimination of drug from the lungs [15].

4
The development of safe and effective formulations for lung delivery necessitate an
understanding of respiratory biopharmaceutics and drug interactions with the lung, apart
from the optimization of device and formulation design. Since the lung is more complex
than the GIT in terms of lumen access, diverse anatomy, difficulty in drug administration
and dosimetry, advances in respiratory biopharmaceutics has been limited [16]. A better
ability to assess the mechanisms of deposition and absorption of inhaled drug formulations
is essential to advance the understanding of pulmonary biopharmaceutics. Several in vivo,
in vitro and ex vivo models have been reported that simulate various anatomical and/or
physiological aspects of the lungs in attempts to better understand the effect of the various
physiological and pharmacological factors on the absorption patterns and deposition
profiles of orally inhaled formulations [1, 12, 17, 18].
Most in vitro models incorporate principles and techniques of cascade impactors to
determine aerodynamic size and deposition profiles of orally inhaled formulations [19, 20].
The deposition profiles of drugs in the lungs of live animals can be studied using in vivo
imaging techniques such as gamma scintigraphy [21], single photon emission computed
tomography (SPECT) [22], positron emission tomography (PET) [23], magnetic resonance
imaging (MRI) [24] and fluorescence imaging [25]. However, drawbacks such as higher
costs, high radiation doses, safety concerns and requirements of specialized training limit
the utilization of these in vivo techniques.
Separate reports have utilized animal models, both small and big animals such as mice,
rats, rabbits and dogs, to study the pharmacokinetics and pharmacodynamics of drugs
following pulmonary delivery [17, 26]. However, anatomical complexities and inter-
species difference between lungs limit some results for human applications [12, 27, 28]. In

5
contrast, ex vivo studies are performed outside the organism in an environment that is
artificial yet mimics the biological environment, in order to enable the investigation of
isolated physiological processes. Isolated perfused tissue models, like the isolated perfused
rat lung model (IPRL) [18], allow the study of drug deposition and absorption in the lung
and provide better in vivo-in vitro correlation as compared to that obtained from single cell
monolayer models [1, 15]. Cell based in vitro models have been widely used for studying
drug uptake, transport and metabolism by the lungs [29–31], especially since they simulate
the microenvironment of lung tissue.
1.1.Cascade impactors for studying drug deposition in the lung
Once inhaled, aerosol particles or droplets deposit in different lung regions, as determined
by lung morphology, breathing pattern, aerosol morphology and geometry, particle size
and density. Aerodynamic particle size is an important factor in determining the regional
deposition of aerosolized particles within the respiratory tract, since it can influence the
aerosol deposition patterns following inhalation [19, 32–37]. The aerodynamic diameter of
a particle is defined as the diameter of a hypothetical spherical particle of unit density (ρ =
1.00 g/cm3) that has the same settling velocity as the physical particle [19, 20, 38]. Larger
and heavier particles (>5-6 µm) tend to be deposited in the mouth, throat and at points of
bifurcation in the early generations of the conducting airways (oropharyngeal deposition).
Smaller and lighter particles (~1-5 µm) tend to be deposited in the deeper regions of the
lung. The particles smaller than 0.5-1 µm tend to be deposited in the lung through Brownian
(random) motion or remain suspended in the airstream and are exhaled. The ideal particle
size range to be achieved in order to obtain optimum deposition in the human lung is
approximately 2-3 µm [3, 12].

6
Cascade impactors are the most commonly used instrumentation for the in vitro assessment
of delivery efficiency both inhalers and nebulizers, since they directly classify orally
inhaled particles and droplets according to aerodynamic diameter. Furthermore, impactors
measure particle size distribution of the entire drug dose delivered, and not just a random
sample of the entire dose. Cascade impactors also allow for the simultaneous quantification
of the mass of the active ingredient present in different size ranges in the formulation,
independent of any non-drug material present in the sample [20, 39].
Apart from being able to study the deposition pattern of an aerosolized powder, an impactor
allows the calculation of the aerodynamic parameters of an aerosol, such as the Mean
Median Aerodynamic Diameter (MMAD), Geometric Standard Deviation (GSD) and the
Fine Particle Fraction (FPF). They provide an in vitro measure of the delivery efficiency
of an aerosol. Deposition of aerosol particles on different stages of an impactor can be
related, in general terms, to drug deposition in lung regions [40]. These patterns help
predict the in vivo deposition pattern in a human lung by depositing larger particles in
stages corresponding to the upper airway and smaller particles in stages corresponding to
the deep lung. Impactors can help predict the deposition pattern of inhaled drug in the
respiratory tract; however, they are by no means lung simulators because of geometry at
the point of particle impact, collection surface hardness and coating, and operation at
constant flow rate in contrast with the variable flow rate in the human lung. It should also
be noted that the impactor stages do not directly correlate with any deposition sites in the
lung [20].
Cascade impactors operate on the mechanism of inertial impaction, wherein the aerosolized
particles are separated on the basis of inertia which is dependent on the particles’ mass and

7
velocity. Thus, aerodynamic particle size can be determined by keeping the particle
velocity constant. Aerosol droplets or particles are drawn through an impactor at a constant
air flow rate and separated by according to size on the different stages. The larger and
heavier particles with higher inertia settle on the initial stages while the smaller and lighter
with lower inertia particles settle on the latter stages [20]. The cut-off diameters for each
stage vary depending on the airflow rate through the impactor and are represented as
particle sizes with a collection efficiency of 50% [41]. The collection efficiency is
determined using the Stoke number which is the ratio of particle stopping distance to the
impactor nozzle distance [42]. The particles larger than the cut-off size settle on the
collection cup at that stage, while smaller particles are carried to the next stage by the air
stream. The various impactors approved by the USP include the Andersen Cascade
Impactor (ACI), Multi Stage Liquid Impinger (MSLI) and the Next Generation Impactor
(NGI) [20].
1.1.1. Next Generation Impactor (NGI)
Figure 3: Next Generation Impactor in closed configuration [43].

8
The NGI is the impactor that was used in our experiments (Figure 3). It is different from
the ACI and MSLI in that it is set up in a horizontal arrangement rather than stacked
vertically one above the other. The use of collection cups as impaction surfaces makes for
easier handling and makes it easier to design modifications for it [20]. The NGI is found to
be operable across a wide range of flow rates and especially preferred for analysis of
aerosolized dry powders [19, 39, 44, 45].
Figure 4: NGI in open configuration [43].
The NGI is a planar impactor with seven stages, also referred to as collection cups or
impaction surfaces that are removable impaction cups aligned in a horizontal arrangement,
with a micro-orifice collector (MOC) at the end (Figure 4). The lower part of the NGI is
the base on which is a frame that holds the collection cups and the upper part is the lid that
holds in place the seal body containing the eight nozzle pieces (Figure 5) and also contains
the inter-stage passageways. The lid attaches to the seal body with the help of two limited
torque screws. There are eight nozzle pieces on the seal body, each of which corresponds
to each of the seven stages and the MOC. Each of the nozzle pieces are designed to
accommodate a specific number and size of holes depending on the stage they correspond

9
to, except the first stage. There are O-rings surrounding the nozzle pieces which help seal
the NGI and prevent any leakage during aerosol testing. The collection cups are tear shaped
and the large end of each is located directly below the nozzle corresponding to that stage,
and that is where particle impaction occurs. The direction of airflow is from this larger
impaction region towards the small end, from where the air is drawn upwards through a
cavity in the lid and directed into the next stage [20].
Figure 5: Seal body of an NGI [43].
The collection cups for stage 1 and the MOC are larger than for the other stages, so as to
minimize the impaction of particles near the walls of the cup, which is also known as
secondary impaction. The other stages are smaller, since secondary impaction is not a
problem at those stages because of the smaller size of the particles that are deposited there.
The MOC is mainly responsible for capturing the smaller particles that escape collection
on the previous seven stages. An external filter holder is attached downstream to the MOC
which contains a glass fiber inserted in it to collect the remaining smaller particles not
captured by the MOC. The NGI is closed by the locking the lid with the bottom frame using
a past-center cam lock handle mechanism at the front of the NGI.
The induction port is the part of the NGI that is used as the entry point for the aerosolized
drug. It is an L-shaped stainless steel tube, one end of which is inserted into the seal body

10
above stage 1 and the other end is used for attaching the inhalation device like the nebulizer
or DPI. It also simulates the human throat in aerosol deposition studies in the NGI. Since
its dimensions, specifically the internal diameter govern the amount of drug that enters the
impactor, it is designed according to USP specifications. The NGI also comes with an add-
on part which is the pre-separator that is mainly used for retention of large particles like
those of diluents such as lactose, especially during analysis of dry powder inhalers, without
affecting the deposition of the smaller drug particles in subsequent stages. It is attached
between the induction port on one end and stage 1 on the other [20, 43].
One of the key parameters in NGI design is the critical impaction distance (Figure 6). It is
the distance between the lip of the collection cup and its bottom (the collection surface),
that is, the depth of a regular NGI collection cup. The distance ‘b’, which is 14.625 ± 0.1
mm for a regular collection cup, needs to be maintained constant in order to achieve
consistent deposition profiles of an aerosolized formulation in the NGI.
Figure 6: Cross-section of an NGI stage. ('b': critical impaction distance)
The logical next step after in vitro evaluation of drug deposition using an impactor is
usually the testing of the absorption and transport of an inhalable formulation using in vitro
cell culture models, wherein the cells are treated with the drug formulation in order to study
its effects on the cell line. In vitro cell culture studies are useful for preliminary toxicity

11
and absorption testing of drug formulations before progress to ex vivo and in vivo studies
[46].
1.2.In vitro cell based lung epithelial models
Cell culture techniques have been gaining importance recently as a complement to animal
studies for many reasons including their lower cost in contrast with intact animal models,
their predictive ability and simulate and their higher and faster throughput. Apart from
reduced cost of operation, in vitro cell culture techniques ensure reproducibility,
robustness, simplicity and better control in performing experiments and in collection of
data [1, 12, 16]. Further, humane considerations dictate that the use of animals in research
be minimized and replaced with suitable alternatives where possible [47]. However, the
major challenge posed to scientists is the development of a universally validated and
standardized in vitro cell culture model [12].
Figure 7: In vitro cell culture model to uptake, absorption and metabolism across the
pulmonary epithelium [1].
The major physical barrier to drug absorption from the lung is the epithelium lining the
airway and the alveoli. Attempts to develop cell monocultures that model the cell types
found in the majority surface area of both airway (columnar cells) and alveolar epithelium
(alveolar type I (ATI) cells) have been underway for the last few decades. Primary cell

12
cultures of lung epithelium have been developed from species like rats and humans,
whereas various immortal human lung epithelial cell lines derived from cancers or
transformed from viruses, such as A549, Calu-3, 16HBE14ο- and BEAS-2B have been
tested for their utility in testing of inhalable drugs [12]. Primary cell cultures of alveolar
type II cells freshly isolated from lung tissue, which can differentiate into type I-like cells
forming tight junctions that resemble the alveolar epithelium are mainly used to replicate
alveolar epithelium since the cell lines available so far are unable to form intercellular tight
junctions. However, even though they are similar to the native epithelium, they are far less
reproducible, convenient and economical as compared to immortal cell lines, which makes
them less suited for absorption studies [15] and the reason why continuous cell lines are
far more commonly used for in vitro studies in laboratories.
Continuous cell lines have the benefit of being culture, maintained and propagated using
standard media and protocols. These cells can be cryopreserved for experimental
flexibility. However, cell models of the lung epithelium often lack features such as
intercellular tight junctions, expression of certain receptors and physiological levels of
product secretion as seen in healthy in vivo tissues. Thus, the choice of cell line is extremely
crucial while designing an in vitro model that mimics the biological barrier [48, 49]. Two
continuous cell lines, Calu-3 and 16HBE14ο- have been developed as models for the
bronchial epithelium, since they are morphologically resemble native bronchial epithelium
epithelium and form a physical barrier to drug absorption from the lung [50–52]. Calu-3
cells are derived from the bronchial adenocarcinoma of the airway [53] and 16HBE14ο-
cells are immortalized and transformed non-carcinoma bronchial epithelial cells obtained
from a 1-year old heart transplant patient [54]. Both cell lines have well differentiated

13
epithelial morphology and tight junctions [1, 16]. A549 is another immortal cell line
derived from a human lung adenocarcinoma that is used to replicate the alveolar epithelium
since it exhibits characteristics of type II pneumocytes which are present in a small surface
area but perform specific functions which makes A549 cells useful in certain studies even
though they are unable to form functional tight junctions [55–59]. All three cell lines form
confluent lung epithelial cell monolayers in culture, enabling the study of the transepithelial
transport kinetics of test molecules, possibly helping predict in vivo absorption of the
molecule.
As opposed to primary cell cultures, continuous cells can be cultured onto collagen-coated
or untreated permeable filter inserts at lower cell densities. Apart from having been grown
in conventional submerged cultures, these cells have been grown under air-interface culture
as well, which involves the removal of culture medium from the apical surface on day 2 or
3 of cell growth. The cells are then allowed to reach confluence using media supplied to
only the basolateral cell surface, thus allowing aerosol particles to be deposited directly
onto semi-dry cell apical surfaces, which is a more realistic replication of aerosol
deposition in vivo [60–62].
1.2.1. Aerosolization onto cell cultures
The conventional approach to testing the deposition and absorption of drugs for pulmonary
delivery dictates that the deposition profile of the powder/solution be obtained followed by
in vitro cell culture studies, wherein the drug solution is directly administered to the cells.
However, this approach fails to account for aerodynamic deposition patterns on doses used
for cell cultures. This separation of methodologies has contributed to poor correlation
between in vitro cell studies and the behavior of some inhaled drug formulations in vivo.

14
A unification of drug deposition patterns and cell culture methodologies would help create
a better model of the human lung in vitro in order to allow scientists to investigate the
pharmacokinetics, pharmacodynamics, and toxicokinetics of inhaled drugs. An in vitro
model that blends aerosol deposition with its absorption and transport studies would be
presumed to be a better predictor of the drug disposition in vivo.
Furthermore, most of the currently used methods for in vitro testing of aerosols involve
submersion in physiological buffers/fluids, in order to enable particle separation from the
medium, quantification of phenomena like particle dissolution and/or polymer degradation
and drug release from polymer particles. However, therapeutic aerosols delivered to the
lung impact on the thin layer of fluid lining the lungs. These considerations have
necessitated the development of a more physiologically relevant model of the human lungs
for aerosol testing [61].
Several reports attempt to unify these approaches for direct aerosolized particle deposition
onto cell cultures grown under both submerged and air interface conditions through some
form of particle impactor (Table 1). Since deposition in cascade impactor gives a general
correlation with drug deposition in the lung regions, specific cell types can be incorporated
in specific impactor stages, thereby exposing the cells to particles of in vivo relevance and
helping design an in vitro model that closely mimics both drug deposition and transport
patterns in the airways.

15
Table 1: Examples of cell culture studies reported in literature using impactors.
(PADDOCC: Pharmaceutical Aerosol Deposition Device on Cell Cultures).
Impactor used Cell line used Formulation tested Reference
Multi stage liquid
impinger (MSLI) Calu-3
Poly(lactic-co-glycolic)
acid microparticles [61]
Viable cascade
impactor (VCI) Calu-3
Micronized fluorescent
marker [62]
Multi stage liquid
impinger (MSLI) Calu-3
Salbutamol sulfate and
budesonide formulations [63]
PADDOCC Calu-3 Salbutamol sulfate and
budesonide formulations [64]
Fiegel et al. [61] investigated the effect of direct impingement of aerosol particles on Calu-
3 cell monolayers grown under conventional liquid-covered culture (LCC) or air-interfaced
culture (AIC) conditions. Poly (lactic-co-glycolic) acid (PLGA) microparticles were
aerosolized directly onto Calu-3 cells grown on TranswellTM inserts placed under the
second stage nozzle of an Astra-type liquid impinger under vacuum at 30 L/min. Studies
using sodium fluorescein showed that the permeability of cells grown under LCC
conditions was significantly higher after microparticle impingement, in contrast with those
under AIC conditions, which remained almost unchanged even after microparticle
deposition. This was thought to be a result of a dense mucus coating developed on the cells
during the AIC which may have protected the cells during impaction [61].
Cooney et al. [62] also studied the effect of direct aerosol deposition on Calu-3 cells grown
under both LCC and AIC conditions, but using a viable cascade impactor to deposit dry
powder particles and nebulizer droplets onto cells grown on TranswellTM filter inserts
placed on stage 5 of the impactor. They obtained similar results as Fiegel et al. [61] for the

16
permeability of the fluorescent markers tested, but they were able to show that this in vitro
model could be applied to nebulizers as well as dry powder inhalers [62].
Bur et al. [63] investigated the transport and absorption of dry powder aerosol formulations
of budesonide and salbutamol across Calu-3 cells grown under AIC and LCC conditions
by delivering the powder through an MSLI, whereby it was deposited onto cell culture
grown inserts placed under the stage 3 nozzle. They demonstrated that dissolution rate of
drugs with low solubility governs their rate of absorption in the limited quantity of fluid
lining the lung. The study overall showed that the cells grown under AIC conditions are
better suited to replicate conditions in vivo than those grown under LCC conditions.
Other studies by Hein et al. [64, 65] using devices like the PADDOCC for delivering
budesonide and salbutamol dry powder formulations to Calu-3 cells and by Lenz et al. [66]
using the ALICE-CLOUD technology to deliver Bortezomib to A549 cells have also
helped paved the way for combining aerosol deposition with subsequent absorption studies
across cell cultures that model lung epithelial cells.
In vitro studies of inhaled drugs would be incomplete without dissolution testing, since the
drug has to first dissolve in the fluid lining the lung before it can be absorbed and show its
action. In vitro dissolution testing can be a reliable and sensitive predictor of in vivo
bioavailability for some drugs [67]. They are regularly used as part of quality control (QC)
studies of commercially manufactured drug formulations for checking batch-to-batch
uniformity, stability and detection of manufacturing variations, if any [68].

17
1.3.In vitro dissolution testing of inhaled drugs
The physical state of a drug determines what happens to it immediately after deposition on
the lung surface. A free, solubilized drug will quickly diffuse into the epithelial lining fluid
(ELF) and become available for absorption, while drug in the form of dry powder particles
must dissolve before it can be absorbed and may even be eliminated by clearance
mechanisms such as mucociliary or cough clearance before absorption can take place [15].
Dissolution is defined as the process by which a solid substance enters into a solvent to
form a solution and is controlled by the affinity between the solid and the solvent. There
are official dissolution tests in various pharmacopeias for testing solid and semi-solid
dosage forms but not specifically for orally inhaled formulations.
The lung clearance rate of highly hydrophilic compounds is not significantly affected by
their dissolution rate, and there are hardly any differences in the pharmacokinetics for
different formulation types, unless regional deposition is greatly affected, or if absorption
is altered by excipients added to the formulation. The absorption of very poorly soluble
compounds which show a fast onset of absorption followed by sustained absorption over
time, is assumed to be governed by dissolution rate. The time to achieve peak concentration
for micronized lipophilic drugs is believed to be related to their intrinsic solubility [69].
Bur et al. [63] showed through in vitro cell culture studies that dissolution of the drug in
the fluid layer over the cells was the rate limiting step for the absorption of drug. Assuming
the rate of absorption of the drug is very fast, the overall rate of the process is limited by
dissolution/drug release.
However, the drug has to dissolve in a very small volume of fluid that is found lining the
lung. A total volume of 10-30 mL of liquid is available for dissolution in the human lung.

18
Its thickness varies from 5-10 µm in the conducting airways and gradually decreases in the
distal alveolar region to about 0.01-0.08 µm, though it may be several microns thick in
pooled areas [10, 70]. These volumes and thicknesses may be much higher in disease
conditions. Thus, it is possible that a drug particle may be completely submerged in the
layer of lining fluid in the conducting airway, whereas the particle size maybe much larger
than the fluid layer thickness in the alveoli. Thus, the area of solid-liquid interface between
the particles and the fluid is proportional to the surface area of the particle in the upper
airways but limited by fluid thickness in the alveolar region, leading us to believe that
particles deposited in the upper airways might dissolve faster than those in the alveoli. On
the other hand, the particles in alveoli may end up dissolving faster due to factors like
higher solubility, greater total interfacial surface area and/or faster peripheral absorption
[15].
The testing of pulmonary dissolution in vitro is a complex task, since each of the parameters
affecting dissolution will be different depending of specific lung regions, leading to a
variety of different dissolution processes occurring simultaneously, unlike dissolution in
the gastrointestinal tract (GIT), which is a continuous process occurring over a series of
tanks [71]. Dissolution testing of an inhalable drug would need to take into account the
large surface area and small volume of fluid lining the lung surface, which is considered to
be mostly stationary. Consequently, knowledge in the area of drug dissolution in the lungs
is not as advanced as that of the GIT. As a result, there are currently no in vitro dissolution
models to help predict in vivo release for orally inhaled formulations as opposed to the
standard test methods established for oral solid dosage forms [72]. However, several
attempts have been made to develop suitable dissolution models [73].

19
Commercial models like the type 2 dissolution apparatus have been used to study dry
powder dissolution by direct placement of the powder in the vessel [74] or into a modified
basket to prevent escape directly into the media [75, 76]. Most of the models submerge the
powder in large volumes of dissolution medium [67, 68], but models that replicate the air-
liquid interface have also been demonstrated [77]. However, not all of these models
performed dissolution testing after deposition using a cascade impactor. Samples of correct
aerodynamic particle size distribution can be obtained by first deposition of aerosol through
a cascade impactor, in order to give a more realistic picture of the size-wise deposition of
particles in different lung regions. But the mass of drug per surface area is kept significantly
higher, owing to difficulties in quantification otherwise, thereby making the model lose in
vivo significance to some extent. In spite of the relative simplicity of in vitro dissolution
models compared to the physiologically complex in vivo conditions, a correlation has been
obtained in certain cases between in vitro dissolution and in vivo release, especially in case
of modified release formulations [15, 78]. Several reports in literature describe attempts
made to develop testing methods for aerosol formulations for inhalation after deposition
using a cascade impactor [79].
Davies and Feddah [67] developed a model wherein dissolution of three glucocorticoids
was studied in a flow-through cell following administration into an ACI, using water,
simulated lung fluid (SLF) and modified SLF with L-α-phosphatidylcholine (DPPC) as
dissolution media, keeping temperature and flow rate constant. The dose fraction to be used
for dissolution was captured using a fiber filter enclosed in a stainless steel holder
incorporated in the ACI. This method was able to study dissolution of poorly soluble
glucocorticoids in aerosol form. The maintenance of sink conditions and minimization of

20
sample loading effects due to better dispersion in the fiber filter are some advantages of
this model, whereas its drawbacks are the use of non-standard dissolution apparatus and
the dependence of dissolution profile on the flow rate [84].
Table 2: Examples of dissolution studies for inhaled drugs in literature [79].
Dissolution
Apparatus
Aerosol particle
collector Comments Reference
Flow-through cell
apparatus
Fiber filters
between membrane
filters in stainless
steel holders
Linear dependence of
dissolution rate with flow
rate
[67]
Franz cell
apparatus
0.45 µm
microcellulose
membrane
Receptor cell connected to
1 L heated vessel [80]
Paddle apparatus
(USP type 2)
1 µm polycarbonate
(PC) membrane
Dissolution rate affected
by uniformity of drug
loading and particle size
[68]
Paddle over disk
apparatus NGI dissolution cup
Dissolution rate dependent
on drug loading [81]
Transwell®
system apparatus
0.22 µm
polyvinylidene
(PVDF) membrane
filter
Dissolution rate dependent
on filter loading [82]
Paddle apparatus
(type 2) Stainless steel filter
Dissolution rate dependent
on drug loading/filter
orientation
[83]
Arora et al. [82] studied the dissolution of a series of commercial corticosteroid inhaler
formulations after their deposition on polyvinylidene fluoride (PVDF) membranes placed
at stages 2 and 4 of an ACI. The membrane was then placed in the donor compartment of
a Transwell® system with the drug-loaded side facing the receiver compartment and 0.04
mL of medium, either deionized distilled water (DDW) or phosphate buffer saline (PBS),
was added to the donor compartment and dissolution profiles obtained at 37°C and 100%
humidity. The aim of the study was to study the dissolution of respirable aerosol particles

21
in conditions resembling the limited volume of mostly stationary fluid in the lung. One of
the advantages of this system is the simulation of in vivo conditions due to the diffusion
(unstirred) mechanism while some of its drawbacks include that the PVDF membrane is
not representative of lung permeability and the extremely small fluid volume leads to lower
dissolution and permeation rates at higher drug loading [84].
Son and McConville [81] developed a method wherein they modified different stages of
the NGI to include the NGI dissolution cup instead of the regular collection cup. The
particles of commercial dry powder inhalers were collected and the insert in the dissolution
cup removed, covered by polycarbonate membrane, secured with the membrane holder and
dissolution carried out in a conventional dissolution tester using different media like
phosphate buffer, PBS and SLF for dissolution. They further carried out optimization of
parameters like collection surface, agitation speed and dissolution media using this model.
The commercial availability of the NGI dissolution cup, use of standard dissolution
apparatus and the ability to analyze particle size fractions on individual stages are some of
the advantages of this system, while dependence of dissolution rate on drug loading is a
drawback [84].
1.4.Hypothesis and Specific Aims
As previously discussed, an in vitro model that integrates aerosol deposition and cell
culture testing of drugs for pulmonary delivery would be an improvement in the prediction
of in vivo drug toxicity and absorption compared to current approaches. Previous studies
that [61–63] have demonstrated the feasibility of incorporation of cell cultures in various
cascade impactors, have failed to utilize the NGI which has been shown to give more
accurate measurements for aerosols over a range of flow rates from 15-100 L/min apart

22
from being especially preferred for the analysis of dry powder deposition as compared to
the ACI or MSLI [19].
Furthermore, there are currently no standardized tests for studying the dissolution of orally
inhaled formulations unlike those for oral solid dosage forms, even though dissolution is
considered to be an essential quality control tool for evaluation of commercial
formulations. Most of the methods that have been developed so far either do not consider
that there is a small volume of fluid lining the lung or they use the entire emitted dose for
analysis instead of the respirable fraction [67].
The objective of this research project was to design a small volume liquid impaction
surface (SVLIS) as a modification to the NGI which would facilitate incorporation of cell
cultures in the NGI to enable direct deposition of aerosolized drug on cells. To make sure
the modification did not alter the aerodynamic parameters of the drug, aerodynamic
parameters aerosolized in the modified needed to be determined and compared with those
obtained from an unmodified NGI. Another objective was to develop a dissolution testing
method using a model drug to test the extended application of the same modification to
better replicate conditions during dissolution in vivo.
The hypothesis of this thesis project was that the incorporation of a SVLIS in the NGI does
not affect the aerodynamic deposition profile of aerosolized drugs and can be used for
expanded in vitro evaluation of aerosolized drug formulations.
Three specific aims were designed in order to prove this hypothesis. The first aim was to
design a SVLIS and incorporate lung cell cultures into the NGI. The second aim involved
the evaluation of deposition patterns in the SVLIS in comparison with normal impaction

23
surfaces. The third aim was to study the dissolution profile of a powdered drug using the
SVLIS.

24
CHAPTER 2
Specific Aim 1: To design a small volume liquid impaction surface (SVLIS) and
incorporate lung cell cultures into the NGI using the SVLIS

25
2. Background
The first step in developing an in vitro model was to design a modification to the NGI that
would serve as a liquid impaction surface. In order to be useful as a tool for performing in
vitro cell culture studies and for dissolution testing of orally inhaled drug products, the
liquid impaction surface to be designed to replace a regular NGI collection cup needed to
fulfill certain requirements. First and foremost, the volume of liquid present should be
minimum so as to form a thin liquid layer, because the lung is lined with a thin layer of
fluid ranging from a thickness of 0.01-10 µm in different regions [10, 70]. Also, since one
of the potential applications of the modification was to be for growing cell cultures, it
needed to be designed in a way that visualization of cells under a microscope would be
possible.
2.1. Design of the Small Volume Liquid Impaction Surface (SVLIS)
A previously custom designed deep collection cup made of aluminum was previously used
in our lab [85] as a modification to be incorporated in stage 4 of the NGI instead of a regular
collection cup for incorporation and testing of bacterial cultures. During experiments, this
deep cup was filled with 42 mL of liquid in order to maintain the USP specified critical
impaction distance ‘b’. The same deep collection cup was initially considered for use in
our studies for growing cell culture and dissolution testing. However, it neither fulfilled
the requirement of a small volume nor would it be easily possible to grow or visualize the
cells in the aluminum cup.
In order to resolve these issues, a new collection surface was developed, an insert which
would fit into the commercially available gravimetric cup (MSP Corporation, Shoreview,
MN). All the parts of the modification needed to be autoclavable, since cells were to be

26
grown in them under sterile conditions. The gravimetric cup itself is made out of stainless
steel, but the materials chosen for the insert were a plastic called Lexan for the body and
glass for its bottom surface, so that it would be transparent and enable visualization under
the microscope. The O-rings were made of rubber.
All the materials were tested and were found to show no visible changes after autoclaving
them at 121ºC for 25 minutes. The dimensions were such as the well would contain 5 mL
of liquid when filled to the brim and consequently the critical impaction distance would
remain unchanged. Henceforth, this modification will be referred to as the Small Volume
Liquid Impaction Surface or the SVLIS and the deep cup modification will be referred to
as the Large Volume Liquid Impaction Surface or the LVLIS. The figure 8 shows an
unmodified collection cup, the LVLIS and the SVLIS kept side by side and figure 9 shows
the schematic cross-sectional representation of all three in order to better understand how
the critical impaction distance ‘b’ in the design would be maintained constant even after
modification.
The figure 10 shows the detailed schematic design of the SVLIS, consisting of three main
parts; the plastic body, the sight glass bottom and the O-rings to hold them together. The
metal base attached to the glass bottom with the help of three screws was part of the first
prototype, but was later done away with since it was deemed unnecessary for the design.
The figure 11 shows the exact dimensions of the SVLIS. All the parts were made to so they
could be disassembled and assembled again to form the small volume insert as shown in
figure 12.
The insert was designed so as to fit into the gravimetric cup, with the lip of the insert flush
with the bottom surface of the gravimetric cup to form an airtight seal. Leak tests were
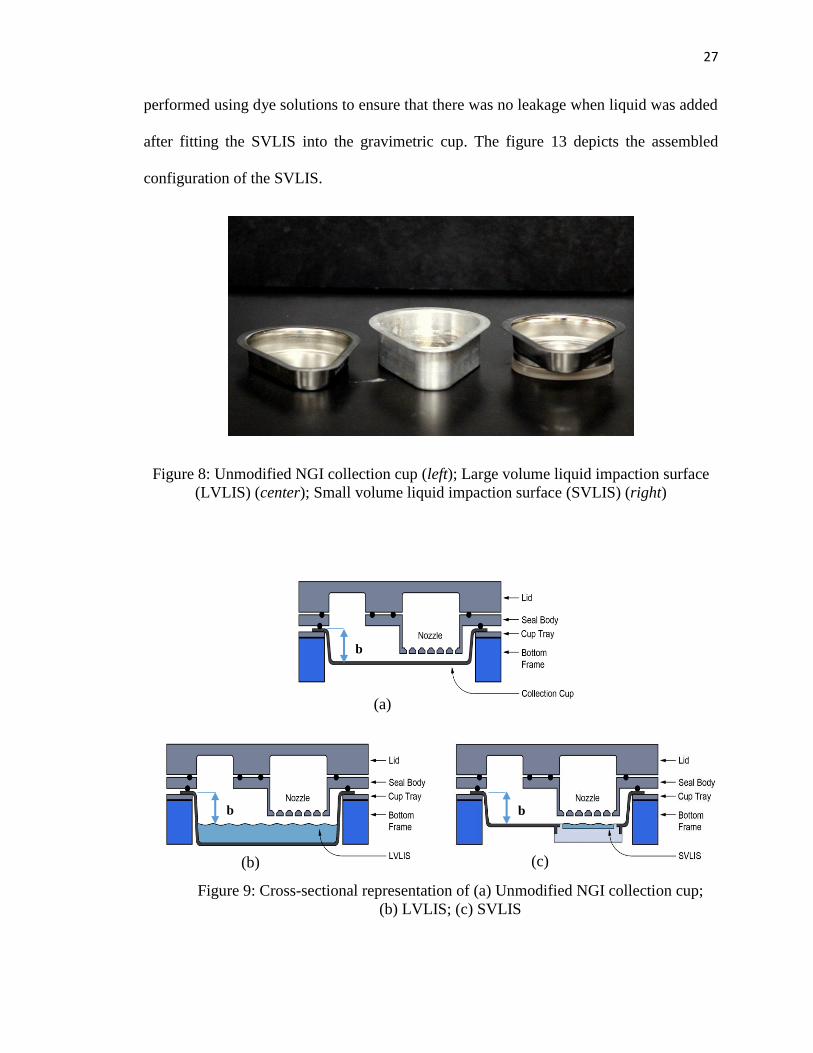
27
performed using dye solutions to ensure that there was no leakage when liquid was added
after fitting the SVLIS into the gravimetric cup. The figure 13 depicts the assembled
configuration of the SVLIS.
Figure 8: Unmodified NGI collection cup (left); Large volume liquid impaction surface
(LVLIS) (center); Small volume liquid impaction surface (SVLIS) (right)
b
b b
(a)
(b) (c)
Figure 9: Cross-sectional representation of (a) Unmodified NGI collection cup;
(b) LVLIS; (c) SVLIS

28
Figure 11: Dimensions of SVLIS (Capacity: 5 mL)
(a)
Sight glass
O-ring
Plastic body
O-ring
Metal base
Screw
(b)
Figure 10: Design of SVLIS. (a) Cross-sectional view; (b) three-dimensional view

29
Figure 12: Final design of the SVLIS insert. (a) Top view; (b) Side view
Figure 13: SVLIS insert assembled with the NGI gravimetric cup. (a) Top view; (b) Side view
2.2. Cell growth on SVLIS
The model cell line used for the subsequent studies is the A549 cell line. A549 is a
continuous cell line established in 1972 from a human pulmonary adenocarcinoma [57],
which expresses the differentiated biochemical properties of type II pneumocytes [55, 56].
Even though type II pneumocytes contribute only to about 10% of the surface area of the
deep lung, they are present in a large number and believed to perform distinct functions
(a) (b)
(a) (b)

30
like production of surfactant; they are also believed to be progenitor of type II cells and
play a role in oxidative metabolism of drugs in the lung [86]. Also, A549 have been shown
to be unable form functional tight junctions [58]. As a result, primary cell culture growing
in confluent monolayers is most often used to obtain alveolar type I-like epithelial cells.
However, A549 cells are accepted as a model for toxicity studies [59, 87–89], since they
are fast growing cells that form a confluent monolayer in culture and are easy to handle.
Furthermore, A549 cells have been demonstrated to uptake microspheres in the respirable
range (~3 µm), making them useful in studying the mechanisms of pulmonary drug
delivery of macromolecules and studies have also shown that they are useful in studying
clearance of environmental particulates [90, 91]. For the purpose of the following studies,
MTT assay was used as a means to determine cell viability after growing cells in the SVLIS
and exposing them to airflow and saline in the NGI. The MTT assay is a simple, rapid and
sensitive screening procedure usually used for determining drug or excipient toxicity in an
in vitro system [92].
2.2.1. Materials
The gravimetric collection cup used in the modification of the NGI (MSP Corporation,
Shoreview, MN) was obtained from the MSP Corporation (Shoreview, MN). The glass
bottomed insert for the gravimetric cup was obtained custom-made from Benson Machine
Works Inc. (Omaha, NE). The A549 cell line obtained from the American Type Culture
Collection (ATCC, Rockville, MD) was used for the study. The medium used was Ham’s
F-12K medium supplemented with 10% v/v fetal bovine serum (FBS), 1% v/v L-
glutamine, 1% v/v non-essential amino acids (NEAA), 1% v/v penicillin-streptomycin
solution and 1% v/v sodium pyruvate. Sterile poly-d-lysine for coating the SVLIS was

31
obtained from EMD Millipore (Billerica, MA). Normal saline obtained from Ricca
Chemical Company (Arlington, TX) was sterilized by sterile filtration.
2.2.2. Methods
2.2.2.1.Growth of cells on the SVLIS
The SVLIS was autoclaved to sterilize it and taken inside the cell culture hood for coating
its glass bottom. The sterile poly-d-lysine solution was diluted to a final concentration of
100 µg/mL using autoclaved water. 5 mL of this solution was pipetted out on the SVLIS
and left overnight in the hood. The SVLIS was placed inside a closed sterile petri dish
throughout the course of all experiments to keep it covered in order to maintain its sterility.
Just before starting the experiment, the coating solution was removed from the SVLIS and
it was washed with the cell culture medium to wash off the excess and ensure uniform
coating every time. On day one of the experiment, the cells were passaged and seeded on
the SVLIS at the seeding density of 1.068 x 10⁶ cells/mL. After plating, the SVLIS was
maintained at 37ºC in an incubator at a relative humidity of 85% in an atmosphere of 5%
CO2. The cells were observed under a microscope every day for a week and pictures were
taken using a camera attached to the microscope at a magnification of 200x. The medium
in the SVLIS was removed and replaced with 5 mL of fresh medium every other day. At
the end of every experiment, all the SVLIS components were washed and cleaned
thoroughly and soaked in hydrochloric acid before autoclaving to remove any residual
coating.
2.2.2.2.Assembly and operation of the NGI
The NGI was assembled as specified in the USP. The induction port was attached to the
mouth of the main frame of the NGI. The external filter was fitted into the filter holder

32
provided to capture droplets that had escaped impaction on the MOC and the entire
assembly was connected to a vacuum pump. The airflow inside the NGI was calibrated to
15 L/min using the airflow meter connected to the mouth of the induction port via a custom-
made airtight silicone elastomer fitting to maintain the vacuum inside.
2.2.2.3.Incorporation of cells in the NGI
The next step was to study the effect of airflow on the cells when grown on the SVLIS and
incorporated in the NGI. For this purpose, the NGI had to be thoroughly cleaned first and
sterilized as necessary. Before the start of the experiment, the collection cups, gravimetric
cup, the filter assembly and the induction port were sterilized by autoclaving. The airflow
meter was surface sterilized using paraformaldehyde by placing it in an airtight chamber
overnight. Autoclavable tubing was obtained so that the NGI assembly could be connected
to the compressor which is outside the cell culture hood. All the other parts of the NGI,
including the base, body and the orifice plate were disinfected using 70% ethanol, before
bringing them inside the hood (Figure 14).
Figure 14: NGI cleaned, sanitized and taken inside cell culture hood

33
On day one of the experiment, the cells were split as usual and plated in six different
SVLIS, three as “controls”, again at a seeding density of 1.068 x 10⁶ cells/mL. Three of
these SVLIS were meant to be used as “controls”, meaning that they were not to be exposed
to airflow and would be kept in the incubator throughout the course of the study. The three
other SVLIS were meant to be used as “samples”, meaning that the cells in them would be
exposed to airflow inside the NGI. After 24 hours of plating the cells, that is, on day two
of the experiment, the cleaned and sterilized NGI was assembled inside the cell culture
hood as instructed in section 3.3.2. The SVLIS containing A549 cells was incorporated in
stage 4 of the NGI, since in the past, modifications to the NGI have been primarily carried
out on this stage [85]. The NGI was allowed to run at 15 L/min for 10 minutes with the
SVLIS containing cells at stage 4. No drug was aerosolized through the NGI and only air
was allowed to pass through the system as treatment to the cells. At the end of 10 minutes,
the SVLIS containing A549 cells was removed, covered using the petri dish (figure 15)
and incubated for 4 hours. After the incubation period, since there was no treatment to be
removed, the medium was removed from over the cells and replaced with 5 mL of fresh
medium and the SVLIS was incubated for 72 hours. The medium in the SVLIS was
removed and replaced with 5 mL of fresh medium every other day.
Figure 15: 'Controls' and 'Samples' plated in the SVLIS placed in petri dishes

34
After 72 hours of incubation, an MTT assay was performed to determine cell viability. The
cells in the SVLIS were treated with 1 mL of MTT solution (5 mg/mL) prepared in
Dulbecco’s phosphate buffered saline (DPBS) and incubated for 4 hours. After incubation
for 4 hours, the MTT treatment was removed from the cells along with the medium and the
cells were then treated with 5 mL a 1:1 solution of 20% w/v sodium dodecyl sulfate (SDS):
dimethylformamide (DMF). The SVLIS was then kept inside an incubator-shaker (MaxQ
4450, Thermo Scientific) for an hour at 37ºC. The resultant solution was then pipetted out
in triplicates in a 96-well plate and analyzed at 540 nm using the Synergy H1 Hybrid Multi-
mode Microplate Reader (Biotek Instruments Inc., Winooski, VT).
After the effect of airflow on cells, the effect of an inert solution, such as normal saline was
to be studied on the cells incorporated in the NGI. For this next study, the NGI and its
assorted parts were cleaned and sterilized again. This time the Aeroneb Pro nebulizer was
also autoclaved. The cells were split and plated in six SVLIS as above, three of which were
used as “controls” and no saline was nebulized onto them. The other three were the
“samples” and were to be incorporated in the NGI and saline was to be nebulized onto
them. The same study as described above was performed by nebulizing normal saline into
the NGI containing the cells in the SVLIS at stage 4 for 10 minutes, instead of just passing
airflow through it. The subsequent steps performed were also as described above.
Both the experiments were performed in triplicate to enable statistical analysis on the data
obtained. Statistical significance was determined using the Student t-test. The cells were
observed under the microscope and pictures were taken at 200x throughout the course of
the experiments.

35
2.2.3. Results and Discussion
2.2.3.1.Growth of cells in the SVLIS
The figure 16 shows the growth of the A549 cells in the SVLIS for a period of 6 days,
when confluence was reached. From the figure, cells were observed to grow at an expected
rate in the SVLIS and it can be inferred that the glass bottom of the SVLIS can be made
conducive to the growth of A549 cells.
2.2.3.2.Incorporation of cells in the NGI
After it was established that it was possible to grow cells on the glass bottom of the SVLIS,
an attempt was made to incorporate the cells growing on the SVLIS at stage 4 of the NGI.
For that purpose, the cells were plated, then placed at stage 4 in the NGI and exposed to
airflow for 10 minutes, following which they were allowed to grow. Another experiment
Day 1 Day 2 Day 3
Day 4 Day 5 Day 6
Figure 16: Cell growth observed in SVLIS over 6 days
36
in which saline was aerosolized through the system instead of exposing the cells to airflow
only.
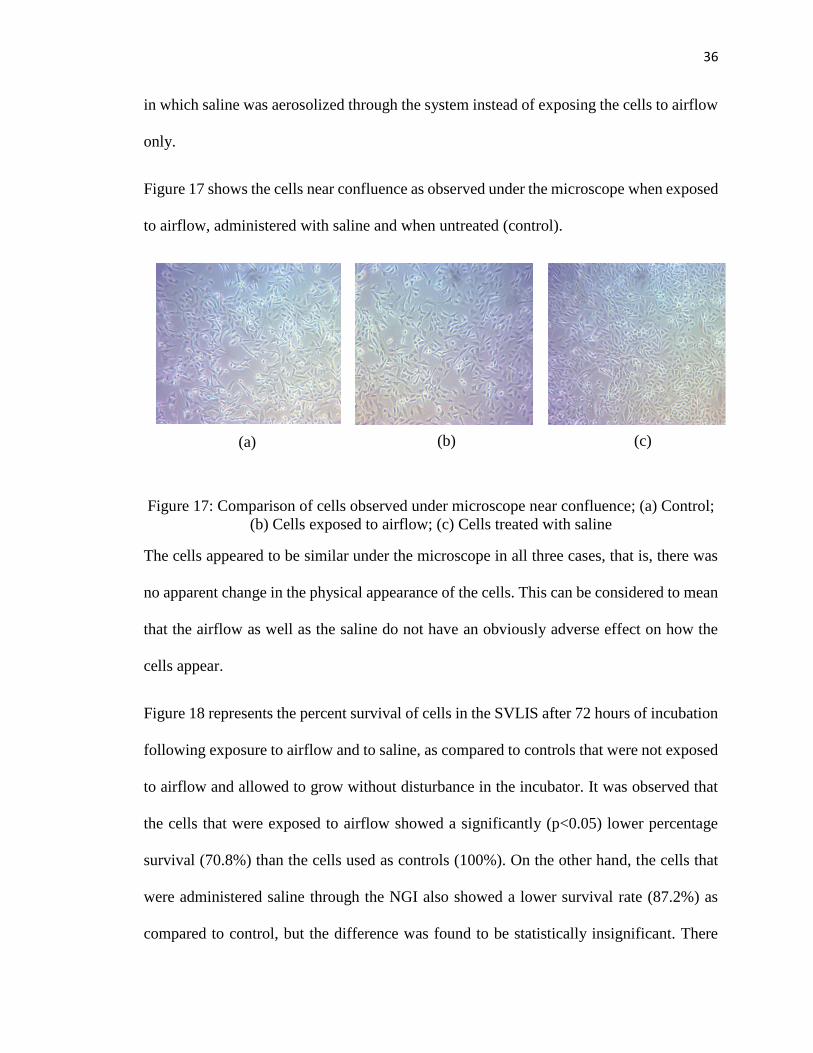
Figure 17 shows the cells near confluence as observed under the microscope when exposed
to airflow, administered with saline and when untreated (control).
Figure 17: Comparison of cells observed under microscope near confluence; (a) Control;
(b) Cells exposed to airflow; (c) Cells treated with saline
The cells appeared to be similar under the microscope in all three cases, that is, there was
no apparent change in the physical appearance of the cells. This can be considered to mean
that the airflow as well as the saline do not have an obviously adverse effect on how the
cells appear.
Figure 18 represents the percent survival of cells in the SVLIS after 72 hours of incubation
following exposure to airflow and to saline, as compared to controls that were not exposed
to airflow and allowed to grow without disturbance in the incubator. It was observed that
the cells that were exposed to airflow showed a significantly (p<0.05) lower percentage
survival (70.8%) than the cells used as controls (100%). On the other hand, the cells that
were administered saline through the NGI also showed a lower survival rate (87.2%) as
compared to control, but the difference was found to be statistically insignificant. There
(a) (b) (c)

37
was also found to be a significant difference between the percent survival of cells exposed
to airflow alone and those administered with saline, as can be seen in the graph.
Figure 18: Cell survival in the SVLIS after 72 hours of treatment
The results obtained after administration of normal saline as an inert solution to cells
incorporated into the NGI with the help of the SVLIS were encouraging, in that the cells
showed more or less similar growth to control cells. However, a significant difference was
observed between the percentages of cells that survived, when exposed to airflow at the
rate of 15 L/min continuously for 10 minutes inside the NGI, as compared to the controls.
One reason for this may be that the air flowing through the NGI is causing evaporation of
the medium from above the cell layer (studied in detail in section 3.5), thus causing drying
out and consequent cell death, since fresh medium is only added to the cells 4 hours after
treatment. On the other hand, the since nebulization of saline through the system lessens
the possibility of evaporation and helps prevent drying out, percentage of surviving cells
may be higher than for cells only exposed to airflow.
100%
70.8%
87.2%
0%
20%
40%
60%
80%
100%
120%
140%
Control Airflow Saline
Cel
l su
rviv
al
Treatment
% Cell survival
*

38
Thus, the SVLIS may have a potential application especially for in vitro testing of
nebulized drug formulations. It may also be noted that in a scenario where drug is to be
administered using a metered dose inhaler (MDI) or a dry powder inhaler (DPI), the
actuation of the inhaler and hence, the time for which the cells would be exposed to high
airflow rates, would be a few seconds at most. That might minimize cell death due to
evaporation of medium. However, more studies need to be performed using MDIs and
DPIs at the pertinent airflow rates in order to obtain conclusive evidence regarding the
same. Those studies are not in the scope of this thesis and will not be discussed in further
detail. Meanwhile, it can be inferred from the available evidence that using the SVLIS to
incorporate cell cultures in the NGI is a promising new method for in vitro testing of orally
inhaled formulations.
2.2.4. Summary of preliminary studies
2.2.4.1.Cell growth in LVLIS
The modification to the NGI previously used in our lab was the aluminum deep collection
cup or the large volume liquid impaction surface (LVLIS) to replace the regular collection
cups. The LVLIS was initially considered for use as a tool for in vitro testing of inhalable
formulations by using it to incorporate cell cultures in the NGI. Consequently, an attempt
was made to study the effect of exposing A549 cells to this LVLIS before eventually
developing the SVLIS.
2.2.4.2.Materials
Deep collection cups machined from block aluminum were obtained custom made from
Benson Machine Works Inc. (Omaha, NE). Sterile petri dishes were obtained from Fisher

39
Scientific (Pittsburgh, PA). The medium was prepared and sterilized as described in section
2.2.2.1.
2.2.4.3.Methods
Two of the deep collection cups (LVLIS) were sterilized by autoclaving before starting the
experiment. The cells were passaged and 42 mL of the resulting cell suspension was used
as sample for exposure of the cells to the aluminum plate and the petri dish. 42 mL each of
the cell suspension was poured into the LVLIS and the petri dish, which was used as
control. The suspension was poured into both the LVLIS and the petri dish, allowed to sit
for 15 minutes before plating them in a six well plate in triplicate as well and both sets of
cells (control and sample) were incubated. At the end of 96 hours, an MTT assay was
performed as described in section 2.2.2.1 to determine cell viability.
2.2.4.4.Results and Discussion
Figure 19 represents the growth of cells (percent survival) following incubation for 96
hours after exposing the cells to the aluminum LVLIS for 15 minutes, as compared with
cells exposed to regular sterile petri dishes for the same amount of time as control. The
cells that were exposed to the aluminum SVLIS for 15 minutes before incubation for 96
hours (4 days) showed a survival rate only slightly less (93.6%) than the controls exposed
only to a plastic petri dish (100%), but the difference between the two was not significant
(p>0.05).

40
Figure 19: Cell survival 96 hours after exposure to metallic LVLIS
Even though the results obtained from the above study were encouraging, there were
certain drawbacks associated with using the LVLIS to modify the NGI for use in in vitro
cell culture studies. In order to function at the correct critical impaction distance ‘b’, the
LVLIS needs a large quantity of liquid (42 mL) to be added to it. This would not simulate
the conditions in a healthy human lung since a small volume of fluid is present lining the
lungs and the thickness of fluid lining in most areas is not more than 10 µm and in some
areas, it may be as low as 0.08 µm [10, 70]. Secondly, the metallic nature of the LVLIS
made it difficult to actually grow the cells on its bottom surface and even more difficult to
visualize them under a microscope due to the opacity of its bottom surface. That was the
rationale behind only exposing the cells to the LVLIS and then plating them in a plastic
six-well plate, rather than attempting to grow the cells on the metal directly. Thus, in order
to overcome these drawbacks, the SVLIS was designed to have a glass bottom to enable
cell visualization and to contain a smaller volume of liquid (5 mL).
100.0%93.6%
0%
20%
40%
60%
80%
100%
120%
Control (Petri dish) Sample (LVLIS)
Cel
l su
rviv
al
Treatment
% Cell survival

41
CHAPTER 3
Specific Aim II: To evaluate the deposition patterns in a SVLIS compared to normal
impaction surfaces

42
3. Background
For the purpose of this thesis project, the NGI was modified to serve as an enhanced in
vitro testing model. It was critical to ensure that any modification introduced into the NGI
would not affect the deposition and aerodynamic parameters of the formulation aerosolized
through the NGI. It was also necessary to compare these properties in the modification with
those of drug aerosolized through unmodified NGI. This section describes the evaluation
of aerosol deposition patterns and aerodynamic properties the SVLIS modified NGI.
3.1.Selection of model drug
Figure 20: Structure of theophylline [93]
The primary purpose of this aim was to study and compare the aerodynamic parameters
and deposition patterns of an aerosol nebulized through an unmodified NGI with those
from a SVLIS modified NGI. Theophylline was chosen as a model drug for use in
nebulized solutions. Theophylline, chemically known as 1, 3-dimethylxanthine, is a white,
odorless, crystalline, bitter tasting powder with a molecular weight of 180.164 Da (Figure
20). Theophylline is a bronchodilator used to relieve airflow obstruction in acute asthma
patients and to reduce the severity of symptoms in patients suffering from chronic asthma.
It is soluble in water up to a concentration of 8.3 g/L at 20ºC and has a distinctive ultraviolet

43
(UV) absorbance with maximum absorbance (λmax) at a wavelength of 273 nm. All these
factors made theophylline a sound choice for the model drug.
3.2.Method for detection of theophylline
3.2.1. Materials
Anhydrous theophylline was obtained from the City Chemical Corporation (New York,
NY). A PURELAB Ultra water purification system (ELGA LabWater, Woodridge, IL) was
used to obtain the deionized water. A Synergy H1 Hybrid Multi-mode Microplate Reader
(Biotek Instruments Inc., Winooski, VT) was used for the detection of theophylline and
data analysis was performed using the Gen5 Data Analysis Software (Biotek Instruments
Inc., Winooski, VT). 96-well plates obtained from Corning Inc. (Corning, NY) were used
for detection of theophylline in the microplate reader.
3.2.2. Methods
A theophylline stock solution was prepared by dissolving 25 mg of theophylline in 50 mL
tap water, to produce a solution of concentration 500 µg/mL. Dilutions were made from
the stock using deionized water in a ratio of 1:3 for preparations of a standard curve of
theophylline. The Gen5 Data Analysis software was used to create a protocol for setting
the study parameters. The detection method was set so as to measure the absorbance of the
sample solutions at a wavelength of 273 nm (λmax of theophylline). The blanks, standards
and samples were assigned appropriate names in the “plate layout” section. The
“Transformation” section was set to subtract each well from the blank well to negate effects
from any contaminants.

44
200 µL of each of the dilutions and the blank (deionized water) was pipetted into the 96-
well plates in triplicate. The absorbance of the solutions were obtained by reading the plate
in the plate reader at 273 nm using the aforementioned protocol. A standard curve was
obtained by plotting the curve of absorbance against the known concentrations of each
dilution. The concentrations of unknown solutions were determined using their absorbance
by extrapolation on this curve.
3.2.3. Results and Discussion
A linear standard curve was obtained by plotting a graph of absorbance vs concentration.
The plate reader was found to be able to detect concentrations of theophylline between
55.556 µg/mL and 0.008 µg/mL (Figure 21). The curve was plotted and the equation found
using the Microsoft Excel software. A correlation coefficient (R2) value of 1 was obtained
indicating a goodness of fit of the line. The slope and intercept of the line was calculated
and then the values used to calculate the concentration of unknown solutions using equation
1 as under:
𝐶𝑜𝑛𝑐𝑒𝑛𝑡𝑟𝑎𝑡𝑖𝑜𝑛 𝑜𝑓 𝑈𝑛𝑘𝑛𝑜𝑤𝑛 𝑠𝑜𝑙𝑢𝑡𝑖𝑜𝑛
= (𝐴𝑏𝑠𝑜𝑟𝑏𝑎𝑛𝑐𝑒 𝑜𝑓 𝑈𝑛𝑘𝑛𝑜𝑤𝑛 𝑠𝑜𝑙𝑢𝑡𝑖𝑜𝑛 − 𝐼𝑛𝑡𝑒𝑟𝑐𝑒𝑝𝑡)/𝑆𝑙𝑜𝑝𝑒 … (1)
These results indicated that it is possible to detect and quantify theophylline using its UV
absorbance in a plate reader. The method was also found to be reproducible, ensuring
consistency in results obtained in future experiments.
45
Figure 21: Typical standard curve of theophylline
3.3.Validation of Unmodified NGI
3.3.1. Materials
Anhydrous theophylline was obtained from the City Chemical Corporation (New York,
NY). The PURELAB Ultra water purification system (ELGA LabWater, Woodridge, IL)
was used to obtain the deionized water. The theophylline solution was aerosolized into the
Next Generation Impactor (MSP Corporation, Shoreview, MN) using an Aeroneb Pro
nebulizer (Aerogen Ltd., Galway, Ireland). The airflow rate in the NGI was calibrated using
the TSI 4000 series airflow meter (TSI, MN, USA). A glass fiber filter (MSP Corporation,
Shoreview, MN) was attached to the NGI to entrap any droplets that escaped impaction on
the last collection cup (MOC). A Synergy H1 Hybrid Multi-mode Microplate Reader
(Biotek Instruments Inc., Winooski, VT) was used for the detection of theophylline and
data analysis was performed using the Gen5 Data Analysis Software (Biotek Instruments
Inc., Winooski, VT). 96-well plates obtained from Corning Inc. (Corning, NY) were used
to hold the samples for detection.
y = 0.0327x + 0.0527
R² = 1
0.0
0.2
0.4
0.6
0.8
1.0
1.2
1.4
1.6
1.8
2.0
0 10 20 30 40 50 60
Ab
sorb
an
ce
Concentration (µg/mL)
Std Curve Linear (Std Curve)

46
3.3.2. Methods
3.3.2.1.Preparation of theophylline solutions
5 mL of the stock solution prepared as described previously in section 3.2.2 (500 µg/mL),
was used as the sample solution for nebulization into the NGI. Tap water was used since
the traces of ions present in the tap water are essential for nebulizing the drug.
3.3.2.2.Assembly of the NGI
The NGI was assembled and operated as specified in section 2.2.2.2. The airflow inside
the NGI was calibrated to 15 L/min using the airflow meter connected to the mouth of the
induction port via a custom-made airtight silicone elastomer fitting to maintain the vacuum
inside.
3.3.2.3.Nebulization of theophylline solution
The Aeroneb Pro nebulizer was set up so as to enable entry of the aerosol into the NGI
through the induction port due to the airflow movement. 5 mL of the theophylline stock
solution (corresponding to 2.5 mg of theophylline) was pipetted out into the head of the
nebulizer. The control unit and the vacuum pump was switched on and the theophylline
solution was allowed to nebulize through the NGI till dryness for a period of 10 minutes.
3.3.2.4.Recovery and Analysis of nebulized theophylline
The theophylline solution and droplets deposited on each component of the NGI (head,
neck of nebulizer, induction port, stages 1-7, orifice plates and filter) were collected
following aerosolization. The collection was carried out in separate volumetric flasks
assigned to each component by washing each of the components at least thrice with

47
deionized water and then the volume in each flask was made up to 100 mL using deionized
water. The sample recovered from the NGI filter was filtered using a 0.2 µm filter, so as to
clear the solution of any glass fibers. Each nebulization was performed in triplicate.
Following the procedure described in section 3.2.2., each of the collected samples was
pipetted out in triplicate in a 96-well plate and read using the Synergy H1 Hybrid
Multimode Microplate Reader and subsequently analyzed using the Gen5 Data Analysis
Software. A standard curve was also run along with the sample as described in section 3.2.2
to enable determination of the unknown concentrations. The amount of drug deposited in
the induction port and the NGI is defined as the Emitted Dose (ED). The amount of drug
deposited in the NGI (% recovery) was calculated using equation 2:
𝑃𝑒𝑟𝑐𝑒𝑛𝑡 𝐷𝑜𝑠𝑒 𝑟𝑒𝑐𝑜𝑣𝑒𝑟𝑒𝑑
= (𝐴𝑚𝑜𝑢𝑛𝑡 𝑜𝑓 𝑑𝑟𝑢𝑔 𝑟𝑒𝑐𝑜𝑣𝑒𝑟𝑒𝑑 𝑓𝑟𝑜𝑚 𝑡ℎ𝑒 𝑛𝑒𝑏𝑢𝑙𝑖𝑧𝑒𝑟 𝑎𝑛𝑑 𝑁𝐺𝐼)
/(𝐴𝑚𝑜𝑢𝑛𝑡 𝑜𝑓 𝑑𝑟𝑢𝑔 𝑎𝑒𝑟𝑜𝑠𝑜𝑙𝑖𝑧𝑒𝑑) × 100 … (2)
The aerodynamic parameters, namely the Fine Particle Fraction (% FPF), the Mass Median
Aerodynamic Diameter (MMAD) and the Geometric Standard Deviation (GSD) were then
calculated according to guidance in the USP. The % FPF (≤ 5µm) represents that portion of
the particles deposited in the NGI having a diameter less than 5 µm. The MMAD is the
diameter above and below which 50% of the particles exist [1, 94]. The GSD characterizes
the variability of particle size distribution. The aerodynamic particle size distribution of the
powder can be characterized by the MMAD and GSD and they were calculated using the
equation of the % cumulative recovery against the aerodynamic diameter as described in
the USP [43]. The above study was performed in triplicates each time and compared with
a similar study performed for the modified NGI.

48
3.3.3. Results and Discussion:
Figure 22: Deposition pattern of nebulized theophylline in unmodified NGI
The MMAD of the theophylline solution was found to be 3.54 ± 0.07 µm, its GSD was
found to be 3.17 ± 0.27 µm and the FPF was found to be 65 ± 1.1 %. This FPF value reflects
a large cumulative deposited dose based on the deposition pattern of theophylline in the
unmodified NGI (Figure 22). These values are representative of the readings that were
expected to be obtained from all future studies.
The MMAD value of 3.54 µm lies between the desirable size range of 1 to 5 µm [1, 95,
96], which is sufficient for deposition of the drug in the lower bronchioles and alveoli.
GSD obtained should be smaller than 1.3 and ideally closer to 1.2 [44]. The GSD value of
3.17 µm was slightly on the higher side, indicating the polydisperse nature of the
aerosolized particles. Usually, a narrow particle size distribution is known to be produced
due to aerosolization by vibrating mesh nebulizers. However, the formulation was not
optimized to yield uniform particle sizes prior to use which might be the major contributing
0%
2%
4%
6%
8%
10%
12%
14%
16%
18%
20%
Dep
osi
ted
Do
se
Stage
Unmodified NGI (n=3)

49
factor to a higher GSD. Besides, nebulizer performance and efficiency might play a role.
The aerodynamic diameter of approximately 65% of the nebulized theophylline recovered
from the NGI was found to be below 5 µm.
The MMAD obtained was found to be desirable, whereas the GSD was slightly higher,
indicating polydispersity of the particles. The aerodynamic deposition pattern and the
aerodynamic parameters obtained in this study were meant to serve as the baseline values
for comparison against values obtained from all future studies. However, studies performed
previously in the same lab [85] suggested that results obtained from different studies
performed varied to a certain extent, probably due to changes in nebulizer performance
over the period of time that passed between each individual study. Keeping that in mind, a
validation study was performed on the unmodified NGI on the same day each time a similar
study was performed on the modified NGI, so as to nullify any variations due to these
changes in nebulizer performance. This procedure was followed for all the repetitions of
the studies (n=3).
3.4.Validation of the modified NGI
The SVLIS modified NGI was developed with the intent to provide a liquid collection
surface for aerosol particles/droplets that could be a close approximation of the thin liquid
layer present lining the lung. Also, this liquid layer was meant to be utilized for growing
cell cultures to mimic the physiological environment of the lung to some extent (section
2). Stage 4 was initially chosen as the prototype stage for studying the effect of airflow and
saline administered through the NGI on A549 cells. However, the subsequent studies
attempt to determine the applicability of this modification to other NGI stages as well,
namely stage 4, 5, 6 and 7, since the cut-off diameters at these stages lie between the

50
respirable range of 1-5 µm, by comparing the deposition profiles and aerodynamic
parameters obtained by modifying those stages with those of unmodified NGI.
3.4.1. Materials
The gravimetric collection cup used in the modification of the NGI (MSP Corporation,
Shoreview, MN) was obtained from the MSP Corporation (Shoreview, MN). The glass
bottomed insert for the gravimetric cup was custom designed and fabricated (Benson
Machine Works Inc., Omaha, NE). The other materials used, including the drug
(theophylline) were as described in section 2.3.1.
3.4.2. Methods
A theophylline stock solution was prepared as described in section 3.2.2. The glass
bottomed insert was fitted into the gravimetric cup to make the SVLIS. 5 mL of deionized
water was added to the SVLIS so that it was filled to the brim to keep the critical impaction
distance (distance between the surface of water and the lip of the gravimetric cup)
unchanged. The assembled SVLIS was then incorporated in stage 4 of the NGI to replace
the regular collection cup at that stage. The NGI was assembled and the theophylline
solution was nebulized through it as described in section 2.3.2. Drug was recovered and
analyzed as previously described. The same experiment was repeated with the unmodified
NGI on the same day as the modified.
Further, the same study was performed by subsequent incorporation of the SVLIS in stage
5, 6 and 7 of the NGI in turn, in exactly the same manner as described above. All the studies
were performed in triplicate to allow for statistical analysis and comparison of drug
deposition and aerodynamic parameters.

51
The percentage of drug recovered and the aerodynamic parameters (MMAD, GSD and
FPF) were calculated as described in section 3.3.2 and compared with those obtained from
the unmodified NGI. The deposition pattern was also determined and compared with that
obtained from the NGI. The percent of theophylline deposited at each stage gave an idea
of the in vitro deposition efficiency. Statistical significance (p<0.05) was calculated by
performing student t-tests on the data to compare the two data sets (unmodified and
modified).
3.4.3. Results
3.4.3.1.Incorporation of SVLIS at Stage 4
Figure 23: Stage-wise deposition for unmodified NGI and NGI with SVLIS at stage 4
(n=3). Blue columns (left): Deposition in unmodified NGI; Red columns (right):
Deposition in modified stage 4
Following nebulization, theophylline deposition patterns were evaluated in both the
unmodified NGI and modified NGI with SVLIS at stage 4 (Figure 23). Stage 4 is
highlighted in the figure to indicate modification. No significant difference was found
0%
5%
10%
15%
20%
25%
Dep
osi
ted
Do
se (
%)
Stages
Unmodified SVLIS at Stage 4

52
between the deposition in unmodified and modified NGI at any of the stages after
performing statistical tests (Student t-test). The aerodynamic parameters for theophylline
obtained after nebulization through the unmodified and modified NGI were as under (Table
3). The aerodynamic parameters for theophylline (MMAD, GSD and FPF) obtained from
nebulization into the modified NGI were also statistically equivalent to those obtained from
unmodified NGI.
Table 3: Aerodynamic parameters for unmodified NGI and NGI with SVLIS at stage
4(n=3)
Aerodynamic
Parameters
Unmodified NGI
(n=3)
SVLIS at Stage 4
(n=3)
MMAD (µm) 3.54 0.60 3.59 0.20
GSD 3.17 0.27 3.25 0.43
FPF≤5 µm (%) 65.00 1.10 62.70 5.20
3.4.3.2.Incorporation of SVLIS at Stage 5
Figure 24: Stage-wise deposition for unmodified NGI and NGI with SVLIS at stage 5
(n=3). Blue columns (left): Deposition in unmodified NGI; Green columns (right):
Deposition in modified stage 5. *=significant difference
0%
5%
10%
15%
20%
25%
Dep
osi
ted
Do
se (
%)
Stage
Unmodified SVLIS at stage 5
*
*

53
The next modification was the incorporation of the SVLIS at stage 5 in order to provide a
proof of concept of the utility of the modification in other stages of the NGI where the
aerodynamic cutoff is below 5 µm at the airflow rate of 15 L/min. The above graph (figure
24) compares the percentage of deposited dose at each stage of the modified NGI
containing the SVLIS at stage 5 with that obtained from unmodified NGI. Stage 5 is
highlighted to indicate modification. A statistically significant difference was found
between the deposition in the unmodified and modified NGI at stages 5 and 7. The table 4
below shows the aerodynamic parameters obtained by nebulizing theophylline through
unmodified NGI and modified NGI with SVLIS incorporated at stage 5. Even though the
deposition pattern showed a difference at two of the stages, there was no significant
difference between the aerodynamic parameters obtained from the unmodified and
modified NGI.
Table 4: Aerodynamic parameters for unmodified NGI and NGI with SVLIS at stage 5
(n=3).
Aerodynamic
Parameters
Unmodified NGI
(n=3)
SVLIS at Stage 5
(n=3)
MMAD (µm) 3.85 0.02 3.90 0.04
GSD 2.60 0.11 2.64 0.12
FPF≤5 µm (%) 62.90 0.70 61.30 1.30

54
3.4.3.3.Incorporation of SVLIS in Stage 6
Figure 25: Stage-wise deposition for unmodified NGI and NGI with SVLIS at stage 6
(n=3). Blue columns (left): Deposition in unmodified NGI; Pink columns (right):
Deposition in modified stage 6. *=significant difference
The next modification involved the incorporation of SVLIS at stage 6. The above graph
(figure 25) is a comparison of the deposited doses of theophylline at each stage obtained
from the unmodified and modified NGI containing SVLIS at stage 6, which is highlighted
in the figure. A statistically significant difference was found between the deposited doses
in the unmodified and modified NGI at stages 6 and 7. The table 5 below shows the
aerodynamic parameters obtained after nebulization of theophylline into the unmodified
and modified NGI with SVLIS at stage 6. Again, it was found that there was no significant
difference in the aerodynamic parameters obtained from the modified NGI as compared to
the unmodified NGI.
0%
5%
10%
15%
20%
25%
Dep
osi
ted
Do
se (
%)
Stage
Unmodified SVLIS at stage 6
* *

55
Table 5: Aerodynamic parameters for unmodified NGI and NGI with SVLIS at stage 6
(n=3).
Aerodynamic
Parameters
Unmodified NGI
(n=3)
SVLIS at Stage 6
(n=3)
MMAD (µm) 3.47 0.39 3.47 0.38
GSD 2.44 0.25 2.71 0.09
FPF≤5 µm (%) 64.00 0.30 64.90 1.90
3.4.3.4.Incorporation of SVLIS at Stage 7
Figure 26: Stage-wise deposition for unmodified NGI and NGI with SVLIS at stage 7
(n=3). Blue columns (left): Deposition in unmodified NGI; Orange columns (right):
Deposition in modified stage 7. *=significant difference
In this last modification, the SVLIS was incorporated at stage 7. The above graph (figure
26) compares the deposition obtained at each stage of the unmodified and modified NGI
containing SVLIS at stage 7, after nebulizing theophylline through it. Stage 7 is highlighted
to indicate modification. In this case, deposition at three stages (1, 2 and 7) differed
significantly in the modified NGI as compared to the unmodified NGI. The aerodynamic
parameters obtained by nebulizing theophylline into the unmodified and modified NGI
0%
5%
10%
15%
20%
25%
Dep
osi
ted
Do
se (
%)
Stage
Unmodified SVLIS at stage 7
*
*
*

56
with SVLIS at stage 7 were as under (table 6). For the first time, a significant difference
was obtained in the MMAD of the modified NGI from that of the unmodified NGI, though
the other two parameters (GSD and FPF) remained statistically equivalent.
Table 6: Aerodynamic parameters for unmodified NGI and NGI with SVLIS at stage 7
(n=3); * = significant difference.
Aerodynamic
Parameters
Unmodified NGI
(n=3)
SVLIS at Stage 7
(n=3)
MMAD (µm) 3.85 0.02 4.09 0.04*
GSD 2.60 0.11 2.47 0.08
FPF≤5 µm (%) 62.90 0.70 60.80 1.80
3.4.4. Discussion
The results showed that the incorporation of a liquid impaction surface at stage 4 using a
small volume insert did not affect the deposition pattern or the aerodynamic parameters of
the drug. One of the advantages of this modification was that it minimized dead spaces in
the collection cup and since all it involved was adding water to the SVLIS, it was
convenient to achieve. Further, the solubility of theophylline in water made the process of
its collection and quantitation from the stage simpler. The possibility of variations in
nebulizer performance was eliminated by performing the study on the unmodified NGI on
the same day as that on the modified NGI.
In the above experiments, except when the SVLIS was incorporated in stage 4, a significant
difference was observed in the deposited dose at two or more of the stages of the modified
NGI as compared to the unmodified NGI. It was also observed that the modified stage (for
instance stage 5 when SVLIS was incorporated in it) was one of the stages showing the
difference. In each case, the deposition in the modified stage was found to be less than that

57
same stage in the unmodified NGI. Also, deposition at stage 7 differed significantly each
time.
Some of the factors that might be affecting the drug deposition in the NGI stages are
particle size, particle density, airflow inside the NGI, re-entrainment of particles and the
critical impaction distance. In our experiments, the theophylline used was the same
throughout and solutions were prepared from it following the exact same procedure every
time. Also, the studies on unmodified and modified NGI were performed on the same day.
Thus, the possibility of changing particle size being the reason for varied results in aerosol
deposition in the unmodified and modified NGI is unlikely. The same can be said for
particle density, since the theophylline used was the same and was stored in the manner
throughout. Further, all the experiments were performed under constant laboratory
conditions, without substantial changes in temperature, atmospheric pressure or relative
humidity, minimizing the possibility of change in powder density through aggregation.
The airflow rate inside the NGI is calibrated to remain constant at 15 L/min throughout the
experiment. However, in case of the modified NGI, the air encounters liquid (water, in this
case) at the stage where SVLIS is incorporated, while traversing through the NGI. It was
not possible account for exact variations in localized airflow patterns that might be
affecting the air movement downstream from the modified stage. One approach to
minimize this problem might be to use a gel or higher viscosity fluid instead of water as
the collection surface in future studies.
Re-entrainment can be explained as the bouncing of the particles off the surface of the
collection cups on impact and their subsequent settling on the orifice plate above or moving
on to the latter stages. The collection cups were not coated with Sigmacote (silicone in

58
heptane) to prevent this re-entrainment as suggested in the USP, since erratic results were
obtained in the preliminary studies performed after coating. Thus re-entrainment is not
likely one of the reasons for discrepancies observed in the deposition; however, the chances
of re-entrainment are minimum at the modified stage, since the particles impact on the
liquid surface of the SVLIS. There is a slight possibility that re-entrainment may be
occurring from the stages before the modified stage, though a difference in deposition at
the initial stages (stage 1 and 2) was only found when stage 7 contained the SVLIS.
The deposition will most certainly be affected if the critical impaction distance (distance
b) changes to a great extent over the span of nebulization (10 minutes). There is a high
possibility of this variation in this case, since the impaction surface is a liquid (water) and
losses due to evaporation might result in a considerable loss in height of the liquid, thus
affecting distance b. If losses due to evaporation are sufficiently high, the height of the
liquid in the SVLIS will reduce, causing the distance b to increase. This would mean the
particles will have a longer distance to travel for impaction, causing smaller and lighter
particles to not impact on that stage and instead move with the airstream towards the
successive stages. This would explain why the deposition at the modified stage is affected
and is significantly lower than at the same stage in an unmodified NGI. It would also
explain the higher deposition at some of the stages subsequent to the one containing the
SVLIS. However, this theory only holds if a higher deposition is obtained in stages after
the modification as compared to the same stages in unmodified NGI.
In order to confirm whether there is a significant change in the height of liquid, and in turn,
the critical impaction distance during aerosolization, a study was performed to determine

59
the losses due to evaporation at different airflow rates and using two different liquids in
the SVLIS (deionized water and cell culture medium).
3.5.Validation of modified NGI using Dry Powder Inhaler (DPI)
The results obtained from the study described in section 3.4.3 directly leads to testing the
application of the SVLIS in the NGI for dry powder formulations. Besides, one of the
potential applications of the SVLIS is proposed to be in dissolution testing of orally inhaled
dry powders, which necessitated that the deposition of a DPI in the modified NGI be
compared to its deposition in an unmodified NGI. Since encouraging results were obtained
when SVLIS was incorporated at stage 4 of the NGI, stage 4 was chosen for this study as
of this point.
3.5.1. Materials
Anhydrous lactose was obtained from Sigma-Aldrich Co. (St. Louis, MO). The Sylgard ®
184 silicone elastomer kit (Dow Corning, MI, USA) was used to make a custom
mouthpiece adapter for maintaining an airtight connection between the DPI and induction
port. The empty hard gelatin capsules were obtained from Gallipot Inc. (St. Paul, MN). A
DPI used for the study was the Foradil Aerolizer (Merck and Co., NJ). A Planetary Ball
Mill PM 100 (Retsch Inc., Newtown, PA) was used for dry powder homogenization. The
gravimetric collection cup used in the modification of the NGI (MSP Corporation,
Shoreview, MN) was obtained from the MSP Corporation (Shoreview, MN). The glass
bottomed insert for the gravimetric cup was obtained custom-made from Benson Machine
Works Inc. (Omaha, NE). The other materials used, including the drug (theophylline) were
as described in section 2.3.1.

60
3.5.2. Methods
250.3 mg of theophylline along with 4.7557 g of lactose were homogenized using the ball
mill (three cycles of 30 minutes each at 250 rpm). 100 mg of this uniformly mixed powder
was filled in each of the hard gelatin capsules so that each capsule contained 5 mg of
theophylline. The exact weights may vary between capsules. The NGI was assembled as
described in section 2.3.2 and airflow was calibrated to 60 L/min. A custom mouthpiece
adapter was made using the Sylgard ® 184 silicone elastomer kit in order to maintain an
airtight connection between the DPI and the induction port. The mouthpiece end of the
DPI, when inserted into the adapter, must align with the horizontal axis of the induction
port in the same orientation as intended for use and the front face of the mouthpiece should
be flush with the face of the induction port, forming an airtight seal [43]. The capsule was
inserted inside the DPI, punctured and the DPI was actuated for 30 seconds under vacuum.
Drug was recovered and analyzed as previously described. The data obtained was used for
calculation of deposition pattern as well as the aerodynamic parameters (MMAD, GSD and
FPF). The study was repeated using the modified NGI containing SVLIS at stage 4 instead
of a regular collection cup for comparison. As mentioned in section 3.4.2, the experiment
with the unmodified NGI was performed on the same day as the modified. The above study
was performed in triplicate to allow for statistical analysis and comparison of drug
deposition and aerodynamic parameters.

61
3.5.3. Results and Discussion
Figure 27: Stage-wise deposition for unmodified NGI and NGI with SVLIS at stage 4 for
DPI (n=3). Blue columns (left): Deposition in unmodified NGI; Purple columns (right):
Deposition in modified stage 7. *= significant difference
The above graph (figure 27) gives a comparison of the deposition of theophylline obtained
from each stage of the unmodified NGI with that of the modified NGI containing SVLIS
at stage 4, when powdered drug was aerosolized through the NGI using a DPI. Stage 4 is
highlighted to indicate modification. A significant difference was observed between the
deposited dose in the unmodified and modified NGI at stage 4 only. The aerodynamic
parameters obtained after the aerosolization of DPI containing theophylline into the NGI
are represented in the table 7 below. No significant difference was observed in the
aerodynamic parameters obtained from the modified NGI as compared to the unmodified
NGI.
0%
10%
20%
30%
40%
50%
60%
70%
80%
90%
Dep
osi
ted
Do
se (
%)
Stage
Unmodified SVLIS at stage 4
*

62
Table 7: Aerodynamic parameters for unmodified NGI and NGI with SVLIS at stage 4
for DPI (n=3).
Aerodynamic
Parameters
Unmodified NGI
(n=3)
SVLIS at Stage 7
(n=3)
MMAD (µm) 5.85 0.22 5.66 0.09
GSD 1.46 0.09 1.55 0.05
FPF≤5 µm (%) 8.76 2.00 10.74 1.22
As stated previously, the collection cups were not coated with silicone before performing
any of the studies. That might have led to re-entrainment of the powder or ‘particle bounce
effects’, which may be responsible for the difference in deposition observed between stage
4 of the modified and unmodified NGI. That might explain the fact that a slightly lower
deposition was obtained in the initial stages of the modified NGI, while it was higher at
stage 4, which was the modified stage containing the SVLIS. At this stage, the particle
impaction is on water instead of a solid surface, which is why re-entrainment might not
have occurred at stage 4 itself. The USP and European Pharmacopeia both recommend
coating of the collection cup surfaces with silicone oil to reduce particle bounce and inter-
stage loss, particularly for testing of DPI formulations [97]. Thus, an approach that might
help overcome this problem may be to coat the collection surfaces with the Sigmacote and
repeat the study.
3.6.Evaluation of effect of airflow on liquid height in the SVLIS
Evaporation losses from the surface may result in a change in weight as well as height of a
liquid. There is a possibility that the height of liquid in the SVLIS may decrease during
nebulization due to losses from evaporation of liquid under the effect of airflow,
consequently affecting the critical impaction distance. This necessitated the evaluation of

63
the effect of airflow on the liquid in the SVLIS and its effect on the drug deposition pattern
in the NGI.
3.6.1. Materials
The materials used were as described in section 2.3.1. Ham’s F-12K medium was prepared
as instructed in section 2.2.1.
3.6.2. Methods
For this study, two of the SVLIS were filled with 5 mL of deionized water. One SVLIS
was kept on the countertop to serve as ‘control’ and the other was incorporated in different
stages of the NGI in turn as the ‘sample’. The NGI was assembled and operated as
described in section 2.3.2, only for these experiments no drug was aerosolized through the
NGI and air alone was allowed to circulate through the system. The SVLIS were weighed
at the beginning of the experiment (Time 0) and after specific time intervals of 1, 2, 3, 4,
5, 10 and 15 minutes. Since the loss in weight of the water is proportional the loss in height,
height loss after each time interval was accordingly calculated using the following equation
3.
𝑃𝑒𝑟𝑐𝑒𝑛𝑡 𝑙𝑜𝑠𝑠 𝑖𝑛 ℎ𝑒𝑖𝑔ℎ𝑡 = 𝐿𝑜𝑠𝑠 𝑖𝑛 𝑙𝑖𝑞𝑢𝑖𝑑 ℎ𝑒𝑖𝑔ℎ𝑡 𝑖𝑛 𝑚𝑚
𝑇𝑜𝑡𝑎𝑙 ℎ𝑒𝑖𝑔ℎ𝑡 𝑜𝑓 𝑟𝑒𝑔𝑢𝑙𝑎𝑟 𝑐𝑜𝑙𝑙𝑒𝑐𝑡𝑖𝑜𝑛 𝑐𝑢𝑝 × 100 … (3)
The percent loss values were calculated as a percentage of the total height of a regular NGI
collection cup since that corresponds to the critical impaction distance ‘b’. The same study
was performed at two other airflow rates, 30 L/min and 60 L/min, with incorporation of
the SVLIS at different stages in each case. The stages at which the SVLIS would be
incorporated were chosen based on the cut-off diameters for the stages at a certain flow

64
rate according to the USP (Table 8). The stages that had a cut-off diameter between 1 µm
and 5 µm were chosen for the study.
Table 8: Aerodynamic cutoff diameters for different stages and airflow rates as per USP.
Diameter (µm) at Flow rate (L/min)
Stage 15 L/min 30 L/min 60 L/min
1 14.10 11.50 8.13
2 8.61 6.35 4.51
3 5.39 3.97
2.85
4 3.30 2.30 1.67
5 2.08 1.36 0.95
6 1.36 0.81 0.56
7 0.98 0.54 0.34
The highlighted stages for each flow rate were those chosen for modification in the study.
The same study was performed using Ham’s F-12K medium instead of deionized water.
All the studies were performed in triplicate (n=3).
3.6.3. Results and Discussion
3.6.3.1.Evaporative loss at 15 L/min
The table 9 shows the loss in height of water after running air through the NGI for 10
minutes, which is the standard run time for nebulized solutions. However, the NGI was run
for 15 minutes to maintain uniformity between the various studies performed. As stated
previously, stages were chosen for the study based on aerodynamic cutoff diameters for
each stage at a particular flow rate.

65
Table 9: Loss in height of water from different stages at 15 L/min after 10 minutes.
Stage
Control Sample
Height loss
(%)
Height loss
(mm)
Height Loss
(%)
Height Loss
(mm)
4 1.41 ± 0.21 0.21 ± 0.03 3.81 ± 0.11 0.56 ± 0.02
5 1.24 ± 0.18 0.18 ± 0.03 4.02 ± 0.22 0.59 ± 0.03
6 1.11 ± 0.02 0.16 ± 0.00 4.32 ± 0.35 0.63 ± 0.05
7 1.25 ± 0.08 0.18 ± 0.01 4.56 ± 0.39 0.67 ± 0.06
As can be seen in the table, the loss in height of the water remains more or less similar in
the control SVLIS for all the stages under study, since the control SVLIS was left outside
on the countertop each time. On the other hand, the losses in height are far greater in the
sample SVLIS and become higher as the SVLIS is incorporated further down in the NGI.
In other words, height loss is much greater when SVLIS is at stage 7 (0.67 mm) than at
stage 4 (0.56 mm).
The USP states that any difference in the critical impaction distance should be not more
than 0.1 mm, which corresponds to a 0.68% loss [43]. The loss in the height of water
observed here is greater than that allowed by the USP. However, the USP guidelines are
for collection cups with a solid collection surface, while there is no specification for a liquid
impaction surface like the one being studied here. Further, the results of the study in section
3.4.3.1 show that this change in height of water did not significantly affect the deposition
or the aerodynamic parameters of the drug nebulized into the NGI containing the SVLIS
at stage 4. However, the increasing change in height of water when the subsequent stages
are modified (stage 5, 6 and 7) might be a cause of the significant differences observed in

66
the deposition patterns and/or aerodynamic parameters of drug (section 2.4.3). The size of
the orifices on the seal body decrease in size from the first to last stage of the NGI, which
makes the linear velocity (volumetric airflow divided by cross-sectional area of orifices)
of the air through the initial stages lower than that at the latter stages [62]. Thus, the higher
linear velocity in the latter stages might be responsible for the greater decrease in the water
level when the latter stages are modified due to increased evaporative loss.
The same study was performed using an equal volume of Ham’s F-12K medium instead of
water in order to determine whether it would behave the same as water when exposed to
airflow in the NGI at 15 L/min (Table 10).
Table 10: Loss in height of medium from different stages at 15 L/min after 10 minutes.
Stage
Control Sample
Height loss
(%)
Height loss
(mm)
Height Loss
(%)
Height Loss
(mm)
4 1.15 ± 0.05 0.17 ± 0.01 3.40 ± 0.07 0.50 ± 0.01
5 1.01 ± 0.07 0.15 ± 0.01 3.48 ± 0.08 0.51 ± 0.01
6 1.13 ± 0.11 0.17 ± 0.02 3.71 ± 0.20 0.54 ± 0.03
7 0.93 ± 0.01 0.14 ± 0.00 3.99 ± 0.41 0.58 ± 0.06
For the Ham’s F-12K medium again, the change in height in the control SVLIS is almost
the same every time and much lower compared to the sample SVLIS. The loss in height of
the medium also goes on increasing as farther stages are incorporated but the difference is
not quite as pronounced as in case of water.

67
3.6.3.2.Evaporative loss at 30 L/min
The same experiment was also performed using deionized water to study the effect of an
airflow rate of 30 L/min (Table 11), which is the standard airflow rate used to study
deposition in the NGI using Metered-dose Inhalers (MDI). Even though the NGI was run
for 15 minutes during the study for uniformity, only data for 1 minute is considered, since
inhaler actuation takes a few seconds at most.
Table 11: Loss in height of water from different stages at 30 L/min after 1 minute.
Stage
Control Sample
Height loss
(%)
Height loss
(mm)
Height Loss
(%)
Height Loss
(mm)
3 0.12 ± 0.03 0.05 ± 0.00 0.44 ± 0.05 0.08 ± 0.01
4 0.10 ± 0.00 0.04 ± 0.01 0.58 ± 0.00 0.14 ± 0.01
5 0.18 ± 0.06 0.03 ± 0.00 0.60 ± 0.06 0.13 ± 0.02
6 0.16 ± 0.05 0.03 ± 0.01 0.80 ± 0.13 0.15 ± 0.03
In this study, like the previous ones, the magnitude of loss in height was higher in the
sample SVLIS than the control each time and it increased as progressively latter stages of
the NGI were modified. However, the increase was not as distinct as the previous study.
Similar results as obtained at 15 L/min were obtained in this study, but since only height
loss data at the end of 1 minute was considered, the loss in height observed was not as high.
The loss in height after 1 minute when the SVLIS was at stage 4 was only about 0.14 mm,
which is close to the USP specification of 0.1 mm. thus, an actuation using an MDI for a
span of few seconds would not markedly affect the critical impaction distance at the stage
containing the SVLIS. To ensure a similar result in case water is replaced with Ham’s F-
12K medium, the same study was performed using the medium (Table 12)

68
Table 12: Loss in height of medium from different stages at 30 L/min after 1 minute.
Stage
Control Sample
Height loss
(%)
Height loss
(mm)
Height Loss
(%)
Height Loss
(mm)
3 0.5 ± 0.1 0.02 ± 0.00 1.8 ± 0.2 0.06 ± 0.01
4 0.4 ± 0.0 0.01 ± 0.00 2.4 ± 0.0 0.08 ± 0.00
5 0.7 ± 0.3 0.03 ± 0.01 2.5 ± 0.3 0.09 ± 0.01
6 0.6 ± 0.2 0.02 ± 0.01 3.3 ± 0.5 0.12 ± 0.02
Similar results were observed with the medium as with water, but as discussed previously,
the loss in height overall was lesser than with water and also less than or close to the USP
specification of 0.1 mm.
3.6.3.3.Evaporative loss at 60 L/min
Finally, the same study was performed using deionized water by circulating airflow at a
rate of 60 L/min through the NGI (Table 13), which is the standard airflow rate for
experiments that use a DPI to aerosolize the drug through the NGI.
Table 13: Loss in height of water from different stages at 60 L/min after 1 minute.
(Height loss of water and medium from stage 5 not shown because considerable
splashing of liquid was observed at 60 L/min when SVLIS was placed in stage 5)
Stage
Control Sample
Height loss
(%)
Height loss
(mm)
Height Loss
(%)
Height Loss
(mm)
2 0.27 ± 0.05 0.04 ± 0.01 0.97 ± 0.22 0.14 ± 0.03
3 0.18 ± 0.10 0.03 ± 0.01 0.97 ± 0.12 0.14 ± 0.02
4 0.22 ± 0.07 0.03 ± 0.01 1.49 ± 0.30 0.22 ± 0.04
5 - - - -

69
Again, the experiment was performed and readings taken for a span of 15 minutes, but data
considered was only up to the 1 minute mark, since DPI actuation is complete in a matter
of seconds. At the end of one minute, the loss in height of water observed was again very
low for the control SVLIS in each case, and higher for the sample SVLIS. The loss in
height when the SVLIS was at stage 2 and stage 3 was the same (0.14 mm) while it was
higher when SVLIS was incorporated at stage 4 (0.22 mm). This loss in height, and thus,
change in critical impaction distance might be partially responsible for the difference in
deposition obtained when deposition was studied for a DPI by incorporation of SVLIS at
stage 4. An attempt was made to perform the study by keeping the SVLIS containing water
in stage 5, excessive splashing of the water was observed at the first reading itself (1
minute) and the study was discontinued. Another study of the same kind was performed by
replacing water with Ham’s F-12K medium to study its behavior when exposed to an
airflow rate of 60 L/min in the NGI (Table 14).
Table 14: Loss in height of medium from different stages at 60 L/min after 1 minute.
Stage
Control Sample
Height loss
(%)
Height loss
(mm)
Height Loss
(%)
Height Loss
(mm)
2 0.12 ± 0.03 0.02 ± 0.00 0.61 ± 0.05 0.09 ± 0.01
3 0.16 ± 0.05 0.02 ± 0.01 0.82 ± 0.14 0.12 ± 0.02
4 0.14 ± 0.07 0.02 ± 0.01 1.01 ± 0.02 0.15 ± 0.00
5 * * * *
In this case again it was observed that the overall loss in height of the medium was lower
than that for water and each time it was around the specification in the USP (0.1 mm). An
attempt was again made to perform the study by keeping the SVLIS in stage 5 but again
considerable “splashing”, that is, liquid movement, was observed due to which the study

70
was discontinued. The splashing might be due to increased turbulence in the inter-stage
passageways in the latter stages of the NGI at the high airflow rate of 60 L/min, since we
have already established that the higher linear velocity in the latter stages of the NGI leads
to increased evaporative losses.
In all the above studies, the loss in height of the medium was lower than that observed with
water, which leads us to believe that replacing the water with medium might lead to fewer
changes in the critical impaction distance. It was hypothesized that this might be due to the
possibly higher density and viscosity of the medium as compared to water. Thus, density
of the two liquids was determined using the Mettler Toledo DM40 Density meter (Mettler
Toledo, Columbus, OH) and their viscosity was determined using the Brookfield DV-1
Digital viscometer (Brookfield Engineering Labs Inc., Stoughton, MA), which confirmed
that both the density as well as viscosity of medium was slightly higher than that of water
(Table 15).
Table 15: Density and viscosity for water and medium.
Density
(g/cm3)
Viscosity
(cps)
Deionized water 0.9982 3
Ham’s F-12K medium 1.0085 3.4
A possible reason could be elevation of boiling point of the water due to addition of the
powdered medium and other solutes to it for the preparation of Ham’s F-12K medium. This
is a colligative property, which depends on the solute added to the solvent, instead of the
identity of the solvent itself. Thus, the added solutes in the medium may have increased its
evaporation temperature, leading to a smaller loss.

71
The lowest change in critical impaction distance when the NGI was run at 15 L/min for 10
minutes was observed when the SVLIS was incorporated into stage 4. Also, changes in
critical impaction distance that more or less matched the limit stated by the USP were also
obtained when the NGI was run at 30 and 60 L/min with the modification at stage 4. The
cut-off diameters for stage 4 also lie within the desirable range of 1-5 µm for all three flow
rates, making it the convenient stage for modification. Keeping these factors in mind, stage
4 was chosen as the stage for incorporation of the SVLIS for all future studies.
The changes in height of water and Ham’s F-12K medium due to different airflow rates
when the SVLIS is incorporated at stage 4 can be summarized in the following graphs
(Figure 28).

72
Figure 28: Loss in height of water and medium from stage 4 at different flow rates. (a) 15
L/min; (b) 30 L/min; (c) 60 L/min
0%
10%
20%
30%
40%
50%
0 5 10 15 20
% H
eight
loss
Time (mins)
0%
10%
20%
30%
40%
50%
0 5 10 15 20
% H
eight
loss
Time (mins)
0%
10%
20%
30%
40%
50%
0 5 10 15 20
% H
eight
loss
Time (mins)
Control (water)
Control (Hamm's F12 K medium)
Sample (water)
Sample (Hamm's F12K medium)
(a) (b)
(c)

73
CHAPTER 4
Specific Aim 3: To study the dissolution profile of a powdered drug using the SVLIS

74
4. Background
Dissolution of an inhaled drug particle in the pulmonary fluid can be a rate-limiting step
for absorption of a drug into cells, especially for drugs with low solubility and high
permeability. It is proposed that the SVLIS modified NGI can be used as a model to study
the dissolution of a drug in the fluid immediately after deposition in the NGI for the
development of in vitro models that simulate the conditions a drug faces in vivo after
inhalation.
4.1.Dissolution study using SVLIS as the dissolution chamber
4.1.1. Materials
Theophylline anhydrous was obtained from the City Chemical Corporation (New York,
NY). Lactose was obtained from Sigma-Aldrich Co. (St. Louis, MO).
4.1.2. Methods
250.3 mg of theophylline was weighed out and homogeneously mixed with 4.7557 g of
lactose and then subjected to particle size reduction using the Planetary Ball Mill PM 100
(Retsch Inc., Newtown, PA). 20.7 mg of this homogenized powder was weighed to be used
as the sample for dissolution and deionized water was used as the dissolution medium for
this experiment. The SVLIS which was to be used as the dissolution chamber was filled
with 5 mL of deionized water and placed inside the incubator-shaker (MaxQ 4450, Thermo
Scientific). The SVLIS was placed inside a petri dish before putting it in the incubator-
shaker in order to keep it covered and prevent solvent loss during the experiment.

75
Figure 29: Dissolution set up in the incubator-shaker
At time 0, the powder sample was added to the SVLIS and the first sample was removed.
500 µL of sample was removed from the medium at 0, 1, 2, 3, 4, 5, 10 and 15 minutes and
replaced with fresh deionized water. During the experiment, the apparatus was maintained
at 37ºC and at a speed of 75 rpm. The samples were then diluted 1:10 before analyzing
them using the Synergy H1 Hybrid Multi-mode Microplate Reader (Biotek Instruments
Inc., Winooski, VT) at a wavelength of 273 nm. The concentrations of theophylline in the
samples were calculated using a standard curve which was run simultaneously in the plate
reader.
Figure 30: SVLIS containing water inside petri dish

76
4.1.3. Results and Discussion
Figure 31: In vitro dissolution profile of theophylline
The graph above (Figure 31) represents the dissolution of theophylline in deionized water
over a span of 15 minutes. The total amount of theophylline at Time 0, that is, total drug
content in 20.7 mg of the theophylline-lactose mixture was determined experimentally
before using it to calculate the percentages of total drug recovered at each time point. The
maximum dissolution of 93.65% was observed at 2 minutes (t2 min).
Theophylline is slightly soluble in water, up to a concentration of 8.3 mg/mL. Since a very
small amount of theophylline is present in the sample, dissolution is seen to be rapid and
occurs within just 2 minutes. Also, theophylline was only mixed with lactose without any
substantial particle engineering and formulated as an immediate release powder for
experimentation. The absorption and clearance of drugs with higher aqueous solubility is
not governed by their dissolution rate as much, unless the formulation is considerably
altered by addition of excipients. Whereas for drugs with very poor aqueous solubility, a
0
10
20
30
40
50
60
70
80
90
100
0 5 10 15 20
To
tal
dru
g r
eco
ver
ed (
%)
Time (mins)
Adjusted total drug

77
rapid onset of absorption is observed followed by sustained absorption over time, which
could possibly be controlled by its dissolution rate [15, 69]. The formulation would have
to contain the necessary excipients and be appropriately optimized in order for dissolution
time to be controlled. A low solubility drug such a steroid could also be used for dissolution
testing.
For the purpose of this study, the sample was added directly to the SVLIS at time 0. If the
SVLIS were to be incorporated in the NGI before performing the study, the particles would
impact upon the SVLIS with greater force and at a much higher rate (at an airflow of 60
L/min). We can assume that would change the dissolution rate to a certain extent, most
likely causing an increase in it and that would have to be taken under consideration during
testing of any formulation using this method. This study was performed only as a proof of
concept to show that the SVLIS can be potentially used for dissolution testing of orally
inhaled powder formulations and that is why only an n of 1 was performed. The results
obtained are evidence that the SVLIS is a potentially viable system for dissolution testing
of orally inhaled drug products.
4.2.Proposed study design for future dissolution testing
If the dissolution study were to be performed after aerosolizing the drug through the NGI
using a DPI, it would more closely simulate the aerodynamics of the lung during and
immediately after drug inhalation. In order to be able to do that, first there is a need to
achieve a deposition profile in the modified NGI containing the SVLIS that closely matches
that obtained after aerosolizing a dry powder through an unmodified NGI. That might be
possible by coating the collection surfaces with Sigmacote before running the NGI as
explained in section 3.4.4.3 to prevent particle bounce effects.

78
The dissolution medium used for this study was deionized water, however for a detailed
dissolution study, a medium that resembles the lung epithelial lining fluid (ELF) as closely
as possible should be used. In healthy individuals, this fluid is mainly composed of mainly
water (96%), salts, phospholipids, proteins and mucins with a pH of about 6.6 in healthy
lung [15, 98, 99], the alveoli have a thin surface layer of lung surfactant containing
phospholipids and proteins which increase the solubility of poorly soluble drugs [15, 100,
101]. Since the composition of the epithelial lining fluid (ELF) in the lungs is extremely
complex, the dissolution medium to be used should preferably be a variation of simulated
lung fluid (SLF), which would closely resemble the composition of the ELF in terms of
electrolyte concentration [67, 102, 103]. The volume of medium to be placed in the SVLIS
is low, keeping in mind the thin layer of ELF lining the lungs [15].
For this study, SVLIS was placed in the incubator-shaker to maintain the temperature at
37ºC and the agitation. Another way to achieve the same would be to place the SVLIS
(covered using a petri dish) on an induction plate and making use of micro-stirrer bars for
agitation. The one problem in this case might be providing heat uniformly to the system
since it is not enclosed as in the incubator-shaker. The speed of agitation would need to be
optimized as well. The humidity in the lung is extremely high, which also needs to be
considered. An alternative would be to place the system inside an incubator without any
agitation at all, to simulate lung conditions [82]. Due to the small volume and surface area
of the SVLIS and its open nature, sampling from the same spot every time was not possible.
A small hole can be drilled on top of the petri dish so that samples can be withdrawn from
approximately the same point every time.

79
The results obtained from further dissolution studies to be performed using SVLIS as the
dissolution chamber need to be validated by comparing them with those obtained from
similar studies previously performed by researchers in several different ways. A good start
would be to compare results with a dissolution study performed using a conventional USP
type II (paddle) apparatus. That would be instrumental in providing more information about
the potential for using the SVLIS as a chamber for dissolution testing.

80
CHAPTER 5
Conclusions and Future studies

81
5. Conclusions and future directions
5.1.Conclusions
The recent advances in the area of pulmonary drug delivery and orally inhaled formulations
has necessitated the development of enhanced models for in vitro testing, in order to enable
us to better predict their behavior in vivo. These models must simulate as closely as
possible, the deposition of the aerosol in the lung. A truly efficient model would be
expected to integrate at least two aspects of aerosol delivery to the lung, for instance its
deposition and subsequent dissolution or deposition followed by its dissolution in the fluid
lining the lung. This Master’s project involved the design and evaluation of one such in
vitro model.
A small volume liquid impaction surface (SVLIS) was designed as a modification for
incorporation in NGI stages which would potentially be able to be used for performing in
vitro cell studies as well as dissolution studies following inhaled drug deposition in the
NGI. The SVLIS was successfully used to grow monolayers of A549 cells for
incorporation into the NGI. . The cells grown on the SVLIS were incorporated in the NGI
at stage 4 before exposing them to airflow and subsequently saline at 15 L/min inside the
cell culture hood. Even though airflow alone was shown to somewhat inhibit the growth of
cells, saline when administered to the cells did not adversely affect their growth. Thus, the
SVLIS can be said to have a potential application in in vitro cell culture models for studying
absorption of inhaled drugs following deposition through an impactor.
Even though cell cultures could be incorporated in the SVLIS modified NGI, validation
studies showed that deposition patterns of the model drug theophylline were affected
following the modification at all stages (5, 6 and 7) except stage 4. This was partially

82
attributed to an excessive loss in height of the liquid in the SVLIS that occurs when exposed
to airflow, thus affecting the critical impaction distance. Hence, it was recommended that
stage 4 be modified for all further studies and airflow dynamics in the NGI be evaluated in
detail before other stages could be modified. Deposition of dry powder obtained at
modified stage 4 were also observed to be different from those of unmodified NGI, which
could be possibly attributed to the use of uncoated collection surfaces.
A preliminary dissolution study of a model drug using the SVLIS as a dissolution chamber
suggested that the SVLIS can be potentially used in an in vitro dissolution model to study
inhaled drug dissolution after deposition, provided an appropriate method was designed by
optimization of all the parameters. However, the problems encountered in the deposition
patterns obtained after dry powder aerosolization need to be resolved before further
dissolution studies can be undertaken.
Thus, we can conclude that the SVLIS can be potentially incorporated at stage 4 of the NGI
for further in vitro cell studies following deposition of nebulized drug solutions. However,
further studies need to be performed as described in the future studies section before its
application for modification of other stages or for dissolution studies of inhaled dry
powders can be established.
5.2.Future studies
Deposition profiles obtained following nebulization of theophylline in modified NGI with
SVLIS at stages 5, 6 and 7 were found to be different from those obtained from the same
study using unmodified NGI. Thus, further studies need to be performed in order to
examine the deposition patterns and airflow dynamics inside the NGI to determine if any

83
changes in airflow rate and turbulence were occurring towards the latter NGI stages which
were responsible for the variations in deposition patterns in the SVLIS modified NGI. Also,
the validation studies using dry powder inhalers should be performed again after coating
the NGI collection surfaces with the appropriate coating solution to reduce particle rebound
and re-entrainment, in order to verify the utility of this model to study dry powder
deposition.
The utility of this model in studying drug absorption and transport should be further tested
by performing cellular uptake studies following deposition of a model drug solution on the
cells grown on the SVLIS and by performing transepithelial electrical studies (TEER)
studies across the cell monolayers, in order to actually study the effect of the environment
in the NGI on the pharmacokinetics of a known drug. An attempt should be made to grow
other lung epithelial cell lines such as Calu-3 to verify that this system can be applied across
a range of cell lines representing different regions of the lung epithelium.
Dissolution studies should be appropriately designed by alteration and optimization of
parameters like agitation, humidity, sampling and using a proper inhaled formulation.
Dissolution testing of a commercially available inhaled product such as a steroid should be
performed to further establish the validity of this model in in vitro dissolution testing.

84
References
[1] K. Nahar, N. Gupta, R. Gauvin, S. Absar, B. Patel, V. Gupta, A. Khademhosseini, and F.
Ahsan, “In vitro, in vivo and ex vivo models for studying particle deposition and drug
absorption of inhaled pharmaceuticals.,” Eur. J. Pharm. Sci., vol. 49, no. 5, pp. 805–18,
Aug. 2013.
[2] A. Mescher, “The Respiratory System,” in Junqueira’s Basic Histology: Text & Atlas, 13th
ed., A. Mescher, Ed. New York, NY: McGraw-Hill, 2013.
[3] C. Mobley and G. Hochhaus, “Methods used to assess pulmonary deposition and
absorption of drugs.,” Drug Discov. Today, vol. 6, no. 7, pp. 367–375, Apr. 2001.
[4] F. L. De Marzo N, Di Blasi P, Boschetto P, Mapp CE, Sartore S, Picotti G, “Airway smooth
muscle biochemistry and asthma.,” Eur. Respir. J. Suppl., vol. 6, p. 473s–476s, 1989.
[5] P. R. Phipps, I. Gonda, S. D. Anderson, D. Bailey, and G. Bautovich, “Regional deposition
of saline aerosols of different tonicities in normal and asthmatic subjects,” Eur. Respir. J.,
vol. 7, no. 8, pp. 1474–1482, Aug. 1994.
[6] W. D. Bennett, G. Scheuch, K. L. Zeman, J. S. Brown, J. Heyder, W. Stahlhofen, W.
Möller, K. Häußinger, R. Winkler-heil, T. Meyer, M. S. Berridge, Z. Lee, S. Verbanck, C.
Kim, E. P. Agency, N. Carolina, D. William, and K. L. Ze-, “Regional deposition and
retention of particles in shallow , inhaled boluses : effect of lung volume Regional
deposition and retention of particles in shallow , inhaled boluses : effect of lung volume,”
J. Appl. Physiol., vol. 86, pp. 168–173, 1999.
[7] P. A. Jaques and C. S. Kim, “Measurement of total lung deposition of inhaled ultrafine
particles in healthy men and women.,” Inhal. Toxicol., vol. 12, no. 8, pp. 715–731, 2000.
[8] M. S. Messina, O. G. Thomas, and G. C. Smaldone, “Changes in mucociliary clearance
during acute exacerbations of asthma.,” Am. Rev. Respir. Dis., vol. 143, no. 5 Pt 1, pp. 993–
997, 1991.
[9] P. R. Byron and E. M. Phillips, “Absorption, clearance and dissolution in the lung,” in
Respiratory Drug Delivery, P. R. Byron, Ed. Boca Raton: CRC Press Inc., 1990, pp. 107–
142.
[10] J. S. Patton, “Mechanisms of macromolecule absorption by the lungs,” Adv. Drug Deliv.
Rev., vol. 19, pp. 3–36, 1996.
[11] M. Sakagami, P. R. Byron, J. Venitz, and F. Rypacek, “Solute disposition in the rat lung in
vivo and in vitro: determining regional absorption kinetics in the presence of mucociliary
escalator.,” J. Pharm. Sci., vol. 91, no. 2, pp. 594–604, Feb. 2002.

85
[12] M. Sakagami, “In vivo, in vitro and ex vivo models to assess pulmonary absorption and
disposition of inhaled therapeutics for systemic delivery.,” Adv. Drug Deliv. Rev., vol. 58,
no. 9–10, pp. 1030–60, Oct. 2006.
[13] C. Lombry, D. A. Edwards, V. Préat, and R. Vanbever, “Alveolar macrophages are a
primary barrier to pulmonary absorption of macromolecules.,” Am. J. Physiol. Lung Cell.
Mol. Physiol., vol. 286, no. 5, pp. L1002–8, May 2004.
[14] Y. Pang, M. Sakagami, and P. R. Byron, “The pharmacokinetics of pulmonary insulin in
the in vitro isolated perfused rat lung: implications of metabolism and regional
deposition.,” Eur. J. Pharm. Sci., vol. 25, no. 4–5, pp. 369–78, 2005.
[15] B. Olsson, E. Bondesson, L. Borgström, S. Edsbäcker, K. Ekelund, L. Gustavsson, and T.
Hegelund-myrbäck, “Pulmonary Drug Metabolism, Clearance, and Absorption,” in
Controlled Pulmonary Drug Delivery, H. D. C. Smyth and A. J. Hickey, Eds. New York,
NY: Springer New York, 2011, pp. 21–50.
[16] B. Forbes and C. Ehrhardt, “Human respiratory epithelial cell culture for drug delivery
applications.,” Eur. J. Pharm. Biopharm., vol. 60, no. 2, pp. 193–205, Jul. 2005.
[17] S. J. Enna and L. S. Schanker, “Absorption of drugs from the rat lung.,” Am. J. Physiol.
Lung Cell. Mol. Physiol., vol. 223, no. 5, pp. 1227–1231, 1972.
[18] P. R. Byron, S. R. N. Roberts, and A. R. Clark, “An isolated perfused rat lung preparation
for the study of aerosolized drug deposition and absorption,” J. Pharm. Sci., vol. 75, no. 2,
pp. 168–171, 1986.
[19] M. Taki, C. Marriott, X.-M. Zeng, and G. P. Martin, “Aerodynamic deposition of
combination dry powder inhaler formulations in vitro: a comparison of three impactors.,”
Int. J. Pharm., vol. 388, no. 1–2, pp. 40–51, Mar. 2010.
[20] V. A. Marple, D. L. Roberts, R. F.J., N. C. Miller, K. G. Truman, M. Van Oort, B. Olsson,
M. J. Holroyd, J. P. Mitchell, and D. Hochrainer, “Next Generation Pharmaceutical
Impactor (A New Impactor for Pharmaceutical Inhaler Testing). Part I: Design,” J. Aerosol
Med., vol. 16, no. 3, pp. 283–299, 2003.
[21] S. P. Newman, “Scintigraphic assessment of therapeutic aerosols.,” Crit. Rev. Ther. Drug
Carr. Syst., vol. 10, no. 1, pp. 65–109, 1993.
[22] N. J. C. SNELL and D. GANDERTON, “Assessing lung deposition of inhaled medications
Consensus statement from a workshop of the British Association for Lung Research, held
at the Institute of Biology, London, U.K. on 17 April 1998,” Respir. Med., vol. 93, pp.
123–133, 1999.

86
[23] S. F. Gardner, J. A. Green, E. M. Bednarczyk, L. Farnett, and F. Miraldi, “Principles and
clinical applications of positron emission tomography.,” Am. J. Hosp. Pharm., vol. 49, no.
6, pp. 1499–1506, 1992.
[24] R. B. Thompson and W. H. Finlay, “Using MRI to Measure Aerosol Deposition,” J.
Aerosol Med. Pulm. Drug Deliv., vol. 25, no. 2, pp. 55–62, 2012.
[25] D. Yi, A. Price, A. Panoskaltsis-Mortari, A. Naqwi, and T. S. Wiedmann, “Measurement
of the distribution of aerosols among mouse lobes by fluorescent imaging.,” Anal.
Biochem., vol. 403, no. 1–2, pp. 88–93, 2010.
[26] J. Fiegel, L. Garcia-Contreras, M. Thomas, J. VerBerkmoes, K. Elbert, A. Hickey, and D.
Edwards, “Preparation and in vivo evaluation of a dry powder for inhalation of
capreomycin.,” Pharm. Res., vol. 25, no. 4, pp. 805–11, Apr. 2008.
[27] S.-A. Cryan, N. Sivadas, and L. Garcia-Contreras, “In vivo animal models for drug delivery
across the lung mucosal barrier.,” Adv. Drug Deliv. Rev., vol. 59, no. 11, pp. 1133–51, Sep.
2007.
[28] R. F. Phalen, M. J. Oldham, and R. K. Wolff, “The Relevance of Animal Models for
Aerosol Studies,” J. Aerosol Med. Pulm. Drug Deliv., vol. 21, no. 1, pp. 113–124, 2008.
[29] A. Haynes, M. S. Shaik, A. Chatterjee, and M. Singh, “Formulation and Evaluation of
Aerosolized Celecoxib for the Treatment of Lung Cancer,” Pharm. Res., vol. 22, no. 3, pp.
427–439, Mar. 2004.
[30] S. V Fulzele, M. S. Shaik, A. Chatterjee, and M. Singh, “Anti-cancer effect of celecoxib
and aerosolized docetaxel against human non-small cell lung cancer cell line, A549.,” J.
Pharm. Pharmacol., vol. 58, no. 3, pp. 327–36, Mar. 2006.
[31] J. J. Salomon, S. Endter, G. Tachon, F. Falson, S. T. Buckley, and C. Ehrhardt, “Transport
of the fluorescent organic cation 4-(4-(dimethylamino)styryl)-N-methylpyridinium iodide
(ASP+) in human respiratory epithelial cells.,” Eur. J. Pharm. Biopharm., vol. 81, no. 2,
pp. 351–9, Jun. 2012.
[32] D. V. Bates, B. R. Fish, T. F. Hatch, T. T. Mercer, and P. E. Morrow, “Deposition and
retention models for internal dosimetry of the human respiratory tract. Task group on lung
dynamics.,” Health Phys., vol. 12, no. 2, pp. 173–207, 1966.
[33] S. P. Newman and S. W. Clarke, “Therapeutic aerosols 1--physical and practical
considerations.,” Thorax, vol. 38, no. 12, pp. 881–6, Dec. 1983.
[34] J. Heyder, J. Gebhart, G. Rudolf, C. F. Schiller, and W. Stahlhofen, “Deposition of particles
in the human respiratory tract in the size range 0.005–15 μm,” J. Aerosol Sci., vol. 17, pp.
811–825, 1986.

87
[35] G. Rudolf, R. Köbrich, and W. Stahlhofen, “Modelling and algebraic formulation of
regional aerosol deposition in man,” J. Aerosol Sci., vol. 21, pp. S403–S406, 1990.
[36] M. Dolovich, “Measurement of particle size characteristics of metered dose inhaler (MDI)
aerosols.,” J. Aerosol Med., vol. 4, no. 3, pp. 251–263, 1991.
[37] D. Ganderton, “General factors influencing drug delivery to the lung.,” Respir. Med., vol.
91, no. A, pp. 13–16, 1997.
[38] I. Gonda, “Targeting by deposition,” in Pharmaceutical Inhalation Aerosol Technology.,
A. J. (Ed. . Hickey, Ed. New York, NY: Marcel Dekker Inc., 1992, pp. 61–82.
[39] J. P. Mitchell and M. W. Nagel, “Cascade Impactors for the Size Characterization of
Aerosols from Medical Inhalers: Their Uses and Limitations Cascade Impactors for the
Size Characterization of Aerosols from Medical Inhalers: Their Uses and Limitations,” J.
Aerosol Med., vol. 16, no. 4, pp. 341–377, 2004.
[40] D. SWIFT, B. ASGHARIAN, and J. S. KIMBELL, “Use of Mathematical Aerosol
Deposition Models in Predicting the Distribution of Inhaled Therapeutic Aerosols,” in
Inhalation Aerosols, Second., A. Hickey, Ed. New York, NY: Marcel Dekker Inc., 2006,
pp. 51–78.
[41] C. Dunbar and J. P. Mitchell, “Analysis of Cascade Impactor Mass Distributions,” J.
Aerosol Med., vol. 18, no. 4, pp. 439–451, 2005.
[42] A. H. de Boer, D. Gjaltema, P. Hagedoorn, and H. W. Frijlink, “Characterization of
inhalation aerosols: a critical evaluation of cascade impactor analysis and laser diffraction
technique.,” Int. J. Pharm., vol. 249, no. 1–2, pp. 219–31, Dec. 2002.
[43] “601 INHALATION AND NASAL DRUG PRODUCTS: AEROSOLS, SPRAYS, AND
POWDERS—PERFORMANCE QUALITY TESTS,” United States Pharmacopeia, Natl.
Formul., vol. USP37 NF32, pp. 6346–6373, 2014.
[44] V. A. Marple, B. A. Olson, K. Santhanakrishnan, J. P. Mitchell, S. C. Murray, and B. L.
Hudson-Curtis, “Next generation pharmaceutical impactor (a new impactor for
pharmaceutical inhaler testing). Part II: Archival calibration.,” J. Aerosol Med., vol. 16, no.
3, pp. 301–324, 2003.
[45] V. A. Marple, B. A. Olson, K. Santhanakrishnan, D. L. Roberts, J. P. Mitchell, and B. L.
Hudson-Curtis, “Next generation pharmaceutical impactor: a new impactor for
pharmaceutical inhaler testing. Part III. extension of archival calibration to 15 L/min.,” J.
Aerosol Med., vol. 17, no. 4, pp. 335–343, 2004.
[46] M. Paranjpe and C. C. Müller-Goymann, “Nanoparticle-mediated pulmonary drug
delivery: a review.,” Int. J. Mol. Sci., vol. 15, no. 4, pp. 5852–73, Jan. 2014.

88
[47] P. Flecknell, “Replacement, reduction and refinement.,” ALTEX, vol. 19, no. 2, pp. 73–8,
Jan. 2002.
[48] H. Wan, H. L. Winton, C. Soeller, G. A. Stewart, P. J. Thompson, D. C. Gruenert, M. B.
Cannell, D. R. Garrod, and C. Robinson, “Tight junction properties of the immortalized
human bronchial epithelial cell lines Calu-3 and 16HBE14o-.,” Eur. Respir. J., vol. 15, no.
6, pp. 1058–68, Jun. 2000.
[49] K. J. Kim, Z. Borok, and E. D. Crandall, “A useful in vitro model for transport studies of
alveolar epithelial barrier.,” Pharm. Res., vol. 18, no. 3, pp. 253–5, Mar. 2001.
[50] N. R. Mathias, F. Yamashita, and V. H. L. Lee, “Respiratory epithelial cell culture models
for evaluation of ion and drug transport,” Adv. Drug Deliv. Rev., vol. 22, pp. 215–249,
1996.
[51] I. Forbes, “Human airway epithelial cell lines for in vitro drug transport and metabolism
studies.,” Pharm. Sci. Technolo. Today, vol. 3, no. 1, pp. 18–27, Jan. 2000.
[52] A. Steimer, E. Haltner, and C.-M. Lehr, “Cell Culture Models of the Respiratory Tract
Relevant to Pulmonary Drug Delivery,” J. Aerosol Med., vol. 18, no. 2, pp. 137–182, 2005.
[53] B. Q. Shen, W. E. Finkbeiner, J. J. Wine, R. J. Mrsny, and J. H. Widdicombe, “Calu-3: a
human airway epithelial cell line that shows cAMP-dependent Cl- secretion.,” Am. J.
Physiol., vol. 266, no. 5 Pt 1, pp. L493–501, May 1994.
[54] A. L. Cozens, M. J. Yezzi, K. Kunzelmann, T. Ohrui, L. Chin, K. Eng, W. E. Finkbeiner,
J. H. Widdicombe, and D. C. Gruenert, “CFTR expression and chloride secretion in
polarized immortal human bronchial epithelial cells.,” Am. J. Respir. Cell Mol. Biol., vol.
10, no. 1, pp. 38–47, Jan. 1994.
[55] M. Lieber, B. Smith, A. Szakal, W. Nelson-Rees, and G. Todaro, “A continuous tumor-
cell line from a human lung carcinoma with properties of type II alveolar epithelial cells,”
Int. J. cancer, vol. 17, no. 1, pp. 62–70, 1976.
[56] D. L. Shapiro, L. L. Nardone, S. A. Rooney, E. K. Motoyama, and J. L. Munoz,
“Phospholipid biosynthesis and secretion by a cell line (A549) which resembles type II
aleveolar epithelial cells,” Biochim. Biophys. Acta, vol. 530, no. 2, pp. 197–207, 1978.
[57] L. L. Nardone and S. B. Andrews, “Cell line A549 as a model of the type II pneumocyte,”
Biochim. Biophys. Acta - Lipids Lipid Metab., vol. 573, no. 2, pp. 276–295, May 1979.
[58] K. J. Elbert, U. F. Schäfer, H. J. Schäfers, K. J. Kim, V. H. Lee, and C. M. Lehr,
“Monolayers of human alveolar epithelial cells in primary culture for pulmonary
absorption and transport studies,” 1999, vol. 5, no. 601–608, 16AD.

89
[59] R. Duffin, L. Tran, D. Brown, V. Stone, and K. Donaldson, “Proinflammogenic Effects of
Low-Toxicity and Metal Nanoparticles In Vivo and In Vitro: Highlighting the Role of
Particle Surface Area and Surface Reactivity,” InhalationToxicology, vol. 19, no. 10, pp.
849–856, 2007.
[60] C. Ehrhardt, J. Fiegel, S. Fuchs, R. Abu-Dahab, U. F. Schaefer, J. Hanes, and C.-M. Lehr,
“Drug absorption by the respiratory mucosa: cell culture models and particulate drug
carriers.,” J. Aerosol Med., vol. 15, no. 2, pp. 131–9, Jan. 2002.
[61] J. Fiegel, C. Ehrhardt, U. F. Schaefer, C. Lehr, and J. Hanes, “Large Porous Particle
Impingement on Lung Epithelial Cell Monolayers — Toward Improved Particle
Characterization in the Lung,” Pharm. Res., vol. 20, no. 5, pp. 788–796, 2003.
[62] H. A. Cooney D, Kazantseva M, “Development of a Size-dependent Aerosol Deposition
Model Utilising Human Airway Epithelial Cells for Evaluating Aerosol Drug Delivery,”
Altern. to Lab. Anim., vol. 32, no. 6, pp. 581–590, 2004.
[63] M. Bur, H. Huwer, L. Muys, and C. M. Lehr, “Drug transport across pulmonary epithelial
cell monolayers: effects of particle size, apical liquid volume, and deposition technique.,”
vol. 23, no. 3, pp. 119–127, 2010.
[64] S. Hein, M. Bur, U. F. Schaefer, and C.-M. Lehr, “A new Pharmaceutical Aerosol
Deposition Device on Cell Cultures (PADDOCC) to evaluate pulmonary drug absorption
for metered dose dry powder formulations.,” Eur. J. Pharm. Biopharm., vol. 77, no. 1, pp.
132–8, Jan. 2011.
[65] S. Hein, M. Bur, T. Kolb, B. Muellinger, U. F. Schaefer, and C. M. Lehr, “The
Pharmaceutical Aerosol Deposition Device on Cell Cultures (PADDOCC) in vitro system:
design and experimental protocol,” Altern. to Lab. Anim., vol. 38, no. 4, pp. 285–295, 2010.
[66] A. G. Lenz, T. Stoeger, D. Cei, M. Schmidmeir, N. Pfister, G. Burgstaller, B. Lentner, O.
Eickelberg, S. Meiners, and O. Schmid, “Efficient bioactive delivery of aerosolized drugs
to human pulmonary epithelial cells cultured at air- liquid interface conditions,” Am. J.
Respir. Cell Mol. Biol., pp. 1–44, 2014.
[67] N. M. Davies and M. R. Feddah, “A novel method for assessing dissolution of aerosol
inhaler products,” Int. J. Pharm., vol. 255, no. 1–2, pp. 175–187, Apr. 2003.
[68] Y.-J. Son and J. T. McConville, “Development of a standardized dissolution test method
for inhaled pharmaceutical formulations.,” Int. J. Pharm., vol. 382, no. 1–2, pp. 15–22,
Dec. 2009.
[69] J. A. Tolman and R. O. Williams, “Advances in the pulmonary delivery of poorly water-
soluble drugs: influence of solubilization on pharmacokinetic properties.,” Drug Dev. Ind.
Pharm., vol. 36, no. 1, pp. 1–30, Jan. 2010.

90
[70] M. Eljamal, S. Nagarajan, and J. S. Patton, “In situ and in vivo methods for pulmonary
delivery,” Pharm. Biotechnol., vol. 8, pp. 361–374, 1996.
[71] L. X. Yu, E. Lipka, J. R. Crison, and G. L. Amidon, “Transport approaches to the
biopharmaceutical design of oral drug delivery systems: prediction of intestinal
absorption.,” Adv. Drug Deliv. Rev., vol. 19, no. 3, pp. 359–76, Jun. 1996.
[72] V. A. Gray, A. J. Hickey, P. Balmer, N. M. Davies, C. Dunbar, T. S. Foster, B. L. Olsson,
M. Sakagami, V. P. Shah, M. J. Smurthwaite, and E. Al, “The Inhalation Ad Hoc Advisory
Panel for the USP performance tests of inhalation dosage forms,” Pharmacopeial Forum,
vol. 34, no. 4, pp. 1068–1074, 2008.
[73] R. Salama, D. Traini, H.-K. Chan, and P. M. Young, “Recent Advances in Controlled
Release Pulmonary Therapy,” Curr. Drug Deliv., vol. 6, no. 4, pp. 404–414, 2009.
[74] M. Asada, H. Takahashi, H. Okamoto, H. Tanino, and K. Danjo, “Theophylline particle
design using chitosan by the spray drying,” Int. J. Pharm., vol. 270, no. 1–2, pp. 167–174,
Feb. 2004.
[75] S. Jaspart, P. Bertholet, G. Piel, J.-M. Dogné, L. Delattre, and B. Evrard, “Solid lipid
microparticles as a sustained release system for pulmonary drug delivery.,” Eur. J. Pharm.
Biopharm., vol. 65, no. 1, pp. 47–56, Jan. 2007.
[76] T. P. Learoyd, J. L. Burrows, E. French, and P. C. Seville, “Chitosan-based spray-dried
respirable powders for sustained delivery of terbutaline sulfate.,” Eur. J. Pharm.
Biopharm., vol. 68, no. 2, pp. 224–34, Feb. 2008.
[77] R. O. Cook, R. K. Pannu, and I. W. Kellaway, “Novel sustained release microspheres for
pulmonary drug delivery.,” J. Control. Release, vol. 104, no. 1, pp. 79–90, May 2005.
[78] E. Rytting, M. Bur, R. Cartier, T. Bouyssou, X. Wang, M. Krüger, C.-M. Lehr, and T.
Kissel, “In vitro and in vivo performance of biocompatible negatively-charged salbutamol-
loaded nanoparticles.,” J. Control. Release, vol. 141, no. 1, pp. 101–7, Jan. 2010.
[79] T. Riley, D. Christopher, J. Arp, A. Casazza, A. Colombani, A. Cooper, M. Dey, J. Maas,
J. Mitchell, M. Reiners, N. Sigari, T. Tougas, and S. Lyapustina, “Challenges with
developing in vitro dissolution tests for orally inhaled products (OIPs).,” AAPS
PharmSciTech, vol. 13, no. 3, pp. 978–89, Sep. 2012.
[80] R. O. Salama, D. Traini, H.-K. Chan, and P. M. Young, “Preparation and characterisation
of controlled release co-spray dried drug-polymer microparticles for inhalation 2:
evaluation of in vitro release profiling methodologies for controlled release respiratory
aerosols.,” Eur. J. Pharm. Biopharm., vol. 70, no. 1, pp. 145–52, Sep. 2008.
[81] Y. Son, M. Horng, M. Copley, and J. T. Mcconville, “Optimization of an In Vitro
Dissolution Test Method for Inhalation Formulations,” no. May, pp. 6–13, 2010.

91
[82] D. Arora, K. A. Shah, M. S. Halquist, and M. Sakagami, “In vitro aqueous fluid-capacity-
limited dissolution testing of respirable aerosol drug particles generated from inhaler
products.,” Pharm. Res., vol. 27, no. 5, pp. 786–95, May 2010.
[83] J. Mees, C. Fulton, S. Wilson, N. Bramwell, M. Lucius, and A. Cooper, “Development of
Dissolution Methodology for Dry Powder Inhalation Aerosols Pfizer Global Research &
Development DCoE,” vol. 892, no. 1997, p. 1997, 2011.
[84] T. Riley, D. Christopher, J. Arp, A. Colombani, A. Cooper, and M. Reiners, “Dissolution
Testing of Inhaled Products,” in IPAC-RS Conference, 2011, no. March.
[85] S. R. Gharse, “Creation and validation of an enhanced in vitro model of the lung,”
Creighton University, 2012.
[86] K. A. Foster, C. G. Oster, M. M. Mayer, M. L. Avery, and K. L. Audus, “Characterization
of the A549 cell line as a type II pulmonary epithelial cell model for drug metabolism.,”
Exp. Cell Res., vol. 243, no. 2, pp. 359–66, Sep. 1998.
[87] R. C. Stearns, J. D. Paulauskis, and J. J. Godleski, “Endocytosis of ultrafine particles by
A549 cells.,” Am. J. Respir. Cell Mol. Biol., vol. 24, no. 2, pp. 108–15, Mar. 2001.
[88] L. K. Limbach, P. Wick, P. Manser, R. N. Grass, A. Bruinink, and W. J. Stark, “Exposure
of engineered nanoparticles to human lung epithelial cells: influence of chemical
composition and catalytic activity on oxidative stress,” Environ. Sci. Technol., vol. 41, no.
11, pp. 4158–4163, 2007.
[89] H.-R. Paur, F. R. Cassee, J. Teeguarden, H. Fissan, S. Diabate, M. Aufderheide, W. G.
Kreyling, O. Hänninen, G. Kasper, M. Riediker, B. Rothen-Rutishauser, and O. Schmid,
“In-vitro cell exposure studies for the assessment of nanoparticle toxicity in the lung—A
dialog between aerosol science and biology,” J. Aerosol Sci., vol. 42, no. 10, pp. 668–692,
Oct. 2011.
[90] K. A. Foster, M. Yazdanian, and K. L. Audus, “Microparticulate uptake mechanisms of in-
vitro cell culture models of the respiratory epithelium.,” J. Pharm. Pharmacol., vol. 53, no.
1, pp. 57–66, Jan. 2001.
[91] B. Stringer, A. Imrich, and L. Kobzik, “Lung Epithelial Cell (A549) Interaction with
Unopsonized Environmental Particulates: Quantitation of Particle-Specific Binding and
IL-8 Production,” Exp. lung Res., vol. 22, no. 5, pp. 496–528, 996.
[92] R. Scherliess, “The MTT assay as tool to evaluate and compare excipient toxicity in vitro
on respiratory epithelial cells.,” Int. J. Pharm., vol. 411, no. 1–2, pp. 98–105, Jun. 2011.
[93] H. A. Boushey, “Chapter 20: Drugs used in Asthma,” in Basic and Clinical Pharmacology,
12th ed., T. A. Katzung BG, Masters SB, Ed. New York, NY: McGraw-Hill, 2012.

92
[94] N. R. Labiris and M. B. Dolovich, “Pulmonary drug delivery. Part I: Physiological factors
affecting therapeutic effectiveness of aerosolized medications,” Br. J. Clin. Pharmacol.,
vol. 56, no. 6, pp. 588–599, Aug. 2003.
[95] S. Shi, E. S. D. Ashley, B. D. Alexander, and A. J. Hickey, “Initial characterization of
micafungin pulmonary delivery via two different nebulizers and multivariate data analysis
of aerosol mass distribution profiles.,” AAPS PharmSciTech, vol. 10, no. 1, pp. 129–37,
Jan. 2009.
[96] P. R. Byron, M. Hindle, C. F. Lange, P. W. Longest, D. McRobbie, M. J. Oldham, B.
Olsson, C. G. Thiel, H. Wachtel, and W. H. Finlay, “In Vivo–In Vitro Correlations:
Predicting Pulmonary Drug Deposition from Pharmaceutical Aerosols,” J. Aerosol Med.
Pulm. Drug Deliv., vol. 23, no. S2, pp. S59–S69, 2010.
[97] W. Wong, J. Crapper, H.-K. Chan, D. Traini, and P. M. Young, “Pharmacopeial
methodologies for determining aerodynamic mass distributions of ultra-high dose inhaler
medicines.,” J. Pharm. Biomed. Anal., vol. 51, no. 4, pp. 853–7, Mar. 2010.
[98] T. F. Boat and P. W. Cheng, “Biochemistry of airway mucus secretions.,” Fed. Proc., vol.
39, no. 13, pp. 3067–3074, 1980.
[99] H. Fischer and J. H. Widdicombe, “Mechanisms of acid and base secretion by the airway
epithelium.,” J. Membr. Biol., vol. 211, no. 3, pp. 139–50, Jan. 2006.
[100] S. Pham and T. S. Wiedmann, “Note: dissolution of aerosol particles of budesonide in
Survanta, a model lung surfactant.,” J. Pharm. Sci., vol. 90, no. 1, pp. 98–104, Jan. 2001.
[101] T. S. Wiedmann, R. Bhatia, and L. W. Wattenberg, “Drug solubilization in lung
surfactant.,” J. Control. Release, vol. 65, no. 1–2, pp. 43–7, Mar. 2000.
[102] O. Moss, “Simulants of lung interstitial fluid,” Health Phys., vol. 36, no. 3, pp. 447–448,
1979.
[103] M. R. C. Marques, R. Loebenberg, and M. Almukainzi, “Simulated Biological Fluids with
Possible Application in Dissolution Testing,” no. August, pp. 15–28, 2011.