development and evaluation of fast … article development and evaluation of fast disintegrating...
TRANSCRIPT

Original Article
DEVELOPMENT AND EVALUATION OF FAST DISINTEGRATING EXTENDED RELEASE TABLETS
CONTAINING ANTIHYPERTENSIVE DRUG"
HADEL A. ABO ENIN*
*Pharmaceutics Department, National Organization of Drug Control and Research (NODCAR), Giza, Egypt. *Pharmaceutics Department,
Taif University, Taif, Saudi Arabia.
Email: [email protected], [email protected]
Received: 26 Mar 2014 Revised and Accepted: 27 Apr 2014
ABSTRACT
Objective: The aim of this work was preparing once daily fast disintegrating tablets to handle easily for adult hypertensive patients who have
difficulty in swallowing.
Methods: Solid dispersions bisoprolol hemifumarate (SD-BH) was prepared by using EC and HPMC in different ratios. A 3* 22 full factorial design
was used to investigate the main formulation parameters (different fillers, binder differ in the molecular weight and different coat type).
SD-BH were prepared and characterized by DSC. Disintegration time, wetting properties, friability, and hardness of FDTs were evaluated. Percent
drug dissolved was determined. Furthermore, the bioavailability was compared with commercial market product.
Results: The mean production yield of BH-SDs was 93.50 ± 0.39 %. The tablets demonstrated a hardness of 2-5 N, friability 0.04-0.56% and
disintegration time of 67 ± 1.54 sec. The formulations were subjected to accelerated stability study as per ICH guidelines and were found to be
stable after three weeks at 60 °C and 75 % R.H.
Conclusion: Based on The present study; the suggested FDTs (Ta1) which delivers a solid dispersions' 10 mg BH using HPMC and EC in 1:1 ratio
showed an extended effect in lowering the blood pressure and decrease the disintegrating time lesser than commercial oral tablets.
Keywords: Bisoprolol hemifumarate, Fast disintegrating tablets, Bioavailability study, Extended release, Solid dispersion.
INTRODUCTION
Hypertension is still one of the most significant risk factors for
cardiovascular disease, especially in the adult population [1]. Thus;
the development of an appropriate dosage form is desirable. Various
changes in the physiological functions associated with aging as
difficulty in swallowing large tablets or capsules or dysphagia made
current dosage forms are impractical [2].
The most desirable formulation for use by the elderly is one that's
easy to swallow and easy to handle [3]. Ease of swallowing and no
need for water; only the small volume of saliva of these
formulations, result in making fast disintegrating tablets’ primary
benefit is improvement the patient compliance [4].
Drugs (β blockers) have been one of the primary treatment of
hypertension because their ability to manage the heart failure [5].
Bisoprolol hemifumarate (BH) [(RS)-1-{4-[(2-isopropoxyethoxy)
methyl]phenoxy}-3-(isopropylamino)propan-2-ol] is a selective
beta-1 receptor blocker. BH leads to 46% decrease in sudden death
after one year of administration. BH administered is an effective and
safe as antianginal agent. It acts essentially through reduction of
myocardial oxygen consumption [6-7].
The administration of a drug in a controlled approach is being given
greater attention for improved therapeutic levels. Sustained or
controlled drug delivery occurs when the drug is released from the
plymers at a constant rate for the required period. The polymer the
drug or other active ingredients combined in such a way that help in
delayed the release [8].
Solid dispersion (SD) technique has been applied for the controlled
release of drugs. Previous reports have shown that by using SDs
containing a polymer blend, such as hydroxypropyl methylcellulose
(HPMC) and ethyl cellulose (EC), it is possible to precisely control
the rate of release of an extremely water-soluble drug [9].
Hence, this study concerned with the development and evaluation a
fast disintegrating, extended release tablets of BH as a new dosage
form easy for handling of elderly hypertensive patients using a solid
dispersion technique. Solid dispersion was prepared by the
accession of a release-retarding polymer hydroxypropyl methyl
cellulose (HPMC) and ethyl cellulose (EC) in different proportions.
The effects of polymer loading on drug release recorded after
studying the effect of formulae excepient on the disintegration time.
MATERIALS AND METHODS
Materials
BH was purchased from Merck (Barcelona, Spain). EC, HPMC, Ac-Di-Sol
(croscarmellose sodium), magnesium stearate and aspartame were
purchased from Fluka; Germany. Mannitol was purchased from El –Nasr
Pharmaceuticals, Egypt. Anhydrous lactose, polyvinyl pyrolidone, (PVP
K30 and PVP K90) were purchased from Sigma; USA.
Methods
Preparation of solid dispersions batches (batches A, B, and C)
by the solvent evaporation method
Solid dispersions BH were prepared by using EC and HPMC. Batches
A, B and C were prepared using HPMC: EC ratio as 1:1, 1:2, and 2:1
respectively.
One gram of the drug was dissolved in a mixture of methanol and
dichloromethane (1:1). Shaking very well was to ensure complete
dissolving of the drug in the solvent mixture. Mixture of EC and
HPMC equivalent to expected ratio poured in the solvent containing
the drug. Stirring very well using mechanical stirrer and magnetic
stirrer was till complete evaporation of the solvent. Sieving till give
homogenous powder by passed through a 200 μm sieve and
retained on a 100 μm sieve. Subsequently, the sieved ground
powders were stored at 25°C in a desiccator in a screw-capped glass
vial until use.
HPLC method for the determination of BH
The assay of BH was performed by a modified Joshi et al HPLC
method [10]. A thermo Inertsil ODS 3V®, C18 column (5 μ, 25 cm ×
4.6 mm, Hypersil) and a mobile phase consisting of 0.01 M
International Journal of Pharmacy and Pharmaceutical Sciences
ISSN- 0975-1491 Vol 6, Issue 6, 2014
Innovare
Academic Sciences

Abo Enin et al.
Int J Pharm Pharm Sci, Vol 6, Issue 6, 165-174
166
phosphate buffer (pH 7.4): acetonitrile (30:70 v/v) mixture was
used at the flow rate was 1 ml/min, and the effluent was monitored
at 273 nm.
The linearity, the precision, the selectivity, and the accuracy of the
method with respect to intra- and inter-day for three days were
demonstrated as per ICH guidelines [11].
Evaluation and characterization of SD batches
Percent yield of SDs and drug loading
The amount of the prepared batches A, B and C equivalent to 10 mg of
BH were weighed accurately and washed with 100 ml of phosphate
buffer PH 6.8 for 5 minutes. The extract was vortexes for 1 minute,
followed by centrifugation at 18,500 g (Centrifuge 5810 R; Ependorf,
Hamburg, Germany) for 10 minutes. The supernatant was filtered
through a 0.45-μm membrane and the amount of BH determined by
HPLC. Each sample was analyzed in triplicate. The formulation’s yield
percentage was calculated using a calibration curve constructed of
standard drug. The area of absorption in HPLC method was equivalent
to the free drug content. The production yields of SDs (Y %) and drug
loading (DL %) was estimated as follows:
Where Wf is the analyzed amount of free drug in the supernatant; W
total is the theoretical amount of drug that was added; W Polymers is the
total amount of Polymers added (total weight of HPMC and EC) [12].
Differential scanning calorimetry (DSC)
The samples (5–10) mg was thematically sealed in an aluminum pan
and heating was carried out at the 5°C / min using a Shimadzu DSC-
50, Japan. Nitrogen was used to purge gas through the DSC cell at a
flow rate of 50 ml/min over a temperature range of 30-150°C [13].
In vitro drug release study of the drug from the prepared solid
dispersion
A weighed quantity of drug solid dispersions from each batch (A, B
and C) equivalent to 10 mg of BH were introduced individually into
each vessel containing 900 ml of phosphate buffer solution pH 7.4,
37 ± 0.5°C and at a speed of 50 r.p.m in USP basket type apparatus I
(Dissolution tester, Pharma test, PTZ, Germany). At a required time
intervals, samples were withdrawn and replaced by an equal volume
of fresh pre-warmed dissolution medium maintaining sink
conditions throughout the experiment. Samples were analyzed by
HPLC as described earlier.
Kinetic analysis of in vitro release study
To study the mechanism of BH release, the cumulative release
percent vs time profiles were fitted to different mathematical
models as follows:
Zero-order kinetic model: ��
�� = KT
First-order kinetics model: ln(1 − MtM∞� ) = KT
Higuchi model: MtM∞� = KT�/��
Korsmeyer - Peppas empirical equation model: MtM∞ � = Ktn
Where Mt is the percent of drug cumulatively released at time t, M∞
is the percent of drug cumulative released at the time ∞, Mt/M∞ is
the fraction of drug released at the time point t, k is a kinetic rate
constant, and n is the exponent characterizing the mechanism of
drug release.
Factorial design for fast disintegrating tablet formulation
3*22 factorial design was used for tablet preparation. Two factors
were used at two levels as follows; 1: Binders; (low particle size and
high particle size; PVP K30 and PVP K90 respectively).
2: Diluents (Mannitol and lactose).
The design was repeated three times for each coating ratio as;
HPMC: EC (1:1, 1:2 and 2:1) represented as (A, B and C) respectively
Tablet preparation
The ingredients of each formula were mixed using geometric dilution
method (The composition presented in table 1). The produced mixtures
passed through a 200 μm sieve and retained on a 100 μm sieve. The
produced mixtures were finally mixed with magnesium stearate for 2
minutes. The tablets were directly compressed using single punch tablet
machine with 7 mm flat-faced punch (Single punch tablet machine,
Shang Hai Hua's Mao industrial and commercial Co. China). The
compression was manual and the tablets were compressed one after the
other. The total weight of each tablet was kept constant in all formulae
(100 mg / tablet). Then the tablets were evaluated for uniformity in
weight using an electronic balance (Sartorius). Also the compression
pressure was adjusted and monitored during the manufacture process at
7 KN.
Table 1: The composition of different BH tablets prepared by direct compression method
Formulae NO.* Batch 10% Binder 68% Diluent
Ta1 A PVP K30 Mannitol
Tb1 B
Tc1 C
Ta2 A Lactose
Tb2 B
Tc2 C
Ta3 A PVP K90 Mannitol
Tb3 B
Tc3 C
Ta4 A Lactose
Tb4 B
Tc4 C
*All formulae contain; amount of Bisoprolol hemifumarate solid dispersion equivalent to 10mg (10% w/w), Sweeting agent; 1%, Aspartame, and
Lubricant; 1% Mg Stearate
Physical evaluation
Tablet Hardness test
The hardness test was carried out using a tablet hardness tester
(Hardness Tester, D.R. Schleunger, 6D tablet tester, Germany). Six tablets
from each formulation batch were tested randomly, and the average
reading was noted. The average hardness is measured in kg/cm2 [14].
Tablet friability
The tablets’ friability test was measured according to the United
States pharmacopeia (USP 36, 2013) [15]. A sample of tablets
corresponding to 6.5 g was placed in the friability tester (Friabilator,
Van Seward, PNC, Germany) which was given 100 revolutions (25
r/min for 4 min). The tablets were reweighed for determination of

the percent friability. The friability percent was calculated
following equation.
The friability percent
=Initialweight � Finalweight� Initialweight⁄
Tablets wetting time (WT) and tablets wetting absorption ratio
(WAR)
Tablets WT was measured by a modified procedure
reported by Bi et al. [16]. The procedure was
Five circular tissue papers of 10 cm diameter were
dish containing an eosin dye solution in water (10
A tablet was carefully placed on the tissue paper.
for appearance of the dye solution on the upper
wetting time (WT)] was recorded using a stopwatch.
absorption ratio was calculated using the following
WAR = Wb � Wa� Wa.⁄ Equ (4)
Wa and Wb are the weights before and after
respectively [17].
Disintegration time
Measurement of disintegration time by a modified apparatus:
Fast disintegrating tablets disintegrate or dissolve in the mouth by
saliva. The limited amount of saliva in the mouth and the absence of
simulated tablet disintegration test found in US Pharmacopeia made
the difficulty to apply the general disintegration
conditions. A modified version of simple and novel disintegrating
test apparatus developed by Fu et al was used [
consisted of a cylindrical vessel in which 10-mesh screen was placed
in such way that only 2 ml of disintegrating medium would be
placed below the sieve. Disintegration test was carried out at 150
RPM. 2 ml phosphate buffer pH 6.8 was maintained at 37 ± 0.5°C.
In-vivo oral disintegration time
A test was performed on six healthy adult volunteers.
required for the complete disintegration of the tablet when it placed
on the tongue was determined by tactile feedback using a stop
watch. Permission to carry out this work was
Institutional Ethics Committee (NODCAR, Giza, Egypt)
In vitro dissolution study
Tablet formulae were introduced individually into each vessel
containing 900 ml of phosphate buffer solution pH 7.4, 37 ± 0.5°C
and at a speed of 50 r.p.m in USP Apparatus Π (Dissolution tester,
Pharma test, PTZ, Germany) [20]. Aliquots of 3 ml were withdrawn
from the dissolution medium at different time interval for 24 hours.
The drug content was determined by HPLC method and calculated
according to the predetermined yield percent. Each experiment was
done in triplicate.
Dissolution efficiency (DE %) is used as the criterion for comparing
the effect of polymer concentration on the rate of the drug release.
DE is defined as the area under the dissolution curve up to the time
“t,” expressed as percentage of the area of a rectangle described by
100% dissolution at the same time as in equation (5).
Dissolution efficiency (DE %) = � y. dt/Y100t �t
0
Where Y is the percent drug release as the function of time, t, T is the
total time of drug release and Y100 is a 100 % drug release
Accelerated stability testing:
The selected formulae were stored at 60 °C and 75 % relative
humidity (maintained using a saturated solution of NaCl) for three
weeks [22]. The stored tablets were examined visually for any
appearance and/or color changes every week. Th
evaluation includes the dissolution test was repeated at the end of
the storage period as the previously adopted for the fresh tablets. All
experiments were repeated three times with three different batches.
The results were expressed as the mean ± SD followed by paired t
test. Differences are considered to be significant at p < 0.05.
Abo Enin et al.
Int J Pharm Pharm Sci, Vol
was calculated from the
weight � 100 Equ (3)
wetting absorption ratio
procedure from that
was modified as follows:
were placed in a petri
(10 ml of 0.05% w/v).
paper. The required time
upper surface of tablet [A
stopwatch. The water
following equation:
Equ (4)
after water absorption,
Measurement of disintegration time by a modified apparatus:
Fast disintegrating tablets disintegrate or dissolve in the mouth by
saliva. The limited amount of saliva in the mouth and the absence of
simulated tablet disintegration test found in US Pharmacopeia made
the difficulty to apply the general disintegration test to reflect real
conditions. A modified version of simple and novel disintegrating
was used [18]. The device
mesh screen was placed
in such way that only 2 ml of disintegrating medium would be
placed below the sieve. Disintegration test was carried out at 150
RPM. 2 ml phosphate buffer pH 6.8 was maintained at 37 ± 0.5°C.
volunteers. The time
required for the complete disintegration of the tablet when it placed
on the tongue was determined by tactile feedback using a stop
was obtained from the
Egypt) [19].
Tablet formulae were introduced individually into each vessel
containing 900 ml of phosphate buffer solution pH 7.4, 37 ± 0.5°C
.m in USP Apparatus Π (Dissolution tester,
Pharma test, PTZ, Germany) [20]. Aliquots of 3 ml were withdrawn
from the dissolution medium at different time interval for 24 hours.
The drug content was determined by HPLC method and calculated
predetermined yield percent. Each experiment was
is used as the criterion for comparing
the effect of polymer concentration on the rate of the drug release.
DE is defined as the area under the dissolution curve up to the time
“t,” expressed as percentage of the area of a rectangle described by
equation (5).
� 100 Equ (5)
Where Y is the percent drug release as the function of time, t, T is the
is a 100 % drug release [21].
The selected formulae were stored at 60 °C and 75 % relative
humidity (maintained using a saturated solution of NaCl) for three
weeks [22]. The stored tablets were examined visually for any
appearance and/or color changes every week. The tablets’ physical
evaluation includes the dissolution test was repeated at the end of
the storage period as the previously adopted for the fresh tablets. All
experiments were repeated three times with three different batches.
s the mean ± SD followed by paired t
test. Differences are considered to be significant at p < 0.05.
Dissolution profiles of fresh and stored tablets were compared
according to the model independent mathematical approach of
Moore and Flanner, 1996 [23].
calculated according to the following equation:
ƒ2 � 50 log��l � 1/n�∑nt�
Where n is the number of sampling points. Rt, and Tt
percent dissolved of the reference (fresh) and the test (stored) at
time t respectively. ƒ2 represents a logarithmic transformation of the
sum of squared error of differences between the reference and test
products over all time points [24].
Clinical study
Thirty patients with primary hypertension (age: 50.9± 2.38years,
weight: 83.9± 2.81kg, blood pressure: 165.8 ± 3.90/102.5± 1.86mm
Hg, heart rate: 63.6± 2.98min
According to by the Human Ethics Committee of NOD
organization of drug control and research) the study protocol was
approved and the institutional guidelines. All the enrolled patients
have written informed consent. The test was performed to compare
the pharmacokinetic and the pharmacodynami
selected formula (Ta1) to commercial oral tablet (5mg Concor
The non blind, two treatments, two periods and randomized
crossover study were followed. Under this design, half of the
subjects were given orally 5mg Concor
half was given Ta1 buccally once daily (The composition in table 1)
with a 7-day inter dose washout periods.
A volume of blood samples (2.0 ml) was drawn through an
intravenous catheter and collected at different time intervals in
heparinized tubes. Plasma samples analyzed using a modified
validated Braza et al. HPLC for determination of BH method after
deproteinized by acetonitrile [25]. Blood samples were at 0.25, 0.5,
1, 2, 4, 6, 8, 12, 16, 20, and 24 h after oral dose and 0.5, 1, 1.5, 2,
6, 8, 12, 16, and 24 after buccal administration of formula Ta1
tablet’s group, on day 1 and day 7.
Pharmacokinetic parameters were calculated by a non
compartmental method. The area under the serum concentration
versus time curve; AUC0−t, AUC0−∞ an
(MRT) was calculated. Mean residence time (MRT) is the average
total time of a given dose spent in the body, which may be
calculated as MRT = AUMC/AUC. The Cmax and Tmax were
obtained directly from the data. The average steady
concentration (Cav) is calculated as Cav = AUC0
Bioavailability is the rate and extent to which the active
ingredient is absorbed from a drug product and was performed
using the F ratio, where F was the ratio of AUC0
tablet versus market tablets (t=24 for both formulae)
Blood pressures (BPs) were monitored and measured for 24 hours.
The difference of the blood pressure induced by each formula
expressed as the mean reduction in both DBP and SBP. The data
collected at different time inte
sphygmomanometer. The mean arterial pressure was calculated
according to the following equation.
MAP~DBP �1
3SBP � DBP) Equ (7)
The response to the formulae was expressed by (MAP
represent the rate and extent of DBP a
Statistical Analysis
All tests were conducted in triplicates. The results were expressed
as the mean ± SD followed by paired t test. One
Variance (ANOVA) was applied to assess the significance of the
effect of storage on the physical properties of the tested formulae
and the fresh formulae (In all experiments). Two
Variance (ANOVA) was used to assess the significance of the effect of
formulation and subject factors on the pharmacodynamic
parameters. Guassian’s test for multiple comparisons was then
performed to determine the source of difference respectively using
SPSS® software version 7.5 (SPSS Inc., Chicago, IL). Differences are
considered to be significant at p < 0.05.
Int J Pharm Pharm Sci, Vol 6, Issue 6, 165-174
167
Dissolution profiles of fresh and stored tablets were compared
according to the model independent mathematical approach of
Moore and Flanner, 1996 [23]. The similarity factor (ƒ2) was
calculated according to the following equation:
Rt � Tt�2 !0.5 � 100"�1 Equ (6)
Where n is the number of sampling points. Rt, and Tt, is the mean
percent dissolved of the reference (fresh) and the test (stored) at
time t respectively. ƒ2 represents a logarithmic transformation of the
sum of squared error of differences between the reference and test
products over all time points [24].
Thirty patients with primary hypertension (age: 50.9± 2.38years,
weight: 83.9± 2.81kg, blood pressure: 165.8 ± 3.90/102.5± 1.86mm
Hg, heart rate: 63.6± 2.98min−1) were included in this study.
According to by the Human Ethics Committee of NODCAR (National
organization of drug control and research) the study protocol was
approved and the institutional guidelines. All the enrolled patients
have written informed consent. The test was performed to compare
the pharmacokinetic and the pharmacodynamic effect of the best
) to commercial oral tablet (5mg Concor ®).
The non blind, two treatments, two periods and randomized
crossover study were followed. Under this design, half of the
subjects were given orally 5mg Concor® twice daily and the other
buccally once daily (The composition in table 1)
day inter dose washout periods.
A volume of blood samples (2.0 ml) was drawn through an
intravenous catheter and collected at different time intervals in
ed tubes. Plasma samples analyzed using a modified
validated Braza et al. HPLC for determination of BH method after
deproteinized by acetonitrile [25]. Blood samples were at 0.25, 0.5,
h after oral dose and 0.5, 1, 1.5, 2, 3, 4,
after buccal administration of formula Ta1
tablet’s group, on day 1 and day 7.
Pharmacokinetic parameters were calculated by a non
compartmental method. The area under the serum concentration
−t, AUC0−∞ and mean residence time
(MRT) was calculated. Mean residence time (MRT) is the average
total time of a given dose spent in the body, which may be
calculated as MRT = AUMC/AUC. The Cmax and Tmax were
obtained directly from the data. The average steady-state
oncentration (Cav) is calculated as Cav = AUC0−t / t.
Bioavailability is the rate and extent to which the active
ingredient is absorbed from a drug product and was performed
using the F ratio, where F was the ratio of AUC0−∞ for BH in Ta1
ket tablets (t=24 for both formulae)
Blood pressures (BPs) were monitored and measured for 24 hours.
The difference of the blood pressure induced by each formula
expressed as the mean reduction in both DBP and SBP. The data
collected at different time intervals and recorded with Mercurial
sphygmomanometer. The mean arterial pressure was calculated
according to the following equation.
Equ (7)
The response to the formulae was expressed by (MAP-AUC) to
represent the rate and extent of DBP and SBP reduction.
All tests were conducted in triplicates. The results were expressed
as the mean ± SD followed by paired t test. One-way Analysis of
Variance (ANOVA) was applied to assess the significance of the
he physical properties of the tested formulae
and the fresh formulae (In all experiments). Two-way Analysis of
Variance (ANOVA) was used to assess the significance of the effect of
formulation and subject factors on the pharmacodynamic
’s test for multiple comparisons was then
performed to determine the source of difference respectively using
software version 7.5 (SPSS Inc., Chicago, IL). Differences are
considered to be significant at p < 0.05.
Abo Enin et al.
Int J Pharm Pharm Sci, Vol 6, Issue 6, 165-174
168
RESULT AND DISCUSSION
HPLC method for the determination of BH
HLPC separation method explains; a mean correlation coefficient
(r2) for the calibration curve was over 0.9989. The assay showed
acceptable precision and accuracy. The precision ranged from 0.321
to 12.984 (C.V. %) and accuracy ranged from -5.25-15.988 (relative
error %). The relative standard deviation was lesser than 2%. The
LLOQ of the assay was calculated to be 0.05µg/ml. At all the results
indicated that; the suitability of the HPLC method for the
determination of BH in unknown samples.
Percent yield of SDs and drug loading
The production yields of SDs ranged between 93.50 ± 0.39 and 99.20
± 0.52%. The production yields of SDs for batch A was 93.50 ± 0.39,
batch B was 95.987± 0.685% while for batch C was 99.20 ± 0.52%.
The amount of drugs determined in each SD was 94.56 ± 0.36, 98.72
± 1.11% and 95.86 ± 0.80 for batches A, B and C respectively. The
drug loading (DL %) was for batches A; 29.879±0.12%, B;
30.28±0.078% and C; 29.928±0.257%. Statistical analysis shows no
significant difference between either batch whether in the
production yields or in the drug loading (DL %) or in the drug
content.
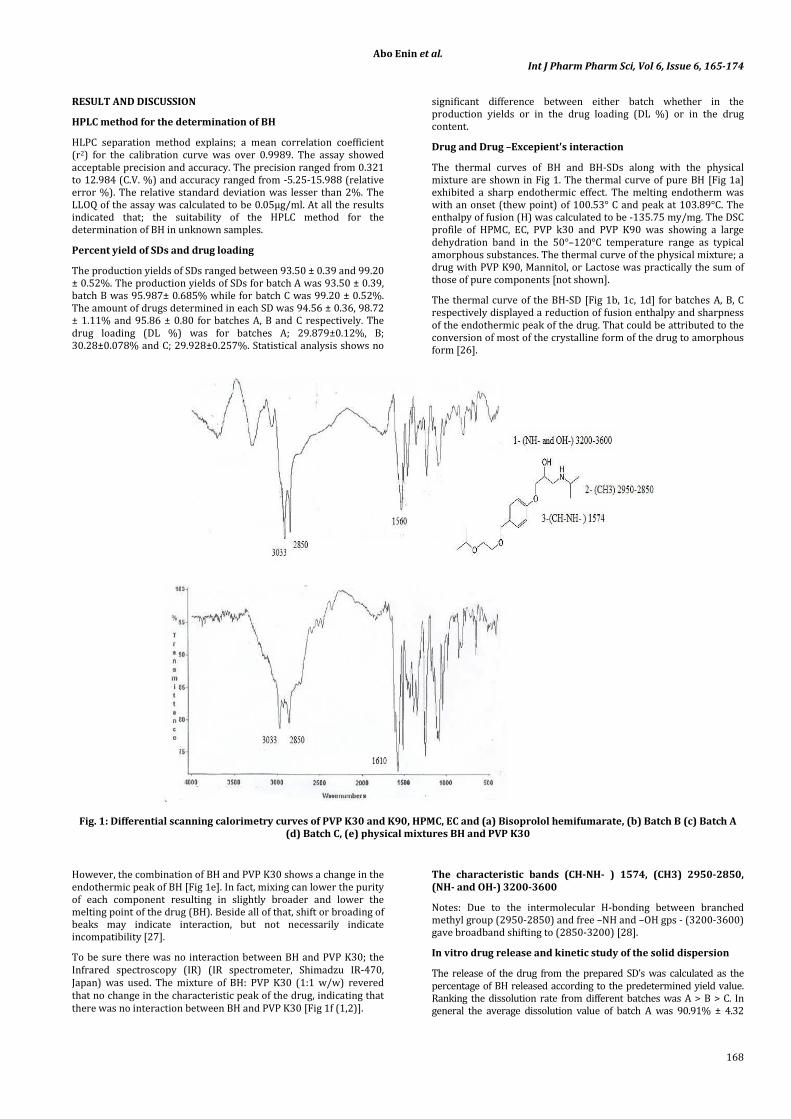
Drug and Drug –Excepient's interaction
The thermal curves of BH and BH-SDs along with the physical
mixture are shown in Fig 1. The thermal curve of pure BH [Fig 1a]
exhibited a sharp endothermic effect. The melting endotherm was
with an onset (thew point) of 100.53° C and peak at 103.89°C. The
enthalpy of fusion (H) was calculated to be -135.75 my/mg. The DSC
profile of HPMC, EC, PVP k30 and PVP K90 was showing a large
dehydration band in the 50°–120°C temperature range as typical
amorphous substances. The thermal curve of the physical mixture; a
drug with PVP K90, Mannitol, or Lactose was practically the sum of
those of pure components [not shown].
The thermal curve of the BH-SD [Fig 1b, 1c, 1d] for batches A, B, C
respectively displayed a reduction of fusion enthalpy and sharpness
of the endothermic peak of the drug. That could be attributed to the
conversion of most of the crystalline form of the drug to amorphous
form [26].
Fig. 1: Differential scanning calorimetry curves of PVP K30 and K90, HPMC, EC and (a) Bisoprolol hemifumarate, (b) Batch B (c) Batch A
(d) Batch C, (e) physical mixtures BH and PVP K30
However, the combination of BH and PVP K30 shows a change in the
endothermic peak of BH [Fig 1e]. In fact, mixing can lower the purity
of each component resulting in slightly broader and lower the
melting point of the drug (BH). Beside all of that, shift or broading of
beaks may indicate interaction, but not necessarily indicate
incompatibility [27].
To be sure there was no interaction between BH and PVP K30; the
Infrared spectroscopy (IR) (IR spectrometer, Shimadzu IR-470,
Japan) was used. The mixture of BH: PVP K30 (1:1 w/w) revered
that no change in the characteristic peak of the drug, indicating that
there was no interaction between BH and PVP K30 [Fig 1f (1,2)].
The characteristic bands (CH-NH- ) 1574, (CH3) 2950-2850,
(NH- and OH-) 3200-3600
Notes: Due to the intermolecular H-bonding between branched
methyl group (2950-2850) and free –NH and –OH gps - (3200-3600)
gave broadband shifting to (2850-3200) [28].
In vitro drug release and kinetic study of the solid dispersion
The release of the drug from the prepared SD’s was calculated as the
percentage of BH released according to the predetermined yield value.
Ranking the dissolution rate from different batches was A > B > C. In
general the average dissolution value of batch A was 90.91% ± 4.32

Abo Enin et al.
Int J Pharm Pharm Sci, Vol 6, Issue 6, 165-174
169
within 20 hrs ± 0.978, batch B give 93.13% ± 2.17 within 26 hrs ± 2.01
while batch C showed dissolution of 92.43% ± 4.17 within 28 hrs ± 2.74
It was noted from fig 2 that the increase in the polymer
concentration leads to decrease the dissolution rate. The release
retardation was a result of increasing in the diffusion path length
which drug molecules have to traverse by the effects of ethyl
cellulose concentration as well as the negative effect of HPMC on the
drug release [29]. HPMC is known to form hydrogels which slowly
erodes in aqueous solutions [30]. All the above leads to prolong the
dissolution rate of the drug.
Fig. 2: Dissolution profile of the prepared BH-SD batch (A, B and C).
The release profiles were evaluated kinetically by zero order, first
order, and Higuchi models. The release data obtained according to
the determination coefficient (R2) had high linearity (R2: 0.9891 to
0.9956) observed for the Higuchi model. That means both the drug
and carrier dissolve at rates proportional to their solubility and
diffusion coefficients in the dissolving medium. It mainly applied to
solid dispersal systems [31-33].
The different batches also followed Korsmeyer–Peppas model a
simple exponential equation for a drug release fraction n<0.5 [34].
This indicates case, I or simple Fickian diffusion. So, drug release
depends on two simultaneous rate processes, the rate of water
uptake and the rate of drug diffusion through continuously swelling
gel layer surrounding the drug. High polymer content results in a
greater amount of gel being formed. This gel and its viscous nature
increase the diffusion path length of the drug and furthermore affect
the diffusion coefficient of the drug. As a result, a reduction in the
drug release rate is obtained [35]. Hence, the drug release was
controlled by a combination of diffusion, polymer relaxation and
erosion of the polymeric component.
Fig. 1f: IR spectrum of 1) Bisoprolol hemifumarate, 2) BH – PVP K30
The characteristic bands (CH-NH- ) 1574, (CH3) 2950-2850, (NH- and OH-) 3200-3600
Physical characterization of tablets
All formulae showed acceptable hardness values ranging from 2-5 (USP
36, 2013), except Tc4 and Tb4 Table 2. Taking the binder factor in
consideration, significant difference occurred (increasing the hardness
value) when changing the binder of smaller particle size with that of
larger particle size (P-value=0. 158, SE=0. 156). The analysis of
interaction revealed that; mannitol had the lowest hardness value with a
small particle size binder; PVP K30 (P-value=0. 138, SE=0. 062) (Data
not shown). All tablets showed accepted friability value. The friability %
was ranging from 0.04-0.56% i.e., Less than 1%
All factors studied had a significant effect on the tablets' friability
(p<0.05). Studying the interaction found that only Diluents*PVP K30
interaction had a significant effect on the tablets' friability (p > 0.05)
(P-value=0. 121, SE=0. 021). The friability % of mannitol-PVP K 30
was higher than lactose-PVP K 30 (Data not shown).
Tablets wetting time (WT) and wetting absorption ratio (WAR)
Tablets belonging to formulation T1, T3 prepared using mannitol
exhibited shorter wetting time than T2, T4 prepared using lactose.
In addition tablets formulae prepared with PVP K30 exhibited
shorter wetting time than that prepared using PVP K90; Table 2.
This could be attributed to the greater number of pores formed in
these compressed tablets which resulted from its lower hardness
(the reduced tablet porosity retards water penetration and delays or
even inhibit the role of the super disintegrant) [36].
Moreover, it was evident that all tablets containing Ac-Di-Sol as a
super disintegrant which when moistened, expands and swells to
cause rupture and complete the disintegration of the tablet [37].
Hence, the decrease in the wetting time indicated the enhancement
of the tablet disintegration. In addition, the high absorption ratio
indicating the large amount of water absorbed, which lead to
enhance the disintegration of tablets.
Disintegration time
Measurement of disintegration time by a modified apparatus
The tablets’ disintegration time showed a wide variation from 31 to
83 seconds (Table 2). The data clearly indicate that the
disintegration time and hardness values strongly depend on the
selected independent variables as shown in Table 2.
Tb4 and Tc4 tablet formulations have the longest disintegration
time as there was a direct correlation between hardness value and

Abo Enin et al.
Int J Pharm Pharm Sci, Vol 6, Issue 6, 165-174
170
disintegration time. The greatest compact force leads to lower the
tablets' porosity. Luginbuhl and Leuenberger [38] confirmed that
the water uptake was the first step in the process of disintegration.
PVP type and diluents' types had the significant effect on the
disintegration time (P<0.05). Not only there was no interaction
between the effect of PVP type and the diluents used, but also it had
no significant effect on the tablets' disintegration (Data not shown)
(P-value=0. 0159, SE=1. 844).
Except all formulae have the same type and the same concentration
of the disintegrant (5% Ac Di Sol) but each formula has different
disintegration time. This was explained by the previously reported
fact; the rate at which the binder dissolved is the main factor
consider in the tablets’ disintegration. It was distributed across the
particle surface [39].
Tablets formulae T1 and T2 containing PVP K30 as a binder have
disintegration times lesser than one minute. PVP K30 has the
smallest particle size in addition; the uneven surface of PVP with a
folded structure increases the area subjected to the disintegration
media which led to decrease the disintegration time [40].
In-vivo oral disintegration time
Only seven formulae namely Ta1, Tb1, Tc1, Tb2, Ta3, Tb3 and Tb4
showed disintegration times lesser than three minutes, 67, 89, 128,
146, 173, 180 and 163 seconds respectively (European
Pharmacopoeia, 2002, adopted the term orodis-persible tablet as a
tablet to be placed in the mouth and disintegrated in lesser than 3
min) [41].
From all previous study tablets formulae Ta1, Tb1, Tc1, Tb2, Ta3,
and Tb3 have the best physical characters of all previous evaluation
tests. Tb4 was excluded as it has unaccepted hardness value hence;
it was not used for the following evaluation tests.
In vitro dissolution study
Dissolution samples were analyzed by HPLC method as previously
described. The best selected formulae were compared in this respect
with the release of the market product (10 mg Concor® tablets). The
values were calculated as the percentage of BH dissolute according
to the predetermined yield value. The market product (10 mg
Concor® tablets) shows the fast dissolution rate completed in the
first hours. It gave 98.41% within 60 minutes; Fig 3A.
Table 2: Physical evaluation of the stored and the fresh tablets
The fresh tablets
F
Formula number
H.*
%F* Dt** Dt*** WT# WAR##
Ta1 3.1±0.03 0.52 34±033 67±0.91 10.2±0.44 50.19±1.37
Tb1 3.6±0.25 0.04 36±0.24 89±0.15 10.5±0.71 51.81±0.07
Tc1 3.8±0.09 0.23 31±0.24 128±0.56 11.5±0.71 54.81±0.07
Ta2 3.95±0.58 0.50 35±0.06 206±0.02 31.3±0.14 19.89±0.24
Tb2 4.0±0.07 0.56 45±0.08 146±0.03 29.1±0.48 18.87±1.01
Tc2 4.3±0.57 0.07 53±0.6 217±0.01 28.1±0.48 20.87±1.01
Ta3 4.8±0.04 0.073 68±0.07 173±0.45 19.3±0.14 42.89±0.24
Tb3 4.9±0.59 0.11 69±0.09 180±0.25 17.3±0.14 44.89±0.24
Tc3 4.9±0.9 0.04 71±0.59 199±0.09 18.3±0.84 45.69±0.94
Ta4 4.87±0.01 0.12 65±0.06 206±0.41 85.3±0.84 15.69±0.94
Tb4 5.1±0.025 0.01 73±0.04 163±0.03 180.2±0.39 3.73±0.76
Tc4 5.9±0.96 0.03 83±0.12 301±0.4 185.2±0.39 5.73±0.76
The stored tablets
F H.* %F* Dt** Dt***
Tb2 2.1±0.14 0.93 170±0.45 173±0.11
Ta1 2.0±0.11 0.12 68±1.21 69±0.23
Tb1 2.5±0.43 0.87 74±1.12 76±0.91
F: Formula number H: Hardness (Kg/cm2) ± SD %F*: %Friability Dt**: Measurement of disintegration time by a modified apparatus± SD Dt***: In-
vivo oral disintegration time± SD #WT: Wetting Time ##WAR: wetting absorption ratio.
Fig. 3A: Dissolution profile of the market product 5mg Concor®
for 60 minutes.
Ranking the dissolution rate from different formulae was Ta1>Ta3>
Tb1> Tb2>Tb3> Tc1. In general the average dissolution value of
batch A was 98.98% ± 5.47 within 18 hrs ± 1.078, batch B give
96.63% ± 6.47 within 20 hrs ± 0.47 while batch C showed
dissolution of 86.63% ± 4.17 within 23 hrs ± 1.84.
Statistical analysis of the results when comparing Ta1 with Tb1 and
Ta3 with Tb3 indicate that increase in the amount of HPMC, it seems
that there is no change in the release pattern (P-value=0. 207, SE=0.
0987). But when compare Ta1, Tb1 and Tc1 with each other indicate
that an increase in the amount of EC, it seems that has a significant
effect in retard the release pattern.
The reduction in the dissolution rate was in the same pattern as
previously reported in the in vitro release study of the solid
dispersion. Comparing the dissolution value of Tb1 and Tb2 found
that; there was a significant effect on mixing BH with anhydrous
lactose. The latter showed the dissolution rate profile lower than the
dissolution rate profile of the formula containing mannitol; 55.81%,
64.52% for Tb1 and Tb2 in the first 12 hrs respectively, Fig 3B.
The standard deviation was emitted to increase the clarity of
the figure
Comparing the dissolution result of (Ta1, Tb1, and Tb2) with (Ta3
and Tb3) found that; PVP K30 has a significant effect on the dissolution
rate. The presence of PVP K30 in Ta1, Tb1, and Tb2 can probably be
increased the wetability of the drugs as, PVP K30 causes decreased the
interfacing tension between the drug and the dissolution media [42].

Abo Enin et al.
Int J Pharm Pharm Sci, Vol 6, Issue 6, 165-174
171
Fig. 3B: Dissolution profile of the best selected formulae Ta1, Tb1, Tc1, Tb2, Ta3, and Tb3. The standard deviation was emitted to increase
the clarity of the figure
DE was used to compare the dissolution rate and the polymer effect on
it. The DE value was 93.86%, 83.58% 63.97%, 72.25%, 71.25%, and
70.98% for Ta1, Tb1, Tc1, Tb2, Ta3, and Tb3 respectively. The DE
value for Ta1 containing 1:1 of HPMC: EC ratio is 93.86%. Whereas
this value decreased to 77.96% and 63.97% for Tb1, Tb2 (average),
and Tc1 containing 1:2 and 2:1 ratio of HPMC: EC, respectively. That
improving there is a retardation in the drug release rate by increasing
the amount of EC and there was no significant change while increasing
HPMC amount (P-value=0. 0135, SE=0. 635).
From the previous study tablets formulae Ta1, Tb1 and Tb2 were
selected as they have the highest DE. Ta3 and Tb3 were excluded as
it contains PVP K90 which has a negative effect on the dissolution
rate and Tc1 have the lowest DE (< 70%) Hence, Ta1, Tb1 and Tb2
were used for the following evaluation tests.
To be more precise; the dissolution result of the selected prepared
tablets (Ta1, Tb1 and Tb2) compared with the dissolution result of the
BH-SD to evaluate if the tablet compression has any effect on the
retardation of drug release. From Fig. 3C, it is clear that a slightly faster
release was observed during the first hour with tablet compared with
that of uncompressed SD-BH. However, a significant difference was
not observed (p > 0.05) in the release patterns. It means the
dissolution rate mainly depend on the composition of the SD.
Fig. 3C: Dissolution profile of the best dissolute formulae (Ta1, Tb1 and Tb2) and their prepared BH-SD batches (A and B).
The standard deviation was emitted to increase the clarity of
the figure
The slight increase in the dissolution rate could be due to the effect
of the super disintegrant which enables the minimal
rupture/fracture of solid dispersion particle. In addition, the effect of
the water soluble diluents (mannitol and lactose) and PVP K30
enhance the wetting of the SD particles [43].
By studying the mechanism of drug release from each formula, the
dissolution data of batches were fitted to zero-order, first-order,
Higuchi and Korsmeyer-Peppas as earlier reported.
0
10
20
30
40
50
60
70
80
90
100
110
0 2 4 6 8 10 12 14 16 18 20 22 24 26 28 30 32 34 36 38 40 42 44 46 48 50
Time (hr)
Mea
n cu
mul
ativ
e %
dru
g re
leas
ed
Tc1 Ta1 Tb1 Tb2 Ta3 Tb3

Abo Enin et al.
Int J Pharm Pharm Sci, Vol 6, Issue 6, 165-174
172
The in vitro release profiles of drug from all the formulations could
be best expressed by Higuchi’s equation (cumulative percentage) as
the correlation coefficient values (R2) had high linearity (R2: 0.990 to
0.999). It was found that different formulae had n<0.5; this indicates
case I or simple Fickian diffusion (Data not shown). Hence, diffusion
was controlled by a combination of diffusion and polymer relaxation.
Accelerated stability testing
None of the stored formulae (Ta1, Tb1 and Tb2) showed any change
in color or appearance throughout the storage period. On the other
hand, some tablets of Tb2 showed faint discoloration by the 2nd
week. The characters of the stored tablets are summarized in the
table 2. Formula Tb2 contains a high percentage of lactose which
undergo a non-enzymatic browning reaction with amines (active .
group in BH) generally known as the Maillard reaction. That reaction
resulted in the discoloration and the brown spots at the end of the
storage period [44].
According to Moore and Flanner equation; the dissolution profiles to
be considered similar, the value of the similarity factor (ƒ2) should
be as close as possible to 100 (range from 50 to 100, corresponds to
10% and 0% differences, respectively). The computed (ƒ2) values
were 75.277%, 69.05% and 56.222% for Ta1, Tb1 and Tb2,
respectively, indicating that the dissolution profiles of fresh and
stored tablets could be considered similar, Fig 4. The highest (ƒ2)
value was in case of Ta1 and Tb1. It was indicated the higher the
similarity between the dissolution profiles of fresh and stored
tablets of these formulae.
Fig. 4: The dissolution profile of the fresh formulae compared to the dissolution profile of the stored formulae (Ta1, Tb1 and Tb2).
Fig. 5: The mean serum concentration-time curves after single and multiple doses of: A: BH oral tablet 5mg Concor® (n = 30). B: BH
extended-release tablet Ta1 (n = 30).
0
10
20
30
40
50
60
70
80
90
100
110
0 5 10 15 20 25 30 35 40 45 50
Time (hr)
Mea
n cu
mul
ativ
e %
dru
g re
leas
e
Tb1 ( Fresh) Tb1(Stored) Ta1 ( Fresh) Ta1( Stored)Tb2 (Fresh) Tb2 ( Stored)

Abo Enin et al.
Int J Pharm Pharm Sci, Vol 6, Issue 6, 165-174
173
Physical evaluation of formulae Tb1 and Ta1 showed a marked
decrease in the mechanical strength of formula Tb1 compared to
Ta1 (hardness value). Although the mechanical strength of formula
Tb1 was less than fresh one but according to ICH guidelines (ICH Q1,
Q6a) some physical changes in attributes may be expected under
accelerated conditions [11]. Furthermore, statistical analysis
approved that; all results (hardness, friability and disintegration
time) had no significant difference in the stored formulae Ta1
compared to fresh formula Ta1. Hence, this formula was physically
stable after storage (The level of significance of rejection is more
than 0.25) [11].
Based on all results of storage at 60 °C and 75 % R.H for three
weeks, and the other physical characters; formula Ta1 was the best
selected formula.
Clinical study
Mean serum concentration-time curves of BH formulations on day 1
and day 7 are shown in Figures 5 (a and b), and the pharmacokinetic
properties are summarized in Table 3. While the mean values for the
area under the mean reduction of MAP-time curve AUC (0-24) was
illustrated in Fig 6.
The results of the statistical analysis revealed that the formulation
had a significant effect on Tmax, AUC (0-24) and AUC (0-∞) of BH at p <
0.05 (F5, 17 n = 6.469, 43.890 and 242) respectively. Based on these
results, it was evident that the formulation exhibited the most
significant effect on AUC (o-∞). On the other hand, there was no
significant difference between the subjects for all the tested
parameters, Cpmax and Cav. Multiple comparisons using Guassian’s
test revealed that AUC(0-∞) was extremely differed significantly with
the highest value for Ta1.
The mean values of the area under the mean reduction of MAP-time
curves AUC (0-24) were 17.39 ± 1.92 and 39.479 ± 4.62 after the oral
administration of the market product 5 mg Concor® and the buccal
administration of Ta1 to the thirty subjects, respectively at p < 0.05
(P-value = 0.35). Based on these results, it was evident that the
formula Ta1 exhibited a significant difference effect in reduction of
the mean arterial pressure.
The formula Ta1 was developed to decrease the frequency of the
dose administration and maintain the peak serum concentrations
after drug administration and maintain the reduction of the mean
arterial pressure. The peak concentration of Ta1 was delayed. In
addition, there was less fluctuation compared to market
formulation.
Fig. 6: Mean reduction of MAP following sublingual dose of the
tested formula Ta1 (10mg Bisoprolol), the market product (5
mg Concor®)
Table 3: Pharmacokinetic parameters of BH of two BH formulations after single dose and multiple doses at the end of 7- days (Mean ± SD)
Single dose Parameter Test (Ta1 tablet) Reference (5mg Concor®)
C max (ng/mL) 1.25 ± 39.0 1.3± 271
Tmax (h) 6.258 ± 1.34 2.547 ± 0.38
MRT (h) 23.21687± 2.28 9.951042± 0.44
AUC (0-24) (ng·h/mL) 24.62883 ± 156 18.74665 ± 776
AUC(0-∞) (ng·h/mL) 49.10886 28.16401
F (%) 174.68± 23.9
F (%)
Multiple dose C max (ng/mL) 1.219 ± 29.7 1.14 ± 255
T max (h) 2.60 ± 0.87 1.88 ± 0.36
MRT (h) 20.57 ± 2.40 10.43 ± 0.30
AUC (0-24) (ng·h/mL) 32.2 ± 3.1 27.985 ± 3.6
AUC (0-∞) (ng·h/mL) 53 ± 6.1 33.5 ± 4.4
Cav(ng/ml) 1.34 ± 0.77 1.16 ± 1.42
F (%) 158.3± 24.1
CONCLUSION
The present study indicates; the suggested buccal tablet (Ta1) which
contains solid dispersions' 10 mg BH using HPMC and EC in 1:1 ratio
showed an extended effect in lowering the blood pressure than
commercial oral tablets. The Ta1 formulation of bisoprolol
hemifumatare was developed to decrease the frequency of dose. In
addition, it considered a promising dosage form easy for handling of
elderly patients suffering from hypertension once every 24hr. It can
be taken with no access of water as; it is orodispersible tablets with
short disintegrating time. The significant findings presented here
encourage further studies.
REFERENCES
1. Rathbone MJ, Hadgraft J, Roberts MS. Delivery Technology
Drugs and Pharmaceutical Sciences, Vol. New York: Marcel
Dekker Inc. P 2003; 126:203-16.
2. Kamimori GH, Karyekar CS, Otterstetter R, and Cox DS. The rate
of absorption and relative bioavailability of caffeine
administration chewing gum versus capsules to normal
Healthy volunteers. Int. J. Pham 2002; 234:159-67.
3. Rathbone MJ, Ponchel G, and Ghazali FA. Systemic oral mucosal
drug delivery and delivery systems. In: Oral Mucosal Drug
Delivery, (ed.).New York. P 1996; 241-85.
4. Kumar V, and Medina M. Evaluation of cellulose II powders as a
potential multifunctional excepients in tablet formulation. Int .J.
Pharm 2006; 322:31-35.
5. Dubey IYa, and Starokadomskyy PL. New absorption promoter
for the buccal delivery: Preparation and characterization of
lysalbinic acid. Int. J. Pham 2006; 308:149-54.
6. Popa G, and Gafitanu E. Oral disintegrating tablets. A new
modern solid dosage form. Rev. Med. Chir. Soc. Med. Nat. Iasi
2003; 107(2):337-42.
7. Serpelloni M. Orodispersible solid pharmaceutical form, United
States patent. (Patent number: US 2003/ 0147947 A1(2003).
8. Chang RK, Guo X, Burnside BA, and Couch RA. Fast dissolving
drug delivery tablets. Pharm. Technol 2000; 6:52-58.

Abo Enin et al.
Int J Pharm Pharm Sci, Vol 6, Issue 6, 165-174
174
9. Honda Y. and Nakano M. Evaluation of preference for
swallowing orally disintegrating Famotidine tablet in
outpatient. J. Hosp. Pharm 1998; 24:533-40.
10. {Murpani, 1875 #3086}
11. International conference on harmonization technical
requirement for registration of pharmaceuticals for human use,
Q1 AND Q6A; Adopted by CPMP, November, 1999. Available at:
http://www.ich.org/products/guidelines/quality/article/quali
ty-guidelines.html
12. Barenholz Y, Amselem S. Quality control assays in the
development and clinical use of liposome-based formulations,
in: G. Gregoriadis (Ed.), Liposome Technology, Liposome
Preparation and Related Techniques (2nd ed.) (1993), pp. 527–
616.
13. Song W, Cun D, Xi H, Fang L. The control of skin-permeating
rate of bisoprolol by ion-pair strategy for long-acting
transdermal patches. AAPS PharmSciTech 2012;13(3):811-5.
14. Sameer GL, Yi-Ying Y, Ajay KB. Effects of disintegration-
promoting agent, lubricants and moisture treatment on
optimized fast disintegrating tablets. Int. J. Pharm 2009;365(1–
2), 5:4-11.
15. United State Pharmacopoeia USP 36, NF 31. The united states
pharmacopeias convention 1261 Twinbrook parkaway,
Rockville, MD 20852, 2013:pp.256-59.
16. Bi Y, Yonezawa Y and Sunada H. Rapidly disintegrating tablets
prepared by the wet compression method: mechanism and
optimization. J. pharm. Sci 1999;88, 10:1004-1110.
17. Sameer GL and Ajay KB. Response Surface Methodology to
Optimize Novel Fast Disintegrating Tablets Using β
Cyclodextrin as Diluent, AAPS PharmSciTech
2010;11(4):1627–16-35.
18. Shukla D, Chakraborty S, Singh S and Mishra B. Fabrication and
evaluation of taste masked resinate of risperidone and its
orally disintegrating tablets. Chem. Pharm. Bull
2009;57(4):337-45.
19. Shu T, Szuki H, Hironaka K, and Ito K. Studies of rapidly
disintegrating tablets in oral cavity using co-ground mixtures
of mannitol and crosspovidone Chem. Pharm. Bull 2002;50,
2:193-98.
20. Ved P, Saurabh M, Deepika Sh, Hemlata KY, and Vikas J. Fast
disintegrating tablets: Opportunity in drug delivery system. J
Adv Pharm Technol Res 2011; Oct-Dec;2(4):223–2-35.
21. Nokhodchi A, Hassan-Zadeh D, Monajjem-Zadeh F, Taghi-Zadeh
N. Effect of various surfactants and their concentration on
controlled release of captopril from polymeric matrices. Acta
Pharm 2008;58:151-62.
22. Matthews BR. Regulatory aspects of stability testing in Europe.
Drug Dev Ind Pharm 1999;25:831-56. [PubMed]
23. Moore JW and Flanner HH. The comparison of dissolution
profile. Pharm. Tech 1996;20(6):64-74.
24. Avachat A, Kotwal V. Design and evaluation of matrix-based
controlled release tablets of diclofenac sodium and chondroitin
sulphate. AAPS PharmSciTech 2007; Oct 19;8(4):E88.
25. Braza AJ, Modamio P, Lastra CF, Mariño EL. Development,
validation and analytical error function of two
chromatographic methods with fluorimetric detection for the
determination of bisoprolol and metoprolol in human plasma.
Biomed. Chromatogr 2002;16:517-22.
26. Yoshihashi Y, Iijima H, Yonemochi E. and Terada K. Estimation
of physical stability of amorphous solid dispersion using
differential scanning calorimetry. J. Thermal Analysis and
Calorimetry 2006;85,3:689-92.
27. Clas S, Dalton CR, and Hancock BC. Calorimetry in
pharmaceutical research and development. In: Encyclopedia of
Pharmaceutical Technology, Swarbrick, J. and Boylan J. C. (eds.)
2002: P 289-301.
28. Alper NL, Keiser WE, and Szymanski HA. (eds.). IR Theory and
Practice of Infrared Spectroscopy. New York, 1st edn., P
1(1970).
29. Gopi MV, Phillip JS, and Jin-WL. Development of orally
disintegrating tablets comprising controlled-release
multiparticulate beads. Drug Development and Industrial
Pharmacy 2012;38(12):1428-40.
30. Kim EJ, Chun MK, Jang JS, Lee IH, Lee KR, and Choi HK.
Preparation of a solid dispersion of felodipine using a solvent
wetting method. Eur.J. of Pharm. Biopharm 2006;64:200-5.
31. Higuchi WI, Mir NA, and Desai SJ. Dissolution rates of
polyphase mixtures. J.Pharma. Sci 1965;54:1405-10.
32. Corrigan OI. Retardation of polymeric carrier dissolution by
disperseddrugs: Factors influencing the dissolution of solid
dispersions containing polyethylene glycols. Drug
Development and Industrial Pharmacy 1986;12:1777-93.
33. Craig DQM. The mechanisms of drug release from solid
dispersions in water-soluble polymers. Int. J. Pharm
2002;231:131-44.
34. Korsmeyer RW, Gurny R, Doelker E, Buri P, and Peppas NA.
Mechanisms of solute release from porous hydrophilic
polymers. Int. J. Pharm 1983;15:25-35.
35. Uttam M, Veeran G, Animesh G, Anirbandeep B, Uttam B,
Bappaditya C, and Tapan KP. Optimization of Metformin HCl
500 mg Sustained Release Matrix Tablets Using Artificial
Neural Network (ANN) Based on Multilayer Perceptrons (MLP)
Model. Chem. Pharm. Bull 2008;56(2):150-55.
36. Aburahma MH, El-Laithy HM, Hamza Yel-S. Preparation and In
Vitro/In Vivo Characterization of Porous Sublingual Tablets
Containing Ternary Kneaded Solid System of Vinpocetine with
β-Cyclodextrin and Hydroxy Acid. Sci Pharm 2010;78 (2):363-
79. Epub 2010 May 17.
37. Battu SK, Repka MA, Majumdar S, Madhusudan RY.
Formulation and evaluation of rapidly disintegrating tablet
Fenoverine tablets: Effect of superdisintegrants. Drug. Dev. Ind.
Pharm 2007;33:1225-32.
38. Luginbühl R and Leuenberger H. Use of percolation theory to
interpret water uptake, disintegration time and intrinsic
dissolution rate of tablets consisting of binary mixtures.
Pharmaceutica Acta Helvetiae 1994;69, 3:127-34.
39. Shangarow RF. Compressed tablets by direct compression, In:
Pharmaceutical Dosage Form: Tablets, Liberman, H.A.,
Lachman L .and Schwartz,J.B.,(eds.).New York, 2nd edn., Vol. 1,
1989:P. 203-14.
40. Fang-Yu L, Min MH, Janaki RN, Kuldeepak S, James SC, Joseph
AF. Water soluble polymer-based rapidly dissolving tablets and
production process theory. United States patent;Patent
number:2002:US6465009 B1.
41. European Pharmacopia, 4th edition, "Strasbowry, Council of
Europe”, 2002:PP.191-201, 984, 1169-70, 1505-1507, 1828-9,
2435.
42. Sammour OA, Hammad MA, Megrab NA, Zidan AS. Formulation
and optimization of mouth dissolve tablets containing
rofecoxib solid dispersion. AAPS PharmSciTech
2006;Jun16;7(2):E55.
43. Nikhil K, Jeetendra SN, Vandana J, and Rahul J. Formulation,
Development, and Performance Evaluation of Metoclopramide
HCl Oro-Dispersible Sustained Release Tablet. Arch Pharm Res
2011;34, 10:1691-1700.
44. Qiu Z, Stowell JG, Morris KR, Byrn SR, Pinal R. Final, Kinetic
study of the Maillard reaction between metoclopramide
hydrochloride and lactose. Int. J. Pharm 2005;303(1-2):20-30.