development and implementation of a fish monitoring
TRANSCRIPT

Development and Implementation of aFish Monitoring Program
for the Port Honduras Marine ReservePunta Gorda, Toledo District, Belize
Report on an internship with the Toledo Institute for Development and theEnvironment
January 27-April 11 2001
supported by The Nature Conservancyin collaboration withGlobal Graduates
andthe Marine Resource Management ProgramCollege of Oceanic and Atmospheric Sciences
Oregon State University
in partial fulfillment of the requirements for the degree ofMaster of Science in Marine Resource Management
Maggie SommerM.S. candidate
Marine Resource ManagementOregon State University
December, 2001

ABSTRACT
Marine protected areas are increasingly popular tools for fisheries conservation and
enhancement worldwide. Monitoring programs that enable managers to track changes in
fish stock abundance, size-frequency of target species, and species diversity are critical to
evaluating the success of MPA's. The Port Honduras Marine Reserve (PHMR) in
southern Belize encompasses approximately 415 square kilometers of shallow, coastal
waters with significant mangrove and estuarine habitat. The PHMR is intended to protect
and enhance nearby reef fisheries. The management entity, the Toledo Institute for
Development and the Environment (TIDE), requested assistance in developing a long-
term fish monitoring program to assess the effectiveness of the reserve and guide future
regulatory decisions. The Nature Conservancy provided funding for a three month
internship with TIDE for this purpose. I worked onsite in Punta Gorda, Belize, to
develop a low-cost methodology capable of generating sufficiently thorough and accurate
results. I trained TIDE staff and volunteers in the monitoring protocol and in basic
analysis and presentation of the results, and made recommendations for long-term
implementation of the program. This report examines the PHMR management
framework, the monitoring techniques used, and the training programs developed and
provided to TIDE staff. Recommendations for the improvement and sustainability of the
monitoring program are made.

TABLE OF CONTENTS
INTRODUCTION 1BACKGROUND 3
Coastal Resource Management in Belize 3History of Coastal Resource Exploitation 3Integrated Coastal Zone Management 4ICZM in Belize 5
The Role of Marine Protected Areas 6The Port Honduras Marine Reserve 9
Habitats 11Fisheries resources 14Reserve establishment and management 17Goals 18Need for monitoring 20
OBJECTIVES 21Monitoring Program Objectives: 21Internship Objectives: 23
METHODS 24Review of fish census methods 25Bohnsack-Bannerot Stationary Visual Census (SVC) Technique 29Monitoring Sites 31Survey Frequency 33Training Methods 34
SCUBA certification 35Classroom training 35In-water training 36Data management 38
RESULTS AND DISCUSSION 39Initial Results 39Expected Results 39Assessment of the Monitoring Program 43
RECOMMENDATIONS 461. Information 462. Zoning 483. Training 484. Institutional 495. Monitoring Methodology 506. Data Management and Analysis 517. Commitment 538. Personnel 53
CONCLUSIONS 54REFERENCES 57

Appendix 1 64Internship products and other materials left with TIDE/TNC in Punta Gorda 64
Appendix 2 66Survey data sheet template 66
Appendix 3 67Data sheets for length estimation training & practice 67
Appendix 4 68List of fish species common in the port honduras marine reserve 68
Appendix 5 69Training materials 69
1. Flashcards used for fish species identification training 692. Slide, PowerPoint presentation on fish identification used in MonitoringWorkshop 69
Appendix 6 71Sample Microsoft Excel worksheet from spreadsheet created for survey data 71
Appendix 7 72Sample charts of species abundance and lengths using data from a training dive 72

INTRODUCTION
Belize has jurisdiction over the second-largest coral reef system in the world, after the
Great Barrier Reef in Australia. Coral reefs are home to a wealth of biological diversity,
including harvestable fisheries resources such as fish and shellfish. Marine finfish
catches from coral reef systems are an important source of food and income for coastal
populations around the world. However, fish stocks have declined significantly in many
reef areas (Bohnsack, 2000). Because reef fisheries are complex, targeting multi-species
assemblages and often using non-specific gear types, they can be difficult to manage
using traditional sectoral approaches. Additionally, many countries with coral reef
habitats do not have adequate resources to ensure enforcement of complex fisheries
regulations. The use of marine protected areas (MPA's), or areas where some form of
increased resource protection is provided, in fisheries conservation and enhancement is
growing.
The Government of Belize, recognizing the need to protect its coastal resources, has
followed the Great Barrier Reef Marine Park model and focused its efforts on the creation
of MPA's (Gibson et al., 1998). The newest of these is the Port Honduras Marine
Reserve (PHMR) in southern Belize. The PHMR was instituted in 2000 with protection
and enhancement of local fish stocks its primary goal. The Toledo Institute for
Development and Environment (TIDE), a non-governmental organization dedicated to
the conservation of the Toledo district's natural resources and to sustainable economic
development for its residents, is the managing authority for the PHMR.
1

In order for any MPA to achieve its goals, it must have sufficient local support; financial,
technical, and other resources for management; and the ability to respond to new
information about, or changes in, the fish stocks and the local environmental, social, and
economic conditions. In other words, a program of regular scientific monitoring of these
elements is an integral part of MPA management.
Recognizing the need for information about the status and trends in fish populations in
the reserve, TIDE requested assistance from the local office of The Nature Conservancy
(TNC) in developing a long-term fish monitoring program for the PHMR. The Nature
Conservancy agreed to provide funding for a graduate student to establish a monitoring
program through an internship with TIDE. Mr. Wil Maheia, Executive Director of TIDE,
contacted Global Graduates—The Oregon International Internship Program (Global
Graduates) to recruit an intern. Global Graduates arranges international internships in a
variety of disciplines for students in the Oregon University System (OUS). I was
selected for the internship on the basis of previous experience and interest, and
availability of funding was confirmed in late December 2000. The internship consisted
of a ten-week period of work onsite in Punta Gorda with TIDE. This report describes the
process of developing the monitoring plan and training TIDE staff, and makes
recommendations on the future monitoring and management efforts in the PHMR.
2
BACKGROUND
COASTAL RESOURCE MANAGEMENT IN BELIZE
History of Coastal Resource Exploitation
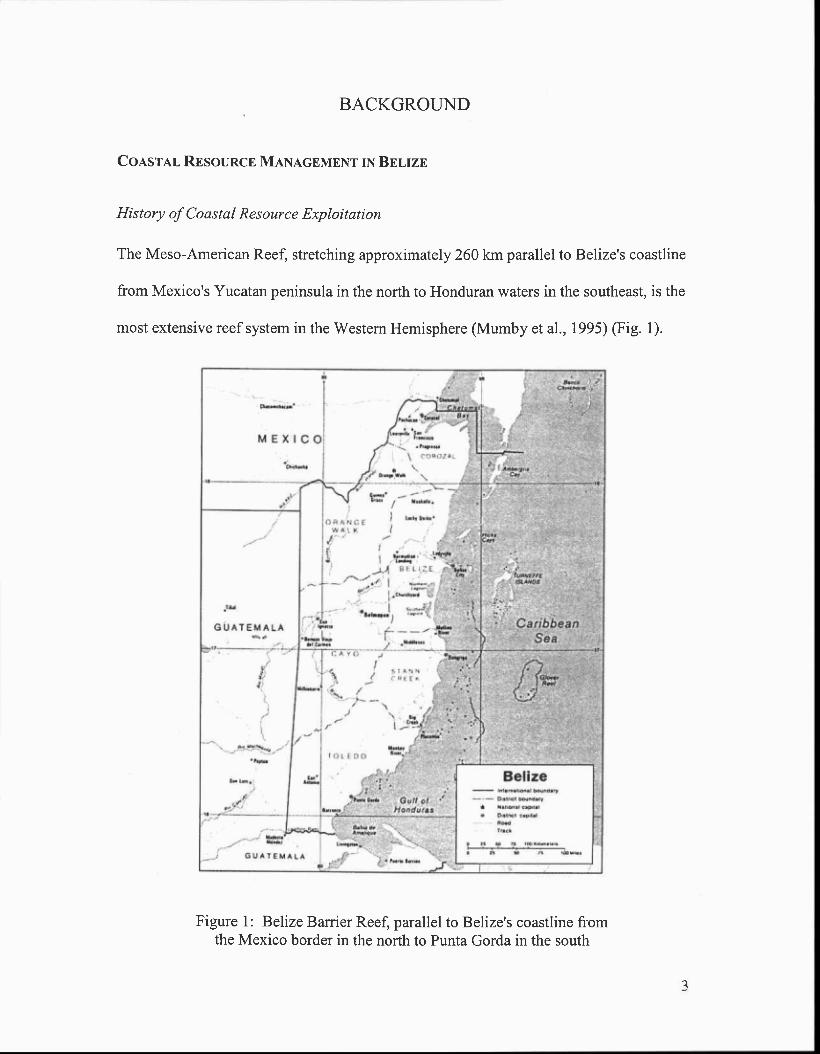
The Meso-American Reef, stretching approximately 260 km parallel to Belize's coastline
from Mexico's Yucatan peninsula in the north to Honduran waters in the southeast, is the
most extensive reef system in the Western Hemisphere (Mumby et al., 1995) (Fig. 1).
Figure 1: Belize Barrier Reef, parallel to Belize's coastline fromthe Mexico border in the north to Punta Gorda in the south

The reef is one of the most diverse in the world (Gibson et al., 1998), and contains
extensive biological resources. Belize's low human population density-11.3 persons per
square kilometer (CIA, 2000)—and the structurally complex reef which precludes the use
of industrial fishing gears ensured that the coastal environment and resources were only
lightly impacted by human activity until recently (Carter et al., 1992; Gibson et al.,
1998). However, in recent years Belize has seen a dramatic rise in development activity
associated with commercial agriculture, tourism, and fisheries exploitation (Mumby et
al., 1995), and environmental degradation and resource depletion have become serious
concerns. To address these issues, the government of Belize has adopted the integrated
coastal zone management (ICZM) model (Gibson et al., 1998).
Integrated Coastal Zone Management
Integrated Coastal Zone Management is an interdisciplinary, multi-sectoral approach to
management planning and implementation in coastal systems. Characteristics of ICZM
include recognition of the distinctive character and importance of the coastal zone;
institutional processes ensuring a participatory approach to decision-making, and a
precautionary approach to environmental management (Cicin-Sain and Knecht, 1998).
Goals of ICZM in natural resource management are the maintenance of ecosystem
services and intra- and intergenerational equity. The "integrated" component is vital:
successful ICZM must account for the linkages within and between natural, social,
economic, and political systems, and provide a means of coordinating input from and
management of each. ICZM can be an effective tool for achieving sustainable
4

development by balancing economic growth and natural resource protection (Huber and
Jameson, 2000).
ICZM in Belize
In 1989 Belize hosted the International Workshop on Management of Coastal Resources
(Windhevoxhel, 1995). It was recognized that an "integrated, holistic approach to the
management of [Belize's] coastal resources was necessary to ensure their use and
protection in the long term" (CZMAI, 2000b). Recommendations developed by
conference participants formed the foundation for the establishment of the Coastal Zone
Management Unit (CZMU) by the Belize government in March of the following year
(Gibson et al., 1998). The original CZMU was a small division of the Department of
Fisheries, in the Ministry of Agriculture, Fisheries, and Co-operatives. In 1993, the
GEF/UNDP provided significant funding (US$3 million) for ICZM in Belize, and the
five-year (1993-1998) Coastal Zone Planning Project was launched. The Project's main
objective was to draft development and planning guidelines for the coastal zone (CZMAI
2001a). Legislation, in the form of the Coastal Zone Management Act, provided for new
institutional arrangements of ICZM in Belize through the establishment of the CZM
Authority with a coordinating and advisory role, and the CZM Institute, responsible for
providing support in research, monitoring, education, and training to relevant government
departments such as the Ministry of Agriculture and Fisheries and the Ministry of Natural
Resources. These two units are now grouped together, forming the Coastal Zone
5

Management Authority and Institute (CZMAI), which continues to provide policy and
planning support to the various Ministries responsible for Belize's coastal resources.
Marine protected areas are often cited as an integral part of ICZM, and are an important
component of Belize's CZM program (Wells, 1995). The first MPA, Half Moon Caye
Natural Monument, was established in 1982, followed by the Hol Chan Marine Reserve
in 1987. Belize now has about 10 MPA's along the length of its coastline. All of these
sites have zoning schemes providing for multiple use and conservation of the resources
within the protected area (Wells, 2001).
THE ROLE OF MARINE PROTECTED AREAS
Marine protected areas have been recognized as one of the most effective tools to restore
depleted reef fishery stocks (PDT, 1990). Other common goals for MPA's include
biodiversity conservation, habitat protection, and tourism promotion. The use of MPA's
for fisheries management has grown in the last ten years, as research has indicated
significant increases in fish stocks in areas closed to harvest (Raikitin and Kramer, 1996;
Wantiez et al., 1997; Edgar and Barrett, 1997; Jennings, 2000). The precautionary nature
and ecosystem-based management approach of MPA's make them appropriate tools for
the conservation of multispecies fisheries resources. They allow proactive, instead of
reactive, management of dynamic (and often poorly understood) resources such as reef
fisheries.
6

"Marine protected area" is a general phrase used to refer to a marine/coastal area afforded
some kind of additional protection from human impact. "Reserve," "biosphere reserve,"
"park," and "sanctuary" are some of the other terms used to refer to an MPA. Although
these terms may be used to denote a specific management regime, there is no
international standard definition; thus "marine sanctuaries" in one country may allow
unregulated fishing while those in another country prohibit all fishing. The most
common use of "marine reserve" refers to an area completely closed to extractive use of
biological resources, i.e., a no-fishing ("no-take") zone. "Marine fishery reserves"
(MFR's) refer to no-take zones that focus on conserving fish biomass with the goal of
enhancing local fisheries through spillover of adult fish from the reserve to neighboring
fished areas, or through protection of spawning stocks and increased production of larvae
to supply new recruits to local fisheries.
Most MPA's established for fisheries enhancement have been created on faith (including
the PHMR): despite the abundance of studies documenting local increases in fish
abundance and size within protected areas, until recently few had correlated that
information with increases in catch rates or the average size of fish caught outside of
reserves (Appeldoorn, 1997; Goodridge et al., 1997). Several examples of fishery effects
provide encouraging initial evidence of fisheries enhancement. In the Philippines, Alcala
and Russ (1990) and Russ (1991) demonstrated significantly higher yields to fishermen in
areas adjacent to the Sumilon Island reserve during 10 years of closure than after the
reserve was reopened to fishing. More recently, Roberts et al. (2001) have added
convincing, albeit limited, evidence that reserves contribute to nearby fisheries. They
7

present results showing enhancement of fisheries near protected areas in Florida and St.
Lucia:
• In Florida, the Merritt Island National Wildlife Refuge at Cape Canaveral was
closed to public access in 1962 for the security of the Kennedy Space Center,
creating a de facto marine fishery reserve. Roberts et al. (2001) examined records
from the International Game Fish Association, and found that world record-sized
catches in three out of four important game fish species were concentrated in the
area adjacent to the Merritt Island area. They suggest that the reserve is exporting
trophy-sized fish to nearby waters.
• The Soufriere Marine Management Area in St. Lucia was created in 1995.
Combined biomass of five commercially important fish families increased rapidly
within the MPA (Roberts, 1995). However, an assessment of the potential for the
export of fish from the reserve to adjacent fishing grounds, conducted about a year
after implementation of protective management, concluded that export potential
was negligible (Corless et al., 1997). The Roberts et al. (2001) study found that
after five years of protection, the reserve had led to improvement in local fisheries,
as judged by landings data and interviews with fishers that indicated that most felt
better off with the reserves than without.
These cases show that MPA's can produce tangible benefits to fisheries in some cases,
but further research is needed in a wider range of conditions. The complex
characteristics of each situation that has been documented so far may preclude the
8

application of conclusions to a different set of environmental, social, and economic
circumstances.
THE PORT HONDURAS MARINE RESERVE
The PHMR is located in the southwest corner of the Gulf of Honduras, a semi-enclosed
embayment of the Caribbean Sea that includes portions of the exclusive economic zones
of Belize, Guatemala, and Honduras (Fig. 2). It falls entirely within Belize's 12 nautical
mile territorial sea, although its southeast boundary is close to waters claimed by
Guatemala (Maritime Areas Act, 1992). The reserve encompasses approximately 415
square kilometers of shallow, coastal waters and small islands (cayes) in the Toledo
District of southern Belize. The boundaries of the reserve extend from the south bank of
the Monkey River in the northeast to the Rio Grande, just north of Punta Gorda Town, in
the southwest; lines extending seaward of these two points directly south and east,
respectively, form two sides of the roughly triangular reserve. The predominantly
mangrove-lined coastline of the central Toledo District forms the third side. Ocean
circulation is restricted due to the shape of the coast and the orientation of the 138 low
mangrove cayes in three roughly shore-parallel lines on shallow carbonate banks
separated by deep channels (Heyman and Kjerfve, 1999).
9
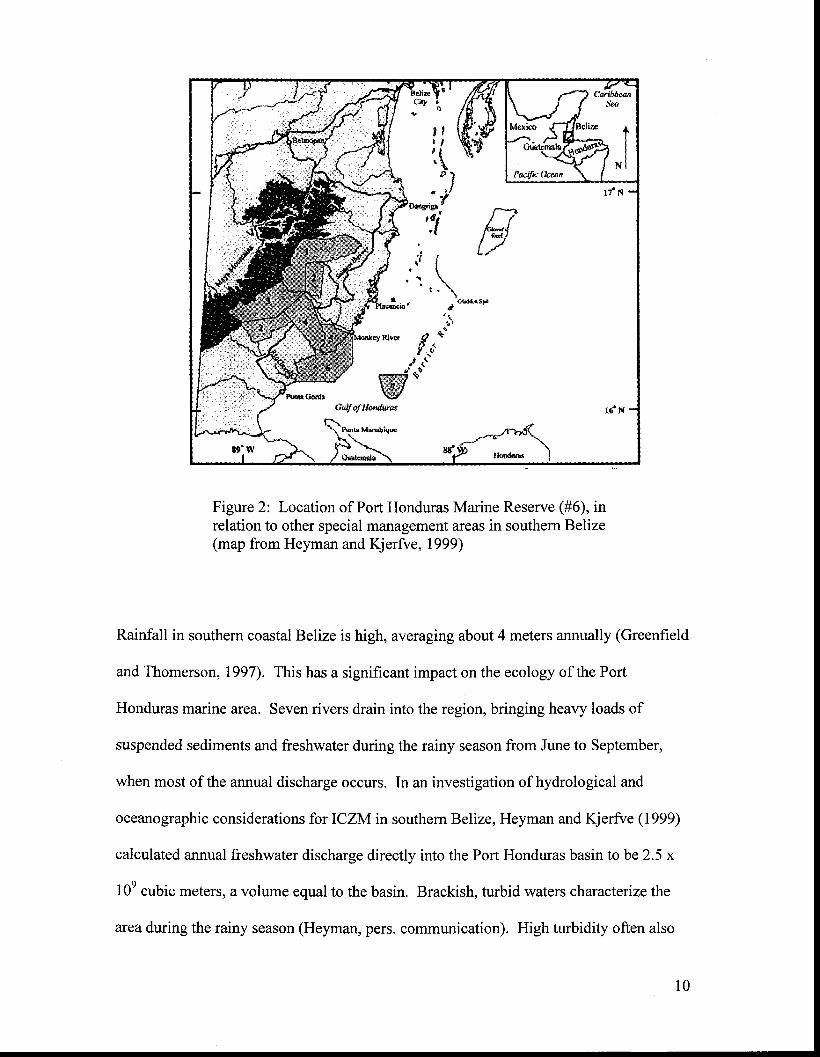
Figure 2: Location of Port Honduras Marine Reserve (#6), inrelation to other special management areas in southern Belize(map from Heyman and Kjerfve, 1999)
Rainfall in southern coastal Belize is high, averaging about 4 meters annually (Greenfield
and Thomerson, 1997). This has a significant impact on the ecology of the Port
Honduras marine area. Seven rivers drain into the region, bringing heavy loads of
suspended sediments and freshwater during the rainy season from June to September,
when most of the annual discharge occurs. In an investigation of hydrological and
oceanographic considerations for ICZM in southern Belize, Heyman and Kjerfve (1999)
calculated annual freshwater discharge directly into the Port Honduras basin to be 2.5 x
109 cubic meters, a volume equal to the basin. Brackish, turbid waters characterize the
area during the rainy season (Heyman, pers. communication). High turbidity often also

characterizes the Port Honduras waters during the dry season, when strong daily onshore
winds raise wind waves large enough to resuspend the fine riverine sediments on the
bottom. These physical attributes largely determine the habitats and organisms found in
the PHMR region.
Habitats
The Port Honduras ecosystem comprises three closely related components: coastal
mangrove forest, or mangal; extensive seagrass beds; and coral reefs (Fig. 3). These
three subsystems are linked by physical and biological processes such as sediment-
trapping, nutrient production, and ontogenetic fish migration. Each subsystem displays
unique characteristics and biota, and is essential for various life history stages of many
organisms.
Mangal
Extensive mangrove forests fringe much of the undisturbed mainland and the
numerous small, low-lying cayes. All four species of mangrove common throughout
the southeast Atlantic and the Caribbean are present here: buttonwood, Conocarpus
erectus; white mangrove, Laguncularia racemosa; black mangrove, Avicennia
germinans; and red mangrove, Rhizophora mangle. Red mangroves, with
characteristic prop roots, are found in the intertidal and shallow subtidal zones. The
numerous sturdy roots provide structurally complex habitat for numerous plants,
11

invertebrates, and juvenile and adult fish (Greenfield and Thomerson, 1997;
Nagelkerken, 2000).
Figure 3: Coastal Habitats of Belize(map from Gubbay, 1995)

Seagrass beds
Seagrass beds predominate in the shallow lagoon waters inshore of the barrier reef,
and there are large expanses of seagrass/algae habitat in the PHMR. The areas closest
to shore are dominated by freshwater- and sediment-tolerant benthic algae (Heyman
and Kjerfve, 1999); farther from the river mouths turtlegrass, Thalassia testudinum,
prevails. Both mangroves and seagrass beds have been shown to contain a high
diversity and abundance of coral reef fishes in the Caribbean (Thayer et al., 1987;
Sedberry and Carter, 1992). Parrish (1989) suggested that one reason for the high
density of juvenile fish in seagrass beds is the lower density of predators due to the
distance from coral reefs.
Patch reefs
The coral reefs found within the PHMR are generally small, isolated patch reefs
interspersed between seagrass beds and hardbottom areas (solid carbonate substrate
with scattered soft corals, or gorgonians, and sponges). The variable salinity and high
turbidity and sedimentation rates characteristic of the PHMR waters probably inhibit
more extensive coral growth, particularly in the areas close to shore. Nevertheless,
reefs are scattered throughout the outer Port Honduras waters, and the PHMR was
designed to incorporate several of the more attractive sites, with the hope of providing
snorkel or dive destinations for tourists (Maheia, pers. communication). The
hermatypic, or reef-building, corals that are the architects of these reefs provide
structurally complex habitat for abundant and diverse life, including hundreds of
13

species of fish (Sale, 1991a). Almost all reef fishes are demersal and are strongly
associated with the shelter provided by the reef structure (Sale, 1991a).
Fisheries resources
Coral reef fish are an important resource for human populations, particularly in the
developing world (Russ, 1991). In Belize, where 33% of the population is below the
poverty line (CIA, 2000), residents of the coastal zone depend heavily on fishing for food
and income. Commercially valuable marine species such as the Caribbean spiny lobster
(Panulirus argus), queen conch (Strombus gigas), and fish in the snapper (Lutjanidae)
and grouper (Serranidae) families are found in the PHMR. Although the primary fishery
in Belize is for lobster and conch, most of that is exported (Auil, 1992). In the rural
Toledo district, most fishermen target lobster for cash income through sale to one of the
Fishermen's Co-operatives during the lobster season, but catch finfish year round for
local sale in the village markets, or for personal consumption (TIDE, 1998b). As such,
the finfish resources of the PHMR are important to the livelihood of many small-scale
artisanal fishers and their families throughout the region. Estimates of the combined
handline and gill net catch of three of the most important finfish in the PHMR area (Lane
snappers, Lutjanus synagris; mackerel, Scomberomerus maculatus and S. regalis; and
jacks, Carangidae) exceed 245,000 pounds annually (TIDE, 1998a).
Fishers in Belize still have the "luxury" of catching fish high on the food chain--the
predatory snappers and groupers. These are the highest-valued fish throughout many
14

tropical and subtropical parts of the world, and in areas like Jamaica they have been
essentially removed from the ecosystem by extremely intense fishing pressure (Koslow,
1994). Most Belizean fishermen consider small and herbivorous fish such as wrasses and
surgeonfish to be "trash" fish not worth keeping (if they are caught in the first place),
while species like these form the majority of the small catches in Jamaica (Munro, 2000).
The continued presence of the larger piscivores on the reefs of southern Belize may
indicate relatively intact, healthy ecosystems that have not yet been overexploited.
Belize's fish stocks cannot remain safe from pressures such as population growth and
technology improvements, however. The current population of Belize, estimated to be
256,062 in July, 2001, is expected to double by the year 2050 (CIA, 2001). Much larger
coastal populations in neighboring Guatemala and Honduras are experiencing similar
growth rates (CIA, 2001) and also exploit the marine resources in the Gulf of Honduras
(TIDE, 1998a, 1998b). The rapid spread of technologies such as outboard motors and
global positioning systems (GPS) is enabling fishers to expand their fishing grounds and
to target their catch more efficiently.
Although fishers continue to land snappers and groupers in the PHMR, the decline in
abundance and size of the fish caught is of concern to local resource managers,
conservationists, and fishermen alike. Russ (1991) described three types of overfishing:
growth, recruitment, and ecosystem. Growth overfishing occurs when a substantial
reduction in the proportion of large size classes, caused by selective removal of larger
individuals from the population by fishing, alters the overall size structure of the

population so that the mean size of landed fish is smaller. Recruitment overfishing, in
which the standing stock biomass has been reduced enough to impair the production of
larvae and subsequent recruitment, is more difficult to prove. Recruitment is subject to
the complex interactions of so many variables such as ocean currents, predation,
competition, food supply, etc. that it may be impossible to attribute a decline in local
recruitment to a decline in local adult biomass (Doherty, 1991). Ecosystem overfishing
occurs when fishing pressure results in changes in the relative abundance of species or
the species composition of the reef community. All three conditions are cause for
concern and action by management; it is not necessary to know which applies in order to
take precautionary measures to address the problem.
Anecdotal reports of reduced fish catches led TIDE to conduct surveys of fishers and
non-fishing members of local communities in 1997, to investigate their perception of the
status of the resources and the reason for any decline in local fisheries, as well as to
gauge community support for a marine protected area (TIDE, 1998b). Residents of the
Port Honduras area agreed that there has been a reduction in fish numbers and sizes for
over a decade, and suggested that much of the apparent stock depletion is due to
overfishing and the use of destructive, non-selective gear types, especially gill nets
(TIDE, 1998a). Foreign nationals fishing illegally in the area were blamed for the
majority of the impact (TIDE, 1998a). Anecdotal reports of boats from neighboring
Guatemala and Honduras fishing in the southern waters of Belize's exclusive economic
zone (EEZ) are common (Maheia, pers. communication).
16

Reserve establishment and management
The surveys conducted by TIDE indicated that local fishermen supported the creation of
a marine reserve and further restrictions on the use of gillnets to protect their resources
(TIDE, 1998b). TIDE proposed the reserve to the Belize government, and prepared a
draft management plan (TIDE, 1998a). After several years of consistent lobbying, the
Department of Fisheries officially declared the PHMR in January, 2000 (Belize Fisheries
Department, 2000). The Department of Fisheries is responsible for managing all marine
reserves established for fishery purposes in Belize, but due to a lack of adequate
resources in southern Belize, has delegated co-management authority for the PHMR to
TIDE. As the PHMR managing entity, TIDE's duties include enforcement of the
reserve's regulations, monitoring of its resources, and ensuring that the goals and
objectives laid out in the management plan are met. Currently, TIDE employs three
rangers for patrol/enforcement duties, one scientific officer to conduct research within the
reserve as well as in other areas in which TIDE is involved (for example, in chemical-free
citrus farming operations), and several other office and field staff members who assist
with research, education, public relations, and other duties. The Nature Conservancy,
which maintains an office in Punta Gorda with a focus on marine conservation issues,
provides scientific advice and significant financial support to TIDE.
17

Goals
The PHMR is intended to:
1) protect the physical and biological resources of Port Honduras,
2) provide education and outreach opportunities, and
3) preserve the value of the area for fisheries and other important genetic
resources (TIDE, 1998a).
Sustaining and enhancing local fisheries is a critical objective of the reserve, since the
continued support of local residents—who are primarily fishing families—is essential.
Although "ecotourism" in the form of guided fly-fishing and kayak trips is being heavily
promoted as a source of income and economic development, the extremely low rates of
tourism in the region (due to the distance of Toledo from Belize's only international
airport and the poor visual quality of the patch reefs in the PHMR compared with the
distant barrier reef and atolls) mean that subsistence fishing will continue to be the
primary economic contribution of the PHMR.
Multiple-use zoning is one of the tools used by the PHMR management team to achieve
its goals (Fig. 5). Simple, effective zoning schemes have been found to be central to the
success of MPA management (Laffoley, 1995). Three types of zones have been
designated in the PHMR:
• Preservation: no entry without permission from TIDE or the Department of
Fisheries; scientific research for reserve management purposes only,
18

■ Conservation: controlled extractive use: no commercial fishing, recreational catch
and release fishing and fishing for personal consumption with proper permits only;
scuba diving, snorkeling, and kayaking encouraged, and
• General Use: all activities except the use of gillnets allowed with proper permits.
The zonation scheme is expected to protect particularly sensitive habitats in the reserve
while allowing local fishers to earn a living as they are accustomed to.
Figure 4: Port Honduras Marine Reserve Zoning Plan

Need for monitoring
"Research is not a luxury, but is at the heart of any programme, whether
for preservation or development, as it is essential to the development of
a workable zonation scheme and to management and planning efforts."
Ray (1976)
In the PHMR, as in any MPA, the primary question is, What are the effects of protection
on the resources in the reserve? Monitoring represents a "barometer" that permits the
measurement of change (Courrau, 1999). Changes and trends in key parameters
describing the populations of interest need to be identified and quantified in order to
evaluate the success of the existing management strategies.
Successful resource management must be able to adapt quickly to these changes to
address obstacles to reserve goals. Small-scale fisheries such as those operating in the
Port Honduras area depend heavily on local stocks of sedentary reef fish, and fishers
often do not have the resources or ability to travel to more distant fishing grounds. This
underscores the vital role that support of local fisheries through the best management of
the PHMR plays in maintaining the livelihoods of many Toledo residents. Sound
information on the status and trends of fish stocks in and near the PHMR generated by a
long term monitoring program is essential to making judgments on the efficacy of
management and to guide any changes deemed necessary. In recognition of this need, the
20
PHMR management plan explicitly requires a program of scientific monitoring of the
reserve's natural resources in order to document changes (TIDE, 1998a).
An additional argument for monitoring lies in the need to engender local support for a
marine reserve. Reporting on the successes (and failures) of management is important:
early results can improve confidence in the reserve by advertising its benefits (Nickerson-
Tietze, 2000). In the Port Honduras area, where support for the PHMR and TIDE is not
universal, it will be essential to show early on that the reserve has the potential to yield
tangible benefits to the local community. Continuing support will depend on the
realization of that potential.
OBJECTIVES
MONITORING PROGRAM OBJECTIVES:
Monitoring of the PHMR fish stocks will provide information on the diversity, numbers,
and sizes of fish; and most importantly, on relative changes in these parameters over
time. TIDE will focus on fish first, because fish stocks are the most valuable resource in
the region in the absence of tourism. If resources are available in the future, monitoring
activities may be expanded to include other ecosystem components and functions.
21

In order for a monitoring program to be effective, the information gathered must be
reliable. Appropriate techniques must be selected and a monitoring program carefully
designed to address specific, management-driven questions. Methods must be
standardized and repeatable, participants must be trained and able to perform to a
consistent standard, and interpretation of the data collected must be logical and unbiased.
Results of the long-term PHMR fish monitoring program will be used by reserve
managers to evaluate the effects of the current zoning scheme and levels of protection,
and to make changes as needed to best achieve the goal of protecting and sustaining local
fisheries.
Specific questions addressed by the long-term collection of data on fish species diversity,
abundance, and size-frequency distributions within and adjacent to the PHMR are:
1. What is the current status of finfish resources in the PHMR?
2. How do the measured variables of species diversity, abundance, and size-
frequency distribution compare across reserve zones and nearby fished (control) areas
in similar habitats?
3. How do these variables change over time in each zone and control area? Are
trends evident?
4. How do the changes in these variables compare across reserve zones and fished
areas?
22

Answers to these questions will permit the establishment of baseline information on the
fish resources, examination of spatial and seasonal variability in the parameters studied,
and will hopefully provide an indication of the effects of various levels of protection
(zones) on the fish stocks in the study areas. After sufficient time (at least several years,
or seasonal cycles), initial trends in fish population parameters should begin to be
evident. This information will be presented to the managing board of TIDE, the Belize
Fisheries Department, and TNC. Continued sampling over a longer period of years will
produce more robust data.
INTERNSHIP OBJECTIVES:
The specific objectives of my internship with TIDE were:
1. To design a fish monitoring program suitable for use in the PHMR by TIDE staff
and volunteers;
2. To train current TIDE staff and volunteers in all areas of the monitoring
methodology, including fish identification, fish size estimation, underwater distance
estimation, and data collection and recording;
3. To develop training methods and materials for use in teaching the monitoring
program to TIDE staff;
4. To train TIDE's scientific staff in data management, analysis, and presentation of
results; and
23

5. To develop TIDE's capacity to train others to assist with monitoring activities in
the future.
METHODS
"[Monitoring is the repeated observation of a phenomenon over time" (Kelleher, 1999).
This brief statement captures the essence of a monitoring program: the methods used
must be repeatable, and must be continued over a long time span. Details of a monitoring
program will vary with environmental characteristics, the specific management-driven
questions addressed, and the resources available. A variety of monitoring techniques for
use in reef fish stock assessments have been developed. Each has strengths and
weaknesses, and careful evaluation of these in relation to the characteristics of the species
and habitat to be surveyed, the resources and abilities of the observers, and the questions
being asked should be taken into consideration when selecting a particular method for
use. A few studies have attempted rigorous comparisons of several methods (Bortone et
al., 1989; Thresher and Gunn, 1989; Samoilys and Carlos, 2000; Harvey et al, 2001b);
however, there is no consensus among researchers on a "best" method to use (Sale,
1991b).
Criteria for a technique to use in the PHMR were developed in consultation with Dr. Wil
Heyman of TNC; Mr. Lindsay Garbutt, TIDE Operations Director; and the TIDE park
24
rangers who are all very knowledgeable about the PHMR environment and the local
community. It was determined that the method must be:
• Objective and repeatable;
• Inexpensive, requiring minimal capital investment;
• Suitable for use in the various habitat types and environmental conditions found
within the PHMR;
• Non-destructive of habitat or living resources; and
• Simple and efficient, since TIDE staff will have other demands on their time and
resources.
REVIEW OF FISH CENSUS METHODS
Fishery-dependent methods, or the collection of catch and effort data from working
fishermen in the region of interest, are one means of assessing resource status. This type
of method can provide information directly relevant to the fishery since the "sampling"
procedures are the fishers' own efforts; thus there is no need to translate a relative
assessment of fish stock status into actual landings. In addition, information on effort is
invaluable in the analysis of abundance and density data. This method was rejected for
our study due to low expectations that local fishers would provide accurate data on their
landings to a visiting researcher. However, fishery-dependent surveys can provide useful
information, and should be conducted in addition to fishery-independent sampling in
order to give the most complete picture of the resource. Use of local, long-term residents
25

who have the confidence and trust of the fishers should make fishery-dependent surveys
possible for the Port Honduras area.
Fishery-independent fish census methods fall into two general categories: destructive
methods, using chemical ichthyocides, gear (traps/nets/handlines etc.), or explosives; and
non-destructive methods. Methods involving habitat damage or requiring the taking of
fish were rejected as contrary to the reserve's goals and objectionable to local fishers.
Any activities that could have been construed as fishing or otherwise taking fish away
from resident fishers would have been politically unacceptable. In addition, destructive
methods are undesirable when it is necessary to re-survey the same location in the future.
Non-destructive methods primarily involve some type of visual survey. This can be
accomplished with remotely operated vehicles (ROV's), or divers. ROV's are
unnecessary in the shallow waters of coral reefs, which are well within safe scuba diving
depth limits. They are prohibitively expensive, and were not considered for this project.
Scuba divers can use video systems to make a permanent visual record of fish, which has
the advantage of allowing verification of species identification at a later time and, if a
stereo-video system is used, a more precise size estimation can be made (Harvey et al.,
2001 a). However, video systems, which include at least one and often more cameras,
underwater housings, and computer hardware and software for image analysis, require a
significant capital investment and were also not considered for use by TIDE.
26

Visual surveys in which a scuba diver observes and records written information during
the survey are the most practical method of monitoring the populations of coral reef
fishes in shallow waters (Samoilys and Carlos, 2000). They are the least expensive, most
efficient in terms of amount of data collected per unit of time, and are commonly used in
coral reef areas throughout the world for monitoring purposes similar to the PHMR's
(Bell, 1985; McCormick and Choat, 1987; Alcala, 1988; Francour, 1994; Russ and
Alcala, 1996). There are three main types of visual census; all can be used to collect data
on species presence/absence, some measure of relative abundance and density, and sizes
of fish observed:
1. The Roving Diver Technique (RDT) (Schmitt and Sullivan, 1996)
This method involves a diver moving at will throughout an area, at his/her own pace,
and searching carefully for all fish visible without physically disturbing habitat. The
area searched is not defined. Duration of the search is recorded. Data on species,
number of individuals, and sizes of observed fish may be recorded. The RDT is
designed to provide useful data on species presence/absence and frequency of
occurrence while being entertaining and challenging for volunteer divers. It is
intended to supplement, not replace, more rigorous visual survey methods (Schmitt
and Sullivan, 1996), and thus was not chosen to be the primary survey method for the
PHMR monitoring program.
27

2. Strip or Belt Transects
Transects are the workhorse of ecological investigations in many disciplines. They
have frequently been used in reef fish surveys (Brock, 1954; Sale and Sharp, 1983;
Sanderson and Solonsky, 1986). Generally, fish are identified, counted, and sized as
the diver swims along a fixed transect line. Length of the transect and width and
height of the survey area vary, but dimensions of 20-50 meters for the length and 2-5
meters for the width/height are usual. The amount of time the diver spends
swimming the transect may or may not be fixed. Density estimates are possible
because the area searched is known.
3. Point Counts
Point counts involve a stationary diver observing fish in a fixed area for a set period
of time. Although both transects and point counts fit the general criteria for a PHMR
fish monitoring program, the point count method was judged to be the most
appropriate because it requires the least amount of equipment and time. The most
widely used point count method is the Underwater Stationary Visual Census (SVC)
Technique of Bohnsack and Bannerot (1986). This method has been used to monitor
reef fish species presence, abundance, and size in the Florida Keys, USA, for over
twenty years (Ault et al., 1996). The SVC technique allows evaluation of habitat
importance to individual species, and changes in reef fish communities due to
protection (Bohnsack et al., 2000). It is a reliable, non-destructive sampling method
that provides information critical to stock assessments, such as quantitative data on
28

the presence/absence, abundance, and average length of multispecies fish stocks (Ault
et al., 1996).
BOHNSACK-BANNEROT STATIONARY VISUAL CENSUS (SVC) TECHNIQUE
Following accepted standards of safe scuba diving, TIDE staff will dive in buddy pairs
for all surveys. The Bohnsack-Bannerot SVC Technique, with additional logistical
details for two divers described, is as follows:
1. Information on site location, persons participating, weather, sea conditions, tide, etc.
is recorded on the data sheets on the boat prior to beginning the surveys.
2. Divers enter the water in buddy pairs and move away from the boat on the surface, so
as to distance themselves from disturbance caused by anchoring the boat while
causing as little disturbance themselves.
3. Divers descend in buddy pairs, taking care not to kick up sediment from the bottom
and reduce local visibility.
4. One diver is designated the primary observer and remains stationary on or near the
bottom at the center of the survey area.
5. The second diver remains stationary near the observer and is present for safety
purposes as well as assistance with fish identification if necessary (communication
between divers is via underwater slates or paper).
6. The survey area is a cylinder extending from the bottom to the surface, or as far up in
the water column as visibility permits, with a radius of 7.5 meters from the primary
29

observer. The 7.5 meter distance should be estimated after above- and underwater
practice (unnecessary activity in the survey area, such as divers running out a line to
measure the radius of the survey area, may cause some of the fish to leave the area).
7. Diver 1 notes the time on the prepared underwater data sheet (plasticized paper
attached to a clipboard), and begins the survey. For exactly five minutes, Diver 1 lists
all fish species observed within the survey area. The diver will rotate slowly through
360° on one direction, completing 3-5 rotations in the five minute period. No
abundance or size data is recorded during this period except for large moving schools.
Estimates of numbers and sizes should be recorded for these schools to avoid
counting them more than once.
8. After the five minute species listing period, Diver 1 records abundance and size data
for only those species listed. If new species are encountered after the initial five
minutes, they should be ignored. Working through the list in order (this avoids a
tendency to count species when they are particularly abundant or active, which would
give a biased result), abundance and size data are collected by again slowly rotating
and scanning the survey area for each species. If individuals of that species are
visible during the scan, Diver 1 records the number of fish (estimating if necessary, to
a single number rather than a range; e.g., 25 instead of 20-30) and the estimated
minimum, maximum, and mean total lengths' in centimeters.
9. If, during the scan, no individuals of a listed species are encountered, Diver 1 records
the abundance and size data from memory for those fish seen during the initial listing
period. (Experience with TIDE staff indicated that it may be helpful to make written
1 Following the conventions used in published length-weight relationships for the species of interest(Bohnsack and Harper, 1988), fork length was used for fish with forked caudal fins, and total length wasused for species with rounded or truncated tails.
30
notes of numbers and sizes of some species during the listing period in case they are
not seen again and the observer's memory is not sufficient, although this is not
suggested in the original description of the technique (Bohnsack and Bannerot,
1986)).
10. After size and abundance data have been recorded for each listed species, Diver 1
notes the end time of the survey on the data sheet.
11. If the buddy team is to complete additional surveys in the area, they should now
proceed underwater to a new location in the same habitat type that does not overlap
previous surveys. Divers may switch roles between surveys if both are equally
competent in fish identification and size estimation.
12. Immediately upon completion of all surveys at a site and return to the boat, the survey
leader (TIDE science officer or PHMR head ranger) should collect all data sheets and
ensure that they have been completely filled out. Data should be reviewed briefly
while the observers who collected and recorded the data are present, in order to
ensure legibility and confirm data outside of expected ranges. This step can prevent
confusion or transcription errors later on.
MONITORING SITES
Permanent sites are generally recommended for long-term monitoring because they offer
the greatest amount of consistency and reliability. Sites that are randomly selected each
time are considered inherently less biased; however, sampling at different sites each time
may not be sensitive enough to measure change because of the patchiness of fish and
31

habitat distribution. In addition, the use of temporary sites requires more samples to give
the same level of statistical confidence as provided by repeat sampling at permanent sites
(Rogers, 1995). Repeated sampling at permanent sites over an extended period of time
provides the most valuable data (Rogers, 1995).
Monitoring in the PHMR will initially occur at 12 primary sites selected in consultation
with TIDE's PHMR rangers, scientific officer, and TNC's Dr. Will Heyman. Potential
sites representative of all habitat types and all reserve zones found in the PHMR were
identified on the basis of the participants' knowledge of the region. These potential
survey sites were evaluated by snorkeling or diving most of the locations, and final sites
were selected by eliminating those locations where access was difficult or restricted
during at least part of the year, or where few fish or little suitable habitat were observed.
Four of the final sites are control sites, outside of the PHMR but in similar environments.
Monitoring sites will be marked with a GPS to facilitate return during each survey period.
Surveys will be conducted within the general vicinity of each marked "primary site" by
using a GPS to reach the exact site coordinates, then moving away a random distance
between 0-100 meters in a randomly selected direction while still remaining in the same
habitat type and depth zone. This will eliminate counting the same individual fish each
time (many of the species are sedentary and site-attached) and increase the
representativeness of the sample.
Four surveys will be conducted at each primary site. Divers will work in teams of two,
with each pair completing enough surveys at each site to total four at the site. One to
32

four teams may participate in each survey. TIDE's boats were too small to comfortably
hold four teams (eight divers with gear) and a boat captain, however, so the optimal
number of teams during training was two. The sites are all less than 60' deep; most are
less than 30'. Each survey will take 5-15 minutes. This allows adequate time for one
buddy team to complete all four surveys in one no-decompression dive at the planned
depths and with a normal air consumption rate. If only one pair of divers is doing the
surveys, the captain should position the boat as described in the preceding paragraph, the
divers descend to the bottom away from the boat, and begin the first survey immediately
if conditions permit (bottom sediments have not been stirred up, reducing visibility, the
depth is not greater than anticipated, no other unsatisfactory conditions encountered).
Subsequent surveys should be conducted by moving out of the initial survey area in a
randomly chosen direction to a position where the new survey area will not overlap any
of the day's previous surveys. If more than one buddy pair is participating, all divers
should enter the water together and teams should spread out while descending so as to not
overlap survey areas. If two teams are diving, each should move to a location for their
second survey as described above, again taking care that none of the day's surveys
overlap in area.
SURVEY FREQUENCY
Monitoring will be conducted quarterly. Surveys will be scheduled to take place during
the heights of the rainy and dry seasons, to examine seasonal variability. It is expected
that a full set of surveys at the twelve primary sites will take four to six days. As time
33

and resources permit, additional sites can be incorporated into the monitoring program.
If TIDE is unable to accomplish full monitoring of all sites quarterly, the frequency may
be reduced to biannually and one each of the reserve and control primary sites may be
removed. TIDE should bear in mind that it is more useful to have thorough, sound data
of a regular frequency from fewer sites than patchy, irregular data from more sites or
times. Urquhart (1997) discusses the statistical power of environmental monitoring
programs, and argues that adding more sites or performing additional surveys at existing
sites makes little improvement to results. Statistical power to detect trends increases as
the number of years of monitoring increases (Urquhart, 1997); thus consistent monitoring
over long-term time spans if crucial for the generation of useful results.
TRAINING METHODS
Training was the most extensive component of the monitoring program development.
Observers' abilities to accurately identify fish to species and to estimate fish sizes and the
survey area are fundamental to a quantitative sampling program (Schmitt et al., 1994;
Mumby et al., 1995; Thompson and Mapstone, 1997). Therefore, although the training
phase of program development exceeded the time planned for it, it was judged more
important to continue the training and ensure that all participants had a good
understanding of the theory and practice of the monitoring program than to begin field
data collection before everyone was capable of doing so competently.
34

Training of TIDE staff and volunteers involved the following stages:
SCUBA certification
One of the rangers and the science officer were already certified SCUBA divers; the
others, along with several volunteers recruited by Dr. Will Heyman, received basic open
water training from a local PADI instructor during the first several weeks of the training.
Classroom training
A two-day workshop on the monitoring methods and fish identification and size
estimation was developed and held at TIDE's headquarters. This constituted the most
intensive above-water training. Work with individual team members on various
components of the training material had begun before and was continued after the formal
group workshop. Instruction during the workshop emphasized group work and focused
on the following information and skills:
â The Bohnsack-Bannerot SVC Technique was explained and discussed with the
group to ensure that everyone understood the purpose of each step. Workshop
participants practiced estimating 7.5 meter distances on land using marked lines.
Dry runs through surveys in a classroom setting allowed everyone to get the feel
for the timing and the data recording needs, and to ask questions.
â Fish identification skills were taught and practiced with the aid of a PowerPoint
presentation created for this purpose. Detailed photographs or color drawings
of each species, with key features useful in identification highlighted, were
used. Group discussion enabled participants to share experiences and insights
35

relevant to fish identification. This was especially useful in learning to
distinguish between very similar species such as the Red Hind (Epinephelus
guttatus) and Rock Hind (E. adscencionis). Waterproof flash cards showing a
picture of each species on the front and scientific, common English, and Creole
or other local names (if available) on the back were created for use in the
classroom and field. Further identification practice using the cards and fish ID
books (Humann, 1999) was encouraged.
â Fish size estimation skills were practiced using paperboard cutouts of fish
shapes in the classroom. Following a protocol developed by the Australian
Institute of Marine Science (English et al., 1994), fifty cutouts ranging from 10
to 100 cm total length distributed normally around a mean of 50 cm were made
and students practiced estimating the lengths at varying distances from the
models until they achieved a minimum accuracy level of 75% within 3 cm of
the actual model lengths2.
In-water training
Ten dives were made throughout the course of the program development to familiarize
participants with new skills like underwater data recording, and to practice skills
learned in the workshop.
2 •Different shapes representing the silhouettes of fish common in the study area (i.e., snapper, grouper,wrasse, etc.) were used. We found that in repeated practice sessions, students quickly learned to identifyindividual cutouts and recall their lengths based on association, rather than having to continually estimatelength. We replaced this set of cutouts with a set in which the same fish body-type shape was used for allsizes. A better solution would be to create multiple sets of cutouts, each with various lengths of a particularshape in the size range in which that type of fish can be reasonably expected to occur.
36

â Participants ran through the SVC technique underwater. Marked lines (7.5 m)
were used for practicing estimation of the survey area radius.
â Data sheets were used to give students experience with underwater data
collection and recording.
â Fish identification was practiced by the instructor pointing to a fish and
indicating a number with hand signals; the students wrote the number and the
fish species on their clipboards and checked their identifications with the
instructor for immediate feedback and reinforcement/correction.
â Fish size estimation was practiced by using wooden fish models similar to the
paperboard ones described above. The models were made for this purpose
immediately prior to the workshop. Small stainless steel eye screws allowed the
models to be strung on lines and laid out on the bottom (taking care not to
damage coral, etc.) with the sides labeled with the lengths down. Students
swam along the line and recorded estimated total lengths on their clipboards,
then swam back along the line and checked their estimates against the lengths
on the backs of the models. This was a good method for calibrating diver
estimates of fish length, and the immediate feedback makes divers aware of any
consistent tendency to over- or underestimate lengths (bias) so that they can
learn to correct it (English et al., 1994; Bell et al., 1995; Harvey et al., 2001b).
However, the wooden fish models were found to be heavy and cumbersome. To
increase the likelihood that TIDE staff will continue to practice underwater size
estimation skills, a set of lightweight "sticks" in sizes corresponding to the total
lengths of the models was made from 3/4" PVC pipe (after English et al., 1994).
37
The sticks can be strung on a line like the wooden models, or can be carried in a
mesh bag, from which they can be pulled out individually, held up to a group of
divers for size estimation, and placed into a second empty bag. This also
reduces the time needed for the exercise by eliminating the need to deploy and
recover the wooden fish models, which easily became entangled in their line.
Size estimation was also practiced on real fish in groups or buddy pairs by
pointing to a fish and comparing estimates, although there was no way to check
estimations against the real lengths. This type of calibration improves the
precision of divers' size estimates.
Data management
A Microsoft Excel spreadsheet was designed to accommodate the monitoring data. Mr.
Karl Castillo, TIDE's outgoing science officer, and Ms. Lynette Gomez, Mr. Castillo's
replacement, were trained in data entry, simple analysis of the results, and the generation
of graphs designed to answer the questions posed (i.e., "What are the relative changes
over time in the fish population characteristics in the various reserve zones, and how do
they compare to other zones and outside the reserve?"). It is strongly recommended that
a technical advisor with sound knowledge of statistical analysis and Microsoft Excel be
available to assist TIDE staff with management and interpretation of results.
38

RESULTS AND DISCUSSION
INITIAL RESULTS
The limited duration of the internship and the inability of several key members of TIDE's
staff to participate due to other demands on their time prevented the collection of data
during the internship period. However, TIDE now has the training and tools needed to
carry on a long-term fish monitoring program within the PHMR. Data generated through
regular monitoring efforts over time can indicate trends in the species diversity,
abundance, and length frequency characteristics of fish populations in the reserve
compared to those outside the reserve, and possibly differences between zones within the
reserve. If desired, published length-weight relationships of selected species (Bohnsack
and Harper, 1988) can be used to convert PHMR data on numbers and lengths into
biomass estimates. Reserve effectiveness will be evaluated in terms of trends in these
parameters, and careful analysis of the results should be useful in shaping future
management strategy for the PHMR.
EXPECTED RESULTS
In order to evaluate the changes in fish community and population characteristics in the
PHMR over time, it is necessary to understand (1) the ecological effects of fishing, and
(2) the extent of the actual reduction or cessation of fishing pressure in the PHMR. The
effects of fishing have been relatively well documented and discussed in the literature
39

(Russ, 1991). These effects include: direct impacts to populations (reductions in
density and biomass, alterations of size and age structure, changes in sex ratios, and
changes in behavior); direct impacts to communities (reductions in species richness,
changes in relative abundance and community species composition); and indirect effects
to both (habitat modification). A reversal of some of these effects may be expected if
fishing is halted or substantially reduced, although it is important to note that the intensity
of prior fishing and the resulting state of the fish stocks and habitat will significantly
affect the potential for, and time frame of, recovery.
A number of studies have documented changes in fish stocks in marine reserves after
fishing was halted (Alcala and Russ, 1988; Sedberry et al., 1992; Buxton, 1993; Polunin
and Roberts, 1993; Russ and Alcala, 1996, Edgar and Barrett, 1997; Wantiez et al., 1997;
Bohnsack, 2000; Jennings, 2000; Cote et al., 2001; McClanahan and Mangi, 2001).
Their findings generally support the expected reversal of the ecological effects of fishing
discussed above. For example, Cote et al. (2001) observed a 25% increase in overall fish
abundance, and an 11% increase in species richness inside marine reserves compared to
adjacent, non-reserve areas. Buxton (1993) found that sex ratios of two protogynous
hermaphroditic sparid species were skewed toward the females outside reserves in South
Africa, and attributed the greater number of males inside reserves to release from size-
selective exploitation. However, these studies have focused on no-take zones closed to
all extractive activity. Since some level of fishing is permitted in most zones of the
PHMR, it will be difficult to quantify the reduction in fishing effort in the PHMR, and
40

great care must be taken when extrapolating from the results of studies of other marine
protected areas.
Nevertheless, the PHMR's managers must have some benchmarks against which to judge
the success of their regulations in achieving the stated goals of "protecting the biological
and physical resources of Port Honduras and...preserving the value of the area for
fisheries and other important genetic resources" (TIDE, 1998a). First, it is essential to
define "success" in terms of the goals as stated above. Biological resources, including
but not limited to fish, lobster, conch, coral, algae, mangroves, and other integral parts of
the biotic community of the PHMR region, must be protected from overharvesting,
physical damage, pollution, and other sources of degradation. Physical resources, e.g.
habitat structure, must be maintained in a condition capable of supporting healthy animal
and plant communities.
The "value of the area for fisheries and other important genetic resources" encompasses a
broader set of conditions, economic and social as well as ecological. The region's
fisheries are sources of income for a significant number of local residents. Fishing is a
traditional practice in the Port Honduras region, and is considered an integral part of local
culture. The resulting need to maintain active fisheries in the Port Honduras area is the
justification for allowing artisanal fishing by local residents in most of the reserve. If the
PHMR's goals were solely to protect fish stocks, the simple answer would be to close the
area to all extractive and destructive use. However, balancing resource protection and
extraction requires a more complex solution. "Success" in this context means that fish
41

stocks must be given enough protection to ensure long-term surplus production that can
be sustainably harvested, and fishers must be given enough opportunity to fish to allow
the practice to continue as a viable part of the local economy and culture.
If the PHMR is "successful" as defined above, we would expect to see the following
results from the fish monitoring program:
Ecological
The following parameters should increase, or at least remain stable, inside thereserve relative to similar, nearby areas outside the reserve:
• Total fish abundance, biomass, density, and species richness• Relative abundance and biomass of exploited species (e.g., groupers and
snappers)• Average size of exploited species• Habitat quality*, due to prohibition of gill-nets which can damage habitat
structure• Fecundity of exploited species• Size at sex reversal * for sex-changing species, due to reduced removal of
the larger sex and resulting decrease in population-based stimuli initiatingsex change. For example, female Nassau groupers may reach a larger sizebefore changing to male
The following should decrease, or at least remain stable, inside the reserverelative to similar, nearby areas outside the reserve:
• Relative abundance and density of prey species, due to increasedabundance and density of exploited species, which tend to be piscivores.
• Growth rates *, due to increased density• Size-at-age *, due to declining growth rates
• These variables (age, sex, growth rate, fecundity, and habitat quality) are notmeasured in the PHMR monitoring program. Habitat quality could beassessed in the current program; however, the other variables cannot bemeasured by a visual monitoring method.
42

Other changes:
• Species composition of fish communities in the reserve may change, dueto increased presence of predators in the reserve and selective removal ofearly post-settlement juveniles of some species (Hixon and Can, 1995).
• Sex ratios may return to a more normal value, as selective removal of thelarger sex is reduced (Buxton, 1993).
• Highly mobile species such as mackerels and jacks are expected to receiveno significant benefits from the PHMR.
Socio-economic
• The local artisanal fishery should continue to support Port Hondurasresidents who have traditionally fished the area, and allow youngergenerations to enter the fishery to balance attrition (i.e., the fishery shouldpersist on a sustainable level over the long-term). "Support" here meansto provide food for fishers' families, and cash income from the sale of fishin local and regional markets.
• Fishing should continue to be a valued, dynamic part of local culture, notjust local history.
• Local communities should "buy into" the PHMR, supporting its goals andobjectives and abiding by its regulations.
ASSESSMENT OF THE MONITORING PROGRAM
The Bohnsack-Bannerot SVC technique has been used for over 20 years to assess reef
fish communities (Ault et al., 1996). However, some researchers do not consider data
collected from visual census methods, especially in length estimation, accurate and
precise enough to be valuable to managers (Sale, 1991b). Harvey et al., (2000b) found
that out of 43 studies in which visual length estimates were made, only three authors
stated the accuracy of their estimates (Sweatman, 1985; Polunin and Roberts, 1993;
Green, 1996). Findings from their own investigation of visual length estimation
techniques led them to conclude that it is "likely that many studies lack the statistical
43
power to detect small, but biologically important, changes in fish length within reef fish
communities." This raises the question of the value of work being done as part of the
PHMR monitoring program. We must ask,
• Is the monitoring program producing data and analyses that give a true picture of the
status of fish stocks in the reserve?
• Do the monitoring activities constitute a wise use of TIDE's limited resources?
• Does the data collected lead to improved management?
Several volunteer organizations have studied of the consistency and relative accuracy of
data collected by novice and experienced divers; these have yielded encouraging results
supporting the use of volunteer reef survey programs (Mumby et al., 1995a). TIDE staff
who were trained to collect fish census data are similar to the volunteer divers who
participated in the study programs, in that they had no scientific diving experience prior
to the training they received for these projects. Both the TIDE staff and the volunteers
studied did have at least some previous knowledge of the fish species in their areas.
Because PHMR managers are interested in trends in fish abundance and size, we are not
as concerned about having accurate information on the numbers and sizes of fish in the
reserve. Consistent information on relative numbers and sizes will allow the
identification of trends. This is considered to be the most critical information for
management; therefore if participants in the PHMR fish monitoring program can be
trained to, and maintained at, a consistent standard of performance, we can be relatively
confident that the surveys are producing reliable data on relative abundances or sizes.
44

Because observer-related error is the most significant cause of bias or imprecision in the
data collected, care must be taken to minimize observer variability and account for it in
the analysis of data. Potential errors that may occur are: 1) recording a fish species as
present when it actually is not; 2) failing to record a species as present when it is; 3)
incorrect size estimation of fish; and 4) inaccurate estimation of the boundaries of the
survey area. Sources of variation can include: physical constraints (e.g., poor visibility,
difficulty physically recording data), diligence, or variation in size and distance
estimation. It has been shown that training and regular practice of the skills required for
underwater visual surveys—species identification, counting, and size estimation—reduce
variation in data collected by the same observer (Mumby et al., 1995a). The most
common method used to reduce variation between observers is "calibration" of the trainee
observer(s) against a diver experienced in the fish surveys (Thompson and Mapstone,
1997). This assumes that the experienced diver's observations are consistent; they cannot
be assumed to represent the actual numbers and sizes of fish on the reef since there is no
means of measuring these variables.
Another method of observer calibration is to use models as described in the Training
Methods section above, which allows divers to estimate fish sizes and then immediately
check their estimate against a real measurement. Immediate feedback should facilitate
learning this skill and speed the training or practice time. The most concrete way of
testing observer accuracy in fish identification, enumeration, and size estimation is to
perform a visual census followed by complete destructive sampling of the community
45

surveyed, in order to have a standard against which to judge the observed data. This has
been done only rarely, and is not practical in most situations. Regardless of the method
of training and calibration used, it must be practiced regularly, and testing—with
immediate feedback—should be an integral component of the training exercises.
RECOMMENDATIONS
The following suggestions for the successful long-term implementation of the PHMR fish
monitoring plan are derived from needs observed during the program development and
training activities. Recommendations in each "needs" category are intended to improve
the ability of the monitoring program to reach its objectives of providing useful
information on the status of fish resources in and around the PHMR.
1. INFORMATION
1.1. A complete baseline survey of the fish stocks in the reserve is required. Sedberry et
al. (1992) emphasize the need for extensive pre- and postdesignation surveys to evaluate
the effects of MPA creation on fish communities. The only previous study of fisheries
resources in the PHMR area was conducted by surveying fishers on their catch and effort
(TIDE, 1998b). Recent communication (12/9/2001) from TIDE's current scientific
officer indicates that a complete survey is planned for 2002. Severe damage to the local
46

environment and human communities from Hurricane Iris in October, 2001 has
temporarily delayed any fish monitoring surveys. No surveys were conducted between
mid-April 2001 and October 2001, after the end of the internship period; it is not known
why.
1.2. Fisheries-dependent surveys should be added to the methods used. Data on catch
and effort are required to judge the effects of the reserve on local fisheries.
1.3. Sociological and economic data on the local fishing communities should be
collected. The social sciences should not be separated from the natural sciences in
resource conservation projects. People, not resources, are managed, and information on
the social and economic welfare of Port Honduras residents will help guide management
as much as information on the ecological welfare of fish stocks.
1.4. Attempts should be made to identify cause and effect relationships for changes
observed in the PHMR. Distinguishing natural variation from that resulting from human
activities such as fishing will enable scientists to improve their understanding of natural
ecosystems and the impact of human use. This in turn will enable managers to focus
their efforts to better achieve the PHMR's goals of resource protection and sustainable
use. However, identifying the causes of change in a dynamic marine ecosystem can be
challenging. This issue may be addressed in part by the addition of an experimental
component to the PHMR research and monitoring programs. Carefully designed and
47

controlled (as much as possible) studies might help to isolate cause and effect
relationships between various natural and anthropogenic events and ecosystem changes.
2. ZONING
2.1 The development of a successful zoning scheme should take into account the
physical and biological characteristics of the area; resource uses; and user activities,
perceptions, and conflicts among users and between users and the environment (Laffoley,
1995). TIDE should consider re-drawing the boundaries of some of the zones to increase
the area closed to extractive fishing. No-take zones have been shown to enhance fish
populations within and near the closed area; however, the largest part of the PHMR is
zoned for General Use, which restricts only gillnet use. Continued harvest by other
means in this area may reduce the benefits of protection and negate any biomass increase.
3. TRAINING
3.1. More people will be needed to carry out the number of surveys planned. TIDE is
aware of this need, and demonstrated the ability to recruit volunteers for its projects.
However, TIDE should take steps to improve retention of its volunteers and staff. New
participants should go through the complete training program and reach an acceptable
standard of performance as judged by testing–feedback–practice--testing procedures.
48

3.2. Trained observers will need to engage in regular practice of the skills necessary for
the collection of accurate data. This is especially true for fish size estimation and
distance estimation. Bell et al. (1985) report that trained divers lose the ability to gauge
fish length if they have not practiced it for six months. The ability to accurately estimate
the survey area is likely to be similarly impaired by lack of practice. As part of the
distance estimation practice, the importance of consistency in decisions about whether or
not to include fish on the borderline should be emphasized. Continuous re-training
should be a regularly scheduled part of the monitoring program, and will probably be
most useful if sessions are held immediately prior to conducting the quarterly surveys.
3.3. Observer variability should be evaluated regularly through the use of calibration
exercises in which pairs or groups of divers survey the same site at the same time and
compare results. Combined with practice in length and distance estimation and fish
identification that includes immediate feedback, this should reduce variability and bias in
the data.
4. INSTITUTIONAL
4.1. Increased support from the Belize Fisheries Department would improve TIDE's
capacity to monitor and manage the reserve. Funding, staff, equipment (such as boats
and scuba gear), and communications between the two organizations are in short supply.
Competition and distrust between TIDE and the Fisheries Department reduce the abilities
of both to achieve their goals in Toledo.
49

4.2. Formal channels for the incorporation of monitoring results into the management
evaluation and decision-making processes should be created. Because the training
activities conducted during the internship produced no data, this was only discussed, not
practiced. The PHMR management team is aware of the importance of adaptive
management and the need for evaluation and evolution in response to new information
and changing circumstances. However, TIDE's administrators demonstrated a tendency
to use anecdotal reports of unknown origin about recent increases in fisheries resources
as a public relations tool. This type of action will only undermine TIDE's reputation and
support among community members in the long run—akin to crying "Wolf!" and leading
people to expect fish that never materialize. TIDE must recognize the importance of
conducting rigorous scientific research, appropriate and sound data analysis, and
publicizing real results (positive or negative). Efforts should be made to counteract a
current lack of public confidence in TIDE and the local representative of TNC.
5. MONITORING METHODOLOGY
5.1. The monitoring methodology used should be subject to peer review and validation.
The Bohnsack-Bannerot SVC technique is used in its published form; however, the site
selection process and number of sites and surveys needed for adequate power of
statistical analysis should be reviewed to confirm the capability of the current design to
produce meaningful results.
50

5.2. Limiting observation and analysis to a subset of the most common or commercially
valuable species (or even families) can facilitate the identification of trends in fish
community structure (Ault and Johnson, 1998). Allowing observers to focus their
training and observations on fewer fish will free more time and attention to use on the
selected group of fishes, and may reduce variability in the data collected.
6. DATA MANAGEMENT AND ANALYSIS
6.1. TIDE's scientific officer will be responsible for data management and analysis. If
necessary, a technical advisor who is readily available to the scientific officer and the
monitoring team leaders for assistance with questions regarding the monitoring protocol;
fish identification; data management, analysis and graphing; and interpretation and
presentation of results will be invaluable to the continuation of a scientifically rigorous
monitoring program.
6.2. TIDE is advised to focus on mean length as the most valuable gauge of reserve
effectiveness. Several researchers recommend using this statistic as an indicator of
population health. Bohnsack and Bannerot (1986) note that abundance patterns from
census data are characterized by high variance, and suggest that mean abundance may not
be the best criterion for comparing populations. Instead, mean length data can give some
information on fish stock status, and maximum length may be useful as an indicator of
fishing pressure.
51

Ault et al. (1998) used mean length in the exploitable phase of the population (defined as
the range between the minimum allowable size set by fishery regulations or gear
characteristics, and the maximum reported size for the species studied in the area of
interest). Mean length in the exploitable phase is highly correlated with average
population size, and thus reflects the rate of fishing mortality in the fishery. Since
persistent heavy fishing decreases the average size in a population, thus reducing
fecundity, an index of average size is an important indicator of fishing effects and
population health (Ault et al., 1998).
TIDE staff should see an increase in mean length of exploited species if the PHMR is
effectively protecting these species. Histograms would be an appropriate way of
interpreting and displaying changes in average size of a species over time, plotting a time
series of size values at each individual sampling site, or grouped according to zone
(Preservation/Conservation/General Use/Outside PHMR).
6.3. Data should eventually be incorporated into a Geographic Information System
(GIS). TIDE has the computer software required, but as of April 2001 did not have any
staff with the necessary expertise. Spatial analyses can be powerful tools for estimating
the distribution of marine populations and human impacts (Mumby et al., 1995b; Rueda,
2001), and can be very useful in stock assessments and fishery management. In addition,
maps and other images that can be created with the GIS can be helpful in public outreach
and education.
52

7. COMMITMENT
7.1. One of the most significant obstacles to the implementation of a sound long-term
monitoring program for the PHMR was the lack of an institutional culture concerned with
scientific investigation. TIDE's leaders seemed more concerned with public relations and
maintaining the image of a successful organization than with collecting and
disseminating real information on the status of fisheries resources in the reserve, or
providing logistical support for the monitoring training program. Varying levels of effort
and motivation by participants in the monitoring training program indicated that a strong
commitment to carrying out thorough surveys and continuing regular training will be
required of the team leaders.
8. PERSONNEL
8.1. Since TIDE plans to have its rangers do the monitoring, experience suggests that it
may be difficult for them to consistently have the required blocks of time (4-6 days four
times a year, at the same times each year) free from their patrol and enforcement duties,
which often include unexpected components. TIDE may not have the resources to hire
additional scientific staff; however, one alternative would be to consider the use of
volunteer organizations such as the Coral Cay Conservation, a U.K.-based organization
that has been training volunteer divers in reef survey methods and using them to conduct
surveys in other areas of Belize (Mumby et al, 1995a).
53

CONCLUSIONS
It remains to be seen if TIDE is willing and able to commit to a scientifically rigorous
long term monitoring program. In a situation where financial and personnel resources are
limited, fish surveys may not be seen as the most pressing need. However, in order for
TIDE to understand the PHMR ecosystems and the results of their management scheme,
they will need to have a long term monitoring program in place and generating legitimate
results. Results of the monitoring program indicating success or failure of the PHMR
will undoubtedly also be of interest to marine resource managers in other areas facing
similar situations and considering the implementation of marine protected areas as
conservation tools.
To some extent, the ability of TIDE to take advantage of the training and materials
provided through this internship will be undermined by turnover within their organization
and loss of trained personnel. Between April and December 2001 at least four key staff
members—the operations director, the science officer and the assistant science officer,
and a park ranger—have left TIDE's employ. This may prove an obstacle to timely
implementation of a monitoring program.
The question of whether the monitoring program itself is viable and capable of producing
valid data may be beside the point. Johannes (1998) argues that successful resource
protection is possible in a data-poor or data-less environment. He claims that research
54

generally does not provide sufficient knowledge of the dynamics of marine finfisheries,
particularly tropical nearshore fisheries involving many species and diverse habitats and
gear types, to enable management to any kind of optimum yield. "Data-less"
management does not mean management without information: useful information is
available from at least two sources. Knowledge and experience gained from research on
other related systems can be judiciously applied in similar situations. Second, local
fishers' knowledge of their marine environment and resources can be extremely
important for management purposes. Fishers from the Port Honduras area have a large
collective body of knowledge about their fishing grounds and the fish they have
traditionally sought. They are aware that the resource is declining, and many are willing
to participate in the management of local fisheries for sustainable extraction. These
sources of information—relevant research elsewhere and local knowledge—may be
sufficient to support precautionary management of the PHMR even in the absence of a
long-term monitoring program. It is the end (good management) that is important to
resource conservation, not the means (monitoring).
However, "MPA's are not ends unto themselves. They are only one important tool in the
suite of measures necessary to maintain biological diversity and to sustain fisheries"
(Kelleher et al., 1995). Much of the popularity of MPA's in the Caribbean is a result of
their value to tourism rather than as a fishery management tool (Roberts and Polunin,
1993). Since tourism is unlikely to bring significant revenue to the Port Honduras area in
the foreseeable future, the importance of sustaining—or improving—local fisheries is
paramount. Local resource managers, TIDE and the Belize Fisheries Department, need a
55

realistic assessment of if, and how, reef fishers are better off as a result of the PHMR. A
long-term fish monitoring plan can provide some insight into this issue. However, it is
not data collected by TIDE, but fish caught by fishers, that is the true measure of the
value of the PHMR. The bottom line is that catches must continue at levels satisfactory
to local fishers if they are to support the reserve and abide by its regulations.
56
REFERENCES
Alcala, A.C., 1988. Effects of marine reserves on coral fish abundances and yields ofPhilippine coral reefs. Ambio. Stockholm [AMMO], 17(3): 194-199.
Alcala, A.C., and G.R. Russ, 1990. A direct test of the effects of protective managementon abundance and yield of tropical marine fisheries. Journal du Conseil, 47(1):40-47.
Appeldoorn, R. S., 1997. Dispersal rates of commercially important coral reef fishes:what do tagging studies tell us about potential emigration from marine fisheriesreserves. Proceedings of the 49th Gulf and Caribbean Fisheries Institute, 49: 54-63.
Auil, S. A., 1992. An assessment of the Belize coral reef fishery. Proceedings of the 45thGulf and Caribbean Fisheries Institute, 45: 84-94.
Ault, J. S., Bohnsack, J. A., and Meester, G. A., 1996. A retrospective (1979-1996)multispecies assessment of coral reef fish stocks in the Florida Keys. FisheryBulletin, 96(3): 395-414.
Ault, T. R., and Johnson, C. R., 1998. Spatially and temporally predictable fishcommunities on coral reefs. Ecological Monographs, 68(1): 25-50.
Belize Fisheries Department, 2000. Fisheries (Port Honduras Marine Reserve) Order,2000. Ministry of Agriculture, Fisheries, and Cooperatives, Belmopan, Belize.
Bell, J. D., 1985. Estimating length frequency distributions of large reef fish underwater.Coral Reefs, 4: 41-44.
Bohnsack, J.A., 2000. A comparison of the short-term impacts of no-take marinereserves and minimum size limits. Bulletin of Marine Science, 66(3): 635-650.
Bohnsack, J.A. and S. Bannerot, 1986. A stationary visual census technique forquantitatively assessing community structure of coral reef fishes. NOAATechnical Report NMFS 41, 15p.
Bohnsack, J.A., and D.E. Harper, 1988. Length-weight relationships of selected marinereef fishes from the Southeastern United States and the Caribbean. NOAA Tech.Memo. NMFS-SEFC-215, 31 p.
Bortone, S. A., Kimmel, J. J., and Bundrick, C. M., 1989. A comparison of three methodsfor visually assessing reef fish communities: time and area compensated.Northeast Gulf Science, 10(2): 85-96.
57

Brock, V. E., 1954. A preliminary report on a method of estimating reef fish populations.Journal of Wildlife Management, 18: 297-308.
Buxton, C.D., 1993. Life-history changes in exploited reef fishes on the east coast ofSouth Africa. Environmental Biology of Fishes, 36: 47-63.
Carr, M.H., and Hixon, M.A., Predation effects on early post-settlement survivorship ofcoral-reef fishes. Marine Ecology Progress Series, 124: 31-42.
Carter, J., Gibson, J., and Can- III, A., 1992. A string of pearls for Belize: an alternativestrategy in conservation and fisheries management for the Belize Barrier Reefecosystem. Proceedings of the 45th Gulf and Caribbean Fisheries Institute, 45:631-653.
CIA (United States Central Intelligence Agency), 2000. World Factbook. Washington,D.C. <www.cia.gov/cia/publications/factbook> Accessed 12/8/2001.
Cicin-Sain, B., and Knecht, R. W., 1998. Integrated Coastal and Ocean Management:Concepts and Practices: Washington, D.C., Island Press, 517 p.
Corless, M., Hatcher, B. G., Hunter, W., and Scott, S., 1997. Assessing the potential forfish migration from marine reserves to adjacent fished areas in the SoufriereMarine Management Area, St. Lucia. Proceedings of the 49th Gulf and CaribbeanFisheries Institute, 49: 71-98.
Cote, I.M., Mosqueira, E., and Reynolds, J.D., 2001. Effects of marine reservecharacteristics on the protection of fish populations: a meta-analysis. Journal ofFish Biology, 59 (Supplement A): 178-189.
Courrau, J., 1999. Strategy for monitoring the management of protected areas in CentralAmerica, PROARCA/CAPAS/CCAD/USAID, p. '73 p.
CZMAI (Belize Coastal Zone Management and Authority), 2001a. Coastal PlanningProgramme. <www.coastalzonebelize.org/program.html> Accessed 11/29/2001.
CZMAI (Belize Coastal Zone Management and Authority), 2001b. The CZMAI Story.<www.coastalzonebelize.org/czmai.html> Accessed 11/29/2001.
Doherty, P. J., 1991. Spatial and temporal patterns in recruitment. In Sale, P. F., ed., TheEcology of Fishes on Coral Reefs, San Diego, CA, Academic Press, Inc., pp. 261-293.
Edgar, G. J., and Barrett, N. S., 1997. Short term monitoring of biotic change inTasmanian marine reserves. Journal of Experimental Marine Biology andEcology, 213(2): 261-279.
58

English, S., Wilkinson, C., and Baker, V., 1994. Survey Manual for Tropical MarineResources: Australian Institute of Marine Science, Townsville, Australia, 368 p.
FAO, 2001. FAO Yearbook vol. 89: Fishery Statistics (Commodities) 1999. Rome:UN/FAO, 190 p.
Francour, P., 1994. Pluriannual analysis of the reserve effect on ichthyofauna in theScandola natural reserve (Corsica, northwest Mediterranean). Oceanologica Acta,17(3): 309-317.
Gibson, J., McField, M., and Wells, S., 1998. Coral reef management in Belize: anapproach through Integrated Coastal Zone Management. Ocean and CoastalManagement, 39: 229-244.
Goodridge, R., H.A. Oxenford, B.G. Hatcher, and F. Narcisse, 1997. Changes in theshallow reef fishery associated with implementation of a system of fishingpriority and marine reserve areas in Sourfriere, St. Lucia. Proceedings of the 49thGulf and Caribbean Fisheries Institute, 49: 316-340.
Green, A.L., 1996. Spatial, temporal and ontogenetic patterns of habitat use by coral reeffishes (family Labridae). Marine Ecology Progress Series, 133(1-3): 1-11.
Greene, L. W., and Alevizon, W. S., 1989. Comparative accuracies of visual assessmentmethods for coral reef fishes. Bulletin of Marine Science, 44(2): 899-912.
Greenfield, D.W., and Thomerson, J.E., 1997. Fishes of the Continental Waters of Belize.University Press of Florida, Gainesville, FL. 311 p.
Gubbay, S. (ed.), 1995. Marine protected areas: principles and techniques formanagement. London: Chapman and Hall. 232 p.
Harvey, E., Fletcher, D., and Shortis, M., 2001a. A comparison of the precision andaccuracy of estimates of reef-fish lengths determined visually by divers withestimates produced by a stereo-video system. Fishery Bulletin, 99: 63-71.
Harvey, E., Fletcher, D., and Shortis, M., 2001b. Improving the statistical power oflength estimates of reef fish: a comparison of estimates determined visually bydivers with estimates produced by a stereo-video system. Fishery Bulletin, 99: 72-80.
Heyman, W., and Kjerfve, B., 1999. Hydrological and oceanographic considerations forintegrated coastal zone management in southern Belize. EnvironmentalManagement, 24(2): 229-245.
Humann, P., and DeLoach, N., 1989. Reef Fish Identification: Jacksonville, FL, NewWorld Publications, 267 p.
59

Jennings, S., 2000. Patterns and prediction of population recovery in marine reserves.Reviews in Fish Biology and Fisheries [Rev. Fish Biol. Fish.], 10(2): 209-231.
Johannes, R. E., 1998. The case for data-less marine resource management: examplesfrom tropical nearshore finfisheries. Trends in Ecology and Evolution, 13(6): 243-246.
Kelleher, G., Bleakley, C., and Wells, S., 1995. A Global Representative System ofMarine Protected Areas, vol. 2: Wider Caribbean, West Africa, and SouthAtlantic. Washington, D.C.: GRBMPA, World Bank, IUCN.
Koslow, J. A., Aiken, K., Auil, S., and Clementson, A., 1994. Catch and effort analysis ofthe reef fisheries of Jamaica and Belize. Fishery Bulletin, 92: 737-747.
Laffoley, 1995. Techniques for managing marine protected areas: zoning. In Gubbay, S.,ed., Marine Protected Areas: Principles and techniques for management: London,Chapman & Hall, pp. 103-112.
Maritime Areas Act, 1992. An Act to make provision with respect to the Territorial Sea,Internal Waters and the Exclusive Economic Zone of Belize; and for mattersconnected therewith or incidental thereto. Belmopan, Belize: Government ofBelize.
McClanahan, T. R., and Arthur, R., 2001. The effect of marine reserves and habitat onpopulations of East African coral reef fishes. Ecological Applications, 11(2): 559-569.
McClanahan, T.R., and Mangi, S., 2001. The effect of a closed area and beach seineexclusion on coral reef fish catches. Fisheries Management and Ecology, 8: 107-121.
McCormick, M. I., and Choat, J. H., 1987. Estimating total abundance of a largetemperate-reef fish using visual strip-transects. Marine Biology, 96: 469-478.
Mumby, P. J., Harborne, A. R., Raines, P. S., and Ridley, J. M., 1995a. A criticalassessment of data derived from Coral Cay Conservation volunteers. Bulletin ofMarine Science, 56(3): 737-751.
Mumby, P. J., Raines, P. S., Gray, D. A., and Gibson, J. P., 1995b. GeographicInformation Systems: a tool for integrated coastal management in Belize. CoastalManagement, 23: 111-121.
Munro, J. L., 2000. Outmigration and movement of tagged coral reef fish in a marinefishery reserve in Jamaica. Proceedings of the 51st Gulf and Caribbean FisheriesInstitute, 51(51): 557-568.
60
Nagelkerken, I., van der Velde, G., Gorissen, M. W., Meijer, G. J., van't Hof, T., and denHartog, C., 2000. Importance of mangroves, seagrass beds and the shallow coralreef as a nursery for important coral reef fishes, using a visual census technique.Estuarine, Coastal and Shelf Science, 51: 31-44.
Nickerson-Tietze, D. J., 2000. Scientific characterization and monitoring: its applicationto integrated coastal management in Malaysia. Ecological Applications: 10(2) pp.386-396.
NOAA, 2001. Gray's Reef Fish Monitoring, Gray's Reef National Marine Sanctuary.<http://www.graysreef.nos.noaa.gov/articles/art1.html> Accessed 11/30/01.
Parrish, J. D., 1989. Fish communities of interacting shallow-water habitats in tropicaloceanic regions. Marine Ecology Progress Series, 58: 143-160.
Plan Development Team, 1990. Potential of marine fishery reserves for reef fishmanagement in the U.S. southern Atlantic. Springfield, VA: NOAA/NMFSSoutheast Fisheries Center, 40p.
Polunin, N. V. C., and Roberts, C. M., 1993. Greater biomass and value of target coral-reef fishes in two small Caribbean marine reserves. Marine ecology progressseries. Oldendorf [MAR. ECOL. PROG. SER.], 100(1-2): 167-176.
Rakitin, A., and Kramer, D. L., 1996. Effect of a marine reserve on the distribution ofcoral reef fishes in Barbados. Marine ecology progress series. Oldendorf [MAR.ECOL. PROG. SER.], 131(1-3): 97-113.
Ray, G. C., 1976. Critical marine habitats: definition, description, criteria and guidelinesfor identification and management. Proceedings of an International Conferenceon Marine Parks and Reserves, pp. 38-52.
Roberts, C. M., 1995. Rapid build-up of fish biomass in a Caribbean marine reserve.Conservation Biology [CONSERV. BIOL.], 9(4): 816-826.
Roberts, C. M., Bohnsack, J. A., Gell, F., Hawkins, J. P., and Goodridge, R., 2001.Effects of marine reserves on adjacent fisheries. Science, 294: 1920-1923.
Roberts, C. M., and Polunin, N. V. C., 1993. Marine reserves: Simple solutions tomanaging complex fisheries? Ambio. Stockholm [AMBIO], 22(6): 363-368.
Rogers, C.S. 1995. Common (or is it uncommon?) sense about coral reef monitoring. In:A Coral Reef Symposium on Practical, Reliable, Low Cost Monitoring Methodsfor Assessing the Biota and Habitat Conditions of Coral Reefs, U.S. EPA/NOAA,1995.
61
Rueda, M., 2001. Spatial distribution of fish species in a tropical estuarine lagoon: ageostatistical appraisal. Marine Ecology Progress Series, 22(2): 217-226.
Russ, G. R., 1991. Coral reef fisheries: effects and yields. In Sale, P. F., ed., The Ecologyof Fishes on Coral Reefs, San Diego, Academic Press, Inc. pp.600-632.
Russ, G. R., and Alcala, A. C., 1996. Marine reserves: Rates and patterns of recovery anddecline of large predatory fish. Ecological Applications [ECOL. APPL.], 6(3):947-961.
Sale, P. F., 1991a. Introduction. In Sale, P. F., ed., The Ecology of Fishes on Coral Reefs,San Diego, CA, Academic Press, Inc., pp. 3-15.
Sale, P. F., 1991b. Reef fish communities: open nonequilibrial systems. In Sale, P. F., ed.,The Ecology of Fishes on Coral Reefs, San Diego, CA, Academic Press, Inc., pp.564-600.
Sale, P.F. and B.J. Sharp, 1983. Correction for bias in visual transect censuses of coralreef fishes. Coral Reefs. Heidelberg etc. [Coral Reefs], 2(1): 37-42.
Samoilys, M. A., and Carlos, G., 2000. Determining methods of underwater visual censusfor estimating the abundance of coral reef fishes. Environmental Biology ofFishes, 57: 289-304.
Sanderson, S. L., and Solonsky, A. C., 1986. Comparison of rapid visual and a striptransect technique for censusing reef fish assemblages. Bulletin of MarineScience, 39: 119-129.
Schmitt, E. F., and Sullivan, K. M., 1996. Analysis of a volunteer method for collectingfish presence and abundance data in the Florida Keys. Bulletin of Marine Science,59(2): 404-416.
Sedberry, G. R., Carter, H. J., and Barrick, P. A., 1992. A comparison of fishcommunities between protected and unprotected areas of the Belize Reefecosystem: implications for conservation and management. Proceedings of the45th Annual Gulf and Caribbean Fisheries Institute, 45: 95-126.
St. John, J., Russ, G. R., and Gladstone, W., 1990. Accuracy and bias of visual estimatesof numbers, size structure and biomass of a coral reef fish. Marine EcologyProgress Series, 64: 253-262.
Sweatman, H., 1985. The influence of adults of some coral reef fishes on larvalrecruitment. Ecological Monographs, 55(4): 469-485.
62

Thayer, G. W., Colby, D. R., and Hettler, W. F., 1987. Utilization of the red mangroveprop root habitat by fishes in south Florida. Marine Ecology Progress Series, 35:25-38.
Thompson, A. A., and Mapstone, B. D., 1997. Observer effects and training inunderwater visual surveys of reef fishes. Marine Ecology Progress Series, 15(4):53-63.
Thresher, R. E., and Gunn, J. S., 1986. Comparative analysis of visual census techniquesfor highly mobile reef associated piscivores (Carangidae). Environmental Biologyof Fishes, 17: 93-116.
TIDE, 1998a. Port Honduras Preliminary Draft Management Plan. Punta Gorda, Belize.
TIDE, 1998b. The Voice of the Fishermen in Southern Belize Working Draft. PuntaGorda, Belize.
Tisdell, C., and Broadus, J. M., 1989. Policy issues related to the establishment andmanagement of marine reserves. Coastal Management, 17: 37-53.
Urquhart, S. N., 1997. Monitoring for policy-relevant regional trends over time.Ecological Applications, 8(2): 246-257.
Wantiez, L., Thollot, P., and Kulbicki, M., 1997. Effects of marine reserves on coral reeffish communities from five islands in New Caledonia. Coral Reefs, 16(4): 215-224.
Wells, S. 1995. Marine Protected Areas in Belize. In: Sustainable Financing Mechanismsfor Coral Reef Conservation: Proceedings of a Workshop. Hooten, A.J. and M.E.Hatziolos, eds. The World Bank, Washington, D.C., pp.16-17.
Windevoxhel, N. J., Rodriguez, J. J., and Lahmann, E. J., 1995. Situation of integratedcoastal zone management in Central America; experiences of the IUCN Wetlandsand Coastal Zone Conservation Program, IUCN, p. 31 p.
63

APPENDIX 1
INTERNSHIP PRODUCTS AND OTHER MATERIALS LEFT WITH TIDE/TNC IN PUNTAGORDA
Products developed during internship:
• Summary description of the SVC protocol with detailed instructions, for
monitoring team's use in new/continuing training activities
• Training methodology for the monitoring protocol and fish identification/size
estimation
• Microsoft PowerPoint presentations for use in fish identification training: one
with color photos of the fish and arrows/notes indicating key identification
features, and one with the same species shuffled and without notes/names for
testing
• Laminated flashcards for fish identification training, with a picture of each species
and the Latin, English, and when possible, Creole names of that species on the
back
• Paperboard cutouts (50) of fish shapes to be used in above-water fish size
estimation training, with the total length in cm written on one side.
• Wooden fish models (50) to be used in underwater fish size estimation training,
with the total length in cm written on one side. On the other side two small
stainless steel eye-screws allow the fish models to be strung on a line for
underwater deployment.
• Lengths of PVC pipe (35) to be used in above- or underwater fish size estimation
training. Lengths in cm are written at one end of each piece. The neutral shape
64
and color of the pipe sections eliminates association of a particular shape/color
model with a size. Lightweight PVC facilitates use.
• Templates for fish identification and size estimation training forms (dry and
underwater)
• Templates for data recording during monitoring surveys
• Microsoft Excel worksheet formatted for PHMR fish survey data
management/analysis
• Recommended TIDE Scuba Diving Standards (drafted in response to apparent
need)
• Article of fish monitoring program and training workshop for TIDE newsletter
Other materials brought to Punta Gorda and left with TIDE/TNC:
• Copy of the Bohnsack-Bannerot SVC protocol
• Copy of Training Techniques for Length Estimation from English et al., 1994
(AIMS)
• Box of Rite-in-the-Rain waterproof paper for copying training or data forms
• Plastic clipboards with pencils for underwater data recording
65

APPENDIX 2
SURVEY DATA SHEET TEMPLATE
Location
Date Observer(s)
Depth Visibility Water temp.
Site description
Tune started Time ended Other
SPECIES COUNT mean
LENGTH
Minimum Maximum
66

APPENDIX 3
DATA SHEETS FOR LENGTH ESTIMATION TRAINING & PRACTICE
ESTIMATION OF SIZE CLASSES Name:Date:
Estimate Trial 1Size (cm)
Trial 2Size (cm)
Trial 3Size (cm)
Trial 4Size (cm)
1 26
2 27
3 28
4 29
5 30
6 31
7 32
8 33
9 34
10 35
11 36
12 37
13 38
14 39
15 40
16 41
17 42
18 43
19 44
20 45
21 46
22 47
23 48
24 49
25 50
67
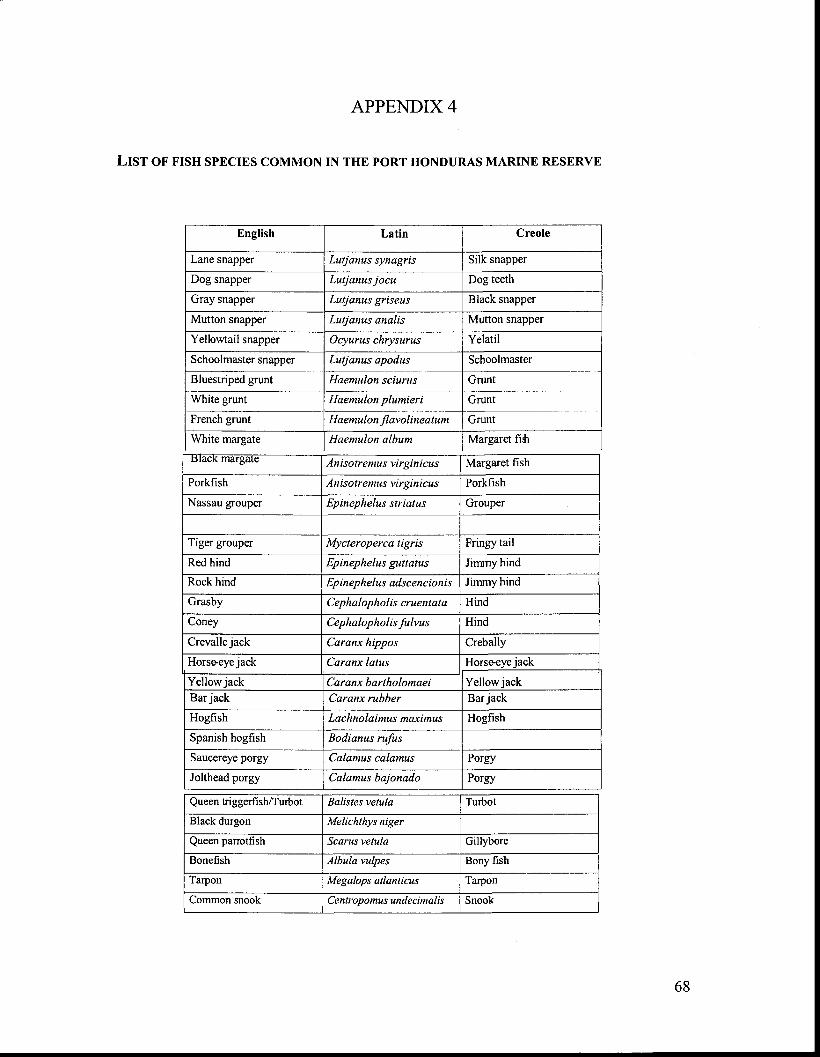
Crebally
Horse-eye jack
Bar jack Caranx rubber Bar jack
Saucereye porgy Calamus calamus Porgy
Jolthead porgy Calamus bajonado Porgy
Black durgon Melichthys niger
Queen parrotfish Scarus vetula Gillybore
Bonefish Bony fishAlbula vulpes
Tarpon TarponMegalops atlanticus
Cephalopholis cruentataGrasby
Coney Cephalopholis fulvus
English Latin Creole
Lane snapper Lutjanus synagris Silk snapper
Dog snapper Lutjanus jocu Dog teeth
Gray snapper Lutjanus griseus Black snapper
Mutton snapper Lutjanus analis Mutton snapper
Yellowtail snapper Ocyurus chrysurus Yelatil
Schoolmaster snapper Lutjanus apodus Schoolmaster
Bluestriped grunt Haemulon sciurus Grunt
White grunt Haemulon plumieri Grunt
French grunt Haemulon flavolineatum Grunt
White margate Haemulon album Margaret fill
acx margate Anisotremus virginicus Margaret fish
Porkfish Anisotremus virginicus Porkfish
Nassau grouper Epinephelus striatus Grouper
Tiger grouper Mycteroperca tigris Fringy tail
Red hind Epinephelus guttatus Jimmy hind
Rock hind Epinephelus adscencionis Jimmy hind
Hind
Hind
Crevalle jack Caranx hippos
Caranx latusHorse-eye jack
Yellow jack Caranx bartholomaei Yellow jack
Hogfish Lachnolaimus maximus Hogfish
Spanish hogfish Bodianus rufus
Queen triggerfish/Turbot Batistes vetula Turbot
Common snook Centropomus undecimalis Snook
APPENDIX 4
LIST OF FISH SPECIES COMMON IN THE PORT HONDURAS MARINE RESERVE
68

APPENDIX 5
TRAINING MATERIALS
1. Flashcards used for fish species identification training
2. Slide, PowerPoint presentation on fish identification used in Monitoring Workshop

APPENDIX 5, CONTINUED
TRAINING MATERIALS
3. PVC sticks used in underwater fish length estimation training

APPENDIX 6
SAMPLE MICROSOFT EXCEL WORKSHEET FROM SPREADSHEET CREATED FOR SURVEYDATA
cPAcvs
Wilson Caye
cPae_JP A e ri 1 04,./ et' eAllir Fr,
yakA'c,e' ,9 be e, .., mac
C,- ,e, sf. cP 4' 4'Cf' c•i• \ •(..1•S` 'Cs
27 1WilsonCaye 3/22/01
KarlCastillo
LynetteGomez
MaggieSommer
sunny,dry, 5 ktwind calm 13 4
coral heads,many algae
Muttonsnapper 2 18 18 18
28 1WilsonCaye 3/22/01
KarlCastillo
LynetteGomez
MaggieSommer
sunny,dry, 5 ktwind calm 13 4
coral heads,many algae
Yellowtailsnapper 11 13 10 16
29 1WilsonCaye 3/22/01
KarlCastillo
LynetteGomez
MaggieSommer
sunny,dry, 5 ktwind calm 13 4
coral heads,many algae Parrothsh 45 12 10 16
30 1WilsonCaye 3/22/01
KarlCastillo
LynetteGomez
MaggieSommer
sunny,dry, 5 ktwind calm 13 4
coral heads,many algae
Bluestriped grunt 2 12 12 12
31 1WilsonCaye 3/22/01
KarlCastillo
LynetteGomez
MaggieSommer
sunny,dry, 5 ktwind calm 13 4
coral heads,many algae
Surgeonfish 4 10 10 10
32 1WilsonCaye 3/22/01
KarlCastillo
LynetteGomez
MaggieSommer
sunny,dry, 5 ktwind calm 13 4
coral heads,many algae
Seargeantmajor 2 8 8 8
33 1WilsonCaye 3/22/01
KarlCastillo
LynetteGomez
MaggieSommer
sunny,dry, 5 ktwind calm 13 4
coral heads,many algae
Frenchangelfish 1 8 8 8

APPENDIX 7
SAMPLE CHARTS OF SPECIES ABUNDANCE AND LENGTHS USING DATA FROM A TRAININGDIVE