development and testing of chemically-based self
TRANSCRIPT

Scholars' Mine Scholars' Mine
Masters Theses Student Theses and Dissertations
Summer 2011
Development and testing of chemically-based self-consolidating Development and testing of chemically-based self-consolidating
concrete concrete
Mark Daniel Ezzell
Follow this and additional works at: https://scholarsmine.mst.edu/masters_theses
Part of the Civil Engineering Commons
Department: Department:
Recommended Citation Recommended Citation Ezzell, Mark Daniel, "Development and testing of chemically-based self-consolidating concrete" (2011). Masters Theses. 5153. https://scholarsmine.mst.edu/masters_theses/5153
This thesis is brought to you by Scholars' Mine, a service of the Missouri S&T Library and Learning Resources. This work is protected by U. S. Copyright Law. Unauthorized use including reproduction for redistribution requires the permission of the copyright holder. For more information, please contact [email protected].

DEVELOPMENT AND TESTING OF CHEMICALLY-BASED
SELF-CONSOLIDATING CONCRETE
by
MARK DANIEL EZZELL
A THESIS
Presented to the Faculty of the Graduate School of the
MISSOURI UNIVERSITY OF SCIENCE AND TECHNOLOGY
In Partial Fulfillment of the Requirements for the Degree
MASTER OF SCIENCE IN CIVIL ENGINEERING
2011
Approved by
Dr. Jeffery Volz, Advisor Dr. John Myers
Dr. Lesley Sneed
Ill
ABSTRACT
Self-consolidating concrete (SCC) possesses several characteristics that can
benefit the concrete construction industry including accelerated construction, a reduction
in labor and equipment, and a reduction in construction noise through eliminating or
reducing the need to vibrate the concrete. However, SCC has some potential downsides.
These problems can usually be attributed to higher paste content, higher fines content,
rounder aggregate, and higher water to cement (w/c) ratios used to increase the flow of
the concrete. The goal of this research project was to develop a SCC that had improved
material properties through the use of chemical admixtures instead of modifications to the
mix proportions. After the SCC was developed, the material properties were compared to
a more traditional or normal concrete (NC) mixture.
Both the SCC and NC underwent testing of fresh and hardened properties. The
SCC underwent the following tests: slump flow, J-ring, L-box, and segregation column.
These tests aided with mixture proportioning and optimization. After the SCC mix
design was selected, material properties were tested and compared for both NC and SCC.
These tests included: compressive strength, modulus of rupture, shrinkage, and shear
strength. These properties were compared between the two types of concrete and also
with empirical models and design code provisions.

IV
ACKNOWLEDGEMENTS
I would like to thank my advisor, Dr. JefferyS. Volz for his advice, guidance, and
patience throughout my time as a graduate student and while working on this research
project. His willingness to teach and knowledge of the material was greatly appreciated.
I would also like to thank my committee members, Dr. John J. Myers and Dr. Lesley H.
Sneed for their help and suggestions.
In addition to my committee I would like to thank the technicians and staff that
helped in several different areas of construction and testing, particularly John Bullock,
Jason Cox. Gary Abbott. and Steve Gabel. Several of my fellow graduate students also
graciousl y donated their time to help such as Carlos Ortega, Ben Gliha, Kyle Marlay,
Nichole Podhorsky. Courtney Greene, and Michael Wolfe. Without their help I am sure
that much of this project would not have been possible.
Finally I would like to thank my friends and family for their support throughout
my education and research . Without their encouragement and support I would not be
where I am today. I am sincerely grateful to you all.
v
TABLE OF CONTENTS
Page
AHS-rRACT .............................. .... ................................ ... ............................. ................. .... iii
ACKNOWLEDGEMENTS .......... ... ............................................................ iv
LIST OF ILLUSTRAT IONS ..... ... ............................... .......... ......... ... .... ......................... .... x
LIST C)F TABLES ........................................................................................................... xiv
SECTION
I . INTR()J)UCTION ............................................................ ....... ....... ............ ......... ....... I
1. 1. BACKGROUND AND MOTIVATION FOR STUDY ........... ..... ............. ... ..... 1
1.2. OBJECTIVE AND SCOPE OF WORK .............................. ...... .................... .... . 2
1.~. APPLICATION .................................................................................. ................ 2
1.4. RES EA RCH PLAN ...... ... ......... .. ...... ... ..... ..................................... .... ....... .......... 3
1.5 . OUTLINE ... .. ... ........ ..... .. ............. ........ .. .. ...... ........... ..... .......... ...................... ..... 6
2. LITERATURE REVIEW ..... .. ...... ............................................. ..... ...... ........ ... ....... .... 8
2. 1. GENERAL ........................ ............... .... ... ...... ............................................. ......... 8
2. 1. 1. Definition of SCC. .................... ......... ............ ... ........ ............ .... ....... .. ....... 8
2 . I .2. Uses for SCC ... ........... ......................... ... ........ .... ........ ........... ... ...... ....... ... 8
2.2. MATERIAL PROPERTIES FOR SCC ......... ..................................................... 8
2 .2 . 1. Concrete Shrinkage . ... .... .. . ... ..... ........ ...... ................ ........ .................. ..... .. 8
2.2.2 . Shrinkage Factors .. ... ... ...... ............... ........ ... ... ......... ... ........... .. ... .............. 8
2.~. ACI COMMITTEE REPORT 237R-07 ........ ... ... ........ ............. ......... .............. .... 9
2.3. 1. Filling ability ............. ........ .... ... ............ ..... .... .. ........... ... .......... ..... ....... ... 10
2.3.2. Stability ............................... .................................................................. . 10
2.3.3. Passing ability ..... ...... ......... .. ............ .. ................... ...... ......... ....... ............ 10
2.4. MIX DEVELOPMENT ..... .. ..................... ....... ............... .................... .... ........ .. 11
2.4. 1. Target Values ... ................ ..... ................ .... .. .. .... ... .. .. ..... ......................... 11
2.4.2. Trial Batches ........................................... .... .............. ..... ........ ..... ...... ...... 11
2 .4.3. Selecting Proportions ....................... ....... .. ........... ....... ......... .... ... ... ..... ... I I
2.5. WATER-REDUCING ADMIXTURES .. .......... ..... ...... ..... ............... ...... ... .... .. . 12
2.5. 1. Classification of Water-Reducers .. .......................... ............ ...... ............. 13

VI
2.5.2. Low-Range (Regular) Water-Reducing Admixtures ... .................... .. .... 13
2.5.3. Mid-Range Water Water-Reducers ........................................................ 13
2.5.4. Superplasticizers (High-Range Water-Reducers) ....... ........ .... ................ 13
2.5.5. Water Reduction Mechanism ....... .......................................................... 14
2.5.6. Effect on fresh concrete properties ..... ....................... ..... ........................ 14
2.5.6.1 Flowing concrete ................. ....................... ......... ........................ l4
2.5.6.2 Slump loss ................................................................................... 14
2.5.6.3 Set retardation ............................................................................. 15
2.5.6.4 Bleeding . ... ..................... ... ........... .................. ................. .. .......... 15
2.5.6.5 Air entrainment. .... .... ........ ........................ .................... .... ...... .... 15
2.5.7. Effect on hardened concrete properties .............. ................................ .. .. 15
2.5.7 .I Compressive strength .................................. .... ........ ..... .. .... ......... 15
2.5.7.2 High-strength concrete ... .... .. ..... ............ ... ... .. ... ...... .... ... .. .. .. ... .... . ! 5
2.5.7.3 Shrinkage ......................................... ... ........................ ....... ..... .... ! 5
2.5.7.4 Creep .............. .. .......... .. .. ............................................................. 16
2.6. VISCOSITY MODIFYING ADMIXTURES ........ .... ... ........ ..... .. ....... ....... ....... 16
2.7. TEST METHODS .. ......... .... ..... ... ..... ..... .. ............... .... ..... ............... ......... ... ....... 16
2.7.1.Slumpflowtest. ......................... .. ....... ..... ............. ....... .. ...... ................... l7
2.7.2. Visual stability index (VSI) ....................................... ... ... .. ........... ... ....... 17
2.7.3. Tso ...... · ...................................................................... .. ......... .......... ...... ... .. 17
2.7.4. J-ring ... ... ...... .... ............................................. ..................... ..... ..... ......... .. 17
2.7.5. L-box ......... ....... .. .... ... ..... ...... ........ ..... ...... ................ .... .......... ...... ..... .. .... 18
2.7.6. Column segregation ............................... .... .... ..... ..... ..... ....... ... ..... .... .. ..... 18
2.8. SHEAR STRENGTH OF SCC ...... ... ........ ....................................... .... .. .......... . 18
2.8.1. Hassan, Hossain, and Lachemi, 2010 ....... ......... ... ... .......... .... ...... ... ..... ... 18
2.8.2. Kim, Hueste, Trejo, and Cline, 2010 ................... ... ... ...... ... ......... ... ....... . 2 1
2.9. OPTIMIZATION OF SCC ...... .. .. .. .......... .. .............. ...... .................. ..... ........ .. .. 24
2. 10. USE OF SUPPLEMENTARY CEMENTITIOUS MATERIALS IN SCC ... 25
2.11. TEMPERATURE INFLUENCES ON SCC ...... .. .... .... ................... ....... .... .. ... 27
2.12. SEGREGATION OF SCC .. .......... .... .... ................ .. .............. .... ........ .. ............ 28
3. SCC MIX DEVELOPMENT .......... .................... ................................ ... ........ .......... 30
Vll
3.1. INTRODUCTION ............................................................................................ 30
3.2. BASE MIX DESIGN ........................................................................................ 30
3.3. ADDITION OF FLY ASH TO BASE MIX ..................................................... 32
3.3.1. Fly ash effects ......................................................................................... 32
3.3.2. Test batches ............................................................................................ 32
3.3.3. Test results .............................................................................................. 32
3.4. SCC MIX DESIGN ........................................................................................... 33
3.4.1. HRWR effects ........................................................................................ 33
3.4.2. Test batches ............................................................................................ 35
3.4.3. Test results .............................................................................................. 35
3.4.4. VMA effects ........................................................................................... 36
3.4.5. Test batches ............................................................................................ 36
3.4.6. Test results ............................................................................ .................. 36
3.4.7. Final Mix Design .................................................................................... 36
4. MATERIAL TESTING PROGRAM ....................................................................... 38
4.1. INTRODUCTION ............................................................................................ 38
4.1.1. Casting .................................................................................................... 38
4.1.2. Curing Conditions ............................................................ ...................... 38
4.2. FRESH CONCRETE TESTING PROGRAM .................................................. 39
4.2.1. Density .................................................................................................... 39
4.2.2. Air content. ............................................................................................. 40
4.2.3. Slwnp flow ............................................................................................. 40
4.2.4. Passing ability ............................................................................ ..... ........ 44
4.2.5. Static Segregation ..................................................................... .............. 45
4.3. HARDENED CONCRETE TESTING PROGRAM ........................................ 47
4.3.1. Compression testing ............................................. .................................. 47
4.3.1. Results .................................................................................................... 49
4.3.2. Conclusions ............................................................................................ 50
4.3.3. Modulus of rupture .............................................................. ................... 52
4.3.4. Results ....................................................... ............................................. 52
4.3.5. Conclusions ............................................................................................ 52

VIII
4.4. CONCLUSIONS ............................................................................................... 56
5. SHRINKAGE ......... ................. ..... ....................... ... ....... ........................................... 59
5.1. METHODOLOGY ...... ... ........................ .. .. ..... .... ........ ...... ....... ... ................. .. .. 59
5.2. RESULTS .................................... .. .. .... ..... ... .. ... ............. .......... .. ..................... .. 61
5.3. DATA ANALYSIS AND INTERPRETATION .............................................. 63
5.4. CONCLUSIONS ............... ................ .... .... ... ............ ......................................... 69
6. FULL-SCALE BEAM SHEAR TESTS ............. ..... .. .. .... .................... .. ... .. ...... .... .... 72
6.1. INTRODUCTION ............................................................................................ 72
6.2. SPECIMEN DESIGN ............... ............... ......... ....... .... ... ... .... ... ... .... ...... ...... ... .. 72
6.3. SPECIMEN CONSTRUCTION ....... ...... .......... ............................ .... ... .... ...... ... 80
6.4. SPECIMEN INSTRUMENTATION AND TEST SETUP ................ .. ....... ..... 89
6.4.1. Specimen instrumentation .. ... ......... .... .. ... ........ ... ............. ... .. ..... .... ... ... ... 89
6.4.2. Test setup ... ..... ..................... .................... ... ...... .............. ............. .. ......... 92
6.5. MATERIAL STRENGTH TESTING AND RESULTS ... ........ ..... .. ...... ..... .. ... 95
6.5.1. Tensile strength of reinforcing steel. ..... .. ... .... ... ............... ...... .... ........... . 95
6.5.2. Compressive Strength of Concrete .... ..................... ..... .. ......................... 95
6.6. TEST RESULTS ......... ..................... .. ...... ..... .......... .. ............... .................. ... .... 97
6.7. DATA ANALYSIS AND INTERPRETATION ............................................ 115
6.8. CONCLUSIONS ............................................................................................. 124
7. FINDINGS, CONCLUSIONS, AND RECOMMENDATIONS ........ .. .... ..... ... ..... 126
7 .I. INTRODUCTION .......................................................................................... 126
7.2. FINDINGS ................... .. ............ .. ........ .... .. .... .... ... .... ......... ...... .. ..... .... ..... .... .. . 126
7 .2.1. Fresh Concrete Property Tests . ................ ..... ..... .. .. ....... .. ..... .... ... ... ...... 126
7.2.2. Hardened Concrete Property Tests ....................................................... 127
7.2.3 . Shrinkage Testing ......... ... .................... .... .. ... ....... .. .. ............ ..... ... ... .... .. 128
7.2.4. Full-Scale Beam Shear Tests .. .. .... ......... .......... ..... ......... .. ... .... .... .......... 129
7.3 . CONCLUSIONS ............................................................................................. 130
7.4. RECOMMENDATIONS ................................................................................ 131
APPENDICES
A. MATERIAL DATA SHEETS .. . .. . .... ...... ................ .. ..... .. .... .. ... .... l32
B. SHRINKAGE PLOTS ..................................... .. ....... .... . ..... ... .... 139

IX
BIBLIC)GRAPHY ..... .. ... .... ....... .... ............................................................................. .... . 143
V ITA ....... . .... . ...... . .... . ......... . ..... ..... ...... .. .... ........ . . ..... ......... .. ............. 147

X
LIST OF ILLUSTRATIONS
Page
Figure 3.1. Slumps at Different Fly Ash Replacements .................................................. 34
Figure 3.2. Concrete Compressive Strength With Fly Ash Replacement.. .. ........ .... ... ..... 34
Figure 4. 1. Raising the Mold During Slump Flow Test .................................................. 41
Figure 4.2. Measure Concrete Diameter During Slump Flow Test .. ..... ... ..... ..... ... ...... .... 42
Figure 4.3. J-Ring Test. ......... .. ............ .... ......... .... .. ..... ............. ....... ..... .. .... ...... ...... .... .. ... . 44
Figure 4.4. Concrete Compression Testing ............. .. ............... ...... .. ... .............. ...... ......... 49
Figure 4.5. Concrete Compressive Strength With Fly Ash Replacement.. ...................... 50
Figure 4.6. Compressive Strength vs. Time .. ........ .. ... .... ...... .... ... ... ....... ... .... ... ... .............. 51
Figure 4.7. Modulus of Rupture ... ...... .................. .... .... .. ................. .. ... .. ......... ....... .... .. .... 53
Figure 4.8. Modulus of Rupture .... ........ ... .... ... ........... ............. ........ ... .. ....... ...... .... .. .... ..... 54
Figure 4.9. Modulus of Rupture After Testing ................................................................ 54
Figure 4.1 0. Modulus of Rupture After Testing ...... .. ..... .... .. .. .. ...... .. ...... ... .... ..... .......... ... 55
Figure 4.11. Modulus of Rupture .. ....... ................... .... ....... .... ... ..... .. ......... .. ... ... .... ........... 55
Figure 5.1. Shrinkage Specimens and DEMEC Locations .............................................. 59
Figure 5.2. Typical Shrinkage Specimen ..... ... ..... .. ... .. .. .... ..... ... ............................... ... ..... 60
Figure 5.3. Concrete Shrinkage Specimens ..................................................................... 61
Figure 5.4. Shrinkage Plot ...... ........ ... ... ..... ..... .. .. .............. .. .. .. ... .... ... ........ ......... .............. 63
Figure 5.5. Shrinkage Plot With Standard Deviations ................... ...... ........... ... ........... ... 64
Figure 5.6. Concrete Shrinkage Compared to ACI 209R Model. .................................... 69
Figure 5.7. Concrete Shrinkage Compared to Bazant-Baweja B3 Model ............... .. .... .. 70
Figure 5.8. Concrete Shrinkage Compared to GL2000 Model ........................................ 70
Figure 6.1. Loading Condition for Full-Scale Beam Shear Tests ... .. ... ... ........... ... ........... 74
Figure 6.2. Steel Reinforcement Location ....................................................................... 78
Figure 6.3. Shear Reinforcement With No Stirrups ......................................................... 78
Figure 6.4. Shear Reinforcement With 7 in. Stirrup Spacing .......................................... 79
Figure 6.5. Shear Reinforcement With 5 in. Stirrup Spacing ................................ ......... . 79
Figure 6.6. Reinforcement Cages ......... ···· ... ................. .. .... ...... ........ .. .............................. 82
Figure 6.7. Strain Gages ................................................................................................... 82

XI
Figure 6.8. Forms Prior to Concrete Placement.. ......................... ................ ........ ....... ..... 84
Figure 6.9. Initial Slump Taken ....................... ....... ........... ......... .... ..... .......... .................. 85
Figure 6.1 0. Filling Concrete Bucket ............................................................................... 85
Figure 6.11. Placing Concrete .................. ... ............................... ... .. .......... ....................... 86
Figure 6.12. Vibrating Concrete ................................ .................... ... ............................... 86
Figure 6.13. Finishing NC .............................. .. ....... .. ................... ... .......... ... .......... .... .. ... 87
Figure 6.14. Addition of Chemical Admixtures ........................ ...................................... 87
Figure 6.15. Placing SCC. .... .. ........ .. ............ ....... .. ... .................................................... .... 88
Figure 6.16. Slump Flow ................................................... .. ........... ............ ...... ... ..... ... .. .. 88
Figure 6.17. Concrete Placement Operations ............. ................. ... ......................... .. ...... 89
Figure 6.18. Strain Gage Location- Beam With No Stirrups ............. ... ... .............. ...... .. 90
Figure 6.19. Strain Gage Locations- Beam With 7 in. Stirrup Spacing ............ .. ....... .... 90
Figure 6.20. Strain Gage Locations - Beam With 5 in. Stirrup Spacing ............ .... ......... 90
Figure 6.21. LVDT ...... ... ......... ........................................ .... ... .. ........ .... ........................... 91
Figure 6.22. Data Acquisition System ........ ... ........ .. .. .... ................. .................... ............. 92
Figure 6.23 . Loading Locations for Full-Scale Shear Specimens .. .. ........ ...... .... .. .......... . 93
Figure 6.24. Shear Test Setup - Front View ...... ........... ........... .... .. .... ......... ....... ... .... ....... 94
Figure 6.25. Shear Test Setup - Side View ..................................................................... 94
Figure 6.26. Load vs. Deflection Plot for NC- No Stirrups ............. .. .. .................. .. ...... 98
Figure 6.27. Load vs. Deflection Plot for NC - 7 in. Spaced Stirrups ........... .. ... .. ... .... ... 98
Figure 6.28. Load vs. Deflection Plot for NC - 5-in. Spaced Stirrups ... ......... ................ 99
Figure 6.29. Load vs. Deflection Plot for SCC - No Stirrups ............................... ........ .. 99
Figure 6.30. Load vs. Deflection Plot for SCC- 7 in. Spaced Stirrups ................ .. ... .. . I 00
Figure 6.31. Load vs. Deflection Plot for SCC - 5 in. Spaced Stirrups .... ..... ..... .... ... ... 100
Figure 6.32. Concrete Shear Strength Plot. ..... .......... .... .. ... .......... .......... .... ... ... .. ....... .... . 1 03
Figure 6.33. Typical Stirrup Strain Plot as a Function of Load .... ........... ... ..... .. ... ......... 104
Figure 6.34. Typical Crack Pattern for NC - Stage 1 ................ .... ....... ..... ...... ... ...... ..... 104
Figure 6.35. Typical Crack Pattern for NC - Stage 2 ..... ........... .... .......... .. ....... ...... ....... I 05
Figure 6.36. Typical Crack Pattern for NC - Stage 3 .. ....... ...... ...... .. .......... .............. ... .. 105
Figure 6.37. Typical Crack Pattern for NC - Stage 4 ... ............ ... .... .. ... .. ... ..... ... ...... ...... 106
Figure 6.38. Typical Crack Pattern for SCC - Stage I .. ....... ...... .. ..... .......................... .. 106

XII
Figure 6.39. Typical Crack Pattern for SCC- Stage 2 ... ...... .................. .. ................ ..... 107
Figure 6.40. Typical Crack Pattern for SCC- Stage 3 .................................................. 107
Figure 6.41. Typical Crack Pattern for SCC - Stage 4 .................................................. 108
Figure 6.42. Typical Crack Pattern for SCC- Stage 5 ... ................................... ............ I 08
Figure 6.43. Control-NS-1 Beam at Failure .. ............. ..... .... .. ................. ........... .... ......... 109
Figure 6.44. Controi-NS-2 Beam at Failure .. ............... .. ........ .. .. ............ .... ... ... ..... ... .. .. .. 109
Figure 6.45. Control-NS-3 Beam at Failure .. .. ............. .. ........ ..... .... .... .. .... ...... .... .......... . 109
Figure 6.46. Control-7-1 Beam at Failure ............ ..... ....... .. ...... ........... .. ...... ... .... ... ....... .. 110
Figure 6.47. Control-7-2 Beam at Failure ... ......... .. ........... .. ..... ........... .. ...................... ... 110
Figure 6.48. Control-7-3 Beam at Failure ..... ..... .............. ... ..... ... .. ........ ..... .... .............. .. 110
Figure 6.49. Control-5-1 Beam at Failure ...... .... ...................... ...... ... .. ... .... ........ .. ...... .... Ill
Figure 6.50. Control-5-2 Beam at Failure ........................ .... .... ...... ................................ Ill
Figure 6.51. Control-5-3 Beam at Failure ................................ ...... ...... ..... ........ ......... .... Ill
Figure 6.52. SCC-NS-1 Beam at Failure ....................................................................... 112
Figure 6.53. SCC-NS-2 Beam at Failure ................................................ ......... .............. I 12
Figure 6.54. SCC-NS-3 Beam at Failure ................... ............................. .. ... ..... ..... ........ 112
Figure 6.55. SCC-7 -1 Beam at Failure ...... .. ............. .................. .... ... ..... ... ....... .......... .. . 113
Figure 6.56. SCC-7-2 Beam at Failure .......................................................................... 113
Figure 6.57. SCC-7 -3 Beam at Failure ... ...................... .. ...... ......... .. ... .... ... .................... 113
Figure 6.58. SCC-5-1 Beam at Failure .......................................................................... 114
Figure 6.59. SCC-5-2 Beam at Failure .......... .... ... ..... ... ....... ... .. ... ......... ... ..... .... ... ....... ... 114
Figure 6.60. SCC-5-3 Beam at Failure ... .......... ... ....... ............... ...... ....... .. .. .... ... .......... .. 1 14
Figure 6.61. Concrete Shear Strength .................. ..... ...... .... .... ... ......... .. ... ............... ....... 120
Figure 6.62. Normalized Concrete Shear Strength ........................................................ 122
Figure 6.63. Comparison of Current Test Results with Previous Test Data Collected by Tureyen and Frosch (2003) ... ..... .. .... ..... ..... ... .. .. ........ ... ....................... . 122
Figure 6.64. V uiV ct Plot ...................... ............. ... .... ...... ... .... ....... .... .. .. ... ... ... .. .......... ....... 123
Figure B. I. Concrete Shrinkage ........ .. .............. .. .. ... ... ........ ... .......... ......... ................ ...... 140
Figure B.2. Concrete Shrinkage .. .... .... ......... ... ..... ...... ... ...... .......... ....... ...... .......... .... ..... .. 140
Figure B.3. Concrete Shrinkage Compared to ACl 209R-92 Model. ............................. 141
Figure B.4. Concrete Shrinkage Compared to Bazant-Baweja B3 Model .. ....... ....... ..... 141

X Ill
Figure B . .'i. Concre te Shrinkage Compared to GL2000 Model ...................................... 142
XIV
LIST OF TABLES
Page
Table 3.1. Fly Ash Replacement Trial Batches ............ ................................................. .. 33
Table 3.2. HRWR Trial Batches ............................... ............................................. ... ....... 35
Table 3.3. VMA Trial Batches ..... ... ..... ................. ........... ........... ................. ..... ... ...... ...... 37
Table 3.4. Final Mix Design ........ .. .. .. .... .. ............ .. ...... ..... ... ........... .. .... .... ..... .... ..... .. ...... . 37
Table 4.1. Summary of Fresh Concrete Testing Program ........... .......................... .. ... ..... 39
Table 4.2. HRWR Dosages ....... .... ..... .................. ......................... ....... ............................ 43
Table 4.3. VMA Dosages .......................................... .............. .......................... ... ..... ... .... 46
Table 4.4. Static Segregation Data .... ... .................. .. ... .... ............. .... ..... ........... .... ............ 47
Table 4.5. Summary of Hardened Concrete Testing Program ................. ............. .... .... ... 48
Table 4.6. Modulus of Rupture ........ ................... ....... .. ...... .. .... ..... ... .... .. .... ............ ....... .. . 53
Table 5.1. NC Shrinkage Strain ............. ... ...... .. .. .. .... .... .... .. ......... .... .... .. .... ....... .. .. ...... ... .. 62
Table 5.2. FA Shrinkage Strain ........ ... .. ................... ... .... .. ......... .. ..................... ..... ....... ... 62
Table 5.3. SCC Shrinkage Strain ............... .... .......... ....................... ............................. .... 62
Table 5.4. NC Shrinkage Strain . ...................... ..... ... .......... ...... .... ..... ............... ... ....... ...... 65
Table 5.5. FA Shrinkage Strain ... .. ............. ... .. .. .... ..... ........ ... .... .... .... ..... ....... ...... .. .... .... .. . 65
Table 5.6. SCC Shrinkage Strain ......... ..... .... ....... ... ................... .... ....... .. .... ... ... ............ ... 66
Table 6.1. Full Scale Shear Test Matrix .. ..... .. .................. .. .. .......... ....... .. .......... ... .... ....... 77
Table 6.2. Final SCC Mix Design per Cubic Yard ... ......... .... .... ... .. ...... ... .. .. ..... ..... ... .. .... . 79
Table 6.3. Final NC Mix Design per Cubic Yard ................... ... .. .... ...... ..... ..... .. ...... ... .... . 80
Table 6.4. Tensile Strength of Steel ........... ..... ............. ................. ... .... .. ........... .... ... .... .... 96
Table 6.5. Concrete Compressive Strength .... ..... ....... ....... ... ... ..... ..... ........... ..... .. ... ...... .. .. 97
Table 6.6. Tested Shear Strength .... ..... ... .. ... ..... ....... ... .. .. .... ... .. ... ....... .. .. ..... .. ..... ... .. ...... . I 02
Table 6.7. Vu andVd Values .. ........ .. .......... ........ ... .... ..... ....... ..... .. ....... .......... ... ... ... .... .. .. 103
Table 6.8. Calculation of Y s·· ··· ······ ········ ·· ······ ······ ··············· ····· ····· ······ ······ ·········· ··· ···· ·· ·· 116
Table 6.9. Vtest I Vcode ............. .. ... .... ....... ...... .. .. ........... .. .. .. .. .. ... .... .. ...... .. .. .... .. .. .... .... . 117
Table 6.1 0. Shear Strength From Concrete .... .... .... ....... .... ..... ..... ..... ...... ... .......... ..... .... .. 11 9
Table 6 .11 . Tested Shear Strength Comparison ... ..... ..... .. .......... .. ........... ....... .... .......... .. 12 1
Table 6.1 2. Vu/Vd ...... ..... .......... .. .... ... .. ... ... ... .... ...... ... ..... ... ...... .... .... ...... ... .. ... ... ... .... ... ... 124

1. INTRODUCTION
1.1. BACKGROUND AND MOTIVATION FOR STUDY
Self-consolidating concrete (SCC) is one of the concrete industry's latest
developments; it is defined as a concrete that spreads easily under its own weight while
still resisting segregation. sec has three main subsets: self-compacting concrete, self
placing concrete, and self-leveling concrete, all of which tout many positive traits that
can translate to economic and technological benefits for the end user. Some of these
benefits include accelerated construction, a reduction in labor and equipment, and a
reduction in construction noise through eliminating or reducing the need to vibrate the
concrete. Furthermore, SCC provides the ability to achieve good compaction even in
areas that have high steel congestion, and this ability is independent of the skill of a
vibrating crew, providing better quality control of the end product. While these are
impressive benefits, SCC is not completely without problems. The use of SCC has also
brought about two significant concerns that must be addressed or taken into account
when designing reinforced concrete with this material: shear strength and shrinkage.
The first concern is that SCC has a lower shear resistance then normal concrete
(NC). This is primarily due to the way that SCC has traditionally been produced. By
reducing the amount of coarse aggregate and selecting an aggregate that is more rounded
in nature, designers are able to produce a concrete that is much more flowable. While
this provides benefits during concrete placement, it can negatively impact the hardened
properties of the concrete, such as the concrete shear strength. When comparing a
rounded aggregate to an angular aggregate, there is the potential for a reduced amount of
aggregate interlock under loading. Rheology, which is related to aggregate diameter and
spacing, also affects shear strength, and there is a significant difference between sec and
NC in this area.
Shrinkage of SCC is also a concern. Factors that typically contribute to shrinkage
are higher paste contents, higher water/cement (w/c) ratios, and the types and amounts of
admixtures used within the concrete. sec generally includes all of these traits compared
to traditional concrete mixes.
Since SCC is still relatively new to the industry, there is still a significant amount
of research that needs to be conducted. The outlook for SCC seems bright in areas such
as precast or prestressed operations but some users are still hesitant to embrace the
material for the concerns mentioned above.
1.2. OBJECTIVE AND SCOPE OF WORK
The objective of this project was to develop an SCC mixture using materials local
to central Missouri and then test and compare the fresh and hardened properties to a
control NC mixture. Different types and amounts of chemical admixtures were used that
allowed for more optimized coarse aggregate properties. Keeping in mind the typical
sec factors that can negatively affect shear strength, the highest aggregate content with
angular shapes were used while still maintaining a highly flowable mix. This result
required a chemically-based approach to SCC mix development. The mixes were then
tested in the plastic and hardened states including shear strength and shrinkage behavior.
The following scope of work was implemented in order to achieve the project's
objective: (1) review applicable literature; (2) develop a research plan; (3) develop and
optimize SCC and NC mix designs for testing; (4) perform material tests on both fresh
and hardened concrete specimens; (5) design, construct, and test full-scale shear testing
specimens; (6) analyze results and prepare this theses in order to document the discovery
of information obtained during this research study.
1.3. APPLICATION
When SCC was first developed, the flowability was increased by increasing w/c
ratios, increasing paste contents, and using rounder aggregates. These can all contribute
to a reduction in shear strength. Since the early days of SCC, admixtures have made
great strides and it is possible to create sec without taking all of these shear strength
reducing measures. If an SCC design can be created using a lower w/c ratio, lower paste
content, a more angular aggregate, or some combination of the three, when compared to
early sec mix designs, then it could be possible that the effect on shear strength will be
negligible or at least smaller than once feared. This would be good news for areas such
as the precast or prestressed industries.
2

3
The prestressing industry in particular will be concerned with the amount of
shrinkage that SCC experiences compared to NC. In many prestressed applications, steel
congestion can be a problem; and many plants are already required to use highly flowable
mixes to ensure that concrete passes around all of the prestressing strands. If SCC
experiences significantly more shrinkage it will lead to significantly higher prestress
losses. With the addition of new chemical admixtures it becomes possible to increase the
amount of coarse aggregate, reduce the w/c ratio, and maintain the flowability of the SCC
all while keeping the shear strength and shrinkage on par with NC.
1.4. RESEARCH PLAN
The proposed research plan included a description of eight (8) tasks necessary to
successfully complete the study. They are as follows:
Task 1: Review applicable literature. In order to better understand the topic it was
necessary to become familiar with previous research. This indicated the test methods that
would be most beneficial and gave a basis for comparison of results from this study to
others. Research programs that studied the effects of aggregate size and shape on
concrete shear strength, effects of admixtures on workability and finishability, and factors
that can effect concrete shrinkage were of particular interest in this area.
Task 2: Perform aggregate material testing. Before mix design could begin,
aggregates were obtained locally for use in the concrete. Standard tests were performed
on the aggregates, both fine and coarse, to determine their properties. These tests
included: specific gravity, absorption, unit weight, sieve analysis, absorption, total and
surface moisture content, and organic impurities. These material properties were used
along with ACI 211.1-92 to create the initial normal concrete mix design.
Task 3: Evaluate the effects of fly ash on the fresh and hardened concrete. It is
generally accepted that the addition of fly ash to concrete will lead to an increase in
slump and workability. Since the objective of this research was to create a self
consolidating concrete with a very high slump and workability, the addition of fly ash
was a logical choice. Fly ash is a waste product from burning coal during electricity
generation, which makes it an environmentally friendly product and its cost is lower than
cement or chemical admixtures. If a moderate increase in slump can be achieved without

4
a significant decrease in strength, it would be possible that admixture dosages could be
decreased, reducing the cost. As a part of this task, both fresh and hardened properties of
concrete were tested with four different amounts of fly ash replacement. This allowed for
an optimization of the amount of cement that would be replaced with fly ash by balancing
the slump and workability increases in the fresh state with the short term retardation in
compressive strength gain.
Task 4: Evaluate the use of different types and brands of admixtures. In order to
maintain the shear strength of the self-consolidating concrete being developed, the coarse
aggregate content was kept higher then normally seen in other self-consolidating concrete
mixes. This approach will lead to a decrease in the slump of the concrete so the use of
chemical admixtures became necessary. It was determined that three chemical
admixtures would be used: air-entraining admixture, high-range water reducing
admixture, and a viscosity-modifying admixture. By increasing the air content in the
concrete, the durability of the concrete is increased as well as a slight increase in slump.
The high-range water reducing admixture provided a significant increase in the slump of
the concrete making it flowable without increasing the w/c ratio to a point that
compressive strength drops too low. The viscosity-modifying admixture prevented
excessive segregation in the fresh state, which can be an issue with a highly flowable
concrete. With the manufactures recommendations, and after testing was completed in
the lab, the types and dosages of the required admixtures were found and a mix design
was developed for the self-consolidating concrete.
Task 5: Produce and evaluate test batches of concrete . As a starting point, ACI
211.1-92 was used to develop an initial mix design. Assumptions were made that the
desired slump would be approximately 4 inches (I 0 I mm) and the air content would be
approximately 4 percent. Information about the aggregate discovered during Task 2 was
also used at this time. This initial concrete was produced and evaluated both in the fresh
and hardened states. Changes were then made to the mix design based on these results
and retested. Some of these changes included modifying the w/c ratio, increasing or
decreasing the aggregate content, and testing different dosages of air-entraining
admixtures to obtain the desired air content. After the NC had been optimized, work
began to develop the SCC. This process began by testing different types and amounts of

5
high-range water reducers and viscosity modifying admixtures. The desired product had
to have a high flowability without a high potential for segregation. This meant balancing
the amounts of the two admixtures that would be used. Similar testing was performed on
the SCC as the NC in the hardened state; however, because of the rheology of the
material, traditional fresh concrete testing was not an option. To test the SCC in its fresh
state, testing apparatuses developed especially for the material were used. Much like the
NC, this information was used to optimize the mix design as well as the admixture
dosages to obtain an optimized sec.
Task 6: Perform shrinkage testing. One concern with SCC was the amount of
shrinkage that the concrete would experience. Many times this increase in shrinkage can
be attributed to the increase in paste content; since the paste shrinks as it cures, it seems
reasonable that if the paste content is increased to improve flowability and create an sec,
the overall concrete shrinkage would also increase. The purpose of the shrinkage testing
in this case was to see if keeping the aggregate contents the same as a traditional concrete
and improving the flowability through the use of admixtures would decrease the
shrinkage experienced.
To study the concrete shrinkage, cylindrical specimens measuring 4 inches (I 0 I
mm) in diameter and 24 inches (609 mm) in length were produced using NC, SCC, and a
NC with a thirty percent replacement of cement with fly ash referred to as the fly ash
concrete (FA). Four specimens were created for each type of concrete and each concrete
specimen had three rows of DEMEC points for a total of nine readings per specimen.
These readings were averaged to obtain an overall shrinkage value for the concrete .
Initially readings were taken every day to capture the largest changes in length but as
time progressed and shrinkage happened more slowly, readings were taken less
frequently. Shrinkage values were then plotted over the time period that readings were
taken to compare the three concrete types. This allowed for a comparison of NC to SCC.
Since the FA could also be compared to the NC and SCC it could be seen if any changes
in shrinkage were due to the admixtures, the fly ash, or a combination of the two.
Task 7: Perform shear testing. In addition to the potential for increased shrinkage,
SCC can also have a decreased shear strength when compared to NC. As with shrinkage,
this can typically be attributed to the increase in the paste content and the types of

aggregate that are used. If the aggregate contents are decreased and a rounder aggregate
is used to improve the flowability of the concrete, there is less aggregate interlock to
provide shear strength. The reasoning for the chemical admixtures was to produce SCC
with a higher content of a more angular-shaped aggregate.
6
In order to compare the shear strength of the NC and SCC, full scale beams were
manufactured to be tested in a third point loading configuration. These beams were
designed to fail in shear by increasing the flexural reinforcement. Three stirrup designs
were also created: no stirrups, the minimum amount required by ACI, and slightly more
than the minimum amount required by ACI. Strain gages were applied to the stirrups and
to the flexural reinforcement to ensure that the steel was yielding, and the maximum load
applied to the beam was also recorded and used to calculate the strength of the beams.
Task 8: At the conclusion of testing, information was gathered and used to
develop findings, conclusions, and recommendations to document the discovery of
information obtained during this research project. The strength of the concrete in shear
and the shrinkage of the SCC compared to the NC was used by researchers to evaluate
the overall performance of the concrete. The data will also help to draw conclusions and
recommend future studies on the product. This thesis will include a literature review, a
description of testing that was completed, and a conclusions and recommendations
section.
1.5. OUTLINE
This thesis includes seven chapters and two appendices. This section will discuss
the information that will be presented in more detail throughout this document.
Chapter 1 includes background information about SCC and the reasoning for
performing this research. It also discusses the scope of work that was done and the work
plan that was followed.
Chapter 2 includes information from previous research performed on SCC to date.
This section includes material properties and mix proportioning of SCC, a description of
typical admixtures used, test methods employed, and optimization of the material.
Chapter 3 describes the process followed to develop the SCC mix design used
throughout the research project.

7
Chapter 4 includes information about the material testing program. The steps that
were followed to determine the fresh and hardened concrete properties are discussed in
this chapter.
Chapter 5 presents information found from shrinkage testing. The process of
casting the specimens, de-molding, and taking data is described as well as presenting
results and conclusions found.
Chapter 6 describes the fabrication process of the shear specimens as well as the
results of the full-scale shear tests that were performed. It describes the process from
bending the rebar to placement and finishing of the concrete as well as presenting results
and conclusions found.
Chapter 7 includes findings, conclusions, and recommendations based on the
research performed.
Appendix A includes material data sheets for the chemical admixtures used
during testing.
Appendix B includes shrinkage plots for concrete specimens.
8
2. LITERATURE REVIEW
2.1. GENERAL
2.1.1. Definition of SCC. SCC is defined as a highly flowable concrete that
resists segregation; it has the ability to fill formwork and encapsulate reinforcement with
little or no mechanical consolidation while still maintaining adequate viscosity to resist
segregation. Its rheology is characterized by a low yield stress making it easy to deform
and a moderate viscosity in its plastic state to maintain a proper, homogenous suspension
of solids (ACI 237, 2007).
2.1.2. Uses for SCC. Initially, SCC was developed to ensure that proper
consolidation was achieved in areas where durability and service life were a concern.
Some of these areas were cast sections with limited access but still highly congested
reinforcement such as a tunnel lining section or concrete filled tubular columns. More
recently SCC has been used for concrete repair applications such as bridge abutments and
pier caps, parking garages, and retaining walls in Canada and Switzerland. North
America has also seen an increase in the amount of the SCC especially in the precast
industry. To provide design assistance and to study this emerging technology, the
American Concrete Institute (ACI) has created ACI Committee 237 and the information
covered in Sections 2.1 through 2.4.3 is from their Emerging Technology Series on SCC.
2.2. MATERIAL PROPERTIES FOR SCC
2.2.1. Concrete Shrinkage Shrinkage is defined as the decrease in the volume of
the cement. It is composed of drying shrinkage, autogenous shrinkage, and carbonation.
The main component is drying shrinkage and, as the name suggests, the volume decrease
in the cement is due to moisture loss from the concrete.
2.2.2. Shrinkage Factors Factors that contribute to shrinkage are the w/cm ratio,
curing conditions, and the volume to surface ratio of the concrete. As the w/cm ratio
increases there is more water to dissipate from the concrete matrix leading to more
shrinkage. The type and duration of curing can also heavily affect shrinkage. If the
relative humidity surrounding the specimen increases, the shrinkage will decrease.
Depending on the type of curing, either active or passive, a different amount of relative

humidity can be provided to prevent shrinkage. Finally, specimens that have a larger
shape and overall higher volume to surface ratio, will entrap more water in the concrete
matrix and decrease shrinkage.
9
Current research has shown that shrinkage of SCC can be more or less than that of
normal concrete (NC) depending on the way that the concrete was developed. Since
drying is the largest contributor to overall shrinkage, the w/cm ratio of the concrete is
very important. If the amount of free water is increased to provide improved flowability,
then it is likely that there will be an increase in the amount of shrinkage in the concrete.
If, however, the w/cm is kept the same but the flowability of the concrete is increased
through the use of chemical admixtures or aggregate size and shape modifications, then it
is likely that the shrinkage will remain the same as that of normal concrete.
2.3. ACI COMMITTEE REPORT 237R-07
While the hardened properties of SCC compared to those found in NC have been
shown to be significantly different, it is the properties during the fresh, plastic state that
really differentiate the two materials. To objectively evaluate an SCC mixture, there are
two different processes. The first is to evaluate the rheological properties of the SCC,
and the second is to evaluate the properties using the more practical field-related testing
equipment. The later is the easier and more widely know method for testing SCC. There
are three properties that can be determined through field relating tests that will be
discussed: stability, filling ability, and passing ability. These properties are all influenced
by and tied to the rheological properties of the concrete. To develop a SCC mix design
that will work in a particular application, the designer must have an adequate knowledge
of these three concrete characteristics and know the type of application for which the
concrete will be used so that the concrete is suitable for the job.
The desired stability, filling ability, and passing ability needed by a concrete mix
will always depend on the application. The three are equally important and have an
effect, to some extent, on the others. When working with SCC, there should be a clear
understanding of exactly what each characteristic means and its importance in different
situations.

10
2.3.1. Filling ability. Filling ability is defined as the ability of SCC to flow and
fill in completely all the spaces within a set of formwork. It is affected by the fluidity
and the viscosity of the concrete. If the fluidity of the concrete increases or viscosity
decreases, then the filling ability would likely increase; however, as the fluidity and the
viscosity change, so will the rheology, which will likely alter the stability of the concrete
as well.
2.3.2. Stability. Stability is defined as the concrete's ability to maintain a
homogeneous distribution of its constituents during placement and hardening. Since
these are two very different types of applications, there are two types of stability
characteristics equally important to SCC: dynamic and static stability. While SCC is in
its plastic state, the typical stability issue is the settlement of the coarse aggregate to the
bottom of the form. Workers may also find that they see excess bleeding or surface
settlement after the casting is completed but before the concrete has set. These are all
static stability issues and can be combated in some cases by using Viscosity Modifying
Admixtures (VMA). A VMA is an admixture used to improve the rheological properties
of the concrete in its plastic state so that it can reduce the risk of segregation or washout.
The second stability issue, dynamic stability, refers to the concretes ability to remain
homogenous and resist separation during placement in the formwork. This can be an
issue if the concrete is flowing through closely spaced obstacles or narrow spaces. This
should also be considered when selecting the type of transportation method and whether
there is agitation or not.
2.3.3. Passing ability. Finally, passing ability is the ability of the concrete to pass
among obstacles such as congested steel or narrow spaces in the formwork. Should the
concrete have segregation issues and the coarse aggregate build up in one of these areas,
a blockage could be experienced, reducing the passing ability of the concrete. Passing
ability is a measure of the flowability of the concrete in a confined situation. It should
not be confused with filling ability, which is the flowability of the concrete in an
unconfined situation.
In order for a designer to find the properties discussed above it is necessary to
produce trial batches of concrete and to quantify the material' s filling ability, passing

ability, and stability. To objectively and effectively find these properties, test methods
have been developed and at this time are under refinement by ASTM.
2A.MIXDEVELOPMENT
II
2A.1. Target Values The first step to creating a SCC mix design is to determine
the slump flow that will be required for the particular application. Generally, a mix
designer should target the lowest slump flow that will provide adequate passability so as
to reduce problems associated with segregation or instability. Tables found in ACI 237R
I I can assist with the selection of an appropriate slump flow target. To begin, the mix
designer should rank each of the member characteristics as low, medium, or high. The
shaded boxes show areas that should be avoided. For example, if there will be a low
placement energy, it is recommended that the concrete have a slump flow of at least 26
inches. With the placement energy low, the concrete will need to have a high filling
ability so that it will be able to fill the forms completely without the assistance of
vibration.
2.4.2. Trial Batches Once the target slump flow is found, designers can move on
to conducting trial mixtures using the materials that will be used on the project. Once the
concrete is hatched, the slump flow should be checked again and the other fresh sec properties, passing ability and stability, should be determined. Once they have all been
determined, the slump flow can be compared to passing ability and stability and a
relationship between them can then be established. This will usually prove useful
because it will allow for less frequent testing of stability in the field.
2A.3. Selecting Proportions ACI document 237R limits its discussion to SCC
produced using conventional materials and production methods. sec is a high
performance concrete in the plastic state with a much higher level of workability and self
consolidation. These attributes are characterized by the concrete's filling ability, passing
ability, and stability. All of these attributes should be present before it can be considered
SCC. To achieve these properties and to optimize them for the concrete's intended
purpose, the application and the placement technique should be taken into account. One
example might be that concrete for a footing could have a higher coarse aggregate
content then concrete to be placed in a column with congested steel reinforcement. The
designer could take advantage of the benefits of a higher aggregate content if a large
slump flow was not required. In a situation where passability was not of the highest
concern, it might not be a problem.
12
When developing a SCC mix design, the ACI 237R guide will supplement the
standard practice for selecting proportions for concrete mixture proportions found in ACI
211.1. There are three different approaches that are typically followed when creating an
SCC mixture. The first is to increase the powder content and apply a high range water
reducing (HRWR) admixture. The higher powder content promotes stability while the
HRWR promotes flowability. The second is to keep the coarse aggregate content higher
and the powder content lower from the first and achieve flowability with a high dosage of
chemical admixtures. This could be beneficial if strength, either shear or compressive,
might be an issue. It can, however, lead to segregation problems, so in addition to the
HRWR a viscosity modifying admixture (VMA) can be applied. The third method is a
combination of the two with a moderate powder content and a moderate VMA dosage.
The approach that the designer should take is once again based on the specific
application.
2.5. WATER-REDUCING ADMIXTURES
In many cases where a high filling ability is required, mix designers will turn to a
water-reducing admixture. As the name indicates, this admixture lowers the water that is
required to attain a given slump, or it reduces the water demand of the concrete. This
ability is advantages in several different ways. The first would be to maintain the same
slump but decrease the water content. This would result in a general improvement in
strength, impermeability, and durability of the concrete. Alternatively, if cost was an
issue, the w/c ratio can be kept the same but the amount of cement can be decreased.
With less cement, which is the highest priced ingredient in concrete, the overall cost of
the concrete can be decreased and the water-reducing admixture can maintain the same
workability. This change may be made for these economic reasons or it may be made for
technical reasons. If heat of hydration is a concern , reducing the amount of cement will
help to lower the concrete temperature. Finally, water reducing admixtures can be used
to help facilitate difficult placements such as intricately detailed forms of highly

congested steel. If a water-reducing admixture is added to a concrete and the water and
cement contents are kept the same, the slump will increase as well as workability and
finishability.
13
2.5.1. Classification of Water-Reducers. Water-reducers are marketed by their
manufactures in three different categories: low, mid, and high-range. The advantage of
using a mid or high-range water-reducer is that it will allow for improved performance
and increased slump without negatively affecting the setting times or air entrainment.
2.5.2. Low-Range (Regular) Water-Reducing Admixtures. An admixture may
be classifies as a Type A water-reducing admixture according to ASTM C 494 if it
reduces water requirements by at least 5%. ASTM C 494 is a performance specification
that sets the minimum for the decrease in water content required to achieve the same
slump as a control mix while maintaining other properties within the specified limits.
These water-reducers will achieve reductions of 5 to I 0% in water requirements. The
actual water reduction is based on several factors: type of admixture, cement fineness,
mix proportions, temperature of concrete, and time of addition.
2.5.3. Mid-Range Water Water-Reducers. In an effort to provide a wide range
of products that can work we11 in any application, admixture companies now offer
formulations that work between conventional concrete and flowing concrete. This is
genera11y defined as concrete that has a slump between 5 and 8 in. (125 and 200 mm)
These are called mid-range water-reducing admixtures, however, this classification is not
recognized by ASTM C 494.
2.5.4. Superplasticizers (High-Range Water-Reducers). In applications where
flowing concrete or a much higher amount of water reduction is required, a high range
water-reducing agent can be used. To be classified as a high-range water-reducing
admixture according to ASTM C 494, a water reduction must be achieved of at least 12-
30%. In some cases it may be used to achieve slumps greater than 8.5 in. ( 190 mm), in
which case it must conform to ASTM C 1017, which sets a performance limit in terms of
an increase in slump. Generally, most commercial products wi11 adhere to both
requirements but having both specifications allows for specifying specific performance
criteria in terms of the plasticizing effects.

14
High-range water-reducers are frequently used in the production of high-strength
concrete where w/c ratios of well below 0.40 and sufficient workability is required. In
some cases, such as in the production of SCC, these admixtures can be used without a
reduction in water to produce concrete with very high slumps. At these slumps, the
concrete flows like liquid and fills forms efficiently, requiring little or no vibration.
2.5.5. Water Reduction Mechanism. Water-reducing admixtures are composed
of negatively charged organic molecules that when added into a concrete mixture absorb
at the solid-water interface. In a concrete mixture, solid particles will have charges on
their faces, these may be positive, negative, or both. As the particles move past each
other during mixing, electrostatic attractions cause adjacent particles to flocculate. As the
particles move together, they trap a considerable amount of water leaving less water to
reduce the viscosity of the concrete. The water-reducing admixture works by
neutralizing the surface charges and causing all the particles to have the same charge.
This causes the particles to repel each other and disperse the water into the paste. This
allows the water to work harder in the mixture.
2.5.6. Effect on fresh concrete properties.
2.5.6.1 Flowing concrete. Improved flowability can be advantageous in several
different situations such as difficult placements, areas where adequate vibration cannot be
achieved, or even to improve the ease in placement. With the use of a high-range water
reducer, higher slumps can be achieved with mix proportions that are closer to a normal
concrete. This would not be easily achieved with conventional water reducers without
using oversanded mixes with high cement contents. This type of concrete is suited for
use in tremie placements, rapid pumping of concrete, and for SCC.
2.5.6.2 Slump loss. While the loss of slump can be a problem with any hi gh
slump concrete, it can be aggravated with the use of a high-range water-reducer. To
combat this problem, a second dose of the admixture can be added or the addition of the
admixture can be done immediately before placement. It should be noted that if repeat
additions are to be made, adequate time for mixing should be allowed for proper
blending. In extreme cases flash setting may occur but this can usually be alleviated by
delaying the addition of the admixture.

15
2.5.6.3 Set retardation. Regular and some mid-range water-reducing admixtures
can act as retarding admixtures. It is recommended that if a faster strength gain is
required, an accelerator be added to balance the effects of the water-reducer. In some
cases it has been noted that some non-retarding formulations can cause retardation if the
curing temperature is low enough.
2.5.6.4 Bleeding. Water-reducers that are based on hydroxycarboxylic acids tend
to increase bleeding. While these admixtures are formulated to improve concrete
workability, they may not improve the cohesiveness. To properly design a flowing
concrete, overdosing must be avoided as it can lead to bleeding and segregation.
2.5.6.5 Air entrainment. Whenever a regular water-reducing admixture is used,
less air-entraining admixture will be required. This is because the water-reducing
admixture coats the cement particles to reduce flocculation; this prevents the air
entraining admixture from being absorbed into the cement particles and makes the
admixture wholly available to act at the air-water interface. This is not the case with a
high-range water-reducer. These have air-detraining properties and to compensate for
this, more air-entraining agent must be added to obtain the same air content as before the
high-range water-reducer was added.
2.5. 7. Effect on hardened concrete properties.
2.5.7.1 Compressive strength. With the addition of water-reducing admixtures,
an increase of approximately 25 % in compressive strength can be seen over decreasing
the w/c ratio alone. These effects can be seen within 24 hours if the effects of
retardation do not occur. This increase in strength is due to the evenly dispersed particles
creating a more uniform microstructure. Some call this increasing the efficiency of the
cement.
2.5.7.2 High-strength concrete. High strengths can be achieved when the w/c
ratio is decreased below 0.40, but this cannot be done economically if the cement content
is raised too high and excessive heat is produced. The amount of cement must be kept at
normal levels with water-reducers maintaining the same slump.
2.5.7.3 Shrinkage. It has been stated that water-reducing admixtures increase the
drying shrinkage of concrete. Data to this effect has generally been conflicting and
variables such as cement type and the particular admixture make it difficult to make
general conclusions on the subject. It is often noted that the rate of shrinkage is
increased, however, after 90 days there is little difference in the shrinkage of concrete
made with a water-reducer to that of a control concrete.
16
2.5.7.4 Creep. As with shrinkage, there have been reports that increases in creep
have been measured but the data is still unclear and there are significant differences
between types and brands of admixtures. If creep values are critical, it is generally
recommended that testing be performed to assess the effects of the mix design with the
materials and admixtures that will be used.
2.6. VISCOSITY MODIFYING ADMIXTURES
Viscosity modifying admixtures are water-soluble polymers with a high
molecular weight. They are used to increase the viscosity of water. Since the water is
mixed within the concrete, this increases the cohesiveness of fresh concrete and reduces
the tendency to bleed and segregate. Viscosity modifying admixtures are useful for gap
graded mixes where large particles tend to segregate and sink within the mixture or when
improved lubricating properties are desired.
Materials that are commonly used to create viscosity-modifying admixtures are
polyethylene oxides, cellulose ethers, alginates, natural gums, and polyacrylamides or
polyvinyl alcohol.
In general an SCC that has a given w/cm ratio and low dosage of HRWRA will
exhibit a better static stability when a VMA is incorporated into the mix design .
Typically a VMA is not necessary in an SCC with a low w/cm ratio and/or high binder
content because it will tend to have proper stability already. If an SCC is designed to
have a relatively high w/cm ratio and/or low binder content a VMA should be added to
ensure adequate stability and robustness.
2.7. TEST METHODS
The characteristics that designers and finishers will be most interested in with
sec will be the concrete's ability to fill a mold, resi st segregation , flow through
congested areas or obstacles without segregation, and finishability. To that end, there

have been six tests that have been developed, specifically for sec, to determine these
characteristics.
2.7.1. Slump flow test. The slump flow test is a common procedure that can be
executed quickly and easily at a concrete plant or jobsite to find the free-flow properties
of the concrete in the absence of any obstructions. The procedure follows ASTM C
143/C 143M (2010). The concrete is placed in an inverted concrete slump cone in one
lift without any means of consolidation. The mold is then raised and the concrete is
allowed to flow out of the bottom of the cone. Two diameters are then measured,
perpendicular to each other, across the concrete. The average is then recorded as the
concrete's slump flow. The slump flow can be compared to the filling potential of the
concrete.
17
2.7.2. Visual stability index (VSI). After completion of the slump flow test, a
visual stability index reading can be performed on the concrete from the slump flow test.
This index is intended to provide a quick measurement of the concrete's stability. After
the slump flow is completed and diameters have been measured, a visual observation of
the concrete spread is noted and a VSI number of 0, 1, 2, or 3 is assigned. A reading of 0
or I should indicate that the concrete is stable, while a reading of 2 or 3 would indicate
that segregation could be an issue and producers should modify the mix to provide more
stability.
2.7.3. T50• During placement, the flow rate of SCC is influenced by the viscosity.
To find the relative measure of the unconfined flow rate, the Tso test can be performed.
A sample of concrete is placed in an inverted slump cone in one lift without any
consolidation. The cone is raised as would be done for a slump flow test and the time is
recorded in seconds that it takes for the outer edge of the concrete to reach a diameter of
20 in . A longer time would indicate that the mixture has a higher viscosity and a lower
flow rate.
2.7.4. J-ring. To test the ability of the concrete to remain cohesive while flowing
between obstacles, the passing ability of the concrete should be determined. The J -ring
can provide this information as well as being easy to run either in a plant or in the field.
Once again concrete is placed in an inverted slump flow cone in one lift with no
consolidation. The cone should be placed concentric with a J-ring so that as the cone is

raised, the concrete must flow through the ring. Two diameters are measured
perpendicular to each other and the average is recorded as the concrete's J-ring slump
flow. The larger the slump flow, the farther the concrete can travel through
reinforcement under its own weight.
18
2.7.5. L-box. In addition to the J-ring, the L-box test can also be used to
determining the confined flow characteristics of the concrete. The apparatus is made of a
horizontal and a vertical box in the shape of an L separated by a moveable gate. Concrete
is placed in the vertical box and after the gate is raised, the concrete flows past vertical
reinforcement and into the horizontal section. After flow has stopped, the height at the
end of the horizontal section is expressed as a proportion of whatever remains in the
vertical section. Should the concrete flow as easily as water, the ratio would be I, since
the two heights would be equal. The minimum ratio is considered to be 0., but as the
ratio approaches 1 the flow potential increases.
2.7.6. Column segregation. In addition to flowing abilities, both confined and
unconfined, segregation potential is also an important characteristic. To evaluate this
property, a column segregation test can be performed. The procedure is relatively
straightforward. A sample of fresh concrete is placed in a cylindrical mold in one lift
without any consolidation. The column is allowed to rest in the cylinder for a prescribed
period of time, and then the column is sectioned into three segments with the top and
bottom sections each accounting for a quarter of the total column volume. The concrete
that comes from the top and the bottom sections are washed over a No.4 sieve and the
masses from the top and bottom sections are determined. From this, the percent
segregation is calculated. No percent segregation has been set as acceptable, but it is
generally assumed that any value under 10% is tolerable.
2.8. SHEAR STRENGTH OF SCC
2.8.1. Hassan, Hossain, and Lachemi, 2010. An investigation was conducted
within the Civil Engineering Department of Ryerson University in Toronto, Canada to
study the shear strength, cracking behavior, and deflection characteristics of sec and
compare these results to NC. The test consisted of casting and testing 20 beams
containing no shear reinforcement under a three point loading condition. The variables

19
that were modified were the concrete type (SCC or NC), coarse aggregate content, beam
depth, and longitudinal steel reinforcement ratio. The performance was then evaluated
based upon several different factors such as the crack pattern and width, load at either the
first flexural or shear crack, ultimate shear resistance, post-cracking shear resistance and
ductility, load-deflection response, and failure mode. The conclusion was drawn from
the testing that in general, the shear strength of SCC is lower than that of NC. It was also
concluded that the current code-based equations are still valid for predicting the crack
width and first flexural cracking load and moment.
In general, the production of SCC involves increasing the fine aggregate content,
incorporating mineral admixtures, and/or using viscosity modifying admixtures. This
will result in a highly flowable mixture that will readily spread under its own weight with
minimal segregation. This reduces or even eliminates the need for vibrators to achieve
good compaction which will then in turn reduce the amount of labor during construction
and the possibility of errors.
At the beginning stages of SCC production, there were two main concerns on the
minds of engineers and designers regarding the concrete's shear strength. These were
that the concrete's best defense against shear, the coarse aggregate, had had been reduced
to promote flowability and passability, and the aggregate interlock mechanism was
weakened due to the smoother fractured surfaces formed during loading.
The experimental program consisted of testing twenty beams having a 400mm
width and shear span to total depth ratio (a/h) of 2.5. Ten of these beams were made
using SCC,ten were made using NC, and none of the beams contained any shear
reinforcement. Mix designs called for cement similar to an ASTM Type I and included
ground granulated blast furnace slag to be used as supplementary cementitious materials
for both types of concrete. Natural sand was used as a fine aggregate and a I 0 mm
maximum size crushed stone was used for the coarse aggregate. While the materials
were the same between the two mix designs, the amounts were varied. The SCC mixture
had 25% less aggregate by volume then the NC mixtures. The purpose of this change
was to investigate how much of an effect aggregate interlock had on shear strength. To
modify the flowability and the cohesiveness of the concretes, water reducers were used.
A high-range water reducer (HRWR) similar to a Type Fin ASTM C 494 was used for
the SCC mixture, and a water reducer (WR) similar to a Type A in ASTM C 494 was
used for the NC mixture.
20
The beam testing setup consisted of a three point loading configuration with a
hydraulic jack to gradually apply a concentrated load to the center of the beam. Four
linear variable differential transducers (LVDTs) were used to measure the shear strain by
attaching them diagonally to the front of the beam. Another LVDT was attached at the
beam's midpoint to record the deflection at that point. Electrical strain gages were
attached to the lower layer of steel reinforcement to measure the strain experienced by the
bars at that point. The use of a computer-aided data acquisition system was used to
record the load, displacements, and strains throughout the test. The beam was loaded in
three stages: at 50%, 75%, and 100% of the expected failure load.
To compare the shear strength between the SCC and NC beams, the ultimate
shear load first had to be normalized. This was accomplished by dividing the ultimate
shear load by the square root off' c for each type of concrete. It was then discovered that
the 25% lower coarse aggregate contend found in the SCC beams was the main cause of
lower ultimate shear loads in the beams. With less coarse aggregate, there was less
aggregate interlock. It was pointed out that these tests were conducted using
conventional strength concrete and results can only be applied to such at this point.
Should a higher strength concrete be used, the aggregate itself would fail rather than the
interface between the paste and the aggregate. This would mean that diagonal cracks
would have a shorter path to travel and a lower resistance due to aggregate interlock.
To observe how the mechanism on aggregate interlock and dowel action play into
the shear resistance of concrete from V d (development of first diagonal crack shear) to V u
(ultimate shear), the ratio of V JV d was calculated and studied for both types of beams.
This ratio helps to analyze the post-cracking shear resistance of concrete beams due to
aggregate interlock and dowel action. It was found that the ratios were lower for sec then for NC. This supports the theory that with less coarse aggregate, the SCC is unable
to develop the same amount of post-cracking shear resistance as NC.
The conclusions drawn from this set of experiments showed that there were
similarities between the two types of concretes as far as crack widths, heights, and angles,
as well as overall failure mode. This was as predicted by the reinforcement design and

21
the overall beam dimensions. It was found that the ultimate shear load increased as
longitudinal reinforcement increased while the ultimate shear stress decreased as the
overall beam depth was increased. One could conclude that the longitudinal steel keeps
the cracks together thereby increasing the aggregate interlock and increasing the ultimate
shear load. The shear stress reduction also can be explained. As the depth of the beam
increased, there was a larger area for the shear to act on . If the same load is applied over
a larger area one should expect the shear stress to decrease. The study also found that
when comparing the shear strength of SCC beams to NC beams, the SCC beams were
lower and this reduction was greater in deeper beams that contained lower longitudinal
steel rations. Once again the mix design for this test contained 25% less coarse aggregate
by volume within the SCC. With less aggregate interlock, there was a reduction in shear
strength. This reduction was increased even further by the reduction of longitudinal steel,
which allowed the cracks to open wider,further reducing the shear strength of the
concrete.
2.8.2. Kim, Hueste, Trejo, and Cline, 2010. In the paper entitled "Shear
Characteristics and Design for High-Strength Self-Consolidating Concrete," the effect of
a lower aggregate content, which is typically found in sec, was studied as it related to
the shear strength of the material. Push-off tests were performed to determine the
influence of aggregate and paste volumes on shear capacity. Thi s information was then
compared to NC samples.
It is known that shear strength of a reinforced concrete is dependent on the
contribution of both the shear strength of the concrete itself as well as the shear
reinforcement. If the strength of the concrete is reduced, the shear reinforcement will
have to be increased to support the load. The goal of this research program was to
determine if the current design equations were appropriate for estimating the shear
strength of the concrete and finding the amount of reinforcement that would be required .
Aggregate interlock is a significant contributor to concrete shear capacity. Therefore,
when the amount of coarse aggregate is reduced, as it typically is for SCC mixtures, the
shear strength is also reduced. When working with a high strength concrete, the strength
of the paste matrix is increased making it closer to the strength of the aggregate itself, and
as this happens more broken aggregate can be seen along the failure points. This means

22
that shear cracks in a high strength concrete will tend to travel through the aggregate
rather than around it as it would if a lower strength concrete were used. This would mean
that the distance that a crack would travel would be approximately the same regardless of
the amount of aggregate. Tests were performed to see if the effect on shear is the same
for high strength concrete as it is for lower strengths.
The variables that were tested were two 16-hour target strengths, two aggregate
types (river gravel and limestone), and three coarse aggregate volumes. This
combinations of these variables amounted to 12 SCC mixtures. The variables that were
tested for NC were two 16-hour target release strengths and two coarse aggregate
contents. This amounted to 4 NC mixtures to be used as control mixtures. A total of 48
push-off samples were fabricated and tested to determine shear characteristics as well as
(4X8) cylinders for determining the compressive and splitting tensile strength of the
concrete on the day of testing.
According to research performed by Mehta and Monterio (20 I 0), the absorptive
capacity of an aggregate can provide a rough estimate of the its strength. The more
absorptive an aggregate is, the less strength it should have. The absorption of the
aggregates that were used were both measured and it was found that the river gravel had
an absorption of 0.78% and the limestone had a absorption of 1.43%. The Los Angeles
abrasion test was also performed to see the relation between the resistance of the
aggregate to impact and its correlation to strength. The test involves loading a specific
gradation of the material being tested into a rotating drum with eleven steel spheres.
After the specified number of revolutions, typically 500, the drum is stopped and the
degraded sample is sieved and the percent lost is calculated. A material that has a higher
resistance to abrasion, and in turn a higher strength, will have a lower percent loss. When
the Los Angeles abrasion test was conducted on the river gravel and the limestone, the
percentages lost were 16 and 29 respectively. This data would tend to indicate that
because the limestone has a higher absorption and a higher percent loss it would be an
inferior material for shear resistance.
After the properties of the concrete aggregate had been determined, the concrete
could be batched and the fresh concrete properties could be determined. The tests that
were performed on the concrete included the filling ability, slump flow , flow rate (T50),
23
and YSI. These were all conducted in accordance with ASTM C 1611 . The slump flow
values that were measured stayed between 27.5 and 29.5 in. (699 and 749 mm). The air
content was between 0.8 and 1.6% and the T50 ranged between 1.0 and 7.0 seconds. The
YSI stayed between 0.5 and 1.0 indicating that this was a very stable mixture. This is
important in almost every sec application but it is especially important for shear testing
because the aggregate needs to be as homogenous as possible. If the aggregates settled to
the bottom, the shear values would be affected.
Push off tests were performed to find the shear strength of the concrete. This was
then divided by the normal strength to provide a quantifiable comparative assessment of
the amount of normalized energy due to the aggregate interlock. It was found that the
volume effect of the coarse aggregate can be considered as a significant effect. The
difference between the volume effect of river gravel and the volume effect of the
limestone aggregate could not be clearly found.
The 28-day compressive strengths all exceeded 10 ksi, indicating that they were
high strength concrete. The calculated values of the energy absorbed due to aggregate
interlock and the shear stress/ normal stress ratio decreased as the crack width or slip
increased. This shows that high strength concrete can exhibit aggregate interlock.
Visually it was seen that lower concrete strength specimens tended to have less coarse
aggregate fractures, this would lead to an increase in aggregate interlock. This could be
seen visually and also in the larger amount of energy that was absorbed. While high
strength concrete can still have some aggregate interlock, it is less than a lower strength
concrete. As the strength of the paste increases closer to the strength of the aggregate,
more aggregate is broken at failure, and if the aggregate fails, the result is less aggregate
interlock.
Aggregate type also showed that it was a critical factor when it came to aggregate
interlock. For all specimens, both SCC and NC, the river gravel showed more energy
absorbed indicating more aggregate interlock then the limestone. The type of aggregate
used is not the only factor that was important. The amount of the aggregate was also
influential to the aggregate interlock. As expected, the energy absorbed was higher for
concrete specimens that had a higher amount of coarse aggregate in them. This was true
regardless of the type of aggregate that was used.
While the research has shown there is a lower contribution to shear strength due
to aggregate interlock with sec made with lower coarse aggregate contents, it is yet to
be determined if this will require additional shear reinforcement. A study of typical
girders is planned to see if additional shear reinforcement is required for precast and
prestressed beams containing SCC. Also, the testing procedure did not test specimens
made from sec developed using chemical admixtures and higher coarse aggregate
contents.
2.9. OPTIMIZATION OF SCC
24
The paper entitled "Optimization and Performance of Air-Entrained Self
Consolidating Concrete" (Khayat, 2000) studied the mechanical and physical properties
of an optimized sec mixture as well as characteristics of sec that incorporated different
types and contents of cementitous materials. It was recognized that to achieve proper
bond to reinforcement, structural performance, and durability, it would be important that
SCC have a high stability. This stability would provide some resistance to blocking
when traveling through tight areas but also resistance to bleeding and segregation after
casting. It is known that air entrainment of sec can significantly reduce viscosity, which
can lead to a decrease in cohesiveness and resistance to segregation. The objective of
tests performed was to develop an air entrained concrete that still provided adequate
resistance to segregation.
To prevent segregation within a SCC mixture, a designer has several basic
options. The first is to increase the powder content, which will promote cohesiveness and
stability while reducing the demand for HRWRA. These powders could be cement or
supplementary cementitious materials and they work by increasing the packing density
and reducing the interparticle friction. The second defense against segregation, should
the designer choose not to modify materials or gradations, would be to ad a VMA in
addition to the HRWRA. Tests performed for this study included a combination of the
two mentioned above and attempted to find the proper dosages for HR WRA, air
entraining admixtures (AEA) and VMA, as well as testing different cementitious material
contents and their effects on fresh properties.

25
The first phase of the optimization process set out to find acceptable dosages for
HRWRA, VMA, and AEA. Variables that were studied in these nine batches were the
flowability and the stability of the concrete. After dosages for the chemical admixtures
were obtained, fourteen mixtures were prepared while varying the concentrations of
cementitious materials and VMA. There were three different cementitious material
contents tested and the water/cementitious material (w/cm) ratio ranged from 0.45 to 0.5.
Following this step, five mixtures were selected from the previous 14 that showed an
optimized balance of restricted deformability, resistance to surface settlement, HRWRA
and VMA demands, and cost. These concrete mixtures were then tested for compressive
strength, modulus of elasticity, drying shrinkage, rapid chloride-ion permeability, water
permeability, air-void system, and freezing and thawing durability.
As a result of the first nine tests, it was found that mixtures made without any
VMA and a moderate amount of cement experienced a relatively high settlement.
Surface settlement can be related to the concrete's resistance to segregation. It was seen
that with the addition of a VMA, there was an increased resistance to settlement for a
given w/cm.
At the conclusion of testing, it was seen that it is possible to proportion an air
entrained sec that will have high stability and resistance to blockage in congested areas.
It was also shown that even mixtures that had high slump flow values still maintained a
high resistance to surface settlements and a high stability. Regarding compressive
strength, it was shown that concrete made with a 0.45 w/cm outperformed those made
with a 0.5 w/cm. It was also seen that there was significant drying shrinkage even as a
result of the higher water content. This could have been due to the smaller coarse
aggregate content, leaving a larger paste volume which experiences shrinkage.
2.10. USE OF SUPPLEMENTARY CEMENTITIOUS MATERIALS IN SCC
Research performed by the Department of Civil Engineering at Gaziantep
University set out to investigate how the use of binary, ternary, and quaternary
cementitious blends of mineral admixtures could affect the properties of SCC. To find
these relationships, 22 sec mixtures were designed and cast to find an optimal mixture
proportion. The control mixture contained only Portland cement while other mixtures
incorporated blends of Portland cement (PC), fly ash (FA), ground granulated blast
furnace slag (GGBFS), and silica fume (SF).
26
Research performed prior to testing showed that incorporation of pulverized FA
and limestone powder had lessoned the amount of HRWRA required to achieve the
desired slump. By incorporating these materials into the concrete mixture, the powder
content was increased, improving the rheological properties of the concrete and
improving the concrete's stability. One other benefit that was discovered was that
because of the slower reaction of the supplementary cementitious materials, there was a
reduced risk of concrete cracking due to heat of hydration, making the concrete more
durable. Research has shown that blends of different cementitious cementitious materials
such as these have shown beneficial results for concrete, so testing with a sec was
necessary while looking at characteristics such as self compactibility, targeted strength,
and durability.
Testing showed that compressive strengths for concrete produced with a 60%
replacement of PC with FA, the compressive strength was reduced approximately 40%.
This could be corrected with the appropriate use of mineral admixtures. It was also seen
that a SCC made with I 0% FA and I 0% GGBFS had the highest strength. This showed
that the use of FA will generally lead to a reduction in strength, however, SCC made with
GGBFS and/or SF will generally have strength comparable to concrete made with PC
alone.
Shrinkage testing showed that within approximately the first I 0 days of curing, all
concretes preformed approximately the same. At that point it can be clearly seen that
concrete produced with FA or GGBFS had lower shrinkage values. It was also seen that
as the amount of mineral admixtures continued to increase, the amount of shrinkage
continued to decrease.
Conclusions drawn from testing showed that incorporating mineral admixtures
into concrete will improve the filling and passing abilities of SCes. This could be seen
by the increased H2/H 1 ratios for concrete made with these materials. Also as expected,
the T so slump flow times were decreased showing that the concretes had a hi gher filling
ability and flowability. Overall there are real benefits to adding these cementitious

27
materials to sec and generally as long as mixture proportioning is performed mindful of
any negative effects that can be overcome.
2.11. TEMPERATURE INFLUENCES ON SCC
In the paper entitled "Influence of Temperature on Fresh Performance of Self
consolidating Concrete" researchers studied the effects of hot and cold weather on the
properties of fresh and hardened concrete properties. The scope of the study attempted to
test the unconfined workability, flow rate, passing ability, and dynamic stability of sec throughout a range of temperatures that concrete is typically placed. On this project,
three mix designs were tested, all having the same amounts of cement, fly ash, coarse and
fine aggregates, and w/cm. The amounts of HRWRA and VMAs were modified to see
their relative effects on workability at different temperatures. The three mix designs were
then tested at 7 different temperatures ranging from -0.50 to 43.00°C (3 1.1 to I 09.4°F),
and the fresh and hardened concrete properties were determined for comparison.
It is known that cold temperatures wi11 affect fresh and hardened performance of
concrete by decreasing the workability, and retarding the setting and strength gain of
concrete. If the effect of cold concrete is known more precisely it can be determined if it
is necessary to heat the water or the aggregates to eliminate the adverse effects of cold
materials. Cold temperatures are not the only problem; temperatures that are too warm
can lead to accelerated setting and lower long term strength and hardened properties.
Workability can be an issue if the temperature is high enough and the relati ve humidity is
low, causing rapid evaporation of the free water. If concrete is placed in hot weather, the
temperature can be cooled by simple methods such as adding ice to the mi x water,
shading the coarse aggregate, or adding more water to the mix design. If these methods
are not enough, the use of plasticizers and super plasticizers can be better remediation
materials in hot weather conditions on the job site instead of water.
It was seen that the performance of self-consolidating concrete was affected by
both hot and cold temperatures. At hot temperatures, the concrete experienced a
decrease in unconfined workability, increase in plastic viscosity, and improvement in
stability. It was also seen that these performance issues could be overcome by over
dosage of the admixtures to reverse the changes in the fresh properties.

28
Concrete that was poured in colder temperatures was not affected as much as
concrete poured at higher temperatures. Concrete poured at -0.5°C (31.1 °F) did not
require and remediation by way of admixture addition. The gains in slump flow at lower
temperatures were less than l in. (25 mm) and the flow rate and dynamic segregation
resistance were unaffected.
Following testing the data was plotted and equations were developed to correlate
the slump flow loss or gain due to hot and cold temperatures. These showed significant
statistical relationships between the dependent and independent variables. These
equations could be applied to determine the required optimum admixture dosages given
the ambient temperature at placement.
2.12. SEGREGATION OF SCC
In the paper entitled "Effect of Mixture Design Parameters on Segregation of
Self-Consolidating Concrete" (Hassan, 2006) researchers wanted to present a simple test
method to assess the ability of SCC mixtures to resist segregation. The proposed test
required the use of an apparatus consisting of a PVC tube 12 in. (305 mm) in height with
a 6 in. ( 152 mm) diameter. The apparatus is broken down into four 4in. tall sections
using leak-free joints that are hinged to a vertical steel rod for easy sliding. The
penetration apparatus was modified slightly from four penetration heads instead of one
and was mounted on a steel frame. Each head is approximately 25g (0.05 lb.) and 0.78
in. (20 mm) in diameter with a semi-spherical end. For the first segregation test, the four
penetration heads are allowed to penetrate the concrete under their own weight just after
the cylinder is filled and the depth is measured. After sitting for 30 minutes, the concrete
in each part is washed over a 3/8 in. sieve. Anything trapped on the 3/8 in. sieve is
retrieved and the mass is determined.
The experimental program consisted of 123 flowable concrete mixtures with an
initial slump flow of 20±0.4 to 30±0.4 in. (500±10 to 750±10 mm). The screen stability
test was performed as well as the proposed segregation method on the concrete. In
addition to these, the slump-flow, T so, L-Box test, V -funnel test, and compression
strength test were performed to determine the properties of the concrete. Concrete
mixtures were prepared in accordance with ASTM C 192-00 "Standard Practice for
Making and Curing Concrete test Specimens in the Laboratory.
29
This research showed that the ability of SCC to resist segregation decreases
whenever the w/cm or the dosage of HRWRA is increased. This is especially evident
whenever the w/cm was greater than 0.45. To combat the concrete's inability to resist
segregation, a VMA can be used and testing showed that as expected for a given w/cm
and HR WRA dosage, as VMA dosage increases segregations decreases. It was seen that
there was a point beyond which segregation was effectively controlled.
The coarse/total aggregate ratio showed a slight to negligible effect on the ability
of sec to resist segregation whereas the total content of cementitious materials had a
mixed effect on segregation. It was seen that at a high w/cm increasing the cementitious
materials caused an increase in segregation while at a lower w/cm increasing the content
of cementitious materials slightly enhanced the concrete ' s resistance to segregation.

30
3. SCC MIX DEVELOPMENT
3.1. INTRODUCTION
There are two different approaches to developing an SCC mix design. The first is
a materials based approach which focuses on modifying the aggregate types and amounts.
Typically the coarse aggregate content is reduced while the paste content is increased.
To improve the flowability of the aggregate a rounder aggregate is typically desired. The
rounder shape allows the aggregate pieces to roll past each other easier increasing slump.
The disadvantages to this approach are that the rounder aggregate decreases the shear
strength of the concrete. With a lower coarse aggregate content the aggregate pieces are
farther apart reducing aggregate interlock, and as a result shear strength is reduced. The
reduction in aggregate interlock can also be caused by the rounder aggregate; sharp edges
on aggregates tend to hold together better then rounded edges.
The try and avoid the reduction in shear strength a second chemically-based
approach was utilized for this project. The coarse aggregate and paste contents were kept
the same as a NC. The ACI 211.1 document entitled "Standard Practice for Selecting
Proportions for Normal , Heavyweight, and Mass Concrete" was used to develop a mix
design. This mix design was then modified through the use of a HRWR and a VMA.
This allowed for improved flowability without sacrificing on aggregate interlock.
3.2. BASE MIX DESIGN
Before testing could begin to test for concrete shrinkage or shear strength a self
consolidating concrete mix design had to be developed. Concrete materials that were
local and readily available were preferred and used for testing. During the mix
development stage there were 15 batches created to determine the effects of different
variables tested.
For a point of comparison a NC mixture was desired. To achieve this, the ACI
21 1.1 committee report was used, referred to as ACI committee report here. First a
slump was assumed to be 6 in. (!52 mm). This is larger than the recommended slump in
Table 6.3.1, however, keeping in mind that the overall goal is to create a SCC mixture a
higher slump was selected to further improve tlowability. After a slump is known the

approximate water and air content requirements can be determined. A gradation of the
coarse aggregate to be used showed that the nominal max size was 1 in. (25.4 mm).
31
Using this information combined with the desired slump, a water content of 340 pounds
per cubic yard was determined. A w/c ratio was the next step in the process; 0.45 was
selected since high strength concrete was not required and a high coarse aggregate
content was being used. In addition, a more angular aggregate combined with a low w/c
ratio could be enough to prevent the admixtures from producing SCC. Using the w/c
ratio and the water content the amount of cement was determined. To maintain a high
shear strength it was important that the coarse aggregate content be kept the same for all
types of concrete being tested. The amount of coarse aggregate was determined by
referring to Table 6.3.6 of the ACI committee report. Using the fineness modulus of the
fine aggregate and the nominal maximum size of the coarse aggregate the coarse
aggregate content was determined. The last step in the creation of the base mix design
was to find the fine aggregate content. This was done by summing the volumes per cubic
yard for the water, cement, and coarse aggregate and subtracting them from 1 cubic yard .
It was known that the efforts to preserve the shear strength of the concrete would
compromise the flowabilty of the concrete mixture. This made it important that in any
area possible changes be made to increase slump. One area that was selected was air
content. By increasing the amount of air entrained within the concrete it was possible to
obtain a slight increase in slump with minimal sacrifice to shear strength. Typically with
a I in. (25.4 mm) maximum aggregate size an air content of approximately 1.5 percent
can be expected; this is usually from air trapped during the mixing process. An air
content of approximately 6 percent was desired so an air entraining admixture became
necessary. Micro Air, produced by the BASF chemical company was selected to achieve
the desired air content. Trial batches were produced and tested to determine the dosage
of the admixture that would produce a 6 percent air content. Another benefit achieved
through the addition of a air-entraining admixture is that the air bubbles are more evenly
spaced throughout the concrete and uniform in size. This adds to the concretes durability
as well as the flowabilty in the fresh state.

32
3.3. ADDITION OF FLY ASH TO BASE MIX.
3.3.1. Fly ash effects. To begin mix design development it was important to
observe what type and how much of an effect that a class C fly ash would have on the
plastic and hardened properties of concrete. Fly ash was obtained from the Labadie
Power Plant in Labadie, Missouri for testing. It is known that fly ash particles are shaped
similar to microscopic spheres allowing them to act like small ball bearings when added
to the concrete mixture. This will tend to increase the slump of the mixture with
everything else the same. Since the overall objective is to create a self consolidating
concrete, the use of fly ash can be helpful because it is less expensive then cement or high
range water reducers but can still provide a moderate increase in the slump and
workability of the concrete. There is a tradeoff that must be taken into account when
working with fly ash; because fly ash is a pozzolan and it requires the Calcium
Hydroxide from other cementitious materials for a reaction, the strength gain will take
longer.
3.3.2. Test batches. The effect fly ash would have at different amounts of cement
replacement was the first piece of information that was to be determined. A control
mixture, referred to as the base in Table 3.1, was created and compared to concrete with
different fly ash replacements. This control mixture had a w/c ratio of 0.45, a design
slump of 6-in., and a nominal maximum coarse aggregate size of 1- in. An air entraining
admixture was added to achieve an air content of 6 percent. Three other concrete batches
were performed with the same mix designs except that cement was replaced with flyash
by 20, 30, and 40 percent respectively. The batch weights for these concrete mixtures can
be seen in Table 3.1.
3.3.3. Test results. Following hatching the slumps and air contents were taken on
the concrete in the plastic state. The compressive strength was found at 7 and 28 days. It
can be seen in Figure 3.1 that the fly ash increased the slump of the concrete dramatically
from the control to 20%. It was also noted that increasing the fly ash replacement beyond
30% did not have a significant effect on the slump or the workability of the concrete; in
fact the graph shows there was a decrease in slump. The compression test data was also
plotted and is shown in Figure 3.2. It showed that at 7 days, as the amount of fly ash
increased, compression strength decreased. When compression testing was performed at
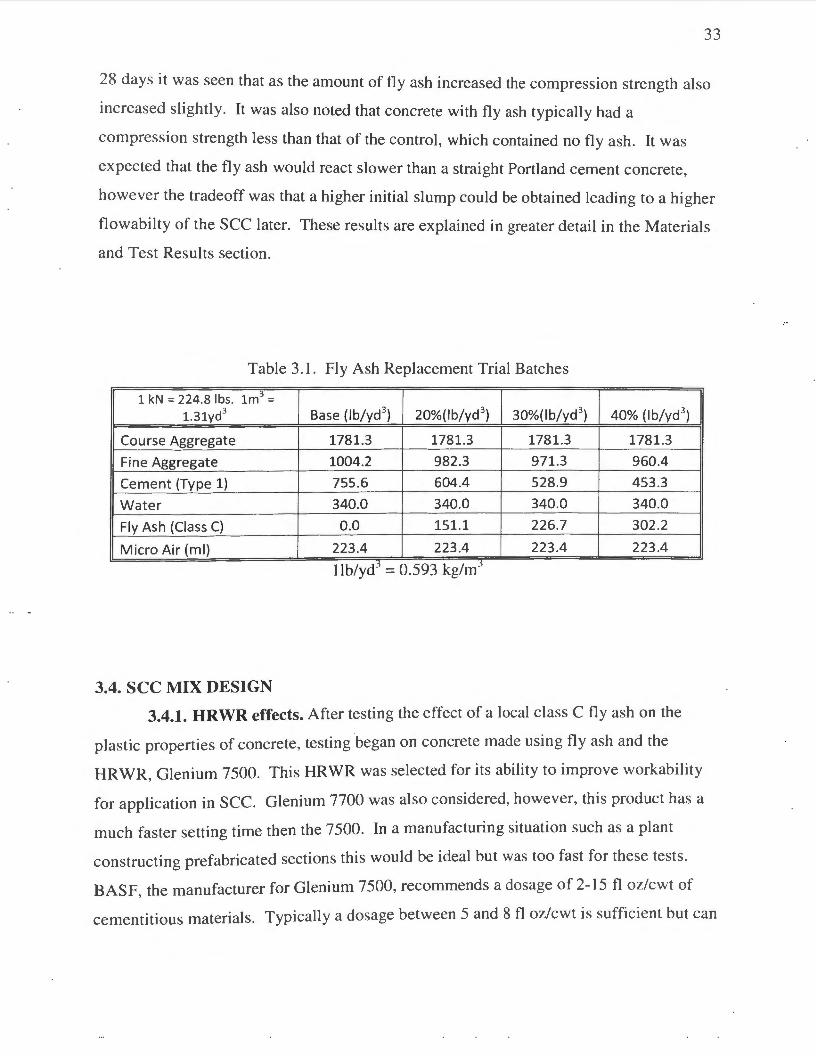
33
28 days it was seen that as the amount of fly ash increased the compression strength also
increased slightly. It was also noted that concrete with fly ash typically had a
compression strength less than that of the control, which contained no fly ash. It was
expected that the fly ash would react slower than a straight Portland cement concrete,
however the tradeoff was that a higher initial slump could be obtained leading to a higher
flowabilty of the SCC later. These results are explained in greater detail in the Materials
and Test Results section.
Table 3.1. Fly Ash Replacement Trial Batches
.1. 224.8 lbs. 1m3
1.31yd3 Base (lb/yd3) 20%(1b/yd3) 30%(1b/yd3 ) 40% (lb/yd 3 )
Course Aggregate 1781.3 1781.3 1781.3 1781.3
Fine Aggregate 1004.2 982.3 971.3 960.4
Cement (Type 1) 755.6 604.4 528.9 453.3
Water 340.0 340.0 340.0 340.0
Fly Ash (Class C) 0.0 151.1 226.7 302.2
Micro Air (ml) 223.4 223.4 223.4 223.4 ,_j Jlb/yd = 0.593 kg/m j
3.4. SCC MIX DESIGN
3.4.1. HRWR effects. After testing the effect of a local class C fly ash on the
plastic properties of concrete, testing began on concrete made using fly ash and the
HRWR, Glenium 7500. This HRWR was selected for its ability to improve workability
for application in SCC. Glenium 7700 was also considered, however, this product has a
much faster setting time then the 7500. In a manufacturing situation such as a plant
constructing prefabricated sections this would be ideal but was too fast for these tests.
BASF the manufacturer for Glenium 7500, recommends a dosage of 2- 15 fl oz/cwt of '
cementitious materials. Typically a dosage between 5 and 8 fl oz/cwt is sufficient but can

34
be increased for use in sec applications and depending on concrete materials, and jobsite
conditions and applications.
10
8
-:§. 6 0. E 4 :I Vi
2
0
0 20 30 40
Percent Fly Ash Replacement
Figure 3.1. Slumps at Different Fly Ash Replacements
8000 50 '2 0
Q.. "' Q.
40 ~ - 6000 -..c: ..c: .....
OIJ 30 ..... = OIJ 4000 = a.l a.l "" 20 ..... "" rFJ .....
en a.l 2000 10 a.l ~ "fi.i ~
"' 0 "(i.i
a.l
"' 0 a.l "" "" Q. Q. E 0 20 30 40 E 0 0 u
Percent Cement Replacement (%) u
• 7 Day • 28 Day
F. 3 2 Concrete Compressive Strength With Fly Ash Replacement 1gure ..

35
3.4.2. Test batches. To see the effect of the Glenium 7500 three dosages were
selected: 2, 6, and 9 fl oz/cwt. The concrete mix design was kept the same as previous
testing with a cement replacement of 30%. The cement replacement was selected to
balance the benefits of increased slump with the disadvantages of slower strength gain .
After mixing, the following tests were performed on the fresh concrete: slump flow, J
ring, segregation column, unit weight, and air content. The information that was gleaned
from these tests can be seen in the Table 3.2.
3.4.3. Test results. It was seen right away that concrete produced with a dosage
of 2 fl oz/cwt, the lowest recommended by the manufacturer, would not be sufficient to
produce a SCC, in fact a slump was taken instead of a slump flow. Even so, a slump of
6.75 in. ( 171 mm) was still high for a small dosage. The following tests showed much
more promise; each one produced a slump flow of 25 in (635 mm). One could argue that
a dosage of 6 fl oz/cwt would be the optimized dosage; it provided the maximum slump
flow with the minimum amount of chemical admixture used. This was taken into
account, but since a VMA was to be added later the higher dosage, 9 fl oz/cwt, was
selected to proceed. The higher dosage of HRWR would hopefully offset any reduction
in slump flow from the VMA.
Table 3.2. HRWR Trial Batches
J-Ring Static Unit
Dosage Slump Slump Flow Flow Segregation Air Weight
Admixture (fl oz/cwt) (in) (in) (in) (%) (%) (lb;te)
Glenium 7500 2.0 6.75 24.0 12.3 6.0 143.1
Glenium 7500 6.0 25.0 24.0 12.3 6.1 142.0
Glenium 7500 9.0 25.0 23.50 51.7 4.0 141.0
I in. = 25.4 mm I lb/ft3 = 16.0 I kg/m3
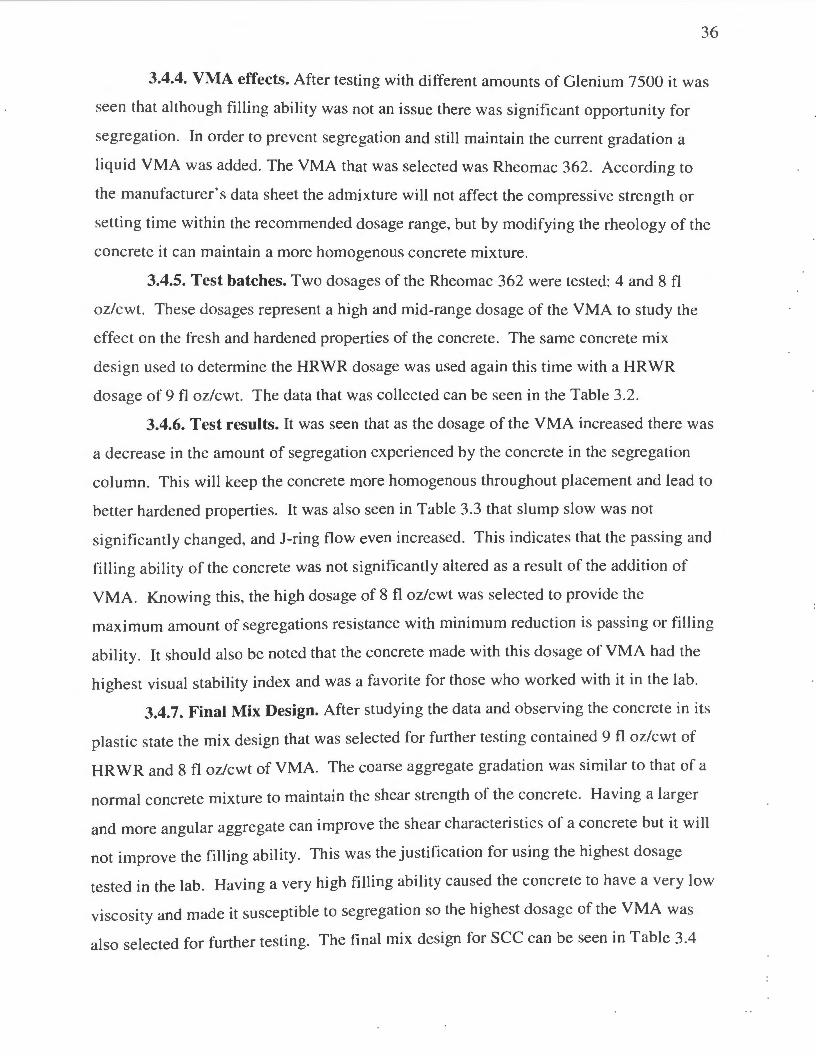
36
3.4.4. VMA effects. After testing with different amounts of Glenium 7500 it was
seen that although filling ability was not an issue there was significant opportunity for
segregation. In order to prevent segregation and still maintain the current gradation a
liquid YMA was added. The VMA that was selected was Rheomac 362. According to
the manufacturer's data sheet the admixture will not affect the compressive strength or
setting time within the recommended dosage range, but by modifying the rheology of the
concrete it can maintain a more homogenous concrete mixture.
3.4.5. Test batches. Two dosages of the Rheomac 362 were tested: 4 and 8 fl
oz/cwt. These dosages represent a high and mid-range dosage of the VMA to study the
effect on the fresh and hardened properties of the concrete. The same concrete mix
design used to determine the HRWR dosage was used again this time with a HRWR
dosage of 9 fl oz/cwt. The data that was collected can be seen in the Table 3.2.
3.4.6. Test results. It was seen that as the dosage of the VMA increased there was
a decrease in the amount of segregation experienced by the concrete in the segregation
column. This will keep the concrete more homogenous throughout placement and lead to
better hardened properties. It was also seen in Table 3.3 that slump slow was not
significantly changed, and J-ring flow even increased. This indicates that the passing and
filling ability of the concrete was not significantly altered as a result of the addition of
VMA. Knowing this, the high dosage of 8 fl oz/cwt was selected to provide the
maximum amount of segregations resistance with minimum reduction is passing or filling
ability. It should also be noted that the concrete made with this dosage of VMA had the
highest visual stability index and was a favorite for those who worked with it in the lab.
3.4.7. Final Mix Design. After studying the data and observing the concrete in its
plastic state the mix design that was selected for further testing contained 9 fl oz/cwt of
HRWR and 8 fl oz/cwt of VMA. The coarse aggregate gradation was similar to that of a
normal concrete mixture to maintain the shear strength of the concrete. Having a larger
and more angular aggregate can improve the shear characteristics of a concrete but it will
not improve the filling ability. This was the justification for using the hi ghest dosage
tested in the Jab. Having a very high filling ability caused the concrete to have a very low
viscosity and made it susceptible to segregation so the highest dosage of the YMA was
also selected for further testing. The final mix design for SCC can be seen in Table 3.4
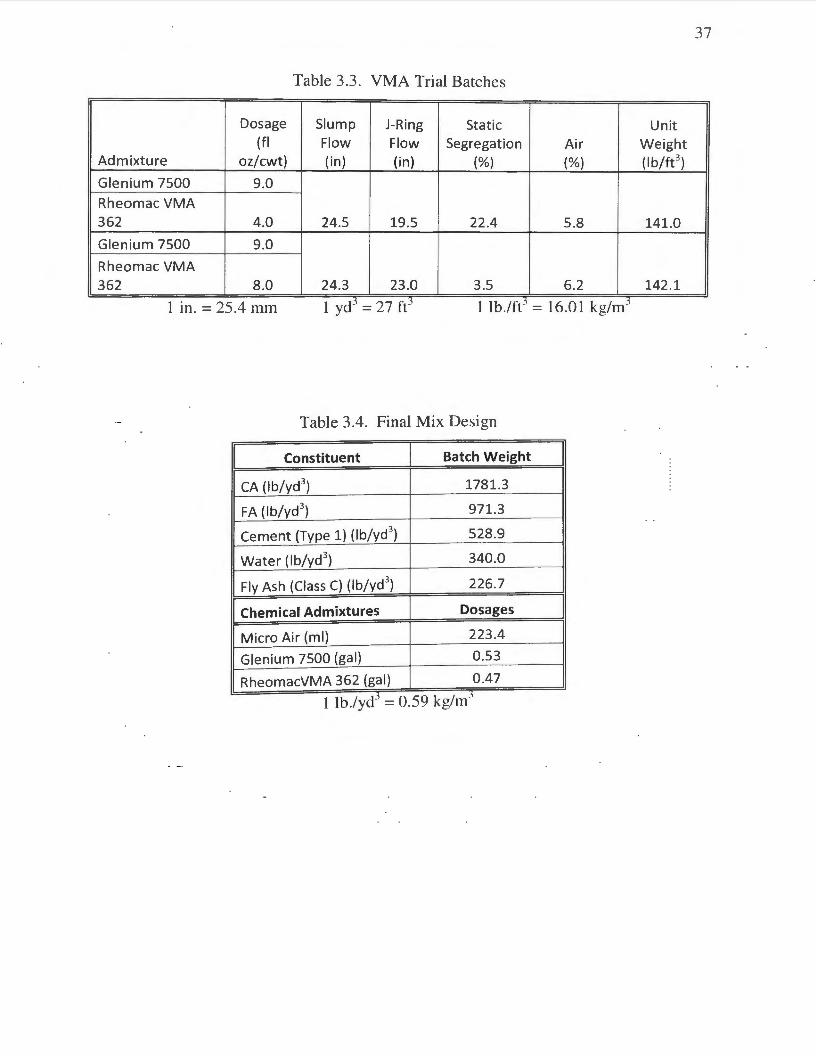
37
Table 3.3. VMA Trial Batches
Dosage Slump J-Ring Static Unit (fl Flow Flow Segregation Air Weight
Admixture oz/cwt) (in) (in) (%) {%) (lb;te)
Glenium 7500 9.0 Rheomac VMA 362 4.0 24.5 19.5 22.4 5.8 141.0
Glenium 7500 9.0
Rheomac VMA 362 8.0 24.3 23.0 3.5 6.2 142.1
, J ,J ,J - j I m. = 25.4 mm I yd =27ft I lb./ft - 16.01 kg/m
Table 3.4. Final Mix Design
Constituent Batch Weight
CA (lb/yd3) 1781.3
FA (lb/yd3) 971.3
Cement (Type 1) (lb/yd3) 528.9
Water (lb/yd3) 340.0
Fly Ash (Class C) (lb/yd3) 226.7
Chemical Admixtures Dosages
Micro Air (ml) 223.4
Glenium 7500 (gal) 0.53
RheomacVMA 362 (gal) 0.47 , J -
j
I lb./yd - 0.59 kg/m

38
4. MATERIAL TESTING PROGRAM
4.1. INTRODUCTION
In order to compare the properties of NC and SCC, material test results were
required. This section details the testing program that was conducted for both types of
concrete. The tests that were performed on the fresh concrete include: density, air
content, slump flow, J-ring, L-box, and segregation column. The tests that were
performed on the hardened concrete include: compressive strength, modulus of rupture,
shrinkage, and shear strength. In addition to these tests, the tensile strength and
modulus of elasticity for the reinforcement steel was also determined. This chapter
details the testing methods and results for the density, air content, slump flow, J-ring, L
box, segregation column, compressive strength, and modulus of rupture. Chapter 5
details shrinkage testing of the NC and sec and includes comparisons with several
prediction models. Chapter 6 details the shear testing and evaluation of both the NC and
sec. 4.1.1. Casting. All concrete was placed on the Missouri S&T property. The
concrete required for the shear specimens is more then what could be reasonably
produced on site so this was delivered by Rolla Ready Mix, located in Rolla, MO.
Concrete was batched at the plant and liquid admixtures were added and mixed on site.
Nine concrete cylinders were cast for each placement and stored near the shear specimens
to have them experience the same temperature and atmospheric conditions. Concrete
produced for compression testing, flexural strength, or any sec fresh property testings,
was typically produced in much smaller quantities in the Missouri S&T Concrete Lab,
located in the Butler-Carlton Civil Engineering Hall.
4.1.2. Curing Conditions. After initial hardening, the shear specimens were
moist cured for 7 days. A layer of wet burlap followed by a layer of plastic sheeting was
placed over the beams to prevent drying and shrinkage cracking. For some concrete, it
was observed that minor plastic shrinkage cracking occurred before water was applied to
the surface. Specimens were moist cured in this condition for approximately 7 days after
which they were removed from their forms to continue curing for a minimum of 28 days
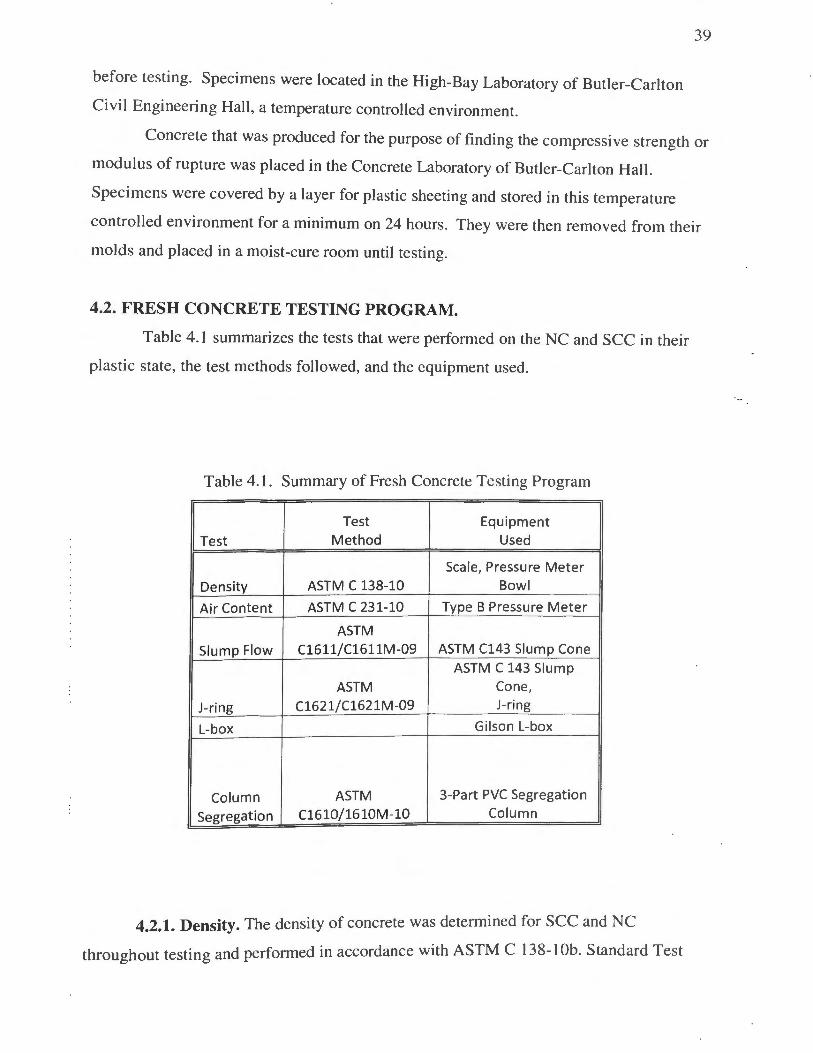
before testing. Specimens were located in the High-Bay Laboratory of Butler-Carlton
Civil Engineering Hall, a temperature controlled environment.
39
Concrete that was produced for the purpose of finding the compressive strength or
modulus of rupture was placed in the Concrete Laboratory of Butler-Carlton Hall.
Specimens were covered by a layer for plastic sheeting and stored in this temperature
controlled environment for a minimum on 24 hours . They were then removed from their
molds and placed in a moist-cure room until testing.
4.2. FRESH CONCRETE TESTING PROGRAM.
Table 4.1 summarizes the tests that were performed on the NC and SCC in their
plastic state, the test methods followed, and the equipment used.
Table 4.1. Summary of Fresh Concrete Testing Program
I Test I Test
I Equipment
I Method Used
Scale, Pressure Meter
Density ASTM C 138-10 Bowl
Air Content ASTM C 231-10 Type B Pressure Meter
ASTM
Slump Flow C1611/Cl611M-09 ASTM C143 Slump Cone ASTM C 143 Slump
ASTM Cone,
J-ring Cl621/Cl621M-09 J-ring
L-box Gilson L-box
Column ASTM 3-Part PVC Segregation
Segregation C1610/1610M-10 Column
4.2.1. Density. The density of concrete was determined for SCC and NC
throughout testing and performed in accordance with ASTM C 138-1 Ob. Standard Test

40
Method for Density (Unit Weight), Yield, and Air Content (Gravimetric) of Concrete
(ASTM C 138.201 0). Concrete was placed in the base of the pressure meter pot used for
determining the air content of the concrete. Concrete was placed in three lifts and was
rodded 25 times each. The weight of the pot and concrete was taken and the concrete
was removed. The empty pot was weighed and subtracted from the previous
measurement to find the weight of the concrete alone. The weight of the concrete was
divided by the known volume of the pot to determine the density of the concrete.
The density of the concrete typically measured approximately 146 Ib/ft3 (2340
kg/m3). There were slight variations from batch to batch, but there was not a significant
difference between the NC and SCC.
4.2.2. Air content. The air content of the concrete was determined for SCC and
NC in accordance with ASTM C 231-10. Standard Test Method for Air Content of
Fresh I y Mixed Concrete by the Pressure Method (ASTM C 23 I, 20 I 0). A Type B
pressure meter was used to find the air content of the concrete. Concrete was placed in
three layers, similar to performing the density test, and rodded 25 times each. The
concrete was struck off and the rim of the bowl was cleaned to ensure a good seal
between the bowl and the lid of the meter. After the lid was clamped to the bowl, water
was inserted into one petcock valve until it flowed out the petcock valve on the opposite
side. The valves were both closed and air was pumped into the chamber until the
appropriate initial pressure was obtained. The pressure was then released by opening the
valve into the bowl and a reading was taken using the gage on the meter. To find the air
content of the concrete, the aggregate correction factor was subtracted from the
measurement taken off of the gage.
During mix design, it was determined that an air content of 6 percent was desired
for both types of concrete. Test batches of concrete were produced and the dosage of the
air-entraining admixture was adjusted to achieve the correct amount of air. By adding
more air to the concrete, the slump was increased, thus increasing the concrete 's
workability and finishability.
4.2.3. Slump flow. Slump flow testing was performed on fresh self-consolidating
concrete in accordance with ASTM Cl611-161 1M. Standard Test Method for Slump
Flow of Self-Consolidating Concrete (ASTM C I 611, 2009). The equipment that was

41
used for this test was a standard slump cone conforming to ASTM C 143-1 Oa. Standard
Test Method for Slump of Hydraulic-Cement Concrete (ASTM Cl43, 2010) and a
nonabsorbent, smooth, rigid base plate having a minimum diameter of 36 in. (915 mm).
The slump flow was performed on a flat, level surface and filled using Filling Procedure
B (Inverted Mold). The mold was filled in a continuous manner and the top surface was
struck off. The mold was then raised in a steady upward lift with no lateral or torsional
motion. After movement of the concrete stopped, two diameters were measured
approximately perpendicular to each other and averaged for the slump flow. Figure 4.1
shows the mold being raised in a steady upward lift, and Figure 4.2 shows the diameter of
the concrete being measured.
Figure 4.1. Raising the Mold During Slump Flow Test
The slump flow test is a measure of a concrete mixture's filling ability or the
ability of the concrete to flow into and fill completely all spaces within the form work
under its own weight. The test was performed similarly to the conventional slump test
but instead of measuring the slump distance vertically the spread of the concrete
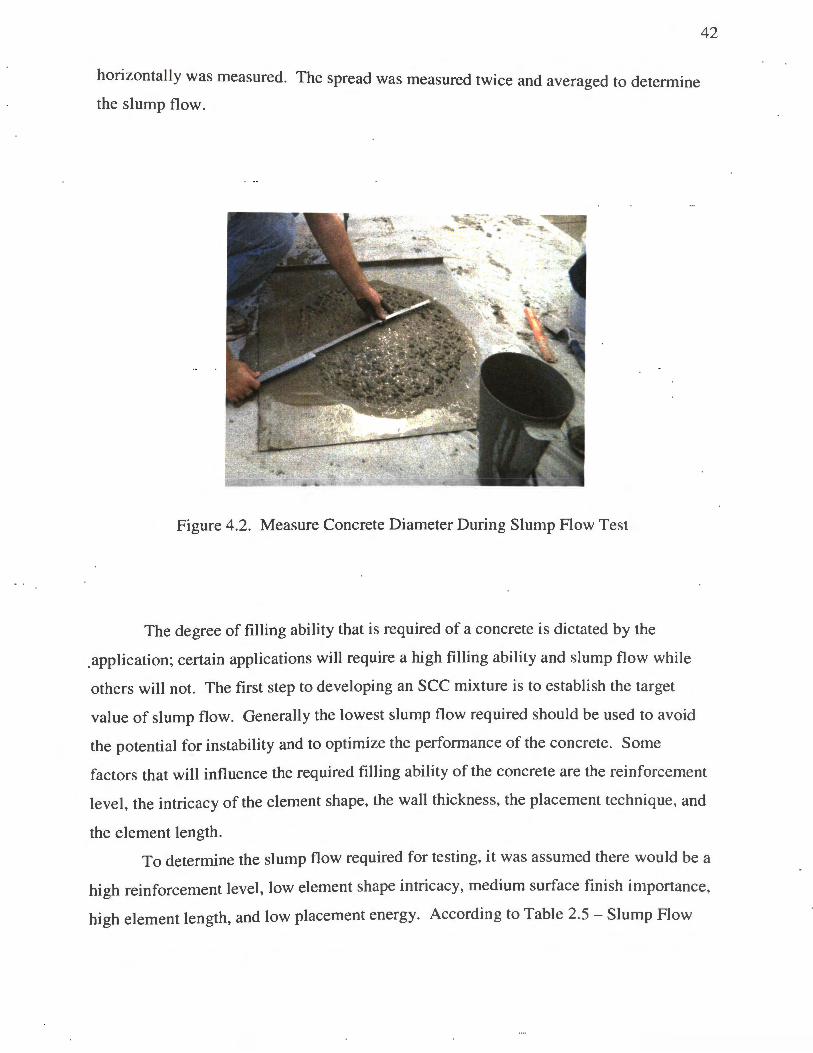
horizontally was measured. The spread was measured twice and averaged to determine
the slump flow.
Figure 4.2. Measure Concrete Diameter During Slump Flow Test
42
The degree of filling ability that is required of a concrete is dictated by the
_application; certain applications will require a high filling ability and slump flow while
others will not. The first step to developing an SCC mixture is to establish the target
value of slump flow. Generally the lowest slump flow required should be used to avoid
the potential for instability and to optimize the performance of the concrete. Some
factors that will influence the required filling ability of the concrete are the reinforcement
level, the intricacy of the element shape, the wall thickness, the placement technique, and
the element length.
To determine the slump flow required for testing, it was assumed there would be a
high reinforcement level, low element shape intricacy, medium surface finish importance,
high element length, and low placement energy. According to Table 2.5- Slump Flow

43
Targets in ACI 237R-07, the target slump flow should be between 22 and 26 in. (559 and
660 mm).
To begin, testing was conducted using the same base concrete mix design and
modifying the dosage of HRWR. This can be seen in Table 4.2. The HRWR that was
used was Glenium 7500 and the dosages tested were 2, 6, and 9 fl oz/cwt. The
manufacturer, BASF chemicals, recommends a dosage of 2 to 15 fl oz/cwt. To save on
cost, the lowest dosage required to meet the required slump flow was desired, so an upper
limit of 9 fl oz/cwt was checked as well as 6 fl oz/cwt.
As shown in Table 4.2, the lowest dosage of 2 fl oz/cwt did not produce a
concrete that could be tested with a slump flow test. Instead, a traditional slump test was
performed and the slump of the concrete recorded. At a dosage of 6 and 9 fl oz/cwt, a
highly flowable concrete was produced with a slump flow of 25 in. (635 mm). To ensure
that adequate slump flow was achieved and not lost with the addition of a VMA, the
higher dosage, 9 fl oz/cwt, was selected for further testing. While it was the highest
dosage tested for this research, it is still well within the manufacturer's suggested dosage
and provides the required flowability .
Table 4.2. HR WR Dosages
Dosage Slump Slump Flow
(fl oz/cwt) (in) (in)
Admixture
Glenium 7500 2 6.75
Glenium 7500 6 25
Glenium 7500 9 25
I m. = 25.4 mm

44
4.2.4. Passing ability. The passing ability of the self-consolidating concrete was
found by performing the J-ring test in accordance with ASTM C 1621-09b. Standard Test
Method for Passing Ability of Self-Consolidating Concrete by J-Ring (ASTM C 1621 ,
2009). The equipment that was used for this test was a standard slump cone conforming
to ASTM C 143-1 Oa, a J -ring, and a rigid base plate. To perform this test, a sample of
freshly mixed concrete was placed in a mold in the inverted position with a J-ring placed
concentrically around it. The concrete was placed in one lift with no tamping or vibration
and the mold was raised allowing it to spread through the J-Ring. After movement of the
concrete stopped, two diameters were measured approximately perpendicular to each
other and averaged. Figure 4.3 shows the J-ring after the movement of concrete has
stopped.
The J-Ring test is a measure of a concrete's passing ability or the ease with which
concrete can pass among various obstacles and narrow spacing of the form work without
blockage. Blockage occurs when there is segregation of the aggregate preventing flow
around an area where there is an obstacle. Ideally, an SCC should have a high level of
filling and passing ability to readily fill a section under the sole action of gravity. Thi s is
referred to as a high filling capacity.
Figure 4.3. J-Ring Test

45
The passing ability required of a concrete is also dictated by the application;
certain applications will require a higher passing abilities then others. The variables that
were considered when determining the required passing ability was the reinforcement
level and the viscosity level. It was assumed that the reinforcement level was high and
that the tight reinforcement could cause aggregate to segregate and potentially block
flow. Narrowing of formwork was not an issue for this particular application, but
because of the reinforcement level being high, a high passing ability was required.
To optimize the passing ability of the concrete, the HRWR dosage previously
determined was used; this was 9 fl oz/cwt. The VMA that was selected for use in the
SCC was Rheomac 362, manufactured by BASF chemical company. Two dosages were
selected for the VMA, 4 and 8 fl oz/cwt. These represented the lower and higher dosages
recommended by the manufacturer.
It was seen that as the dosage of VMA was increased, the J -Ring flow also
increased, meaning the passing ability also increased. Table 4.3 shows that as the dosage
was increased from 4 to 8 fl oz/cwt, the slump flow only decreased from 24.5 to 24.3 in
(622 to 617 mm). This is a very small decrease in slump flow for a significant increase in
passing ability of the concrete. The data indicated that the J-ring flow was the same for
the high dosage of VMA as with the high dosage of the HRWR alone. The visual
stability of the concrete was, however, much improved. The paste had a much thicker
consistency while still maintaining a high filling ability. As this table shows, the slump
flow was 25 in. (635 mm) before the addition of the VMA and 24.5 in. (622 mm) after
the addition of the VMA. This seemed to show that the higher dosage of VMA would
provide the best passing ability without making significant changes to the slump flow or
filling ability of the concrete.
4.2.5. Static Segregation. The static segregation of a SCC can be determined by
this test method by measuring the coarse aggregate content in the top and bottom portions
of the cylindrical specimen. This can then be used to determine the potential a SCC has
for segregation. It is important that a concrete be cohesive enough to prevent the
aggregate from sinking to the bottom, this is especially important in deep sections such as
walls or columns. As with other properties, the degree of segregation that is acceptable is
dependent on the application.

46
Table 4.3. VMA Dosages
Dosage Slump J-Ring Admixture (fl Flow
oz/cwt) (in) (in)
Glenium 7500 9 Rheomac VMA 362 4 24.5 19.5
Glenium 7500 9
Rheomac VMA 362 8 24.3 23
Glenium 7500 9 25 23.5
I in. = 25.4 mm
To perform this test, a sample of freshly mixed sample of SCC is placed in a
cylindrical mold without tamping or vibration. The top surface of the concrete is struck
off and the concrete is allowed to stand for 15 ± I minute. Immediately following the
standing period, the concrete out of the top and bottom quarters of the column are
removed and washed over a No.4 sieve. The aggregate is then brought to a surface-dry
condition by rolling in an absorbent cloth until all visible films are removed. The mass of
the coarse aggregate from the top and bottom sections are then determined to the nearest
0.1 Ib (0.045 kg). The percent static segregation can then be found using Equation I. In
this equation, CAs is the mass of coarse aggregate in the bottom section of the column,
CAT is the mass of coarse aggregate in the top section of the column, and S is the static
segregation in percent. If CAs~ CAT the percent segregation is zero.
S = [CAs-CAT] * 100, if CA8 > CAr CA8 +CAT
( I )
Table 4.4 shows data taken from the static segregation test. The first concrete
mixture contained the HRWR Glenium 7500 only. This made the mixture highl y
flowable; however, there was significant segregation. The next test performed was for a
concrete made using a HRWR and a low dosage of a VMA, Rheomac 362. It was found

47
that segregation improved; however, there was still a significant amount of segregation.
Finally, a high dosage of VMA was added and it was seen that static segregation
decreased significantly. This was the basis for the selection of a high dosage of VMA in
the sec mix design.
Table 4.4. Static Segregation Data
Dosage Static
Test (fl Segregation
Number Admixture oz/cwt) (%)
1 Glenium 7500 9.0 25.4
Glenium 7500 9.0
Rheomac
VMA
2 362 4.0 22.4
Glenium 7500 9.0
Rheomac
VMA
3 362 8.0 3.5
4.3. HARDENED CONCRETE TESTING PROGRAM.
Table 4.5 summarizes the tests that were performed on the NC and SCC
specimens, test methods followed, and specimen sizes.
4.3.1. Compression testing. Compression testing was performed in accordance
with ASTM C39-l 0 (201 0) Standard Test method for Compressive Strength of
Cylindrical Concrete Specimens (ASTM C39, 2010). The specimens used for this were 4
in-diameter (100 mm) by 8 in long (200 mm) cylinders cast in the Concrete Laboratory of
Butler-Carlton Hall (CLBCH). Testing was conducted in the Load Frame Room of
Butler-Carlton Hall (LFBCH). The testing apparatus used was a 1200 kip (5,340 kN)
Forney Compression Machine. The load was applied continuously and without shock to

48
the specimen at a rate of 35± 7 psi/s (0 25 + 0 05 MPa/s) B d h · · · - . . ase on t e specimen size,
this would correspond to a loading rate of 440± 188 Jb/s ( 1.9±0.8 kN/s).
Table 4.5 . Summary of Hardened Concrete Testing Program
Test Test Specimen Age At
Method Geometry Testing
Compressive ASTM C39
4-in. (100 mm) dia.
Strength x 8-in. (200 mm) long cylinder 7 days, 28 days
Modulus of 6-in. (150 mm) x 6-in. (150 mm) ASTM C78 28 days
Rupture x 24-in. (600 mm)
Shrinkage 4-in. (100 mm) dia.
After Casting
ASTM C157 x 24-in. (600 mm) long cylinder for
4 months
Shear 12-in. (305 mm) x 18-in. (457 mm)
Strength x 168-in (4267 mm) ;::: 28 days
A total of 9 cylinders were cast for each trial batch of concrete. All specimens
were cast in plastic cylinder molds with caps and moist cured for 7 days. The specimens
were removed from the molds, marked, and returned to the moist cure chamber of
CLBCH until their intended testing date.
Since the compressive strength exceeded initial expectations, a sulphur-based
capping compound was used. The cylinders were capped in accordance with ASTM
C617 - I 0. Standard Practice for Capping Cylindrical Concrete Specimens (ASTM C61 7,
20 I 0). The capping compound provided a flat surface that helped to eliminate high stress
areas. The manufacturer states that the capping compound compressive strength exceeds
8,000 psi (55.2 MPa) at an age of 2 hours but may be used beyond 15,000 psi (I 03.4
MPa) with additional aging. All specimens were allowed to cure, at a minimum, four
hours before testing. Sulfur capping was used in place of neoprene pads in steel end caps
due to the stiffness required to test the higher compressive strengths. The testing
apparatus for concrete compression testing can be seen in Figure 4.4.
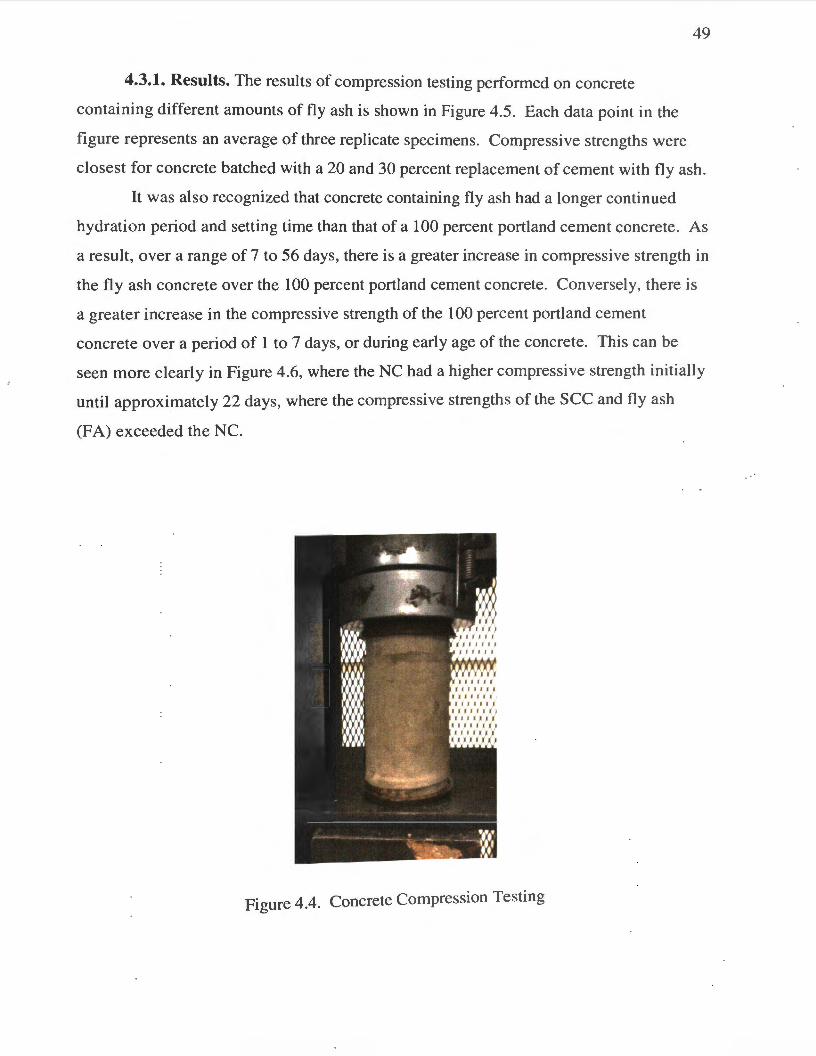
49
4.3.1. Results. The results of compression testing performed on concrete
containing different amounts of fly ash is shown in Figure 4.5. Each data point in the
figure represents an average of three replicate specimens. Compressive strengths were
closest for concrete hatched with a 20 and 30 percent replacement of cement with fly ash.
It was also recognized that concrete containing fly ash had a longer continued
hydration period and setting time than that of a 100 percent portland cement concrete. As
a result, over a range of 7 to 56 days, there is a greater increase in compressive strength in
the fly ash concrete over the 100 percent portland cement concrete. Conversely, there is
a greater increase in the compressive strength of the 100 percent portland cement
concrete over a period of 1 to 7 days, or during early age of the concrete. This can be
seen more clearly in Figure 4.6, where the NC had a higher compressive strength initially
until approximately 22 days, where the compressive strengths of the sec and fly ash
(FA) exceeded the NC.
Figure 4.4. Concrete Compression Testing

50
All three concrete specimens had the same w/cm; the SCC and FA had the same
amount of cement and fly ash. This shows that there is a difference in compressive
strength with the addition of fly ash; however, the difference in compressive strength as a
result of the addition of the specific chemical admixtures used was negligible. This result
is because the SCC and FA strength gain plots are nearly identical as time progressed.
4.3.2. Conclusions. As was expected, as the amount of fly ash increased, the
compressive strength trend was to decrease up to an age of seven days. At 28 days, the
control concrete, which contained no fly ash, still had the highest compressive strength,
but it could be seen that as the amount of fly ash was increased, the compressive strength
also experienced a small increase. This would seem to indicate that the fly ash reacted
slower at first but over time would result in a comparable or higher compressive strength,
which is consistent with previous research.
8000 50
7000 ,.-... 1:':1 ,.-... ~ ·c;; 6 Q. 6000 40 '-'
..c ..c ... ... Oil 5000
Oil c c Q,j 30 Q,j
'"' '"' ... .... rJ1 4000 00
Q,j Q,j
. :: ... "' 3000 20 ·~ "' Q,j Q,j
'"' '"' Q. Q.
E 2000 10
E 0 0
u u 1000
0 0
0 20 30 40
Percent Cement Replacement (%)
• 7 Day • 28 Day
F. 4 5 c ncrete Compressive Strength With Fly Ash Replacement tgure . . o
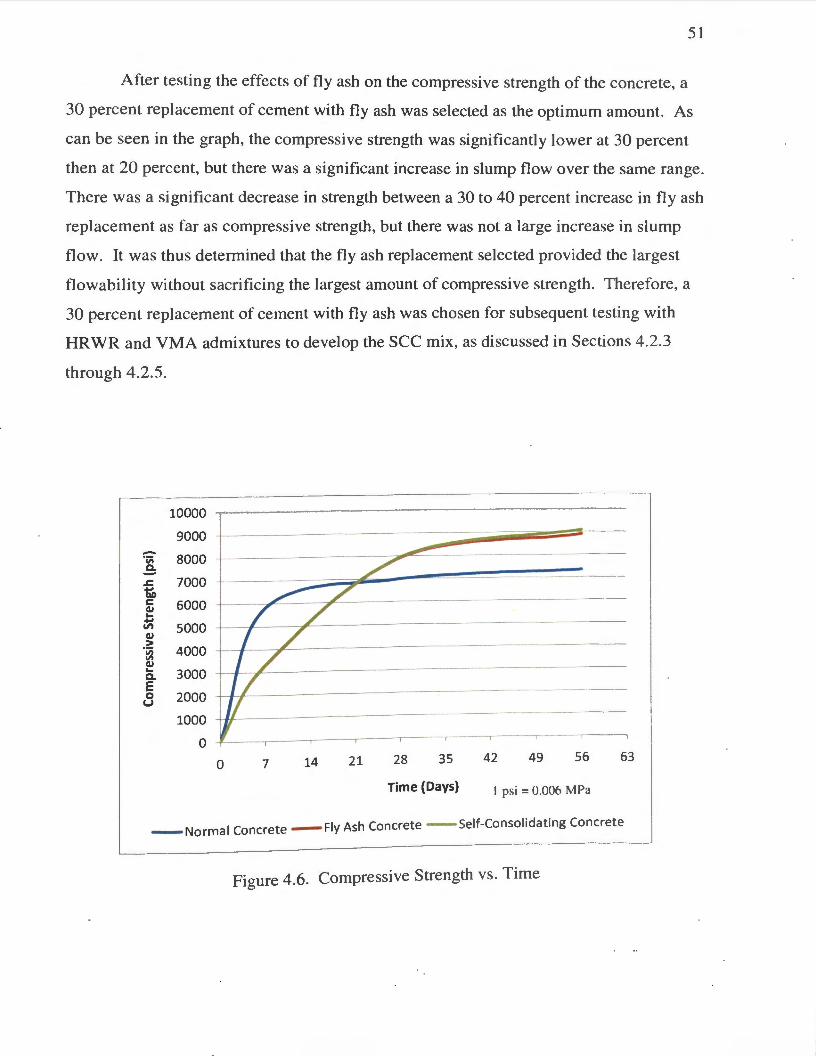
51
After testing the effects of fly ash on the compressive strength of the concrete, a
30 percent replacement of cement with fly ash was selected as the optimum amount. As
can be seen in the graph, the compressive strength was significantly lower at 30 percent
then at 20 percent, but there was a significant increase in slump flow over the same range.
There was a significant decrease in strength between a 30 to 40 percent increase in fly ash
replacement as far as compressive strength, but there was not a large increase in slump
flow . It was thus determined that the fly ash replacement selected provided the largest
flowability without sacrificing the largest amount of compressive strength. Therefore, a
30 percent replacement of cement with fly ash was chosen for subsequent testing with
HRWR and VMA admixtures to develop the SCC mix, as discussed in Sections 4.2.3
through 4.2.5.
10000 -
-9000
- 8000 "iii E: ~ 7000 1i'o c: 6000 QJ ... +J V) 5000 QJ
> "iii 4000 "' QJ ... 3000 ~
E 0 2000 u
1000
0
....,.,.. -
/ -
~ / -
/ /_ I / / /_ -
I / -
ll ----- -
~ ---,
0 7 14 21 28 35 42 49 56 63
Time (Days) I psi = 0.006 MPa
I C te - Fly Ash Concrete - Self-Consolidating Concrete - Norma onere
Figure 4.6. Compressive Strength vs. Time
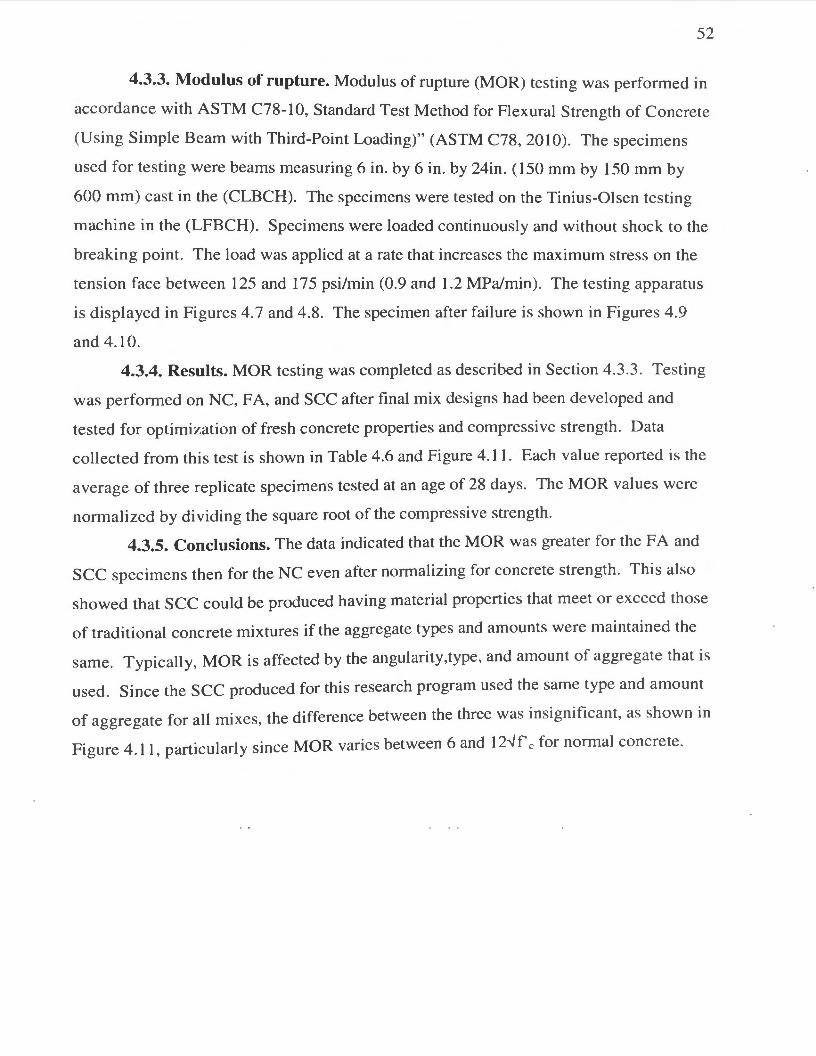
52
4.3.3. Modulus of rupture. Modulus of rupture (MOR) testing was performed in
accordance with ASTM C78-l 0, Standard Test Method for Flexural Strength of Concrete
(Using Simple Beam with Third-Point Loading)" (ASTM C78, 201 0). The specimens
used for testing were beams measuring 6 in. by 6 in. by 24in. (150 mm by 150 mm by
600 mm) cast in the (CLBCH). The specimens were tested on the Tinius-Olsen testing
machine in the (LFBCH). Specimens were loaded continuously and without shock to the
breaking point. The load was applied at a rate that increases the maximum stress on the
tension face between 125 and 175 psi/min (0.9 and 1.2 MPa/min). The testing apparatus
is displayed in Figures 4.7 and 4.8. The specimen after failure is shown in Figures 4.9
and 4.10.
4.3.4. Results. MOR testing was completed as described in Section 4.3.3. Testing
was performed on NC, FA, and SCC after final mix designs had been developed and
tested for optimization of fresh concrete properties and compressive strength. Data
collected from this test is shown in Table 4.6 and Figure 4.1 1. Each val ue reported is the
average of three replicate specimens tested at an age of 28 days. The MOR values were
normalized by dividing the square root of the compressive strength.
4.3.5. Conclusions. The data indicated that the MOR was greater for the FA and
SCC specimens then for the NC even after normalizing for concrete strength. This also
showed that sec could be produced having material properties that meet or exceed those
of traditional concrete mixtures if the aggregate types and amounts were maintained the
same. Typically, MORis affected by the angularity,type, and amount of aggregate that is
used. Since the SCC produced for this research program used the same type and amount
of aggregate for all mixes, the difference between the three was insignificant, as shown in
Figure 4 . 11 , particularly since MOR varies between 6 and 12...Jf' c for normal concrete.

Table 4.6. Modulus of Rupture
Modulus of
Concrete Rupture Normalized Type (psi) MOR
NC 634 8.8
FA 670 9.2
sec 667 9.2
1 psi= 0.006 MPa
iM'iiiiCi EVE PROTECTION MUST BE WORN
IM THIS AREA
Standard Deviation
0.1 0.1
0.1
Figure 4.7. Modulus of Rupture
53

54
Figure 4.8. Modulus of Rupture
Figure 4.9. Modulus of Rupture After Testing

Figure 4.10. Modulus of Rupture After Testing
10.0
9.0
8.0
7.0
6 .0
5.0 +---
4 .0 +-----
3.0
2.0
1 .0
0.0
NC FA
Concrete Type
Figure 4.11. Modulus of Rupture
55
sec

56
4.4. CONCLUSIONS
Materials testing was important for both the development of a SCC but also for
the comparison of SCC to NC. It is important that the properties of SCC are known and
that if there is a significant difference in properties of SCC compared to NC that these are
taken into account in design. The tests performed in this section were selected to
determine if the design parameters used for NC could also be applied to SCC.
To begin, concrete density and air content were taken for both NC and SCC.
These are two tests that are routinely performed on fresh concrete samples. It was seen
that there was not a significant difference between the SCC and the NC. This was as
expected since the major constitutions of the concrete were not altered. The density of
the concrete was found to be approximately 146 lb/ft3 (2340 kg/m3) for all concrete
produced. The air content was also important when producing SCC because with the
addition of air, concrete traditionally experiences an increase in slump and durability .
The air content of several mix designs was taken and the dosage of an air entraining
admixture was adjusted to achieve an air content of 6%. Air content testing was
performed throughout materials testing to ensure that the air content remained relatively
consistent throughout the testing process.
During the mix development phase for SCC, fresh concrete testing was performed
to determine the optimum dosages of different admixtures. To determine the correct
dosage of the HRWR the slump flow of the concrete was determined. It was seen that the
slump flow, and the flowability of the concrete increased greatly as the dosage of the
HRWR was increased from 2 to 6 fl oz/cwt. Beyond this point there was not a significant
increase in the slump flow of the concrete even with additional HRWR. The highest
dosage of the HRWR was still used to maintain a high slump flow after the addition of a
YMA. After the dosage of HRWR was selected the dosage of YMA was determined .
This was conducted much the same way as with the HRWR; different dosages were
selected and slump flow tests were performed to determine the flowability of the
concrete. It was seen that there was very little effect as a result of the addition of VMA
on the slump flow of the concrete.

57
After the addition of VMA the passing ability of the concrete was tested. This
was determined by performing the J-ring test. The diameter of the concrete taken from a
J -ring test was compared to the diameter of the concrete taken from a slump flow test. A
large difference will indicate that the concrete has very little passing ability and that is
affected greatly by obstacles. It was seen that there was very little difference between
SCC produced using a combination of a HRWR and VMA to that of an SCC using a
HRWR alone. Visually the stability was improved greatly with the addition of a VMA
and there was little impact on the passing ability of the concrete as shown by the J -ring
test.
To show that the SCC had an improved stability as a result of the addition of the
VMA the static segregation of the SCC was determined. This was determined by the
static segregation test. This test was performed on concrete made using the HRWR
alone, as well as a low and high dosage of VMA. It was seen that the static segregation
was highest with concrete produced using the HRWR alone. This was as expected since
there was little to prevent the aggregate from settling within the concrete mixture. The
VMA works to effectively increase the specific gravity of the water in the concrete
mixture and prevent segregation. The low dosage of 4 fl oz/cwt for the VMA showed
little improvement over the HRWR alone, however, the high dosage of 8 fl oz/cwt
showed significant improvement. It was shown that for the VMA to be effective the
higher dosage of VMA would be required to prevent segregation.
After the mix design had been developed for the fresh properties of SCC the
hardened properties were tested to determine if the concrete would still be acceptable. To
begin the compressive strength was tested for concrete produced with different amounts
of fly ash. The different cement replacement percentages that were tested were 0, 20, 30,
and 40. It was seen that as the amount of fly ash was increased there was a decrease in
early age strength. Concrete containing higher percentages of fly ash had longer
hydration periods, but had higher compressive strengths after approximately 21 days.
Knowing that the long term compressive strength would be greater and the slump flow
would be increased as a result of the addition of fly ash the fly ash cement replacement
percentage of 30% was selected. This afforded the benefits of increased slump flow in

the fresh state while still maintaining the higher early age strength of a portland cement
concrete.
58
MORis another common hardened concrete property that was determined after
concrete mix design development and used to compare SCC to NC. The MOR was
determined by testing a beam and normalized by dividing this value by the square root of
the compressive strength of that particular concrete. This compressive strength was
determined by testing a cylinder cast from the same batch of concrete. It was seen that
there was not a significant difference between the MOR of SCC and FA concrete. SCC
was also shown to be slightly higher than NC. Overall it was shown that there was little
difference between concrete produced with or without a HRWR and VMA regarding
MOR.
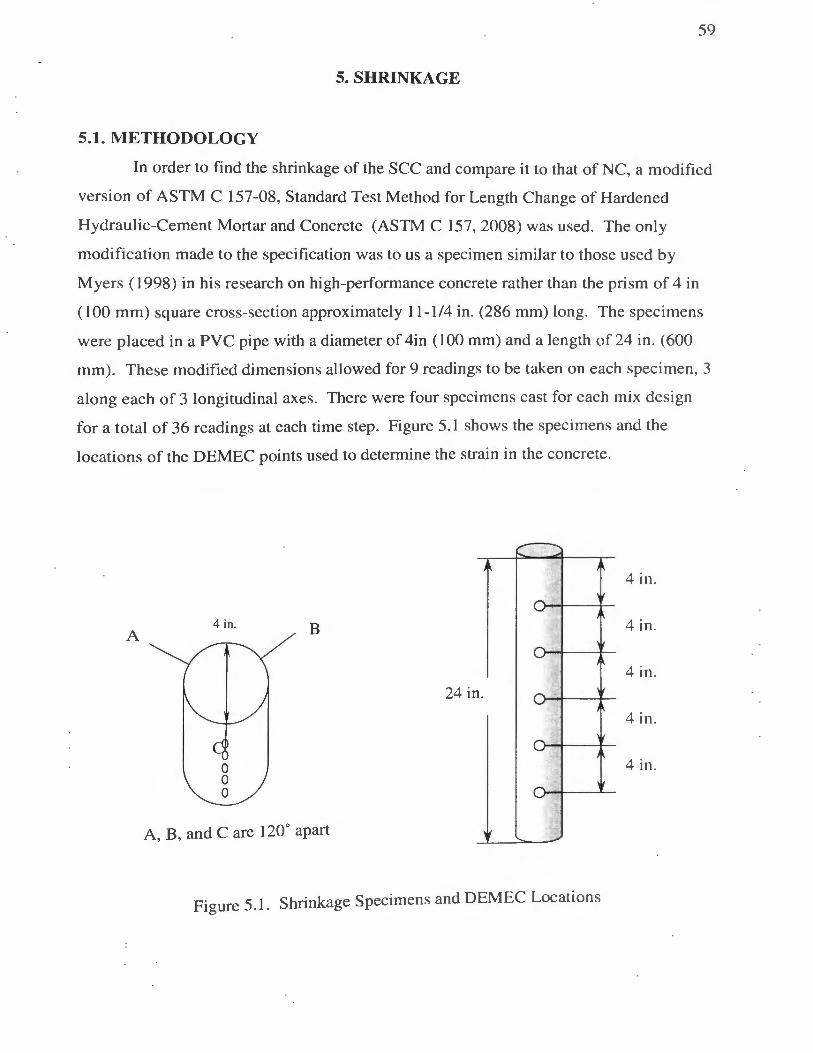
59
5. SHRINKAGE
5.1. METHODOLOGY
In order to find the shrinkage of the SCC and compare it to that of NC, a modified
version of ASTM C 157-08, Standard Test Method for Length Change of Hardened
Hydraulic-Cement Mortar and Concrete (ASTM C 157, 2008) was used. The only
modification made to the specification was to us a specimen similar to those used by
Myers ( 1998) in his research on high-performance concrete rather than the prism of 4 in
(1 00 mm) square cross-section approximately 11-1/4 in. (286 mm) long. The specimens
were placed in a PVC pipe with a diameter of 4in (1 00 mm) and a length of 24 in . (600
mm). These modified dimensions allowed for 9 readings to be taken on each specimen, 3
along each of 3 longitudinal axes. There were four specimens cast for each mix design
for a total of 36 readings at each time step. Figure 5.1 shows the specimens and the
locations of the DEMEC points used to determine the strain in the concrete.
II\ 4 in.
4 in. B 4 in . A
4 in. 24in
4 in .
4 in.
'
A, B, and C are 120° apart
F . 5 1 Shrinkage Specimens and DEMEC Locations tgure ..
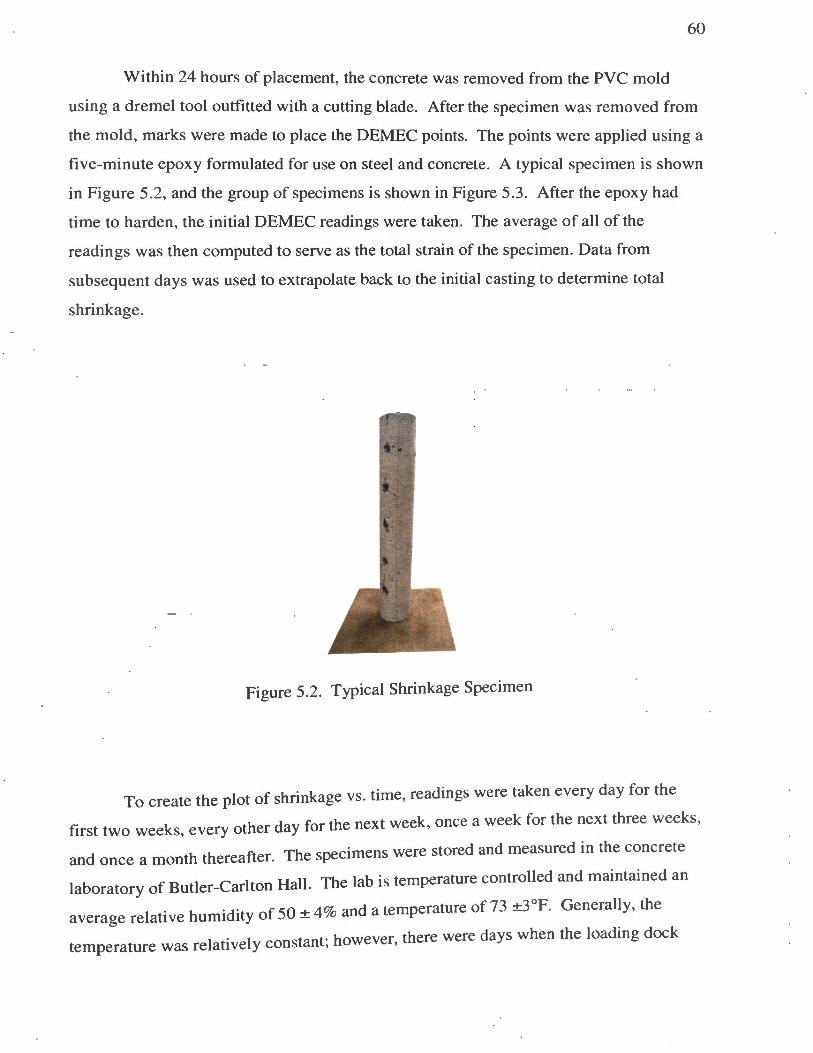
60
Within 24 hours of placement, the concrete was removed from the PVC mold
using a dremel tool outfitted with a cutting blade. After the specimen was removed from
the mold, marks were made to place the DEMEC points. The points were applied using a
five-minute epoxy formulated for use on steel and concrete. A typical specimen is shown
in Figure 5.2, and the group of specimens is shown in Figure 5.3. After the epoxy had
time to harden, the initial DEMEC readings were taken. The average of all of the
readings was then computed to serve as the total strain of the specimen. Data from
subsequent days was used to extrapolate back to the initial casting to determine total
shrinkage.
Figure 5.2. Typical Shrinkage Specimen
To create the plot of shrinkage vs. time, readings were taken every day for the
f. k ther day for the next week once a week for the next three weeks, trst two wee s, every o '
d h th ft r The Specimens were stored and measured in the concrete an once a mont erea e .
1 b f B I C It n Hall The lab is temperature controlled and maintained an a oratory o ut er- ar o .
I · h ·d·t f 50+ 4% and a temperature of 73 ±3°F. Generally, the average re attve um1 1 yo - 7 <
1 · 1 stant· however there were days when the loading dock temperature was re at I ve y con , '
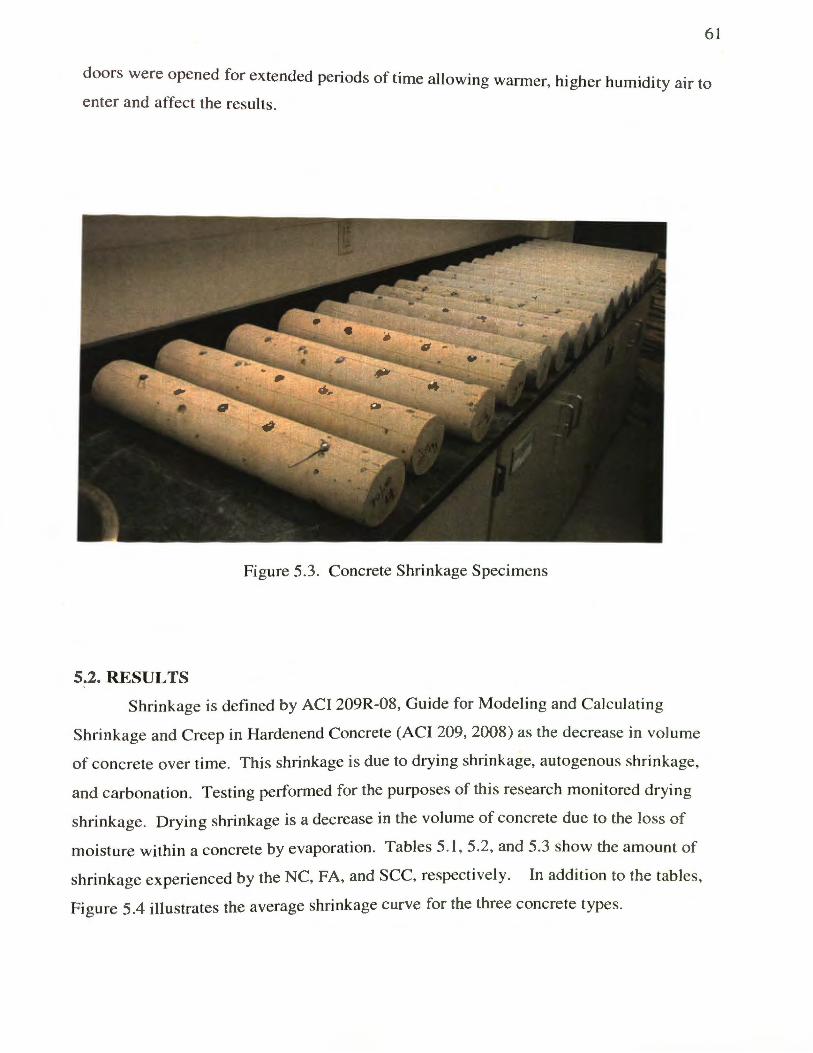
61
doors were opened for extended periods of time allowing warmer, higher humidity air to
enter and affect the results.
Figure 5.3. Concrete Shrinkage Specimens
5.2. RESULTS
Shrinkage is defined by ACI 209R-08, Guide for Modeling and Calculating
Shrinkage and Creep in Hardenend Concrete (ACI 209, 2008) as the decrease in volume
of concrete over time. This shrinkage is due to drying shrinkage, autogenous shrinkage,
and carbonation. Testing performed for the purposes of this research monitored drying
shrinkage. Drying shrinkage is a decrease in the volume of concrete due to the Joss of
moisture within a concrete by evaporation. Tables 5.1, 5.2, and 5.3 show the amount of
shrinkage experienced by the NC, FA, and SCC, respectively. In addition to the tables,
Figure 5.4 illustrates the average shrinkage curve for the three concrete types.
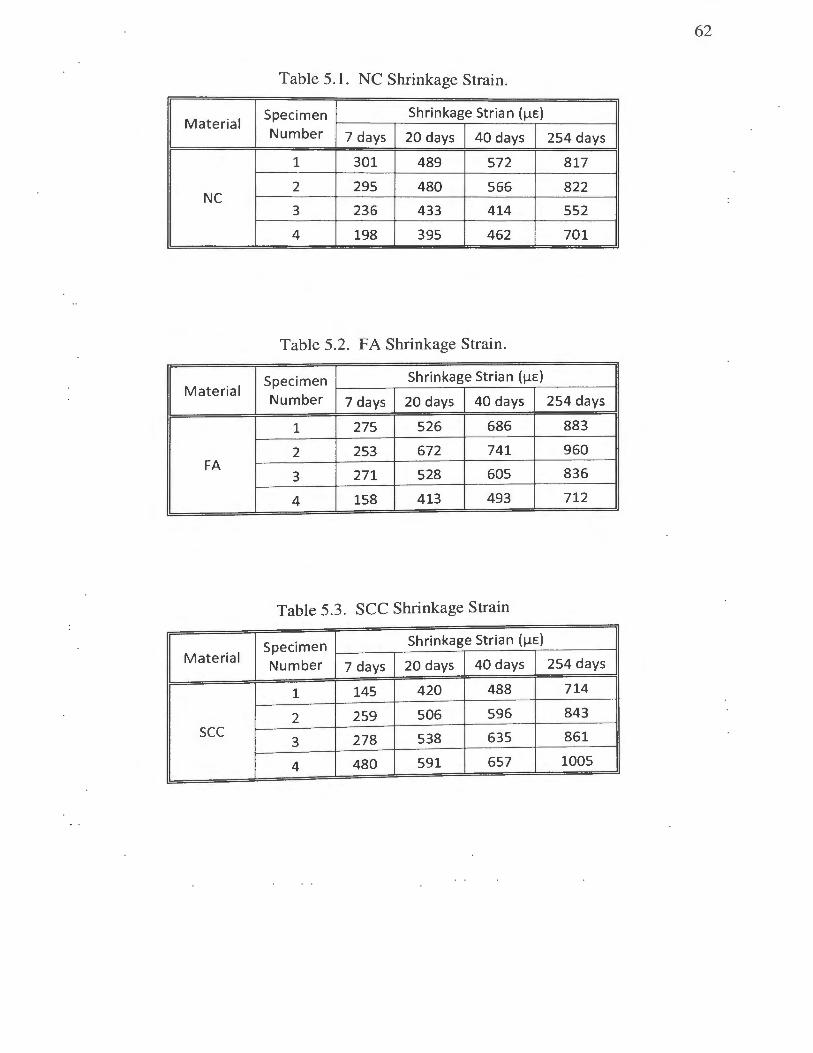
62
Table 5.1. NC Shrinkage Strain.
Material Specimen Shrinkage Strian (llE)
Number 7 days 20 days 40 days 254 days
1 301 489 572 817
2 295 480 566 822 NC
3 236 433 414 552
4 198 395 462 701
Table 5.2. FA Shrinkage Strain.
Specimen Shrinkage Strian (llE) Material
Number 7 days 20 days 40 days 254 days
1 275 526 686 883
2 253 672 741 960 FA
3 271 528 605 836
4 158 413 493 712
Table 5.3. SCC Shrinkage Strain
Specimen Shrinkage Strian (llE) Material Number 7 days 20 days 40 days 254 days
1 145 420 488 714
2 259 506 596 843 sec
3 278 538 635 861
4 480 591 657 1005
63
1000
900
800
700 ~
= ·~ 600 ..... "' 0
'"" ·§ 500 ._., c: ·; 400 '"" .....
rr;
300
/~
~ fY~ ....,.,..
IV ~
200
100
0 '--1
0 50 100 150 200 250 300 Age of Mix (Days)
- NC Shrinkage - FA Shrinkage - sec Shrinkage
Figure 5.4. Shrinkage Plot
5.3. DATA ANALYSIS AND INTERPRETATION
The total amount of shrinkage was greatest for the FA concrete, followed closely
by the SCC, and finally NC. As was expected, initial shrinkage was the greatest before it
began to curve and eventually flatten out. Figure 5.5 shows the same plot as Figure 5.4
but includes error bars based on one standard deviation above and below the average
strain for each point. This plot indicates that the shrinkage between the NC and the SCC
is statistically insignificant since the error bars overlap. The plots for the FA and the SCC
are even closer to each other and the NC is slightly lower. This seems to indicate that the
addition of fly ash added slightly to the shrinkage of the specimens. This could be due to
the fact that the fly ash has a longer hydration period and more water was allowed to

64
evaporate from the specimens. The data also indicated that the addition of HRWR and a
VMA admixtures did not have a significant effect on shrinkage.
Typically shrinkage is affected greatly by the w!cm; as more water is added to a
concrete mix, more drying occurs. Other studies have shown that there can be less
shrinkage with a limestone compared to a stiffer aggregate due to a chemical reaction
between the paste and the limestone. This chemical reaction creates a stronger bond at
the interface zone that resists shrinkage. The aggregate that was used in this research was
a limestone found locally in Missouri. For the purposes of this research, the effects of fly
ash, HRWR, and VMAs on shrinkage were desired so the w/cm, as well as the types and
amounts of the aggregates, were kept the same for all concretes so these effects could be
clearly seen.
1000
~ -~ ,..... _.,j
800
II'"': ~ ,.... ~......--
~~r-....-jl"""
( -
-
,.-.. 600 = ·~ '"' -"' 0
'"' (.J 400 ·s '-'
= ·~
'"' - 200 r.n
50 100 150 200 250 3 (
0 00
-200 Age of Mix (Days)
- NC Shrinkage - FA Shrinkage - sc Shrinkage
F. 5 5 Shrinkage Plot With Standard Deviations tgure ..

65
Tables 5.1 , 5.2, and 5.3 are repeated as Tables 5.4, 5.5, and 5.6 but include
predicted values based on relationships contained in ACI 209R. Models that were used
to predict the shrinkage were the ACI 209R-92 model developed by Branson and
Christianson in 1971, with minor modifications introduced in ACI 209R-82; the Bazant
Baweja 83 model developed by Bazant and Baweja in 1995; and the GL2000 model
developed by Gardner and Lockman in 2001.
Table 5.4. NC Shrinkage Strain.
Specimen Shrinkage Strian (!lE) Material
Number 7 days 20 days 40 days 254 days
1 301 489 572 817
2 295 NC
480 566 822
3 236 433 414 552
4 198 395 462 701
Average NC 258 449 504 723
ACI 209R 448 618 686 761
Bazant-Baweja B3 171 303 413 649
GL2000 155 256 334 504
Table 5.5. FA Shrinkage Strain.
Specimen Shrinkage Strian (!lE) Material
Number 7 days 20 days 40 days 254 days
1 275 526 686 883
2 253 672 741 960 FA
3 271 528 605 836
4 158 413 493 712
Average FA 239 535 631 848
ACI 209R 448 618 686 761
Bazant-Baweja B3 171 303 413 649
GL2000 155 256 334 504

66
Table 5.6. SCC Shrinkage Strain
Material Specimen Shrinkage Strian (llE) Number 7 days 20 days 40 days 254 days
1 145 420 488 714
2 259 506 596 843 sec 3 278 538 635 861
4 480 591 657 1005
Average SCC 291 514 594 856
ACI209R 448 618 686 761
Bazant-Baweja 83 171 303 413 649
GL2000 155 256 334 504
The ACI 209R (2008) empirical model developed by Branson and Christianson is
presented in Equations I through 9. In the following equations, Esh is the ultimate
shrinkage and Ysh is the shrinkage correction factor. To calculate the correction factor,
the following terms are used: Ysh ,tc is the initial moist curing coefficient for curing times
different from 7 days, Y sh,RH is the ambient relative humidity coefficient, Ysh,vs is a
coeffic ient to account for the size of the member in terms of the volume-surface ratio
other then 38 mm, Ysh,s is the slump factor, Ysh,'l' is the fine aggregate factor, Y sh,c is the
cement content factor, and Y sh,a is the air content factor.
(2)
Ysh = Y sh,tcYsh,RHYsh,vsY sh,sY sh,'I'Y sh,cY sh,a (3)
Ysh,tc = 1.202 - 0.2337log(tc) (4)
Ysh,RH = 1.40 - 1.02h for 0.40 < h < 0.80 (5)

Y - 1 2e-0.00472v/s sh,vs - ·
Ysh,s = 0.89 + 0.041s
Ysh r.p = 0.30 + 0.041 rp
Y s h c = 0.75 + 0.00036c
Ysh,a = 0.95 + 0.008a ~ 1
The Bazant-Baweja B3 model solution developed by Bazant and Baweja is
presented in Equations 10 through 16. Once again Esh in equation 10 is the ultimate
shrinkage. To calculate the ultimate shrinkage, the following terms were calculated:
67
(6)
(7)
(8)
(9)
(I 0)
S(t- tc) is the shrinkage time function, Esh= is the ultimate shrinkage strain, Ecm607 /
Ecm(t r is the time dependence factor, Tsh is the shrinkage halftime, E5 = is the c + s h )
nominal ultimate shrinkage, and khis the ambient relative humidity factor.
[(t t )] 0.5
S(t- tc) = tanh ---=....£.._ Tsh
Ecm607 = 1.0805/ [ Ctc+Tsh) ]0.5 E (t + ) ( 4+0.85( T c+tc))
em c Tsh
2 -0.08 -0.25 [2k (~)]
Tsh = 190.8tc fcm28 s 5
( I I)
( 12)
(13)
(14)
( 15)

68
(16)
kh = 1 - h 3 if h < 0.98 (17)
The third model that the shrinkage data was compared to was the GL2000
developed by Gardner and Lockman in 2001. The solution to the model is presented in
Equations 17 through 20. To calculate the shrinkage strains at time, t, in Equation 17, the
following terms were calculated: f3(t- tc) is the shrinkage time function , {3(h) is the
ambient relative humidity factor, and Eshuis the ultimate shrinkage strain.
( 18)
(1 9)
{3(h) = (1 - 1.18h4 ) (20)
(21)
Figures 5.6, 5.7, and 5.8 show the plots of shrinkage for the three concrete types
tested compared to the ACI 209R Model, the Bazant-Baweja B3 Model, and the GL2000
model, respectively. The plots show that the ACI 209R Model, Figure 5.6, is the closest
at predicting the shrinkage of the three concrete types. It also tends to predict initial
shrinkage slightly higher than the actual shrinkage measured but under predicts the
shrinkage slightly at later ages. Both of the other empirical models, the Bazant-Baweja
B3 Mode l in Figure 6 .7 and the GL2000 Model in Figure 6.8, tend to predict shrinkage
lower than the measured shrinkage, with the GL2000 Model significantl y under
predicting the shrinkage.

69
5.4. CONCLUSIONS
By looking at the values for shrinkage for NC and SCC it is possible to see how
the two compare. The purpose of this testing was to determine what affect, if any, the
chemical admixtures would have on shrinkage. In addition to these two types of
concrete, an intermediate concrete made with a 30 percent replacement of fly ash and no
chemical admixtures was tested. This helped to determine if any changes in shrinkage
were a result of the addition of fly ash or if they were a result of the addition of a HRWR
and VMA. Specimens were constructed and testing was performed using a modified
version of ASTM C 157-08 used by Myers in his research in 1998.
1000
900 -800
,--._ .s 700 ~
'"' ~ 600 0
'"' ·§ 500 "-' = 400 ·; !: 300 rJ)
200
...,.,.,...
~:;..-- ~ I~_,---- -
tlr w -
~ -
100 ~-----....!....-• ...__......._ ' 0
0 50 100 150 200 Age of Mix (Days)
250 300
- ACI 209R-92 Model - sec Shrinkage - FA Shrinkage - NC Shrinkage
F . 5 6 Concrete Shrinkage Compared to ACI 209R Model tgure ..

70
1000
900
800
c 700 ·~ ,_
600 ..... IJ}
0 ,_ (.J 500 ! c 400 ·~ ,_ ..... 300 rJ:;
200
100
0 ~ ~ . + __._ ____...J__ .J..-.........J..
0 50 100 150 200 250 300 Age of Mix (Days)
- Bazant-Baweja 83 Model - sec Shrinkage - FA Shrinkage - NC Shrinkage '---
Figure 5.7. Concrete Shrinkage Compared to Bazant-Baweja B3 Model
----------------------------------------------------------------1000
900 -800
:5 700 ~
, ~ ~
~~ Jr
II ~ J/ v
~ ,_ t; 600 0 ,_ ·§ 500 '-'
.5 400 ~ ,_
00 300
200
100
0
0 50 I 00 !50 200 250 300 Age of Mix (Days)
- GL2000 Model - sec Shrinkage - FA Shrinkage - NC Shrinkage
Figure 5.8. Concrete Shrinkage Compared to GL2000 Model

71
After shrinkage data was recorded and plots were made to show shrinkage strain
over time the data was compared to predictions made by 3 shrinkage prediction models.
These models were ACI 209R, Bazant-Baweja B3, and GL2000. These models were
compared to the data collected to determine which most accurately matched the concrete
developed in the lab.
By looking at plots showing shrinkage over time it was seen that the FA concrete
had the most shrinkage and was followed closely by SCC. These two types of concrete
matched the closest to each other and compared to them, NC had the smallest shrinkage.
This would seem to indicate that the fly ash contributed to the slight increase in shrinkage
observed. To determine if this increase in shrinkage was significant, standard deviation
bars were added to select points. It was seen that many of the standard deviation bars
overlapped indicating there was not a significant difference in the shrinkage between the
three concrete types.
After comparing the different types of concrete to each other the shrinkage values
determined in the lab were compared to values predicted by the shrinkage models. The
trend predicted by all three models matched what was seen in testing; the initial shrinkage
was the highest and as time progressed shrinkage slowed and began to plateau. It was
seen that the ACI 209R model most accurately represented the shrinkage observed during
testing. The initial predicted shrinkage was higher than what was seen in the field and
the predicted shrinkage was lower than data taken in the lab. Both the Bazant-Baweja B3
and the GL2000 models under predicted the shrinkage for all three concrete types. Of the
two, the Bazant-Baweja B3 was the closest to the plotted data, however, it was
consistently lower throughout the time testing was conducted.

72
6. FULL-SCALE BEAM SHEAR TESTS
6.1. INTRODUCTION
Shear strength is a concern for designers when working with SCC. Typically,
decreased shear strength with sec can be attributed to higher paste content, rounder
aggregate, and higher water to cement ratios (w/c) used to increase the flowability of the
concrete. All of these cause a loss in aggregate interlock, which contributes significantly
to the shear strength of the concrete.
Since the first SCC mixtures were developed, there have been many advances in
chemical admixtures that allow sec to be made without having to make all of these
material changes. The goal of this research project was to take a slightly different
approach to SCC mix design. Instead of making the material changes mentioned above
and potentially decreasing the shear strength of the concrete, chemical admixtures would
be used to achieve the fresh concrete properties required to have a SCC. This
chemically-based approach would hopefully minimize any associated reduction in shear
strength.
After the SCC mixture was developed, the material properties were compared to a
more traditional or NC mixture. For each concrete type, SCC and NC, there were three
shear reinforcement levels tested. The first set of beams had no shear reinforcement, the
second set had the minimum amount required by ACI 318, and the last had an amount
greater than the minimum required by ACI 318. This last series was referred to during
testing as the maximum amount of shear reinforcing and was designed to ensure that the
beam still failed in shear. Data from each set of SCC beams was compared to data from
the corresponding NC tests as well as provisions from design codes commonly used in
North America.
6.2. SPECIMEN DESIGN
When designing the beams for testing, three stirrup designs were selected: no
stirrups, the minimum amount required by ACI 318 (2008), and some amount greater
than the minimum amount. Design began by selecting the overall dimensions of the
beam and then designing for shear and flexure . To ensure that the beam failed in shear,

73
the capacity of the beam in flexure had to surpass the calculated failure load in shear. For
consistency, all beams used the same amount of flexural reinforcement, which was based
on the capacity of the greatest amount of shear reinforcement.
Before calculations could begin, overall dimensions were selected. As this
research project would use the same test setup as several other projects occurring in the
lab at the same time, a slightly non-traditional four-point loading for shear testing served
as the design setup. As noted previously, one aim of the research was to examine the
affect of a chemically-based SCC on the shear capacity of "typical" beams. As a result, a
shear span-to-depth ratio (aid) between 2.5 and 6 was chosen for the testing (MacGregor,
2005). With the four-point loading setup, this resulted in a beam span length of 12 ft.
(3660 mm), with an overall beam length of 14ft. (4270 mm) to provide adequate end
support and anchorage of the flexural reinforcement, as shown in Figure 6.1. It was also
important that the beams could be easily produced using standard concrete forms and
tested using the equipment in the Structural Engineering Research Laboratory of Butler
Carlton Hall (SERLBCH). After the span length was selected, it was important to ensure
that the aid was greater than 2.5. With this in mind combined with the desire to test
realistic full-scale beam sizes, an overall beam depth of 18 in. (457 mm) was selected,
which resulted in an aid value of approximately 3.1. It has been shown that an increase
in depth of a beam with little or no web reinforcement results in a decrease in shear at
failure for a given compressive strength of concrete (f' c), reinforcement ratio (pw), and
aid (MacGregor, 2005). Beam depths also have an effect on the width and spacing of
inclined cracks in the beams. As the depth increases, the crack spacings and widths tend
to increase. Knowing that the width of the inclined cracks is based on the strain in the
reinforcement crossing the crack, and the spacing of the cracks, the shear stress that can
be transferred across the crack by aggregate interlock Dei, will be less with a deeper beam.
When Dei is exceeded, the faces of the cracks slip, one relative to the other.

74
r------------14.0 ft.---------
1
~ ... : . : .. ... ·. ·~ ...... .. _· .;,. .... ·-·· .. ,. . . f · .: ~ ... . : . ~:. ~·- .: ~~ ~ ••
~ .. •. : .. ' . ~ .. ~.; < .. --~ .•• •· ·_. ~ ·~ ~ .... : ~~ ~ :. ~ .·~ :. ...... . • .. ~ •. ·•· •• · .... . : .. ... ·. • .. ·~ ...... ;: •. _ ..... ... . "'.'· ..• · ... '. · .. : - • . . J ' •• • ~· .. :< ;·< . .~~4: ..
. · .. . <-.... ~: ~ ·-.: ~~.-: ... . ···.·. ~ .. :-. ·· .. -1'···· ·4 '--: ... - ~· ... :·- .· .... :~ · ., . . . 1\ . I ~ .____.___4. 0 ft.---~---4. 0 ft.-----1---4. 0 ft.----l------l
I .0 ft. 1.0t
Figure 6.1 . Loading Condition for Full-Scale Beam Shear Tests
After the overall dimensions of the beam had been chosen, design of the steel
reinforcement could begin. To start, Equation 22 was used to determine the rectangular
stress block depth, a. The equation assumes that the force in the tensi le steel will be
equal to the sum of the compressive concrete and steel forces. In this equation A,11 is the
area of steel in tension, _h. is the yield strength of the steel,f'c is the compressive strength
of the concrete, b is the width of the compression face, a is the depth of equivalent
rectangular stress block, and A.~c is the area of the steel in compression.
(22)
The ACI 318-08 code allows for the use of an equivalent rectangular compressive
stress distribution, or stress block, to replace the more exact concrete stress distribution
which is non-linear. For concrete wi.th f'c~ 4,000 psi, ~,=0.85. If the compressive

strength of the concrete is greater than this j3 1 is reduced by 0.05 for each 1000 psi in
excess of 4000.
75
(23)
By assuming an area of steel, and evaluating Equation 22, the depth of the
equivalent rectangular stress block could be determined. The values for f, andf'c were
both known from testing of tensile steel strength and previous concrete mix designs, and
b was the width of the compression face, 12 in. (304 mm). This was already determined
as an overall beam dimension.
Solving for the equivalent stress block depth allowed for the calculation of the
moment capacity of the section. This calculation is shown in Equation 24. In this
equation, M 11 is the nominal moment capacity of the beam,f~cl is the compressive strength
required from the steel in compression solved for by iteration of Equation 22, dis the
distance from the extreme compression fiber to the centroid of the longitudinal tension
reinforcement, and d, is the distance from the extreme compression fiber to the centroid
of the longitudinal compression reinforcement.
(24)
Once the nominal moment capacity of the beam is known, the load that the beam
should fail at can be predicted by setting it equal to the load applied by the actuator (P)
multiplied by the distance from the support to the load. To ensure that the beam fails in
shear, the load that the beam can support in a flexural capacity must be greater than the
load that the beam can support in shear.
To find the load that the beam can support in shear, two terms must be calculated,
the nominal shear strength provided by the concrete (V,) and the nominal shear strength

76
provided by the shear reinforcement (V5 ). The calculation for Vc is shown in Equation 25
and is taken from the ACI 318-08 code, equation (11-3). By rearranging equation (11-
15) from the ACI code, the spacing can be determined; this result is shown in Equation
26. In this equation Avis the area of steel required,j;.1 is the tensile strength of the steel,
and s is the spacing. Vs reqd is the shear strength that must be supported by the steel. This
is found in Equation 27.
S = Avfytd
Vs reqd
Vsreqd = V- Vc
(25)
(26)
(27)
Equation 26 gives the suggested stirrup spacing according to ACI, or put another
way, this is the minimum number of stirrups that will adequately support this beam. The
minimum spacing of stirrups was calculated to be 7 in. and a spacing of 5 in. was selected
to be the smallest spacing tested or maximum amount of shear reinforcing.
The location of steel reinforcement within the beam is shown in Figure 6.2. Five
No.4 bars served as compression reinforcement and 10 No. 8 bars served as tensile
reinforcement. For calculations d was equal to 14.63 in. and d' was equal to 1.625 in.
There was I in. of clear cover on the sides and 1.5 in . of clear cover on the top and
bottom of the shear reinforcement. Table 6.1 shows the test matrix for beams tested in
shear. Figures 6.3, 6.4, and 6.5 show the locations of the shear reinforcement for the
beams constructed with no stirrups, 7 in. (178 mm) stirrup spacing, and 5 in. ( 127 mm)
stirrup spacing, respectively. The construction of the reinforcement cages are described
in more detail in Section 6.3. Tables 6.2 and 6.3 show the concrete mix designs used for
the SCC and NC beams, respectively. See Chapter 3 for concrete mix development.

77
Table 6.1. Full Scale Shear Test Matrix
Stirrup Concrete Reinforcement
Spacing Type Figure
Specimen (in.) Numbers
Controi-NS-1 No Stirrups NC 6.2, 6.3
Controi-NS-2 No Stirrups NC 6.2, 6.3,
Controi -NS-3 No Stirrups NC 6.2, 6.3
Control-7-1 7 NC 6.2, 6.4
Control -7-2 7 NC 6.2, 6.4
Control -7-3 7 NC 6.2, 6.4
Control -5-1 5 NC 6.2, 6.5
Control-5-2 5 NC 6.2, 6.5
Control-5-3 5 NC 6.2, 6.5
SCC-NS-1 No Stirrups sec 6.2, 6.3
SCC-NS-2 No Stirrups sec 6.2, 6.3
SCC-NS-3 No Stirrups sec 6.2, 6.3
SCC-7-1 7 sec 6.2, 6.4
SCC-7-2 7 sec 6.2, 6.4
SCC-7-3 7 sec 6.2,6.4
SCC-5-1 5 sec 6.2, 6.5
SCC-5-2 5 sec 6.2, 6.5
SCC-5-3 5 sec 6.2, 6.5
1m. = 25.4 mm

c ! ':; l-t4 .~C r
~ ~CO 1n
18.0 In .
~:.·.· ... ~ ..•. · .. ~. ~ .. ··.'.': :'':· ..... :. :. ~ ~ - ~ .' , ... : : :.~ .. _· .... . " ·,. : • • . :,.J ,1' -"" :· ·~ . ; • !l' -~ - . ~:i -~ ·:~: · ·-, . !~~~~~ .. ;·
...
•,
... -: .. ••
. :····1· .. ~· ·l:·~··· .. ·--.-... ... ·.?\.-:' .:·._: ... ~ .... :- .::. -:·"·\. ,; . ; ~: .. ~ · . .. .: -
12.0 in.
Figure 6.2. Steel Reinforcement Location
166.58.
~ I 75 7 OJ 152 00
166.58 1r .
Figure 6.3. Shear Reinforcement With No Stirrups
78
5 No.4 Bars
10 No.8 Bars
Jl ., 5f

79
66 '>J c / ~ • t---rt ',:,
~r ~~~ ' 1 sr '/ ::0 1n
I .,.;· i f_; In 7 0 0 ill
·s·1 co 166 ~<)
Figure 6.4. Shear Reinforcement With 7 in. Stirrup Spacing
166. ~, : ; if' ~ :H;
1--1'1 ."> : r r
~~ 11 s! J In
'/ :c In
: '. 75 in. 00 in 1~2 oc
166 5D
Figure 6.5. Shear Reinforcement With 5 in. Stirrup Spacing
Table 6.2. Final SCC Mix Design per Cubic Yard
[ I Batch
I Constituent Weight
CA (lb) 1781.3
FA (lb) 971.3
Cement (Type 1) (lb) 528.9
Water (lb) 340
Fly Ash (Class C) (lb) 226.7
[Chemical Admixtures I Dosages ! Micro Air (ml) 223.4
Glenium 7500 (gal) 0.53
RheomacVMA 362 (gal) 0.47
lib. = 0.45kg

80
Shear strength testing was performed on the 14ft (4270 ) 1 b · mm ong earns m the
SERLBCH. All specimens were allowed to cure for a minimum of 28 days before testing
began. Three cylinders were kept next to the beams and were tested to determine the
compressive strength of the beam on the day of testing.
Table 6.3. Final NC Mix Design per Cubic Yard
Batch ,..
"tuent Weight
CA (lb) 1781.3
FA (lb) 971.3
Cement (Type 1) (lb) 755.6
Water (lb) 340
Chemical Admixtures Dosages
I Micro Air (ml) I 223.4 I lib.= 0.45 kg
6.3. SPECIMEN CONSTRUCTION
This section will discuss the fabrication of the beams for shear testing as well as
any construction related issues. The beam naming convention used throughout this
section is a follows: "controls" are beams made with normal concrete and "SCC" are
beams made with self-consolidating concrete. The following number is the spacing in
inches between shear stirrups; where the symbol NS indicates there are no stirrups in the
beam. The final number is the specimen number.
Form work was acquired and assembled first in late May 2010. The sides were 18
in. (457 mm) tall and had a length of 14ft. (4270 mm). The sides were attached to the
form base by angle iron and form nails. The ends of the forms were constructed in the
lab using plywood and wood framing and held onto the side pieces using bolts, washers
and wing nuts. These were used for ease of assembly and disassembly. There was a total

of three beam molds such that a single series of beams would be constructed from the
same batch of concrete.
81
Fabrication of the control specimen cages began early in June 2010. Reinforcing
steel, consisting of No. 3, No.4, and No. 8 bars, was delivered to the SERLBCH and cut
to length using a rebar cutter. Ninety degree bends were then added to the ends of the
No. 8 bars. The No. 8 bars were set on top of a set of work stands and 5 No. 8 bars, cut
to lengths of I 0 in . (254 mm), were used to maintain the correct spacing between the two
layers of tensile reinforcement. After longitudinal reinforcement was in place, stirrups
were added and tied to the longitudinal reinforcement using rebar ties. Three different
stirrup designs were then used, no stirrups, a 7 in. (177 mm) spacing, and a 5 in. (127
mm) spacing. The latter two represented the minimum amount of stirrups required by
ACI and the maximum amount used during testing, respectively, which could be
compared to the concrete alone.
Up to this point, construction of the cages was done upside-down. When the
reinforcement cage construction was complete, the cages were lifted off of the work
stands using the overhead crane and rolled over. They were then placed back onto the
work stands to facilitate application of strain gages, this can be seen in Figure 6.6. To
begin, the area that was to receive a strain gages was ground smooth and sanded with 120
grit sandpaper. An acid cleaner was applied to a cotton cloth and used to clean the area
followed by a base to prevent corrosion. Care was taken to not use the same cotton cloth
twice, lest there be recontamination. The strain gages were then glued to the surface of
the steel using the supplied adhesive and allowed to cure for approximately 5 minutes.
After the glue had set, electrical tape was placed beneath the gage to prevent it from
shorting out and giving an invalid reading. Wires were then attached to the leads of the
strain gages. The wires were combined and routed out of the top of the cage. To prevent
damage to the strain gage during concrete placement, tape was placed over the gage. The
strain gages can be seen prior to concrete placement in Figure 6.7.

82
Figure 6.6. Reinforcement Cages
Figure 6.7. Strain Gages

83
The final step in the cage assembly was to add chairs to the bottom and sides.
These held the cage in place, preventing it from leaning into the side or bottom of the
form. This is important because adequate clear cover is necessary to ensure that the
reinforcing steel has the proper development length and is being fully utilized. The forms
prior to concrete placement can be seen in Figure 6.8.
After the cages were securely placed in the forms, concrete was ordered from
Rolla Ready Mix. The mix designs used in Tables 6.2 and 6.3 were supplied to their
office without any chemical admixtures. To compensate for variable moisture conditions
of the aggregates and allow adjustments at the lab, the water content reported to Rolla
Ready Mix was reduced by I 0%. After the truck arrived, an initial slump was taken and
water was added as necessary to achieve the design slump of 6 in. prior to the addition of
admixtures. The slump test is shown in Figure 6.9. At this point, for the control
specimens, NC was placed into the forms using a concrete bucket lifted using the
overhead crane as shown in Figures 6.1 0 and 6.11. A vibrator assisted in ensuring that
the concrete complete) y filled the form work as shown in Figure 6.12. Finishing was done
on all NC beams and can be seen in Figure 6.13. For the SCC beams, HRWR and VMA
were added to the concrete and mixed at a high speed for 5 minutes after the
slump of 6 in. (152 mm) was achieved. This can be seen in Figure 6.14. The SCC was
placed using the concrete bucket but was not vibrated as shown in Figure 6.15. At this
point, the concrete had a high flowability and a slump flow was taken, as shown in Figure
6.16. It was seen that minimal finishing was required for the SCC beams. For all
concrete placements, 9 cylinders were produced for compression testing. Figure 6.17
shows the concrete placement process.
After the concrete was placed, it remained exposed to the air for approximately 3
to 4 hours. At this point, wet burlap was placed over the beams and plastic was placed
over the top as a form of passive curing. It was observed that the SCC beams were more
prone to small plastic shrinkage cracking; if this was the case, water was poured over the
surface to increase the humidity beneath the plastic. Concrete placements happened
concurrently with cage construction and began on June 28, 2010 and continued through
August 1 O, 201 0. After approximately one week, the beams were removed from the
forms, labeled, stacked, and stored in the SERLBCH.

84
Figure 6.8. Forms Prior to Concrete Placement

85
Figure 6.9. Initial Slump Taken
Figure 6.1 0. Filling Concrete Bucket
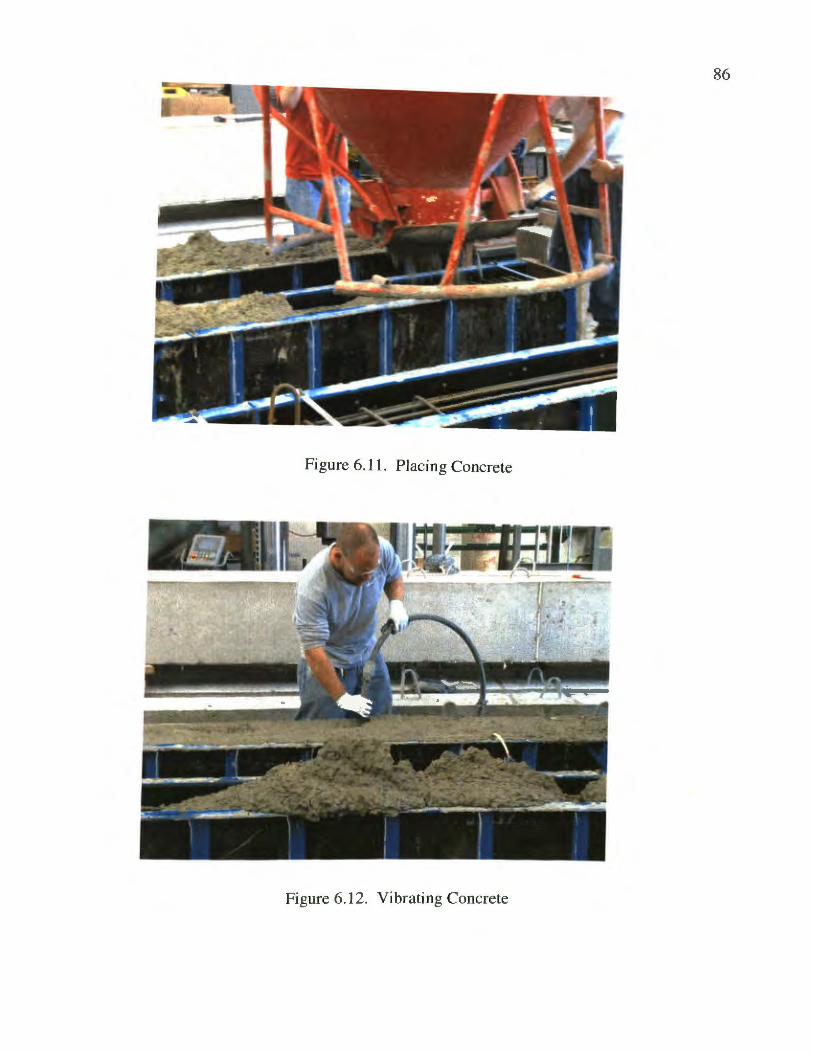
86
Figure 6.11. Placing Concrete
Figure 6.12. Vibrating Concrete
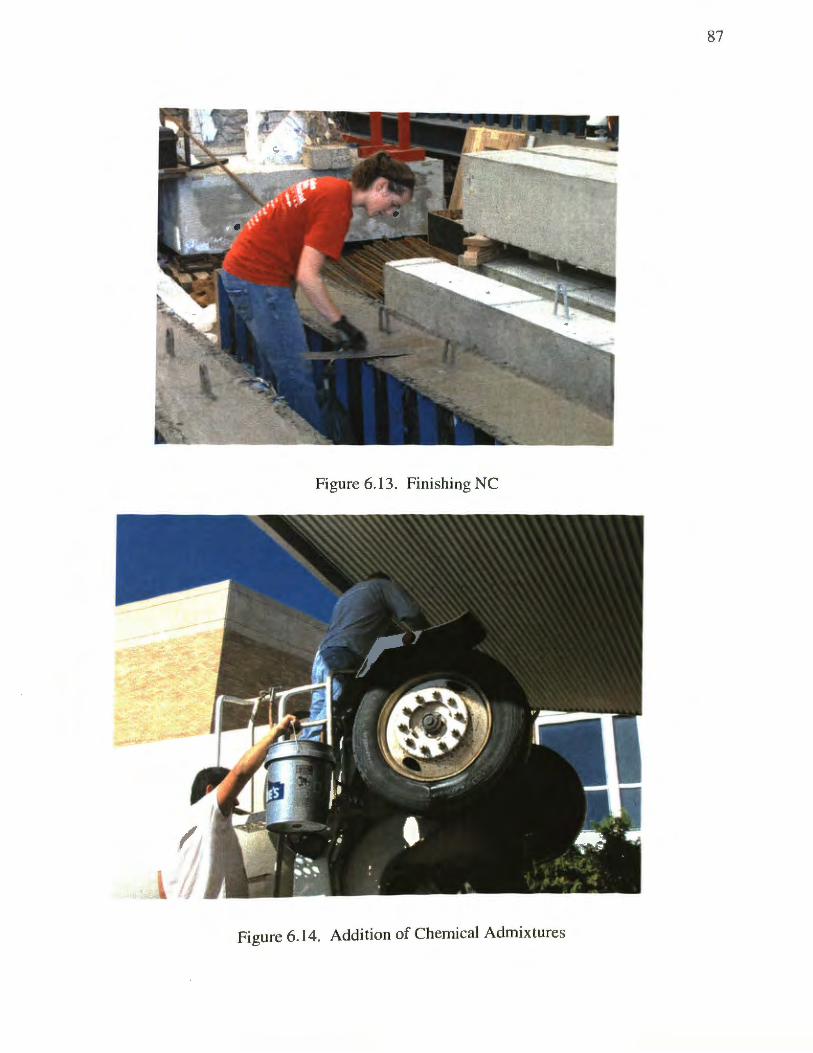
87
Figure 6.13. Finishing NC
Figure 6.14. Addition of Chemical Admixtures

88
Figure 6.15. Placing SCC
Figure 6.16. Slump Flow
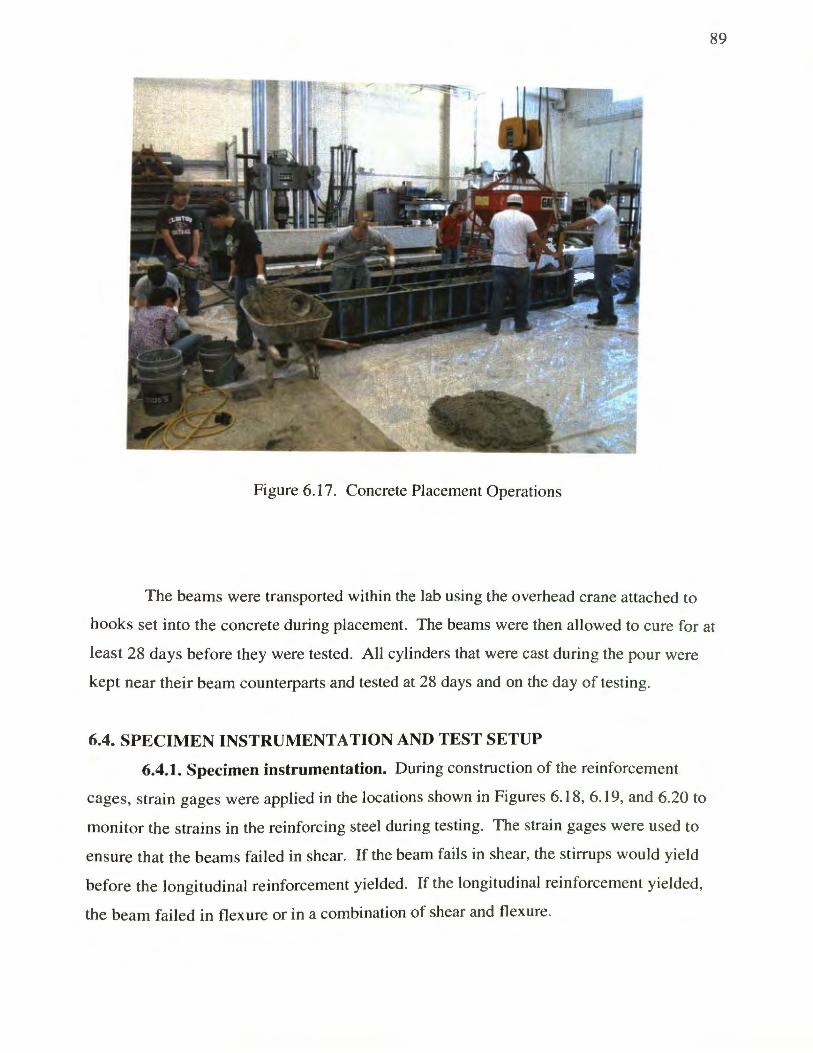
89
Figure 6.17. Concrete Placement Operations
The beams were transported within the Jab using the overhead crane attached to
hooks set into the concrete during placement. The beams were then a11owed to cure for at
least 28 days before they were tested. A11 cylinders that were cast during the pour were
kept near their beam counterparts and tested at 28 days and on the day of testing.
6.4. SPECIMEN INSTRUMENTATION AND TEST SETUP
6.4.1. Specimen instrumentation. During construction of the reinforcement
cages, strain gages were applied in the locations shown in Figures 6.18, 6.19, and 6.20 to
monitor the strains in the reinforcing steel during testing. The strain gages were used to
ensure that the beams failed in shear. If the beam fails in shear, the stirrups would yield
before the longitudinal reinforcement yielded. If the longitudinal reinforcement yielded,
the beam failed in flexure or in a combination of shear and flexure.

90
Strain Gage (typ )
. : I~ 11
/ t--r1 ~~ rr
. 66 5J in . /
~. ~II v
~I .. :'f _, I~
v L\ ~ tr
I 1. It;. I JCI .. .l ::' ~
1 ~ / J~l
Figure 6.18. Strain Gage Location- Beam With No Stirrups
' (,6 S:l rr
1- ' II'
~~ [~ ir ~
11\r .. :t ~ ~ ~ in
9 ·=C rr I : I /~ .-~ CO I~ .52:, ir
~ ) 4 OD 1r1
Figure 6. 19. Strain Gage Locations- Beam With 7 in. Stirrup Spacing
'66 ~<l t • (: 7'' If t- r1 ~() ir
5 00 lr
~ 1r .. 5f:
00 II'
:0 1 / 'J r• -{l.l 2~
/.OC lrr jp
57 OJ 1r.
Figure 6.20. Strain Gage Locations - Beam With 5 in . Stirrup Spacing

91
To monitor the deflection of the beam, a bracket was attached to the side of the
beam at the midpoint of the span. A stand was constructed to hold an LVDT vertically
and measure the deflection of the beam at the midpoint. The setup is shown in Figure
6.21. The L VDT was attached to a data acquisition system (DAS) which recorded the
deflection as the test progressed. The DAS is shown in Figure 6.22. The test was
performed in a displacement-controlled method at increments of 0.05 in. ( 1.3 mm) based
on preliminary calculations. After the deflection was achieved for each load step, the
actuators were stopped and the deflection was held constant until an operator signaled the
program to proceed to the next deflection interval. Also connected to the DAS were load
cells located within the actuators. As testing progressed, the load cells relayed the load
applied by the actuator to the DAS where the information was recorded. The test was
assumed to be complete when the beam continued to deflect but no additional load was
applied by the actuators. Typically, when this occurred, the actuators were run through
two more deflection intervals to ensure that additional load would not be supported by the
beam.
Figure 6.21. L VDT
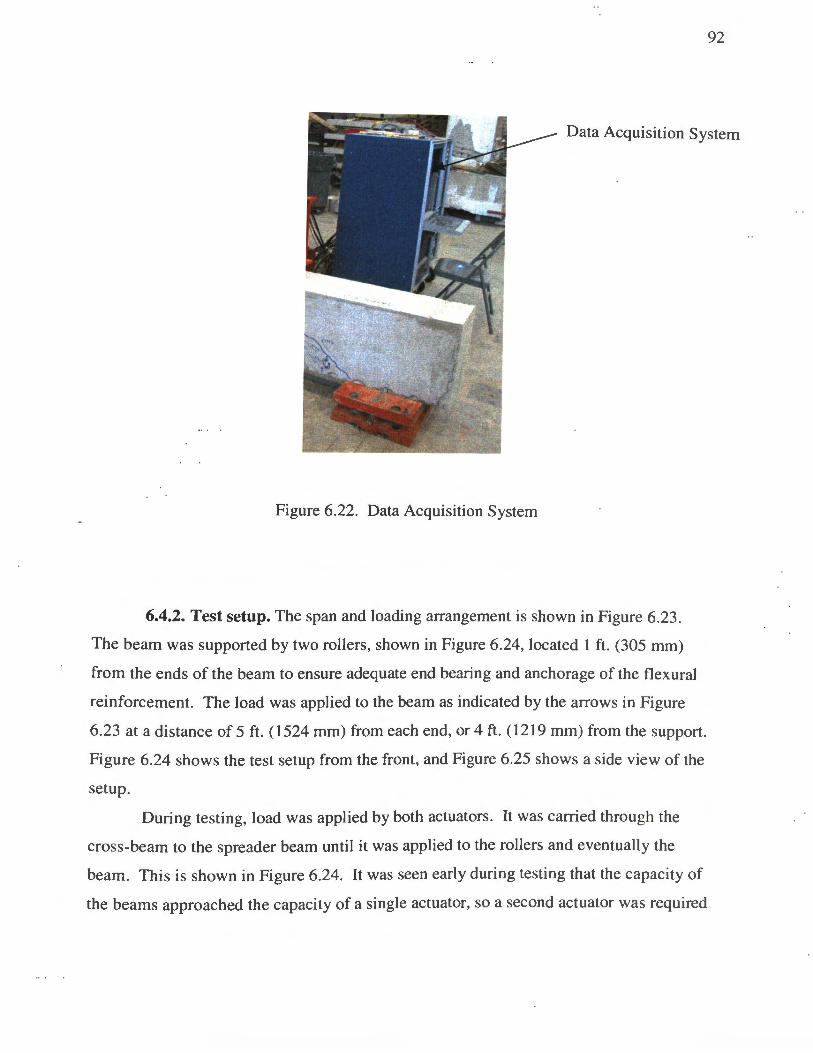
92
Data Acquisition System
Figure 6.22. Data Acquisition System
6.4.2. Test setup. The span and loading arrangement is shown in Figure 6.23 .
The beam was supported by two rollers, shown in Figure 6.24, located 1 ft. (305 mm)
from the ends of the beam to ensure adequate end bearing and anchorage of the flexural
reinforcement. The load was applied to the beam as indicated by the arrows in Figure
6.23 at a distance of 5 ft. ( 1524 mm) from each end, or 4 ft. ( 1219 mm) from the support.
Figure 6.24 shows the test setup from the front, and Figure 6.25 shows a side view of the
setup.
During testing, load was applied by both actuators. It was carried through the
cross-beam to the spreader beam until it was applied to the rollers and eventually the
beam. This is shown in Figure 6.24. It was seen early during testing that the capacity of
the beams approached the capacity of a single actuator, so a second actuator was required

to ensure that testing could be completed. This required the use of the steel cross-beam
to transfer the load to the spreader beam.
93
Several different testing protocols were available for testing. The protocol that
was selected directed the actuators to apply load to the beam until a deflection of 0.05 in.
( 1.27 mm) was achieved. At this point, the actuators stopped and held their position
while researchers observed and marked any cracks that had formed in the concrete.
Photos were taken for the purpose of data analysis at a later time. When all personnel
were safely away from the beam and photos had been taken, the actuators applied load
again until the beam deflected an additional 0.05 in. (1.27 mm). This process continued
until the beam continued to deflect but the actuators could not apply additional load. At
this point, the data was saved, the actuators raised, and the failed beam was removed.
--------14.0 ft.----------t
1
~.. • • • .. "'· : • - • ••• • ••• • . • • · . ' :II -4 . .. ' • ~· ' 1 ' ~ o ... , ' .;.. • o 1 • ' • f ' • j ,I I o I " ~ 10 I 1 \ I o o
~ J : , ... til I ( I 1 I ' I~ II ,.I , I I f' I • 0 I I I 1 ..t', ' • I 4. , ' I , ' .. , I ... I I • I
·.:: ·.- · ; ·~·~ ... · · ... ... ·:·.:·· .... :... : _~ . < . ·~~· . ~~·i·: ... · :~··~ -.:. .~ _·· .. ·· •. ~· ·," .:· ; . ·>" ~~ .. ·· -.. ~ .. · - ~.oll _ ._ • • _ ... .lo< .. ;·4 ··. •.; ·.;;· .,: J-1 1 ° .. ' • ~ I I II # t I I 0 1 1 1 ~ I 4 .. I .. I 1\, I, 0 o • 1 • ' 0 ~~ •
1 0 • • I I ~~ . A:· . ~: ( ~;. ·.~ > ) .· . ~: < ..•.. ,., .•.. ·. ; ;· ·~ 7\>.
1.._____.0--'--ft-. -4.0 ft.-....J------4.0 ft.--'---4.0 ft.----1.0~t
Figure 6.23. Loading Locations for Full-Scale Shear Specimens

94
Actuators
Spreader-Beam Cross-Beam
Rollers
Figure 6.24. Shear Test Setup- Front View
Figure 6.25. Shear Test Setup- Side View

95
6.5. MATERIAL STRENGTH TESTING AND RESULTS
This section contains the results of material testing for the full-scale beam shear
specimens. This included tensile strength testing of the reinforcing steel and compressive
strength testing of the concrete.
6.5.1. Tensile strength of reinforcing steel. Tensile strength testing of the
reinforcing steel was performed in accordance with ASTM ES-09, "Standard Test
Methods for Tension Testing of Metallic Materials" (ASTM E8, 2009). The specimens
used for testing were No. 3, No.4, and No. 8 bars, Sin. (1220 mm) in length. The
specimens were obtained from the same shipment that was used to construct the
reinforcement cages for the full-scale specimens. The reinforcing specimens were tested
on the Tinius-Olsen testing machine in the Construction Materials Load Frame
Laboratory located in the Butler-Carlton Civil Engineering Hall. Specimens were loaded
continuously and without shock to the breaking point.
The tensile strength test for the reinforcement steel was conducted in accordance
with ASTM E8. The specific method that was used was the 0.5 percent offset method.
Steel was ordered to have a strength of 60,000 psi (430 MPa), and this test was performed
to ensure that steel used met this requirement and so that the actual yield strength would
be used in evaluating the response of the beams. All reinforcement met the minimum
60,000 psi (430 MPa) yield strength, and the results are shown in Table 6.4.
6.5.2. Compressive Strength of Concrete. Compression testing was performed
in accordance with ASTM C39-10, "Standard Test method for Compressive Strength of
Cylindrical Concrete Specimens" (ASTM C39, 201 0). The specimens used for this were
4-in.-diameter ( 100 mm) by 8-in.-long (200 mm) cylinders cast in the Concrete
Laboratory of Butler-Carlton Hall (CLBCH). Testing was conducted in the Load Frame
Room of Butler-Carlton Hall (LFBCH). The testing apparatus used was a 1200 kip
(5,340 kN) Forney Compression Machine. The load was applied continuously and
without shock to the specimen at a rate of 35±7 psi/s (0.25±0.05 MPa/s). Based on the
specimen size, this would correspond to a loading rate of 440± 188 1bs per second
( 1.9±0.8 kN/s).

96
A total of 9 cylinders were cast for each set of beams poured. All specimens were
cast in plastic cylinder molds with caps and stored beneath plastic so they would
experience the same atmospheric conditions as the beams. The specimens were removed
from their molds at the same time as the beams, marked and placed beside the beams to
cure until the day of testing. The results of the compression testing can be seen in Table
6.5.
Table 6.4. Tensile Strength of Steel
Yield Specimen Strength
Bar Size Number (psi)
1 68450
2 66900
No.3 3 67900
Average 67750
Standard Deviation 785
cov 1.1%
1 65000
2 65650
No. 4 3 64000
Average 64880
Standard Deviation 830
COV 1.2%
1 71750
2 71100
No.8 3 71800
Average 71550
Standard Deviation 390
cov 0.5%
I psi = 0.006 MPa

Table 6.5. Concrete Compressive Strength
Test-day Average
Specimen f'c (psi) (psi) cov (%)
7270
Control- 7370
NS 7350 7330 0.7
6890
7540
Control-7 7200 7210 4.5
5990
5460
Control-S 5380 5610 5.9
8580
8950
SCC-NS 8700 8743 2.2
7680
8260
SCC-7 8450 8130 4.9
7370
7560
SCC-5 7330 7420 1.7
I psi = 0.006 MPa
6.6. TEST RESULTS Shear testing of the NC and SCC beams was performed in SERLBCH, and data
was collected and stored using a data acquisition system. This section contains the
results of those tests. To begin, the loads for both actuators was plotted against the
deflection of the beam. Plots for load vs. deflection are in Figures 6.26 through 6.31.
97
The variables that were tested for shear strength were the type of concrete (SCC
or NC) and the amount of shear reinforcement. Three beams were tested at each
reinforcement level.

-II) c. ~ -"0 co 0 _.
Vi Q.
32 --c IU 0
....1
300
2SO
200
1SO
100
so
0
./ v .tiiiii/A ~ ~
A ,.,..
~ 0.0 0.2 0.4 0.6 0.8 1.0 1.2 1.4
Deflection (in.) I kip = 4.45 kN
I in.= 25.4 mm - NS - 1 - NS - 2 - NS-3
Figure 6.26. Load vs. Deflection Plot for NC - No Stirrups
300
2SO
200
1SO
100
so
0
0 0.2 0.4 0.6 0.8
Deflection (in.)
1 1.2 1.4 I kip = 4.45 kN
I in.= 25.4 mm
- control-7-1 - control-7-2 - control-7-3
Figure 6.27. Load vs. Deflection Plot for NC - 7 in. Spaced Stirrups
98

300
250
iii 200 a. ~
150 -"'C Rl 0
100 ...J
so
0
~ 'V"'
I~ ""' .....
~ ~V
/ 0 0.2 0.4 0.6 0.8 1 1.2 1.4
Deflection (in.) I kip = 4.45 kN
I in. = 25.4 mm
- control-5-1 - control-5-2 - Control-5-3
Figure 6.28. Load vs. Deflection Plot for NC - 5-in. Spaced Stirrups
-Ill a. g "'C Rl 0
...J
300
250
200
150
.-' 100
so
0
~ .... ....,.,.
_/ --p ~
0 0.2 0.4 0.6 0.8 1
Deflection (in.)
- SCC-NS-1 - SCC-NS-2 - SCC-NS-3
- -
1.2 1.4
I kip = 4.45 kN
I in . = 25.4 mm
Figure 6.29. Load vs. Deflection Plot for SCC - No Stirrups
99

300
2SO
- 200 "' c..
:;;:: - 1SO "'C IU 0
100 .....
so
0
0 0.2 0.4 0.6 0.8 1
Deflection (in.)
- scc-7-1 - scc-7-2 - scc-7-3
1.2 1.4
I kip = 4 .45 kN
I in . = 25.4 mm
Figure 6.30. Load vs. Deflection Plot for SCC- 7 in. Spaced Stirrups
300
2SO
Vi 200 c.. g, 1SO
"'C IU 0 100 .....
so
0
0 0.2 0.4 0.6 0.8 1
Deflection (in.)
- scc-s-1 - scc-s-2 - scc-s-3
1.2 1.4
I kip= 4.45 kN
I in . = 25.4 mm
Figure 6.31. Load vs. Deflection Plot for SCC - 5 in. Spaced Stirrups
100

101
Table 6.5 contains the shear force carried by each beam tested as well as the shear
force contributed by the steel reinforcement and the concrete. The shear force from the
steel reinforcement was determined by observing the number of stirrups crossing the
critical (failure) shear crack and summing the forces in those stirrups as determined from
the measured strains (e.g., Hawkins et al., 2005; Kuchma, 2009; Laskar et al., 20 J 0).
The shear force due to the concrete was then determined by subtracting the stirrup force
from the total shear force. Figure 6.32 shows graphically the shear strength of the
concrete for each of the shear reinforcement scenarios as well as for both concrete types.
However, it should be noted for comparison purposes that the SCC concrete strength
exceeded the NC concrete strength, as shown in Table 6.6.
To examine how aggregate interlock may have affected the shear resistance of the
concrete, the shear force at development of the first diagonal shear crack, Vd, and the
shear force at failure, Vu, were recorded for further analysis. The shear force at the
development of the first diagonal shear crack was determined by visual inspection of the
concrete. When the first crack became visible the load was recorded. The analysis is
contained in Section 6.7, but the values determined during testing are shown in Table 6.7.
To find the contribution that the steel had on the shear strength of the beam it was
first necessary to find and plot the strain of the stirrups. A typical plot of the strain in the
stirrups is shown in Figure 6.33. The steel was assumed to have yielded if the strain was
greater than 0.0023. This value was determined by dividing the tensile strength of the
steel, determined through testing (see Section 6.5), by the modulus of elasticity of steel.
The plot below shows that the steel did in fact yield since the strain was greater than
0.0023.
In addition to studying the strain within the steel, the crack patterns experienced
by the beams were also observed. It was seen that generally the degree of cracking
increased as the amount of stirrups increased. During testing, cracks were marked using
a permanent marker after each deflection of 0.05 in. (1 .27 mm). A typical crack pattern
progression can be seen in Figures 6.34 through 6. 37 for beams constructed with NC,
and in Figures 6.38 through 6.42 for beams constructed with SCC. For both cases, cracks
typically began on the tension face of the beam near the loading points. As the cracks

102
began to increase in size, they also began to slant at an angle approximately 30 to 45
degrees measured from the bottom of the beam to the crack. Typically at failure, the
cracks were spaced approximately the same distance as the stirrups and failure occurred
on one side of the beam. The failure crack typically extended from the beam support to
the loading point on the top side of the beam. Figures 6.43 through 6.60 are photographs
of each of the test specimens after failure.
Table 6.6. Tested Shear Strength
.. Shear Force (kip)
Specimen Stirrup
Spacing (in.) v Vs Vc
Controi-NS-1 68.6 0.0 68.6 No
45.8 0.0 45.8 Controi-NS-2 Stirrups
Controi-NS-3 49.1 0.0 49.1
Control-7-1 61.3 29.8 31.4
Control-7-2 7 97.6 44.7 52.9
Control-7-3 97.9 44.7 53.1
Control-5-1 108.5 59.6 48.8
Control-5-2 5 101.8 44.7 57.1
Control-5-3 94.1 59.6 34.4
SCC-NS-1 40.9 0.0 40.9 No
56.2 0.0 56.2 SCC-NS-2 Stirrups SCC-NS-3 46.9 0.0 46.9
SCC-7-1 105.3 44.7 60.6
SCC-7-2 7 115.6 29.8 85.8
SCC-7-3 101.0 44.7 56.3
SCC-5-1 126.6 59.6 67.0
SCC-5-2 5 130.7 59.6 71.1
SCC-5-3 120.8 44.7 76.1
I k1p- 4.45 kN

80 r--------------------========== ~ 70 r-----------------~=r----------~ 60
Eo so 111 ~ 40 V'l
~ 30 111 ~ 20
>~ 10
0
No Stirrups
7
Stirrup Spacing {in.)
• Control • SCC
5 I kip = 4.45 kN
I in . = 25.4 mm
Figure 6.32. Concrete Shear Strength Plot
Table 6.7. Vu andVd Values
Stirrup Vu vd
Specimen Spacing (in.)
(kip) (kip)
Controi-NS-1 68.6 32.5
Controi-NS-2 No
Stirrups 45.8 22.0
Controi-NS-3 49.1 25 .0
Control-7-1 61.3 21.0
Control-7-2 7 97.6 21.5
Control-7-3 97.9 15.5
Control-5-1 108.5 15.0
Control-5-2 5 101.8 14.5
Control-5-3 94.1 19.5
SCC-NS-1 40.9 22 .0 No 56.2 21.5 SCC-NS-2 Stirrups
SCC-NS-3 46.9 21.5
SCC-7-1 105.3 18.5
SCC-7-2 7 115.6 20.5
SCC-7-3 101.0 24.5
SCC-5-1 126.6 22.0
SCC-5-2 5 130.7 24.0
SCC-5-3 120.8 21.5
1 kip = 4.45 kN 1 in.= 25.4 mm
103

104
120
100
- 80 Ill Q.
:i2 - 60 "0
"' 0 ..... 40
20
0
-0.001 0 0.001 0.002 0.003 0.004 0.005 0.006
Strain I kip= 4.45 kN
Figure 6.33. Typical Stirrup Strain Plot as a Function of Load
140ft . .
,.
I I " ' "\
1\ 1\ 4.0 ft. 4.0 ft. 4. 0 ft.
1.0 ft. I ft = 0.305 m 1.0 t Figure 6.34. Typical Crack Pattern for NC - Stage I

105
14.0 ft.
II
/ ~~ !1 I \\'\\~
1\ 1\ 4.0 ft. 4.0 ft. 4.0 ft.
I .0 ft. I ft = 0.05 m 1.0 t
Figure 6.35. Typical Crack Pattern for NC- Stage 2
140ft I I
1
/~/?@ \~ 1\ 1\
4.0 ft. 4.0 ft. 4.0 ft. 1.0 ft. I ft = 0.305 m 110 t
Figure 6.36. Typical Crack Pattern for NC - Stage 3

106
r---------14.0 ft.----------1
L..-----'----4. 0 ft .----J..---4. 0 ft.----L.---4. 0 ft.-~--.J
I .0 ft. I ft = (U05 m 1.0 t
Figure 6.37. Typical Crack Pattern for NC - Stage 4
140ft .
' ,.
I I \ " "\
7\ 1\ l
4.0 ft. 4.0 ft. 4.0 ft. 1 . 0 ft. I ft = 0.305 m 1.0 t
Figure 6.38. Typical Crack Pattern for SCC - Stage I

107
14.0 ft.
, ,.
r 1 \ "' ' ~
(\ 1\ I 4.0 ft. 4.0 ft. 4.0 ft.
]
1 . 0 ft. I ft = CU05 rn 1.0 t
Figure 6.39. Typical Crack Pattern for SCC - Stage 2
140ft .
, ,.
/ / ( f \ ~ (\ 1\
I 1 4.0 ft. 4.0 ft. 4.0 ft.
1 .0 ft. I ft = 0 . ~05 m 1.0 t
Figure 6.40. Typical Crack Pattern for SCC - Stage 3
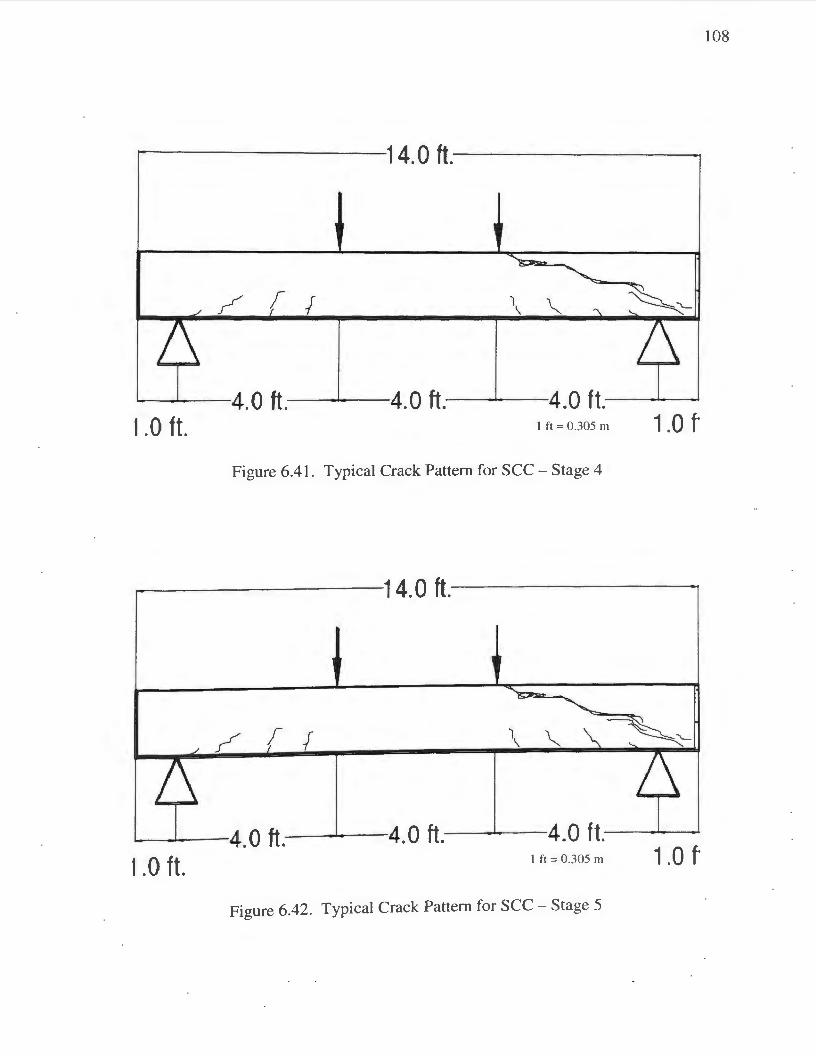
108
ft 14.0 .
' ~
_/ / ( f \ ~ "'\ ~---1\ 1\
4.0 ft. 4.0 ft. 4.0 ft. I I .0 ft. I ft = 0.305 m 1.0 t
Figure 6.41. Typical Crack Pattern for SCC - Stage 4
140ft .
1 ,~
~
./ / ( f \ ~ ~~---
1\ 1\ 0 ft. 4.0 ft. 4.0 ft. 4.
I .0 ft. I ft = 0.305 m 1.0 t
Figure 6.42. Typical Crack Pattern for SCC - Stage 5

109
Figure 6.43. Control-NS-1 Beam at Failure
Figure 6.44. Control-NS-2 Beam at Failure
Figure 6.45. Control-NS-3 Beam at Failure

II 0
Figure 6.46. Control-7-1 Beam at Failure
Figure 6.47. Control-7-2 Beam at Failure
Figure 6.48. Control-7-3 Beam at Failure

I I I
Figure 6.49. Control-5-1 Beam at Failure
Figure 6.50. Control-5-2 Beam at Failure
Figure 6.51. Control-5-3 Beam at Failure

112
Figure 6.52. SCC-NS-1 Beam at Failure
Figure 6.53. SCC-NS-2 Beam at Failure
Figure 6.54. SCC-NS-3 Beam at Failure
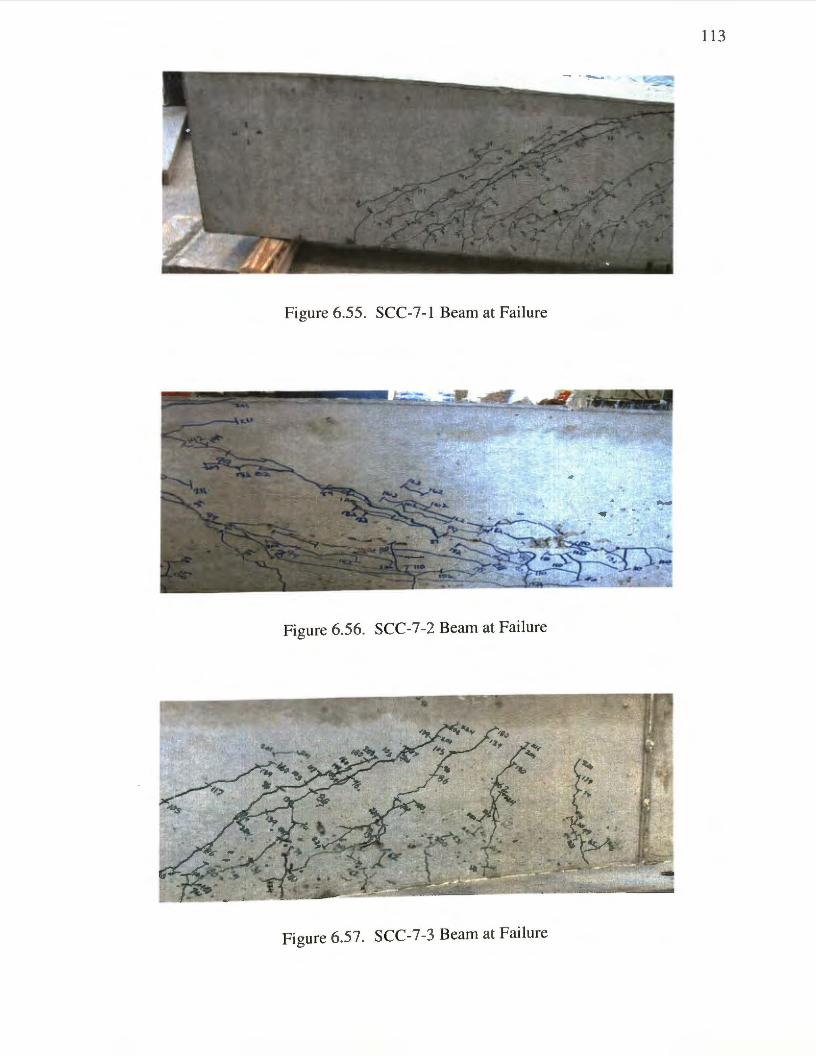
113
Figure 6.55. SCC-7-1 Beam at Failure
Figure 6.56. SCC-7-2 Beam at Failure
Figure 6.57. SCC-7-3 Beam at Failure
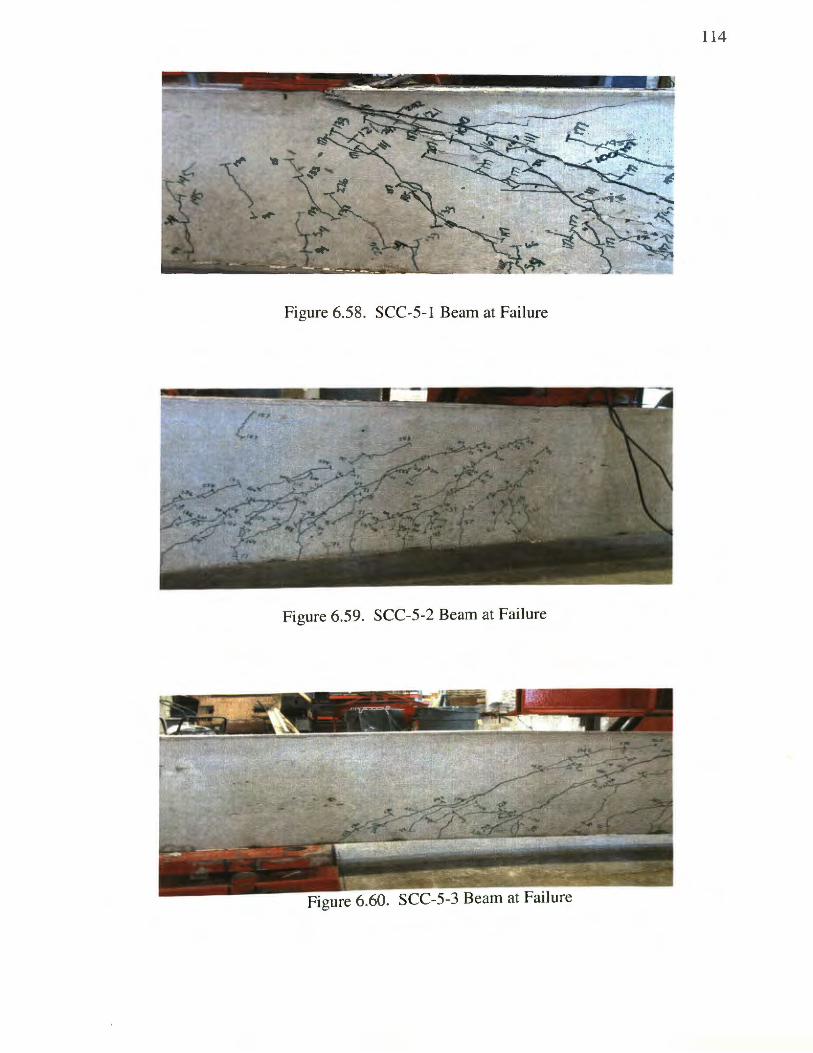
114
Figure 6.58. SCC-5-1 Beam at Failure
Figure 6.59. SCC-5-2 Beam at Failure
Figure 6.60. SCC-5-3 Beam at Failure

115
6.7. DATA ANALYSIS AND INTERPRETATION
Data analysis began by first examining the load-deflection plots as shown in
Figures 6.26 through 6.31. In general, the load-deflection plots indicated a linear
relationship between the load and deflection for the shear specimens. This behavior
would indicate a shear failure as opposed to a flexural failure. It was also noted during
testing that there was often little warning before the beam failed. This sudden failure
translated to the graphs as a continually increasing load compared with the deflection
until failure at which point the load dropped suddenly. It was observed that as the
amount of shear reinforcement increased, the load at which the beams failed also
increased.
To determine the contribution of the stirrups to the overall shear strength of the
beams, it was necessary to plot the load-strain values for the stirrups within each
specimen. Figure 6.33 is an example of one of these plots. It can be seen that initially
there is not a significant amount of strain within the stirrup. As the load applied to the
beam continues to increase, the stirrup begins to go into tension at approximately vd. This would seem to indicate that at this point, the concrete can no longer carry the entire
load and must rely, at least partially, on the stirrups for strength. As load continues to be
applied, the stirrups eventually yield. This happens when the strain in the steel is greater
than 0.0023. For a vast majority of the beams, the stirrups yielded prior to failure of the
beam. For the stirrups that did not yield, the yield strength of the steel could not be used
to estimate V5 • Instead, the measured strain at failure was multiplied by the modulus of
elasticity of the steel to determine the load that the stirrup supported at failure. Values
used to determine the contribution of the stirrups to shear strength are shown in Table
6.8.
In order to compare the shear strength that was determined through testing with
the shear strength that was predicted by ACI (2008) and AASHTO (2008), the ratio of the
test value to the predicted value was calculated. This ratio is given in Table 6.9 and is
based on the actual material properties for concrete strength and stirrup yield strength.
Ideally, the ratio would be greater than 1.0, which would indicate that the shear strength
was conservatively predicted by the codes. The ratios were calculated for three different

116
design equations. The first two were based on ACI Equations 11-3 and 11-5 (ACI 318,
2008).
Table 6.8. Calculation of Ys
# Specimen Stirrups Av (in 2 )
Vs
Crossed (kip)
Controi-NS-1
0 0 0.0
Controi-NS-2
0 0 0.0
Controi-NS-3
0 0 0.0
Control-7-1 2 0.44 29.8
Control-7-2 3 0.66 44.7
Control-7-3 3 0.66 44.7
Control-5-1 4 0.88 59.6
Control-5-2 3 0.66 44.7
Control-5-3 4 0.88 59.6
SCC-NS-1 0 0 0.0
SCC-NS-2 0 0 0.0
SCC-NS-3 0 0 0.0
SCC-7-1 3 0.66 44.7
SCC-7-2 2 0.44 29.8
SCC-7-3 3 0.66 44.7
SCC-5-1 4 0.88 59.6
SCC-5-2 4 0.88 59.6
SCC-5-3 3 0.66 44.7
I kip = 4.45 kN 1 in.= 25.4 mm
The third set of ratios was based on the sectional analysis in the AASHTO
LRFD Code (2008). As shown in Table 6.7, ACI Equation 11-3 and AASHTO were
conservative throughout testing with ratios consistently greater than 1.0. However, ACI
Equation 11-5 was not always conservative since there were ratios less than 1.0 in some

117
cases. However, the very large amount of longitudinal steel ( 4.5%) is likely the reason
that the ratio is less than 1.0 for ACI Equation 11-5. More importantly, both the NC and
SCC beams had similar ratios when using ACI Equation 11-5. This would seem to
indicate that when comparing the two concrete types, the sec performed as well as the
NC.
Table 6.9. Vtest I Vcode
Vtest / Vcode
Specimen Stirrup Vtest
Spacing (in.) (kip) ACI ACI AASHTO
Eq. 11-3 Eq. 11-5
Controi-NS-1 68.6 2.3 1.3 2.3 No
Controi-NS-2 Stirrups 45.8 1.5 0.9 1.5
Controi-NS-3 49.1 1.6 0.9 1.6
Control-7-1 61.3 1.0 0.7 1.1
Control-7-2 7 97.6 1.6 1.2 1.7
Control-7 -3 97.9 1.6 1.2 1.7
Control-5-1 108.5 1.6 1.2 1.7
Control-5-2 5 101.8 1.5 1.1 1.6
Control-5-3 94.1 1.3 1.0 1.4
SCC-NS-1 40.9 1.2 0.7 1.2 No
56.2 1.7 1.0 1.7 SCC-NS-2 Stirrups
SCC-NS-3 46.9 1.4 0.8 1.4
SCC-7-1 105.3 1.7 1.2 1.8
SCC-7-2 7 115.6 1.8 1.3 1.9
SCC-7-3 101.0 1.6 1.2 1.7
SCC-5-1 126.6 1.7 1.3 1.8
SCC-5-2 5 130.7 1.8 1.4 1.9
SCC-5-3 120.8 1.6 1.3 1.7
I k1p - 4.45 kN I m. 25.4 mm

118
After comparing the total shear strength for each of the beams, the shear strength
of the concrete was evaluated for both the specimens without transverse reinforcement
and those with transverse reinforcement. The result is shown in Table 6.10 and
graphically in Figure 6.61. The test value for Vc was calculated by subtracting Vs from V,
where the value of Vs was determined through testing. The values predicted by ACI
Equation 11-3 were 1.1 to 2.7 times smaller than the values determined through testing,
indicating that for these specimens, ACI Equation 11-3 was conservative. The values for
the shear strength of concrete determined using ACI Equation 11-5 were not always
conservative since some ratios were less than 1.0. This result would indicate that the
shear strength predicted using this equation exceeded the shear strength determined
through testing. However, this result may have been a function of the very large amount
of longitudinal steel (4.5%). It was noted, however, that ratios of the tested shear
strength to code predicted shear strength were less than 1.0 for both the NC and the SCC,
and the ratios were relatively consistent between the two types of concrete. This result
could indicate that the SCC performed as well as the NC. Finally, concrete shear
strengths determined through testing were consistently higher than the concrete shear
strengths predicted using the AASHTO equation. This would seem to indicate that
designing with this set of equations would be conservative when determining the shear
strength for both NC and SCC.
Table 6.11 offers a direct comparison between the two concrete types by
normalizing the concrete contribution as a function of the square root of compressive
strength. The tested values listed in the table are repeated from Table 6.5. The last
column indicates the normalized value of the tested concrete shear strength . Figure 6.62
is a graphical representation of the same values. The table and figure indicate that with a
reinforcement ratio of 4.5%, the normalized value of the tested concrete strength ranged
between 2.9 and 4.7. Figure 6.63 is a plot of the extensive amount of test data collected
by Tureyen and Frosch (2004) on concrete shear strength as a function of the longitudinal
reinforcement ratio, and includes the normalized concrete shear strength values
determined in this study. Tureyen and Frosch observed that the coefficient of 2 used in
ACI Equation 11-3 to determine the concrete shear strength was not always accurate. In
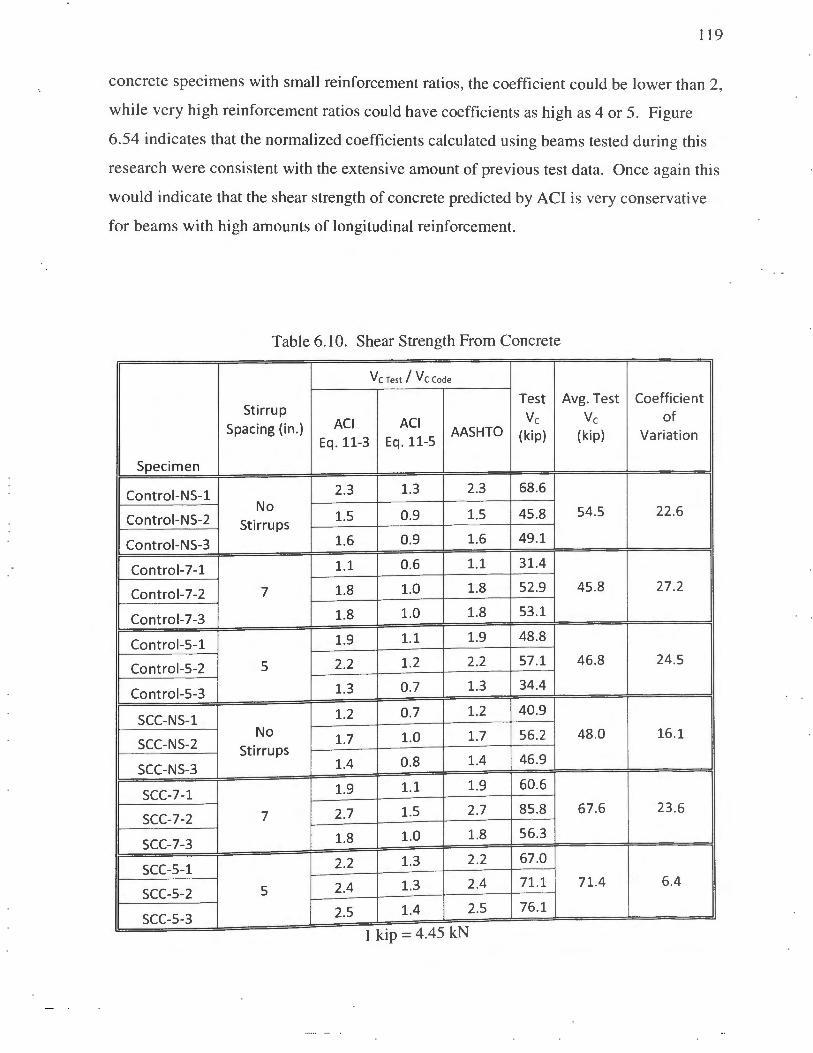
119
concrete specimens with small reinforcement ratios, the coefficient could be lower than 2,
while very high reinforcement ratios could have coefficients as high as 4 or 5. Figure
6.54 indicates that the normalized coefficients calculated using beams tested during this
research were consistent with the extensive amount of previous test data. Once again this
would indicate that the shear strength of concrete predicted by ACI is very conservative
for beams with high amounts of longitudinal reinforcement.
Table 6.1 0. Shear Strength From Concrete
V C Test / V C Code
Test Avg. Test Coefficient Stirrup
Vc Vc of Spacing (in.) ACI ACI
AASHTO Eq. 11-3 Eq. 11-5 (kip) (kip) Variation
Specimen
Controi-NS-1 2.3 1.3 2.3 68.6 No
1.5 0.9 1.5 45.8 54.5 22 .6 Controi-NS-2 Stirrups
Controi-NS 3 1.6 0.9 1.6 49.1
Control-7-1 1.1 0.6 1.1 31.4
Control-7 -2 7 1.8 1.0 1.8 52.9 45 .8 27.2
Control-7 -3 1.8 1.0 1.8 53.1
Control-5-1 1.9 1.1 1.9 48.8
Control-5-2 5 2.2 1.2 2.2 57.1 46.8 24.5
Control-5-3 1.3 0.7 1.3 34.4
SCC-NS-1 1.2 0.7 1.2 40.9
No 1.7 1.0 1.7 56.2 48 .0 16.1 SCC-NS-2 Stirrups
1.4 0.8 1.4 46.9 SCC-NS-3
1.9 1.1 1.9 60.6 SCC-7-1
SCC-7-2 7 2.7 1.5 2.7 85.8 67.6 23 .6
1.8 1.0 1.8 56.3 SCC-7-3
2.2 1.3 2.2 67.0 SCC-5-1
SCC-5-2 5 2.4 1.3 2.4 71.1 71.4 6.4
2.5 1.4 2.5 76.1 SCC-5-3
I kip 4.45 kN

120
140.0
0: 120.0 :i2
100.0 -~ b.o 80.0 c:
I
Ql .... 60.0 ... II) .... 40.0 "' Ql ~
20.0 II)
0.0 1 I
'::<~c., '::<'\ '::<<-, (J~c., (J'\ (J<-,
<..0 ,o ,o c.,G c.,G
~><.; ~ c.,G ~><.; c.P <..-0
c...-O
Specimen I kip = 4.45 kN
• ACI11-3 • ACill-5 • AASHTO • Test
Figure 6.61 . Concrete Shear Strength

12 1
Table 6.11. Tested Shear Strength Compari son
Stirrup Shear Force (kip) Vc t es t
Specimen Spacing bwdJlZ (in.) v v, Vc Vc Avg.
Controi-NS-1
68.6 0.0 68.6
Controi-NS- No 2 Stirrups
45 .8 0.0 45 .8 54.5 3.6
Controi-NS-49.1 0.0 49.1
3
Control-7-1 61.3 29.8 31.4
Control-7 -2 7 97.6 44.7 52.9 45.8 3.1
Control-7 -3 97 .9 44.7 53 .1
Control-5-1 108.5 59.6 48.8
Control-5-2 5 101.8 44.7 57.1 46.8 3.6
Control-5-3 94.1 59.6 34.4
SCC-NS-1 40.9 0.0 40.9
SCC-NS-2 No 56.2 0.0 56.2 48.0 2.9
Stirrups
SCC-NS-3 46.9 0.0 46.9
SCC-7-1 105.3 44.7 60.6
SCC-7-2 7 115.6 29.8 85 .8 67.6 4.3
SCC-7-3 101.0 44.7 56.3
SCC-5-1 126.6 59.6 67 .0
SCC-5-2 5 130.7 59.6 71.1 71.4 4.7
SCC-5-3 120.8 44.7 76.1
I kip = 4.45 kN I tn . 25.4 mm
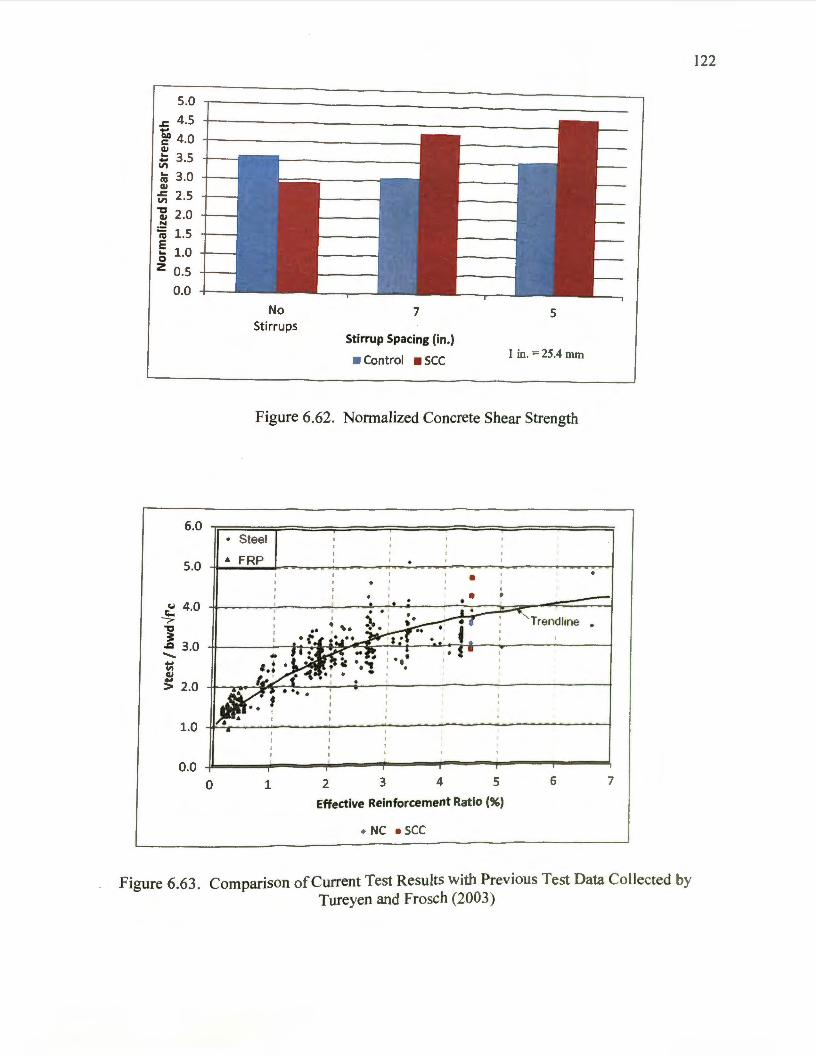
5.0
.J:. 4.5 tO c 4.0 111
~ 3.5 ~ 3.0 111 ~ 2.5 -g 2 .0 N
~ 1.5 E 5 1.0 z 0.5
0.0
6.0
5.0
~ 4.0 ~ "CI ~
.a 3.0 -t: 111 > 2.0
1.0
0.0 0
No Stirrups
7
Stirrup Spacing (in.)
• Control • SCC
5
I in. = 25.4 mm
Figure 6.62. Nonnalized Concrete Shear Strength
• Steel
• FRP • •
1 2 3 4 5 6
Effective Reinforcement Ratio (%)
• NC • sec
7
Figure 6.63. Comparison of Current Test Results with Previous Test Data Collected by Tureyen and Frosch (2003)
122

123
To examine the effect of aggregate interlock on the shear resistance of the
concrete, Vd (development of first diagonal shear crack) and Vu (ultimate shear) were
recorded for each test specimen. The ratio of V /Vd was then calculated and compared for
both types of beams, and this data is shown in Table 6.12. Figure 6.53 is a graphical
representation of this ratio. A higher V /Vd ratio would indicate that the beam was more
ductile and gave an earlier indication of failure before complete collapse. Obviously, this
characteristic is extremely beneficial in the event that overloading would occur. More
importantly, this ratio offers another comparison of the shear behavior between the two
concrete types.
As shown in Figure 6.64, both concrete types followed the same general trend.
The value of V /Vd increased from 2.1 with no stirrups to 6.4 with the smallest stirrup
spacing of Sin. (127 mm). For the SCC specimens, as the spacing between the stirrups
decreased, the ductility also increased. The value of V /Vd increased from 2.2 to 5.6. In
comparing the response of the two concrete types, the error bars in Figure 6.53 indicate
that there was not a significant statistical difference between the NC and SCC specimens.
In all three shear reinforcement scenarios, the error bars overlap. It is also worth noting
that as the amount of shear reinforcement increased, the value of V /Vd also increased, as
expected.
10.0
8.0
"C 6.0 > -:::J 4.0 > 2.0
0.0
No Stirrups
7 5
Stirrup Spacing (in.) 1 in. = 25.4 mm
• Control • SCC
Figure 6.64. V uN ct Plot

124
Table 6.12. VuNd
Stirrup Vu
Specimen Spacing vd Vu/Vd
Average Coefficient
(in.) (kip) (kip) Vu/Vd of
Variation
Controi-NS-1 68.6 32.5 2.1 No
Controi-NS-2 Stirrups
45.8 22.0 2.1 2.1 3.8
Controi-NS-3 49.1 25.0 2.0
Control-7-1 61.3 21.0 2.9
Control-7-2 7.0 97.6 21.5 4.5 4.6 37.0
Control-7-3 97.9 15.5 6.3
Control-5-1 108.5 15.0 7.2
Control-5-2 5.0 101.8 14.5 7.0 6.4 21.0
Control-5-3 94.1 19.5 4.8
SCC-NS-1 40.9 22.0 1.9
SCC-NS-2 No
Stirrups 56.2 21.5 2.6 2.2 17.1
SCC-NS-3 46.9 21.5 2.2
SCC-7-1 105.3 18.5 5.7
SCC-7-2 7.0 115.6 20.5 5.6 5.2 17.3
SCC-7-3 101.0 24.5 4.1
SCC-5-1 126.6 22.0 5.8
SCC-5-2 5.0 130.7 24.0 5.4 5.6 2.8
SCC-5-3 120.8 21.5 5.6
1 k1p = 4.45 kN
6.8. CONCLUSIONS The test results were compared to ACI (2008) and AASHTO (2008) design
provisions for shear. It was observed that both AASHTO and ACI Equation 11-3 were
consistently conservative; however, ACI Equation 11-5 over predicted strength. It was
also observed that there was not a significant difference in strength when comparing NC
and SCC. Shear strengths determined through testing were not significantly different
between NC or SCC beams made with the same shear reinforcement. This result would
seem to indicate that as far as shear behavior, there is not a significant difference between

125
NC and SCC developed through the use of chemical admixtures, and that these elements
can be appropriately designed using existing ACI and AASHTO code provisions.
After comparing test values of concrete shear strength to values predicted by
design codes, the shear strengths were normalized to determine the shear strength
coefficients. These values were compared to the extensive amount of previous research
on shear strength of NC. The normalized coefficients ranged in value from 2.9 to 4.7.
These values were consistent with the previous research on shear strength of NC. It was
also observed that there was not a significant difference between coefficients for NC and
sec. To further compare NC and SCC V,/Vd plots were created. This plot compared
the load that the beam developed at the first shear crack (Vd) to the ultimate load at failure
(Vu). The result indicated that the ratio increased as the number of stirrups increased, as
predicted. The V u!Vd ratio increased from 2.1 in a beam with no stirrups to 6.4 in a beam
with a 5 in. (127 mm) stirrup spacing. It was observed that a comparable increase was
also seen in beams made with SCC. This result would seem to indicate that both NC and
sec benefit from an increase in the amount of shear reinforcement and, more
importantly, that the SCC behaves similarly to NC in terms of shear behavior.

126
7. FINDINGS, CONCLUSIONS, AND RECOMMENDATIONS
7.1. INTRODUCTION
sec has shown that it can be a very beneficial product to the construction
industry; however, because it is still relatively new to the industry, there are many
questions about its use. The purpose of this research was to begin to answer two of these
questions. The first was how shrinkage of SCC compared to shrinkage of NC. It is
known that the w!cm ratio has a significant effect on the shrinkage; so the hope was that
if the w!cm ratio was held constant and a highly flowable concrete was produced by using
chemical admixtures, there would not be an increase in shrinkage. The second question
that was addressed was how shear strength compared between SCC and NC. Many times
sec is produced by reducing the coarse aggregate content and increasing the paste
content. This approach can lead to a reduction in shear strength since coarse aggregate
interlock is essential for high shear strength. This project aimed to maintain a higher
coarse aggregate content and overcome the resulting loss in flowability through the
addition of a higher dosage of HRWR and VMA. The shear strength of the SCC could
then be compared to NC to determine if the shear strength was still acceptable.
In addition to answering these questions, testing performed was useful for the
development of a SCC and for the comparison to codes used in design. It is important
that the properties of sec are known so if there is a significant difference between the
properties of SCC and NC that these are taken into account in design. The tests
performed were selected to determine if the design parameters used for NC could also be
applied to sec.
7.2. FINDINGS
7.2.1. Fresh Concrete Property Tests. Throughout mix design development, it
was observed that concrete density and air content were not significantly different
between the SCC and the NC. This was as expected result since the major constitutions
of the concrete were not altered. The density of the concrete was found to be
approximately 146 Jb/ft3 (2340 kg/m3) for all concrete produced. The air content that was
desired was kept higher to aid in the workability and flowability of the concrete. An air

127
content of 6% was selected and air entraining admixture dosages were tested and adjusted
to achieve this air content.
During the mix development phase for SCC, the slump flow of the concrete was
determined by performing the slump flow test. It was observed that with the concrete
constitutions used, the slump flow reached its maximum amount at approximately 6 fl
oz/cwt (390 mL/1 00 kg) of HRWR. Beyond this point, there was not a significant
increase in the slump flow of the concrete even with additional HRWR. The highest
dosage of the HRWR tested was still used to maintain a high slump flow after the
addition of a VMA. VMA was introduced to the concrete mixture to prevent segregation.
It was observed that VMA improved the concrete's stability significantly without
reducing the slump flow of the concrete. By performing the slump flow test, the
flowabilty of the concrete could be determined, but to find the passing ability of the
concrete, the J-ring test was performed. It was observed that there was very little
difference between SCC produced using a combination of a HRWR and VMA to that of
an sec using a HRWR alone. There was also only a small difference between the
diameter of the concrete after the slump flow test and the J-ring test. This showed that
the concrete had a high passing ability since there was little difference between restrained
and unrestrained flow, but also that the VMA did not significantly alter the passing
ability of the concrete.
To show that the SCC had an improved stability as a result of the addition of the
VMA, the static segregation of the SCC was determined. This was determined by the
static segregation test. It was observed that the static segregation was highest with
concrete produced using the HRWR alone. This was as expected since there was little to
prevent the aggregate from settling within the concrete mixture. After the addition of the
VMA, the segregation of the concrete began to decrease. At first, the low dosage of 4 fl
oz/cwt (260 mL/1 00 kg) of VMA showed little improvement over the HRWR alone;
however, a dosage of 8 fl oz/cwt (520 mL/kg) showed significant improvement. The
higher dosage of VMA was selected to ensure that there was as little segregation as
possible. 7.2.2. Hardened Concrete Property Tests. After the mix design had been
developed based on achieving acceptable fresh properties for the sec, the hardened
128
properties were tested to determine if the concrete would still be acceptable.
Compression strength testing showed that as the amount of fly ash was increased, there
was a decrease in early age strength but an increase in later age strength. A 30%
replacement of portland cement with fly ash was selected to afford the benefits of
increased slump flow in the fresh state while still maintaining the higher early age
strength of a I 00% portland cement concrete. The MOR was determined by testing a
beam and normalized by dividing this value by the square root of the compressive
strength of that particular concrete. This compressive strength was determined by testing
a cylinder cast from the same batch of concrete. It was determined that there was not a
significant difference between the MOR of SCC and FA concrete. SCC was also shown
to be slightly higher than NC. Overall, this provided evidence that the addition of
HRWR and VMA had little effect on the concrete's MOR.
7.2.3. Shrinkage Testing. Shrinkage testing was another opportunity to compare
SCC and NC. The purpose of this testing was to determine what affect, if any, the
chemical admixtures would have on shrinkage. In addition to these two types of
concrete, an intermediate concrete made with a 30% replacement of fly ash and no
chemical admixtures was tested. After shrinkage data was recorded and plots were made
to show shrinkage strain over time, the data was compared to predictions based on three
shrinkage prediction models. These models were ACI 209R, Bazant-Baweja B3, and
GL2000. By examining plots of shrinkage as a function of time, it was observed that the
FA concrete had the most shrinkage and was followed closely by SCC, while the NC had
the smallest shrinkage. This would seem to indicate that the fly ash contributed to the
slight increase in shrinkage observed as opposed to the chemical admixtures. To
determine if this increase in shrinkage was significant, standard deviation bars were
added to select points. It was observed that many of the standard deviation bars
overlapped, indicating there was not a significant statistical difference in the shrinkage
between the three concrete types.
After comparing the different types of concrete to each other, the shrinkage values
determined in the Jab were compared to values predicted by the shrinkage models . It was
observed that the ACI 209R Model most accurately represented the shrinkage observed
during testing for all three concrete mixes. The initial predicted shrinkage was higher

129
than what was observed in the lab and the ultimate predicted shrinkage was lower than
data taken in the lab. Both the Bazant-Baweja B3 and the GL2000 models under
predicted the shrinkage for all three concrete types. Of the two, the Bazant-Baweja B3
was the closest to the plotted data; however, it was consistently lower throughout the time
testing was conducted.
7.2.4. Full-Scale Beam Shear Tests. To address the concern of shear strength of
SCC, full-scale shear tests were performed on NC and SCC beams. The shear strength
was determined through testing and compared to the predicted values for V and Vc using
the ACI and AASHTO codes. It was determined that there was not a significant
difference between predicted values and values determined through testing. It was noted
that ACI Equation 11-3 and AASHTO were conservative in their predictions of shear
strength; however ACI Equation 11-5 was not always conservative. This was likely a
result of the high amount of longitudinal steel reinforcement within the beams. It was
noted that ACI Equation 11-5 was not conservative in its prediction of shear strength for
either the NC or SCC.
The last thing to be considered was the shear strength contributed by the concrete.
Based on the test results, there was not a significant difference in strength when
comparing NC and SCC. Shear strengths determined through testing were not
significantly different between NC or SCC beams made with the same shear
reinforcement. This result would seem to indicate that as far as shear behavior, there is
not a significant difference between NC and SCC developed through the use of chemical
admixtures, and that these elements can be appropriately designed using existing ACI and
AASHTO code provisions.
When comparing beams made with SCC to beams made with NC, the SCC beams
had a higher shear strength; however, there was also a much greater compressive
strength. After predicted and tested shear strength values had been compared, the shear
strengths were normalized in order to determine the shear strength coefficients. This was
done by dividing the shear strength of the concrete by the product of beam width ,
effective beam depth, and the square root of the concrete compressive strength. The
normalized coefficients ranged in value from 2.9 to 4.7. These values were compared to
normalized concrete shear strength values collected by Tureyen and Frosch (2003) on

concrete shear strength as a function of the longitudinal reinforcement ratio. For the
reinforcement ratio used in this research, the values for the normalized concrete shear
strength were consistent with the previous research on shear strength of NC.
130
Plots of V /Vc~ showed that as the number of stirrups increased so did the ratio, as
predicted. The VtiVd ratio increased from 2.1 in a beam with no stirrups to 6.4 in a beam
with a 5 in. ( 127 mm) stirrup spacing. It was also noticed that the increase was only
slightly smaller in beams made with SCC. This result seems to indicate that both NC and
sec benefit greatly from an increase in the amount shear reinforcement but, more
importantly, that SCC behaves similarly to NC in terms of shear behavior.
7.3. CONCLUSIONS
Based on the previously stated findings, the following conclusions can be drawn
in reference to the evaluation and prediction of the performance of the chemically-based
sec developed for the purpose of this research:
I . There was not a significant difference between NC and SCC with regard
to density or air content.
2. sec showed a significant increase in slump flow with the addition of a
HRWR.
3. SCC showed an improved stability with the addition of a YMA, and that
static segregation was highest in concrete made with a HRWR alone.
4. Long term compressive strengths were similar for both NC and SCC;
however, it was observed that the concrete made with fly ash had a longer
hydration period.
5. There was not a significant difference between NC and SCC with regard
to MOR.
6. By comparing shrinkage plots, fly ash contributed to a slight increase in
shrinkage; however, this increase was not statistically significant.
7. There was not a significant difference in shrinkage between NC and SCC.
8. The ACI 209R Model provided the most accurate shrinkage prediction
model when compared to test values.

131
9. ACI Equation 11-3 and AASHTO were conservative in their prediction of
shear strength for NC and SCC; however, ACI Equation 11-5 was not
always conservative.
10. Normalized shear strength coefficients ranged from 2.9 to 4.7 and were
consistent with the extensive amount of previous research conducted on
NC.
1 1. V,/Vd values indicated there was an increase in ductility with the addition
of shear reinforcement and that both NC and SCC benefited equally from
this additional shear reinforcement.
7.4. RECOMMENDATIONS
Based on the findings and conclusions stated in the previous sections, the
following recommendations were derived in regard to the use of SCC concrete:
1. Shrinkage models for conventional concretes are applicable to the SCC
studied.
2. When using the SCC concrete mixes studied, ACI and AASHTO design
provisions may be used to conservatively determine the shear strength.
3. sec can be produced to provide the benefits of increased flow and
passing abilities while still maintaining shear strength and resulting in
comparable shrinkage with NC.
4. Additional testing is required to study the effects of prestressing on SCC.

APPENDIX A.
MATERIAL DATA SHEETS
(Reproduced with permission from BASF)

The Chemical Company
Description GLENIUM<I> 7500 full-range water-reducing admixture is based on the next generation of polycarboxylate technology found in all of the GLENI UM 7000 series products. This technology combines state-ofthe-art molecular engineering with a precise understanding of regional cements to provide specific and exceptional value to all phases of the concrete construction process.
GLENIUM 7500 admixture is very effective in producing concrete mixtures with different levels of workability including applications that require self-consolidating concrete (SCC). The use of GLENIUM 7500 admixture results in faster setting characteristics as well as improved early age compressive strength. GLENIUM 7500 admixture meets ASTM C 494/C 494M compliance requirements for Type A, water-reducing, and Type F, high-range waterreducing, admixtures.
Applications Recommended for use in:
• Concrete with varying water reduction requirements (5-40%)
• Concrete where control of workability and setting time is critical
• Concrete where high flowability, increased stability, high early and ultimate strengths, and improved durability are needed
• Production of Rheodynamic® SelfConsolidating Concrete (SCC) mixtures
• 4x4 TM Concrete for fasttrack construction
• Pervious Concrete mixtures
GLENIUM® 7500
Product Data Cast-In-Place Concrate Precast Concrete Mass Concrete Masonry Grouting
Full-Range Water-Reducing Admixture
Features
• Dosage flexibility for normal, mid-range and high-range applications
• Excellent early strength development
• Controls setting characteristics
• Optimizes slump retention/setting relationship
• Consistent air entrainment
Benefits • Faster tum over of forms due to accelerated early strength development
• Reduces finishing labor costs due to optimized set times
• Use in fast track construction
• Minimizes the need for slump adjustments at the jobsite
• Less jobsite QC support required
• Fewer rejected loads
• Optimizes concrete mixture costs
Performance Characteristics Concrete produced with GLENIUM 7500 admixture achieves significantly higher
133
early age strength than first generation polycarboxylate high-range water-reducing admixtures. GLENIUM 7500 admixture also strikes the perfect balance between workability retention and setting characteristics in order to provide efficiency in placing and finishing concrete. The dosage flexibility of GLENIUM 7500 allows it to be used as a normal, mid-range, and high-range water reducer.
Guidelines for Use Dosage: GLENIUM 7500 admixture has a recommended dosage range of 2-15 fl ozlcwt (130-975 mU100 kg) of cementitious materials. For most mid to high-range applications, dosages in the range of 5-8 fl oz/cwt (325-520 mU1 00 kg) will provide excellent performance. For high performance and Rheodynamic SelfConsolidating Concrete mixtures, dosages of up to 12 fl oz/cwt (780 mU100 kg) of cementitious materials can be utilized. Because of variations in concrete materials, jobsite conditions and/or applications, dosages outside of the recommended range may be required. In such cases, contact your local BASF Construction Chemicals
representative. Mixing: GLENIUM 7500 admixture can be added with the initial batch water or as a delayed addition. However, optimum water reduction is generally obtained with a
delayed addition.
Master Builders

Product Data: GLENIUM® 7500
Product Notes Conosivfty- Non-Chloride, Non-Corrosive: GLENIUM 7500 admixture w ill neither initiate nor promote corrosion of reinforcing steel embedded in concrete, prestressing steel or of galvanized steel floor and roof systems. Neither calcium chloride nor other chloride-based ingredients are used in the manufacture of GLENIUM 7500 admixture.
Compatibility: GLENIUM 7500 admixture is compatible with most admixtures used in the production of quality concrete, including normal, mid-range and high-range water-reducing admixtures, air-entrainers, accelerators, retarders, extended set control admixtures, corrosion inhibitors, and shrinkage reducers .
Do not use GLENIUM 7500 admixture with admixtures containing beta-naphthalene sulfonate. Erratic behaviors in slump, wori<ability retention and pumpability may be experienced.
Storage and Handling Storage Temperature: GLENIUM 7500 admixture must be stored at temperatures above 40 °F (5 °C). If GLENIUM 7500 admixture freezes, thaw and reconstitute by mechanical agitation.
Sheff Life: GLENIUM 7500 admixture has a minimum shelf life of 9 months. Depending on storage conditions, the shelf life may be greater than stated. Please contact your local sales representative regarding suitability for use and dosage recommendations if the shelf life of GLENIUM 7500 admixture has been exceeded.
Packaging GLENIUM 7500 admixture is supplied in 55 gal (208 L) drums, 275 gal (1040 L) totes and by bulk delivery.
Related Documents Material Safety Data Sheets: GLENIUM 7500 admixture.
BASF Construction Chemicals Admixture Systems
134
Additional Information For additional information on GLENIUM 7500 admixture or on its use in developing concrete mixtures with special performance characteristics, contact your BASF Construction Chemicals representative.
The Admixture Systems business of BASF Construction Chemicals is a leading provider of innovative admixtures for specialty concrete used in the ready mix, precast, manufactured concrete products, underground construction and paving markets throughout the North American region. The Company's respected Master Builders brand products are used to improve the placing, pumping, finishing, appearance and performance characteristics of concrete.
UMITED WfoiF.!oNfY NOTICE. We v.errant our products to be o f good quality and wil l replaca or, at wr dscretion, refund the purchase price of any proclocta prowd deta::tl w . Sati sfactory resul ts depend not only upon ql.Blity prod.Jcts, but 880 upon rreny Dctors beyond our control. lllerefore, B>teePt for Sl.Ch replacerrent or refund. 8ASF MA.KES NO WNF./>NTY OR GJARANTEE. EXPFIO.SS OR IMI'UED, fNO.UOING WNFJ>NTIES OF RlNESS FOR A PARTlCULAR PUFPOSE OR MERCHANTABILITY, RE.SPECTING ITS PRODUCTS, and BASF sl'el l haw no other liability With raopect themto. kry claims regarding prodt.et <Etect must be recetved in wrlt111g W'l thin one (1 ) year from ttle dare of shtprrent. Uoer shalt determlre the aultabl llty o f the productll for the ln!Bnded uoe and assurre a ll riak& and liabili ty In connection therewi th. Any authorizsd charlge in the prinl9d recorrrrendatlons concerning the use of our prod.Jets must bear the !Jignature of tne B4Sf Technical .....,.__
This lnforrrstion and all further technical advice are based 01 BASFa present kno~~and exps'ience. HOYJe'Yel". B6.Sf assurres no II EDil! ty for provldng sl.Ch inforn"Btl on and actvloe Including theextoot to \Milch such tnforrm~on and advice rray relaiB to eodstl r111 thi rd party lntallecll.EII property rights, especially patoot rights. BASF SHAll NOT BE ~NSIEI£ FOR CONSEQIJENTIAL INDIRECT OR INODENTAL DMN\GES ~NO..UDING LOSS OF PROATSJ OF ANY KIND. BASF ,..,_....,. the nght to 11'1B<e anychangesa::cord•ng to technologk:al progress or furthw c::ievel c~::m-srlts.
For Profn&ional u .. onty. Not for aale to or use by the gener•l plbHc.
www.masterbuildere.com . 44122_5544 • Tel: aoo 629-9990 • Fax: 216 939-9821 Unite d Stateo 23700 Chagrin Boulewl'd, Cle"""'."d, ~:oM? • Te l: 800 387.5862 • Fax: 905 792-065 1
Master Builders
Canad!l 1800 Clerk Boulevard, BrBf1lJion, Ontano L6
® Cona1ruotlon Re...roh & Technology GMBH
. . USA • 12109 e LIT ' 2000025 C BASF Conatruofion Cherrioala, 2009 • Pnnted tn
The Chemical Company
Description Micro Air air-entraining admixture provides concrete with extra protection by creating air bubbles that are ultrastable, small and closely spaced- a characteristic especially useful in the types of concrete known for their difficulty to entrain and maintain the air content desired.
Even when used at a lower dosage than standard airentraining admixtures, Micro Air admixture meets the requirements of ASTM C 260, AASHTO M 154, and CRD-C 13.
Applications Recommended for use in:
• Concrete exposed to cyclic freezing and thawing
• Production of high-quality normal or lightweight concrete (heavyweight concrete normally does not contain entrained air)
MICRO AIR® Air-Entraining Admixture
Features
Product Data Cast-in-Place Concrete Precast Concrete Mass Concrete
135
• Ready-to-use in the proper concentration for rapid, accurate dispensing
• Greatly improved stability of air-entrainment
• Ultra stable air bubbles
Benefits • Increased resistance to damage from cyclic freezing and thawing
• Increased resistance to scaling from deicing salts
• Improved plasticity and workability
• Improved air-void system in hardened concrete
• Improved ability to entrain and retain air in low-slump concrete, concrete containing high-carbon content fly ash, concrete using large amounts of fine materials, concrete using high-alkali cements, high-temperature concrete, and concrete with extended mixing times
• Reduced permeability- increased watertightness
• Reduced segregation and bleeding
Performance Characteristics Concrete durability research has established that the best protection for concrete from the adverse effects of freezing and thawing cycles and deicing salts results from: proper air content in the hardened concrete, a suitable air-void system in terms of bubble size and spacing and adequate concrete strength, assuming the use of sound aggregates and proper mixing, transporting, placing, consolidation, finishing and curing techniques. Micro Air admixture can be used to obtain adequate freezing and thawing durability in a properly proportioned concrete mixture, if standard industry practices are followed.
Air Content Determination: The total air content of normal weight concrete should be measured in strict accordance with ASTM C 231, "Standard Test Method for Air Content of Freshly Mixed Concrete by the Pressure Method" or ASTM C 173/C 173M, "Standard Test Method for Air Content of Freshly Mixed Concrete by the Volumetric Method.·
The air content of lightweight concrete should only be determined using the Volumetric Method. The air content should be verified by calculating the gravimetric air content in accordance with ASTM C 138/C 138M, "Standard Test Method for Density (Unit Weight), Yield, and Air Content (Gravimetric) of Concrete." If the total ai r content, as measured by the Pressure Method or Volumetric Method and as verified by the Gravimetric Method, deviates by more than 1-1/2%, the cause should be determined and corrected through equipment calibration or by whatever process is deemed
necessary.
l\1aster Builders

Product Data: MICRO AJR®
Guidelines for Use Dosage: There is no standard dosage for Micro Air admixture. The exact quantity of air-entraining admixture needed for a given air content of concrete varies because of d ifferences in concrete making materials and ambient conditions. Typical factors that might influence the amount of air entrained include: temperature, cementitious materials, sand gradation, sand-aggregate ratio, mixture proportions, slump, means of conveying and placement, consolidation and finishing technique.
The amount of Micro Air admixture used will depend upon the amount of entrained air required under actual job conditions. In a t rial mixture, use 1/8 to 1-1/2 fl oz/cwt (8-98 mU1 00 kg) of cement. In mixtures containing water-reducing or set-control admixtures, the amount of Micro Air admixture needed is somewhat less than the amount required in plain concrete. Due to possible changes in the factors that can affect the dosage of Micro Air admixture, frequent air content checks should be made during the course of the work. Adjustments to the dosage should be based on the amount of entrained air required in the mixture at the point of placement. If an unusually high or low dosage of Micro Air admixture is required to obtain the desired air content, consult your BASF Construction Chemicals representative. In such cases, it may be necessary to determine that, in addition to a proper air content in the fresh concrete, a suitable air-void system is achieved in the hardened concrete.
Dispensing and Mixing: Add Micro Air admixture to the concrete mixture using a dispenser designed for air-entraining admixtures; or add manually using a suitable measuring device that ensures accuracy within plus or minus 3% of the required amount. For optimum, consistent performance, the air-entraining admixture should be dispensed on damp, fine aggregate or with the initial batch water. If the concrete mixture contains lightweight aggregate, field evaluations should be conducted to determine the best method to dispense the air-entraining admixture.
Precaution In a 2005 publication from the Portland Cement Association (PCA R&D Serial No. 2789), it was reported that problemat ic air-void clustering that can potentially lead to above normal decreases in strength was found to coincide with late . . additions of water to air-entrained concretes. Late additrons of water include the conventional practice of holding back water during batching for addition at the jobsite. Therefore, caution should be exercised with delayed additions to air-entrained concrete. Furthermore, an air content check should be performed after any post-batching addition to an
air-entrained concrete mixture.
136
Product Notes Corrosivity- Non-Chloride, Non-Corrosive: Micro Air admixture will neither initiate nor promote corrosion of reinforcing and prestress ing steel embedded in concrete, or of galvan ized steel floor and roof systems. No calcium chloride or other chloride-based ingredients are used in the manufacture of this admixture.
Compatibility: Micro Air admixture may be used in combination with any BASF Construct ion Chemicals admixture, unless stated otherwise on the data sheet for the other product. When used in conjunction with other admixtures, each admixture must be dispensed separately into the mixture.
Storage and Handling Storage Temperature: Micro A ir admixture should be stored and dispensed at 35 oF (2 °C) or higher. Although freezing does not harm this product, precautions should be taken to protect it from freezing. If it freezes, t haw and reconstitute by mild mechanical agitation. Do not use presaurized air for agitation.
Shelf Life: Micro Air admixture has a minimum shelf life of 18 months. Depend ing on storage conditions, the shelf life may be greater than stated. Please contact your BASF Construction Chemicals representative regarding suitability for use and dosage recommendations if the shelf life of Micro Air admixture has been exceeded.
Safety: Micro Air admixture is a caustic solution. Chemical goggles and gloves are recommended when transferring or handl ing this material. (See MSDS and/or product label for complete information.)
Packaging Micro Air admixture is suppl ied in 55 gal (208 L) drums, 275 gal (1 040 L) totes and by bulk delivery.
Related Documents Material Safety Data Sheets: Micro Air admixture.
Additional Information For suggested specification information or for add itional product data on Micro Air admixture, contact your BASF Construct ion Chemicals representative.
The Admixture Systems business of BASF Construction Chemicals is a leading provider of innovaUve admixtures for specialty concrete used in the ready mix, precast, manufactured concrete products, underground construction and paving markets throughout the North American region. The Company's respected Master Builders brand products are used to improve the placing, pumping, finishing, appearance and performance characteristics of concrete.
(/ - \ BASF Construction Chemicals, LLC NSE Admixture Systems ' ___ ;' www.masterbuildera.com . _ • Tel: 800 628.9990 • Fax: 216 g)g -8821 I c.-., J Uni1e d S lalee 23700 Chagrin Boulevard. Cle~d, Ohio 44 122Tel~ 387_5862 • Fax: 905 792-0051
Master Builders ! --·· Canada 1600 Clar1< BouleVSid, Bm~ton, On1ano L6T 4M7 • -
® Cona1ruo1ion ReaMroh & Teohnology GMBH IT f 101 7034 ~ BASF Construction Chemicals, U.C 2007 • Printed in USA • 1 0108 • L

I:I• BASF The Chemical Company
RHEOMAC® VMA 362 Viscosity modifying admixture
DESCRIPTION Aheomac VMA 362 vrscosty modifyrng admiXtu·e (V~) is a ready-to-use. lrqurd admxture that rs specrally dE·veloped for producrng concrete 'IVrth enhanced vrscosity and controlled rhoolc•grcal propertres
Concrete wtth Ftleomao VMA 862 admxture exhrbits superror stabilrty, rncreasmg resstmce to segregatron and facrlrtating placement and conrolidallon Rheomao VMA :362 m eets AS 14 78 for Type SN admxtures
RECOMMENDED R)R Concrete c.ontarnrng .. gap-graded" aggregates Le-an cc.ncrete mJo..tures
• Concrete contarnrng manufactu·ed sand • Concrete as a pun1)1ng ard
Concrete as a 1inrshng ad C oncrete rllrxtures rEquirrng "more body" P,heodynamrc@ Self-Consohdatrng Concret e (SCC) or Super Workable Concnete (SWC)
. I SfficJTM
Mo~ wsoomy of COf1t7r1lfl EBByto~ Controls bl9eding Modd6s rhtJolo(}icti fYOP6I'(ies PrrJYidtls lwribilrly in rrixfr.r9 ~ tni batlahng
• PrrJifdas ooncrt1f6 st8biity thir¥1 fninl!port tni ~ R~ StJ{TBglllion, mwr rMrh ~ OOI'IC1'IJilJ mixflns Erha OQiiS' PLITJ)ifv lil?d ~
• Erhncss tU1scs spptllinllCI!il PrrJYidtls St,p6lior a7d prsdct8bl9 irp/so9 concrsiPJ ~ FBDiltritss ptr1(holion of~ rrixtl.rtiB sud1 BtJ
~ Ss/1-Consoldtllirf} ConcnJitl (SCQ or
rrf.f: Wakab19 Caxnt~P~ '48Jnrr:eJs:rJ;'JUii[3--SettingTme Rheomac VMA 362 admrxtLre has httle to no rmpact on concrete rettrng trme wrt h111 the recommended dosage rar1ge of 150-900 mUt 00 kg of cementrtrous mat en a
Comp-eeeive Strei"QQh Rheomac VMA 362 admrxture does not affect the compreSSive strerlQth of concrete.
Visooaity ~ VMA 362 admrxture wrll exhrbit an rncreare rn c.oncrete vrsc.osrty wrth rncreaSing dosage of the admxture
Ths desrab/e charactenstrc faal1tates ccncrete placement. conoolrdatron and finrshna and prc.v1des stooilrty to very flu1d concrete m )..es ' WorlaiDiity Ptleom;ac 'liMA 362 a:Jm1>-.ture enhcnces workabilrtv
A'r Content Rheomao VMA 362 admxtuE- does not affect th.;. a r content rn 81ther arr-entrarned C( non a r-entra ned concrete
Typrcal dosages of ar-81ltranrn;J admlx!ues ma1· be US8d to achreve the desrred ar content
DOSAGE The recommended dosage rmge for Rheomao VMA 362 admrxtL.re rs 150-900 rnl/1 00 kg of C.8fll ff1trtr•.'\.Js matenas A dosage of 150-400 mU1 00 kg rs recomme-n:Jer:J fur typrca concrete mrxtu·es requnng "mr.re b-•dy" tc. faalitate pUllprng and finshlng procer:Ju es A dosage of up to 900 mU 1 00 kg rs 1 ecc•m11ended tn proVIde stabilrty rn super wc•rkcble (~1-u:•n::drdat~r-..;l)
concrete mxtures Bec.au~ of varat1ons 111 conueto= mate11cis tob~te condltims and/•:f q:>plrcatrons dc·sages outsrde of the
1ed
rnrtra mrx water Alternately,~ VMA 362 admr>-.tue ma:1 be add,..d after al other concreting rngredrents havE- 1:::>8E-n batci"BJ and thaoughly mxed. e1ther at the batch pla-n •:J: at thEJObsite COMPATABIUTY ftlaomiiO ~ J62 admiX!L.re rs corrpatrbl e- ·Mth n1·~-'>l
othff admrxtL.res used 111 th8 prc .. :JL.t;tlc·n of quallly conuete rncludlf\l ncormal . lllld-range a1d hrJh -l<n;Je water-redUCJng admr>-.1ures. ald a r-entra n1n9 adrnr>-.tur<?s ftleomsc ~ 362 a :Jm1xtL.re 15 a.:.:. rompanble •. ,. th typrca accelerators. 1etade1 s. e)..ienjed set C•J~ro .. admr>-.tures corroSK•Il rnhrbtors and sh rnka;J8 r educn~
admixtures However a field tra1l rs reccm rnen i c-d tr enrure approp!'latE- performance
362 admr>-.tUIEten-peratures ctx>ve ooc and below 54°C Protect ~"'-"A 382 adm>Juro;, frcm lre<'-..Zing as 1t cannot be reconstrtuted after tha.v1nq
SHElFUFE A produc:t stcblrty evauat1on has m o,vn that R'leomao VMA 362 adllli>-.1Lre llaS a m&lf life of 8 m :.nths Pleare O)ntact you loca BASF ConSiruct ron a-.,..,lca'& T echn cal P.epre9entat1ve regadlrl(J 9.JrtCDllty ro:.r use an-:! dosage recommendat1c•ns rf tho:- Siater:J r1rnrPlUll Soe-lf 1;8
of Rheomao ~ 362 admxtur<? has t::>een .ox r.E•'-j erJ
137
I:I• BASF The Chemical Company
RHEOMAC® VMA 362 DISPENSING Fll1lilomao VMA 362 aclmxtLJe should be dtspens:?d usna d1rect-feed d1spensng systems ~ It ts recommended that tal-safe featLJes must be inciL.ded In thts dtspenser cpphcatton for potential meter mafunctlons.
PACKAGING Ff"wrlaD ~ 362 IS avalable tn 20L CLbes. 205L Drums and 1000L Palecons.
STATEMENT OF RESPONSIBIUlY
The techrical nformation a-1d ~ication advce given 1n th1s BA8F ConltiiiJtllon Chllrr'llollla pubica!IOn w e based on the pressnt state o f our beSt sdenbftc and pracbcal kno-Medge As the 1niO'fTlebon hereon 1s of a general natu:e. no assunpt1on ca-1 be made BS to a product's SJIIBbtltty for a pa1JCUIBr use or ~rceiJJn a1d no wara1ty as to 1ts accu:acy, relt:'t:liity or completeness eo !her exp"emed cr 1mphed 1s grv!ll1 other tf"B1 those re Lired IEM' The user 1s r rsble tor checki1 the sut~l1 o f oductS tor their nternoo use
NOTE
Field serv1ce where proVIded does not constitute SJpervtOOry respo-~sbtl1ty Suggesbons made t¥ BASF Oonr*UOtiO" ~either orally or 1n wnbng may be folow ed, mod1fied or ret~ted t¥ the owr-es .
eng1neer cr contractor sinoe they , and not BA8F QonltUCICion Chllrnic*l. w e responsble for cen\llng out
BASF Oon8lrucllon ~· Auenla Ply Ud Newcas~e Incorporated in NSW A B N 46 000 450 288 Cal berra Head Office 11 S tanton Road Seven Hils. NSW 2147 Bnsba"le Ph. (02) 8811 4200 TQWI1SV1ne Melbounne
ooedures o ate to a eofic 1cabon (02) 4961 3819 (02) 6280 6010 (07) 3633 9900
(07) 4774 7344 (03) 9548 0300
Adeiade (08) 81~ 7500 Peo1n (CS) 9 300 2600 Da-wrn (08) 8964 3269 Kalgoort1e 0 4 17 77 2 355
BASFConlln..lollonOliiTlloiHNaNZellrd Ud Head Office 45 W1lliEm Pid<enng DrTVe, AlbalY. Aucl<land Ph (09) 414 7233
BASF'M:B SITES '!tf'{'N b8sf-cc.cgTJ au yyww.bes{-cc co 04 Y:l!fW beS-yac cern
138

APPENDIX B.
SHRINKAGE PLOTS

140
1000
900 -
800
c 700 ----_, :::::::;;,;.... ~
~~ Jr
II p
-
·; ~ 600 0 I.
·§ 500 '-"
.s 400 cu I.
(;) 300
200 ---
100 -
~ ~ . 0
0 200 250 50 100 150 Age of Mix (Days) - FA Shrinkage - sec Shrinkage - NC Shrinkage
300 I
J
Figure B. I. Concrete Shrinkage
1000
900
800
-----II""""
1.1" _ .... ~ ........
r~ lr"'
--
~ --
.. P'" -
I -
----
,.-._
= 700 ·; I. - 600 "' 0 I. ~ 500 ·a '-"
= 400 ·; I. 300 -00
200
100
0
0 50 100 150 200 Age of Mix (Days)
250
- NC Shrinkage - FA Shrinkage - sc Shrinkage L_ _________________________________________________ _
300
Figure B.2. Concrete Shrinkage

141
1000
900
800
~ ~
~
7 P'_ __,-17? r-
-.5 700 ~ I. t; 600 0 I.
.:! 500 e "-" .5 400 ~
.!: 300 00
200
100
0 0 50 100 150 200 250 300
Age of Mix (Days)
- ACI 209R-92 Model - sec Shrinkage - FA Shrinkage - NC Shrinkage
Figure B.3. Concrete Shrinkage Compared to ACI 209R-92 Model
1000
900
800
- 700 = ·e 600 -"' e
.:! 500 e "-"
= 400 ·; I. - 300 00
200
100
0 0 50 100 150 200 250 300
Age of Mix (Days) - Bazant-Baweja B3 Model - sec Shrinkage - FA Shrinkage -NC Shrinkage
Figure B.4. Concrete Shrinkage Compared to Bazant-Baweja B3 Model

1000
900
800
:5 700 Cl:l r.. til 600 0 r.. ·§ 500 '-"
r:: 400 ·; r.. ~ 300
200
100
0
142
0 50 100 150 Age of Mix (Days)
200 250 300
- GL2000 Model - sec Shrinkage - FA Shrinkage - NC Shrinkage
Figure B.S. Concrete Shrinkage Compared to GL2000 Model
143
BIBLIOGRAPHY
ACI Committee 440, Guide for the D.esign and Construction of Concrete Reinforced with FRP Bars (440.1R-01), Amencan Concrete Institute, Farmington Hill s Michigan 2001,4lpp. ' '
American Associ.ation of ~tate and Highway Transportation Officials (2007); AASHTO LRFD Bnd?e Desi.g~ Specification;" American Association of State and Highway TransportatiOn Officials; Washington DC.
American A~s.ociation of State and Highway Transportation Officials (1998); "Standard Specification for Highway Gridges;" l61h Edition; American Association of State Highway and Transportation Officials; Washington DC.
American Concrete Institute (ACI 209.2R-08) (2008); "Guide for Modeling and Calculating Shrinkage and Creep in Hardened Concrete" American Concrete Institute; Farmington Hills, Michigan.
American Concrete Institute (ACI 211.1-91) (1991 ); "Standard Practice for Selecting Proportions for Normal, Heavyweight, and Mass Concrete" American Concrete Institute; Farmington Hills, Michigan.
American Concrete Institute (ACI 22.4R-04) (2004); "Guide for the Use of High-Range Water-Reducing Admixtures (Superplasticizers) in Concrete" American Concrete Institute; Farmington Hills, Michigan.
American Concrete Institute (ACI 237R-07) (2007); "Self-Consolidating Concrete;" American Concrete Institute; Farmington Hills, Michigan.
ASTM C 1610/C 1610M- 06a; "Standard Test Method for Static Segregati on of SelfConsolidating Concrete Using Column Technique;" American Society for Testing and Materials; West Conshohocken, Pennsylvania.
ASTM C 1621/C 1621M- 091; "Standard Tst Method for passing Ability of SelfConsolidating Concrete by J-Ring;" American Society for Testing and Materials;
West Conshohocken, Pennsylvania.
ASTM c 31/C31M-09 (2009) "Standard Practice for Maki~g and Curing.Concrete Test Specimens in the Field;" American Society for Testmg and Maten als; West
Conshohocken, Pennsylvania.
ASTM c 39/C 39M_ 10 (2010); "Standard Test Meth~d for Com~ress i ve Stren~th of Cylindrical Concrete Specimens;': American Society for testmg and Matenals;
West Conshohocken, Pennsylvama.

ASTM C 490/~ 49_0M- 08 (2008); "Standard Practice for Use of Apparatus for the Determm~,tiOn of_ Length ~hange of Hardened Cement Paste, Mortar, and Concrete; Amencan Society for Testing and Materials; West Conshohocken Pennsylvania. ·
ASTM C 157 /C _157M- 08 (2008); "Test method for Length change of hardened Hydra_uhc-Cement Mortar and Concrete;" American Society for Testing and Matenals; West Conshohocken, Pennsylvania.
ASTM Cl611/ C 1611M- 05 (2005); "Standard Test Method for Slump flow of SelfConsolidating Concrete;" American Society for Testing and Materials; West Conshohocken, Pennsylvania.
144
ASTM C78 - I 0 (20 1 0); "Standard Test Method for Flexural Strength of Concrete (Using Simple Beam with Third-Point Loading);" American Society for Testing and Materials; West Conshohocken, Pennsylvania.
ASTM E8/E8M- 09 (2009); "Standard Test Methods for Tension Testin g of Metallic Materials;" American Society for Testing and Materials; West Conshohocken,
Pennsylvania.
Boresi, Arthur P., and Richard J. Schmidt. Advanced Mechanics of Materi als. Hoboken.
New Jersey: John Wiley & Sons, inc., 2003.
Canny J, A Computational Approach to Edge Detection. IEEE Transacti ons PAM I 1986.
Vol 10, pp. 679-698.
El-Chabib, Hassan, and Moncef Nehdi. (2006); "Effect of Mixture Design Parameters on Segregation of Self-Consolidating Concrete" ACI Material s Journal: Vol. I 03 . pp .
374-383.
Gesoglu, Mehmet, Erhan Guneyisi, and Erdogan Ozbay. "Properties of _ S_e lf-Compacti J~g Concretes Made With Binary, Ternary, and Quaternary c _ementlll OUS ~lends of Fly Ash, Blast Furnace Slag, and Silica Fume" Constructi on and Bu lldmg
Materials. Science Direct. pp. 8.
Ghafoori, Nader, and Hamidou Diawara. "Influence of Temper~ture on Fr~sh Performance of Self-Consolidating Concrete: Constructi on and BUJldmg
Materials. Science Direct. pp. 10.
Hassan A A A K M A Hossain and M. Lachemi. "Behavior of Full -Scale Self-'
0 • . '' .. • • B' 0 Shear" Cement & Concrete Composll CS .
Consolidating Concrete earns m S . D' t 9 <WW elsevier com/Jocate/cemconcomp>.
ctence 1rec . pp. . . ·

145
Hassan, A. A.A. , K.M.A. Hossain, and M. Lachemi. "Strength, Cracking and Defl ecti on Perform~nce ~f La~ge-S~ale Self-Consolidating Concrete Beams Subjected to Shear Fa1lu_re Engmeenng Structures. Science Direct. pp. 10. www .el sevier.com/locate/engstruct.
Hawkins, N.M. , Kuch_ma, .~.A., Mast, R.F., Marsh, M.L., and Reineck, K.H. , NCHRP Report 549.: Simplified Shear Design of Structural Concrete Members, Transportation Research Board of the National Academies Washington D c 2005. ' ' .. ,
Hwang, So?-Duck; Khayat, Kamal H. (201 0); "Effect of Mix Design on Restrained Shnnkage of Self-Consolidating Concrete;" Material s and Structures Journal; Sherbrooke, Canada.
Khayat, K.H. ( 1999); "Workability, Testing and Performance of Self-Consolidating Concrete;" ACI Materials Journal; Vol. 96, pp. 346-353.
Khayat, K.H. (2000); "Optimization and Performance of Air-Entrained, SelfConsolidating Concrete;" ACI Materials Journal ; Vol. 97, pp. 526-535.
Khayat, K.H. Optimization and Performance of Air-Entrained, Self-Consolidating
Concrete. ACI Materials Journal.
Kuchma, D.A. , "Contribution of Stirrups to Shear Resistance," Proceedings of the 2009 Structures Congress: Don't Mess with Structural Engineers- Expanding Our Role, Austin, Texas, April 2009, pp. 1587-1594.
Laskar, A. , Hsu, T.T.C., and Mo, Y.L. , "Shear Strengths of Prestressed Concrete Beams Part I: Experiments and Shear Design Equations," ACI Structural Journal. V.
107, No.3, May-June 2010, pp. 330-339.
MacGregor, James G, and Janes K. Wight. Reinforced Concrete Mechanics and Design .
Saddle River, NJ: Prentice Hall, 205 .
Myers, J.J. (1998). "Production and Quality Control of High Performance ~oncrete in Texas Bridge Structures;" Dissertation, Uni versity of Texas-Austlll .
NCHRP Report 549 (2005); "Simplified Shear Design of Structu:al Concrete Members: .. National Cooperative Highway Research Program; Washmgton DC.
NCHRP Report 628 (2009); "Self-Consolidating Conc~ete f~r Precast, Prestressed . Concrete Bridge Elements;" National Cooperati ve H1 ghway Research Program.
Washington DC.

146
Sonchi. Mohanncd. Steffen Gruneald, and Joost Walraven. (2007); "Filling Ability and pa-.sing Ability of Self-Consolidating Concrete" ACI Materials Journal; Vol. 104, pp. 162- 170.
Turc ycn. A . Kora y. and Robert J. Frosch. "Concrete Shear Strength: Another Pcrspcctin~" AC I Structural Journal; Vol. 100, pp. 609-615.

147
VITA
Mark Daniel Ezzell was born in Glendale, AZ on July 12, 1986. Mark graduated
in May of 2004 from Metamora Township High School in Metamora, IL. After
graduation he attended Illinois Central College from August of 2004 through May of
2006. In August of 2006 he transferred to Missouri University of Science and
Technology, which was at that time the University of Missouri-Rolla. In May of 2009 he
received his Bachelors of Science Degree in Civil Engineering. In August of 2009 he
enrolled in the M aster of Science program as a structural engineering student at Missouri
S&T where he conducted research developing and testing Self-Consolidating Concrete.
He maintained membership in the American Concrete Institute (ACI) and has served as
the president and student advisor for the Missouri S&T Concrete Canoe Team.