development and use of curricular adaptations for students
TRANSCRIPT

KU ScholarWorks | http://kuscholarworks.ku.edu
Development and Use of Curricular
Adaptations for Students Receiving
Special Education Services
2012
by Jennifer A. Kurth
Lissa Keegan
This work has been made available by the University of Kansas Libraries’ Office of Scholarly Communication and Copyright.
Please share your stories about how Open Access to this article benefits you.
This is the author’s accepted manuscript, post peer-review. The original published version can be found at the link below.
Kurth, J.A. & Keegan, L. (2012). Development and use of curricular adaptations for students receiving special education services. Journal of Special Education. Published Online, Nov. 30, 2012.
Published version: http://dx.doi.org/10.1177/0022466912464782
Terms of Use: http://www2.ku.edu/~scholar/docs/license.shtml

1
Running Head: ADAPTATIONS
Development and Use of Curricular Adaptations for
Students Receiving Special Education Services
Jennifer A. Kurth, PhD
University of Kansas
Department of Special Education
JRP Room 541
Lawrence, KS 66045
Lissa Keegan, MEd
Northern Arizona University
College of Education
Box 5774
Flagstaff, AZ 86011
*All correspondence should be directed to Jennifer Kurth

2
Abstract
The present study is a quasi-experimental descriptive design, with existing educator-made adaptations evaluated. The goals of this study were to (1) Describe how educators develop adaptations, and (2) Evaluate the effectiveness of educator-made adaptations in facilitating the learning of students with disabilities. Findings suggest that: (1) Most adaptations were made in core general education classes; (2) Experienced educators created more simplified curricular adaptations, while novice educators created more functional alternative adaptations; (3) Educators are generally satisfied with the adaptation they have created, and believe it was effective in teaching the student; (4) Educators spent on average 59.1 minutes creating the adaptation; (5) Educators in rural areas and novice educators provided adaptations that were rated lower in quality and clarity than experienced and urban educators; and (6) General education teachers provided adaptations that were of lower quality and clarity than special education teachers and paraeducators. Recommendations for practice are provided.

3
Introduction
The number of children with disabilities being educated in general education, or
inclusive settings, has increased for the past 30 years. Research over this time has
consistently supported the practice of inclusive education (e.g. McGregor & Vogelsberg,
1998). While research evidence supports inclusive practices, the implementation of inclusion
remains difficult for many educators of students with disabilities. Both special and general
education teachers are often unsure of how to manage the needs and supports of diverse
students in general education settings (Dymond, Rengzaglia, & Chun, 2008). Yet students
with disabilities are legally required to access and participate in the general education
curriculum (Individuals with Disabilities Education Improvement Act, 2004; No Child Left
Behind Act, 2001) as well as a specially designed education program planned to address their
unique needs (Education for All Handicapped Children Act, 1975).
Due to these legal mandates, students receiving special education services who have
individual education plans (IEPs) often have adaptations made to the general education
curriculum. These adaptations allow access and participation in the core general education
curriculum regardless of ability level (Browder & Spooner, 2006; Downing, 2008; Janney &
Snell, 2004), and can take many forms, including: individualizing learning goals, teaching,
and supports (Lee et al., 2006). For the purposes of this project, we use the umbrella term
“adaptations” to describe instructional and curricular changes, with the understanding that
accommodations reflect adaptations made to support student access (such as providing
written materials in Braille) and that modifications reflect adaptations made to support
meaning (such as adjusting the difficulty level of an assignment).
Types of Adaptations

4
Adaptations may be curricular, instructional, or alternative (Janney & Snell, 2004).
As described by Janney and Snell (2004), curricular adaptations alter the content of what is
taught through supplementary, simplified, and alternative adaptations. For example, an
algebra lesson may be adapted by adding (supplementing) communication goals to the
algebra lesson (e.g., to work with a partner and ask questions), by simplifying the lesson so
that it is at a different difficulty level (e.g., focusing on adding and subtracting with a
calculator rather than setting up equations), or alternative goals, such as focusing on
following a task-schedule during the algebra lesson. Instructional adaptations alter how
content is taught and/or how learning is demonstrated, and include instructional stimulus and
student response adaptations. Instructional stimulus and student response adaptations change
the “difficulty, amount, modality, format, and/or materials” used to teach or respond to
instruction (Janney & Snell, p. 47, 2004). For example, a novel may be rewritten at a lower
readability level, with more pictures added, as an instructional stimulus adaptation.
Likewise, a student may create a collage of key events and characters from a novel rather
than writing an essay as a student response adaptation. Lastly, alternative adaptations alter
the goal, the instruction, and the activity and include alternative/parallel activities (e.g., a
student works on appropriate behavior and social skills during group work activities, rather
than the academic task), remedial instruction (e.g., a student receives direct instruction in
reading during silent-reading time), and functional skill instruction (e.g., a student works at a
grocery store one hour per day rather than staying at the high school for academic
instruction).
Use of Adaptations
5
Despite the legal mandate to provide access to the general education curriculum,
using adaptations if needed, it is unclear how frequently adaptations are truly used in schools.
For example, special educators working in inclusive settings were found to believe that
adaptations were being implemented more frequently than general education teachers (Kurth,
Gross, Lovinger, & Catalano, 2012). This same study found that teachers reported using
modified work for students with significant disabilities between 61-80% of the time.
Observation of actual implementation to verify this, however, was not completed. Yet,
Wehmeyer and colleagues (2003) reported that adapted materials were available for middle
school students with intellectual disabilities during less than 3% of their observations. Others
have noted that adaptations are more widely available for students with significant support
needs than students with milder disabilities (Dymond & Russell, 2004). In addition to the
reported variability in implementation of adaptations, it is unclear what factors teachers
consider when deciding if and when to provide adaptations to students in lesson-by-lesson or
day-by-day cases.
Effectiveness of Adaptations
Despite uncertainty related to their implementation, adaptations have been associated
with a range of positive classroom characteristics, including: higher student engagement,
fewer student competing behaviors, and less teacher time dedicated to classroom
management (Lee, Wehmeyer, Soukup, & Palmer, 2010). Further, curricular adaptations
have been found to improve student on-task behavior and work-production (Kern, Delaney,
Clarke, Dunlap, & Childs, 2001). Additionally, many educators support the idea of
adaptations (Idol, 2006). However, descriptions of characteristics of effective adaptations are
limited. A method for developing adaptations that facilitates common language between

6
general and special educators, which includes considering the student’s learning goals and
IEP accommodations, individualizing teaching methods, and individualizing personal
supports, has been articulated based on master-teacher input; however, this process has not
been field tested (Janney & Snell, 2006). Finally, students receiving special education
services often demonstrate academic underachievement (Massetti et al., 2008), and inclusive
education has been associated with improved academic outcomes for students with
disabilities (Dessemontet, Bless, & Morin, 2012; Kurth & Mastergeorge, 2010). Yet for
inclusion to be successful, the use of adaptations is necessary to meet individual student
needs (Cross, Traub, Hutter-Pishgahi, & Shelton, 2004). Therefore, understanding how
adaptations are created and their effectiveness in promoting student achievement is needed.
Current Study
The present study is a quasi-experimental descriptive design, with existing educator-
made adaptations evaluated. The goals of this study are to: (1) Describe how educators
develop adaptations, and (2) Evaluate the effectiveness of educator-made adaptations in
facilitating the learning of students with disabilities.
Method
Participants
School districts that include students with disabilities in general education classes
were recruited to participate in this study. As seen in Table 1, educators participated from
three primary geographic areas: An urban area in northern California (1 school district), an
urban area in central/southern Arizona (1 school district), and a rural area in southern
Arizona (1 school district). The district in California is in a city of approximately 100,000
with a median household income of $59, 517. Approximately 24% of the citizens live in

7
poverty, and approximately 27% of the residents speak a language other than English.
Approximately 17% of students in this district qualify for free and reduced lunch. The urban
school district in Arizona is located in a city of approximately 520,000 with a median
household income of $37, 025. Approximately 21% of the citizens live in poverty, and 34%
speak a language other than English in the home. The school district in this study is located
in an affluent area of this city with approximately 8% of students eligible for free and
reduced lunch. Lastly, the rural school in Arizona is situated in a city with a population of
approximately 25,000. Approximately 87% of the city residents speak a language other than
English, with 32.7% of the population living in poverty with an average income of $25,098
per household. Nearly all students in the district (98%) are eligible for free and reduced
lunch (US Census Bureau, 2010).
Thirty-one educators (general education teachers, special education teachers, and
paraeducators) from these three districts provided us with adaptations for the purposes of this
study. These educators include general education teachers (18%), special education teachers
(35%), and paraeducators (also known as paraprofessionals or instructional aides; 47%), as
depicted in Table 1. All general education teachers were located in rural Arizona. These
teachers were also younger and less experienced than teachers in urban Arizona and
California. There were fewer participants in rural Arizona, with fewer adaptations submitted.
All paraeducators were from urban Arizona and California, as were most special education
teachers.
Each educator provided as few as one and as many as four adaptations, resulting in a
total of 68 curricular adaptations. During recruitment two adaptations were requested of each
participant; four participants provided one adaptation, twenty-two provided two adaptations,

8
and five provided four adaptations. Participants provided a varied number of adaptations for
diverse reasons, including illness, time factors, and ease of copying and submitting
adaptations. These educators represent grades kindergarten through twelfth, and instruct
students with mild to significant disabilities.
<<Table 1 here >>
While students were not direct participants, educators were asked to provide basic
demographic information about the student for whom the adaptation was created. This
information included grade, gender, qualifying special education condition, and student
support needs (Soukup, Wehmeyer, Bashinski, & Bovaird, 2007). The support needs of the
student, as defined by Soukup and colleagues (2007) indicate the supports required for
students: (1) Overall Support, or the supports needed for overall functioning, including
independent living, self-care, community integration and (2) Learning Support, or the
supports needed to learn new skills or knowledge. Participants were provided definitions
from Soukup and colleagues (2007) to rate the support needs of the student for both areas,
which included: no support, indirect or direct verbal prompts, gestures or modeling prompts,
partial physical assistance, and full physical assistance. Adaptations for sixty-eight students
were provided. As seen in Table 1, students in rural Arizona were older (high school level)
and had lower overall support and learning support needs than students in urban California
and Arizona (who were primarily in middle school).
Procedure
Participant Recruitment. Participants were recruited through existing relationships
with school districts and teachers. Specifically, school districts that practice inclusive
education were contacted via email to solicit interest. A school administrator, generally the

9
principal or director of special education, was first contacted and told about the study.
Following his or her approval, educators were invited to provide us with a copy of an
adaptation they had already made or would have made had they not participated in the study.
Educators in California and Arizona were recruited.
Data Collection. Each participant signed consent to participate forms, and upon
consent were provided pre-paid mailing envelopes to return copies of the adaptation and a
reflection on the creation of that adaptation. Specifically, educators provided us with a
photocopy or photograph of an adaptation they had already made for a student during the
study time frame along with the original, “un-adapted” materials. Both the participating
educator and the researchers completed reflections of each adaptation.
Educator Instrument. The educator reflection was completed by the participating
educator (teacher or paraeducator) and consisted of 14-items, including: (1) A brief and
anonymous description of the student whose work was adapted, including age, gender, year
in school, special education qualifying condition, support needs and supports provided during
use of the adaptation; (2) the standard and IEP goal being addressed in the lesson; (3) a
description of what changes were made from the original lesson and why; (4) a self-rating of
educator satisfaction with the use and creation of the adaptation using a 5-point rating scale
(where 1 is a high score and 5 a low score) that included: (i) how easy the adaptation was to
use (which included: easy to use, easy to grade, I would use this again, and how well the
student completed the adaptation), (ii) how similar the adaptation was to the original lesson
(which included: similar in purpose, similar in appearance, similar in time required to
complete, similar in language used, similar in working arrangement, and similar in skills
taught) and (iii) how well the adaptation addressed a student need (which included
10
sensory/biological/physical needs, appropriate difficulty level, addresses IEP goal, addresses
content standard, and is age appropriate). Next, (5) educators were asked to report what
adaptations and supports are generally in place for the student and which were in place for
this specific lesson. Adaptations and supports included examples such as extra time, large
print, visual aids, and use of different level materials. Lesson samples included worksheets,
projects, assignments such as essays, and exams. Lastly, (6) the participants provided original
materials before any adaptations were made; and, (7) the adapted materials to allow us to see
what changes were made for the student. Neither the original materials (#6) nor the adapted
materials (#7) are discussed in the results section, as these were simply copies for our review
and to aid our understanding of the adaptations.
Researcher Instrument. Each author independently reviewed all original materials
and their adaptations as part of the researcher reflection instrument. The researcher reflection
included a description of: (1) the domain of the adaptation, such as language arts or science;
(2) the skills or IEP goals addressed in the adaptation, such as math computation or reading
comprehension; and (3) the type of adaptation used. The definitions for types of adaptations
used were those articulated by Janney and Snell (2004) and included curricular, instructional,
and alternative adaptations. The researcher reflection also included: (4) a description of what
was changed from the original and what was the same; (5) a description of whether the
adaptation is an example of an adaptation in teaching, assignment, or assessment and (6) a
rating of the quality and clarity of use of each adaptation. Lastly, adaptations were blind-
scored by independent raters (both authors) for quality and clarity using a 5-point scale where
1 was a high score and 5 a low score, using Janney and Snell’s (2006) indicators of quality
adaptations. These include adaptations that: (1) facilitate social and instructional

11
participation in general education, (2) are only as special as necessary, (3) promote student
independence, and (4) are age and culturally appropriate.
Data Analysis. Data was analyzed using both quantitative and qualitative measures.
Qualitative measures were utilized to evaluate written notes made by authors and educators
about each adaptation. These notes described the adaptation and educator comments as to
what changes were made to the original materials, and why (e.g., if a word bank was added,
this was noted). Both authors analyzed each educator reflection and self-rating. To evaluate
these written notes, a qualitative data analysis technique was utilized that involves
highlighting and organizing themes based on grounded theory techniques (Attride-Stirling,
2001; Corbin & Strauss, 1990) using the Qualitative Data Analysis Software for Mixed
Methods Research (QDA Miner) software. Initially, each author independently rated each
adaptation and educator reflection. Following this, the authors discussed the coding system
each had developed and agreed on a final coding system. All written notes were then re-
analyzed.
Quantitative measures were used to evaluate the reflection-responses of educators and
authors. Specifically, measures of inter-rater reliability regarding the similarities between the
adapted and original materials in terms of content, vocabulary, and skills learned were
analyzed, as well as measures of inter-rater reliability regarding the quality of the adaptations
created. Additionally, descriptive statistics are reported to describe the reflection-responses
for each participant along with comparisons of mean scores, calculated using independent
sample t-tests and ANOVA depending on the number of variables in each sample. Average
ratings of adaptation quality and clarity were reported.
Results

12
Educator Instrument Results
Both authors, without knowledge of from whom or where the educator reflection
came,
analyzed each educator written reflection response independently. Final inter-rater reliability
of these qualitative educator responses was calculated using percentage agreement using
QDA Miner, with a total final agreement of 86.4%.
Description of Students. As shown in Table 1, students ranged in grade from first
through twelfth, and had a range of qualifying conditions. Student support needs for overall
functioning ranged from 1.71 to 3.14. Students in rural Arizona had less support needs than
students in urban Arizona and California. Student support needs for learning ranged from
2.42 to 3.31; students in rural Arizona had fewer learning support needs than students in
urban Arizona and California.
Standards/IEP Goals Addressed in Adaptation. Educators reported “not
applicable” or “I don’t know” when asked which IEP goal the adaptation was linked to in
88% of the adaptation samples provided. Similarly, 64% of educators reported, “I don’t
know” or “not applicable” when describing which state standard the adaptation was linked to.
However, the Researcher Instrument was used to determine the broad skills addressed in the
adaptations (as discussed below), despite the educators themselves being frequently unsure of
the specific IEP goal or state standard the adaptation was aligned to.
What changes were made, and why? To better understand what changes educators
made to the original materials and why, three open-ended questions were included in the
educator reflection. These included: (1) What has changed? (2) What is the same? and (3)
Why were the changes made? Responses to these questions were organized into qualitative

13
themes, as shown in Table 2. Identified themes for “Describe your adaptation: What has
changed from the original?” include the themes of: making changes in quantity/length (e.g.,
“list is only 10 words, not 15”); change in level of difficulty (e.g., “instead of solving for a
variable in a two-step equation, the student is replacing the variable with a number in a
simple equation”); change in response format (e.g., “instead of reading about states of matter
and answering questions, [student] made a poster”); adding or supplementing materials to the
original (e.g., “word bank added”); and fundamental changes that included separate or
different locations and concepts taught (e.g., “different worksheets were used”). As seen in
Table 2, experienced educators were more likely to use adaptations that changed the
difficulty level or response format, whereas novice educators were more likely to use
adaptations that were fundamentally different from the original. Special education teachers
were also more likely to use adaptations that were of a different (lower) difficulty level than
general education teachers or paraeducators.
<<Table 2 here>>
Themes for the question, “Describe your adaptation: What is the same as the
original?” included the themes: same concept, defined here as the adaptation addressing the
same skill/topic area (e.g., “characters, places, plot the same”); same content, defined here as
the same basic materials being used (e.g., “the use of the chapter assessment as practice for
the test”); and different, defined here as essentially no content or concept the same as the
original lesson (e.g., “pre-K Dolch words”). Of statistical significance, novice teachers were
more likely to create adaptations that were very different from the original lesson than
experienced educators.

14
Lastly, themes for the question, “Describe your adaptation: Why were the changes
made?” included the following themes: to encourage student independence (e.g., “read it
himself and do the activity with fewer prompts”); increase access to the core curriculum
(e.g., “adjust the level of [student’s] understanding”); to promote appropriate or on-task
behavior (e.g., “to decrease frustration level to assess science knowledge”); to provide a
separate or different functional curriculum (e.g., “choosing a quieter time in class to do the
work at his [pull out] desk”); and lastly a theme that focused on student deficits were
identified (e.g., “student is very low and is autistic [with] little speech”). As seen in Table 2,
educators in California were more likely to create adaptations that focused on improving
student independence. Experienced educators were more likely to create adaptations that
focus on improving access and behavior, whereas novice educators were more likely to focus
on student deficit when creating adaptations. Special education teachers created more
adaptations that focus on improving access than general education teachers and
paraeducators.
Educator Self-Rating of Effectiveness of Adaptation. Overall, our findings suggest
that all educators are generally satisfied with the adaptation they have provided, with
satisfaction ranging from 1.35-2.33 (where 1 is a high rating, and 5 is a low rating). We
found no significant differences by area, experience, and type of educator. Analysis of Table
3 indicates that all educators appear more likely to create adaptations that are easy to
make/use, followed by adaptations that address a specific student need, and lastly adaptations
that are similar to the original assignment. Furthermore, educators spent on average 59.1
minutes creating the adaptation, with a range of 1-480 minutes. Inspection of Table 3 reveals
that educators in California, special education teachers and paraeducators, and educators with

15
more experience spent more time creating the adaptation than educators in Arizona (rural and
urban), novice teachers, and general education teachers. A mean response of 1.69 across all
educators (where 1 is a high rating, 5 is a low rating) indicates that students were successful
in learning the skill, with use of the adaptation. Educators reported that the adaptation was so
successful that they would use it again (in appropriate circumstances) with a mean rating of
1.24.
<<Table 3 here>>
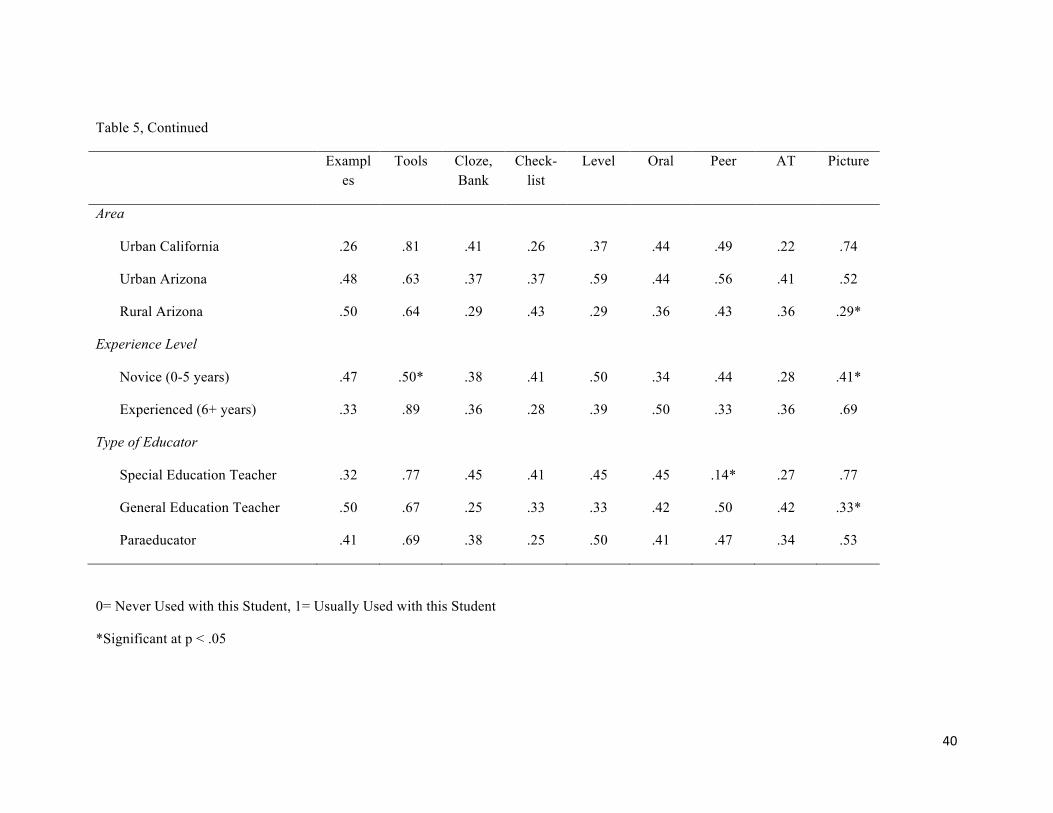
Adaptations used now and usually. Educators indicated specific types of
adaptations used by the student as “never used” and “usually used.” In general, the least used
adaptations included large print (“never used” 71% of students), assistive technology (“never
used” 67% of students), and checklists (“never used” 66% of students). The most frequently
used included lowered reading levels (“usually used” 41% of students), reducing the length
of an assignment (“usually used” 37% of students), using manipulatives or other tools
(“usually used” 32% of students), adding visuals (“usually used” 27% of students), and
providing extra time (“usually used” 27% of students). Several areas of statistical
significance are noteworthy. First, novice educators are less likely to use reduced
length/quantity of assignments, permit tools (such as calculators or computers), and visuals
than experienced educators. Second, general education teachers are less likely to use reduced
length/quantity as an adaptation than special education teachers. They are also less likely to
use pictures as a means of student response (e.g., collage rather than an essay) than special
education teachers. Last, special education teachers are less likely to use peer tutors and
large print materials than general education teachers in this sample.
Researcher Instrument Results
16
Both authors independently reviewed all original and adapted materials when
completing the researcher reflection instrument. These materials were identified only by
participant number; thus, the raters were blind to the type of participant and location.
Following initial review and completion of the researcher instruments, inter-rater reliability
scores were calculated with a percent agreement of 88% after initial rating. The authors then
met and discussed the 12% of ratings where disagreements occurred and came to a joint
agreement regarding these adaptations. These final scores were used in SPSS for generating
descriptive statistics.
Domain of Adaptations. Most adaptations (89%) in the present study were made in
core general education classes (e.g., math, language arts, history, science) as opposed to other
time periods (e.g., art, recess, music). This was true by region, experience level, and type of
educator.
Skills and/or IEP Goals Domains Addressed in Adaptation. The adaptations
addressed a range of IEP and skill domain areas. The most frequent domain was reading
comprehension (26%). The next most frequent domain was math computation (14%); daily
living skills and behavior regulation were both the primary skill domains addressed in 11%
of the adaptations, respectively. Writing passages constituted 10% of adaptation skill areas.
The remaining areas were less frequent: spelling (5%), math reasoning/problem solving,
social skills, communication skills, and motor skills (4% each), reading decoding and
“unclear” were each the primary domains of 3% of the adaptations, and 1% of the
adaptations were related to organizational skills.
Curricular, Instructional, or Alternative Adaptations. Each adaptation was
coded by the authors as being curricular, instructional, or alternative using the definitions

17
articulated by Janney and Snell (2004). In this sample, most educators across region,
experience level, and position made instructional adaptations most frequently (53%),
followed by curricular adaptations (31%), and alternative adaptations (16%). As depicted in
Table 4, the most frequent adaptations in this sample include adaptations to the instructional
stimulus, simplified adaptations, and adaptations to student response. The least used
adaptations were remedial, functional, alternative, and supplementary. Of statistical
significance, we found that experienced educators created more simplified curricular
adaptations, while novice educators created more functional alternative adaptations.
<<Table 4 here>>
What changed and stayed the same. Main findings for changes made (and why) in
adaptations are described in the educator instrument section (above). An area of interest that
emerged during the researcher reflection centered on the language used by participants when
discussing their reasoning for adaptations. Specifically, in the 68 responses to the question
“why were changes made,” 34 references included deficit-based word choices when
describing the student, with words “cannot, unable, not able, and lacks ability” used
repeatedly by educators. Other examples of deficit-based orientations included the
sentiment, “this doubles the work output for staff” and “horrible handwriting.” Less than
7% of responses used language that could be interpreted as strengths-based. The strengths-
based examples primarily focused on providing opportunities for students to be independent
and demonstrate ability.
Adaptations to Teaching, Assignments, or Assessments. Most adaptations in our
sample were related to assignments (51%) and teaching (37%). Few adaptations were to
assessments (12%). For example, an adaptation to teaching in our sample included the

18
elementary school novel Island of the Blue Dolphins rewritten at a lower readability level.
An adaptation to assignments included a worksheet related to the central nervous system in a
high school biology class that had been recreated using a word bank and fill-in-the blanks.
For example, the worksheet stated, “The e_ _ _ c_ _ n _ system is made up of glands” (and
the words “endocrine” and “nervous” appeared beside the question). Lastly, assessment
adaptations in our sample included a middle school science test (on earthquakes and
volcanoes) that was changed from open ended (“name and describe one type of force in the
Earth”) to a matching question (here, the student was provided four forces: friction,
compression, tension, and shear along with four definitions. The student needed to match the
term to its definition for this adapted question).
Quality and Clarity of Adaptation. Both authors scored each adaptation for quality
and clarity using a five-point scale where “1” is a high rating and “5” is a low rating. A
number of statistically significant results arose from this scoring, as shown in Table 3.
Educators in rural Arizona provided adaptations that were rated lower in quality and clarity
than urban educators in Arizona and California. Novice educators provided adaptations that
were of lower quality ratings than experienced educators. Lastly, general education teachers
provided adaptations that were of lower quality and clarity ratings than special education
teachers and paraeducators. However, in our sample, general education teachers were
primarily novice and from a rural area, so it is not certain which factor (area, experience, or
type of educator) has the greatest impact on quality and clarity of adaptations.
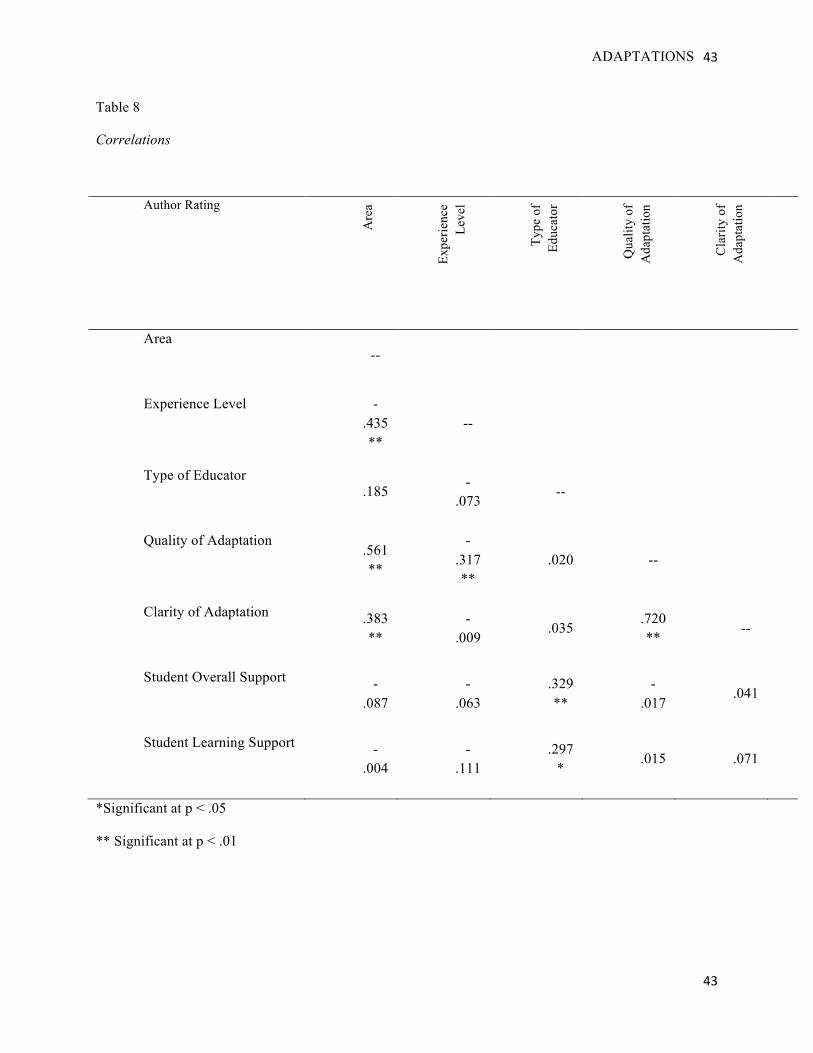
In consideration of this, correlations were calculated for area, experience, type of
educator, quality and clarity of adaptation, and student support needs, using Pearson product-
moment correlation coefficient. Findings indicate that more experience is associated with

19
higher quality adaptations (r = -.317, p < .002). Type of educator (licensed teacher vs.
paraeducator) is not associated with adaptation quality or clarity (r = .020, p < .895 and r =
.035, p < .756, respectively). Furthermore, paraeducators in this sample were more likely to
provide adaptations for students with greater overall and learning support needs than licensed
teachers (r = .329, p < .005), suggesting that paraeducators are more likely to be working
with students with greater support needs than licensed teachers. Lastly, quality and clarity
ratings of adaptations are highly related (r = .720, p < .001), as are student support needs and
overall learning support needs (r = .829, p < .0001).
Discussion
Limitations
Before a full discussion of the results can begin, limitations of the present design
must be recognized. First, the majority of special educators and paraeducators came from
urban districts and all general educators came from a rural district. It is possible that results
would vary if our sample were more evenly distributed. Secondly, general educators
represent only 18% of our sample, which also limits the generalizability of our findings.
Future research should include a wider range of general education teachers. Lastly, the urban
districts provided few adaptations for students with milder disabilities, but the rural district
provided exclusively adaptations for students with learning disabilities. When recruiting
participants, we had solicited inclusive districts for participation; it turned out that the urban
districts included all students (with a range of disabilities), whereas the rural district
maintained a separate class (which did not participate in the study as the students did not
participate in general education classes) for students with more significant disabilities. As a
result, only students with learning disabilities were included from the rural district.

20
Influences on adaptation quality
Area. A number of differences by area were identified, suggesting that resources
available in different regions play a role in adaptations created by educators. Educators in
urban areas of California and Arizona had more resources available, including related service
providers and inclusion support personnel. Educators in rural Arizona had significantly
fewer resources available, including a lack of related service providers and few resources for
families or educators. A number of unique challenges exist in rural education, including
difficulties recruiting teachers (Monk, 2007), and limited federal, state, and community
resources (Artesani & Brown, 1998). Both of these factors were apparent in the rural school
district in Arizona, and may account for the lower quality of adaptations provided in this
area.
Type of educator. Both paraeducators and special education teachers created
adaptations of similar quality and clarity. However, neither California nor Arizona has a
licensing or training program for paraeducators, and so it would seem that on-the-job training
and professional experience contribute to the creation of quality adaptations. Our findings
further indicate that general education teachers made adaptations of lower quality than
special education teachers and paraeducators. Together, these findings suggest that
experience, rather than professional licensure or training, has a greater impact on quality
adaptations. Previous examinations of teacher quality have noted that teachers with and
without certification were equally effective in promoting student learning (Kane, Rockoff, &
Staiger, 2008). The results of this study indicate that these findings can be extended to
educators with no or limited pre-service preparation in special education (i.e., paraeducators
and general education teachers) in terms of creating meaningful adaptations.

21
Experience level. Research in teacher quality generally confirms that educators with
more years of experience are more effective than novice educators (Chingos & Peterson,
2011). In the present study, educators (general education teachers, special education teachers,
and paraeducators) with more experience created higher quality adaptations than novice
educators. Specifically, novice educators created adaptations that were different from the
original lesson more frequently than experienced educators, focused on student-deficits
(rather than support needs), took less time to create adaptations, and had overall lower quality
ratings for their adaptations. Also noteworthy, novice educators were less likely to use
various forms of supports (such as visuals, tools, reducing length, and assistive technology)
in adaptations than experienced educators. Together, these results suggest the importance of
on-the-job experience in creating quality adaptation supports for students in inclusive
settings.
How do educators develop adaptations?
Generally, educators in this sample consider student need, ease of use, and the
original assignment when creating adaptations. Student needs that are of importance to
educators in this sample, based on qualitative analysis, include: student independence,
providing access to the core curriculum, and developing means for students to regulate their
behavior. Overall, educators in this sample created adaptations that were focused on
accessing the core general education curriculum, with limited adaptations focused on access
skills such as communication or motor skills. Lastly, as previous research has suggested, in
this sample general education teachers tended to create adaptations directed toward the class
as a whole with only minor or no changes for individual students (Scott, Vitale, & Masten,

22
1998). Special education teachers and paraeducators in this sample developed exclusively
individual adaptations.
Educators were asked to report which IEP goal the adaptation was aligned with.
Interestingly, educators wrote “not applicable” or “I don’t know” in nearly 90% of the
adaptations. In addition to indicating that IEP goals are not key considerations when
developing adaptations, this finding also suggests that educators are unfamiliar with the
content of student IEPs. Analysis of this data indicates that accessing the general education
lesson content was of paramount concern to educators in this sample, and suggests that
improved mechanisms of sharing IEP goals, along with considerations for aligning IEP goals
to instruction, is needed.
Similarly, educators were frequently (64% of the time) unable to report which state
standard the class lesson and thus the adaptation were aligned with. A number of
possibilities exist that can explain this finding, including that paraeducators were significant
contributors of adaptations and may be less informed about particular state standards than
teachers. Another possibility is that teachers do not have each lesson aligned clearly to a
specific standard.
Language use by educators in their descriptions of why the original materials or
instruction was changed was also noteworthy. The frequent use of deficit-based language
raises the question: does a focus on student deficit effect educator expectations for the
student? Also, does a focus on deficits make it more difficult to integrate the student with
disabilities and create adaptations that are closely aligned to the original coursework (or the
creation of more “special” adaptations)?
How effectively do adaptations facilitate learning and participation?

23
According to Janney and Snell (2004), curricular adaptations alter the content of what
is taught, instructional adaptations alter how that content is taught or how learning is
demonstrated, and alternative adaptations alter the goal, the instruction, and the activity. In
this sample, most educators across region, experience level, and position made instructional
adaptations most frequently. These results indicate access and participation in the general
education curriculum were the primary goals of adaptations, in that as a whole, the
adaptations provided to students were tied to the general education activity and did not
promote removal of students from that setting.
Furthermore, educators reported high success rates for the adaptations. This success
was achieved with relative ease, as reported by the educators and without many fundamental
changes to the content or purpose of the lesson. Of concern, however, was the amount of
time educators reportedly spent creating each adaptation. The time spent ranged from 1
minute to 8 hours per adaptation, with a mean of 59 minutes. The least time intensive
adaptations in this sample consisted mostly of reducing the length of an assignment (e.g.,
crossing off sections the student did not need to complete on a worksheet). The most time
intensive adaptations involved adapting novels to a lower-readability level (e.g., re-writing
Island of the Blue Dolphins). Given caseload size in special education and class size in
general education, it would appear that this level of time commitment might not be feasible
or sustainable for many educators.
Indicators of quality adaptations
Janney & Snell (2006) suggest quality adaptations are those that (1) facilitate social and
instructional participation in general education, (2) are only as special as necessary, (3)
promote student independence, and (4) are age and culturally appropriate. Analysis of the
24
results presented here support these indicators of quality, and we found many examples of
these quality indicators in the adaptations we reviewed. In addition to these quality
indicators, we suggest further indicators of quality. First, ease of use of the adaptation in
terms of time and available resources may be considered an indicator of quality. We
recognize that educators often have limited time and resources to create adaptations.
Developing structures to plan general adaptations, including collaboration, may help decrease
the time commitment required and allow educators time for specific adaptations. Second,
creating adaptations that are high in clarity may be beneficial. That is, an adaptation that
may be created by one individual with such clarity or simplicity of use that others (e.g.,
paraeducators or peer tutors) can efficiently and effectively implement the adaptation will be
beneficial. Lastly, adaptations that focus on student support needs versus student deficits are
also ideal. That is, rather than focusing on what skills a student is lacking or unprepared for,
we can focus on what supports should be in place for the student to be successful (Barnes,
Mercer, & Shakespeare, 1999). Future research may be directed at creating a “checklist” or
other tool with these quality indicators in mind that educators may use to determine if the
adaptation they are creating is of high quality.
Significance & Recommendations
Development of quality adaptations. The present study is unique in that it consists of
an analysis of actual student adaptations, with educator reflections and explanations of those
adaptations. This allows one to understand the factors educators consider when making
adaptations and how we may better prepare educators (both licensed and paraeducators) to
develop high-quality adaptations that promote student skill development, membership, and
participation. Traditionally, adaptations have been viewed as very specific to the unique

25
needs of an individual student, and therefore it has been thought difficult, if not impossible,
to describe a quality adaptation. The present study builds on Janney and Snell’s suggestions
for a means of defining a quality adaptation by describing the factors educators consider and
how adaptations vary by geographic area, experience level, and professional background.
Utilization of resources. The present study also describes the realistic factors associated
with adaptations, including the great time-demands placed upon educators in inclusive
settings who create adaptations for specific students in specific activities and lessons.
Caseload size, shifting to “case managers” rather than primary instructors in inclusive
settings, and paperwork burdens have been identified as contributors to special education
teacher burnout and attrition (Billingsley, 2004). The creation of quality adaptations requires
educators to invest a great amount of time collaborating with general education teachers,
securing materials, and developing adaptations—time that is not spent in direct instruction.
This is an example of the shifting role of special education teachers from direct instructor to
case manager and curriculum developer. In fact, special education teachers now complete a
wide range of tasks beyond instruction, which includes completing IEP paperwork and goal
updating, supervising paraeducators, assessing students, creating adaptations, collaborating
with other educators and families, and many other roles (Vannest & Hagan-Burke, 2010).
Schools may benefit from examining how special educators can accomplish these diverse and
important roles in a more efficient manner. Specifically, schools and administrators may
benefit from reallocating valuable educator time and perhaps shifting roles and
responsibilities. For example, a paraeducator may be hired with expertise in curriculum
adaptation. This person would take on the role of collaborating with general education
teachers to gather information about upcoming lessons and activities, develop specific

26
adaptations, and share them with a special education teacher for approval and
implementation.
Preparation for adaptations. Educators were found to make adaptations that they
identified as successful and effective. However, experienced educators (those with 5 or more
years of experience) were found to create adaptations of higher quality than novice educators.
Background experience (e.g., professional licensure) was found to be of less importance than
on-the-job use of and experience with adaptations. Mentoring and supervision, then, may be
beneficial in preparing novice educators to identify relevant resources for making
adaptations, for selecting adaptations that promote inclusion and skill development, and for
evaluating the effectiveness of the adaptations. Furthermore, pre-service teacher programs
should focus on preparing educators to develop meaningful, high-quality adaptations through
fieldwork and assignments. Lastly, on-going professional development, such as adaptations
workshops, may also be beneficial to educators. However, decontextualized professional
development, such as one-time workshops with little or no follow-up, have minimal impact
on practices (Guskey, 2002). Thus, professional development opportunities that are rich in
feedback, assistance in implementation, and meaningful to the educators must be
emphasized.
Future Directions
Additional research regarding means to objectively measure the quality of a
curriculum adaptation is needed. The development of a checklist or self-rating scale may be
useful in assisting educators when developing an adaptation. Similarly, understanding the
thought-process educators use when creating adaptations would be useful in further

27
understanding the issues educators consider; a think-aloud process in which the educator
“thinks aloud” while making an adaptation may provide valuable insight.
In addition to understanding how quality adaptations can be created, more
information is needed on how those adaptations are implemented and how they benefit
students with disabilities. Specifically, what factors are associated with correct
implementation of adaptations? How are adaptations graded, and does this effect student
involvement in general education? Do adaptations facilitate participation, progress, and
access in general education and inclusive communities? Are adaptations effective in
promoting independence? Lastly, family opinions regarding the use of, and value of,
adaptations is lacking. Research suggests that families value inclusive education in general
(e.g., Leyser & Kirk, 2004) but how families value specific implementation practices, such as
the use of adaptations, is not well described.

28
References
Artesani, A. J., & Brown, D. W. (1998). Special education: Challenges for rural school
systems. Journal of Research in Rural Education, 14(2), 116-124.
Barnes, C., Mercer, G., & Shakespeare, T. (1999). Exploring disability: A sociological
introduction. Cambridge: Polity Press.
Billingsley, B. S. (2004). Special education teacher retention and attrition: A critical analysis
of the research literature. Journal of Special Education, 38(1), 39-55.
Browder, D., & Spooner, F. (2006). Teaching language arts, math, and science to students
with significant cognitive disabilities. Baltimore, MD: Paul H. Brookes.
Chingos, M. M., & Peterson, P. E. (2011). It's easier to pick a good teacher than to train one:
Familiar and new results on the correlates of teacher effectiveness. Economics of
Education Review, 30(3), 449-465.
Cross, A. F., Traub, E. K., Hutter-Pishgahi, L., & Shelton, G. (2004). Elements of Successful
Inclusion for Children with Significant Disabilities. Topics in Early Childhood
Special Education, 24(3), 169-183.
Dessemontet, R. S., Bless, G., & Morin, D. (2012). Effects of inclusion on the academic
achievement and adaptive behaviour of children with intellectual disabilities. Journal
of Intellectual Disability Research, 56(6), 579-587.
Downing, J. E. (2008). Including students with severe and multiple disabilities in typical
classrooms (3rd ed.). Baltimore, MD: Paul H. Brookes.

29
Dymond, S. K., Rengzaglia, A., & Chun, E. (2008). Inclusive high school service learning
programs: Methods for and barriers to including students with disabilities. Education
and Training in Developmental Disabilities, 43(1), 20-36.
Dymond, S. K., & Russell, D. L. (2004). Impact of grade and disability on the instructional
context of inclusive classrooms. Education & Training in Developmental Disabilities,
39(2), 127-140.
Education for All Handicapped Children Act, PL 94-142, U.S. Statutes at Large. 899. 777-
796, Pub. L. No. 94-142 (1975 August 23, 1977).
Guskey, T. R. (2002). Does it make a difference? Educational Leadership, 59(6), 45-51.
Idol, L. (2006). Toward inclusion of special education students in general education.
Remedial & Special Education, 27(2), 77-94.
Individuals with Disabilities Education Act (IDEA) Data. (2009) Retrieved November 11,
2009, from http://www.ideadata.org
Individuals with Disabilities Education Improvement Act, H.R. 1350, Pub. L. No. P.L. 108-
446 (2004).
Janney, R. E., & Snell, M. E. (2004). Modifying schoolwork: Teachers' guides to inclusive
practices (2nd ed.). Baltimore, MD: Paul H. Brooks, Inc.
Janney, R. E., & Snell, M. E. (2006). Modifying schoolwork in inclusive classrooms. Theory
Into Practice, 45(3), 215-223.
Kane, T. J., Rockoff, J. E., & Staiger, D. O. (2008). What does certification tell us about
teacher effectiveness? Evidence from New York City. Economics of Education
Review, 27(6), 615-631.

30
Kern, L., Delaney, B., Clarke, S., Dunlap, G., & Childs, K. (2001). Improving the classroom
behavior of students with emotional behavioral disorders using individualized
curricular modifications. Journal of Emotional and Behavioral Disorders, 9(4), 239-
247.
Kurth, J. A., Gross, M., Lovinger, S., & Catalano, T. (2012). Grading students with
significant disabilities in inclusive settings: Teacher perspectives. The Journal of the
International Association of Special Education, 13(1), 39-55.
Kurth, J. A., & Mastergeorge, A. M. (2010). Individual edcuation plan goals and services for
adolescents with autism: Impact of age and educational setting. Journal of Special
Education, 44(3), 146-160.
Lee, S. H., Amos, B. A., Gragadous, S., Lee, Y., Shogren, K. A., Theoharris, R., &
Wehmeyer, M. L. (2006). Curriculum augmentation and adaptation strategies to
promote access to the general curriculum for students with intellectual and
developmental disabilities. Education and Training in Developmental Disabilities,
41(3), 199-212.
Lee, S. H., Wehmeyer, M. L., Soukup, J. H., & Palmer, S. B. (2010). Impact of curriculum
modifications on access to the general education curriculum for students with
disabilities. Exceptional Children, 76(2), 213-233.
Leyser, Y., & Kirk, R. (2004). Evaluating Inclusion: An examination of parent views and
factors influencing their perspectives. International Journal of Disability,
Development & Education, 51(3), 271-285.
Massetti, G. M., Layhey, B. B., Pelham, W. E., Loney, J., Ehrhardt, A., Lee, S. S., & Kipp,
H. (2008). Academic achievement over 8 years among children who met modified
31
criteria for Attention-Deficit / Hyperactivity Disorder at 4-6 years of age. Journal of
Abnormal Child Psychology, 36(399-410).
McGregor, G., & Vogelsberg, R. T. (1998). Inclusive Schooling Practices: Pedagogical and
Research Foundations: Paul H. Brookes Publishing Co., Inc.
Monk, D. H. (2007). Recruiting and retaining high-quality teachers in rural areas. The Future
of Children, 17(1), 2007.
No Child Left Behind Act, Pub. L. No. P.L. 107-110 (US Department of Education 2001).
Scott, B. J., Vitale, M. R., & Masten, W. G. (1998). Implementing instructional adaptations
for students with disabilities in inclusive classrooms: A literature review. Remedial
and Special Education, 19(2), 106-119.
Soukup, J. H., Wehmeyer, M. L., Bashinski, S. M., & Bovaird, J. A. (2007). Classroom
variables and access to the general curriculum for students with disabilities.
Exceptional Children, 74(1), 101-120.
US Census Bureau. (2010). US Census Bureau Quick Facts Retrieved March 22, 2012, from
http://quickfacts.census.gov/
Vannest, K. J., & Hagan-Burke, S. (2010). Teacher time use in special education. Remedial
& Special Education, 31(2), 126-142.
Wehmeyer, M. L., Lattin, D., Lapp-Rincker, G., & Agran, M. (2003). Access to the general
curriculum of middle school students with mental retardation: An observational
study. Remedial and Special Education, 24(5), 262-272.

32
Table 1
Educator Demographics, as total number
Educator Demographic Urban
California
Urban
Arizona
Rural
Arizona
Number of Participants 12 12 7
Educator Type
General Educator 0 0 5
Special Educator 8 1 2
Paraeducator 4 11 0
Gender
Male 2 1 4
Female 10 11 3
Age
Mean 35 30 26
Range 30-56 19-65 23-47
Years of Experience
Mean 9.3 5.4 5.0
Range 0-18 0-17 0-18
Novice (0-5 years) 5 17 10
Experienced (6+ years) 22 10 4
Number of Adaptations 27 27 14

33
Table 2
Student Demographics, as total number and mean
Student Demographic Urban California
Urban
Arizona
Rural
Arizona
Total Number of Students 27 27 14
Grade
Elementary (K-5) 6 4 0
Secondary (6-12) 21 23 14
Gender
Male 14 14 12
Female 13 13 2
Qualifying Condition
Autism Spectrum 16 8 0
Other Health Impairment 4 2 0
Intellectual Disability 2 11 0
Orthopedic Impairment 1 0 1
Learning Disability 0 0 13
Multiple Disabilities 0 4 0
Emotional Disability 1 2 0
Speech Impairment 3 0 0
Overall Support Need
Mean Rating 2.69 3.14 1.71*
Learning Support Need

34
Mean Rating 2.85 3.31 2.42*
Support Needs: 1= No Support; 2 = Indirect or Direct Verbal Prompts; 3= Gestures or Modeling; 4= Partial Physical Prompts; 5= Full Physical Prompts
* Significant at p < .05

35
Table 3
Purpose of Adaptations Qualitative Themes, as Mean Number of Responses per Adaptation
What changed? What stayed the same? Why were changes made?
Qua
ntity
Leve
l
Res
pons
e
Supp
lem
ent
Diff
eren
t
Con
cept
Con
tent
Diff
eren
t
Inde
pend
ence
Acc
ess
Beh
avio
r
Diff
eren
t
Def
icit
Area
Urban California 0.5 1.1 0.5 0.7 0.1 0.8 0.9 0 0.4* 1.5 0.2 0.1 0.8
Urban Arizona 0.4 0.4 0.3 0.3 0.4 0.5 0.3 0.2 0.1 0.8 0.3 0.1 0.6
Rural Arizona 0.1 0.9 0 0.5 0.1 0.4 0.7 0 0 0.9 0.4 0 0.9
Experience Level
Novice (0-5 years) 0.3 0.6 0.1 0.4 0.4* 0.5 0.6 0.1* 0.1 0.8 0.5* 0.1 0.9*
Experienced (6+ years) 0.4 1.0* 0.5* 0.5 0.1 0.7 0.6 0 0.3 1.3* 0.1 0.1 0.6
Type of Educator
Special Education Teacher 0.5 1.2* 0.5 0.6 0.1 0.8 0.8 0.1 0.3 1.5* 0.3 0 0.6
General Education Teacher 0.1 0.8 0 0.5 0.2 0.4 0.7 0 0 0.9 0.3 0 1

36
Paraeducator 0.4 0.5 0.4 0.3 0.4 0.5 0.5 0.1 0.2 0.8 0.3 0.2 0.8
*Significant at p < .05

37
Table 4
Types of Adaptations as total number as total number of examples provided
Curricular Adaptation1 Alternative Adaptation1 Instructional Adaptation1
Supplementary Simplified Alternative Parallel Remedial Functional Stimulus Response
Area
Urban California 0 8 0 1 0 0 13 5
Urban Arizona 1 6 3 5 2 3 4 3
Rural Arizona 0 4 0 0 0 0 5 5
Experience Level
Novice (0-5 years) 1 4 0 4 2 3* 11 7
Experienced (6+ years) 0 12* 3 2 0 0 11 6
Type of Educator
Special Education Teacher 0 5 0 0 0 0 11 6
General Education Teacher 0 2 0 0 0 0 7 3
Paraeducator 1 9 3 6 2 2 6 3

38
1Source: Janney & Snell (2000)
*Significant at p < .05

39
Table 5
Mean Use of Supports and Adaptations
Large Print
Add Visuals
Reading Level
Color Code
Extra Time
Less Length
High-Light
Simplify
Area
Urban California 0* .74 .52 .44 .93 .93 .48 .30
Urban Arizona .56 .74 .74 .52 .67 .89 .41 .52
Rural Arizona .36 .43 .50 .43 .79 .71 .57 .43
Experience Level
Novice (0-5 years) .44 .63 .63 .47 .78 .75* .44 .47
Experienced (6+ years) .17* .72 .58 .47 .81 .97 .50 .36
Type of Educator
Special Education Teacher 0* .73 .50 .41 .91 .91 .41 .32
General Education Teacher .42 .50 .58 .50 .83 .67* .67 .50
Paraeducator .47 .69 .72 .50 .69 .94 .47 .47
0= Never Used with this Student, 1= Usually Used with this Student
* Significant at p < .05
40
Table 5, Continued
Examples
Tools Cloze, Bank
Check-list
Level Oral Peer AT Picture
Area
Urban California .26 .81 .41 .26 .37 .44 .49 .22 .74
Urban Arizona .48 .63 .37 .37 .59 .44 .56 .41 .52
Rural Arizona .50 .64 .29 .43 .29 .36 .43 .36 .29*
Experience Level
Novice (0-5 years) .47 .50* .38 .41 .50 .34 .44 .28 .41*
Experienced (6+ years) .33 .89 .36 .28 .39 .50 .33 .36 .69
Type of Educator
Special Education Teacher .32 .77 .45 .41 .45 .45 .14* .27 .77
General Education Teacher .50 .67 .25 .33 .33 .42 .50 .42 .33*
Paraeducator .41 .69 .38 .25 .50 .41 .47 .34 .53
0= Never Used with this Student, 1= Usually Used with this Student
*Significant at p < .05

41
Table 6
Educator Self-Evaluation of the Adaptation, as averages
Similarity to Original
Ease
of Use
Addresses Student Needs
Time
(in minutes) to create
Area
Urban California 2.33 1.45 1.72 68.0*
Urban Arizona 2.00 1.46 1.70 20.2
Rural Arizona 1.55 1.40 1.70 14.1
Experience Level
Novice (0-5 years) 1.93 1.52 1.76 26.7
Experienced (6+ years) 2.07 1.35 1.58 86.9*
Type of Educator
Special Education Teacher 2.03 1.42 1.44 52.8
General Education Teacher 1.59 1.39 1.71 18.2*
Paraeducator 2.07 1.44 1.78 35.8
1-5 rating, where 1=high rating/high agreement; 5=low rating/low agreement
*Significant at p < .05

42
Table 7
Rating of Adaptation Quality and Clarity
Author Rating Adaptation Clarity
Mean Rating
Adaptation Quality
Mean Rating
Area
Urban California 1.31 1.91
Urban Arizona 1.24 1.91
Rural Arizona 2.39* 3.93*
Experience Level
Novice (0-5 years) 1.52 2.72*
Experienced (6+ years) 1.50 1.97
Type of Educator
Special Education Teacher 1.23 1.98
General Education Teacher 2.54* 3.92*
Paraeducator 1.34 2.05
1= Highest Rating, 5=Lowest Rating
*Significant at p < .05
ADAPTATIONS
43
43
Table 8
Correlations
Author Rating
Are
a
Expe
rienc
e Le
vel
Type
of
Educ
ator
Qua
lity
of
Ada
ptat
ion
Cla
rity
of
Ada
ptat
ion Stude
nt
Overall
Support
Student
Learning Support
Area
--
Experience Level
-.435**
--
Type of Educator
.185
-.073
--
Quality of Adaptation .561**
-.317**
.020 --
Clarity of Adaptation .383**
-.009
.035 .720**
--
Student Overall Support
-.087
-.063
.329**
-.017
.041 --
Student Learning Support
-.004
-.111
.297*
.015 .071 .829**
--
*Significant at p < .05
** Significant at p < .01