development and validation of analytical...
TRANSCRIPT
10
www.ijppr.humanjournals.com
Kadam V. N. et al. Ijppr.Human, 2014; Vol. 1(2): 10-21 (Research Article)
DEVELOPMENT AND VALIDATION OF ANALYTICAL METHODS FOR
SIMULTANEOUS ESTIMATION OF VOGLIBOSE, GLIMEPIRIDE AND
METFORMIN HYDROCHLORIDE IN BULK AND TABLET DOSAGE FORM
BY HPLC
Kadam V. N.*, Yadav P. J., Mohite, S. K., Magdum C. S.
Rajarambapu College of Pharmacy, Kasegaon;
Article
history
Received
1/7/2014
Available
online
15/08/2014
Keywords:
Voglibose,
Glimepiride,
Metformin,
HPLC,
method
validation
ABSTRACT
Fast, economical, accurate, precise and reproducible RP–HPLC method was
developed for the determination of Voglibose (VGB), Glimepiride (GLM) and
Metformin HCl (MET). RP–HPLC method was developed on Jasco 2075 HPLC
systems with Fine pack ODS C18 column (250mm) and using a mobile phase
mixture containing mixed acetonitrile: phosphate buffer in the ratio of 85:15 (pH
4).The flow rate was 1 ml/min and the effluent was monitored at 223nm. The
retention time of Voglibose, Glimepiride and Metformin HCl were 2.3, 3.8 and 5.1
min respectively. The method was validated in terms of linearity, precision,
accuracy, specificity and system suitability parameters. The proposed method’s
results were found to be satisfactory and are suitable for simultaneous
determination of Voglibose, Glimepiride and Metformin HCl for routine quality
control of drugs in bulk drug and formulation.
Correspondence to Author:
Kadam V. N. Tal- Walwa; Dist- Sangli; 415 404
Maharashtra, India
Email id - [email protected]

11
www.ijppr.humanjournals.com
INTRODUCTION
Glimepiride is a Sulfonyl Urea derivative. Chemically it is [[p-[2-(3ethyl-4-methyl-2-oxo-3-
Pyrroline-1-Oxamide) ethyl] phenyl] sulfonyl] 3-(Trans 4-methyl cyclohexyl) urea. It is widely used
in type-2 diabetes. It is an oral AntiDiabetic with prolonged effect and it maintains a more
physiological regulation of insulin secretion during physical exercise, which suggests that there may
be less risk of hypoglycemia [1]
.
Fig 1: Structure of Glimepiride
Voglibose3,4-Dideoxy-4-[2-hydroxy-1-(hydroxyl methyl) ethyl]amino-2-c-(hydroxymethyl)-
Depiinositol, has attracted considerable interests due to its wide range of therapeutic and
pharmacological properties, including its excellent inhibitory activity against α-glucosidase and its
action against hyperglycemia and various disorders caused by hyperglycemia. Voglibose, a new
potent glucosidase inhibitor used for type 2 diabetes, has shown strong anti-obesity and antidiabetic
activity[2]
.
Fig 2: Structure of Voglibose
Chemically Metformin (MET) is 3-(diaminomethylidene)-1, 1-dimethylguanidine, an oral
antidiabetic drug, used for the treatment of type 2 diabetes, particularly in overweight and obese
people; also used in the treatment of polycystic ovary syndrome and has been investigated for other
diseases where insulin resistance may be an important factor [2]
.

12
www.ijppr.humanjournals.com
Fig 3: Structure of Metformin HCl
INSTRUMENTS AND MATERIALS
Instrument used were JASCO 2075 HPLC systems. Voglibose pure drug was obtained from Micro
labs. Ltd. Bangalore, Glimepiride from Ipca laboratories, Mumbai and Metformin HCl from Sohan
Health Care Pvt. Ltd, Pune as gift sample and was used without further purification. All chemicals
and reagents used were of analytical grade. Tablets were purchased from market.
EXPERIMENTAL
A. Preparation of Standard Stock Solutions:
Standard stock solutions 100 µg/ml of Voglibose, Glimepiride and Metformin HCl were prepared
separately in methanol. And further dilutions were made in selected mobile phase.
B. Selection of analytical wavelength:
Standard stock solutions of Voglibose, Glimepiride and Metformin HCl were prepared in
methanoland from the standard stock solution further dilutions were done using mobile phase. Each
solution was scanned over the range of 200- 400 nm and their spectra were overlaid. It was observed
that 226 nm is the λ max for VGB, 229 nm is the λ max for GLM & 232 nm is λ max of MET. 223
nm was selected as isobestic wavelength for analysis of VGB, GLM and MET which is selected from
overlay spectra of three drugs shown in Fig. no. 4.

13
www.ijppr.humanjournals.com
Fig. no.4: Overlain spectra of Voglibose, Glimepiride and Metformin HCl
C. Selection of mobile phase:
Different mobile phases like Water: Methanol, Methanol: Potassium dihydrogen phosphate buffer,
Water: Acetonitrile, Acetonitrile: Potassium dihydrogen phosphate buffer were tried in order to find
the optimum conditions for the separation of Voglibose, Glimepiride and Metformin HCl. Finally,
Acetonitrile: Potassium dihydrogen Phosphate buffer (0.01 M, pH 4), (85:15 v/v) was selected as an
appropriate mobile phase which gave good resolution and acceptable peak parameters for VGB, GLM
and MET.
D. Preparation of mobile phase:
Acetonitrile: Potassium dihydrogen Phosphate buffer (0.01 M, pH 4), in the ratio (85:15 v/v) was
prepared. pH of mobile phase was adjusted to 4 by using ortho-phosphoric acid.
E. Preparation of Standard drug solutions:
An accurately weighed quantity of about 10 mg of VGB, 10 mg GLM and 10 mg of MET were taken
in 100 ml three separate volumetric flask dissolved in sufficient quantity of methanol then sonicated
for 15 min and diluted to 100 ml with the same solvent so as to get the concentration of 100 μg/ml of
VGB, GLM and MET each. From standard stock solution of each drug, appropriate dilution was done
using the mobile phase to get mixed standard solutions. The chromatogram obtained is shown in Fig.
no. 5.

14
www.ijppr.humanjournals.com
F. Sample Preparation:
Twenty Tablets were weighed and powdered. Powder equivalent to 500 mg of MET, 2 mg of GLM
and 0.2 mg of VGB was taken in 100 ml flask, 80 ml of methanol was added, derivatization of
Voglibose was done by taurine and sodium periodate and sonicated for 15 min and solution was
filtered through Whatmann paper no. 42 into a 100 ml volumetric flask. Filter paper was washed with
same solvent, adding washings to the volumetric flask and volume was made up to the mark with the
solvent to get a stock solution containing 5000 μg/ml of MET, 20 μg/ml of GLM and 2 μg/ml of
VGB. The solution was suitably diluted with mobile phase to have 50 μg/ml of MET, 0.2 μg/ml of
GLM and 0.02 μg/ml of VGB. The chromatogram obtained is shown in Fig. no. 6. The results
obtained are shown in Table no. 1[3,4]
.
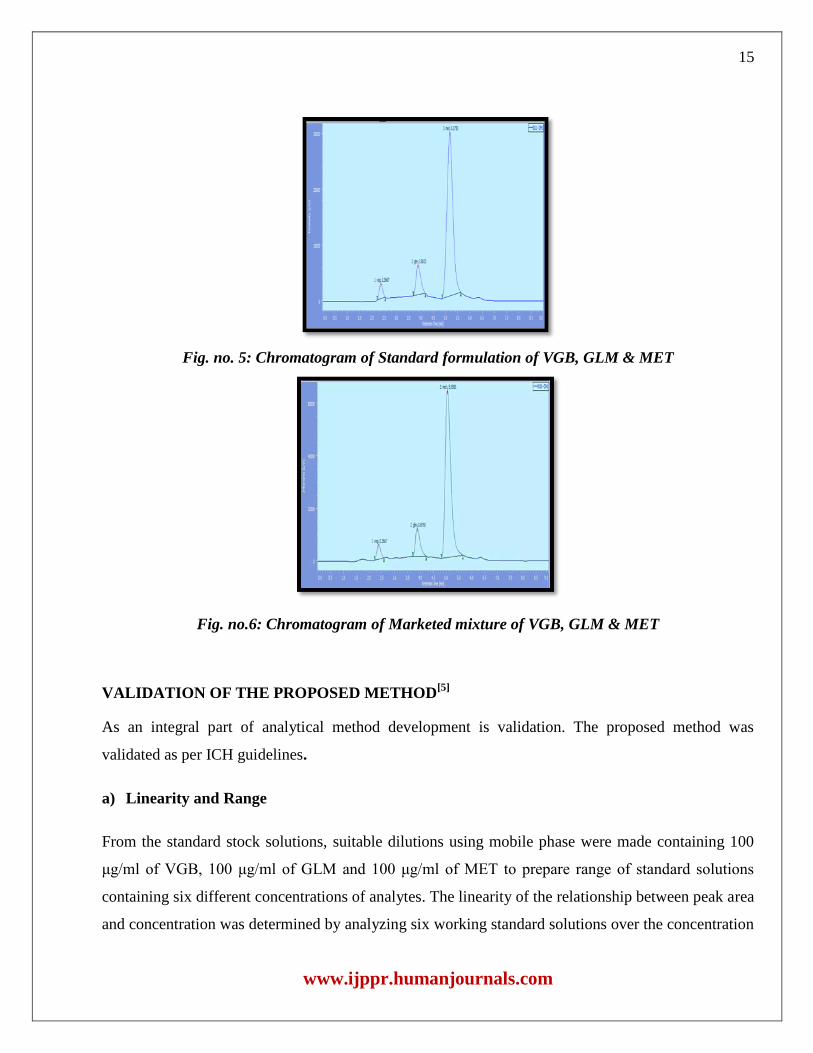
RESULTS AND DISCUSSION
The objective of the present work is to develop precise and reliable HPLC method for the analysis of
Voglibose, Glimepiride & Metformin HCl in bulk and pharmaceutical dosage form. This is achieved
by using the most commonly employed column C18 with U.V. detection at 223 nm. The
representative chromatogram indicating combination of Voglibose, Glimepiride & Metformin HCl is
shown in fig. 6.
Table 1: Analysis of marketed formulation
Marketed
Formulation
Drug Label
Claim
(mg)
Amount
taken
(μg/ml)
Amount
Found
(μg/ml)
% Label
claim±
SD*
TRIVOLIB 2
Voglibose 0.2 0.02 0.0198 99.00
Glimepiride 2 0.2 0.196 98.73
Metformin
HCl
500 50 49.93 99.86
15
www.ijppr.humanjournals.com
Fig. no. 5: Chromatogram of Standard formulation of VGB, GLM & MET
Fig. no.6: Chromatogram of Marketed mixture of VGB, GLM & MET
VALIDATION OF THE PROPOSED METHOD[5]
As an integral part of analytical method development is validation. The proposed method was
validated as per ICH guidelines.
a) Linearity and Range
From the standard stock solutions, suitable dilutions using mobile phase were made containing 100
μg/ml of VGB, 100 μg/ml of GLM and 100 μg/ml of MET to prepare range of standard solutions
containing six different concentrations of analytes. The linearity of the relationship between peak area
and concentration was determined by analyzing six working standard solutions over the concentration

16
www.ijppr.humanjournals.com
range of 1 μg/ml – 6 μg/ml for VGB, 2 - 12 μg/ml of GLM and 10 μg/ml – 60 μg/ml for MET as per
ICH guidelines. The results obtained are shown in Table no. 2 & 3.
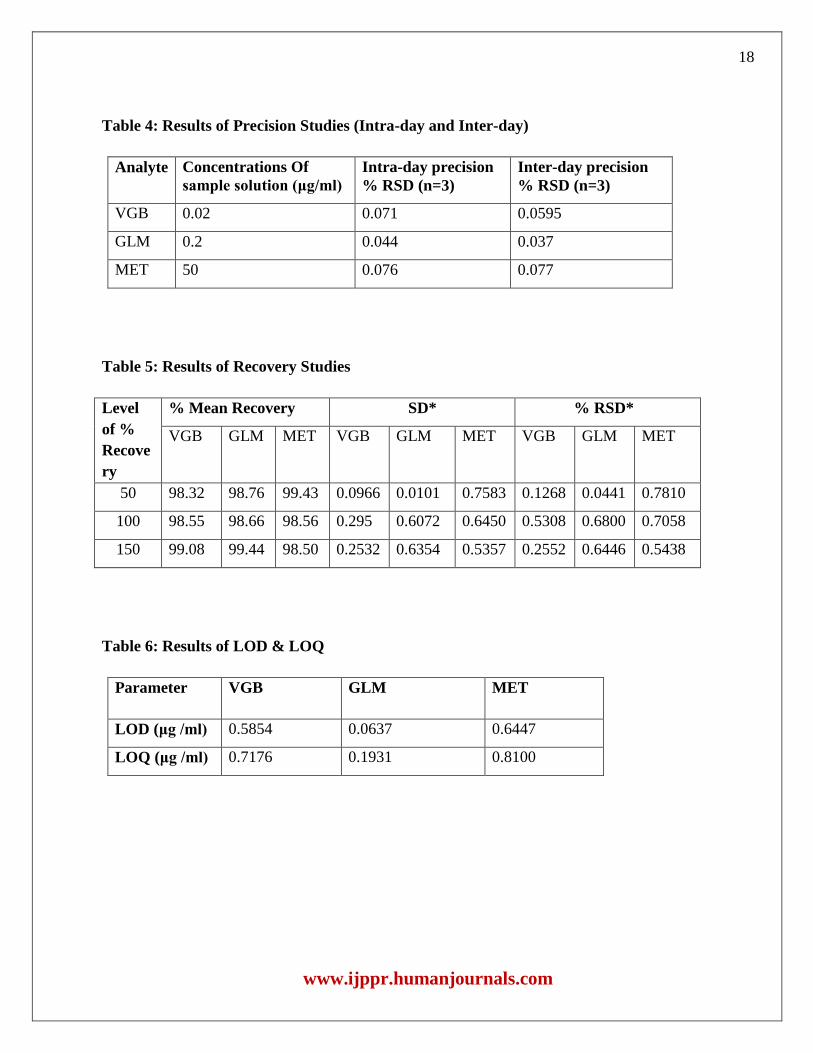
b) Precision Studies
The precision of the method was evaluated by intraday and inter-day variation studies. In intraday
studies, solution of standard and sample were analyzed for assay determination thrice in a day and %
RSD was calculated. The result obtained for intraday and inter-days variations are shown in Table no.
4. For Inter-days variations studies, same concentrations of the mixed standard were analyzed on
three consecutive days.
c) Accuracy
To check the accuracy of the method, recovery studies were carried out at three different levels 50%,
100% and 150% according to ICH guidelines. From the tablet powder blend, weight equivalent 0.02
mg VGB, 0.2 mg GLM and 50 mg of MET was weighed and transferred to 100 ml volumetric flask.
To three flasks, appropriate quantity of working standard of VGB, GLM and MET was added equal
to 50%, 100% and 150% of the equivalent weight of Tablet taken and volume was made up with
double distilled water. The solutions are then filtered through Whatmann filter paper No. 42. From
these stock solutions further dilutions were prepared using mobile phase. The results obtained are
shown in Table no. 5.
d) Limit of Detection & Limit of Quantitation
The Limit of Detection (LOD) is the smallest concentration that can be detected but not necessarily
quantified as an exact value and Limit of Quantification (LOQ) is the lowest amount of analyte in the
sample that can be quantitatively determined with suitable precision and accuracy. LOD & LOQ of
Voglibose, Glimepiride and Metformin HCl are shown in table no.6.
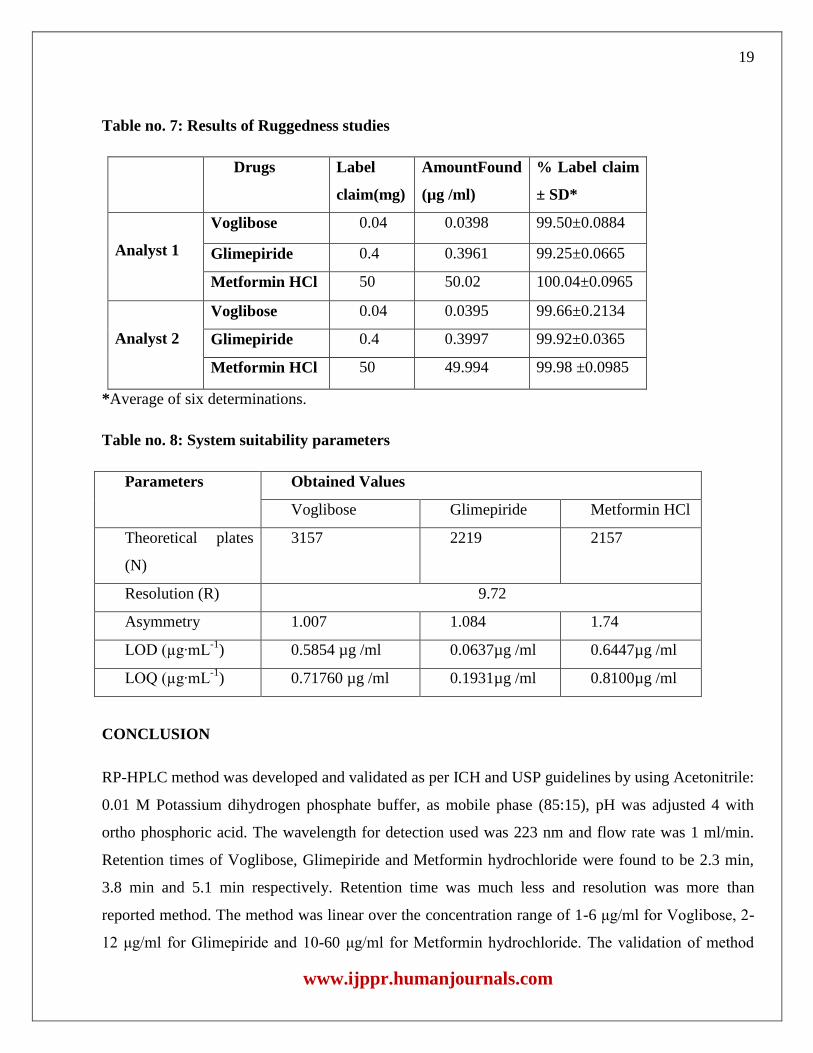
e) Ruggedness
Ruggedness of the methods was assessed by carrying out assay six times with two different analysts
by using same equipment. The results of the same are presented in Table no. 7.

17
www.ijppr.humanjournals.com
f) System suitability
System suitability parameters can be defined as tests to ensure that the method can generate results of
acceptable accuracy and precision. The requirements for system suitability are usually developed
after method development and validation has been completed or The USP (2000) defines parameters
that can be used to determine system suitability prior to analysis. The system suitability parameters
like Theoretical plates (N), Resolution (R), Asymmetry, LOD (μg∙mL-1) and LOQ (μg∙mL-1) were
calculated and compared with the standard values to ascertain whether the proposed RP-HPLC
method for the estimation of Voglibose, Glimepiride and Metformin HCl in bulk and marketed tablet
dosage form was validated or not. The results of the same are presented in Table no. 8.
Table No. 2: Linearity study for VGB, GLM & MET HCl
Sr.
No.
Voglibose Glimepiride Metformin HCl
Conc.
(µg/ml)
Absorbance Conc.
(µg/ml)
Absorbance Conc.
(µg/ml)
Absorbance
1 0 000000 0 000000 0.00 000000
2 1 111647 2 235054 10 1129677
3 2 222141 4 471363 20 2256136
4 3 331254 6 718100 30 3284579
5 4 440395 8 943363 40 4517206
6 5 550175 10 1157928 50 5652034
7 6 668682 12 1415180 60 6762202
Table 3: Linear regression analysis of calibration curves with their respective Absorptivity
values
Parameters Voglibose Glimepiride Metformin HCl
Slope 11037 11750 0.0702
Intercept 1681.85 2646 13208.35
Correlation coefficient (R2
) 0.9991 0.9997 0.9981
Range 1-6µg/ml 2-12 µg /ml 10-60 µg /ml
18
www.ijppr.humanjournals.com
Table 4: Results of Precision Studies (Intra-day and Inter-day)
Analyte Concentrations Of
sample solution (μg/ml)
Intra-day precision
% RSD (n=3)
Inter-day precision
% RSD (n=3)
VGB 0.02 0.071 0.0595
GLM 0.2 0.044 0.037
MET 50 0.076 0.077
Table 5: Results of Recovery Studies
Level
of %
Recove
ry
% Mean Recovery SD* % RSD*
VGB GLM MET VGB GLM MET VGB GLM MET
50 98.32 98.76 99.43 0.0966 0.0101 0.7583 0.1268 0.0441 0.7810
100 98.55 98.66 98.56 0.295 0.6072 0.6450 0.5308 0.6800 0.7058
150 99.08 99.44 98.50 0.2532 0.6354 0.5357 0.2552 0.6446 0.5438
Table 6: Results of LOD & LOQ
Parameter VGB GLM MET
LOD (μg /ml) 0.5854 0.0637 0.6447
LOQ (μg /ml) 0.7176 0.1931 0.8100
19
www.ijppr.humanjournals.com
Table no. 7: Results of Ruggedness studies
Drugs Label
claim(mg)
AmountFound
(µg /ml)
% Label claim
± SD*
Analyst 1
Voglibose 0.04 0.0398 99.50±0.0884
Glimepiride 0.4 0.3961 99.25±0.0665
Metformin HCl 50 50.02 100.04±0.0965
Analyst 2
Voglibose 0.04 0.0395 99.66±0.2134
Glimepiride 0.4 0.3997 99.92±0.0365
Metformin HCl 50 49.994 99.98 ±0.0985
*Average of six determinations.
Table no. 8: System suitability parameters
Parameters Obtained Values
Voglibose Glimepiride Metformin HCl
Theoretical plates
(N)
3157 2219 2157
Resolution (R) 9.72
Asymmetry 1.007 1.084 1.74
LOD (µg∙mL-1
) 0.5854 µg /ml 0.0637µg /ml 0.6447µg /ml
LOQ (µg∙mL-1
) 0.71760 µg /ml 0.1931µg /ml 0.8100µg /ml
CONCLUSION
RP-HPLC method was developed and validated as per ICH and USP guidelines by using Acetonitrile:
0.01 M Potassium dihydrogen phosphate buffer, as mobile phase (85:15), pH was adjusted 4 with
ortho phosphoric acid. The wavelength for detection used was 223 nm and flow rate was 1 ml/min.
Retention times of Voglibose, Glimepiride and Metformin hydrochloride were found to be 2.3 min,
3.8 min and 5.1 min respectively. Retention time was much less and resolution was more than
reported method. The method was linear over the concentration range of 1-6 μg/ml for Voglibose, 2-
12 μg/ml for Glimepiride and 10-60 μg/ml for Metformin hydrochloride. The validation of method

20
www.ijppr.humanjournals.com
carried out as per ICH guidelines. The methods were found to be accurate, precise, economical and
reproducible.

21
www.ijppr.humanjournals.com
REFERENCES
1. M. S. V. Sakuntala, S. Sri Devi, S. Kishore Yadav, K. Srinivas Reddy, RP- HPLC method
development and validation for the simultaneous estimation of glimepiride and pioglitazone HCl
in tablet dosage form, JCPR, 4(1); (2012): 154-159.
2. N. Raj, R. Nargund, P. Kabra, R. Kimbahune, A. Patel, Simultaneous quantification of voglibose
and metformin by Validated analytical method in tablet dosage form, IJIPLS, 1(3) ; (2011): 58-
63.
3. H. Becket, J. B. Stenlake, Practical pharmaceutical chemistry, 4th
ed, Part- 2. New Delhi: CBS,
(2001):157-167.
4. H. Becket, J. B. Stenlake, Practical pharmaceutical chemistry, 4th
ed, Part- 2. New Delhi: CBS,
(2001):273-278,281-299.
5. ICH,Technical Requirements for the Registration of Pharmaceuticals for Human Use, Validation
of analytical procedures, ICH‐Q2A, (1995).
6. R. Chatwal, K. A. Sham, High performance liquid chromatography. In: Instrumental methods of
chemical analysis, 5th
ed, Mumbai: Himalaya Publishing house: (2002): 2.567-2.578, 2.626- 2.636.
7. L. R. Snyder, Practical HPLC method development, John Wiley and Sons, Inc.; 2: (1997): 161-
168.