development charges report - escribe meetings
TRANSCRIPT

Watson & Associates Economists Ltd. 905-272-3600
October 7, 2020 [email protected]
Development Charges Background
Study
Town of Lakeshore

Watson & Associates Economists Ltd. H:\Lakeshore\2020 DC\Report\Final Report.docx
Table of Contents
Page
Executive Summary ....................................................................................................... i
1. Introduction ...................................................................................................... 1-1
1.1 Purpose of this Document ....................................................................... 1-1
1.2 Summary of the Process ......................................................................... 1-2
1.3 Changes to the D.C.A.: Bill 73 – Smart Growth for our Communities Act, 2015 ........................................................................... 1-3
1.3.1 Area Rating ................................................................................ 1-3
1.3.2 Asset Management Plan for New Infrastructure ......................... 1-3
1.3.3 60-Day Circulation of D.C. Background Study ........................... 1-4
1.3.4 Timing of Collection of D.C.s ...................................................... 1-4
1.3.5 Other Changes ........................................................................... 1-4
1.4 Further Changes to the D.C.A.: Bill 108, 138, and 197 ........................... 1-5
1.4.1 Bill 108: More Homes, More Choice Act – An Act to Amend Various Statutes with Respect to Housing, Other Development, and Various Matters ............................................ 1-5
1.4.2 Bill 197: COVID-19 Economic Recovery Act .............................. 1-6
2. Current Town of Lakeshore Policy ................................................................ 2-1
2.1 Schedule of Charges .............................................................................. 2-1
2.2 Services Covered ................................................................................... 2-1
2.3 Timing of D.C. Calculation and Payment ................................................ 2-2
2.4 Indexing .................................................................................................. 2-2
2.5 Redevelopment Allowance ..................................................................... 2-2
2.6 Exemptions ............................................................................................. 2-3
3. Anticipated Development in the Town of Lakeshore ................................... 3-1
3.1 Requirement of the Act ........................................................................... 3-1
3.2 Basis of Population, Household and Non-Residential Gross Floor Area Forecast ......................................................................................... 3-1
3.3 Summary of Growth Forecast ................................................................. 3-2
Table of Contents (Cont’d)
Page
Watson & Associates Economists Ltd. H:\Lakeshore\2020 DC\Report\Final Report.docx
4. The Approach to the Calculation of the Charge ........................................... 4-1
4.1 Introduction ............................................................................................. 4-1
4.2 Services Potentially Involved .................................................................. 4-1
4.3 Increase in the Need for Service ............................................................. 4-1
4.4 Local Service Policy ................................................................................ 4-6
4.5 Capital Forecast ...................................................................................... 4-7
4.6 Treatment of Credits ............................................................................... 4-7
4.7 Classes of Services ................................................................................ 4-8
4.8 Existing Reserve Funds .......................................................................... 4-9
4.9 Deductions ............................................................................................ 4-10
4.9.1 Reduction Required by Level of Service Ceiling ...................... 4-10
4.9.2 Reduction for Uncommitted Excess Capacity .......................... 4-11
4.9.3 Reduction for Benefit to Existing Development ........................ 4-11
4.9.4 Reduction for Anticipated Grants, Subsidies and Other Contributions ............................................................................ 4-13
4.10 Municipal-wide vs. Area Rating ............................................................. 4-13
4.11 Allocation of Development .................................................................... 4-13
4.12 Asset Management ............................................................................... 4-13
4.13 Transit ................................................................................................... 4-14
5. D.C.-Eligible Cost Analysis by Service .......................................................... 5-1
5.1 Introduction ............................................................................................. 5-1
5.2 Service Levels and 10-Year Capital Costs for D.C. Calculation .............. 5-1
5.2.1 Growth Studies .......................................................................... 5-2
5.2.2 Library Services ......................................................................... 5-7
5.2.3 Parks and Recreation Services .................................................. 5-9
5.3 Service Levels and 20-Year Capital Costs for Lakeshore’s D.C. Calculation ............................................................................................ 5-13
5.3.1 Services Related to a Highway ................................................ 5-13
5.3.2 Public Works (Facilities and Fleet) ........................................... 5-16
5.3.3 Fire Protection Services ........................................................... 5-18
5.3.4 Policing Services ...................................................................... 5-20
5.4 Service Levels and Urban 20-Year Capital Costs for Lakeshore’s D.C. Calculation .................................................................................... 5-22
5.4.1 Water Services ......................................................................... 5-22
5.4.2 Wastewater Services ............................................................... 5-26
6. D.C. Calculation ............................................................................................... 6-1
7. D.C. Policy Recommendations and D.C. By-law Rules ................................ 7-1
7.1 Introduction ............................................................................................. 7-1
7.2 D.C. By-law Structure ............................................................................. 7-2

Table of Contents (Cont’d)
Page
Watson & Associates Economists Ltd. H:\Lakeshore\2020 DC\Report\Final Report.docx
7.3 D.C. By-law Rules ................................................................................... 7-2
7.3.1 Payment in any Particular Case ................................................. 7-2
7.3.2 Determination of the Amount of the Charge ............................... 7-3
7.3.3 Application to Redevelopment of Land (Demolition and Conversion) ................................................................................ 7-3
7.3.4 Exemptions (full or partial) ......................................................... 7-4
7.3.5 Phasing in .................................................................................. 7-4
7.3.6 Timing of Collection ................................................................... 7-5
7.3.7 Indexing ..................................................................................... 7-6
7.3.8 The Applicable Areas ................................................................. 7-7
7.4 Other D.C. By-law Provisions ................................................................. 7-7
7.4.1 Categories of Services for Reserve Fund and Credit Purposes .................................................................................... 7-7
7.4.2 By-law In-force Date .................................................................. 7-7
7.4.3 Minimum Interest Rate Paid on Refunds and Charged for Inter-Reserve Fund Borrowing ................................................... 7-7
7.4.4 Area Rating ................................................................................ 7-8
7.5 Other Recommendations ........................................................................ 7-9
8. By-law Implementation ................................................................................... 8-1
8.1 Public Consultation Process ................................................................... 8-1
8.1.1 Introduction ................................................................................ 8-1
8.1.2 Public Meeting of Council........................................................... 8-1
8.1.3 Other Consultation Activity ......................................................... 8-1
8.2 Anticipated Impact of the Charge on Development ................................. 8-2
8.3 Implementation Requirements ................................................................ 8-3
8.3.1 Introduction ................................................................................ 8-3
8.3.2 Notice of Passage ...................................................................... 8-3
8.3.3 By-law Pamphlet ........................................................................ 8-3
8.3.4 Appeals ...................................................................................... 8-4
8.3.5 Complaints ................................................................................. 8-4
8.3.6 Credits ....................................................................................... 8-5
8.3.7 Front-Ending Agreements .......................................................... 8-5
8.3.8 Severance and Subdivision Agreement Conditions ................... 8-5
Appendix A Background Information on Residential and Non-Residential Growth Forecast ............................................................................................. A-1
Appendix B Level of Service .................................................................................. B-1
Appendix C Long-Term Capital and Operating Cost Examination ...................... C-1
Appendix D D.C. Reserve Fund Policy .................................................................. D-1
Table of Contents (Cont’d)
Page
Watson & Associates Economists Ltd. H:\Lakeshore\2020 DC\Report\Final Report.docx
Appendix E Local Service Policy ............................................................................E-1
Appendix F Asset Management Plan ...................................................................... F-1
Appendix G Proposed D.C. By-law ......................................................................... G-1

Watson & Associates Economists Ltd. H:\Lakeshore\2020 DC\Report\Final Report.docx
List of Acronyms and Abbreviations
Acronym Full Description of Acronym
A.M.P. Asset management plan
A.T.C. Atlas Tube Centre
CANSIM Canadian Socio-Economic Information Management System (Statistics Canada)
D.C. Development charge
D.C.A. Development Charges Act, 1997, as amended
F.I.R. Financial Information Return
G.F.A. Gross floor area
L.P.A.T. Local Planning Appeal Tribunal
N.F.P.O.W. No Fixed Place of Work
O.M.B. Ontario Municipal Board
O.P.A. Official Plan Amendment
O. Reg. Ontario Regulation
P.O.A. Provincial Offences Act
P.P.U. Persons per unit
S.D.E. Single detached equivalent
S.D.U. Single detached unit
sq.ft. square foot
sq.m square metre

Executive Summary

Watson & Associates Economists Ltd. PAGE i H:\Lakeshore\2020 DC\Report\Final Report.docx
Executive Summary
1. The report provided herein represents the Development Charges (D.C.)
Background Study for the Town of Lakeshore required by the Development
Charges Act, 1997 (D.C.A.). This report has been prepared in accordance with
the methodology required under the D.C.A. The contents include the following:
• Chapter 1 – Overview of the legislative requirements of the Act;
• Chapter 2 – Review of present D.C. policies of the Town;
• Chapter 3 – Summary of the residential and non-residential growth
forecasts for the Town;
• Chapter 4 – Approach to calculating the D.C.;
• Chapter 5 – Review of historical service standards and identification of
future capital requirements to service growth and related deductions and
allocations;
• Chapter 6 – Calculation of the D.C.s;
• Chapter 7 – D.C. policy recommendations and rules; and
• Chapter 8 – By-law implementation.
2. D.C.s provide for the recovery of growth-related capital expenditures from new
development. The D.C.A. is the statutory basis to recover these charges. The
methodology is detailed in Chapter 4; a simplified summary is provided below:
1) Identify amount, type and location of growth;
2) Identify servicing needs to accommodate growth;
3) Identify capital costs to provide services to meet the needs;
4) Deduct:
• Grants, subsidies and other contributions;
• Benefit to existing development;
• Amounts in excess of 10-year historical service calculation;
• D.C. reserve funds (where applicable);
5) Net costs are then allocated between residential and non-residential benefit;
and
Watson & Associates Economists Ltd. PAGE ii H:\Lakeshore\2020 DC\Report\Final Report.docx
6) Net costs divided by growth to provide the D.C.
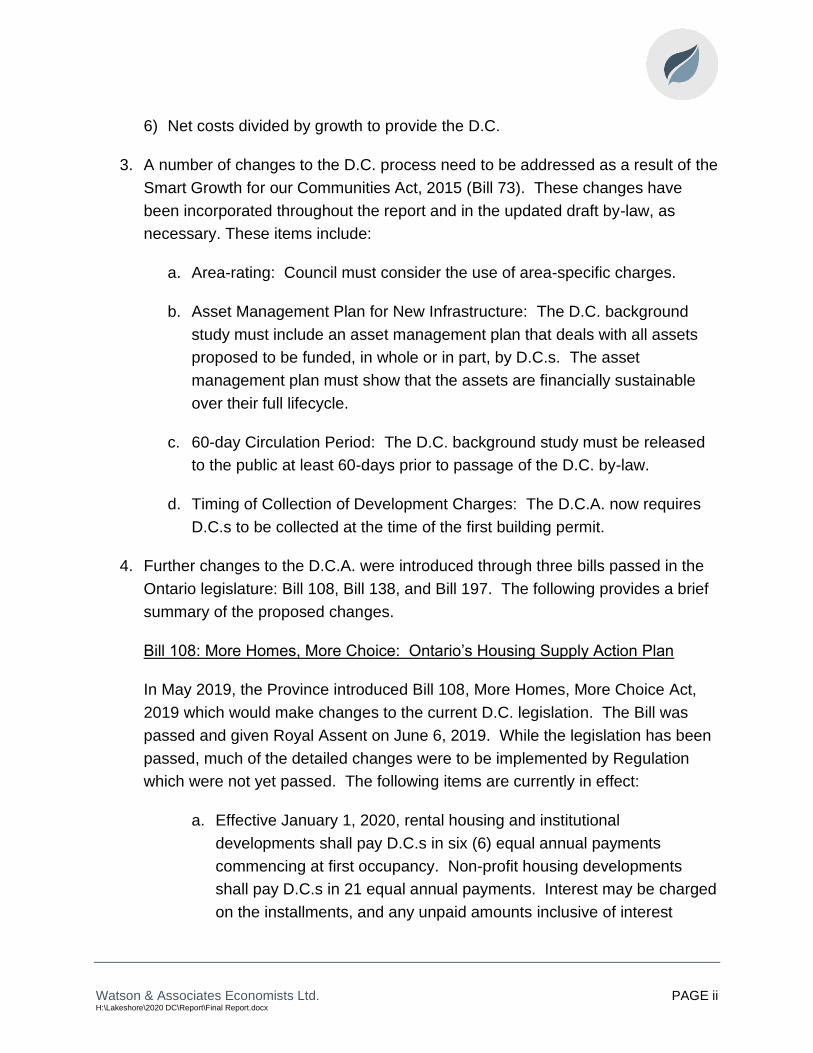
3. A number of changes to the D.C. process need to be addressed as a result of the
Smart Growth for our Communities Act, 2015 (Bill 73). These changes have
been incorporated throughout the report and in the updated draft by-law, as
necessary. These items include:
a. Area-rating: Council must consider the use of area-specific charges.
b. Asset Management Plan for New Infrastructure: The D.C. background
study must include an asset management plan that deals with all assets
proposed to be funded, in whole or in part, by D.C.s. The asset
management plan must show that the assets are financially sustainable
over their full lifecycle.
c. 60-day Circulation Period: The D.C. background study must be released
to the public at least 60-days prior to passage of the D.C. by-law.
d. Timing of Collection of Development Charges: The D.C.A. now requires
D.C.s to be collected at the time of the first building permit.
4. Further changes to the D.C.A. were introduced through three bills passed in the
Ontario legislature: Bill 108, Bill 138, and Bill 197. The following provides a brief
summary of the proposed changes.
Bill 108: More Homes, More Choice: Ontario’s Housing Supply Action Plan
In May 2019, the Province introduced Bill 108, More Homes, More Choice Act,
2019 which would make changes to the current D.C. legislation. The Bill was
passed and given Royal Assent on June 6, 2019. While the legislation has been
passed, much of the detailed changes were to be implemented by Regulation
which were not yet passed. The following items are currently in effect:
a. Effective January 1, 2020, rental housing and institutional
developments shall pay D.C.s in six (6) equal annual payments
commencing at first occupancy. Non-profit housing developments
shall pay D.C.s in 21 equal annual payments. Interest may be charged
on the installments, and any unpaid amounts inclusive of interest

Watson & Associates Economists Ltd. PAGE iii H:\Lakeshore\2020 DC\Report\Final Report.docx
payable shall be added to the property tax roll and collected in the
same manner as taxes.
b. Effective January 1, 2020, the D.C. amount for all developments
occurring within two years of a Site Plan or Zoning By-law Amendment
planning approval (for applications made after January 1, 2020), shall
be determined based on the D.C. by-law in effect on the day of Site
Plan or Zoning By-law Amendment application.
Other key elements of the changes that were not proclaimed and were dealt with
subsequently through Bill 197 are provided below:
• The D.C. would be refined to only allow for the following services to remain
within the D.C.: water, wastewater, storm water, roads, fire, policing,
ambulance, waste diversion, parks development, recreation, public libraries,
long-term care, public health;
• The mandatory 10% deduction would be removed for all services that remain
eligible in the D.C.;
• A new community benefits charge (C.B.C.) would be introduced to include
formerly eligible D.C. services that are not included in the above listing,
parkland dedication and bonus zoning contributions;
Bill 197: COVID-19 Economic Recovery Act, 2020
In March 2020, Canada was impacted by the COVID-19 global pandemic. As a
result, the economy was put into a state of emergency in an effort to slow the
spread of the virus. In response, the Province tabled legislation on July 8, 2020
which amended a number of Acts, including the D.C.A. and the Planning Act.
With this Bill, many changes proposed in Bill 108 have now been revised. With
respect to the above noted changes from Bill 108, the following changes are
provided in Bill 197:
• Eligible Services: The list of eligible services for the D.C. has now been
expanded to include most services eligible under the D.C.A. prior to Bill 108.
For the Town of Lakeshore, this means that all services currently provided in
the D.C. study remain eligible.

Watson & Associates Economists Ltd. PAGE iv H:\Lakeshore\2020 DC\Report\Final Report.docx
• Mandatory 10% Deduction: The mandatory 10% deduction is removed
(consistent with Bill 108). This applies to all D.C.-eligible services.
• Community Benefits Charges: a municipality may, by-law impose a C.B.C. to
pay for the capital costs for formerly-eligible D.C. services in addition to
parkland dedication and bonus zoning contributions. However, based on the
list of D.C.-eligible services under the new legislation, all current services are
D.C. eligible, thus a C.B.C. may not be required for the Town.
These changes to the D.C.A. were proclaimed on September 18, 2020. These
changes are described further in Section 1.4 of this report.
5. The growth forecast (Chapter 3) on which the Town-wide D.C. is based, projects
the following population, housing and non-residential floor area for the 10-year
(2020 to 2029), 20 year (2020-2039) and urban 20 year (2020-Urban 2039)
periods.
6. On June 16, 2015, the Town of Lakeshore passed By-law 46-2015 under the
D.C.A. The by-law imposes D.C.s on residential and non-residential uses. This
by-law would have expired on July 12, 2020, however, the Coronavirus (COVID-
19) Support and Protection Act, 2020 came into force on April 14, 2020 which
causes the 2015 by-law to continue to be in effect for six months after the
provincial emergency declaration period. On July 24, 2020, the Reopening
Ontario (A Flexible Response to COVID-19) Act, 2020, came into effect, bringing
an end to the provincial state of emergency. Accordingly, the 2015 by-law is
continued in force until January 24, 2021. The Town is undertaking a D.C. public
process and anticipates passing a new by-law in advance of the date the existing
by-law is no longer in force. The mandatory public meeting has been set for
October 27, 2020 with adoption of the by-law on December 8, 2020.
10 Year 20 Year Urban 20 Year
2020-2029 2020-20392020-Urban
2039
(Net) Population Increase 4,542 8,302 8,322
Residential Unit Increase 2,230 4,219 4,103
Non-Residential Gross Floor Area Increase (sq.ft.) 2,330,200 4,489,500 4,489,500
Source: Watson & Associates Economists Ltd. Forecast 2020
Measure

Watson & Associates Economists Ltd. PAGE v H:\Lakeshore\2020 DC\Report\Final Report.docx
7. The Town’s D.C.s currently in effect are $19,804 for single detached dwelling
units for full services. Non-residential charges were categorized as industrial,
commercial retail, and commercial non-retail/institutional. Respectively, their
corresponding charges are $8.35, $8.35, and $8.37 per square foot of gross floor
area. Charges for industrial and commercial non-retail were discounted initially,
with the discount to be phased-out over the life of the by-law. This report has
undertaken a recalculation of the charge based on future identified needs
(presented in Schedule ES-1 for residential and non-residential). Charges have
been provided on a Town-wide basis for all services except for water and
wastewater services. Water and wastewater services have been provided on an
urban-area basis. The corresponding single detached unit charge for full
services is $26,189. The non-residential charge for full services is $9.90 per
square foot of building area. These rates are submitted to Council for its
consideration.
8. Charges are also in effect for wind turbines, telecommunication towers, and solar
farms. For each type of development, charges will be imposed for services
related to a highway, fire protection services, policing services and growth
studies. The rates currently in effect are $3.58 per square foot for solar farms
and $6,975 per unit for wind turbines and telecommunication towers. This report
has undertaken a recalculation of the charges and solar farms will be charged on
a $3.22 per square foot basis for the panel surfaces whereas the wind turbines
and telecommunication towers will be charged on a per unit basis of $7,256 per
unit.
9. The D.C.A. requires a summary be provided of the gross capital costs and the
net costs to be recovered over the life of the by-law. This calculation is provided
by service and is presented in Table 6-5. A summary of these costs is provided
below:
Total gross expenditures planned over the next five years 95,864,316$
Less:
Benefit to existing development 26,966,820$
Post planning period benefit 12,519,730$
Ineligible re: Level of Service 58,810$
Grants, subsidies and other contributions 4,166,500$
Net Costs to be recovered from development charges 52,152,456$

Watson & Associates Economists Ltd. PAGE vi H:\Lakeshore\2020 DC\Report\Final Report.docx
This suggests that for the non-D.C. cost over the five-year D.C. by-law (benefit to
existing development, and the grants, subsidies and other contributions), $31.19
million (or an annual amount of $6.24 million) will need to be contributed from
taxes and rates, or other sources. With respect to the post period benefit amount
of $12.52 million, it will be included in subsequent D.C. study updates to reflect
the portion of capital that benefits growth in the post period D.C. forecasts.
Based on the above table, the Town plans to spend $95.86 million over the next
five years, of which $52.15 million (54%) is recoverable from D.C.s. Of this net
amount, $35.22 million is recoverable from residential development and $16.93
million from non-residential development. It is noted also that any exemptions or
reductions in the charges would reduce this recovery further.
10. Considerations by Council – The background study represents the service needs
arising from residential and non-residential growth over the forecast periods.
The following services are calculated based on an urban 20-year forecast:
• Wastewater Services – Facilities;
• Wastewater Services – Collection;
• Water Services – Distribution; and
• Water Services – Facilities.
The following services are calculated based on a 20-year forecast:
• Services Related to a Highway
• Policing Services; and
• Fire Protection Services.
The following services are calculated based on a 10-year forecast. These
include:
• Parks and Recreation Services; and
• Library Services.
In addition, classes of services have been established for the following:
• Public Works; and

Watson & Associates Economists Ltd. PAGE vii H:\Lakeshore\2020 DC\Report\Final Report.docx
• Growth Studies.
Council will consider the findings and recommendations provided in the report
and, in conjunction with public input, approve such policies and rates it deems
appropriate. These directions will refine the draft D.C. by-law which is appended
in Appendix G. These decisions may include:
• adopting the charges and policies recommended herein;
• considering additional exemptions to the by-law; and
• considering reductions in the charge by class of development (obtained by
removing certain services on which the charge is based and/or by a
general reduction in the charge).
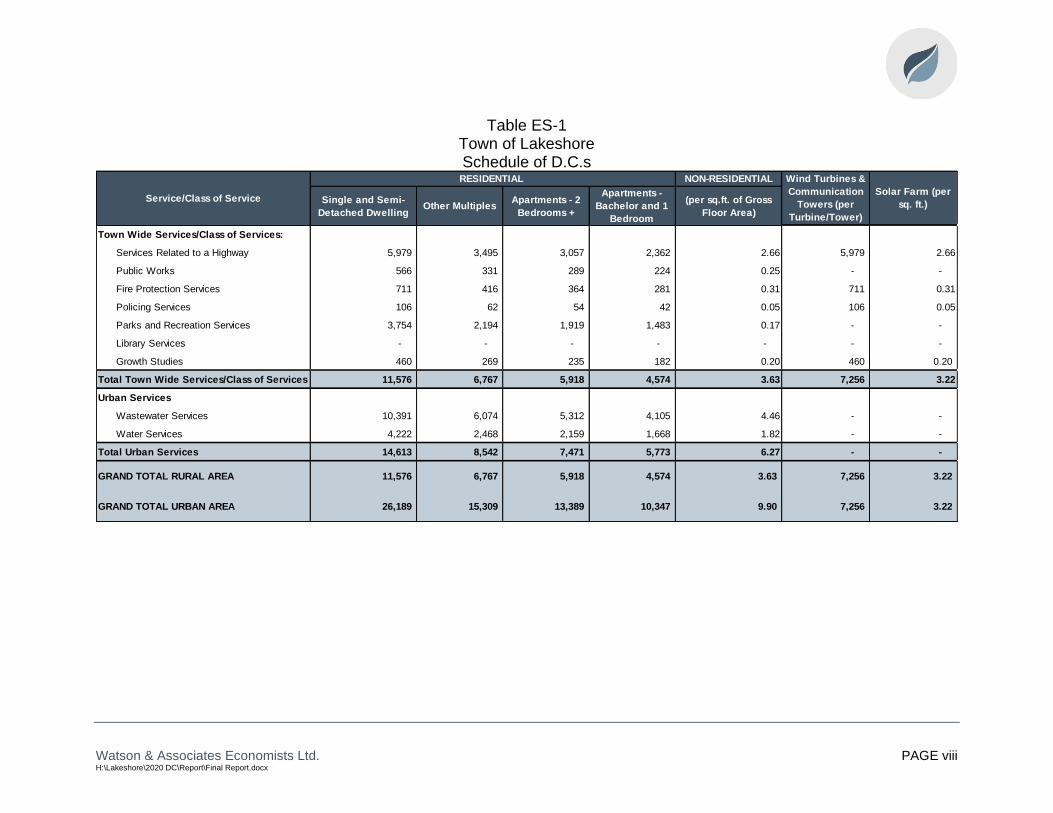
Watson & Associates Economists Ltd. PAGE viii H:\Lakeshore\2020 DC\Report\Final Report.docx
Table ES-1 Town of Lakeshore Schedule of D.C.s
NON-RESIDENTIAL
Single and Semi-
Detached DwellingOther Multiples
Apartments - 2
Bedrooms +
Apartments -
Bachelor and 1
Bedroom
(per sq.ft. of Gross
Floor Area)
Town Wide Services/Class of Services:
Services Related to a Highway 5,979 3,495 3,057 2,362 2.66 5,979 2.66
Public Works 566 331 289 224 0.25 - -
Fire Protection Services 711 416 364 281 0.31 711 0.31
Policing Services 106 62 54 42 0.05 106 0.05
Parks and Recreation Services 3,754 2,194 1,919 1,483 0.17 - -
Library Services - - - - - - -
Growth Studies 460 269 235 182 0.20 460 0.20
Total Town Wide Services/Class of Services 11,576 6,767 5,918 4,574 3.63 7,256 3.22
Urban Services
Wastewater Services 10,391 6,074 5,312 4,105 4.46 - -
Water Services 4,222 2,468 2,159 1,668 1.82 - -
Total Urban Services 14,613 8,542 7,471 5,773 6.27 - -
GRAND TOTAL RURAL AREA 11,576 6,767 5,918 4,574 3.63 7,256 3.22
GRAND TOTAL URBAN AREA 26,189 15,309 13,389 10,347 9.90 7,256 3.22
Service/Class of Service
RESIDENTIAL Wind Turbines &
Communication
Towers (per
Turbine/Tower)
Solar Farm (per
sq. ft.)

Report

Watson & Associates Economists Ltd. H:\Lakeshore\2020 DC\Report\Final Report.docx
Chapter 1
Introduction
Watson & Associates Economists Ltd. PAGE 1-1 H:\Lakeshore\2020 DC\Report\Final Report.docx
1. Introduction
1.1 Purpose of this Document
This background study has been prepared pursuant to the requirements of the D.C.A.
(section 10) and, accordingly, recommends new development charges (D.C.s) and
policies for the Town of Lakeshore.
The Town retained Watson & Associates Economists Ltd. (Watson), to undertake the
D.C. study process throughout 2019 and 2020. Watson worked with Town staff
preparing the D.C. analysis and policy recommendations.
This D.C. background study, containing the proposed D.C. by-law, will be distributed to
members of the public in order to provide interested parties with sufficient background
information on the legislation, the study’s recommendations and an outline of the basis
for these recommendations.
This report has been prepared, in the first instance, to meet the statutory requirements
applicable to the Town’s D.C. background study, as summarized in Chapter 4. It also
addresses the requirement for “rules” (contained in Chapter 7) and the proposed by-law
to be made available as part of the approval process (included as Appendix G).
In addition, the report is designed to set out sufficient background on the legislation
(Chapter 4), Lakeshore’s current D.C. policies (Chapter 2) and the policies underlying
the proposed by-law, to make the exercise understandable to those who are involved.
Finally, it addresses post-adoption implementation requirements (Chapter 8) which are
critical to the successful application of the new policy.
The Chapters in the report are supported by Appendices containing the data required to
explain and substantiate the calculation of the charge. A full discussion of the statutory
requirements for the preparation of a background study and calculation of a D.C. is
provided herein.
Watson & Associates Economists Ltd. PAGE 1-2 H:\Lakeshore\2020 DC\Report\Final Report.docx
1.2 Summary of the Process
The public meeting required under section 12 of the D.C.A., has been scheduled for
October 27, 2020. Its purpose is to present the study to the public and to solicit public
input. The meeting is also being held to answer any questions regarding the study’s
purpose, methodology and the proposed modifications to the Town’s D.C.s.
In accordance with the legislation, the background study and proposed D.C. by-law will
be available for public review on October 7, 2020.
The process to be followed in finalizing the report and recommendations includes:
• consideration of responses received prior to, at, or immediately following the
Public Meeting; and
• finalization of the report and Council consideration of the by-law subsequent to
the public meeting.
Figure 1-1 outlines the proposed schedule to be followed with respect to the D.C. by-law
adoption process.
Figure 1-1 Schedule of Key D.C. Process Dates for the Town of Lakeshore
1. Data collection, staff review, engineering work, D.C. calculations and policy work
Fall 2019 to Summer 2020
2. Public meeting advertisement placed in newspaper(s) and online
No later than October 6, 2020
3. Background study and proposed by-law available to public
October 7, 2020
4. Public meeting of Council October 27, 2020
5. Council considers adoption of background study and passage of by-law
December 8, 2020
6. Newspaper notice given of by-law passage
By 20 days after passage
7. Last day for by-law appeal 40 days after passage
8. Town makes pamphlet available (where by-law not appealed)
By 60 days after in force date
Watson & Associates Economists Ltd. PAGE 1-3 H:\Lakeshore\2020 DC\Report\Final Report.docx
1.3 Changes to the D.C.A.: Bill 73 – Smart Growth for our Communities Act, 2015
With the amendment of the D.C.A. (as a result of Bill 73 and O. Reg. 428/15), there are
a number of areas that must be addressed to ensure that the Town is in compliance
with the D.C.A., as amended. The following provides an explanation of the changes to
the Act that affect the Town’s background study and how they have been dealt with to
ensure compliance with the amended legislation.
1.3.1 Area Rating
Bill 73 has introduced two new sections where Council must consider the use of area-
specific charges:
1) Section 2 (9) of the Act now requires a municipality to implement area-specific
D.C.s for either specific services which are prescribed and/or for specific
municipalities which are to be regulated. (Note that at this time, no municipalities
or services are prescribed by the Regulations.)
2) Section 10 (2) c.1 of the D.C.A. requires that, “the development charges
background study shall include consideration of the use of more than one
development charge by-law to reflect different needs for services in different
areas.”
In regard to the first item, there are no services or specific municipalities identified in the
regulations which must be area-rated. The second item requires Council to consider
the use of area rating. This is discussed further in section 7.4.4.
1.3.2 Asset Management Plan for New Infrastructure
The new legislation now requires that a D.C. background study must include an Asset
Management Plan (subsection 10 (2) (c.2)). The asset management plan must deal
with all assets that are proposed to be funded, in whole or in part, by D.C.s. The current
regulations provide very extensive and specific requirements for the asset management
plan related to transit services; however, they are silent with respect to how the asset
management plan is to be provided for all other services. As part of any asset
management plan, the examination should be consistent with the municipality’s existing
assumptions, approaches and policies on asset management planning. This
Watson & Associates Economists Ltd. PAGE 1-4 H:\Lakeshore\2020 DC\Report\Final Report.docx
examination may include both qualitative and quantitative measures such as examining
the annual future lifecycle contributions needs (discussed further in Appendix F of this
report).
1.3.3 60-Day Circulation of D.C. Background Study
Previously the legislation required that a D.C. background study be made available to
the public at least two weeks prior to the public meeting. The amended legislation now
provides that the D.C. background study must be made available to the public (including
posting on the municipal website) at least 60 days prior to passage of the D.C. by-law.
No other changes were made to timing requirements for such things as notice of the
public meeting and notice of by-law passage.
This D.C. study is being provided to the public on October 7, 2020 to ensure the new
requirements for release of the study is met.
1.3.4 Timing of Collection of D.C.s
The D.C.A. has been refined by Bill 73 to require that D.C.s are collected at the time of
the first building permit. For the majority of development, this will not impact the Town’s
present process. There may be instances, however, where several building permits are
to be issued and either the size of the development or the uses will not be definable at
the time of the first building permit. In these instances, the Town may enter into a
delayed payment agreement in order to capture the full development.
1.3.5 Other Changes
It is also noted that a number of other changes were made through Bill 73 and O. Reg.
428/15, including changes to the way in which transit D.C. service standards are
calculated, the inclusion of waste diversion and the ability for collection of additional
levies. As the Town does not provide transit services and/or waste diversion services,
these sections do not impact the Town’s D.C. With respect to the ability for collection of
additional levies, a detailed local service policy is provided in Appendix E.

Watson & Associates Economists Ltd. PAGE 1-5 H:\Lakeshore\2020 DC\Report\Final Report.docx
1.4 Further Changes to the D.C.A.: Bill 108, 138, and 197
1.4.1 Bill 108: More Homes, More Choice Act – An Act to Amend Various Statutes with Respect to Housing, Other Development, and Various Matters
On May 2, 2019, the Province introduced Bill 108, which proposed changes to the
D.C.A. The Bill has been introduced as part of the Province’s “More Homes, More
Choice: Ontario's Housing Supply Action Plan”. The Bill received Royal Assent on
June 6, 2019.
While having received royal assent, many of the amendments to the D.C.A. would not
come into effect until they are proclaimed by the Lieutenant Governor (many of these
changes were revised through Bill 197). At the time of writing, the following provisions
have been proclaimed:
• Effective January 1, 2020, rental housing and institutional developments will pay
D.C.s in six equal annual payments commencing at occupancy. Non-profit
housing developments will pay D.C.s in 21 equal annual payments. Interest may
be charged on the instalments, and any unpaid amounts may be added to the
property and collected as taxes.
• Effective January 1, 2020 the D.C. amount for all developments occurring within
2 years of a Site Plan or Zoning By-law Amendment planning approval (for
application submitted after this section is proclaimed), shall be determined based
on the D.C. in effect on the day of Site Plan or Zoning By-law Amendment
application. If the development is not proceeding via these planning approvals,
then the amount is determined the earlier of the date of issuance of a building
permit or occupancy.
On February 28, 2020, the Province released updated draft regulations related to the
D.C.A. and the Planning Act. A summary of these changes to take effect upon
proclamation by the Lieutenant Governor is provided below:
Changes to Eligible Services – Prior to Bill 108, the D.C.A. provided a list of ineligible
services whereby municipalities could include growth related costs for any service that
was not listed. With Bill 108, the changes to the D.C.A. would now specifically list the
services that are eligible for inclusion in the by-law. Further, the initial list of eligible
Watson & Associates Economists Ltd. PAGE 1-6 H:\Lakeshore\2020 DC\Report\Final Report.docx
services under Bill 108 was limited to “hard services”, with the “soft services” being
removed from the D.C.A. These services would be considered as part of a new
community benefits charge (discussed below) imposed under the Planning Act. As
noted in the next section this list of services has been amended through Bill 197.
Mandatory 10% deduction – The amending legislation would remove the mandatory
10% deduction for all services that remain eligible under the D.C.A.
Remaining Services to be Included in a New Community Benefits Charge (C.B.C.)
Under the Planning Act – It is proposed that a municipality may, by by-law, impose a
C.B.C. against land to pay for the capital costs of facilities, services and matters
required because of development or redevelopment in the area to which the by-law
applies. The C.B.C. is proposed to include formerly eligible D.C. services that are not
included in the above listing, in addition to parkland dedication and bonus zoning
contributions.
1.4.2 Bill 197: COVID-19 Economic Recovery Act
In response to the global pandemic that began affecting Ontario in early 2020, the
Province released Bill 197 which provided amendments to a number of Acts, including
the D.C.A. and Planning Act. This Bill also revised some of the proposed changes
identified in Bill 108. Bill 197 was tabled on July 8, 2020, received Royal Assent on July
21, 2020, and was proclaimed on September 18, 2020. The following provides a
summary of the changes:
1.4.2.1 D.C. Related Changes
List of D.C. Eligible Services
• As noted above, under Bill 108 some services were to be included under the
D.C.A. and some would be included under the C.B.C. authority. However, Bill
197 revised this proposed change and has included all services (with some
exceptions) under the D.C.A. These services are as follows:
o Water supply services, including distribution and treatment services.
o Wastewater services, including sewers and treatment services.
o Storm water drainage and control services.
o Services related to a highway.
o Electrical power services.

Watson & Associates Economists Ltd. PAGE 1-7 H:\Lakeshore\2020 DC\Report\Final Report.docx
o Toronto-York subway extension.
o Transit services.
o Waste diversion services.
o Policing services.
o Fire protection services.
o Ambulance services.
o Library services
o Long-term Care services
o Parks and Recreation services, but not the acquisition of land for parks.
o Public Health services
o Childcare and early years services.
o Housing services.
o Provincial Offences Act services.
o Services related to emergency preparedness.
o Services related to airports, but only in the Regional Municipality of
Waterloo.
o Additional services as prescribed.
Classes of Services – D.C.
Pre-Bill 108/197 legislation (i.e. D.C.A., 1997) allowed for categories of services to be
grouped together into a minimum of two categories (90% and 100% services).
The Act (as amended) repeals and replaces the above with the four following
subsections:
• A D.C. by-law may provide for any eligible service or capital cost related to any
eligible service to be included in a class, set out in the by-law.
• A class may be composed of any number or combination of services and may
include parts or portions of the eligible services or parts or portions of the capital
costs in respect of those services.
• A D.C. by-law may provide for a class consisting of studies in respect of any
eligible service whose capital costs are described in paragraphs 5 and 6 of s. 5 of
the D.C.A.
• A class of service set out in the D.C. by-law is deemed to be a single service with
respect to reserve funds, use of monies, and credits.

Watson & Associates Economists Ltd. PAGE 1-8 H:\Lakeshore\2020 DC\Report\Final Report.docx
As well, the removal of 10% deduction for soft services under Bill 108 has been
maintained.
Note: an initial consideration of “class” appears to mean any group of services.
10-Year Planning Horizon
• The 10-year planning horizon has been removed for all services except transit.
1.4.2.2 C.B.C. Related Changes
C.B.C. Eligibility
• The C.B.C. is limited to lower-tier and single tier municipalities, whereas upper-
tier municipalities will not be allowed to impose this charge.
• O.Reg. 509/20 was filed on September 18, 2020. This regulation provides for the
following:
o A maximum rate will be set as a percentage of the market value of the
land the day before building permit issuance. The maximum rate is set at
4%. The C.B.C may only be imposed on developing or redeveloping
buildings which have a minimum height of five stories and contain no less
than 10 residential units.
o Bill 197 states that before passing a C.B.C. by-law, the municipality shall
prepare a C.B.C. strategy that (a) identifies the facilities, services and
matters that will be funded with C.B.C.s; and (b) complies with any
prescribed requirements.
o Only one C.B.C. by-law may be in effect in a local municipality at a time.
1.4.2.3 Combined D.C. and C.B.C. Impacts
D.C. vs. C.B.C. Capital Cost
• A C.B.C. may be imposed with respect to the services listed in s. 2 (4) of the
D.C.A. (eligible services), "provided that the capital costs that are intended to be
funded by the community benefits charge are not capital costs that are intended
to be funded under a development charge by-law."
Transition – D.C. and C.B.C.

Watson & Associates Economists Ltd. PAGE 1-9 H:\Lakeshore\2020 DC\Report\Final Report.docx
• The specified date for municipalities to transition to the D.C. and C.B.C. is two
years after Schedules 3 and 17 of the COVID-19 Economic Recovery Act comes
into force (i.e. September 18, 2022).
• Generally, for existing reserve funds (related to D.C. services that will be
ineligible):
o If a C.B.C. is passed, the funds are transferred to the C.B.C. special
account;
o If no C.B.C. is passed, the funds are moved to a general reserve fund for
the same purpose
o If a C.B.C. is passed subsequent to moving funds to a general reserve
fund, those monies are then moved again to the C.B.C. special account.
• For reserve funds established under s. 37 of the Planning Act (e.g. bonus zoning)
o If a C.B.C. is passed, the funds are transferred to the C.B.C. special
account;
o If no C.B.C. is passed, the funds are moved to a general reserve fund for
the same purpose;
o If a C.B.C. is passed subsequent to moving funds to a general reserve
fund, those monies are then moved again to the C.B.C. special account.
If a municipality passes a C.B.C. by-law, any existing D.C. credits a landowner may
retain may be used towards payment of that landowner’s C.B.C.
As a result of the passage of Bill 197, and subsequent proclamation on September 18,
2020, this report has provided the D.C. calculations without the 10% mandatory
deduction.
Watson & Associates Economists Ltd. H:\Lakeshore\2020 DC\Report\Final Report.docx
Chapter 2 Current Town of Lakeshore Policy

Watson & Associates Economists Ltd. PAGE 2-1 H:\Lakeshore\2020 DC\Report\Final Report.docx
2. Current Town of Lakeshore Policy
2.1 Schedule of Charges
On June 16, 2015, the Town of Lakeshore passed By-law 46-2015 under the D.C.A.
The by-law imposes D.C.s on residential and non-residential uses. This by-law would
have expired on July 12, 2020, however, the Coronavirus (COVID-19) Support and
Protection Act, 2020 came into force on April 14, 2020 which causes the 2015 by-law to
continue to be in effect for six months after the provincial emergency declaration period.
On July 24, 2020, the Reopening Ontario (A Flexible Response to COVID-19) Act,
2020, came into effect, bringing an end to the provincial state of emergency.
Accordingly, the 2015 by-law is continued in force until January 24, 2021. The Town is
undertaking a D.C. public process and anticipates passing a new by-law in advance of
the date the existing by-law is no longer in force.
This by-law imposes D.C.s for residential and non-residential uses. The table below
provides the rates currently in effect, as at January 1, 2020.
Table 2-1 Town of Lakeshore Current D.C. Rates
2.2 Services Covered
The following services are covered under By-laws 46-2015:
• Services Related to a Highway;
• Fire Protection Services;
ServiceSingle & Semi
DetachedOther Multiples
Apartments with
>= 2 Bedrooms
Apartments with
< 2 BedroomsIndustrial
Commercial -
Retail
Commercial -
Non-retail and
Institutional
Town Wide Services
Services Related to a Highway 5,704 3,383 2,937 2,238 2.88 2.88 2.88 5,704 2.88
Fire Protection Services 248 147 129 97 0.12 0.12 0.13 248 0.12
Policing Services 142 84 73 56 0.06 0.06 0.06 142 0.06
Parks Services 1,191 707 613 467 0.11 0.11 0.11 - -
Recreation Services 2,609 1,547 1,344 1,023 0.27 0.27 0.26 - -
Library Services - - - - - - - - -
Administration 880 522 454 346 0.52 0.52 0.54 880 0.52
Total Town Wide Services 10,774 6,390 5,550 4,227 3.97 3.97 3.99 6,975 3.58
Urban Services
Wastewater Services 4,416 2,618 2,162 1,733 2.14 2.14 2.14 - -
Water Services 4,614 2,737 2,259 1,808 2.24 2.24 2.24 - -
Total Urban Services 9,030 5,355 4,421 3,541 4.38 4.38 4.38 - -
GRAND TOTAL RURAL AREA 10,774 6,390 5,550 4,227 3.97 3.97 3.99 6,975 3.58
GRAND TOTAL URBAN AREA 19,804 11,745 9,971 7,768 8.35 8.35 8.37 6,975 3.58
Non-Residential (per sq. ft. of Gross Floor Area)ResidentialWind Turbines &
Communication
Towers (per
Turbine/Tower)
Solar Farm (per
sq. ft.)
Watson & Associates Economists Ltd. PAGE 2-2 H:\Lakeshore\2020 DC\Report\Final Report.docx
• Policing Services;
• Parks Services;
• Recreation Services;
• Administration (studies);
• Wastewater Services; and
• Water Services.
2.3 Timing of D.C. Calculation and Payment
D.C.s are calculated, payable, and collected upon issuance of a building permit for the
development. Council from time to time, and at any time, may enter into agreements
providing for all or any part of a D.C. to be paid before or after it would otherwise be
payable.
2.4 Indexing
Rates shall be indexed on January 1st of every year by the percentage change recorded
in the average annual Non-Residential Building Construction Price Index produced by
Statistics Canada.
2.5 Redevelopment Allowance
As a result of the redevelopment of land, a building or structure existing on the same
land within five years prior to the date of payment of D.C.s in regard to such
redevelopment was, or is to be demolished, in whole or in part, or converted from one
principal use to another principal use on the same land, in order to facilitate the
redevelopment, the D.C.s otherwise payable with respect to such redevelopment shall
be reduced by the following amounts:
(a) in the case of a residential building or structure, or in the case of a mixed-use
building or structure, the residential uses in the mixed-use building or structure,
an amount calculated by multiplying the applicable D.C. under subsection 3.11 of
the by-law by the number, according to type, of dwelling units that have been or
will be demolished or converted to another principal use; and
Watson & Associates Economists Ltd. PAGE 2-3 H:\Lakeshore\2020 DC\Report\Final Report.docx
(b) in the case of a non-residential building or structure or, in the case of mixed-use
building or structure, the non-residential uses in the mixed-use building or
structure, an amount calculated by multiplying the applicable D.C.s under
subsection 3.12 of the by-law by the gross floor area that has been or will be
demolished or converted to another principal use;
provided that such amounts shall not exceed, in total, the amount of the D.C.s otherwise
payable with respect to the redevelopment.
2.6 Exemptions
The following non-statutory exemptions are provided under By-law 46-2015:
• Lands, buildings or structures used or to be used for a place of worship or for the
purposes of a cemetery or burial ground exempt from taxation under the
Assessment Act; and
• Non-residential farm buildings constructed for bona fide farm uses.

Watson & Associates Economists Ltd. H:\Lakeshore\2020 DC\Report\Final Report.docx
Chapter 3 Anticipated Development in the Town of Lakeshore
Watson & Associates Economists Ltd. PAGE 3-1 H:\Lakeshore\2020 DC\Report\Final Report.docx
3. Anticipated Development in the Town ofLakeshore
3.1 Requirement of the Act
Chapter 3 provides the methodology for calculating a D.C. as per the D.C.A. Figure 3-1
presents this methodology graphically. It is noted in the first box of the schematic that in
order to determine the D.C. that may be imposed, it is a requirement of Section 5 (1) of
the D.C.A. that “the anticipated amount, type and location of development, for which
development charges can be imposed, must be estimated.”
The growth forecast contained in this chapter (with supplemental tables in Appendix A)
provides for the anticipated development for which the Town of Lakeshore will be
required to provide services, over a 10-year (early-2020 to early-2030), and 20-year
time horizon (early-2020 to early-2040).
3.2 Basis of Population, Household and Non-Residential Gross Floor Area Forecast
The D.C. growth forecast has been derived by Watson from the work conducted for
Phase 1 of the Town of Lakeshore Employment Lands Strategy. In preparing the
growth forecast, the following information sources were consulted to assess the
residential and non-residential development potential for the Town of Lakeshore over
the forecast period, including:
• Town of Lakeshore Official Plan (approved November 2010);
• County of Essex Foundation Report (August 2011);
• County of Essex Official Plan (approved April 2014);
• 2006, 2011 and 2016 population, household, and employment Census data;
• Historical residential and non-residential building permit data over the 2009 to
2018 period;
• Residential supply opportunities as provided by the Town of Lakeshore; and
• Discussions with Town staff regarding anticipated residential and non-residential
development in the Town of Lakeshore.
Watson & Associates Economists Ltd. PAGE 3-2 H:\Lakeshore\2020 DC\Report\Final Report.docx
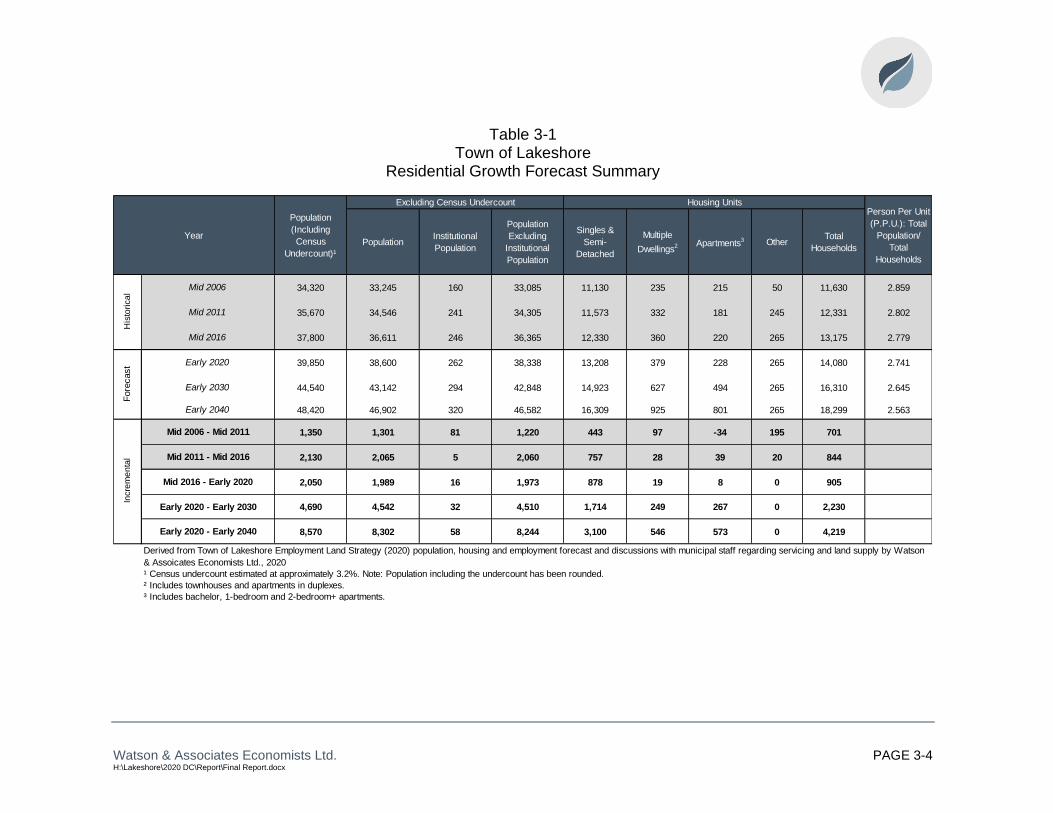
3.3 Summary of Growth Forecast
A detailed analysis of the residential and non-residential growth forecasts is provided in
Appendix A and the methodology employed is illustrated in Figure 3-1. The discussion
provided herein summarizes the anticipated growth for the Town and describes the
basis for the forecast. The results of the residential growth forecast analysis are
summarized in Table 3-1 below, and Schedule 1 in Appendix A.
As identified in Table 3-1 and Appendix A, Schedule 1, population in Lakeshore is
anticipated to reach approximately 44,500 by early-2030 and 48,400 by early-2040,
resulting in an increase of approximately 4,700 and 8,600 persons, respectively.1
1 The population figures used in the calculation of the 2020 D.C. including the net Census undercount, which staff have estimated at approximately 3.2%.

Watson & Associates Economists Ltd. PAGE 3-3 H:\Lakeshore\2020 DC\Report\Final Report.docx
Figure 3-1 Household Formation-based Population and Household Projection Model
Watson & Associates Economists Ltd. PAGE 3-4 H:\Lakeshore\2020 DC\Report\Final Report.docx
Table 3-1 Town of Lakeshore
Residential Growth Forecast Summary
PopulationInstitutional
Population
Population
Excluding
Institutional
Population
Singles &
Semi-
Detached
Multiple
Dwellings2 Apartments
3 OtherTotal
Households
34,320 33,245 160 33,085 11,130 235 215 50 11,630 2.859
35,670 34,546 241 34,305 11,573 332 181 245 12,331 2.802
37,800 36,611 246 36,365 12,330 360 220 265 13,175 2.779
39,850 38,600 262 38,338 13,208 379 228 265 14,080 2.741
44,540 43,142 294 42,848 14,923 627 494 265 16,310 2.645
48,420 46,902 320 46,582 16,309 925 801 265 18,299 2.563
1,350 1,301 81 1,220 443 97 -34 195 701
2,130 2,065 5 2,060 757 28 39 20 844
2,050 1,989 16 1,973 878 19 8 0 905
4,690 4,542 32 4,510 1,714 249 267 0 2,230
8,570 8,302 58 8,244 3,100 546 573 0 4,219
¹ Census undercount estimated at approximately 3.2%. Note: Population including the undercount has been rounded.
² Includes townhouses and apartments in duplexes.
³ Includes bachelor, 1-bedroom and 2-bedroom+ apartments.
Mid 2006 - Mid 2011
Mid 2011 - Mid 2016
Mid 2006
Mid 2011
Mid 2016
Early 2020
Early 2030
Early 2020 - Early 2030
Population
(Including
Census
Undercount)¹
Year
Excluding Census Undercount Housing UnitsPerson Per Unit
(P.P.U.): Total
Population/
Total
Households
His
tori
ca
l
Early 2020 - Early 2040
Fore
cast
Incre
me
nta
l
Early 2040
Mid 2016 - Early 2020
Derived from Town of Lakeshore Employment Land Strategy (2020) population, housing and employment forecast and discussions with municipal staff regarding servicing and land supply by Watson
& Assoicates Economists Ltd., 2020
Watson & Associates Economists Ltd. PAGE 3-5 H:\Lakeshore\2020 DC\Report\Final Report.docx
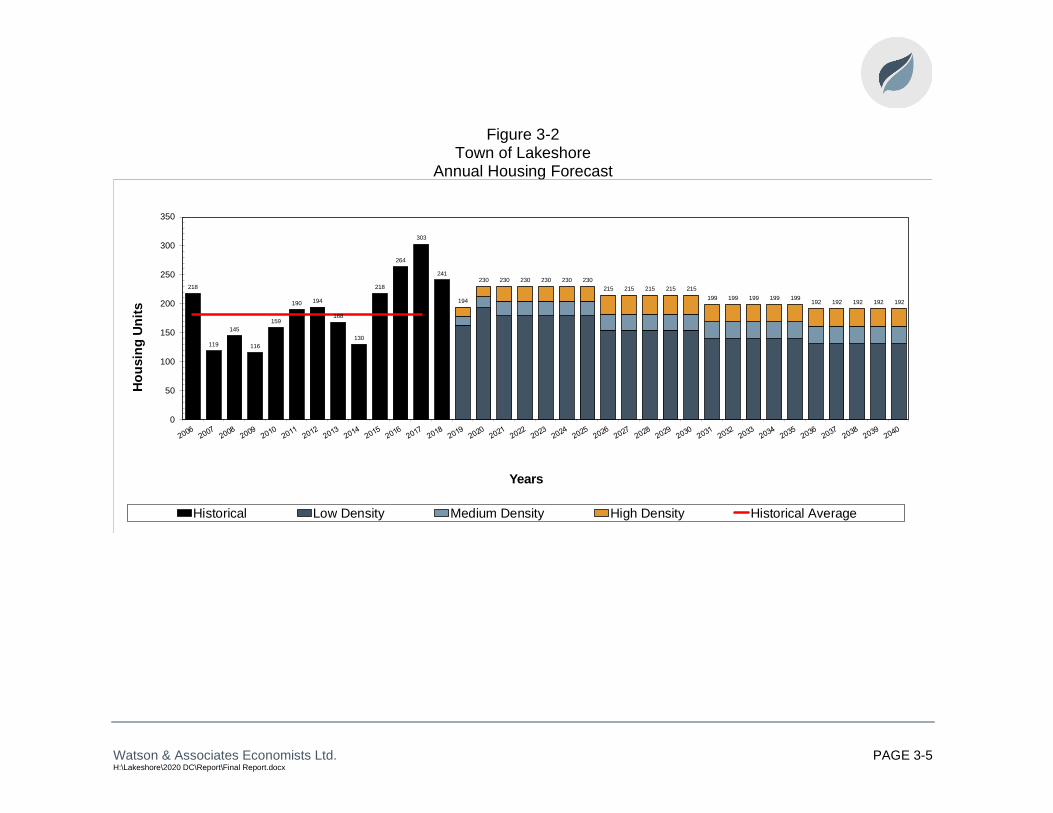
Figure 3-2 Town of Lakeshore
Annual Housing Forecast
218
119
145
116
159
190 194
168
130
218
264
303
241
194
230 230 230 230 230 230
215 215 215 215 215
199 199 199 199 199192 192 192 192 192
0
50
100
150
200
250
300
350
Ho
usin
g U
nit
s
Years
Historical Low Density Medium Density High Density Historical Average

Watson & Associates Economists Ltd. PAGE 3-6 H:\Lakeshore\2020 DC\Report\Final Report.docx
Provided below is a summary of the key assumptions and findings regarding the Town
of Lakeshore D.C. growth forecast.
1. Housing Unit Mix (Appendix A – Schedules 1 and 6)
• The housing unit mix for the Town was derived from a detailed review of
residential supply data for the Town (as per Schedule 6), and historical
development activity (as per Schedule 7).
• Based on the above indicators, the 10-year household growth forecast for the
Town is comprised of a unit mix of 77% low density units (single detached and
semi-detached), 11% medium density (multiples except apartments) and 12%
high density (bachelor, 1-bedroom and 2-bedroom apartments).
2. Geographic Location of Residential Development (Appendix A – Schedule 2)
• Schedule 2 summarizes the anticipated amount, type, and location of
development by servicing area for the Town of Lakeshore.
• In accordance with forecast demand and available land supply, the amount and
percentage of forecast housing growth between 2020 and 2040 by development
location is summarized below.
Development Location
Approximate Amount
of Housing Growth,
2020 to 2040
Percentage of
Housing Growth, 2020
to 2040
Urban 4,100 97%
Rural 120 3%
Town Total 4,220 100%
3. Planning Period
• Short and longer-term time horizons are required for the D.C. process. The
D.C.A. limits the planning horizon for certain services, such as parks, recreation
and libraries, to a 10-year planning horizon. Services related to a highway,

Watson & Associates Economists Ltd. PAGE 3-7 H:\Lakeshore\2020 DC\Report\Final Report.docx
public works, fire, police, stormwater, water and wastewater services can utilize a
longer planning period.
4. Population in New Housing Units (Appendix A - Schedules 3, 4 and 5)
• The number of housing units to be constructed by 2040 in the Town of Lakeshore
over the forecast period is presented in Figure 3-2. Over the 2020 to 2030
forecast period, the Town is anticipated to approximately average 220 new
housing units per year.
• Between 2020 to 2040, the Town is forecast to average 210 units annually.
• Institutional population1 is anticipated to increase by approximately 60 people
between 2020 to 2040.
• Population in new units is derived from Schedules 3, 4, and 5, which incorporate
historical development activity, anticipated units (see unit mix discussion) and
average persons per unit (P.P.U.) by dwelling type for new units.
• Schedule 8 summarizes the P.P.U. for the new housing units by age and type of
dwelling based on a 2016 custom Census data for Lakeshore. The total
calculated 20-year average P.P.U.s by dwelling type are as follows:
o Low density: 3.331
o Medium density: 1.947
o High density2: 1.594
5. Existing Units and Population Change (Appendix A - Schedules 3, 4 and 5)
• Existing households for early-2020 are based on the 2016 Census households,
plus estimated residential units constructed between early-2016 and early-2020
assuming a 6-month lag between construction and occupancy (see Schedule 3).
• The decline in average occupancy levels for existing housing units is calculated
in Schedules 3 through 5, by aging the existing population over the forecast
period. The forecast population decline in existing households over the 2020 to
2040 forecast period is approximately 4,060
1 Institutional includes special care facilities such as nursing home or residences for senior citizens. A P.P.U. of 1.100 depicts 1-bedroom and 2- or more bedroom units in these special care facilities. 2 Includes bachelor, 1-bedroom and 2- or more bedroom apartments.
Watson & Associates Economists Ltd. PAGE 3-8 H:\Lakeshore\2020 DC\Report\Final Report.docx
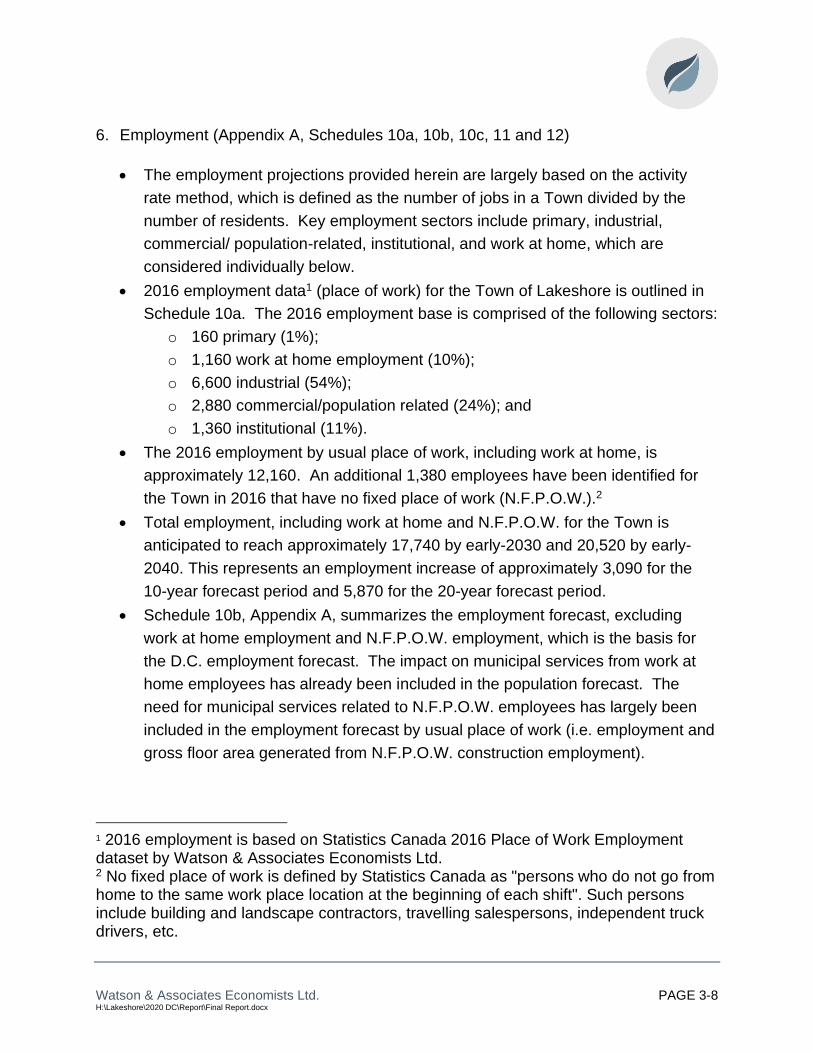
6. Employment (Appendix A, Schedules 10a, 10b, 10c, 11 and 12)
• The employment projections provided herein are largely based on the activity
rate method, which is defined as the number of jobs in a Town divided by the
number of residents. Key employment sectors include primary, industrial,
commercial/ population-related, institutional, and work at home, which are
considered individually below.
• 2016 employment data1 (place of work) for the Town of Lakeshore is outlined in
Schedule 10a. The 2016 employment base is comprised of the following sectors:
o 160 primary (1%);
o 1,160 work at home employment (10%);
o 6,600 industrial (54%);
o 2,880 commercial/population related (24%); and
o 1,360 institutional (11%).
• The 2016 employment by usual place of work, including work at home, is
approximately 12,160. An additional 1,380 employees have been identified for
the Town in 2016 that have no fixed place of work (N.F.P.O.W.).2
• Total employment, including work at home and N.F.P.O.W. for the Town is
anticipated to reach approximately 17,740 by early-2030 and 20,520 by early-
2040. This represents an employment increase of approximately 3,090 for the
10-year forecast period and 5,870 for the 20-year forecast period.
• Schedule 10b, Appendix A, summarizes the employment forecast, excluding
work at home employment and N.F.P.O.W. employment, which is the basis for
the D.C. employment forecast. The impact on municipal services from work at
home employees has already been included in the population forecast. The
need for municipal services related to N.F.P.O.W. employees has largely been
included in the employment forecast by usual place of work (i.e. employment and
gross floor area generated from N.F.P.O.W. construction employment).
1 2016 employment is based on Statistics Canada 2016 Place of Work Employment dataset by Watson & Associates Economists Ltd. 2 No fixed place of work is defined by Statistics Canada as "persons who do not go from home to the same work place location at the beginning of each shift". Such persons include building and landscape contractors, travelling salespersons, independent truck drivers, etc.
Watson & Associates Economists Ltd. PAGE 3-9 H:\Lakeshore\2020 DC\Report\Final Report.docx
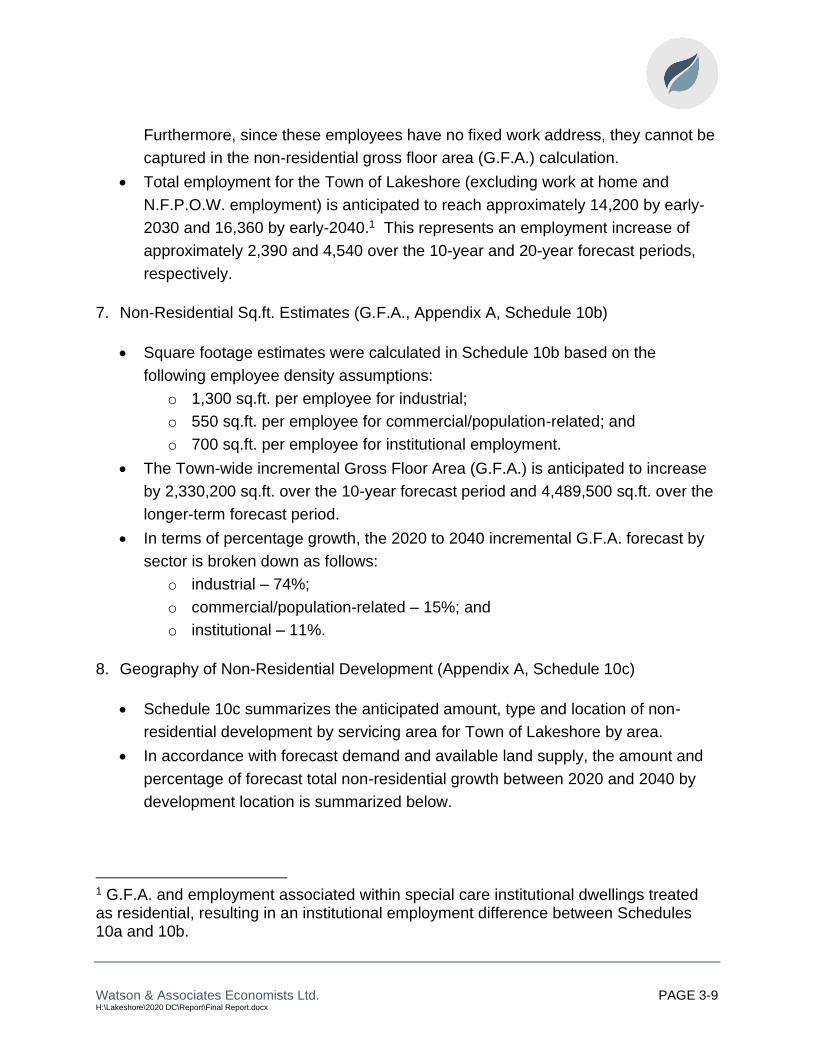
Furthermore, since these employees have no fixed work address, they cannot be
captured in the non-residential gross floor area (G.F.A.) calculation.
• Total employment for the Town of Lakeshore (excluding work at home and
N.F.P.O.W. employment) is anticipated to reach approximately 14,200 by early-
2030 and 16,360 by early-2040.1 This represents an employment increase of
approximately 2,390 and 4,540 over the 10-year and 20-year forecast periods,
respectively.
7. Non-Residential Sq.ft. Estimates (G.F.A., Appendix A, Schedule 10b)
• Square footage estimates were calculated in Schedule 10b based on the
following employee density assumptions:
o 1,300 sq.ft. per employee for industrial;
o 550 sq.ft. per employee for commercial/population-related; and
o 700 sq.ft. per employee for institutional employment.
• The Town-wide incremental Gross Floor Area (G.F.A.) is anticipated to increase
by 2,330,200 sq.ft. over the 10-year forecast period and 4,489,500 sq.ft. over the
longer-term forecast period.
• In terms of percentage growth, the 2020 to 2040 incremental G.F.A. forecast by
sector is broken down as follows:
o industrial – 74%;
o commercial/population-related – 15%; and
o institutional – 11%.
8. Geography of Non-Residential Development (Appendix A, Schedule 10c)
• Schedule 10c summarizes the anticipated amount, type and location of non-
residential development by servicing area for Town of Lakeshore by area.
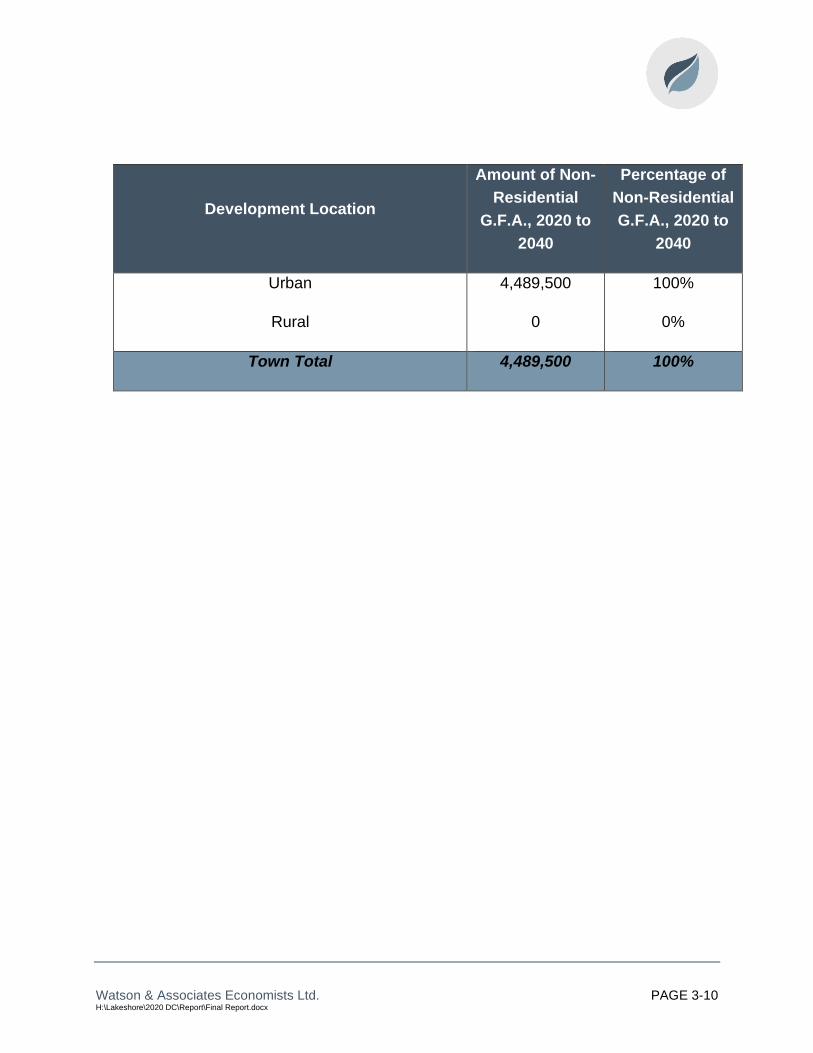
• In accordance with forecast demand and available land supply, the amount and
percentage of forecast total non-residential growth between 2020 and 2040 by
development location is summarized below.
1 G.F.A. and employment associated within special care institutional dwellings treated as residential, resulting in an institutional employment difference between Schedules 10a and 10b.
Watson & Associates Economists Ltd. PAGE 3-10 H:\Lakeshore\2020 DC\Report\Final Report.docx
Development Location
Amount of Non-
Residential
G.F.A., 2020 to
2040
Percentage of
Non-Residential
G.F.A., 2020 to
2040
Urban 4,489,500 100%
Rural 0 0%
Town Total 4,489,500 100%

Watson & Associates Economists Ltd. H:\Lakeshore\2020 DC\Report\Final Report.docx
Chapter 4 The Approach to the Calculation of the Charge

Watson & Associates Economists Ltd. PAGE 4-1 H:\Lakeshore\2020 DC\Report\Final Report.docx
4. The Approach to the Calculation of the Charge
4.1 Introduction
This chapter addresses the requirements of subsection 5 (1) of the D.C.A. with respect
to the establishment of the need for service which underpins the D.C. calculation.
These requirements are illustrated schematically in Figure 4-1.
Note: As the Province has passed Bill 197, notes have been provided where proposed
changes impact the methodology.
4.2 Services Potentially Involved
Table 4-1 lists the full range of municipal service categories which are provided within
the Town.
A number of these services are defined in subsection 2 (4) of the D.C.A. as being
ineligible for inclusion in D.C.s. These are shown as “ineligible” on Table 4-1. Two
ineligible costs defined in subsection 5 (3) of the D.C.A. are “computer equipment” and
“rolling stock with an estimated useful life of (less than) seven years...” In addition, local
roads are covered separately under subdivision agreements and related means (as are
other local services). Services which are potentially eligible for inclusion in the Town’s
D.C. are indicated with a “Yes.”
4.3 Increase in the Need for Service
The D.C. calculation commences with an estimate of “the increase in the need for
service attributable to the anticipated development,” for each service to be covered by
the by-law. There must be some form of link or attribution between the anticipated
development and the estimated increase in the need for service. While the need could
conceivably be expressed generally in terms of units of capacity, subsection 5 (1) 3,
which requires that Town Council indicate that it intends to ensure that such an increase
in need will be met, suggests that a project-specific expression of need would be most
appropriate.
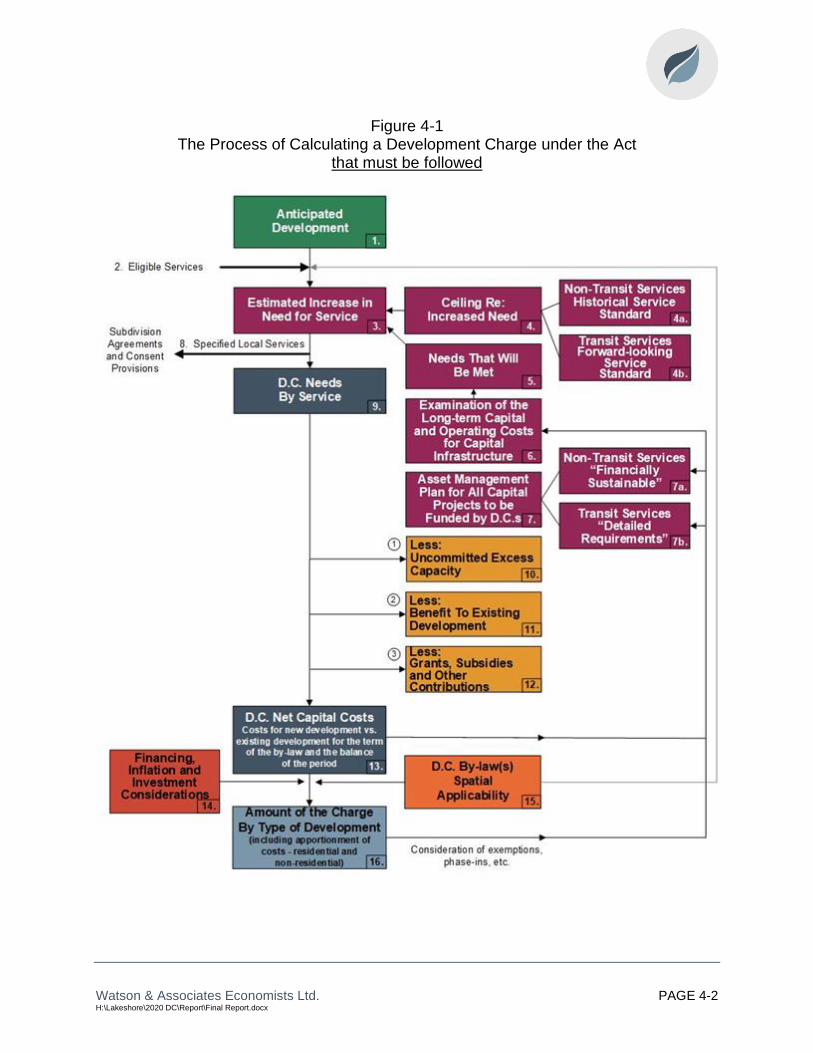
Watson & Associates Economists Ltd. PAGE 4-2 H:\Lakeshore\2020 DC\Report\Final Report.docx
Figure 4-1 The Process of Calculating a Development Charge under the Act
that must be followed

Watson & Associates Economists Ltd. PAGE 4-3 H:\Lakeshore\2020 DC\Report\Final Report.docx
Table 4-1 Categories of Municipal Services to be Addressed as Part of the Calculation
Eligibility for Inclusion in the D.C. Calculation
Description
Yes Municipality provides the service – service has been included in the D.C. calculation.
No Municipality provides the service – service has not been included in the D.C. calculation.
n/a Municipality does not provide the service.
Ineligible Service is ineligible for inclusion in the D.C. calculation.
Categories of Municipal Services
Eligibility for
Inclusion in the D.C. Calculation
Service Components
Maximum Potential
D.C. Recovery
%
1. Services Related to a Highway
Yes Yes Yes
No Yes Yes No
1.1 Arterial roads 1.2 Collector roads 1.3 Bridges, Culverts and Roundabouts 1.4 Local municipal roads 1.5 Traffic signals 1.6 Sidewalks and streetlights 1.7 Active Transportation
100 100
100
0 100 100 100
2. Other Transportation Services
n/a n/a
Ineligible
Ineligible
Yes Yes n/a n/a
2.1 Transit vehicles2 & facilities 2.2 Other transit infrastructure 2.3 Municipal parking spaces -
indoor 2.4 Municipal parking spaces -
outdoor 2.5 Works Yards 2.6 Rolling stock1 2.7 Ferries 2.8 Airport
100 100
0
0 100 100 100
100**
1with 7+ year life time
*same percentage as service component to which it pertains
computer equipment excluded throughout
**Airports only eligible for the Region of Waterloo

Watson & Associates Economists Ltd. PAGE 4-4 H:\Lakeshore\2020 DC\Report\Final Report.docx
Categories of Municipal Services
Eligibility for
Inclusion in the D.C. Calculation
Service Components
Maximum Potential
D.C.Recovery
%
3. StormwaterDrainage andControl Services
No
No No
3.1 Main channels and drainage trunks
3.2 Channel connections 3.3 Retention/detention ponds
100
100 100
4. Fire ProtectionServices
Yes Yes Yes
4.1 Fire stations 4.2 Fire pumpers, aerials and
rescue vehicles1 4.3 Small equipment and gear
100 100
100
5. OutdoorRecreationServices (i.e.Parks and OpenSpace)
Ineligible
Yes
Yes Yes
Yes
Yes
5.1 Acquisition of land for parks, woodlots and E.S.A.s
5.2 Development of area municipal parks
5.3 Development of district parks 5.4 Development of municipal-
wide parks 5.5 Development of special
purpose parks 5.6 Parks rolling stock1 and yards
0 100
100
100
100 100
6. IndoorRecreationServices
Yes
Yes
6.1 Arenas, indoor pools, fitness facilities, community centres, etc. (including land)
6.2 Recreation vehicles and equipment11
100
100
7. Library Services Yes
n/a n/a
7.1 Public library space (incl. furniture and equipment)
7.2 Library vehicles1 7.3 Library materials
100 100 100
8. Electrical PowerServices
Ineligible Ineligible Ineligible
8.1 Electrical substations 8.2 Electrical distribution system 8.3 Electrical system rolling stock
0 0 0
1with 7+ year lifetime

Watson & Associates Economists Ltd. PAGE 4-5 H:\Lakeshore\2020 DC\Report\Final Report.docx
Categories of Municipal Services
Eligibility for
Inclusion in the D.C. Calculation
Service Components
Maximum Potential
D.C.Recovery
%
9. Provision ofCultural,Entertainmentand TourismFacilities andConventionCentres
Ineligible
Ineligible
9.1 Cultural space (e.g. art galleries, museums and theatres)
9.2 Tourism facilities and convention centres
0
0
10. WastewaterServices
Yes Yes No n/a
10.1 Treatment plants 10.2 Sewage trunks 10.3 Local systems 10.4 Vehicles and equipment1
100 100
0 100
11. Water SupplyServices
Yes Yes No n/a
11.1 Treatment plants 11.2 Distribution systems 11.3 Local systems 11.4 Vehicles and equipment1
100 100
0 100
12. WasteManagementServices
Ineligible
Ineligible
n/a n/a
12.1 Landfill collection, transfer vehicles and equipment
12.2 Landfills and other disposal facilities
12.3 Waste diversion facilities 12.4 Waste diversion vehicles and
equipment1
0
0 100
100
13. Police Services Yes n/a Yes
13.1 Police detachments 13.2 Police rolling stock2\11 13.3 Small equipment and gear
100 100 100
14. Long-term Care n/a n/a
14.1 Long-term Care space 14.2 Vehicles1
100 100
15. Child Care andEarly Years
n/a n/a
15.1 Childcare space 15.2 Vehicles1
100 100
16. Public Health n/a n/a
16.1 Public Health space 16.2 Public Health vehicles1
100 100
17. Social Housing n/a 17.1 Social Housing space 100
18. ProvincialOffences Act(P.O.A.)
n/a 18.1 P.O.A. space 100
1with a 7+ year lifetime

Watson & Associates Economists Ltd. PAGE 4-6 H:\Lakeshore\2020 DC\Report\Final Report.docx
Categories of Municipal Services
Eligibility for
Inclusion in the D.C. Calculation
Service Components
Maximum Potential
D.C.Recovery
%
19. Social Services n/a 19.1 Social service space 0
20. Ambulance n/a n/a
20.1 Ambulance station space 20.2 Vehicles1
100 100
21. HospitalProvision
Ineligible 21.1 Hospital capital contributions 0
22. Provision ofHeadquartersfor the GeneralAdministrationof Municipalitiesand AreaMunicipalBoards
Ineligible Ineligible Ineligible
22.1 Office space 22.2 Office furniture 22.3 Computer equipment
0 0 0
23. Other Yes
Yes
23.1 Studies in connection with acquiring buildings, rolling stock, materials and equipment, and improving land2 and facilities, including the D.C. background study cost
23.2 Interest on money borrowed to pay for growth-related capital
0-100
0-100
1with a 7+ year lifetime 2same percentage as service component to which it pertains
4.4 Local Service Policy
Some of the need for services generated by additional development consists of local
services related to a plan of subdivision. As such, they will be required as a condition of
subdivision agreements or consent conditions. The Town’s detailed Local Service
Policy is provided in Appendix E.

Watson & Associates Economists Ltd. PAGE 4-7 H:\Lakeshore\2020 DC\Report\Final Report.docx
4.5 Capital Forecast
Paragraph 7 of subsection 5 (1) of the D.C.A. requires that “the capital costs necessary
to provide the increased services must be estimated.” The Act goes on to require two
potential cost reductions and the Regulation sets out the way in which such costs are to
be presented. These requirements are outlined below.
These estimates involve capital costing of the increased services discussed above.
This entails costing actual projects or the provision of service units, depending on how
each service has been addressed.
The capital costs include:
a) costs to acquire land or an interest therein (including a leasehold interest);
b) costs to improve land;
c) costs to acquire, lease, construct or improve buildings and structures;
d) costs to acquire, lease or improve facilities, including rolling stock (with a useful
life of 7 or more years), furniture and equipment (other than computer
equipment), materials acquired for library circulation, reference or information
purposes;
e) interest on money borrowed to pay for the above-referenced costs;
f) costs to undertake studies in connection with the above-referenced matters; and
g) costs of the D.C. background study.
In order for an increase in need for service to be included in the D.C. calculation, Town
Council must indicate “...that it intends to ensure that such an increase in need will be
met” (subsection 5 (1) 3). This can be done if the increase in service forms part of a
Council-approved Official Plan, capital forecast or similar expression of the intention of
Council (O. Reg. 82/98 section 3). The capital program contained herein reflects the
Town’s approved and proposed capital budgets and master servicing/needs studies.
4.6 Treatment of Credits
Section 8, paragraph 5, of O. Reg. 82/98 indicates that a D.C. background study must
set out “the estimated value of credits that are being carried forward relating to the
service.” Subsection 17, paragraph 4, of the same Regulation indicates that “...the
value of the credit cannot be recovered from future D.C.s,” if the credit pertains to an

Watson & Associates Economists Ltd. PAGE 4-8 H:\Lakeshore\2020 DC\Report\Final Report.docx
ineligible service. This implies that a credit for eligible services can be recovered from
future D.C.s. As a result, this provision should be made in the calculation, in order to
avoid a funding shortfall with respect to future service needs. Outstanding credit
obligations for roads and wastewater have been included in the D.C. calculations.
4.7 Classes of Services
Section 7 of the D.C.A. states that a D.C. by-law may provide for any D.C. eligible
service or the capital costs with respect to those services. Further, a class may be
composed of any number or combination of services and may include parts or portions
of each D.C. eligible services. With respect to growth-related studies, Section 7(3) of
the D.C.A. states that:
“For greater certainty, a development charge by-law may provide for a class
consisting of studies in respect of any service listed in subsection 2 (4) whose capital
costs are described in paragraphs 5 and 6 of subsection 5 (3).”
These provisions allow for services to be grouped together to create a class for the
purposes of the D.C. by-law and D.C. reserve funds. The D.C. calculations and by-law
provided herein include the following classes; public works (facilities and fleet) and
growth studies. These classes are comprised of the following services:
• Public Works – facilities and fleet
o Services related to a highway;
o Water services; and
o Wastewater services.
• Growth Studies
o Services related to a highway;
o Water services;
o Wastewater services;
o Parks and Recreation services;
o Fire services; and
o Policing services.

Watson & Associates Economists Ltd. PAGE 4-9 H:\Lakeshore\2020 DC\Report\Final Report.docx
4.8 Existing Reserve Funds
Section 35 of the D.C.A. states that:
“The money in a reserve fund established for a service may be spent only for capital costs determined under paragraphs 2 to 7 of subsection 5 (1).”
There is no explicit requirement under the D.C.A. calculation method set out in
subsection 5 (1) to net the outstanding reserve fund balance as part of making the D.C.
calculation; however, section 35 does restrict the way in which the funds are used in
future.
For services which are subject to a per capita based, service level “cap,” the reserve
fund balance should be applied against the development-related costs for which the
charge was imposed once the project is constructed (i.e. the needs of recent growth).
This cost component is distinct from the development-related costs for the next 10-year
period, which underlie the D.C. calculation herein.
The alternative would involve the Town spending all reserve fund monies prior to
renewing each by-law, which would not be a sound basis for capital budgeting. Thus,
the Town will use these reserve funds for the Town’s cost share of applicable
development-related projects, which are required but have not yet been undertaken, as
a way of directing the funds to the benefit of the development which contributed them
(rather than to future development, which will generate the need for additional facilities
directly proportionate to future growth).
The Town’s D.C. reserve fund balances by service at December 31, 2019 are shown
below:
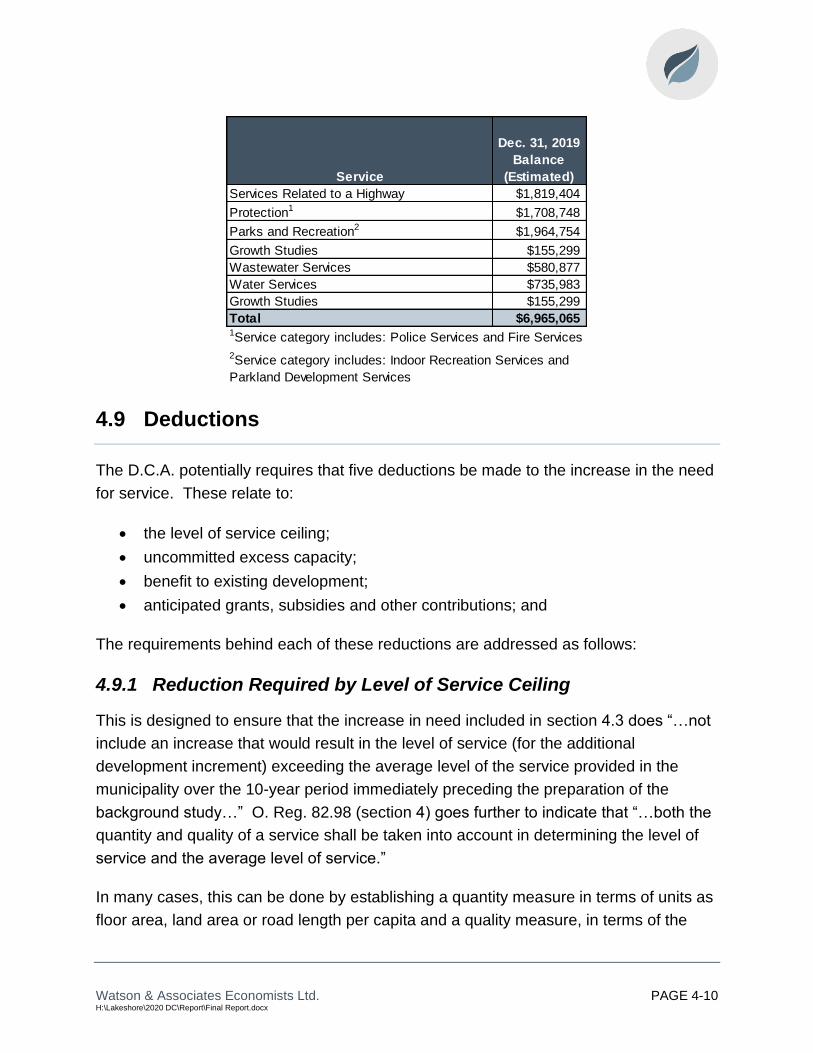
Watson & Associates Economists Ltd. PAGE 4-10 H:\Lakeshore\2020 DC\Report\Final Report.docx
4.9 Deductions
The D.C.A. potentially requires that five deductions be made to the increase in the need
for service. These relate to:
• the level of service ceiling;
• uncommitted excess capacity;
• benefit to existing development;
• anticipated grants, subsidies and other contributions; and
The requirements behind each of these reductions are addressed as follows:
4.9.1 Reduction Required by Level of Service Ceiling
This is designed to ensure that the increase in need included in section 4.3 does “…not
include an increase that would result in the level of service (for the additional
development increment) exceeding the average level of the service provided in the
municipality over the 10-year period immediately preceding the preparation of the
background study…” O. Reg. 82.98 (section 4) goes further to indicate that “…both the
quantity and quality of a service shall be taken into account in determining the level of
service and the average level of service.”
In many cases, this can be done by establishing a quantity measure in terms of units as
floor area, land area or road length per capita and a quality measure, in terms of the
Service
Dec. 31, 2019
Balance
(Estimated)
Services Related to a Highway $1,819,404
Protection1 $1,708,748
Parks and Recreation2 $1,964,754
Growth Studies $155,299
Wastewater Services $580,877
Water Services $735,983
Growth Studies $155,299
Total $6,965,0651Service category includes: Police Services and Fire Services
2Service category includes: Indoor Recreation Services and
Parkland Development Services

Watson & Associates Economists Ltd. PAGE 4-11 H:\Lakeshore\2020 DC\Report\Final Report.docx
average cost of providing such units based on replacement costs, engineering
standards or recognized performance measurement systems, depending on
circumstances. When the quantity and quality factor are multiplied together, they
produce a measure of the level of service, which meets the requirements of the Act, i.e.
cost per unit.
With respect to transit services, the changes to the Act as a result of Bill 73 have
provided for an alternative method for calculating the services standard ceiling. Transit
services must now utilize a forward-looking service standard analysis, described later in
this section.
The average service level calculation sheets for each service component in the D.C.
calculation are set out in Appendix B.
4.9.2 Reduction for Uncommitted Excess Capacity
Paragraph 5 of subsection 5 (1) requires a deduction from the increase in the need for
service attributable to the anticipated development that can be met using the Town’s
“excess capacity,” other than excess capacity which is “committed.”
“Excess capacity” is undefined, but in this case must be able to meet some or all of the
increase in need for service, in order to potentially represent a deduction. The
deduction of uncommitted excess capacity from the future increase in the need for
service would normally occur as part of the conceptual planning and feasibility work
associated with justifying and sizing new facilities, e.g. if a road widening to
accommodate increased traffic is not required because sufficient excess capacity is
already available, then widening would not be included as an increase in need, in the
first instance.
4.9.3 Reduction for Benefit to Existing Development
Section 5 (1) 6 of the D.C.A. provides that, “The increase in the need for service must
be reduced by the extent to which an increase in service to meet the increased need
would benefit existing development.” The general guidelines used to consider benefit to
existing development include:
• the repair or unexpanded replacement of existing assets that are in need of
repair;
Watson & Associates Economists Ltd. PAGE 4-12 H:\Lakeshore\2020 DC\Report\Final Report.docx
• an increase in average service level of quantity or quality (compare water as an
example);
• the elimination of a chronic servicing problem not created by growth; and
• providing services where none previously existed (generally considered for water
or wastewater services).
This step involves a further reduction in the need, by the extent to which such an
increase in service would benefit existing development. The level of services cap
discussed in section 4.4 of this report is related but is not the identical requirement.
Sanitary, storm and water trunks are highly localized to growth areas and can be more
readily allocated in this regard than other services such as services related to a
highway, which do not have a fixed service area.
Where existing development has an adequate service level which will not be tangibly
increased by an increase in service, no benefit would appear to be involved. For
example, where expanding existing library facilities simply replicates what existing
residents are receiving, they receive very limited (or no) benefit as a result. On the
other hand, where a clear existing service problem is to be remedied, a deduction
should be made accordingly.
In the case of services such as recreation facilities, community parks, libraries, etc., the
service is typically provided on a Town-wide system basis. For example, facilities of the
same type may provide different services (i.e. leisure pool vs. competitive pool),
different programs (i.e. hockey vs. figure skating) and different time availability for the
same service (i.e. leisure skating available on Wednesday in one arena and Thursday in
another). As a result, residents will travel to different facilities to access the services
they want at the times they wish to use them, and facility location generally does not
correlate directly with residence location. Even where it does, displacing users from an
existing facility to a new facility frees up capacity for use by others and generally results
in only a very limited benefit to existing development. Further, where an increase in
demand is not met for a number of years, a negative service impact to existing
development is involved for a portion of the planning period.

Watson & Associates Economists Ltd. PAGE 4-13 H:\Lakeshore\2020 DC\Report\Final Report.docx
4.9.4 Reduction for Anticipated Grants, Subsidies and Other Contributions
This step involves reducing the capital costs necessary to provide the increased
services by capital grants, subsidies and other contributions (including direct developer
contributions required due to the local service policy) made or anticipated by Council
and in accordance with various rules such as the attribution between the share related
to new vs. existing development. That is, some grants and contributions may not
specifically be applicable to growth or where Council targets fundraising as a measure
to offset impacts on taxes (O. Reg. 82/98 section 6).
4.10 Municipal-wide vs. Area Rating
This step involves determining whether all of the subject costs are to be recovered on a
uniform municipal-wide basis or whether some or all are to be recovered on an area-
specific basis. Under the amended D.C.A., it is now mandatory to “consider” area-rating
of services (providing charges for specific areas and services), however, it is not
mandatory to implement area-rating. Further discussion is provided in section 7.4.4.
4.11 Allocation of Development
This step involves relating the costs involved to anticipated development for each period
under consideration and using allocations between residential and non-residential
development and between one type of development and another, to arrive at a schedule
of charges.
4.12 Asset Management
The new legislation now requires that a D.C. background study must include an asset
management plan (subsection 10 (2) c. 2). The asset management plan (A.M.P.) must
deal with all assets that are proposed to be funded, in whole or in part, by D.C.s. The
current regulations provide very extensive and specific requirements for the A.M.P.
related to transit services (as noted in the subsequent subsection); however, they are
silent with respect to how the A.M.P. is to be provided for all other services. As part of
any A.M.P., the examination should be consistent with the municipality’s existing
Watson & Associates Economists Ltd. PAGE 4-14 H:\Lakeshore\2020 DC\Report\Final Report.docx
assumptions, approaches and policies on the asset management planning. This
examination has been included in Appendix F.
4.13 Transit
The most significant changes to the Act relate to the transit service. These changes
relate to four areas of the calculations, as follows:
A. Transit no longer requires the statutory 10% mandatory deduction from the net
capital cost (subsection 5.2 (i) of the D.C.A.).
B. The background study requires the following in regard to transit costs (as per
subsection 8 (2) of the Regulations):
1. The calculations that were used to prepare the estimate for the planned level
of service for the transit services, as mentioned in subsection 5.2 (3) of the
Act.
2. An identification of the portion of the total estimated capital cost relating to the
transit services that would benefit,
i. the anticipated development over the 10-year period immediately
following the preparation of the background study, or
ii. the anticipated development after the 10-year period immediately
following the preparation of the background study.
3. An identification of the anticipated excess capacity that would exist at the end
of the 10-year period immediately following the preparation of the background
study.
4. An assessment of ridership forecasts for all modes of transit services
proposed to be funded by the development charge over the 10-year period
immediately following the preparation of the background study, categorized
by development types, and whether the forecasted ridership will be from
existing or planned development.
Watson & Associates Economists Ltd. PAGE 4-15 H:\Lakeshore\2020 DC\Report\Final Report.docx
5. An assessment of the ridership capacity for all modes of transit services
proposed to be funded by the development charge over the 10-year period
immediately following the preparation of the background study.
C. A new forward-looking service standard (as per subsection 6.1 (2) of the
Regulations):
1. The service is a discrete service.
2. No portion of the service that is intended to benefit anticipated development
after the 10-year period immediately following the preparation of the
background study may be included in the estimate.
3. No portion of the service that is anticipated to exist as excess capacity at the
end of the 10-year period immediately following the preparation of the
background study may be included in the estimate.
D. A very detailed asset management strategy and reporting requirements
(subsection 6.1 (3) of the Regulation) that includes lifecycle costs, action plans
that will enable the assets to be sustainable, summary of how to achieve the
proposed level of service, discussion on procurement measures and risk.
The Town does not currently, and in the near future does not intend to, provide transit
services. Therefore, the above calculations and reporting requirements are not
required.

Watson & Associates Economists Ltd. H:\Lakeshore\2020 DC\Report\Final Report.docx
Chapter 5 D.C.-Eligible Cost Analysis byService

Watson & Associates Economists Ltd. PAGE 5-1 H:\Lakeshore\2020 DC\Report\Final Report.docx
5. D.C.-Eligible Cost Analysis by Service
5.1 Introduction
This chapter outlines the basis for calculating eligible costs for the D.C.s to be applied
on a uniform basis. In each case, the required calculation process set out in subsection
5 (1) paragraphs 2 to 7 in the D.C.A. and described in Chapter 4, was followed in
determining D.C.-eligible costs.
The nature of the capital projects and timing identified in the Chapter reflects Council’s
current intention. Over time, however, Town projects and Council priorities change and
accordingly, Council’s intentions may alter and different capital projects (and timing)
may be required to meet the need for services required by new growth.
5.2 Service Levels and 10-Year Capital Costs for D.C. Calculation
This section evaluates the development-related capital requirements for all of the
“softer” services over a 10-year planning period. Each service component is evaluated
on two format sheets: the average historical 10-year level of service calculation (see
Appendix B), which “caps” the D.C. amounts; and, the infrastructure cost calculation,
which determines the potential D.C. recoverable cost.
Watson & Associates Economists Ltd. PAGE 5-2 H:\Lakeshore\2020 DC\Report\Final Report.docx
5.2.1 Growth Studies
The D.C.A. permits the inclusion of studies undertaken to facilitate the completion of the
Town’s capital works program. As discussed in Section 4.7, these studies have been
allocated as a class of services based on each service to which the study relates.
For planning related studies, a deduction of 10% has been applied to recognize the
extent to which the studies relate to non-D.C.-eligible services. All planning studies
have been allocated to the classes of services in the following manner:
• Services Related to a Highway – 25%
• Water – 25%
• Wastewater – 25%
• Fire – 8%
• Police – 8%
• Parks and Recreation – 9%.
The following provides a list of the planning studies included in the calculations:
• Facility Master Plan;
• Official Plan and Zoning By-law Amendment;
• Emeryville Secondary Plan; and
• Lighthouse Cove Secondary Plan.
In addition, the capital cost of D.C. background studies has been allocated across the
different services based on the proportion of the total net growth-related capital costs.
The following provides a breakdown of the allocation of D.C. background studies to
each service:
• Fire – 3%
• Parks and Recreation – 6%
• Services Related to a Highway – 27%
• Water – 19%; and
• Wastewater – 45%.

Watson & Associates Economists Ltd. PAGE 5-3 H:\Lakeshore\2020 DC\Report\Final Report.docx
The remainder of the growth studies identified are as follows:
• Transportation Master Plan – Services Related to a Highway;
• Water Master Plan – Water Services;
• Wastewater Master Plan – Wastewater Services;
• Stormwater Management Master Plan – Services Related to a Highway;
• Fire Station Master Plan Update – Fire Services;
• Parks and Recreation Master Plan – Parks and Recreation Services;
• A.T.C. Regional Parks Plan – Parks and Recreation Services;
• Comber Community Centre Master Plan - Parks and Recreation Services; and
• Belle River Marina/Lakeview Park Master Plan - Parks and Recreation Services.
The cost of these studies is $2,291,000 of which $670,610 is attributable to existing
benefit. A deduction of $80,620 has been made to recognize the portion of planning
studies related to D.C.-ineligible services, as mentioned above. The existing reserve
fund balance of $155,299 has been deducted resulting in a net D.C.-eligible cost of
$1,384,571 to be included in the calculations.
These costs have been allocated 66% residential and 34% non-residential based on the
incremental growth in population to employment for the 10-year forecast period.
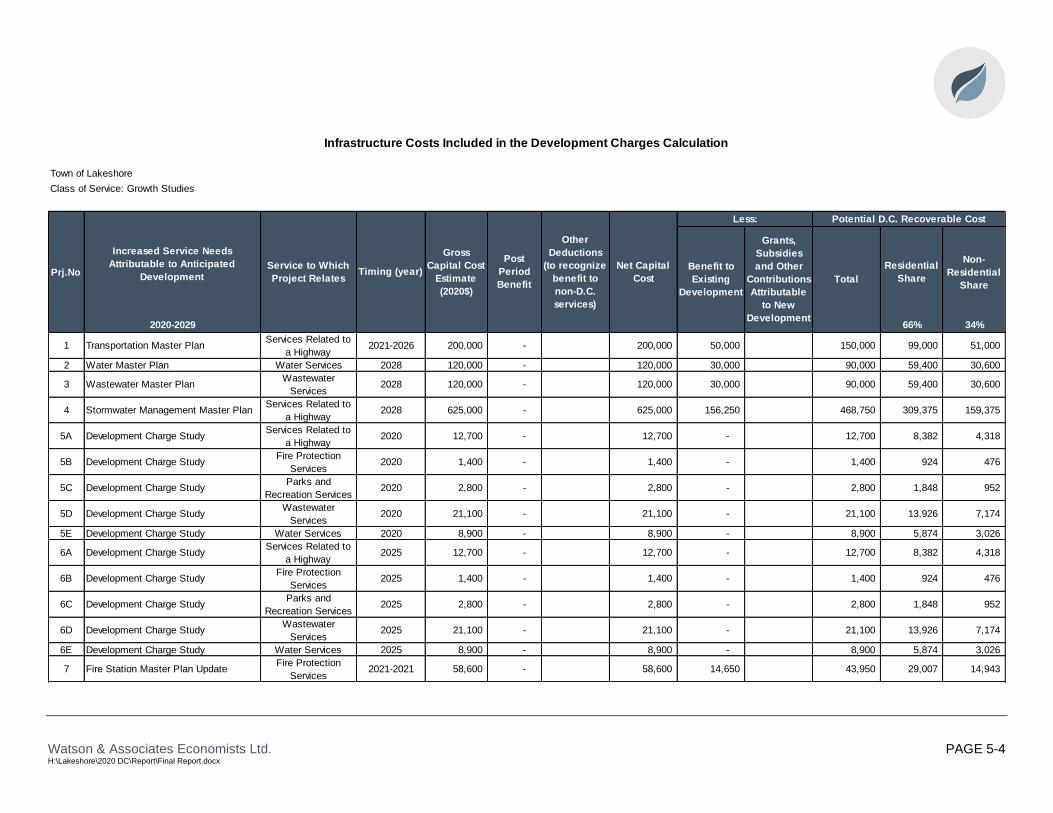
Watson & Associates Economists Ltd. PAGE 5-4 H:\Lakeshore\2020 DC\Report\Final Report.docx
Infrastructure Costs Included in the Development Charges Calculation
Town of Lakeshore
Class of Service: Growth Studies
Prj.NoService to Which
Project Relates
Residential
Share
Non-
Residential
Share
2020-2029 66% 34%
1 Transportation Master PlanServices Related to
a Highway2021-2026 200,000 - 200,000 50,000 150,000 99,000 51,000
2 Water Master Plan Water Services 2028 120,000 - 120,000 30,000 90,000 59,400 30,600
3 Wastewater Master PlanWastewater
Services2028 120,000 - 120,000 30,000 90,000 59,400 30,600
4 Stormwater Management Master PlanServices Related to
a Highway2028 625,000 - 625,000 156,250 468,750 309,375 159,375
5A Development Charge StudyServices Related to
a Highway2020 12,700 - 12,700 - 12,700 8,382 4,318
5B Development Charge StudyFire Protection
Services2020 1,400 - 1,400 - 1,400 924 476
5C Development Charge StudyParks and
Recreation Services2020 2,800 - 2,800 - 2,800 1,848 952
5D Development Charge StudyWastewater
Services2020 21,100 - 21,100 - 21,100 13,926 7,174
5E Development Charge Study Water Services 2020 8,900 - 8,900 - 8,900 5,874 3,026
6A Development Charge StudyServices Related to
a Highway2025 12,700 - 12,700 - 12,700 8,382 4,318
6B Development Charge StudyFire Protection
Services2025 1,400 - 1,400 - 1,400 924 476
6C Development Charge StudyParks and
Recreation Services2025 2,800 - 2,800 - 2,800 1,848 952
6D Development Charge StudyWastewater
Services2025 21,100 - 21,100 - 21,100 13,926 7,174
6E Development Charge Study Water Services 2025 8,900 - 8,900 - 8,900 5,874 3,026
7 Fire Station Master Plan UpdateFire Protection
Services2021-2021 58,600 - 58,600 14,650 43,950 29,007 14,943
Gross
Capital Cost
Estimate
(2020$)
Increased Service Needs
Attributable to Anticipated
DevelopmentTiming (year)
Post
Period
Benefit
Other
Deductions
(to recognize
benefit to
non-D.C.
services)
Net Capital
Cost
Less:
Benefit to
Existing
Development
Grants,
Subsidies
and Other
Contributions
Attributable
to New
Development
Total
Potential D.C. Recoverable Cost

Watson & Associates Economists Ltd. PAGE 5-5 H:\Lakeshore\2020 DC\Report\Final Report.docx
Infrastructure Costs Included in the Development Charges Calculation
Town of Lakeshore
Class of Service: Growth Studies
Prj.NoService to Which
Project Relates
Residential
Share
Non-
Residential
Share
2020-2029 66% 34%
8A Facility Master PlanFire Protection
Services2027 12,640 - 1,260 11,380 6,320 5,060 3,340 1,720
8B Facility Master Plan Policing Services 2027 12,640 - 1,260 11,380 6,320 5,060 3,340 1,720
8C Facility Master PlanParks and
Recreation Services2027 14,220 - 1,420 12,800 7,110 5,690 3,755 1,935
8D Facility Master PlanServices Related to
a Highway2027 39,500 - 3,950 35,550 19,750 15,800 10,428 5,372
8E Facility Master Plan Water Services 2027 39,500 - 3,950 35,550 19,750 15,800 10,428 5,372
8F Facility Master PlanWastewater
Services2027 39,500 - 3,950 35,550 19,750 15,800 10,428 5,372
9 Parks and Recreation Master PlanParks and
Recreation Services2025-2029 58,600 - 58,600 43,950 14,650 9,669 4,981
10AOfficial Plan and Zoning By-law
Amendment
Fire Protection
Services2020-2025 28,400 - 2,840 25,560 7,100 18,460 12,184 6,276
10BOfficial Plan and Zoning By-law
AmendmentPolicing Services 2020-2025 28,400 - 2,840 25,560 7,100 18,460 12,184 6,276
10COfficial Plan and Zoning By-law
Amendment
Parks and
Recreation Services2020-2025 31,950 - 3,200 28,750 7,990 20,760 13,702 7,058
10DOfficial Plan and Zoning By-law
Amendment
Services Related to
a Highway2020-2025 88,750 - 8,880 79,870 22,190 57,680 38,069 19,611
10EOfficial Plan and Zoning By-law
AmendmentWater Services 2020-2025 88,750 - 8,880 79,870 22,190 57,680 38,069 19,611
10FOfficial Plan and Zoning By-law
Amendment
Wastewater
Services2020-2025 88,750 - 8,880 79,870 22,190 57,680 38,069 19,611
11A Emeryville Secondary PlanFire Protection
Services2020-2021 4,160 - 420 3,740 1,040 2,700 1,782 918
11B Emeryville Secondary Plan Policing Services 2020-2021 4,160 - 420 3,740 1,040 2,700 1,782 918
11C Emeryville Secondary PlanParks and
Recreation Services2020-2021 4,680 - 470 4,210 1,170 3,040 2,006 1,034
Gross
Capital Cost
Estimate
(2020$)
Increased Service Needs
Attributable to Anticipated
DevelopmentTiming (year)
Post
Period
Benefit
Other
Deductions
(to recognize
benefit to
non-D.C.
services)
Net Capital
Cost
Less:
Benefit to
Existing
Development
Grants,
Subsidies
and Other
Contributions
Attributable
to New
Development
Total
Potential D.C. Recoverable Cost

Watson & Associates Economists Ltd. PAGE 5-6 H:\Lakeshore\2020 DC\Report\Final Report.docx
Infrastructure Costs Included in the Development Charges Calculation
Town of Lakeshore
Class of Service: Growth Studies
Prj.NoService to Which
Project Relates
Residential
Share
Non-
Residential
Share
2020-2029 66% 34%
11D Emeryville Secondary PlanServices Related to
a Highway2020-2021 13,000 - 1,300 11,700 3,250 8,450 5,577 2,873
11E Emeryville Secondary Plan Water Services 2020-2021 13,000 - 1,300 11,700 3,250 8,450 5,577 2,873
11F Emeryville Secondary PlanWastewater
Services2020-2021 13,000 - 1,300 11,700 3,250 8,450 5,577 2,873
12A Lighthouse Cover Secondary PlanFire Protection
Services2020-2021 19,200 - 1,920 17,280 4,800 12,480 8,237 4,243
12B Lighthouse Cover Secondary Plan Policing Services 2020-2021 19,200 - 1,920 17,280 4,800 12,480 8,237 4,243
12C Lighthouse Cover Secondary PlanParks and
Recreation Services2020-2021 21,600 - 2,160 19,440 5,400 14,040 9,266 4,774
12D Lighthouse Cover Secondary PlanServices Related to
a Highway2020-2021 60,000 - 6,000 54,000 15,000 39,000 25,740 13,260
12E Lighthouse Cover Secondary Plan Water Services 2020-2021 60,000 - 6,000 54,000 15,000 39,000 25,740 13,260
12F Lighthouse Cover Secondary PlanWastewater
Services2020-2021 60,000 - 6,000 54,000 15,000 39,000 25,740 13,260
13 ATC Regional Parks PlanParks and
Recreation Services2020-2021 100,000 - 100,000 50,000 50,000 33,000 17,000
14Comber Community Centre Master
Plan
Parks and
Recreation Services2020-2029 30,000 - 30,000 15,000 15,000 9,900 5,100
15Belle River Marina/Lakeview Park
Master Plan
Parks and
Recreation Services2020-2029 80,000 - 80,000 40,000 40,000 26,400 13,600
16 Reserve Fund Adjustment - - - 155,299 (155,299) (102,498) (52,802)
2,291,000 - 80,520 2,210,480 825,909 - 1,384,571 913,817 470,754
Gross
Capital Cost
Estimate
(2020$)
Increased Service Needs
Attributable to Anticipated
DevelopmentTiming (year)
Post
Period
Benefit
Other
Deductions
(to recognize
benefit to
non-D.C.
services)
Net Capital
Cost
Less:
Benefit to
Existing
Development
Grants,
Subsidies
and Other
Contributions
Attributable
to New
Development
Total
Potential D.C. Recoverable Cost

Watson & Associates Economists Ltd. PAGE 5-7 H:\Lakeshore\2020 DC\Report\Final Report.docx
5.2.2 Library Services
The Town currently provides four library facilities which total 12,750 sq.ft. in library
space. Based on the space provided over the past 10 years, the historical average
level of service provided by the Town equates to an investment of $85 per capita. This
level of service provides the Town with a maximum D.C.-eligible amount for recovery
over the forecast period of $385,207.
The Town has advised that no further facility space has been identified at this time. As
such, no D.C. for library services has been calculated.
While library services are predominantly residential based, there is some use of the
facilities by non-residential users, for the purpose of research. To acknowledge this
use, the capital costs would be allocated 95% residential and 5% non-residential.
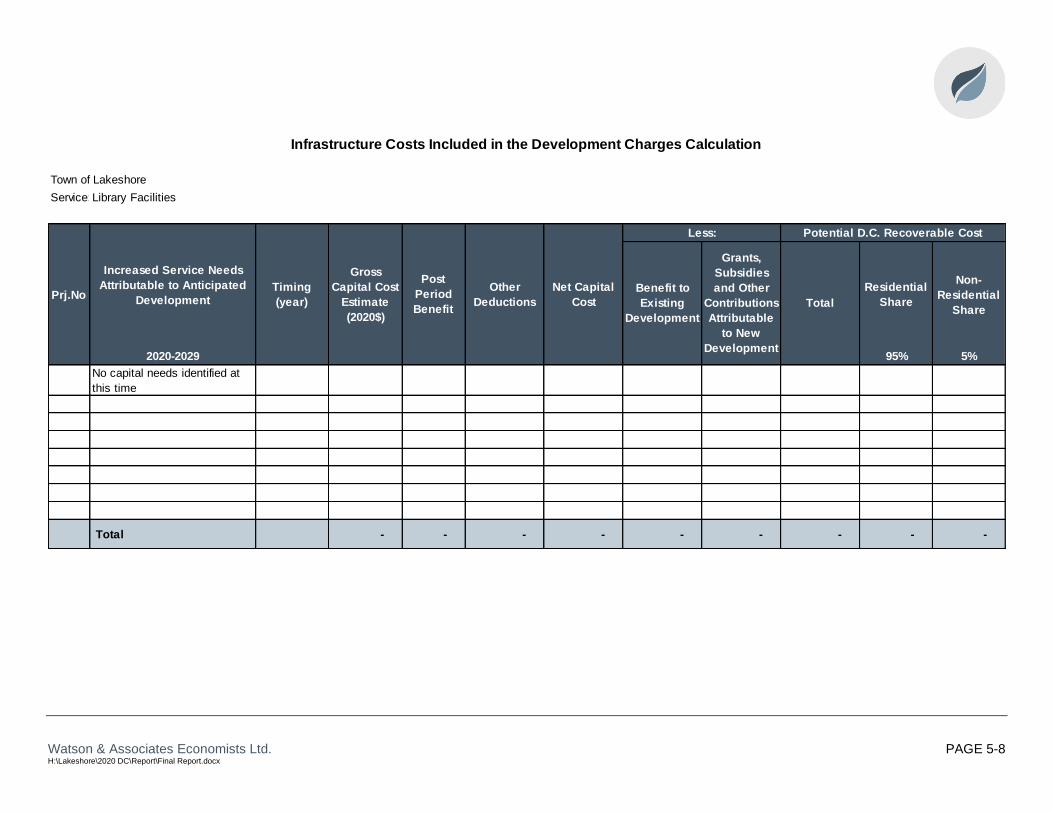
Watson & Associates Economists Ltd. PAGE 5-8 H:\Lakeshore\2020 DC\Report\Final Report.docx
Infrastructure Costs Included in the Development Charges Calculation
Town of Lakeshore
Service:Library Facilities
Prj.NoResidential
Share
Non-
Residential
Share
2020-2029 95% 5%
No capital needs identified at
this time
Total - - - - - - - - -
Net Capital
Cost
Benefit to
Existing
Development
Grants,
Subsidies
and Other
Contributions
Attributable
to New
Development
Total
Less: Potential D.C. Recoverable Cost
Increased Service Needs
Attributable to Anticipated
DevelopmentTiming
(year)
Gross
Capital Cost
Estimate
(2020$)
Post
Period
Benefit
Other
Deductions

Watson & Associates Economists Ltd. PAGE 5-9 H:\Lakeshore\2020 DC\Report\Final Report.docx
5.2.3 Parks and Recreation Services
The Town currently has 347.02 acres of parkland within its jurisdiction. This parkland
consists of various sized parkettes, neighbourhood/community parks and open space
area. The average level of service over the 10-year historical period (2010 to 2019) is
9.6 acres of parkland and 11.8 parkland amenities items per 1,000 population. The
Town also provided an average of 0.5 kilometres of trails per 1,000 population.
Including parkland, parkland amenities (e.g. ball diamonds, playground equipment,
soccer fields, etc.), and park trails, the level of service provided over the historical 10-
year period is approximately $1,109 per capita, which equates to a D.C.-eligible amount
of approximately $5.04 million.
The Town also currently provides 29 parks and recreation vehicles and items of
equipment at a value of approximately $880,000. The average level of service provided
over the previous ten years is 0.7 vehicles and equipment items per 1,000 population or
$21 per capita. This equates to a D.C.-eligible amount of approximately $95,000.
With respect to recreation facilities, the Town of Lakeshore provides services from
205,448 sq.ft. of building space. Over the historic 10-year period, the Town has
provided 4.48 sq.ft. of building space or $1,563 per capita. This level of service equates
to a D.C.-eligible amount of approximately $7.10 million.
When applied over the forecast period, the historic average level of service translates
into a total D.C.-eligible amount of $12,230,879 for parks and recreation services.
Based on the projected growth over the forecast period, the Town has identified
$18,768,600 in future growth capital costs for parkland development. These projects
include the development of additional parks including amenities and trails. A deduction
in the amount of $9,346,000 has been made to account for the benefit to existing
development. In addition, the Town also anticipates the need for two ½ ton trucks, 1
dump truck and 1 utility vehicle to service growth at a gross capital cost of $395,000.
This amount has been included in the calculations. Further, the Town has also
identified the need for Phase 3 of the Atlas Tube Centre, however, as this project is
anticipated to begin outside of the forecast period this is considered 100% benefit to
growth beyond the current forecast period. A deduction of $1,964,754 has been made

Watson & Associates Economists Ltd. PAGE 5-10 H:\Lakeshore\2020 DC\Report\Final Report.docx
to account for the existing reserve fund balance resulting in a net growth capital cost of
$7,852,846. This amount has been included in the D.C. calculations.
As the predominant users of parks and recreation tend to be residents of the Town, the
forecast growth-related costs have been allocated 95% to residential and 5% to non-
residential.
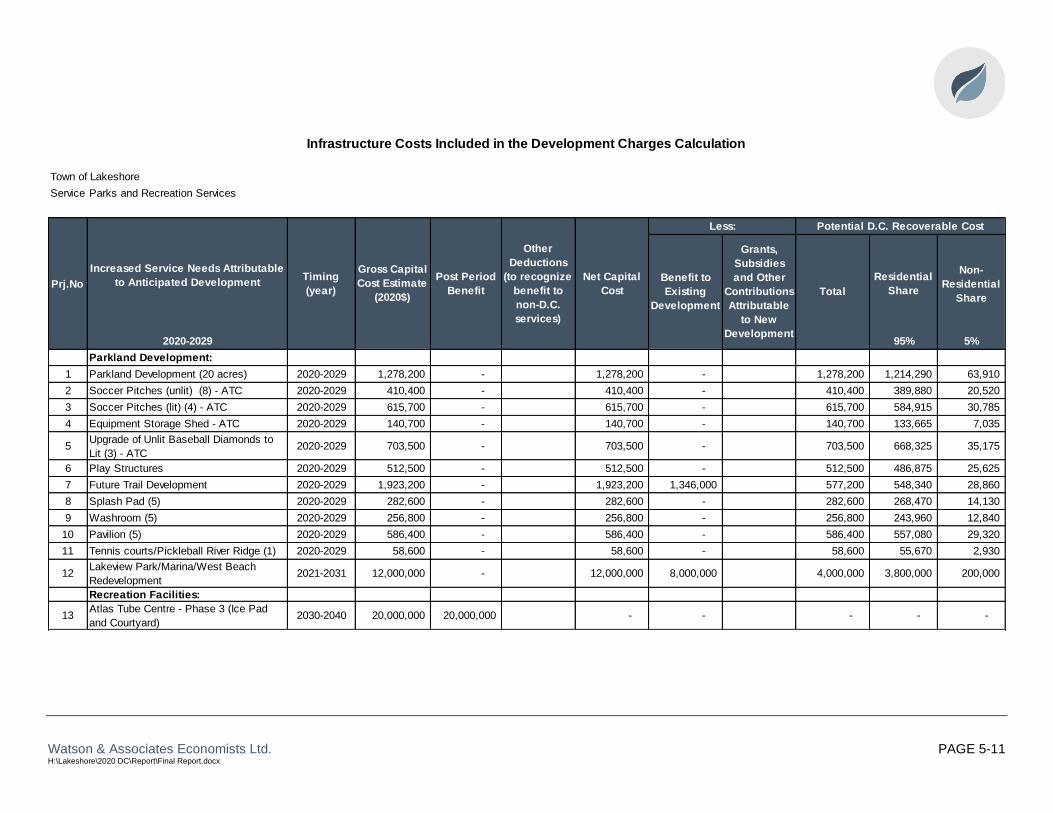
Watson & Associates Economists Ltd. PAGE 5-11 H:\Lakeshore\2020 DC\Report\Final Report.docx
Infrastructure Costs Included in the Development Charges Calculation
Town of Lakeshore
Service:Parks and Recreation Services
Prj.NoResidential
Share
Non-
Residential
Share
2020-2029 95% 5%
Parkland Development:
1 Parkland Development (20 acres) 2020-2029 1,278,200 - 1,278,200 - 1,278,200 1,214,290 63,910
2 Soccer Pitches (unlit) (8) - ATC 2020-2029 410,400 - 410,400 - 410,400 389,880 20,520
3 Soccer Pitches (lit) (4) - ATC 2020-2029 615,700 - 615,700 - 615,700 584,915 30,785
4 Equipment Storage Shed - ATC 2020-2029 140,700 - 140,700 - 140,700 133,665 7,035
5Upgrade of Unlit Baseball Diamonds to
Lit (3) - ATC2020-2029 703,500 - 703,500 - 703,500 668,325 35,175
6 Play Structures 2020-2029 512,500 - 512,500 - 512,500 486,875 25,625
7 Future Trail Development 2020-2029 1,923,200 - 1,923,200 1,346,000 577,200 548,340 28,860
8 Splash Pad (5) 2020-2029 282,600 - 282,600 - 282,600 268,470 14,130
9 Washroom (5) 2020-2029 256,800 - 256,800 - 256,800 243,960 12,840
10 Pavilion (5) 2020-2029 586,400 - 586,400 - 586,400 557,080 29,320
11 Tennis courts/Pickleball River Ridge (1) 2020-2029 58,600 - 58,600 - 58,600 55,670 2,930
12Lakeview Park/Marina/West Beach
Redevelopment2021-2031 12,000,000 - 12,000,000 8,000,000 4,000,000 3,800,000 200,000
Recreation Facilities:
13Atlas Tube Centre - Phase 3 (Ice Pad
and Courtyard)2030-2040 20,000,000 20,000,000 - - - - -
Net Capital
Cost
Benefit to
Existing
Development
Grants,
Subsidies
and Other
Contributions
Attributable
to New
Development
Total
Less: Potential D.C. Recoverable Cost
Increased Service Needs Attributable
to Anticipated DevelopmentTiming
(year)
Gross Capital
Cost Estimate
(2020$)
Post Period
Benefit
Other
Deductions
(to recognize
benefit to
non-D.C.
services)

Watson & Associates Economists Ltd. PAGE 5-12 H:\Lakeshore\2020 DC\Report\Final Report.docx
Infrastructure Costs Included in the Development Charges Calculation
Town of Lakeshore
Service:Parks and Recreation Services
Prj.NoResidential
Share
Non-
Residential
Share
2020-2029 95% 5%
Parks and Recreation Vehicles &
Equipment:
14 2 1/2 ton trucks 2020-2029 85,000 - 85,000 - 85,000 80,750 4,250
15 1 dump truck 2020-2029 280,000 - 280,000 - 280,000 266,000 14,000
16 Utility Vehicle 2020 30,000 - 30,000 - 30,000 28,500 1,500
17 Reserve Fund Adjustment 1,964,754 (1,964,754) (1,866,516) (98,238)
Total 39,163,600 20,000,000 - 19,163,600 11,310,754 - 7,852,846 7,460,204 392,642
Net Capital
Cost
Benefit to
Existing
Development
Grants,
Subsidies
and Other
Contributions
Attributable
to New
Development
Total
Less: Potential D.C. Recoverable Cost
Increased Service Needs Attributable
to Anticipated DevelopmentTiming
(year)
Gross Capital
Cost Estimate
(2020$)
Post Period
Benefit
Other
Deductions
(to recognize
benefit to
non-D.C.
services)

Watson & Associates Economists Ltd. PAGE 5-13 H:\Lakeshore\2020 DC\Report\Final Report.docx
5.3 Service Levels and 20-Year Capital Costs for Lakeshore’s D.C. Calculation
This section evaluates the development-related capital requirements for those services
with 20-year capital costs.
5.3.1 Services Related to a Highway
Lakeshore owns and maintains 364 km of rural and urban, arterial and collector roads.
The Town also owns and maintains 85 km of sidewalks and multi-use pathways as well
as 2,869 streetlights. Over the historic 10-year period, the Town has provided an
average level of investment of $19,688 per capita. Based on this service standard, the
Town would be eligible to collect $163,448,116 from D.C.s over the 20-year forecast
period.
With respect to future growth-related needs, the identified capital projects related to
roads, traffic control, sidewalks, and streetlights total $122,189,400. The capital
projects include various works related to adding capacity to the highway system
including road improvements/expansions, intersection improvements, additional
sidewalks, pathways, and streetlights. Deductions for post-period benefit of
$32,606,900 and existing benefit of $36,743,000 have been made. A further deduction
of $17,049,000 has been made to recognize contributions from developing landowners
through developer agreements. Further, outstanding credits related to IC Roy have
been included in the calculations at an amount of $6,626. Finally, a deduction of
$1,819,404 has been made to account for the existing reserve fund balance resulting in
a net D.C.-eligible amount of $33,976,822 and has been included in the calculations.
The residential/non-residential capital cost allocation for all services related to a
highway is 65% residential and 35% non-residential based on the incremental growth in
population to employment for the 20-year forecast period.

Watson & Associates Economists Ltd. PAGE 5-14 H:\Lakeshore\2020 DC\Report\Final Report.docx
Town of Lakeshore
Service: Services Related to a Highway - Roads
Less:
Prj .NoResidential
Share
Non-
Residential
Share
2020-2039 From To 65% 35%
Arterial/Collector Roads:
1 Little Base Line Rd Wallace Rd Cty Rd 25 2025 8,049,500 - 8,049,500 - 8,049,500 - - -
2 Little Base Line Rd Patillo RoadWallace Line
Rd2028 9,667,800 1,947,600 7,720,200 1,208,500 4,833,900 1,677,800 1,090,570 587,230
3 Little Base Line Rd CR 19 Patillo Rd 2030 27,810,700 11,205,100 16,605,600 6,952,700 9,652,900 6,274,385 3,378,515
4 Patillo Road CPR Tracks Advance 2021 16,667,700 3,357,900 13,309,800 6,250,600 4,166,500 2,892,700 1,880,255 1,012,445
5 Patillo Road Cty Rd 22 Via Tracks 2021 3,461,800 929,900 2,531,900 1,730,900 801,000 520,650 280,350
6 Wallace Road Cty Rd 22 CPR Tracks 2025 6,288,100 2,533,500 3,754,600 1,572,000 2,182,600 1,418,690 763,910
7 Wallace Road CPR Tracks Cty Rd 42 2025 2,201,200 886,900 1,314,300 550,300 764,000 496,600 267,400
8 Wallace Road Cty Rd 22 Cty Rd 2 2021 3,518,100 1,417,500 2,100,600 879,500 1,221,100 793,715 427,385
10 Extension of Silver Creek Silver Creek Street A 2030 355,300 143,200 212,100 88,800 123,300 80,145 43,155
11 North Talbot Road Cty Rd 19 SMR 2030 5,408,500 726,400 4,682,100 4,056,400 625,700 406,705 218,995
12 Lighthouse Cove Access Road Cty Rd 2 Mariners Drive 2034-2039 3,773,800 1,013,700 2,760,100 1,886,900 873,200 567,580 305,620
13 Street A Street D Little Base Line 2030 9,507,100 3,830,500 5,676,600 2,376,800 3,299,800 2,144,870 1,154,930
14 Street A and cul de sacs (.125km) Cty Rd 22 Street D 2030 598,100 241,000 357,100 149,500 207,600 134,940 72,660
NEWAmy Croft Road Widening including
Intersection ImprovementsManning Road
First Set of
Lights2020 3,000,000 - 3,000,000 300,000 2,700,000 1,755,000 945,000
NEW Bridge over Puce River (Oakwood) 2030 10,000,000 - 10,000,000 5,000,000 5,000,000 3,250,000 1,750,000
Traffic Control Devices and Widening
15 Renaud Line Cty Rd 42 2023-2039 192,300 103,300 89,000 - 89,000 57,850 31,150
16 Rourke Line Rd Cty Rd 22 2025 192,300 51,600 140,700 96,200 44,500 28,925 15,575
17 Rourke Line Rd Cty Rd 42 2030 192,300 51,600 140,700 96,200 44,500 28,925 15,575
18 Wallace Rd Cty Rd 22 2025 192,300 77,500 114,800 48,100 66,700 43,355 23,345
19 Wallace Rd Cty Rd 42 2025-2039 192,300 103,300 89,000 - 89,000 57,850 31,150
20 Little Baseline Patillo 2021 192,300 77,500 114,800 48,100 66,700 43,355 23,345
21 Little Baseline Wallace 2028 192,300 77,500 114,800 48,100 66,700 43,355 23,345
22 Street A Cty Rd 22 2030 192,300 77,500 114,800 48,100 66,700 43,355 23,345
23 Manning Road Lanoue 2021 192,300 77,500 114,800 48,100 66,700 43,355 23,345
Sidewalks & Streetlights - -
24 Street A Cty Rd 22 Little Base Line 2030 218,100 87,900 130,200 54,500 75,700 49,205 26,495
25 East Pike Road pathways Tecumseh Rd Cty Rd 22 2030 164,200 66,100 98,100 41,100 57,000 37,050 19,950
26 East Pike Road pathways County Road 2 Little Base Line 2030 164,200 66,100 98,100 41,100 57,000 37,050 19,950
27 Elmstead Road (E Pike/Cty Rd 21) Little Base Line Cty Rd 42 2034-2039 496,100 266,500 229,600 - 229,600 149,240 80,360
28 Little Base Line pathways 1/sidewalk 1 Manning Road Wallace 2030 1,241,900 500,400 741,500 310,500 431,000 280,150 150,850
29 Little Base Line pathways 1/sidewalk 1 Wallace Cty Rd 25 2030 1,791,900 722,000 1,069,900 448,000 621,900 404,235 217,665
30 Patillo Road - sidewalk&pathway CPR tracks Cty Rd 22 2021 289,700 77,800 211,900 144,900 67,000 43,550 23,450
31 Patillo Road pathway Tecumseh Rd Cty Rd 22 2021 136,000 36,500 99,500 68,000 31,500 20,475 11,025
32 Wallace Road pathway County Road 2 Cty Rd 22 2021 64,500 26,000 38,500 16,100 22,400 14,560 7,840
Infrastructure Costs Included in the Development Charges Calculation
Net Capital
CostBenefit to
Existing
Development
Grants, Subsidies
and Other
Contributions
Attributable to New
Development*
Total
Potential D.C. Recoverable Cost
Increased Service Needs Attributable to
Anticipated DevelopmentTiming
(year)
Gross Capital
Cost Estimate
(2020$)
Post Period
Benefit
Other
Deductions
(to recognize
benefit to
non-D.C.
services)
Location

Watson & Associates Economists Ltd. PAGE 5-15 H:\Lakeshore\2020 DC\Report\Final Report.docx
Town of Lakeshore
Service: Services Related to a Highway - Roads
Less:
Prj .NoResidential
Share
Non-
Residential
Share
2020-2039 From To 65% 35%
33 Wallace Road pathway 1/sidewalk 1 County Road 2 Cty Rd 22 2025 408,100 164,400 243,700 102,000 141,700 92,105 49,595
34 Wallace Road pathway CPR tracks Cty Rd 42 2025 154,800 62,400 92,400 38,700 53,700 34,905 18,795
35 West Puce Road pathway Cty Rd 22 Cty Rd 42 2034-2039 424,500 171,000 253,500 106,100 147,400 95,810 51,590
36 Tecumseh Road pathway Charron LineRochester
Place2025 759,900 306,200 453,700 190,000 263,700 171,405 92,295
37 Ruscom river pathway e&w sides Cty Rd 2 GTPerdu park 2025 1,600,700 429,900 1,170,800 800,400 370,400 240,760 129,640
Comber Area (master plan) - - - - - - -
40 Middle Road/CR 46 pathway Conrail Raymond Road 2035 219,300 58,900 160,400 109,700 50,700 32,955 17,745
Woodslee Area (master plan) - -
41 West Belle River Rd pathway North Rear Rd County Road 46 2030 160,700 43,100 117,600 80,400 37,200 24,180 13,020
42 County Road 46 pathwayW Belle River
RdCounty Road 27 2030 65,700 17,600 48,100 32,900 15,200 9,880 5,320
43 County Road 27 pathway County Road 46South Middle
Rd2030 219,300 58,900 160,400 109,700 50,700 32,955 17,745
County Roads (master plan)
44 County Road 22 pathway 1/sidewalk 1East Puce River
Rd.Renaud Line 2020 880,700 236,500 644,200 440,400 203,800 132,470 71,330
45 County Road 22 pathway 1/sidewalk 1 Renaud Rourke 2025 313,100 126,100 187,000 78,300 108,700 70,655 38,045
46 County Road 22 pathway 1/sidewalk 1 RourkeW Belle River
Rd2030 377,600 152,100 225,500 94,400 131,100 85,215 45,885
Credits
47 IC Royagreement
credits6,626 - 6,626 - 6,626 4,307 2,319
Reserve Fund Adjustment 1,819,404 (1,819,404) (1,182,613) (636,791)
Total 122,196,026 32,606,900 - 89,589,126 38,562,404 17,049,900 33,976,822 22,084,934 11,891,888
Infrastructure Costs Included in the Development Charges Calculation
Net Capital
CostBenefit to
Existing
Development
Grants, Subsidies
and Other
Contributions
Attributable to New
Development*
Total
Potential D.C. Recoverable Cost
Increased Service Needs Attributable to
Anticipated DevelopmentTiming
(year)
Gross Capital
Cost Estimate
(2020$)
Post Period
Benefit
Other
Deductions
(to recognize
benefit to
non-D.C.
services)
Location

Watson & Associates Economists Ltd. PAGE 5-16 H:\Lakeshore\2020 DC\Report\Final Report.docx
5.3.2 Public Works (Facilities and Fleet)
As per Section 4.7, a D.C. by-law may provide for any D.C.-eligible service to be
included in a class set out in the by-law. Public Works is proposed as a class of service
comprised of Services Related to a Highway, Water Services, and Wastewater
Services.
The Town operates their Public Works service out of a number of facilities. The
facilities currently provide 32,686 sq.ft. of building area, and over the previous 10-year
period, the average level of service was 0.79 sq.ft. per capita or $146 per capita. The
Town also has a variety of vehicles and major equipment totalling approximately $8.75
million. Over the past 10 years, the historic level of service provides a level of
investment of $242 per capita. This level of service provides the Town with a maximum
D.C.-eligible amount for recovery over the 20-year forecast period of $3,219,017 related
to Public Works.
With respect to future growth-related needs, the identified capital projects include
expansions to public works facilities and additional vehicles and equipment at a gross
capital cost of $8,112,000. $3,984,600 of this amount has been identified as benefitting
growth beyond the forecast period and $911,500 has been identified as benefitting
existing development. The resulting D.C.-recoverable cost is $3,216,000 and has been
included in the calculations.
The residential/non-residential capital cost allocation for facilities and fleet is 65%/35%
which is based on the incremental growth in population to employment for the 20-year
forecast period.
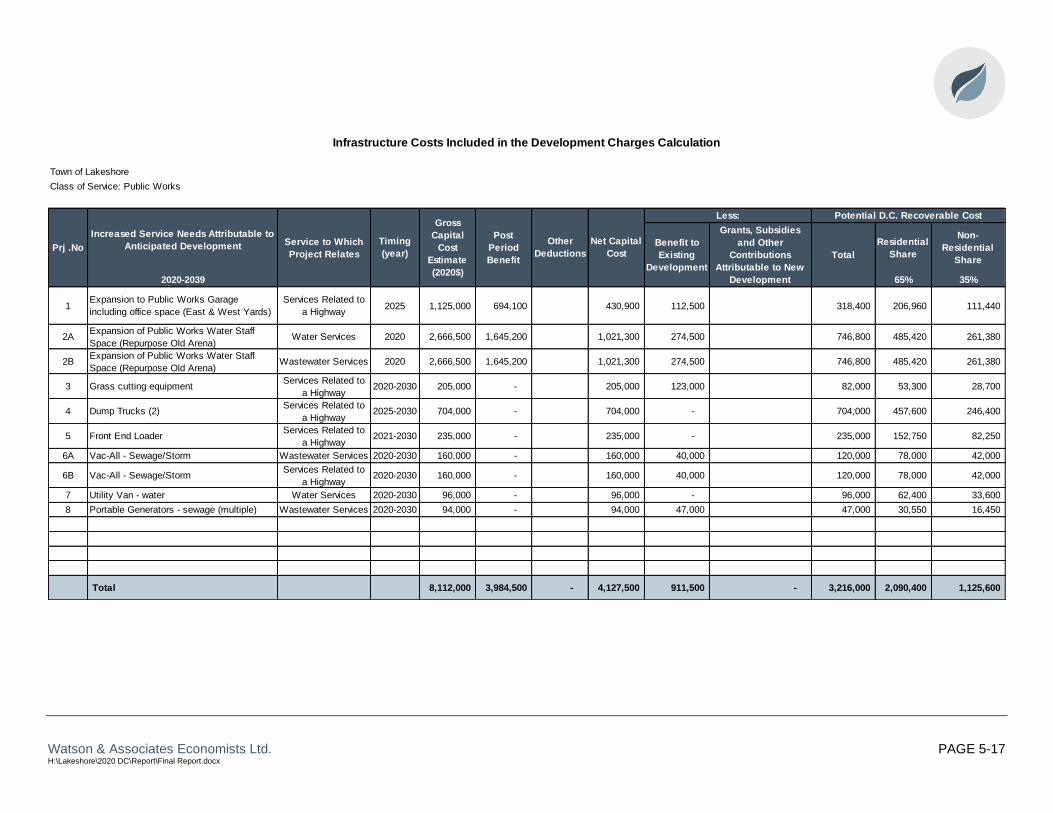
Watson & Associates Economists Ltd. PAGE 5-17 H:\Lakeshore\2020 DC\Report\Final Report.docx
Infrastructure Costs Included in the Development Charges Calculation
Town of Lakeshore
Class of Service: Public Works
Less: Potential D.C. Recoverable Cost
Prj .NoService to Which
Project Relates
Residential
Share
Non-
Residential
Share
2020-2039 65% 35%
1Expansion to Public Works Garage
including office space (East & West Yards)
Services Related to
a Highway2025 1,125,000 694,100 430,900 112,500 318,400 206,960 111,440
2AExpansion of Public Works Water Staff
Space (Repurpose Old Arena)Water Services 2020 2,666,500 1,645,200 1,021,300 274,500 746,800 485,420 261,380
2BExpansion of Public Works Water Staff
Space (Repurpose Old Arena)Wastewater Services 2020 2,666,500 1,645,200 1,021,300 274,500 746,800 485,420 261,380
3 Grass cutting equipmentServices Related to
a Highway2020-2030 205,000 - 205,000 123,000 82,000 53,300 28,700
4 Dump Trucks (2)Services Related to
a Highway2025-2030 704,000 - 704,000 - 704,000 457,600 246,400
5 Front End LoaderServices Related to
a Highway2021-2030 235,000 - 235,000 - 235,000 152,750 82,250
6A Vac-All - Sewage/Storm Wastewater Services 2020-2030 160,000 - 160,000 40,000 120,000 78,000 42,000
6B Vac-All - Sewage/StormServices Related to
a Highway2020-2030 160,000 - 160,000 40,000 120,000 78,000 42,000
7 Utility Van - water Water Services 2020-2030 96,000 - 96,000 - 96,000 62,400 33,600
8 Portable Generators - sewage (multiple) Wastewater Services 2020-2030 94,000 - 94,000 47,000 47,000 30,550 16,450
Total 8,112,000 3,984,500 - 4,127,500 911,500 - 3,216,000 2,090,400 1,125,600
Increased Service Needs Attributable to
Anticipated DevelopmentTiming
(year)
Gross
Capital
Cost
Estimate
(2020$)
Post
Period
Benefit
Other
Deductions
Net Capital
CostBenefit to
Existing
Development
Grants, Subsidies
and Other
Contributions
Attributable to New
Development
Total

Watson & Associates Economists Ltd. PAGE 5-18 H:\Lakeshore\2020 DC\Report\Final Report.docx
5.3.3 Fire Protection Services
The Town currently operates its fire services from five stations with a combined square
footage of 17,271. Over the historic 10-year period, the per capita average level of
service was 0.48 sq.ft. or $183 per capita. This level of service provides the Town with
a maximum D.C.-eligible amount for recovery over the forecast period of $1,517,606.
The Town has a current inventory of 18 vehicles including fire engines, trucks and
tankers. The historic 10-year level of service equates to a level of investment of $254
per capita which translates into a D.C.-eligible amount of $2,107,380.
In addition to vehicles, the fire service also has a variety of small equipment and gear
such as firefighters gear, defibrillators, radios, etc. The Town has a current inventory of
507 items and over the past 10 years the Town has provided an average level of
investment of $53 per capita. This results in a D.C.-eligible amount of $440,919.
The maximum D.C.-eligible amount for recovery over the 20-year forecast period for fire
services is $4,065,905.
The Town has identified the need for an Additional Station and Training Facility as well
as a new Station #3. Additional vehicles, equipment and gear have also been identified
to service future growth. The gross capital cost for these projects is $9,038,600. A
facility-related deduction of $345,100 has been made to account for the benefit to
growth beyond the 20-year forecast period. A further deduction of $3,049,500 has been
made to account for the share of the costs that benefit existing development. Finally, a
deduction of $1,602,379 has been made to account for the existing reserve fund
balance. This results in a net growth-related capital cost of $4,041,621 to be included in
the calculation.
These costs are shared between residential and non-residential based on the
population to employment ratio over the forecast period, resulting in 65% being
allocated to residential development and 35% being allocated to non-residential
development.

Watson & Associates Economists Ltd. PAGE 5-19 H:\Lakeshore\2020 DC\Report\Final Report.docx
Infrastructure Costs Included in the Development Charges Calculation
Town of Lakeshore
Service: Fire Services
Less: Potential D.C. Recoverable Cost
Prj .NoResidential
Share
Non-Residential
Share
2020-2039 65% 35%
Fire Stations
1Wallace Woods Station and
Training Facility2025-2038 4,000,000 192,000 3,808,000 1,430,000 2,378,000 1,545,700 832,300
2 New Station #3 2026-2039 3,190,000 153,100 3,036,900 1,570,500 1,466,400 953,160 513,240
Fire Vehicles
3 Fire Prevention Officer Vehicle 2021 35,000 - 35,000 17,500 17,500 11,375 6,125
4 1/2 Ton 4x4 Truck 2020-2025 63,000 - 63,000 31,500 31,500 20,475 11,025
5 100' Aerial Platform 2025-2029 1,572,600 - 1,572,600 - 1,572,600 1,022,190 550,410
Fire Equipment and Gear
6 Bunker Gear Wash/Extractor 2020-2025 30,000 - 30,000 - 30,000 19,500 10,500
7Large Positive Pressure
Ventilation Fan2020-2039 8,000 - 8,000 - 8,000 5,200 2,800
8 SCBA Air Packs (5) 2025 35,000 - 35,000 - 35,000 22,750 12,250
9 New Fulltime Fire Staff Gear (15) 2025-2039 105,000 - 105,000 - 105,000 68,250 36,750
Reserve Fund Adjustment 1,602,379 (1,602,379) (1,041,546) (560,833)
Total 9,038,600 345,100 0 8,693,500 4,651,879 0 4,041,621 2,627,054 1,414,567
Increased Service Needs
Attributable to Anticipated
Development
Timing
(year)Benefit to
Existing
Development
Grants, Subsidies
and Other
Contributions
Attributable to
New Development
Total
Post Period
Benefit
Other
Deductions (to
recognize
benefit to non-
D.C. services)
Net Capital Cost
Gross Capital
Cost
Estimate
(2020$)
Watson & Associates Economists Ltd. PAGE 5-20 H:\Lakeshore\2020 DC\Report\Final Report.docx
5.3.4 Policing Services
The Ontario Provincial Police (O.P.P.) service operates from facilities in Belle River and
Comber which provide 6,900 sq.ft. of building area. Over the historic 10-year period,
the average level of investment was $82 per capita. This level of service provides the
Town with a maximum D.C.-eligible amount for recovery over the 20-year forecast
period of $680,930. The Town also provides the O.P.P. with police equipment and gear
with an average per capita of 1 piece of equipment and gear for every 1,000 population.
This amounts to a per capita standard of $8 and a maximum D.C.-eligible amount of
$65,586.
The total maximum D.C.-eligible amount related to Policing services is $746,516.
To service growth over the 20-year forecast period, the Town has identified a provision
to address the need for additional facility space. The gross cost of this provision is
$600,000. As this provision represents the growth-related costs over the forecast
period, no deductions are required, and this amount is included in the D.C. calculations.
The costs for policing services are shared 65%/35% between residential and non-
residential based on the population to employment ratio over the 20-year forecast
period.
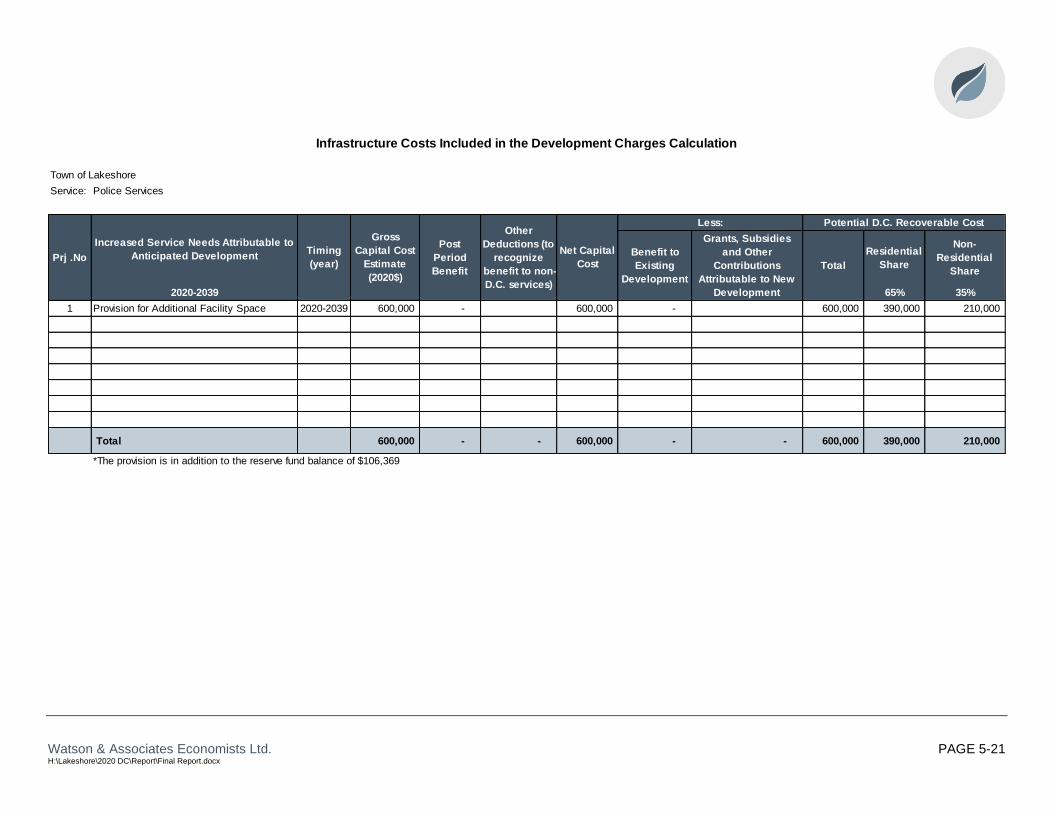
Watson & Associates Economists Ltd. PAGE 5-21 H:\Lakeshore\2020 DC\Report\Final Report.docx
Infrastructure Costs Included in the Development Charges Calculation
Town of Lakeshore
Service: Police Services
Less: Potential D.C. Recoverable Cost
Prj .NoResidential
Share
Non-
Residential
Share
2020-2039 65% 35%
1 Provision for Additional Facility Space 2020-2039 600,000 - 600,000 - 600,000 390,000 210,000
Total 600,000 - - 600,000 - - 600,000 390,000 210,000
*The provision is in addition to the reserve fund balance of $106,369
Other
Deductions (to
recognize
benefit to non-
D.C. services)
Increased Service Needs Attributable to
Anticipated DevelopmentTiming
(year)
Gross
Capital Cost
Estimate
(2020$)
Post
Period
Benefit
Net Capital
CostBenefit to
Existing
Development
Grants, Subsidies
and Other
Contributions
Attributable to New
Development
Total

Watson & Associates Economists Ltd. PAGE 5-22 H:\Lakeshore\2020 DC\Report\Final Report.docx
5.4 Service Levels and Urban 20-Year Capital Costs for Lakeshore’s D.C. Calculation
This section evaluates the development-related capital requirements for those services
with urban 20-year capital costs.
In 2018, the Town (with Stantec Consulting Ltd. and CH2M Hill Canada Limited)
completed a water and wastewater master plan update which identified Town-wide
capital needs. Further, in 2019 an Environmental Assessment was completed for the
Denis St. Pierre Water Pollution Control Plan Expansion. The following sections utilized
the information from these studies along with discussions with staff to form the capital
needs for the forecast period.
5.4.1 Water Services
The Town has identified several growth-related capital projects related to water
distribution services. These projects include new watermains and replacement of
existing mains with upsized mains in order to service growth. The total gross capital
cost related to these projects is $15,948,900. A deduction in the amount of $999,700
has been made to account for the share of the costs that benefit growth beyond the
forecast period. A further deduction of $6,913,800 has been made to account for the
benefit to existing development, resulting in a net D.C.-recoverable cost of $8,035,400.
In addition to the water distribution infrastructure, growth-related projects related to
water facilities in the amount of $34,368,457 have been identified. This amount
includes new water towers, a water treatment plant expansion in Stoney Point and
growth-related debt for the Belle River water treatment plant and tower. A deduction of
$9,805,600 has been made to account for the post period benefit and $8,622,600 has
been deducted to account for the benefit to existing development. After an adjustment
of $735,983 to recognize the existing reserve fund balance, a net growth-related capital
cost of $15,204,273 has been included in the D.C. calculations.
The total growth-related capital cost for water services included in the D.C. is
$23,239,673.
Watson & Associates Economists Ltd. PAGE 5-23 H:\Lakeshore\2020 DC\Report\Final Report.docx
The costs for all water services are shared 65%/35% between residential and non-
residential based on the population to employment ratio over the urban 20-year forecast
period.

Watson & Associates Economists Ltd. PAGE 5-24 H:\Lakeshore\2020 DC\Report\Final Report.docx
Infrastructure Costs Included in the Development Charges Calculation
Town of Lakeshore
Service: Water Distribution
Residential
Share
Non-
Residential
Share
2020-2039 (Urban) 65% 35%
1Thru Wallace Woods- W Puce to Patillo -
new 600 mm main2023-2025 2,361,100 - 2,361,100 - 2,361,100 1,534,715 826,385
2
Little Baseline-W Pike to E Pike-replace
exist 150&200 with 400mm/Little Baseline-
Stonebrook east 400mm to exist 500mm (2
segments)
2022 955,300 - 955,300 382,100 573,200 372,580 200,620
3Little Baseline-W Pike west to existing
150mm-new 400mm line2026 877,700 - 877,700 367,000 510,700 331,955 178,745
4W Puce-Cty Rd 22 south to exist 600-
replace 300mm with 600mm (North-South)2023 828,000 - 828,000 380,900 447,100 290,615 156,485
5Cty Rd 22-W Puce to Patillo-replace exist
300mm with 400mm2021-2022 2,492,800 - 2,492,800 1,470,500 1,022,300 664,495 357,805
6Schoolhouse Rd-Scott Siderd to Lakeshore
Rd 101-new 150mm watermain2029 357,700 - 357,700 - 357,700 232,505 125,195
7Renaud-Cty Rd 22 to St Clair/Alexander Ave-
Cty Rd 22 to Caille-replace exist 150mm2028 663,500 - 663,500 311,800 351,700 228,605 123,095
8Comber Side Road-St Clair Rd to park
entrance-new 300mm to tower2024-2025 762,300 - 762,300 404,000 358,300 232,895 125,405
9County Rd 35-Tecumseh Rd to Hwy 401-
new 300mm main2030-2035 4,546,500 539,700 4,006,800 2,455,100 1,551,700 1,008,605 543,095
10Construct new 400mm along Wallace Line
Cty Rd 22 to Wallace Woods2023-2024 676,000 174,400 501,600 - 501,600 326,040 175,560
11Cty Rd 22 patillo Rd to West Pike Creek
(replace existing 300 with 400mm)2035-2040 1,428,000 285,600 1,142,400 1,142,400 - - -
Total 15,948,900 999,700 - 14,949,200 6,913,800 - 8,035,400 5,223,010 2,812,390
* Timing of Works may be dependant upon receiving funding assistance which would include developer assistance, grants, etc.
Increased Service Needs Attributable to
Anticipated DevelopmentTiming*
(year)
Gross
Capital Cost
Estimate
(2020$)
Post
Period
Benefit
Other
Deductions
Net Capital
CostBenefit to
Existing
Development
Grants, Subsidies
and Other
Contributions
Attributable to New
Development
Total
Less: Potential D.C. Recoverable Cost
Prj.No
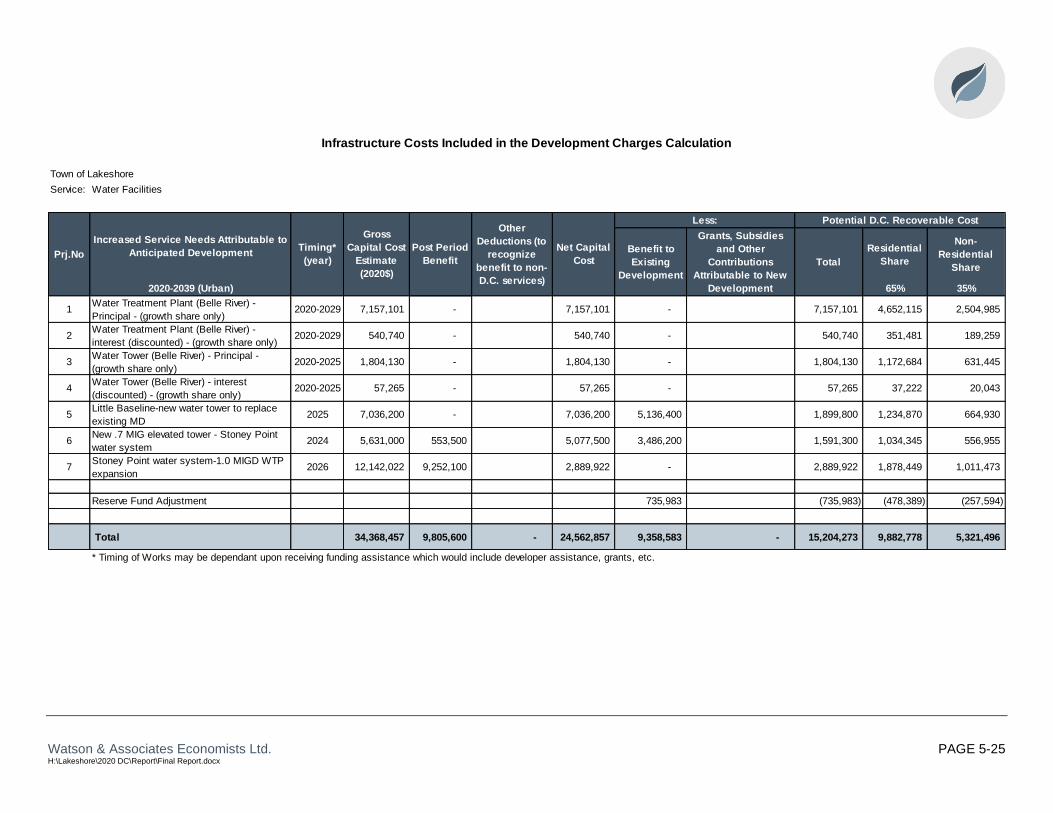
Watson & Associates Economists Ltd. PAGE 5-25 H:\Lakeshore\2020 DC\Report\Final Report.docx
Infrastructure Costs Included in the Development Charges Calculation
Town of Lakeshore
Service: Water Facilities
Residential
Share
Non-
Residential
Share
2020-2039 (Urban) 65% 35%
1Water Treatment Plant (Belle River) -
Principal - (growth share only)2020-2029 7,157,101 - 7,157,101 - 7,157,101 4,652,115 2,504,985
2Water Treatment Plant (Belle River) -
interest (discounted) - (growth share only)2020-2029 540,740 - 540,740 - 540,740 351,481 189,259
3Water Tower (Belle River) - Principal -
(growth share only)2020-2025 1,804,130 - 1,804,130 - 1,804,130 1,172,684 631,445
4Water Tower (Belle River) - interest
(discounted) - (growth share only)2020-2025 57,265 - 57,265 - 57,265 37,222 20,043
5Little Baseline-new water tower to replace
existing MD2025 7,036,200 - 7,036,200 5,136,400 1,899,800 1,234,870 664,930
6New .7 MIG elevated tower - Stoney Point
water system2024 5,631,000 553,500 5,077,500 3,486,200 1,591,300 1,034,345 556,955
7Stoney Point water system-1.0 MIGD WTP
expansion2026 12,142,022 9,252,100 2,889,922 - 2,889,922 1,878,449 1,011,473
Reserve Fund Adjustment 735,983 (735,983) (478,389) (257,594)
Total 34,368,457 9,805,600 - 24,562,857 9,358,583 - 15,204,273 9,882,778 5,321,496
* Timing of Works may be dependant upon receiving funding assistance which would include developer assistance, grants, etc.
Potential D.C. Recoverable Cost
Prj.No
Increased Service Needs Attributable to
Anticipated DevelopmentTiming*
(year)
Gross
Capital Cost
Estimate
(2020$)
Post Period
Benefit
Other
Deductions (to
recognize
benefit to non-
D.C. services)
Net Capital
CostBenefit to
Existing
Development
Grants, Subsidies
and Other
Contributions
Attributable to New
Development
Total
Less:

Watson & Associates Economists Ltd. PAGE 5-26 H:\Lakeshore\2020 DC\Report\Final Report.docx
5.4.2 Wastewater Services
The Town has identified a number of conveyance systems to be included as growth-
related capital projects related to wastewater services. In total, the gross capital cost is
$42,077,500. A deduction of $9,062,500 has been made to account for the benefit to
growth beyond the forecast period in addition to a deduction of $15,329,805 for the
share of the costs attributable to existing development. Therefore, the net D.C-
recoverable cost is $17,685,195.
The Town has also identified growth-related capital costs associated with wastewater
facilities. These items include growth-related principal and interest (discounted)
payments on debt issued for treatment plants in addition to new capital projects. The
gross-capital costs related to these projects is $67,236,870. Deductions for post period
benefit and benefit to existing development have been made in the amounts of
$8,926,700 and $18,214,700, respectively. In addition, $580,877 has also been
deducted from the calculations to account for the existing reserve fund balance resulting
in a D.C.-eligible amount of $39,514,593.
In total, the D.C.-eligible amount included in the calculations for wastewater services is
$57,199,788.
The costs for all wastewater services are shared 65%/35% between residential and
non-residential based on the population to employment ratio over the urban 20-year
forecast period.

Watson & Associates Economists Ltd. PAGE 5-27 H:\Lakeshore\2020 DC\Report\Final Report.docx
Infrastructure Costs Included in the Development Charges Calculation
Town of Lakeshore
Service: Wastewater - Sewers
Residential
Share
Non-
Residential
Share
2020-2039 (Urban) 65% 35%
1Forcemain to transmit wastewater from Comber
to the new STF (Phase 1)2030 4,007,000 337,000 3,670,000 2,203,850 1,466,150 952,998 513,153
2Pump Station to transmit wastewater from
Stoney Point to the new STF (Phase 1)2030 500,000 42,000 458,000 275,000 183,000 118,950 64,050
3
New Pumping Station and forcemain to
transmit sewage from Lighthouse Cove to the
new STF (Phase 1)
2035 2,282,100 191,900 2,090,200 1,255,155 835,045 542,779 292,266
4 Rochester Place conveyance system1 2035 3,192,100 319,200 2,872,900 1,596,050 1,276,850 829,953 446,898
5Belle River/Maidstone Conveyance (Puce to
Manning)2022-2027 13,975,100 1,397,600 12,577,500 6,987,550 5,589,950 3,633,468 1,956,483
6Belle River Rd/N Woodslee/S Woodslee
conveyance2035-2040 10,200,000 2,040,100 8,159,900 - 8,159,900 5,303,935 2,855,965
7 Essex Fringe Conveyance System 2040 3,346,900 334,700 3,012,200 3,012,200 - - -
8Sanitary Trunk Line Cost Sharing Agreement -
CE30476 (09/08/03)0 174,300 - 174,300 - 174,300 113,295 61,005
9 Pike Creek Gravity Collection System 2035-2040 4,400,000 4,400,000 - - - - -
Total 42,077,500 9,062,500 - 33,015,000 15,329,805 - 17,685,195 11,495,377 6,189,818
* Timing of Works may be dependant upon receiving funding assistance which would include developer assistance, grants, etc.
Less: Potential D.C. Recoverable Cost
Prj.No
Increased Service Needs Attributable to
Anticipated DevelopmentTiming*
(year)
Gross Capital
Cost Estimate
(2020$)
Post Period
Benefit
Other
Deductions
Net Capital
CostBenefit to
Existing
Development
Grants, Subsidies
and Other
Contributions
Attributable to New
Development
Total
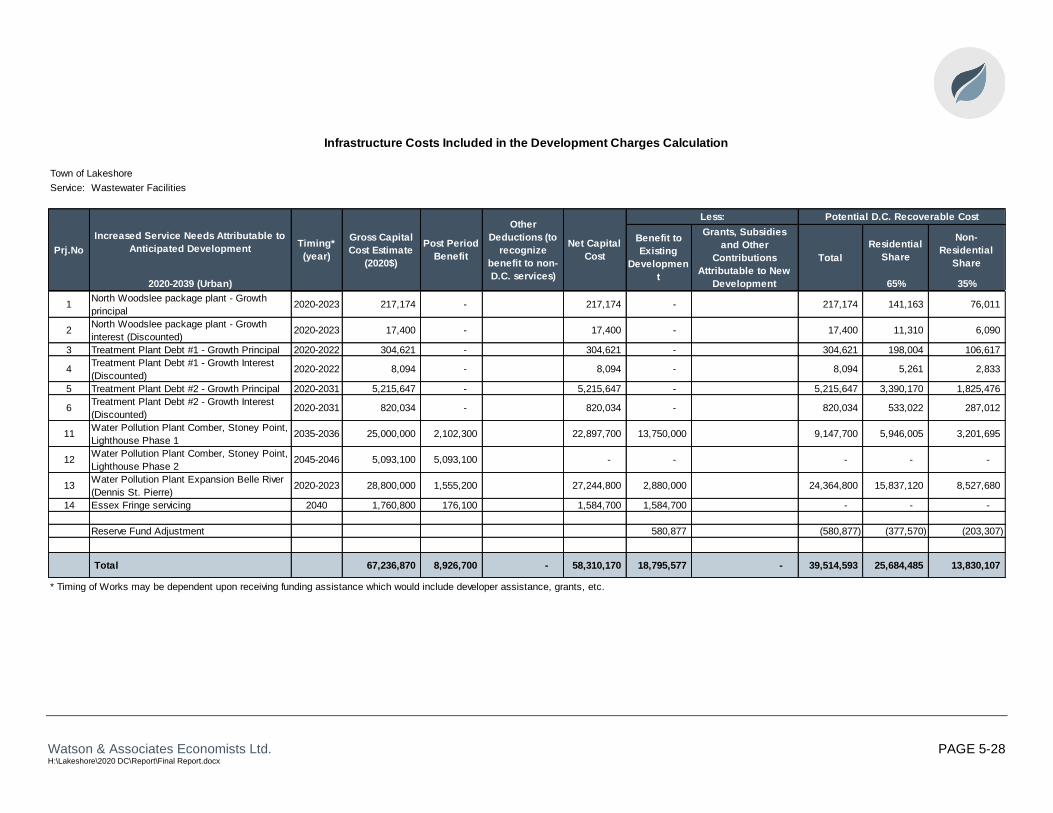
Watson & Associates Economists Ltd. PAGE 5-28 H:\Lakeshore\2020 DC\Report\Final Report.docx
Infrastructure Costs Included in the Development Charges Calculation
Town of Lakeshore
Service: Wastewater Facilities
Residential
Share
Non-
Residential
Share
2020-2039 (Urban) 65% 35%
1North Woodslee package plant - Growth
principal2020-2023 217,174 - 217,174 - 217,174 141,163 76,011
2North Woodslee package plant - Growth
interest (Discounted)2020-2023 17,400 - 17,400 - 17,400 11,310 6,090
3 Treatment Plant Debt #1 - Growth Principal 2020-2022 304,621 - 304,621 - 304,621 198,004 106,617
4Treatment Plant Debt #1 - Growth Interest
(Discounted)2020-2022 8,094 - 8,094 - 8,094 5,261 2,833
5 Treatment Plant Debt #2 - Growth Principal 2020-2031 5,215,647 - 5,215,647 - 5,215,647 3,390,170 1,825,476
6Treatment Plant Debt #2 - Growth Interest
(Discounted)2020-2031 820,034 - 820,034 - 820,034 533,022 287,012
11Water Pollution Plant Comber, Stoney Point,
Lighthouse Phase 12035-2036 25,000,000 2,102,300 22,897,700 13,750,000 9,147,700 5,946,005 3,201,695
12Water Pollution Plant Comber, Stoney Point,
Lighthouse Phase 22045-2046 5,093,100 5,093,100 - - - - -
13Water Pollution Plant Expansion Belle River
(Dennis St. Pierre)2020-2023 28,800,000 1,555,200 27,244,800 2,880,000 24,364,800 15,837,120 8,527,680
14 Essex Fringe servicing 2040 1,760,800 176,100 1,584,700 1,584,700 - - -
Reserve Fund Adjustment 580,877 (580,877) (377,570) (203,307)
Total 67,236,870 8,926,700 - 58,310,170 18,795,577 - 39,514,593 25,684,485 13,830,107
* Timing of Works may be dependent upon receiving funding assistance which would include developer assistance, grants, etc.
Prj.No
Increased Service Needs Attributable to
Anticipated DevelopmentTiming*
(year)
Gross Capital
Cost Estimate
(2020$)
Post Period
Benefit
Other
Deductions (to
recognize
benefit to non-
D.C. services)
Net Capital
Cost
Benefit to
Existing
Developmen
t
Grants, Subsidies
and Other
Contributions
Attributable to New
Development
Total
Less: Potential D.C. Recoverable Cost

Watson & Associates Economists Ltd. H:\Lakeshore\2020 DC\Report\Final Report.docx
Chapter 6 D.C. Calculation

Watson & Associates Economists Ltd. PAGE 6-1 H:\Lakeshore\2020 DC\Report\Final Report.docx
6. D.C. Calculation
Table 6-1 calculates the proposed uniform D.C.s to be imposed for infrastructure
services based upon an urban 20-year horizon (wastewater, and water). Table 6-2
calculates the proposed uniform D.C. to be imposed on anticipated development in the
Town for Town-wide services over a 20-year planning horizon. Table 6-3 calculates the
proposed uniform D.C. to be imposed on anticipated development in the Town for
Town-wide services over a 10-year planning horizon
The calculation for residential development is generated on a per capita basis and is
based upon four forms of housing types (singles and semi-detached, apartments 2+
bedrooms, apartments bachelor and 1 bedroom, and all other multiples). The non-
residential D.C. has been calculated on a per sq.ft. of gross floor area basis for all types
of non-residential development (industrial, commercial and institutional).
The D.C.-eligible costs for each service component were developed in Chapter 5 for all
Town services and classes, based on their proposed capital programs.
For the residential calculations, the total cost is divided by the “gross” (new resident)
population to determine the per capita amount. The eligible D.C. cost calculations set
out in Chapter 5 are based on the net anticipated population increase (the forecast new
unit population less the anticipated decline in existing units). The cost per capita is then
multiplied by the average occupancy of the new units (Appendix A, Schedule 5) to
calculate the charge in Tables 6-1, 6-2 and 6-3.
With respect to non-residential development, the total costs in the uniform charge
allocated to non-residential development (based on need for service) have been divided
by the anticipated development over the planning period to calculate a cost per sq.ft. of
gross floor area.
Table 6-4 summarizes the total D.C. that is applicable for Town-wide services and Table
6-5 summarizes the gross capital expenditures and sources of revenue for works to be
undertaken during the 5-year life of the by-law.

Watson & Associates Economists Ltd. PAGE 6-2 H:\Lakeshore\2020 DC\Report\Final Report.docx
Table 6-1 Town of Lakeshore
D.C. CalculationUrban Area Services 2020-2039 (Urban)
2020$ D.C.-Eligible Cost 2020$ D.C.-Eligible Cost
SERVICE/CLASS Residential Non-Residential S.D.U. per sq.ft.
$ $ $ $
1. Wastewater Services
1.1 Treatment plants 25,684,485 13,830,107 7,178 3.08
1.2 Sewers 11,495,377 6,189,818 3,213 1.38
37,179,862 20,019,926 10,391 4.46
2. Water Services
2.1 Treatment plants and storage 9,882,778 5,321,496 2,762 1.19
2.2 Distribution systems 5,223,010 2,812,390 1,460 0.63
15,105,788 8,133,886 4,222 1.82
TOTAL 52,285,650 $28,153,811 $14,613 $6.27
D.C.-Eligible Capital Cost $52,285,650 $28,153,811
20 Year Urban Gross Population/GFA Growth (sq.ft.) 11,918 4,489,500
Cost Per Capita/Non-Residential GFA (sq.ft.) $4,387.12 $6.27
By Residential Unit Type P.P.U.
Single and Semi-Detached Dwelling 3.331 $14,613
Other Multiples 1.947 $8,542
Apartments - 2 Bedrooms + 1.703 $7,471
Apartments - Bachelor and 1 Bedroom 1.316 $5,773
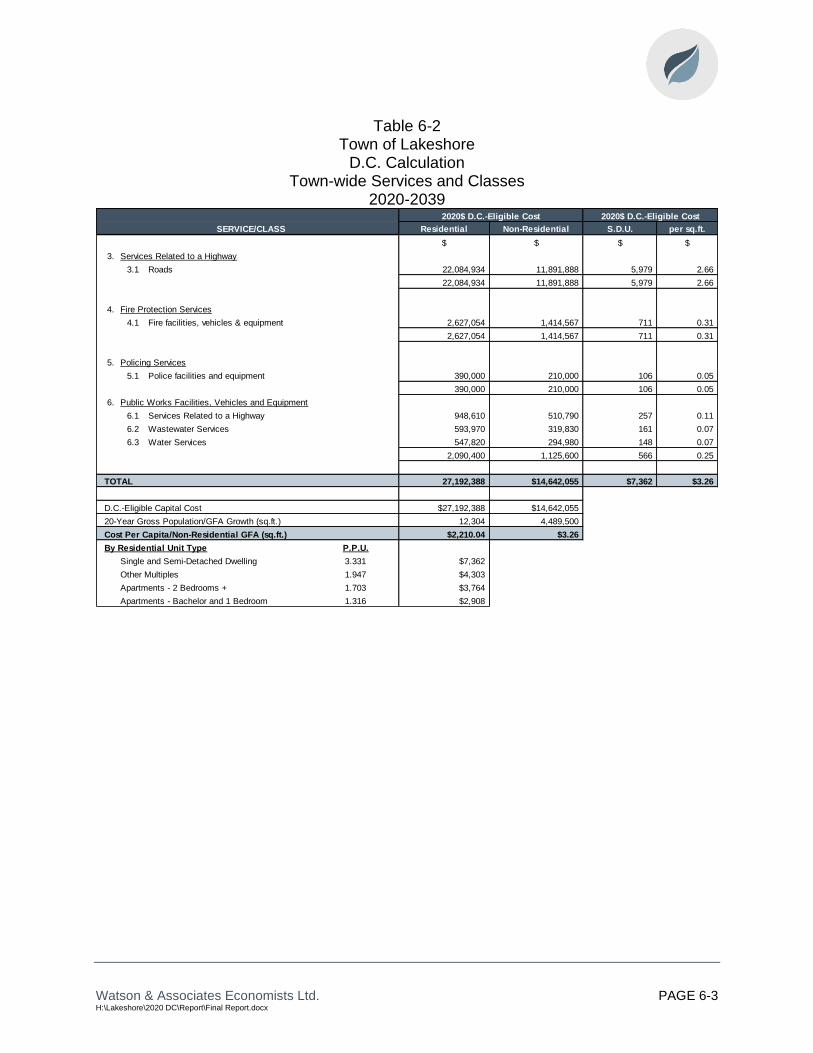
Watson & Associates Economists Ltd. PAGE 6-3 H:\Lakeshore\2020 DC\Report\Final Report.docx
Table 6-2 Town of Lakeshore
D.C. CalculationTown-wide Services and Classes
2020-2039 2020$ D.C.-Eligible Cost 2020$ D.C.-Eligible Cost
SERVICE/CLASS Residential Non-Residential S.D.U. per sq.ft.
$ $ $ $
3. Services Related to a Highway
3.1 Roads 22,084,934 11,891,888 5,979 2.66
22,084,934 11,891,888 5,979 2.66
4. Fire Protection Services
4.1 Fire facilities, vehicles & equipment 2,627,054 1,414,567 711 0.31
2,627,054 1,414,567 711 0.31
5. Policing Services
5.1 Police facilities and equipment 390,000 210,000 106 0.05
390,000 210,000 106 0.05
6. Public Works Facilities, Vehicles and Equipment
6.1 Services Related to a Highway 948,610 510,790 257 0.11
6.2 Wastewater Services 593,970 319,830 161 0.07
6.3 Water Services 547,820 294,980 148 0.07
2,090,400 1,125,600 566 0.25
TOTAL 27,192,388 $14,642,055 $7,362 $3.26
D.C.-Eligible Capital Cost $27,192,388 $14,642,055
20-Year Gross Population/GFA Growth (sq.ft.) 12,304 4,489,500
Cost Per Capita/Non-Residential GFA (sq.ft.) $2,210.04 $3.26
By Residential Unit Type P.P.U.
Single and Semi-Detached Dwelling 3.331 $7,362
Other Multiples 1.947 $4,303
Apartments - 2 Bedrooms + 1.703 $3,764
Apartments - Bachelor and 1 Bedroom 1.316 $2,908
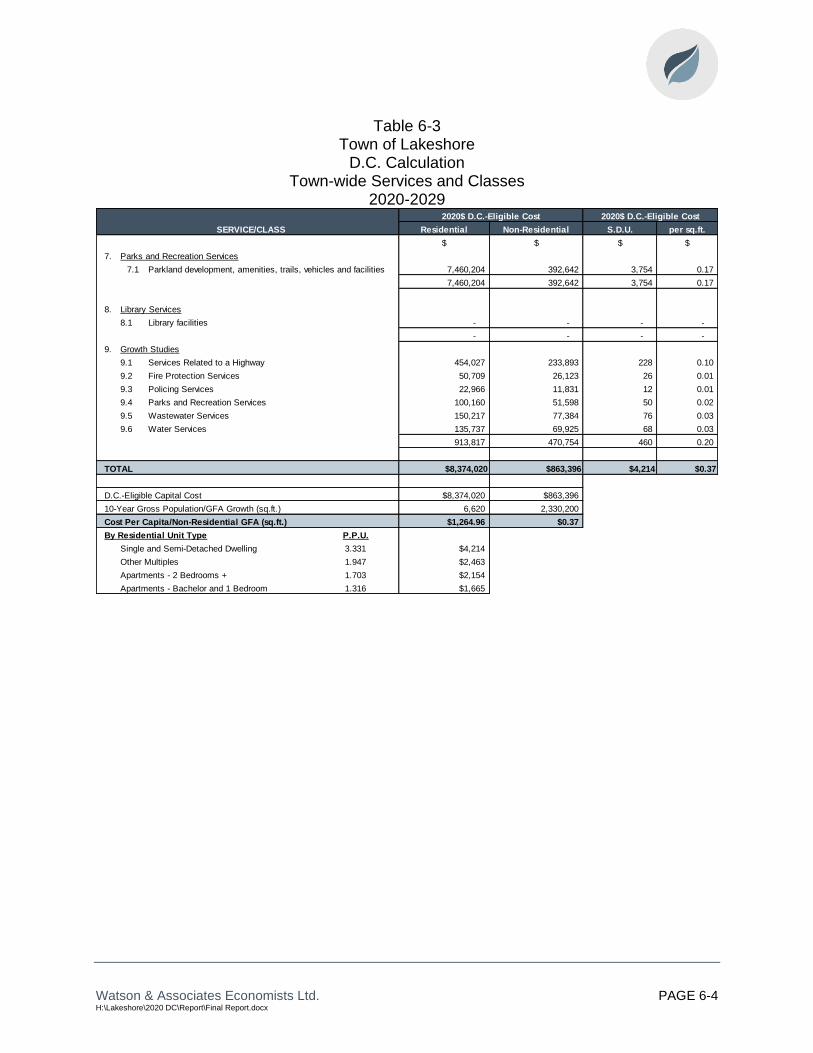
Watson & Associates Economists Ltd. PAGE 6-4 H:\Lakeshore\2020 DC\Report\Final Report.docx
Table 6-3 Town of Lakeshore
D.C. CalculationTown-wide Services and Classes
2020-2029 2020$ D.C.-Eligible Cost 2020$ D.C.-Eligible Cost
SERVICE/CLASS Residential Non-Residential S.D.U. per sq.ft.
$ $ $ $
7. Parks and Recreation Services
7.1 Parkland development, amenities, trails, vehicles and facilities 7,460,204 392,642 3,754 0.17
7,460,204 392,642 3,754 0.17
8. Library Services
8.1 Library facilities - - - -
- - - -
9. Growth Studies
9.1 Services Related to a Highway 454,027 233,893 228 0.10
9.2 Fire Protection Services 50,709 26,123 26 0.01
9.3 Policing Services 22,966 11,831 12 0.01
9.4 Parks and Recreation Services 100,160 51,598 50 0.02
9.5 Wastewater Services 150,217 77,384 76 0.03
9.6 Water Services 135,737 69,925 68 0.03
913,817 470,754 460 0.20
TOTAL $8,374,020 $863,396 $4,214 $0.37
D.C.-Eligible Capital Cost $8,374,020 $863,396
10-Year Gross Population/GFA Growth (sq.ft.) 6,620 2,330,200
Cost Per Capita/Non-Residential GFA (sq.ft.) $1,264.96 $0.37
By Residential Unit Type P.P.U.
Single and Semi-Detached Dwelling 3.331 $4,214
Other Multiples 1.947 $2,463
Apartments - 2 Bedrooms + 1.703 $2,154
Apartments - Bachelor and 1 Bedroom 1.316 $1,665

Watson & Associates Economists Ltd. PAGE 6-5 H:\Lakeshore\2020 DC\Report\Final Report.docx
Table 6-4 Town of Lakeshore
D.C. CalculationTotal All Services and Classes
2020$ D.C.-Eligible Cost 2020$ D.C.-Eligible Cost
Residential Non-Residential S.D.U. per sq.ft.
$ $ $ $
Urban-wide Services/Classes 20 Year 52,285,650 28,153,811 14,613 6.27
Town-wide Services/Classes 20 Year 27,192,388 14,642,055 7,362 3.26
Town-wide Services/Classes 10 Year 8,374,020 863,396 4,214 0.37
TOTAL 87,852,058 43,659,263 26,189 9.90

Watson & Associates Economists Ltd. PAGE 6-6 H:\Lakeshore\2020 DC\Report\Final Report.docx
Table 6-5 Town of Lakeshore
Gross Expenditure and Sources of Revenue Summary for Costs to be Incurred over the Life of the By-law
Sources of Financing
Tax Base or Other Non-D.C. Source D.C. Reserve Fund
Other
Deductions
Benefit to
ExistingOther Funding Residential Non-Residential
1. Wastewater Services
1.1 Treatment plants 31,862,156 0 2,880,000 0 1,555,200 17,827,521 9,599,434
1.2 Sewers 6,987,550 0 3,493,775 0 698,800 1,816,734 978,241
2. Water Services
2.1 Treatment plants and storage 5,631,000 0 3,486,200 0 553,500 1,034,345 556,955
2.2 Distribution systems 8,075,500 0 2,637,500 0 174,400 3,421,340 1,842,260
3. Services Related to a Highway
3.1 Roads 28,422,330 0 9,926,600 4,166,500 6,247,430 5,253,170 2,828,630
4. Fire Protection Services
4.1 Fire facilities, vehicles & equipment 114,405 0 43,750 0 0 45,926 24,729
5. Policing Services
5.1 Police facilities and equipment 150,000 0 0 0 0 97,500 52,500
6. Public Works Facilities, Vehicles and Equipment
6.1 Services Related to a Highway 187,182 0 55,909 0 0 85,327 45,945
6.2 Wastewater Services 2,781,955 0 314,045 0 1,645,200 534,761 287,948
6.3 Water Services 2,710,136 0 274,500 0 1,645,200 513,784 276,653
7. Parks and Recreation Services
7.1 Parkland development, amenities, trails, vehicles and facilities 7,960,436 0 3,582,091 0 0 4,159,428 218,917
8. Library Services
8.1 Library facilities 0 0 0 0 0 0 0
9. Growth Studies
9.1 Services Related to a Highway 292,992 14,700 70,075 0 0 137,423 70,794
9.2 Fire Protection Services 107,027 4,707 26,407 0 0 50,103 25,811
9.3 Policing Services 47,027 4,707 11,757 0 0 20,172 10,392
9.4 Parks and Recreation Services 210,705 5,297 90,728 0 0 75,689 38,991
9.5 Wastewater Services 168,058 14,700 36,742 0 0 76,967 39,650
9.6 Water Services 155,858 14,700 36,742 0 0 68,915 35,502
Total Expenditures & Revenues $95,864,316 $58,810 $26,966,820 $4,166,500 $12,519,730 $35,219,104 $16,933,352
Post D.C. Period
Benefit
Total Gross CostService/Class
Watson & Associates Economists Ltd. H:\Lakeshore\2020 DC\Report\Final Report.docx
Chapter 7 D.C. Policy Recommendationsand D.C. By-law Rules
Watson & Associates Economists Ltd. PAGE 7-1 H:\Lakeshore\2020 DC\Report\Final Report.docx
7. D.C. Policy Recommendations and D.C. By-lawRules
7.1 Introduction
Subsection 5 (1) 9 states that rules must be developed:
“...to determine if a development charge is payable in any particular case and to determine the amount of the charge, subject to the limitations set out in subsection 6.”
Paragraph 10 of the section goes on to state that the rules may provide for exemptions,
phasing in and/or indexing of D.C.s.
Subsection 5 (6) establishes the following restrictions on the rules:
• the total of all D.C.s that would be imposed on anticipated development must not
exceed the capital costs determined under 5(1) 2-8 for all services involved;
• if the rules expressly identify a type of development, they must not provide for it
to pay D.C.s that exceed the capital costs that arise from the increase in the
need for service for that type of development; however, this requirement does not
relate to any particular development; and
• if the rules provide for a type of development to have a lower D.C. than is
allowed, the rules for determining D.C.s may not provide for any resulting
shortfall to be made up via other development.
With respect to “the rules,” section 6 states that a D.C. by-law must expressly address
the matters referred to above re subsection 5 (1) paragraphs 9 and 10, as well as how
the rules apply to the redevelopment of land.
The rules provided are based on the Town’s existing policies; with consideration for the
updates from Bill 108 and Bill 197. However, there are items under consideration at this
time and these may be refined prior to adoption of the by-law.
Watson & Associates Economists Ltd. PAGE 7-2 H:\Lakeshore\2020 DC\Report\Final Report.docx
7.2 D.C. By-law Structure
It is recommended that:
• classes of services be established for public works and growth studies;
• the Town uses a uniform Town-wide D.C. calculation for all municipal services
and classes except water and wastewater;
• water and wastewater services be imposed on the urban service areas of the
Town; and
• one municipal D.C. by-law be used for all services and classes.
7.3 D.C. By-law Rules
The following subsections set out the recommended rules governing the calculation,
payment and collection of D.C.s in accordance with section 6 of the D.C.A.
It is recommended that the following sections provide the basis for the D.C.s.:
7.3.1 Payment in any Particular Case
In accordance with the D.C.A., subsection 2 (2), a D.C. be calculated, payable and
collected where the development requires one or more of the following:
“(a) the passing of a zoning by-law or of an amendment to a zoning by-law under section 34 of the Planning Act;
(b) the approval of a minor variance under section 45 of the PlanningAct;
(c) a conveyance of land to which a by-law passed under subsection 50(7) of the Planning Act applies;
(d) the approval of a plan of subdivision under section 51 of the PlanningAct;
(e) a consent under section 53 of the Planning Act;
(f) the approval of a description under section 9 of the CondominiumAct, 1998; or

Watson & Associates Economists Ltd. PAGE 7-3 H:\Lakeshore\2020 DC\Report\Final Report.docx
(g) the issuing of a permit under the Building Code Act, 1992 in relationto a building or structure.”
7.3.2 Determination of the Amount of the Charge
The following conventions be adopted:
1) Costs allocated to residential uses will be assigned to different types of
residential units based on the average occupancy for each housing type
constructed during the previous decade. Costs allocated to non-residential uses
will be assigned based on the amount of square feet of gross floor area
constructed for eligible uses (i.e. industrial, commercial and institutional).
2) Costs allocated to residential and non-residential uses are based upon a number
of conventions, as may be suited to each municipal circumstance, e.g.
• for parks and recreation and library services, a 5% non-residential attribution
has been made to recognize use by the non-residential sector;
• for growth studies, a 66% residential/34% non-residential allocation has been
made based on a population vs. employment growth ratio over the 10-year
forecast period;
• for services related to a highway, public works, fire services and policing
services, a 65% residential/35% non-residential attribution has been made
based on a population vs. employment growth ratio over the 20-year forecast
period; and
• for water and wastewater services a 65% residential/35% non-residential
allocation has been made based on population vs. employment growth over
the 20-year urban forecast period.
7.3.3 Application to Redevelopment of Land (Demolition and Conversion)
If a development involves the demolition of and replacement of a building or structure
on the same site, or the conversion from one principal use to another, the developer
shall be allowed a credit equivalent to:
1) the number of dwelling units demolished/converted multiplied by the applicable
residential D.C. in place at the time the D.C. is payable; and/or
Watson & Associates Economists Ltd. PAGE 7-4 H:\Lakeshore\2020 DC\Report\Final Report.docx
2) the gross floor area of the building demolished/converted multiplied by the
current non-residential D.C. in place at the time the D.C. is payable.
The demolition credit is allowed only if the land was improved by occupied structures
and if the demolition permit related to the site was issued less than five years prior to
the issuance of a building permit. The credit can, in no case, exceed the amount of
D.C.s that would otherwise be payable.
7.3.4 Exemptions (full or partial)
a) Statutory exemptions:
• industrial building additions of up to and including 50% of the existing
gross floor area (defined in O. Reg. 82/98, section 1) of the building; for
industrial building additions which exceed 50% of the existing gross floor
area, only the portion of the addition in excess of 50% is subject to D.C.s
(subsection 4 (3) of the D.C.A.);
• buildings or structures owned by and used for the purposes of any
municipality, local board or Board of Education (section 3); and
• residential development that results only in the enlargement of an existing
dwelling unit, or that results only in the creation of up to two additional
dwelling units (based on prescribed limits set out in section 2 of O. Reg.
82/98).
b) Non-statutory exemptions:
• Lands, buildings or structures used or to be used for a place of worship or
for the purposes of a cemetery or burial ground exempt from taxation
under the Assessment Act; and
• Non-residential farm buildings constructed for bona fide farm uses.
7.3.5 Phasing in
No provisions for phasing in the D.C. are provided in the D.C. by-law.
Watson & Associates Economists Ltd. PAGE 7-5 H:\Lakeshore\2020 DC\Report\Final Report.docx
7.3.6 Timing of Collection
The D.C.s for all services and classes are payable upon issuance of the first building
permit for each dwelling unit, building, or structure, subject to early or late payment
agreements entered into by the Town and an owner under s.27 of the D.C.A., 1997.
Commencing January 1, 2020, rental housing and institutional developments will pay
D.C.s in six equal annual payments commencing at occupancy. Non-profit housing
developments will pay D.C.s in 21 equal annual payments. Moreover, the D.C. amount
for all developments occurring within 2 years of a Site Plan or Zoning By-law
Amendment planning approval (for applications submitted after January 1, 2020), shall
be determined based on the D.C. in effect on the day of the Site Plan or Zoning By-law
Amendment application.
Installment payments and payments determined at the time of Site Plan or Zoning
Bylaw Amendment application may be subject to annual interest charges. The
applicable interest rate is provided in the Town’s “Development Charge Interest Policy”.
Subsequent to the release of the D.C. background study, staff will conduct a review of
appropriate interest rates and will present a staff report to Council for their
consideration.
For the purposes of administering the By-law, the following definitions are provided as
per O. Reg. 454-19:
“Rental housing” means development of a building or structure with four or more
dwelling units all of which are intended for use as rented residential premises.
“Institutional development” means development of a building or structure intended for
use,
a. as a long-term care home within the meaning of subsection 2 (1) of the Long-
Term Care Homes Act, 2007;
b. as a retirement home within the meaning of subsection 2 (1) of the Retirement
Homes Act, 2010;
c. by any of the following post-secondary institutions for the objects of the
institution:
i. a university in Ontario that receives direct, regular and ongoing operating
funding from the Government of Ontario,

Watson & Associates Economists Ltd. PAGE 7-6 H:\Lakeshore\2020 DC\Report\Final Report.docx
ii. a college or university federated or affiliated with a university described in
subclause (i), or
iii. an Indigenous Institute prescribed for the purposes of section 6 of the
Indigenous Institutes Act, 2017;
d. as a memorial home, clubhouse or athletic grounds by an Ontario branch of the
Royal Canadian Legion; or
e. as a hospice to provide end of life care.
“Non-profit housing development” means development of a building or structure
intended for use as residential premises by,
a. a corporation without share capital to which the Corporations Act applies, that is
in good standing under that Act and whose primary object is to provide housing;
b. a corporation without share capital to which the Canada Not-for-profit
Corporations Act applies, that is in good standing under that Act and whose
primary object is to provide housing; or
c. a non-profit housing co-operative that is in good standing under the Co-operative
Corporations Act.
A D.C. that is applicable under section 5 of the D.C.A. shall be calculated and payable:
• where a permit is required under the Building Code Act in relation to a building or
structure, the owner shall pay the D.C. prior to the issuance of a permit of prior to
the commencement of development or redevelopment as the case may be; and
• despite the above, Council, from time to time and at any time, may enter into
agreements providing for all or any part of a D.C. to be paid before or after it
would otherwise be payable.
7.3.7 Indexing
Indexing of the D.C.s shall be implemented on a mandatory basis annually commencing
on January 1st 2021, and every January 1st thereafter, in accordance with the Statistics
Canada Quarterly, Non-Residential Building Construction Price Index (Table 18-10-
0135-01)1 for the most recent year-over-year period.
1 O. Reg. 82/98 referenced “The Statistics Canada Quarterly, Construction Price
Statistics, catalogue number 62-007” as the index source. Since implementation,

Watson & Associates Economists Ltd. PAGE 7-7 H:\Lakeshore\2020 DC\Report\Final Report.docx
7.3.8 The Applicable Areas
The charges developed herein provide for varying charges within the Town, as follows:
• all municipal-wide services/classes – the full residential and non-residential
charge will be imposed on all lands within the Town; and
• water and wastewater – the full residential and non-residential charge will be
imposed on the urban service areas of the Town.
7.4 Other D.C. By-law Provisions
It is recommended that:
7.4.1 Categories of Services for Reserve Fund and Credit Purposes
The Town’s D.C. collections are currently reserved in six separate reserve funds:
services related to a highway, protection, parks and recreation and growth studies,
wastewater services and water services. It is recommended that the reserve fund for
Protection Services be split into two reserve funds; one for fire services and one for
policing services. Additionally, it is recommended that a reserve fund for the public
works class be established.
Appendix F outlines the reserve fund policies that the Town is required to follow as per
the D.C.A.
7.4.2 By-law In-force Date
A by-law under the D.C.A. comes into force on the day after which the by-law is passed
by Council.
7.4.3 Minimum Interest Rate Paid on Refunds and Charged for Inter-Reserve Fund Borrowing
The minimum interest rate is the Bank of Canada rate on the day on which the by-law
comes into force (as per section 11 of O. Reg. 82/98).
Statistics Canada has modified this index twice and the above-noted index is the most
current. The draft by-law provided herein refers to O. Reg. 82/98 to ensure traceability
should this index continue to be modified over time.

Watson & Associates Economists Ltd. PAGE 7-8 H:\Lakeshore\2020 DC\Report\Final Report.docx
7.4.4 Area Rating
As noted earlier, Bill 73 has introduced two new sections where Council must consider
the use of area specific charges:
1. Section 2 (9) of the Act now requires a municipality to implement area-specific
D.C.s for either specific services which are prescribed and/or for specific
municipalities which are to be regulated (note that at this time, no municipalities
or services are prescribed by the Regulations).
2. Section 10 (2) c.1 of the D.C.A. requires that “the development charges
background study shall include consideration of the use of more than one
development charge by-law to reflect different needs for services in different
areas.”
In regard to the first item, there are no services or specific municipalities identified in the
regulations which must be area-rated. The second item requires Council to consider
the use of area-rating.
At present, the Town’s by-law provides for water and wastewater services on an urban
area basis. All other Town services are recovered based on a uniform, Town-wide
basis. There have been several reasons why area-rating has not been imposed on
these services including:
1. All Town services, with the exception of water, wastewater and stormwater,
require that the average 10-year service standard be calculated. This average
service standard multiplied by growth in the Town, establishes an upper ceiling
on the amount of funds which can be collected from all developing landowners.
Section 4 (4) of O. Reg. 82/98 provides that “…if a development charge by-law
applies to a part of the municipality, the level of service and average level of
service cannot exceed that which would be determined if the by-law applied to
the whole municipality.” Put in layman terms, the average service standard
multiplied by the growth within the specific area, would establish an area specific
ceiling which would significantly reduce the total revenue recoverable for the
Town hence potentially resulting in D.C. revenue shortfalls and impacts on
property taxes.

Watson & Associates Economists Ltd. PAGE 7-9 H:\Lakeshore\2020 DC\Report\Final Report.docx
2. Extending on item 1, attempting to impose an area charge potentially causes
equity issues in transitioning from a Town-wide approach to an area specific
approach. For example, if all services were now built (and funded) within Area A
(which is 75% built out) and this was funded with some revenues from Areas B
and C, moving to an area rating approach would see Area A contribute no funds
to the costs of services in Areas B and C. The development charges would be
lower in Area A (as all services are now funded) and higher in Areas B and C.
As well, funding shortfalls may then potentially encourage the municipality to
provide less services to Areas B and C due to reduced revenue.
3. Many services which are provided (roads, parks, recreation facilities, library) are
not restricted to one specific area and are often used by all residents. For
example, arenas located in different parts of the Town will be used by residents
from all areas depending on the programing of the facility (i.e. a public skate is
available each night, but at a different arena; hence usage of any one facility at
any given time is based on programing availability).
For the reasons noted above, it is recommended that Council continue the D.C.
approach to calculate the charges on a uniform Town-wide basis for all services/classes
of services other than water and wastewater.
7.5 Other Recommendations
It is recommended that Council:
“Whenever appropriate, request that grants, subsidies and other contributions be
clearly designated by the donor as being to the benefit of existing development or
new development, as applicable;”
“Adopt the assumptions contained herein as an ‘anticipation’ with respect to
capital grants, subsidies and other contributions;”
“Classes of services be established for growth studies and public works (facilities
and fleet);”
“Continue the D.C. approach to calculate water and wastewater services on a
uniform urban-area basis and all other services be calculated on a uniform Town-
wide basis;”
Watson & Associates Economists Ltd. PAGE 7-10 H:\Lakeshore\2020 DC\Report\Final Report.docx
“Approve the capital project listing set out in Chapter 5 of the D.C.s Background
Study dated October 7, 2020, subject to further annual review during the capital
budget process;”
“Approve the D.C.s Background Study dated October 7, 2020, as amended (if
applicable);"
“Determine that no further public meeting is required;” and
“Approve the D.C. By-law as set out in Appendix G.”
Watson & Associates Economists Ltd. H:\Lakeshore\2020 DC\Report\Final Report.docx
Chapter 8 By-law Implementation
Watson & Associates Economists Ltd. PAGE 8-1 H:\Lakeshore\2020 DC\Report\Final Report.docx
8. By-law Implementation
8.1 Public Consultation Process
8.1.1 Introduction
This chapter addresses the mandatory, formal public consultation process (section
8.1.2), as well as the optional, informal consultation process (section 8.1.3). The latter
is designed to seek the co-operation and participation of those involved, in order to
produce the most suitable policy. Section 8.1.4 addresses the anticipated impact of the
D.C. on development from a generic viewpoint.
8.1.2 Public Meeting of Council
Section 12 of the D.C.A. indicates that before passing a D.C. by-law, Council must hold
at least one public meeting, giving at least 20 clear days’ notice thereof, in accordance
with the Regulation. Council must also ensure that the proposed by-law and
background report are made available to the public at least two weeks prior to the (first)
meeting.
Any person who attends such a meeting may make representations related to the
proposed by-law.
If a proposed by-law is changed following such a meeting, Council must determine
whether a further meeting (under this section) is necessary (i.e. if the proposed by-law
which is proposed for adoption has been changed in any respect, Council should
formally consider whether an additional public meeting is required, incorporating this
determination as part of the final by-law or associated resolution. It is noted that
Council’s decision, once made, is final and not subject to review by a Court or the Local
Planning Appeal Tribunal (L.P.A.T.) (formerly the Ontario Municipal Board (O.M.B.)).
8.1.3 Other Consultation Activity
There are three broad groupings of the public who are generally the most concerned
with Town D.C. policy:
1. The first grouping is the residential development community, consisting of land
developers and builders, who are typically responsible for generating the majority

Watson & Associates Economists Ltd. PAGE 8-2 H:\Lakeshore\2020 DC\Report\Final Report.docx
of the D.C. revenues. Others, such as realtors, are directly impacted by D.C.
policy. They are, therefore, potentially interested in all aspects of the charge,
particularly the quantum by unit type, projects to be funded by the D.C. and the
timing thereof, and Town policy with respect to development agreements, D.C.
credits and front-ending requirements.
2. The second public grouping embraces the public at large and includes taxpayer
coalition groups and others interested in public policy.
3. The third grouping is the industrial/commercial/institutional development sector,
consisting of land developers and major owners or organizations with significant
construction plans, such as hotels, entertainment complexes, shopping centres,
offices, industrial buildings and institutions. Also involved are organizations such
as Industry Associations, the Chamber of Commerce, the Board of Trade and the
Economic Development Agencies, who are all potentially interested in Town D.C.
policy. Their primary concern is frequently with the quantum of the charge, gross
floor area exclusions such as basements, mechanical or indoor parking areas, or
exemptions and phase-in or capping provisions in order to moderate the impact.
8.2 Anticipated Impact of the Charge on Development
The establishment of sound D.C. policy often requires the achievement of an
acceptable balance between two competing realities. The first is that high non-
residential D.C.s can, to some degree, represent a barrier to increased economic
activity and sustained industrial/commercial growth, particularly for capital intensive
uses. Also, in many cases, increased residential D.C.s can ultimately be expected to be
recovered via higher housing prices and can impact project feasibility in some cases
(e.g. rental apartments).
On the other hand, D.C.s or other Town capital funding sources need to be obtained in
order to help ensure that the necessary infrastructure and amenities are installed. The
timely installation of such works is a key initiative in providing adequate service levels
and in facilitating strong economic growth, investment and wealth generation.

Watson & Associates Economists Ltd. PAGE 8-3 H:\Lakeshore\2020 DC\Report\Final Report.docx
8.3 Implementation Requirements
8.3.1 Introduction
Once the Town has calculated the charge, prepared the complete background study,
carried out the public process and passed a new by-law, the emphasis shifts to
implementation matters.
These include notices, potential appeals and complaints, credits, front-ending
agreements, subdivision agreement conditions and finally the collection of revenues and
funding of projects.
The sections which follow overview the requirements in each case.
8.3.2 Notice of Passage
In accordance with section 13 of the D.C.A., when a D.C. by-law is passed, the Town
clerk shall give written notice of the passing and of the last day for appealing the by-law
(the day that is 40 days after the day it was passed). Such notice must be given no
later than 20 days after the day the by-law is passed (i.e. as of the day of newspaper
publication or the mailing of the notice).
Section 10 of O. Reg. 82/98 further defines the notice requirements which are
summarized as follows:
• notice may be given by publication in a newspaper which is (in the Clerk’s
opinion) of sufficient circulation to give the public reasonable notice, or by
personal service, fax or mail to every owner of land in the area to which the by-
law relates;
• subsection 10 (4) lists the persons/organizations who must be given notice; and
• subsection 10 (5) lists the eight items which the notice must cover.
8.3.3 By-law Pamphlet
In addition to the “notice” information, the Town must prepare a “pamphlet” explaining
each D.C. by-law in force, setting out:
• a description of the general purpose of the D.C.s;

Watson & Associates Economists Ltd. PAGE 8-4 H:\Lakeshore\2020 DC\Report\Final Report.docx
• the “rules” for determining if a charge is payable in a particular case and for
determining the amount of the charge;
• the services to which the D.C.s relate; and
• a description of the general purpose of the Treasurer’s statement and where it
may be received by the public.
Where a by-law is not appealed to the L.P.A.T., the pamphlet must be readied within 60
days after the by-law comes into force. Later dates apply to appealed by-laws.
The Town must give one copy of the most recent pamphlet without charge, to any
person who requests one.
8.3.4 Appeals
Sections 13 to 19 of the D.C.A. set out the requirements relative to making and
processing a D.C. by-law appeal and L.P.A.T. Hearing in response to an appeal. Any
person or organization may appeal a D.C. by-law to the L.P.A.T. by filing a notice of
appeal with the Town clerk, setting out the objection to the by-law and the reasons
supporting the objection. This must be done by the last day for appealing the by-law,
which is 40 days after the by-law is passed.
The Town is carrying out a public consultation process, in order to address the issues
that come forward as part of that process, thereby avoiding or reducing the need for an
appeal to be made.
8.3.5 Complaints
A person required to pay a D.C., or his agent, may complain to the Town Council
imposing the charge that:
• the amount of the charge was incorrectly determined;
• the reduction to be used against the D.C. was incorrectly determined; or
• there was an error in the application of the D.C.
Sections 20 to 25 of the D.C.A. set out the requirements that exist, including the fact
that a complaint may not be made later than 90 days after a D.C. (or any part of it) is
payable. A complainant may appeal the decision of Town Council to the L.P.A.T.
Watson & Associates Economists Ltd. PAGE 8-5 H:\Lakeshore\2020 DC\Report\Final Report.docx
8.3.6 Credits
Sections 38 to 41 of the D.C.A. set out a number of credit requirements, which apply
where a Town agrees to allow a person to perform work in the future that relates to a
service in the D.C. by-law.
These credits would be used to reduce the amount of D.C.s to be paid. The value of
the credit is limited to the reasonable cost of the work which does not exceed the
average level of service. The credit applies only to the service to which the work
relates, unless the Town agrees to expand the credit to other services for which a D.C.
is payable.
8.3.7 Front-Ending Agreements
The Town and one or more landowners may enter into a front-ending agreement which
provides for the costs of a project which will benefit an area in the Town to which the
D.C. by-law applies. Such an agreement can provide for the costs to be borne by one
or more parties to the agreement who are, in turn, reimbursed in future by persons who
develop land defined in the agreement.
Part III of the D.C.A. (sections 44 to 58) addresses front-ending agreements and
removes some of the obstacles to their use which were contained in the D.C.A., 1989.
Accordingly, the Town assesses whether this mechanism is appropriate for its use, as
part of funding projects prior to Town funds being available.
8.3.8 Severance and Subdivision Agreement Conditions
Section 59 of the D.C.A. prevents a municipality from imposing directly or indirectly, a
charge related to development or a requirement to construct a service related to
development, by way of a condition or agreement under section 51 or section 53 of the
Planning Act, except for:
• “local services, related to a plan of subdivision or within the area to which the
plan relates, to be installed or paid for by the owner as a condition of approval
under section 51 of the Planning Act;” and
• “local services to be installed or paid for by the owner as a condition of approval
under section 53 of the Planning Act.”

Watson & Associates Economists Ltd. PAGE 8-6 H:\Lakeshore\2020 DC\Report\Final Report.docx
It is also noted that subsection 59 (4) of the D.C.A. requires that the municipal approval
authority for a draft plan of subdivision under subsection 51 (31) of the Planning Act,
use its power to impose conditions to ensure that the first purchaser of newly subdivided
land is informed of all the D.C.s related to the development, at the time the land is
transferred.
In this regard, if the Town in question is a commenting agency, in order to comply with
subsection 59 (4) of the D.C.A. it would need to provide to the approval authority,
information regarding the applicable Town D.C.s related to the site.
If the Town is an approval authority for the purposes of section 51 of the Planning Act, it
would be responsible to ensure that it collects information from all entities which can
impose a D.C.
The most effective way to ensure that purchasers are aware of this condition would be
to require it as a provision in a registered subdivision agreement, so that any purchaser
of the property would be aware of the charges at the time the title was searched prior to
closing a transaction conveying the lands.
Appendices

Watson & Associates Economists Ltd. PAGE A-1 H:\Lakeshore\2020 DC\Report\Final Report.docx
Appendix A Background Information on Residential and Non-Residential Growth Forecast
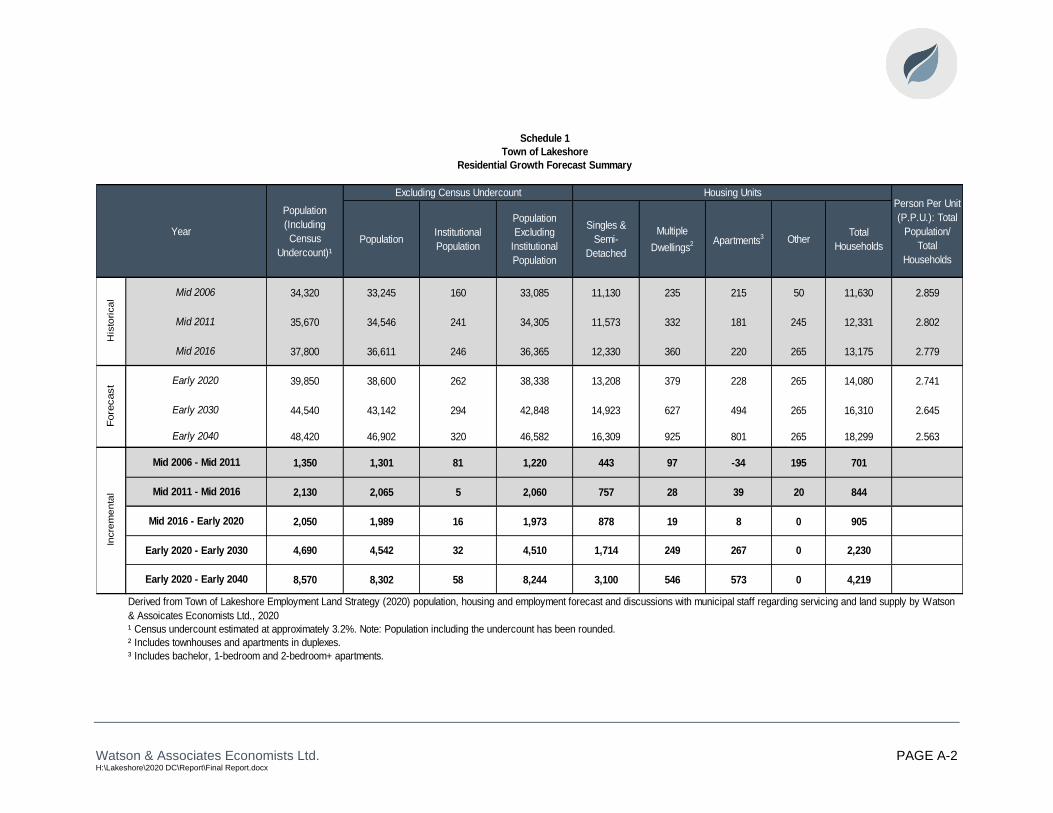
Watson & Associates Economists Ltd. PAGE A-2 H:\Lakeshore\2020 DC\Report\Final Report.docx
PopulationInstitutional
Population
Population
Excluding
Institutional
Population
Singles &
Semi-
Detached
Multiple
Dwellings2 Apartments
3 OtherTotal
Households
34,320 33,245 160 33,085 11,130 235 215 50 11,630 2.859
35,670 34,546 241 34,305 11,573 332 181 245 12,331 2.802
37,800 36,611 246 36,365 12,330 360 220 265 13,175 2.779
39,850 38,600 262 38,338 13,208 379 228 265 14,080 2.741
44,540 43,142 294 42,848 14,923 627 494 265 16,310 2.645
48,420 46,902 320 46,582 16,309 925 801 265 18,299 2.563
1,350 1,301 81 1,220 443 97 -34 195 701
2,130 2,065 5 2,060 757 28 39 20 844
2,050 1,989 16 1,973 878 19 8 0 905
4,690 4,542 32 4,510 1,714 249 267 0 2,230
8,570 8,302 58 8,244 3,100 546 573 0 4,219
¹ Census undercount estimated at approximately 3.2%. Note: Population including the undercount has been rounded.
² Includes townhouses and apartments in duplexes.
³ Includes bachelor, 1-bedroom and 2-bedroom+ apartments.
Mid 2006 - Mid 2011
Mid 2011 - Mid 2016
Mid 2006
Mid 2011
Mid 2016
Early 2020
Early 2030
Early 2020 - Early 2030
Schedule 1
Town of Lakeshore
Residential Growth Forecast Summary
Population
(Including
Census
Undercount)¹
Year
Excluding Census Undercount Housing UnitsPerson Per Unit
(P.P.U.): Total
Population/
Total
Households
His
tori
ca
l
Early 2020 - Early 2040
Fore
cast
Incre
me
nta
l
Early 2040
Mid 2016 - Early 2020
Derived from Town of Lakeshore Employment Land Strategy (2020) population, housing and employment forecast and discussions with municipal staff regarding servicing and land supply by Watson
& Assoicates Economists Ltd., 2020

Watson & Associates Economists Ltd. PAGE A-3 H:\Lakeshore\2020 DC\Report\Final Report.docx
218
119
145
116
159
190 194
168
130
218
264
303
241
194
230 230 230 230 230 230
215 215 215 215 215
199 199 199 199 199192 192 192 192 192
0
50
100
150
200
250
300
350
Ho
usin
g U
nit
s
Years
Figure A-1
Annual Housing Forecast¹
Historical Low Density Medium Density High Density Historical Average

Watson & Associates Economists Ltd. PAGE A-4 H:\Lakeshore\2020 DC\Report\Final Report.docx
2020 - 2030 1,656 249 267 2,172 6,427 (1,899) 4,528 32 4,560
2020 - 2040 2,984 546 573 4,103 11,918 (3,654) 8,264 58 8,322
2020 - 2030 58 0 0 58 193 (211) (18) 0 (18)
2020 - 2040 116 0 0 116 386 (406) (20) 0 (20)
2020 - 2030 1,714 249 267 2,230 6,620 (2,110) 4,510 32 4,542
2020 - 2040 3,100 546 573 4,219 12,304 (4,060) 8,244 58 8,302
1 Includes townhouses and apartments in duplexes.
2 Includes accessory apartments, bachelor, 1-bedroom and 2-bedroom+ apartments.
Note: Numbers may not add to totals due to rounding.
Town of Lakeshore
Derived from Town of Lakeshore Employment Land Strategy (2020) population, housing and employment forecast and discussions with municipal staff regarding servicing and land supply by Watson & Assoicates Economists Ltd., 2020
Rural
Institutional
Population
Net Population
Including
InstitutionalLocation Residential Units In New Units Population
Change
Urban
Town of Lakeshore
Estimate of the Anticipated Amount, Type and Location of
Residential Development for Which Development Charges can be Imposed
Development Timing Single & Semi-
DetachedMultiples
1Apartments
2 Total Gross Population Existing Unit
Net Population
Increase,
Excluding
Institutional
Schedule 2
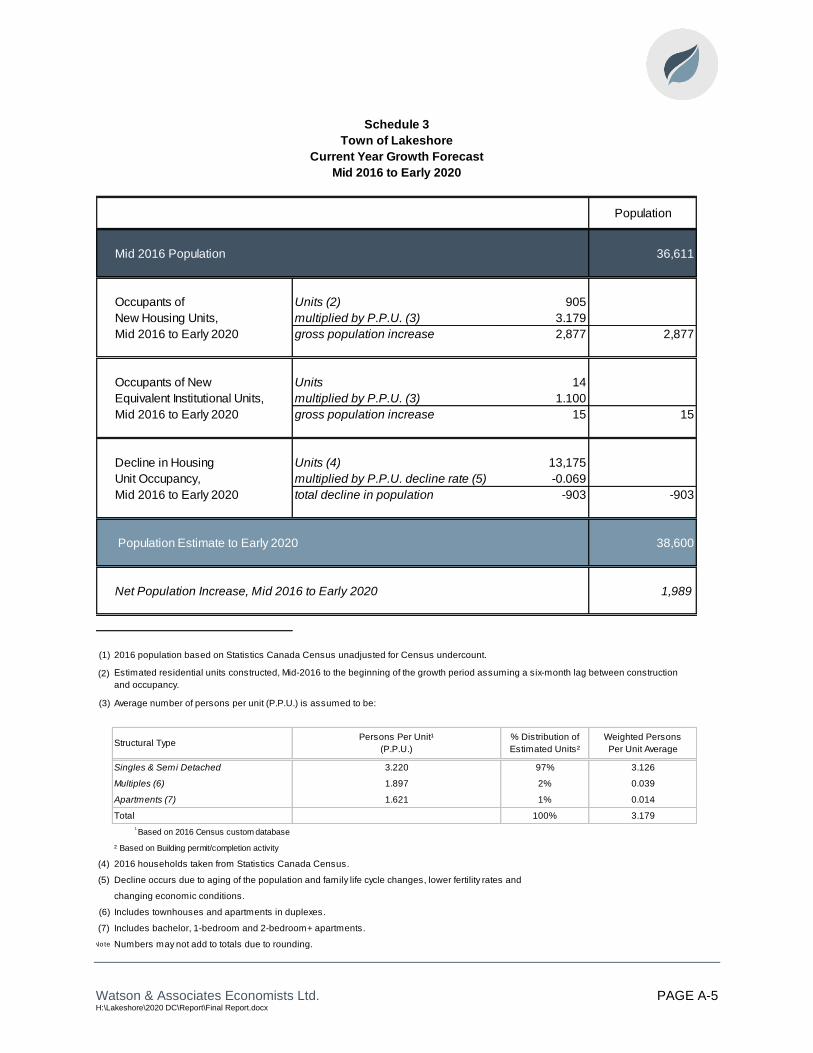
Watson & Associates Economists Ltd. PAGE A-5 H:\Lakeshore\2020 DC\Report\Final Report.docx
Mid 2016 Population 36,611
Occupants of Units (2) 905
New Housing Units, multiplied by P.P.U. (3) 3.179
Mid 2016 to Early 2020 gross population increase 2,877 2,877
Occupants of New Units 14
Equivalent Institutional Units, multiplied by P.P.U. (3) 1.100
Mid 2016 to Early 2020 gross population increase 15 15
Decline in Housing Units (4) 13,175
Unit Occupancy, multiplied by P.P.U. decline rate (5) -0.069
Mid 2016 to Early 2020 total decline in population -903 -903
Population Estimate to Early 2020 38,600
Net Population Increase, Mid 2016 to Early 2020 1,989
(1) 2016 population based on Statistics Canada Census unadjusted for Census undercount.
(2)
(3) Average number of persons per unit (P.P.U.) is assumed to be:
Singles & Semi Detached 3.220 97% 3.126
Multiples (6) 1.897 2% 0.039
Apartments (7) 1.621 1% 0.014
Total 100% 3.179
¹ Based on 2016 Census custom database
² Based on Building permit/completion activity
(4) 2016 households taken from Statistics Canada Census.
(5) Decline occurs due to aging of the population and family life cycle changes, lower fertility rates and
changing economic conditions.
(6) Includes townhouses and apartments in duplexes.
(7) Includes bachelor, 1-bedroom and 2-bedroom+ apartments.
Note Numbers may not add to totals due to rounding.
Schedule 3
Town of Lakeshore
Current Year Growth Forecast
Mid 2016 to Early 2020
Estimated residential units constructed, Mid-2016 to the beginning of the growth period assuming a six-month lag between construction
and occupancy.
Population
Structural TypePersons Per Unit¹
(P.P.U.)
% Distribution of
Estimated Units²
Weighted Persons
Per Unit Average

Watson & Associates Economists Ltd. PAGE A-6 H:\Lakeshore\2020 DC\Report\Final Report.docx
Early 2020 Population 38,600
Occupants of Units (2) 2,230
New Housing Units, multiplied by P.P.U. (3) 2.969
Early 2020 to Early 2030 gross population increase 6,620 6,620
Occupants of New Units 29
Equivalent Institutional Units, multiplied by P.P.U. (3) 1.100
Early 2020 to Early 2030 gross population increase 32 32
Decline in Housing Units (4) 14,080
Unit Occupancy, multiplied by P.P.U. decline rate (5) -0.150
Early 2020 to Early 2030 total decline in population -2,110 -2,110
Population Estimate to Early 2030 43,142
Net Population Increase, Early 2020 to Early 2030 4,542
(1) Early 2020 Population based on:
(2) Based upon forecast building permits/completions assuming a lag between construction and occupancy.
(3) Average number of persons per unit (P.P.U.) is assumed to be:
Singles & Semi Detached 3.331 77% 2.561
Multiples (6) 1.947 11% 0.217
Apartments (7) 1.594 12% 0.191
one bedroom or less 1.316
two bedrooms or more 1.703
Total 100% 2.969
¹ Persons per unit based on adjusted Statistics Canada Custom 2016 Census database.
² Forecast unit mix based upon historical trends and housing units in the development process.
(4) Early 2020 households based upon 2016 Census (13,175 units) + Mid 2016 to Early 2020 unit estimate (905 units) = 14,080 units.
(5)
(6) Includes townhouses and apartments in duplexes.
(7) Includes bachelor, 1-bedroom and 2-bedroom+ apartments.
Note: Numbers may not add to totals due to rounding.
Decline occurs due to aging of the population and family life cycle changes, lower fertility rates and changing economic conditions.
Population
2016 Population (36,611) + Mid 2016 to Early 2020 estimated housing units to beginning of forecast period (905 x 3.179 = 2,877) + (14 x
1.1 = 15) + (13,175 x -0.069 = -903) = 38,600
Structural TypePersons Per Unit¹
(P.P.U.)
% Distribution of
Estimated Units²
Weighted Persons
Per Unit Average
Schedule 4
Early 2020 to Early 2030
Town of Lakeshore
Ten Year Growth Forecast

Watson & Associates Economists Ltd. PAGE A-7 H:\Lakeshore\2020 DC\Report\Final Report.docx
Early 2020 Population 38,600
Occupants of Units (2) 4,219
New Housing Units, multiplied by P.P.U. (3) 2.916
Early 2020 to Early 2040 gross population increase 12,304 12,304
Occupants of New Units 53
Equivalent Institutional Units, multiplied by P.P.U. (3) 1.100
Early 2020 to Early 2040 gross population increase 58 58
Decline in Housing Units (4) 14,080
Unit Occupancy, multiplied by P.P.U. decline rate (5) -0.288
Early 2020 to Early 2040 total decline in population -4,060 -4,060
Population Estimate to Early 2040 46,902
Net Population Increase, Early 2020 to Early 2040 8,302
(1) Early 2020 Population based on:
(2) Based upon forecast building permits/completions assuming a lag between construction and occupancy.
(3) Average number of persons per unit (P.P.U.) is assumed to be:
Singles & Semi Detached 3.331 73% 2.448
Multiples (6) 1.947 13% 0.252
Apartments (7) 1.594 14% 0.216
one bedroom or less 1.316
two bedrooms or more 1.703
Total 100% 2.916
¹ Persons per unit based on Statistics Canada Custom 2016 Census database.
² Forecast unit mix based upon historical trends and housing units in the development process.
(4) Early 2020 households based upon 2016 Census (13,175 units) + Mid 2016 to Early 2020 unit estimate (905 units) = 14,080 units.
(5) Decline occurs due to aging of the population and family life cycle changes, lower fertility rates and changing economic conditions.
(6) Includes townhouses and apartments in duplexes.
(7) Includes bachelor, 1-bedroom and 2-bedroom+ apartments.
Note: Numbers may not add to totals due to rounding.
Twenty Year Growth Forecast
2016 Population (36,611) + Mid 2016 to Early 2020 estimated housing units to beginning of forecast period (905 x 3.179 = 2,877) + (14 x
1.1 = 15) + (13,175 x -0.069 = -903) = 38,600
Population
Early 2020 to Early 2040
Structural TypePersons Per Unit¹
(P.P.U.)
% Distribution of
Estimated Units²
Weighted Persons
Per Unit Average
Schedule 5
Town of Lakeshore
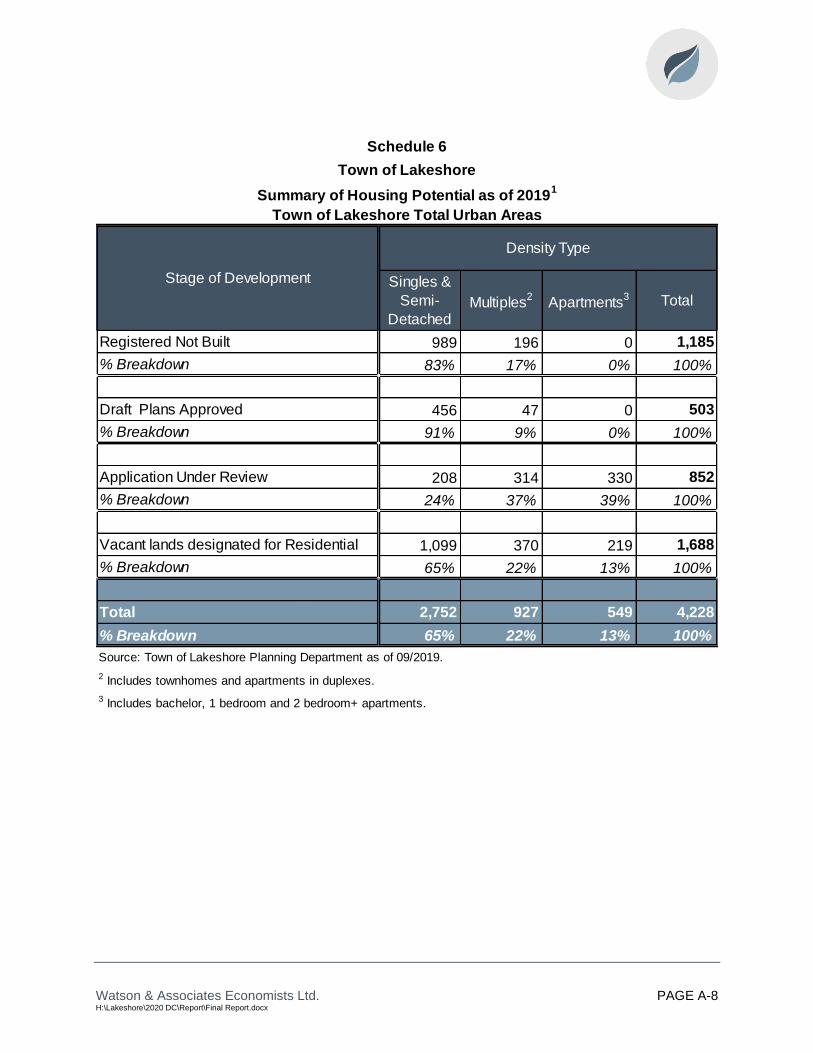
Watson & Associates Economists Ltd. PAGE A-8 H:\Lakeshore\2020 DC\Report\Final Report.docx
989 196 0 1,185
83% 17% 0% 100%
456 47 0 503
91% 9% 0% 100%
208 314 330 852
24% 37% 39% 100%
1,099 370 219 1,688
65% 22% 13% 100%
Total 2,752 927 549 4,228
% Breakdown 65% 22% 13% 100%
Source: Town of Lakeshore Planning Department as of 09/2019.
2 Includes townhomes and apartments in duplexes.
3 Includes bachelor, 1 bedroom and 2 bedroom+ apartments.
Stage of Development
Schedule 6
Town of Lakeshore
Summary of Housing Potential as of 20191
Town of Lakeshore Total Urban Areas
Density Type
Singles &
Semi-
DetachedMultiples
2Apartments
3 Total
Registered Not Built
% Breakdown
Draft Plans Approved
% Breakdown
% Breakdown
Vacant lands designated for Residential
% Breakdown
Application Under Review
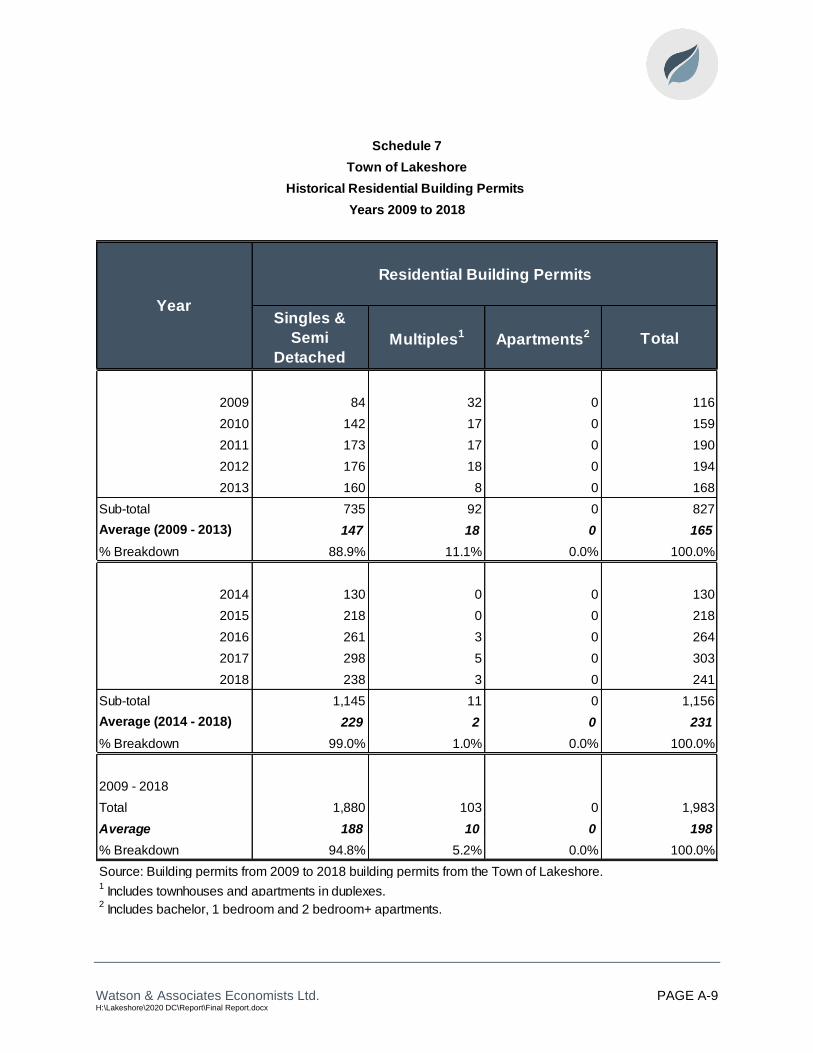
Watson & Associates Economists Ltd. PAGE A-9 H:\Lakeshore\2020 DC\Report\Final Report.docx
Residential Building Permits Residential Building Completions
Total
2009 84 32 0 116
2010 142 17 0 159
2011 173 17 0 190
2012 176 18 0 194
2013 160 8 0 168
Sub-total 735 92 0 827
Average (2009 - 2013) 147 18 0 165
% Breakdown 88.9% 11.1% 0.0% 100.0%
2014 130 0 0 130
2015 218 0 0 218
2016 261 3 0 264
2017 298 5 0 303
2018 238 3 0 241
Sub-total 1,145 11 0 1,156
Average (2014 - 2018) 229 2 0 231
% Breakdown 99.0% 1.0% 0.0% 100.0%
2009 - 2018
Total 1,880 103 0 1,983
Average 188 10 0 198
% Breakdown 94.8% 5.2% 0.0% 100.0%
1 Includes townhouses and apartments in duplexes.
2 Includes bachelor, 1 bedroom and 2 bedroom+ apartments.
Singles &
Semi
DetachedMultiples
1Apartments
2
Town of Lakeshore
Historical Residential Building Permits
Years 2009 to 2018
Year
Source: Building permits from 2009 to 2018 building permits from the Town of Lakeshore.
Schedule 7

Watson & Associates Economists Ltd. PAGE A-10 H:\Lakeshore\2020 DC\Report\Final Report.docx
Age of Singles and Semi-Detached
Dwelling < 1 BR 1 BR 2 BR 3/4 BR 5+ BR Total 20 Year Average Adjusted1
1-5 - - - 3.159 4.400 3.220
6-10 - - - 3.234 4.594 3.369 0.054
11-15 - - 1.760 3.375 4.265 3.355 3.331
16-20 - - - 3.213 3.750 3.258 3.331
20-25 - - 2.000 2.951 3.962 3.056 3.331
25-35 - - 1.933 2.959 3.368 2.917
35+ - 1.543 1.759 2.509 3.313 2.351 3.331
Total - 1.422 1.801 2.893 3.909 2.823
Age of All Density Types
Dwelling < 1 BR 1 BR 2 BR 3/4 BR 5+ BR Total
1-5 - - 1.800 3.099 4.632 3.111
6-10 - - 1.800 3.170 4.563 3.212
11-15 - - 1.714 3.379 4.265 3.276
16-20 - - 2.000 3.195 3.947 3.240
20-25 - - 1.824 2.966 3.962 3.000
25-35 - - 1.862 2.931 3.368 2.793
35+ - 1.302 1.728 2.516 3.340 2.314
Total - 1.300 1.754 2.884 3.967 2.756
Adjusted based on 1996-2016 historical trends.
Note: Does not include Statistics Canada data classified as 'Other'
P.P.U. Not calculated for samples less than or equal to 50 dwelling units, and does not include institutional population.
Schedule 8a - 20 Year Average
Town of Lakeshore
Persons Per Unit By Age and Type of Dwelling
(2016 Census)

Watson & Associates Economists Ltd. PAGE A-11 H:\Lakeshore\2020 DC\Report\Final Report.docx
Age of Multiples1
Dwelling < 1 BR 1 BR 2 BR 3/4 BR 5+ BR Total 20 Year Average Adjusted
1-5 - - 1.612 2.465 - 1.897
6-10 - 1.545 1.903 2.394 - 2.090
11-15 - - 1.626 2.293 - 1.949 1.947
16-20 - - 1.770 2.757 - 2.389 1.947
20-25 - - 1.884 3.036 - 2.458 1.947
25-35 - 1.000 2.045 3.124 - 2.641
35+ - 1.251 1.887 2.830 4.053 2.297
Total 0.857 1.252 1.835 2.778 4.321 2.278
Age of Apartments2
Dwelling < 1 BR 1 BR 2 BR 3/4 BR 5+ BR Total 20 Year Average Adjusted
1-5 - 1.133 2.333 - - 1.621
6-10 - 1.421 1.784 2.083 - 1.676
11-15 - 1.395 1.534 2.083 - 1.536 1.594
16-20 - 1.506 1.764 2.400 - 1.707 1.594
20-25 - 1.288 1.732 2.667 - 1.614 1.594
25-35 0.826 1.201 1.763 3.229 - 1.529
35+ 1.101 1.193 1.878 2.645 - 1.494
Total 1.052 1.212 1.816 2.653 2.300 1.523
Age of All Density Types
Dwelling < 1 BR 1 BR 2 BR 3/4 BR 5+ BR Total
1-5 - 1.267 1.820 3.201 4.675 3.014
6-10 - 1.474 1.862 3.217 4.524 3.017
11-15 - 1.377 1.709 3.200 4.327 2.973
16-20 - 1.515 1.803 3.082 4.109 2.891
20-25 - 1.303 1.881 2.973 3.752 2.731
25-35 1.091 1.211 1.905 2.921 3.643 2.525
35+ 1.176 1.221 1.819 2.579 3.600 2.233
Total 1.217 1.239 1.820 2.785 3.965 2.458
2 Includes bachelor, 1 bedroom and 2 bedroom+ apartments.
Adjusted based on 1996-2016 historical trends.
Note: Does not include Statistics Canada data classified as 'Other'
P.P.U. Not calculated for samples less than or equal to 50 dwelling units, and does not include institutional population.
Schedule 8b
Essex County
Persons Per Unit By Age and Type of Dwelling
(2016 Census)
1 Includes townhouses and apartments in duplexes.

Watson & Associates Economists Ltd. PAGE A-12 H:\Lakeshore\2020 DC\Report\Final Report.docx
3.223.37 3.35 3.26
3.062.92
2.35
1.902.09
1.95
2.39 2.462.64
2.30
1.62 1.681.54
1.71 1.61 1.53 1.49
0.00
0.50
1.00
1.50
2.00
2.50
3.00
3.50
4.00
1-5 6-10 11-15 16-20 20-25 25-35 35+
Pe
rso
ns P
er
Dw
ellin
g
Age of Dwelling
Schedule 9
Persons Per Unit By Structural Type and Age of Dwelling(2016 Census)
Singles and Semi-Detached Multiples Apartments
Town of Lakeshore
Multiple and Apartment P.P.U.s are based on Essex County.
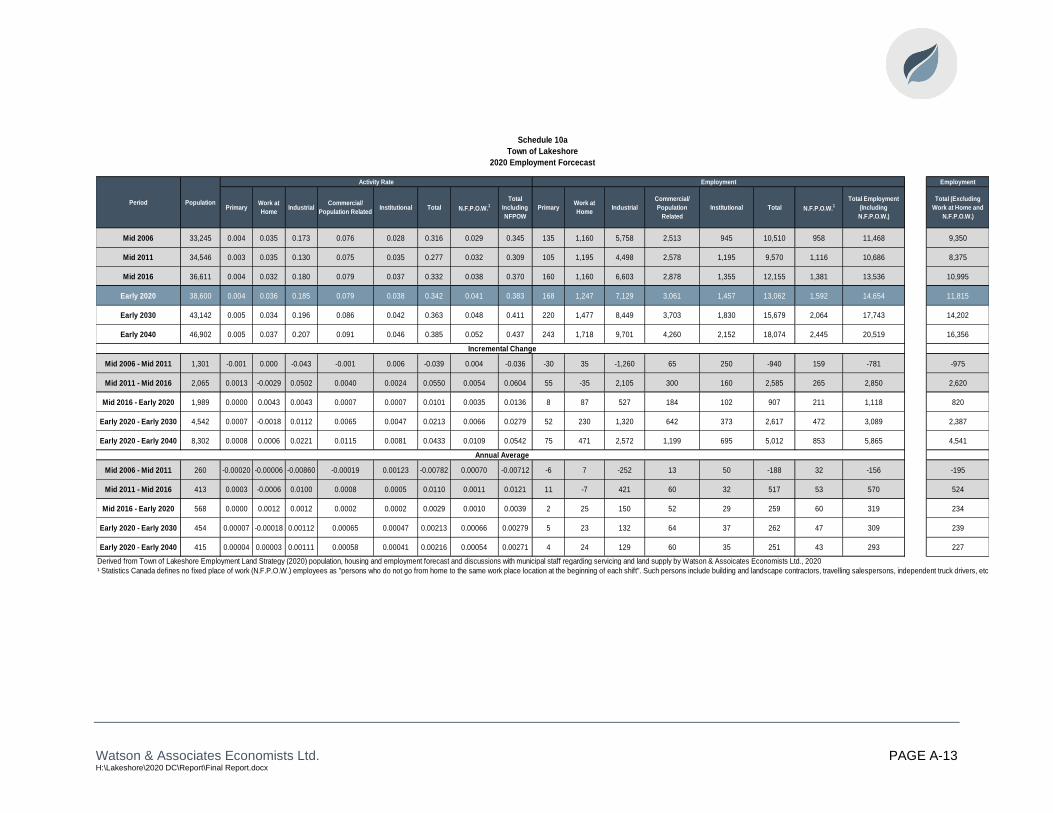
Watson & Associates Economists Ltd. PAGE A-13 H:\Lakeshore\2020 DC\Report\Final Report.docx
Employment
Mid 2006 33,245 0.004 0.035 0.173 0.076 0.028 0.316 0.029 0.345 135 1,160 5,758 2,513 945 10,510 958 11,468 9,350
Mid 2011 34,546 0.003 0.035 0.130 0.075 0.035 0.277 0.032 0.309 105 1,195 4,498 2,578 1,195 9,570 1,116 10,686 8,375
Mid 2016 36,611 0.004 0.032 0.180 0.079 0.037 0.332 0.038 0.370 160 1,160 6,603 2,878 1,355 12,155 1,381 13,536 10,995
Early 2020 38,600 0.004 0.036 0.185 0.079 0.038 0.342 0.041 0.383 168 1,247 7,129 3,061 1,457 13,062 1,592 14,654 11,815
Early 2030 43,142 0.005 0.034 0.196 0.086 0.042 0.363 0.048 0.411 220 1,477 8,449 3,703 1,830 15,679 2,064 17,743 14,202
Early 2040 46,902 0.005 0.037 0.207 0.091 0.046 0.385 0.052 0.437 243 1,718 9,701 4,260 2,152 18,074 2,445 20,519 16,356
Mid 2006 - Mid 2011 1,301 -0.001 0.000 -0.043 -0.001 0.006 -0.039 0.004 -0.036 -30 35 -1,260 65 250 -940 159 -781 -975
Mid 2011 - Mid 2016 2,065 0.0013 -0.0029 0.0502 0.0040 0.0024 0.0550 0.0054 0.0604 55 -35 2,105 300 160 2,585 265 2,850 2,620
Mid 2016 - Early 2020 1,989 0.0000 0.0043 0.0043 0.0007 0.0007 0.0101 0.0035 0.0136 8 87 527 184 102 907 211 1,118 820
Early 2020 - Early 2030 4,542 0.0007 -0.0018 0.0112 0.0065 0.0047 0.0213 0.0066 0.0279 52 230 1,320 642 373 2,617 472 3,089 2,387
Early 2020 - Early 2040 8,302 0.0008 0.0006 0.0221 0.0115 0.0081 0.0433 0.0109 0.0542 75 471 2,572 1,199 695 5,012 853 5,865 4,541
Mid 2006 - Mid 2011 260 -0.00020 -0.00006 -0.00860 -0.00019 0.00123 -0.00782 0.00070 -0.00712 -6 7 -252 13 50 -188 32 -156 -195
Mid 2011 - Mid 2016 413 0.0003 -0.0006 0.0100 0.0008 0.0005 0.0110 0.0011 0.0121 11 -7 421 60 32 517 53 570 524
Mid 2016 - Early 2020 568 0.0000 0.0012 0.0012 0.0002 0.0002 0.0029 0.0010 0.0039 2 25 150 52 29 259 60 319 234
Early 2020 - Early 2030 454 0.00007 -0.00018 0.00112 0.00065 0.00047 0.00213 0.00066 0.00279 5 23 132 64 37 262 47 309 239
Early 2020 - Early 2040 415 0.00004 0.00003 0.00111 0.00058 0.00041 0.00216 0.00054 0.00271 4 24 129 60 35 251 43 293 227
Derived from Town of Lakeshore Employment Land Strategy (2020) population, housing and employment forecast and discussions with municipal staff regarding servicing and land supply by Watson & Assoicates Economists Ltd., 2020
¹ Statistics Canada defines no fixed place of work (N.F.P.O.W.) employees as "persons who do not go from home to the same work place location at the beginning of each shift". Such persons include building and landscape contractors, travelling salespersons, independent truck drivers, etc.
Total (Excluding
Work at Home and
N.F.P.O.W.)
Incremental Change
Annual Average
Total
Including
NFPOW
N.F.P.O.W.1Work at
HomeIndustrial
Commercial/
Population
Related
Town of Lakeshore
Total Employment
(Including
N.F.P.O.W.)
Institutional
Schedule 10a
N.F.P.O.W.1
2020 Employment Forcecast
Activity Rate
Period PopulationPrimary
Work at
HomeIndustrial
Commercial/
Population RelatedInstitutional Total
Employment
Primary Total

Watson & Associates Economists Ltd. PAGE A-14 H:\Lakeshore\2020 DC\Report\Final Report.docx
Mid 2006 33,245 135 5,758 2,513 945 9,350 7,484,800 1,381,900 661,500 9,528,200
Mid 2011 34,546 105 4,498 2,578 1,195 8,375 5,846,800 1,417,600 836,500 8,100,900
Mid 2016 36,611 160 6,603 2,878 1,355 10,995 8,583,300 1,582,600 948,500 11,114,400
Early 2020 38,600 168 7,129 3,061 1,457 11,815 9,267,700 1,683,600 1,019,900 11,971,200
Early 2030 43,142 220 8,449 3,703 1,830 14,202 10,983,700 2,036,700 1,281,000 14,301,400
Early 2040 46,902 243 9,701 4,260 2,152 16,356 12,611,300 2,343,000 1,506,400 16,460,700
Mid 2006 - Mid 2011 1,301 -30 -1,260 65 250 -975
Mid 2011 - Mid 2016 2,065 55 2,105 300 160 2,620
Mid 2016 - Early 2020 1,989 8 527 184 102 820 684,400 101,000 71,400 856,800
Early 2020 - Early 2030 4,542 52 1,320 642 373 2,387 1,716,000 353,100 261,100 2,330,200
Early 2020 - Early 2040 8,302 75 2,572 1,199 695 4,541 3,343,600 659,400 486,500 4,489,500
Mid 2006 - Mid 2011 260 -6 -252 13 50 -195
Mid 2011 - Mid 2016 413 11 421 60 32 524
Mid 2016 - Early 2020 568 2 150 52 29 234 195,543 28,857 20,400 244,800
Early 2020 - Early 2030 454 5 132 64 37 239 171,600 35,310 26,110 233,020
Early 2020 - Early 2040 415 4 129 60 35 227 167,180 32,970 24,325 224,475
Derived from Town of Lakeshore Employment Land Strategy (2020) population, housing and employment forecast and discussions with municipal staff regarding servicing and land supply by Watson & Assoicates Economists Ltd., 20201 Square Foot Per Employee Assumptions
Industrial 1,300
Commercial/ Population Related 550
Institutional 700
Note: Numbers may not add to totals due to rounding.
Industrial Institutional Total
Incremental Change
Commercial/
Population
Related
Institutional Industrial
Commercial/
Population
Related
* Reflects Early 2020 to Early 2040 forecast period
Schedule 10b
Town of Lakeshore
Employment & Gross Floor Area (G.F.A) Forecast, 2020 to Buildout
Period Population
Employment Gross Floor Area in Square Feet (Estimated)¹
Total
Annual Average
Primary

Watson & Associates Economists Ltd. PAGE A-15 H:\Lakeshore\2020 DC\Report\Final Report.docx
2020 - 2030 1,716,000 353,100 261,100 2,330,200 2,335
2020 - 2040 3,343,600 659,400 486,500 4,489,500 4,466
2020 - 2030 - - - - -
2020 - 2040 - - - - -
2020 - 2030 1,716,000 353,100 261,100 2,330,200 2,335
2020 - 2040 3,343,600 659,400 486,500 4,489,500 4,466
1 Square feet per employee assumptions:
Industrial 1,300
Commercial 550
Institutional 700
2 Employment Increase does not include No Fixed Place of Work.
*Reflects Early 2020 to Early 2040 forecast period
Employment
Increase2
Rural
Urban
Development Location Timing
Schedule 10c
Estimate of the Anticipated Amount, Type and Location of
Non-Residential Development for Which Development Charges can be Imposed
Industrial
G.F.A. S.F.1
Commercial
G.F.A. S.F.1
Institutional
G.F.A. S.F.1
Total Non-
Residential
G.F.A. S.F.
Town of Lakeshore
Derived from Town of Lakeshore Employment Land Strategy (2020) population, housing and employment forecast and discussions with municipal staff regarding
servicing and land supply by Watson & Assoicates Economists Ltd., 2020

Watson & Associates Economists Ltd. PAGE A-16 H:\Lakeshore\2020 DC\Report\Final Report.docx
New Improve Additions Total New Improve Additions Total New Improve Additions Total New Improve Additions Total
2007 1,823 1,516 4,249 7,587 7,217 481 0 7,698 187 10 0 198 9,227 2,007 4,249 15,482
2008 9,763 567 0 10,330 8,550 306 0 8,856 6 60 0 66 18,319 933 0 19,251
2009 1,231 521 0 1,752 81 643 1,808 2,532 0 444 0 444 1,312 1,608 1,808 4,728
2010 77,529 137 0 77,666 418 2,267 0 2,685 2,319 794 524 3,637 80,267 3,198 524 83,988
2012 422 1,647 3,216 5,285 38,592 1,147 0 39,739 0 89 0 89 39,014 2,883 3,216 45,113
2013 6,141 6,639 0 12,780 1,841 460 421 2,722 0 1,041 1,894 2,935 7,982 8,140 2,314 18,436
2014 0 2,225 5,263 7,488 16,388 1,940 0 18,328 9,536 4,306 893 14,734 25,924 8,471 6,156 40,550
2015 249 2,550 0 2,799 3,662 5,206 0 8,868 13,736 1,803 0 15,540 17,647 9,560 0 27,207
2016 11,852 1,213 0 13,065 1,106 2,081 0 3,187 0 586 0 586 12,958 3,880 0 16,839
Subtotal 109,030 18,164 12,728 139,921 78,396 15,011 2,229 95,635 25,784 10,042 4,942 40,768 213,209 43,216 19,899 276,325
Percent of Total 78% 13% 9% 100% 82% 16% 2% 100% 63% 25% 12% 100% 77% 16% 7% 100%
Average 12,114 1,816 4,243 13,992 7,840 1,501 1,114 9,564 5,157 1,004 1,236 4,077 21,321 4,322 2,843 27,632
2007 - 2011
Period Total 98,504 22,791 6,885 128,179
2007 - 2011 Average 19,701 4,558 1,377 25,636
% Breakdown 76.8% 17.8% 5.4% 100.0%
2012 - 2016
Period Total 41,417 72,844 33,884 148,145
2012 - 2016 Average 8,283 14,569 6,777 29,629
% Breakdown 28.0% 49.2% 22.9% 100.0%
2007 - 2016
Period Total 139,921 95,635 40,768 276,325
2007 - 2016 Average 13,992 9,564 4,077 27,632
% Breakdown 50.6% 34.6% 14.8% 100.0%
Source: Statistics Canada Publication, 64-001-XIB
Note: Inflated to year-end 2017 (January, 2018) dollars using Reed Construction Cost Index
Years 2007 to 2016
(000's 2018 $)
YEAR Industrial Commercial Institutional Total
Schedule 11
Town of Lakeshore
Non-Residential Construction Value
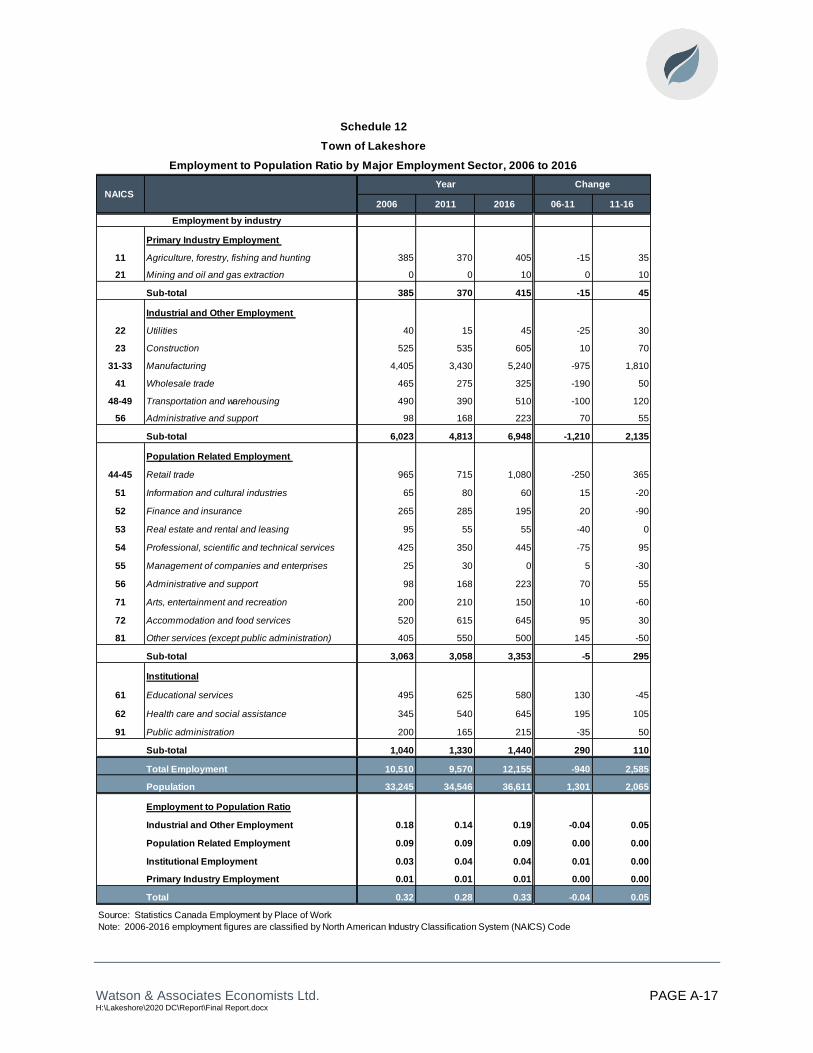
Watson & Associates Economists Ltd. PAGE A-17 H:\Lakeshore\2020 DC\Report\Final Report.docx
2006 2011 2016 06-11 11-16
Primary Industry Employment
11 Agriculture, forestry, fishing and hunting 385 370 405 -15 35
21 Mining and oil and gas extraction 0 0 10 0 10
Sub-total 385 370 415 -15 45
Industrial and Other Employment
22 Utilities 40 15 45 -25 30
23 Construction 525 535 605 10 70
31-33 Manufacturing 4,405 3,430 5,240 -975 1,810
41 Wholesale trade 465 275 325 -190 50
48-49 Transportation and warehousing 490 390 510 -100 120
56 Administrative and support 98 168 223 70 55
Sub-total 6,023 4,813 6,948 -1,210 2,135
Population Related Employment
44-45 Retail trade 965 715 1,080 -250 365
51 Information and cultural industries 65 80 60 15 -20
52 Finance and insurance 265 285 195 20 -90
53 Real estate and rental and leasing 95 55 55 -40 0
54 Professional, scientific and technical services 425 350 445 -75 95
55 Management of companies and enterprises 25 30 0 5 -30
56 Administrative and support 98 168 223 70 55
71 Arts, entertainment and recreation 200 210 150 10 -60
72 Accommodation and food services 520 615 645 95 30
81 Other services (except public administration) 405 550 500 145 -50
Sub-total 3,063 3,058 3,353 -5 295
Institutional
61 Educational services 495 625 580 130 -45
62 Health care and social assistance 345 540 645 195 105
91 Public administration 200 165 215 -35 50
Sub-total 1,040 1,330 1,440 290 110
Total Employment 10,510 9,570 12,155 -940 2,585
Population 33,245 34,546 36,611 1,301 2,065
Employment to Population Ratio
Industrial and Other Employment 0.18 0.14 0.19 -0.04 0.05
Population Related Employment 0.09 0.09 0.09 0.00 0.00
Institutional Employment 0.03 0.04 0.04 0.01 0.00
Primary Industry Employment 0.01 0.01 0.01 0.00 0.00
Total 0.32 0.28 0.33 -0.04 0.05
Source: Statistics Canada Employment by Place of Work
Note: 2006-2016 employment figures are classified by North American Industry Classification System (NAICS) Code
Employment by industry
Change
Schedule 12
Town of Lakeshore
Employment to Population Ratio by Major Employment Sector, 2006 to 2016
NAICS Year

Watson & Associates Economists Ltd. PAGE B-1 H:\Lakeshore\2020 DC\Report\Final Report.docx
Appendix B
Level of Service
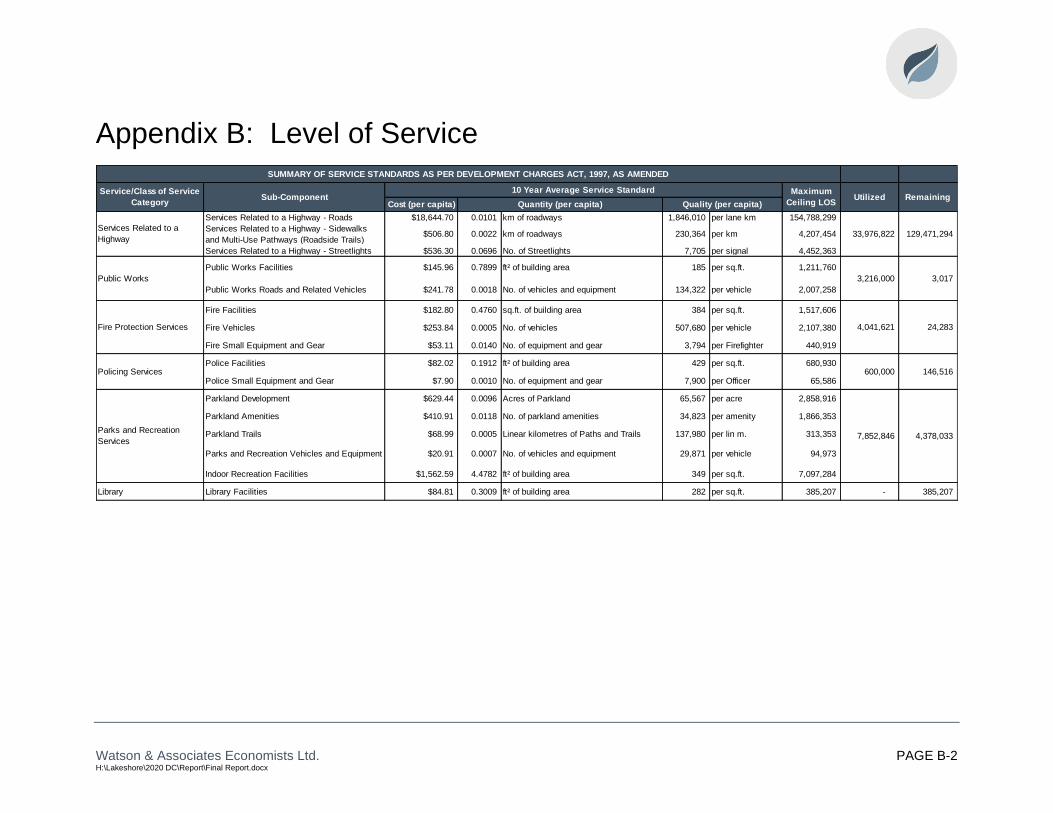
Watson & Associates Economists Ltd. PAGE B-2 H:\Lakeshore\2020 DC\Report\Final Report.docx
Appendix B: Level of Service
Cost (per capita)
Services Related to a Highway - Roads $18,644.70 0.0101 km of roadways 1,846,010 per lane km 154,788,299
Services Related to a Highway - Sidewalks
and Multi-Use Pathways (Roadside Trails)$506.80 0.0022 km of roadways 230,364 per km 4,207,454
Services Related to a Highway - Streetlights $536.30 0.0696 No. of Streetlights 7,705 per signal 4,452,363
Public Works Facilities $145.96 0.7899 ft² of building area 185 per sq.ft. 1,211,760
Public Works Roads and Related Vehicles $241.78 0.0018 No. of vehicles and equipment 134,322 per vehicle 2,007,258
Fire Facilities $182.80 0.4760 sq.ft. of building area 384 per sq.ft. 1,517,606
Fire Vehicles $253.84 0.0005 No. of vehicles 507,680 per vehicle 2,107,380
Fire Small Equipment and Gear $53.11 0.0140 No. of equipment and gear 3,794 per Firefighter 440,919
Police Facilities $82.02 0.1912 ft² of building area 429 per sq.ft. 680,930
Police Small Equipment and Gear $7.90 0.0010 No. of equipment and gear 7,900 per Officer 65,586
Parkland Development $629.44 0.0096 Acres of Parkland 65,567 per acre 2,858,916
Parkland Amenities $410.91 0.0118 No. of parkland amenities 34,823 per amenity 1,866,353
Parkland Trails $68.99 0.0005 Linear kilometres of Paths and Trails 137,980 per lin m. 313,353
Parks and Recreation Vehicles and Equipment $20.91 0.0007 No. of vehicles and equipment 29,871 per vehicle 94,973
Indoor Recreation Facilities $1,562.59 4.4782 ft² of building area 349 per sq.ft. 7,097,284
Library Library Facilities $84.81 0.3009 ft² of building area 282 per sq.ft. 385,207 - 385,207
Fire Protection Services
Policing Services
Parks and Recreation
Services
4,041,621 24,283
600,000 146,516
7,852,846 4,378,033
SUMMARY OF SERVICE STANDARDS AS PER DEVELOPMENT CHARGES ACT, 1997, AS AMENDED
10 Year Average Service Standard
Quality (per capita)Quantity (per capita)
Service/Class of Service
CategorySub-Component
Services Related to a
Highway
Public Works 3,216,000 3,017
Utilized RemainingMaximum
Ceiling LOS
33,976,822 129,471,294

Watson & Associates Economists Ltd. PAGE B-3 H:\Lakeshore\2020 DC\Report\Final Report.docx
Town of Lakeshore
Service Standard Calculation Sheet
Service: Services Related to a Highway - Roads
Unit Measure: km of roadways
Description 2010 2011 2012 2013 2014 2015 2016 2017 2018 20192020 Value
($/km)
Arterial/Collector - Urban 24 24 24 24 24 24 24 24 24 24 $2,994,500
Arterial/Collector - Rural (Tar & Chip) 210 210 210 210 210 210 213 219 219 219 $1,815,000
Arterial/Collector - Rural (Gravel) 130 130 130 130 130 130 127 122 122 122 $1,687,300
Total 364 364 364 364 364 364 364 364 364 364
Population 34,259 34,546 34,982 35,431 35,803 36,052 36,610 37,213 37,938 38,465
Per Capita Standard 0.011 0.011 0.010 0.010 0.010 0.010 0.010 0.010 0.010 0.010
10 Year Average 2010-2019
Quantity Standard 0.0101
Quality Standard $1,846,010
Service Standard $18,645
D.C. Amount (before deductions) 20 Year
Forecast Population 8,302
$ per Capita $18,645
Eligible Amount $154,788,299
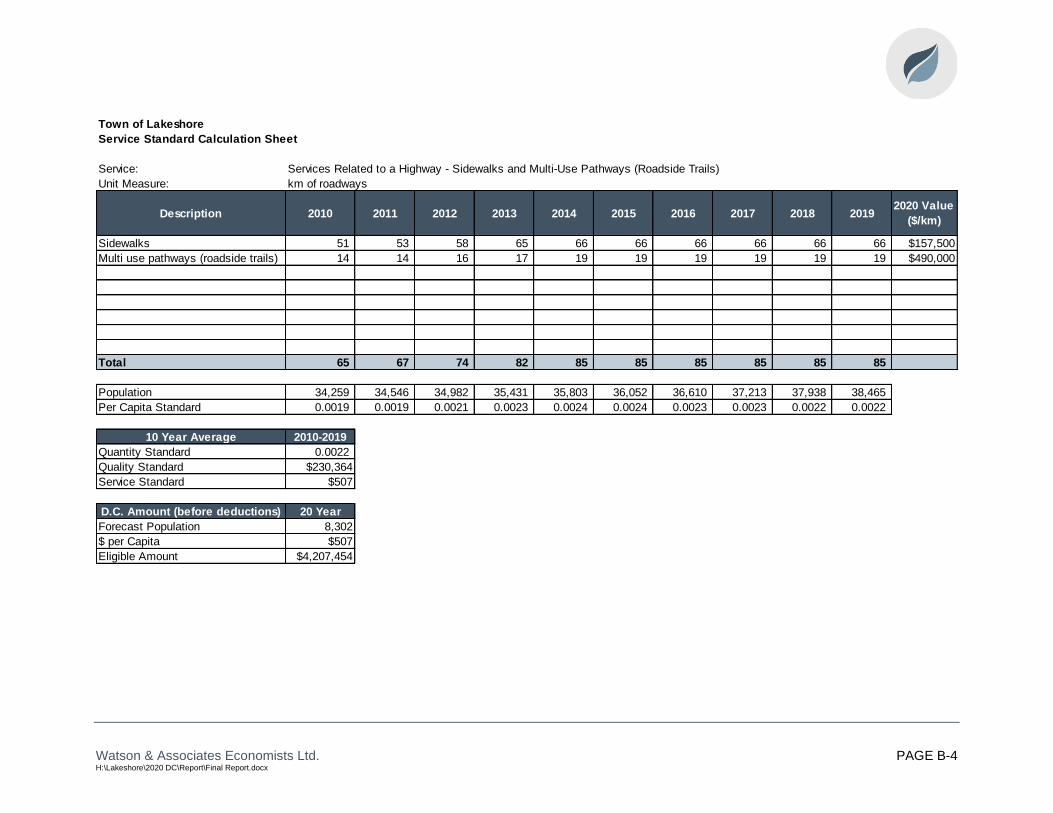
Watson & Associates Economists Ltd. PAGE B-4 H:\Lakeshore\2020 DC\Report\Final Report.docx
Town of Lakeshore
Service Standard Calculation Sheet
Service: Services Related to a Highway - Sidewalks and Multi-Use Pathways (Roadside Trails)
Unit Measure: km of roadways
Description 2010 2011 2012 2013 2014 2015 2016 2017 2018 20192020 Value
($/km)
Sidewalks 51 53 58 65 66 66 66 66 66 66 $157,500
Multi use pathways (roadside trails) 14 14 16 17 19 19 19 19 19 19 $490,000
Total 65 67 74 82 85 85 85 85 85 85
Population 34,259 34,546 34,982 35,431 35,803 36,052 36,610 37,213 37,938 38,465
Per Capita Standard 0.0019 0.0019 0.0021 0.0023 0.0024 0.0024 0.0023 0.0023 0.0022 0.0022
10 Year Average 2010-2019
Quantity Standard 0.0022
Quality Standard $230,364
Service Standard $507
D.C. Amount (before deductions) 20 Year
Forecast Population 8,302
$ per Capita $507
Eligible Amount $4,207,454

Watson & Associates Economists Ltd. PAGE B-5 H:\Lakeshore\2020 DC\Report\Final Report.docx
Town of Lakeshore
Service Standard Calculation Sheet
Service: Services Related to a Highway - Streetlights
Unit Measure: No. of Streetlights
Description 2010 2011 2012 2013 2014 2015 2016 2017 2018 20192020 Value
($/item)
Streetlights 2,109 2,117 2,199 2,202 2,611 - - - - - $7,700
Streetlights (Standard) - - - - - 2,062 2,142 2,164 2,179 2,179 $7,000
Decorative Streetlights - - - - - 614 628 644 690 690 $10,000
Total 2,109 2,117 2,199 2,202 2,611 2,676 2,770 2,808 2,869 2,869
Population 34,259 34,546 34,982 35,431 35,803 36,052 36,610 37,213 37,938 38,465
Per Capita Standard 0.06 0.06 0.06 0.06 0.07 0.07 0.08 0.08 0.08 0.07
10 Year Average 2010-2019
Quantity Standard 0.0696
Quality Standard $7,705
Service Standard $536
D.C. Amount (before deductions) 20 Year
Forecast Population 8,302
$ per Capita $536
Eligible Amount $4,452,363

Watson & Associates Economists Ltd. PAGE B-6 H:\Lakeshore\2020 DC\Report\Final Report.docx
Town of Lakeshore
Service Standard Calculation Sheet
Class of Service: Public Works Facilities
Unit Measure: ft² of building area
Description 2010 2011 2012 2013 2014 2015 2016 2017 2018 2019
2020
Bld'g
Value
($/sq.ft.)
Value/sq.ft.
with land,
site works,
etc.
Maidstone Road Garage 9,140 9,140 9,140 9,140 9,140 9,140 9,140 9,140 9,140 9,140 $161 $192
Maidstone Salt Shed - - - - - - 6,800 6,800 6,800 6,800 $147 $147
Rochester Garage 10,952 10,952 10,952 10,952 10,952 10,952 10,952 10,952 10,952 10,952 $161 $192
Rochester Salt Shed 1,345 1,345 1,345 1,345 1,345 1,345 1,345 1,345 1,345 1,345 $90 $90
Garage - Belle River 1,960 1,960 1,960 1,960 1,960 1,960 1,960 1,960 1,960 1,960 $221 $258
Public Works Office Space 993 993 993 993 993 993 993 993 993 993 $227 $265
Maidstone Storage Shed 1,496 1,496 1,496 1,496 1,496 1,496 1,496 1,496 1,496 1,496 $90 $90
Total 25,886 25,886 25,886 25,886 25,886 25,886 32,686 32,686 32,686 32,686
Population 34,259 34,546 34,982 35,431 35,803 36,052 36,610 37,213 37,938 38,465
Per Capita Standard 0.7556 0.7493 0.7400 0.7306 0.7230 0.7180 0.8928 0.8783 0.8616 0.8498
10 Year Average 2010-2019
Quantity Standard 0.7899
Quality Standard $185
Service Standard $146
D.C. Amount (before deductions) 20 Year
Forecast Population 8,302
$ per Capita $146
Eligible Amount $1,211,760

Watson & Associates Economists Ltd. PAGE B-7 H:\Lakeshore\2020 DC\Report\Final Report.docx
Town of Lakeshore
Service Standard Calculation Sheet
Class of Service: Public Works Roads and Related Vehicles
Unit Measure: No. of vehicles and equipment
Description 2010 2011 2012 2013 2014 2015 2016 2017 2018 20192020 Value
($/Vehicle)
Public Works:
1 ton truck 4 4 4 4 4 4 4 4 4 4 $100,000
1/2 ton truck 1 1 1 1 2 3 3 3 3 3 $40,000
Tandem truck 5 5 5 5 5 5 5 5 5 5 $350,000
Single axle truck 5 5 5 5 5 5 5 5 5 5 $293,200
Sweeper 1 1 1 1 1 1 1 1 1 1 $285,500
Grader 4 4 4 4 3 3 3 3 3 3 $410,400
Backhoe 2 3 2 2 2 2 2 2 2 2 $153,600
Front End Loader 1 1 1 1 1 1 1 1 1 1 $234,500
Chipper 1 1 1 1 1 1 1 1 1 1 $70,400
Trailer 1 1 1 1 1 1 1 1 1 1 $58,600
Mower 2 2 2 2 2 2 2 2 2 2 $18,800
Tractor 2 2 2 2 2 2 2 2 2 2 $83,300
Autocrane - - - 1 1 1 1 1 1 1 $16,000
Brine wetting tanks 1 1 1 1 1 - - - - - $27,000
Water Tanks - - - - - - - 1 1 1 $40,000
Pickup 1 1 1 1 1 2 2 2 2 2 $35,000
Aerial truck 1 1 1 1 1 1 1 1 1 1 $153,600
Asphalt Planner $27,000
Snow Blower $9,000
Car (EIS Technician) - - - - - - - 1 1 1 $24,500
Generators:
Generator - townhall (Public Works,
Building & Planning)0.31 0.31 0.31 0.31 0.31 0.31 0.31 0.31 0.31 0.31 $283,200
Building:
Generator - water plant - Belle River 1 1 1 1 1 1 1 1 1 1 $293,200
Generator - water plant - Stoney Pt 1 1 1 1 1 1 1 1 1 1 $70,400
Generator - water - pump stations 2 2 2 2 2 2 2 2 2 2 $29,300
Generator - sanitary - Rourke plant 1 1 1 1 1 1 1 1 1 1 $170,000
Generator - sanitary 4 4 4 4 4 4 4 4 4 4 $46,900
Valve maintenance equipment - 1 1 1 1 1 1 1 1 1 $111,400
Car for Building Inspector - - - - - - - 1 1 1 $30,000

Watson & Associates Economists Ltd. PAGE B-8 H:\Lakeshore\2020 DC\Report\Final Report.docx
Town of Lakeshore
Service Standard Calculation Sheet
Class of Service: Public Works Roads and Related Vehicles
Unit Measure: No. of vehicles and equipment
Description 2010 2011 2012 2013 2014 2015 2016 2017 2018 20192020 Value
($/Vehicle)
Car for By-Law Officer - - - - - - - 1 1 1 $30,000
Sanitary:
Sludger/hauler - Sewage 1 1 1 1 1 1 1 1 1 1 $205,200
Pickup 3 3 2 2 2 - - - - - $36,400
Car - - 1 1 1 - - - - - $25,800
Boom Truck 1 1 1 1 1 $175,900
Drainage:
1/2 ton 1 1 1 1 1 1 1 1 1 1 $40,000
Water:
Minivan 3 3 3 3 3 1 1 1 1 1 $35,000
Pickup 3 3 2 2 2 2 2 2 2 2 $36,400
1/2 ton 2 2 3 2 2 2 2 2 2 2 $40,000
3/4 ton 2 2 2 2 2 2 2 2 2 2 $49,300
1 ton 3 3 4 4 4 4 4 4 4 4 $100,000
Forklift 1 1 1 1 1 1 1 1 1 1 $41,000
Small truck crane - 1 1 1 1 1 1 1 1 1 $29,300
Car - - - - - 4 4 4 4 4 $24,900
Total 60 63 63 63 63 64 64 68 68 68
Population 34,259 34,546 34,982 35,431 35,803 36,052 36,610 37,213 37,938 38,465
Per Capita Standard 0.0018 0.0018 0.0018 0.0018 0.0018 0.0018 0.0018 0.0018 0.0018 0.0018
10 Year Average 2010-2019
Quantity Standard 0.0018
Quality Standard $134,322
Service Standard $242
D.C. Amount (before deductions) 20 Year
Forecast Population 8,302
$ per Capita $242
Eligible Amount $2,007,258

Watson & Associates Economists Ltd. PAGE B-9 H:\Lakeshore\2020 DC\Report\Final Report.docx
Town of Lakeshore
Service Standard Calculation Sheet
Service: Fire Facilities
Unit Measure: sq.ft. of building area
Description 2010 2011 2012 2013 2014 2015 2016 2017 2018 2019
2020
Bld'g
Value
($/sq.ft.)
Value/sq.ft.
with land,
site works,
etc.
Fire Station #1 - Puce 3,295 3,295 3,295 3,601 3,601 3,601 3,601 3,601 3,601 3,601 $320 $384
Fire Station #2 - MD - 6/7 Siderd and 46 3,575 3,575 3,575 3,575 3,575 3,575 3,575 3,575 3,575 3,575 $320 $384
Fire Station #3 - Belle River 3,200 3,200 3,200 3,200 3,200 3,200 3,200 3,200 3,200 3,200 $320 $384
Fire Station #4 - Rochester (Cty Rd 31) 3,200 3,200 3,200 3,200 3,200 3,200 3,200 3,200 3,200 3,200 $320 $384
Fire Station #5 - Comber 3,695 3,695 3,695 3,695 3,695 3,695 3,695 3,695 3,695 3,695 $320 $384
Total 16,965 16,965 16,965 17,271 17,271 17,271 17,271 17,271 17,271 17,271
Population 34,259 34,546 34,982 35,431 35,803 36,052 36,610 37,213 37,938 38,465
Per Capita Standard 0.4952 0.4911 0.4850 0.4875 0.4824 0.4791 0.4718 0.4641 0.4552 0.4490
10 Year Average 2010-2019
Quantity Standard 0.4760
Quality Standard $384
Service Standard $183
D.C. Amount (before deductions) 20 Year
Forecast Population 8,302
$ per Capita $183
Eligible Amount $1,517,606

Watson & Associates Economists Ltd. PAGE B-10 H:\Lakeshore\2020 DC\Report\Final Report.docx
Town of Lakeshore
Service Standard Calculation Sheet
Service: Fire Vehicles
Unit Measure: No. of vehicles
Description 2010 2011 2012 2013 2014 2015 2016 2017 2018 20192020 Value
($/Vehicle)
Fire Engine 6 6 6 6 6 6 6 6 6 6 $802,000
Fire Rescue 1 1 1 1 1 1 1 1 1 1 $300,000
Fire Tanker 2 2 2 2 3 3 3 3 3 3 $645,000
Aerial truck 1 1 1 1 1 1 1 1 1 1 $1,572,600
1/2 ton truck 2 1 1 1 1 1 1 1 1 1 $55,500
3/4 ton truck 1 1 1 1 1 1 1 1 1 1 $65,000
Minivan 2 2 2 2 1 1 1 1 1 1 $40,000
Fire Safety House Trailer 1 1 1 1 1 1 1 1 1 1 $55,500
Pickup 2 2 2 2 - - - - - - $59,800
Pumper 2 2 2 2 - - - - - - $464,400
SUV - - - - 3 3 3 3 3 3 $76,000
Total 20 19 19 19 18 18 18 18 18 18
Population 34,259 34,546 34,982 35,431 35,803 36,052 36,610 37,213 37,938 38,465
Per Capita Standard 0.0006 0.0005 0.0005 0.0005 0.0005 0.0005 0.0005 0.0005 0.0005 0.0005
10 Year Average 2010-2019
Quantity Standard 0.0005
Quality Standard $507,680
Service Standard $254
D.C. Amount (before deductions) 20 Year
Forecast Population 8,302
$ per Capita $254
Eligible Amount $2,107,380
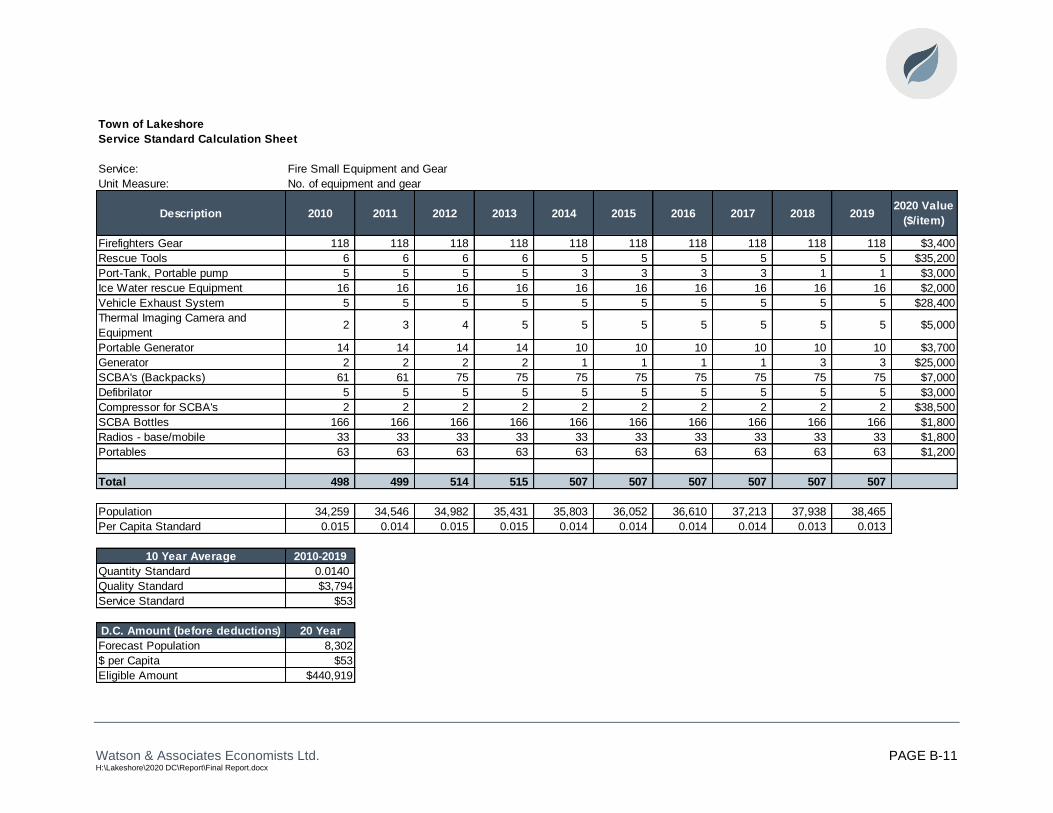
Watson & Associates Economists Ltd. PAGE B-11 H:\Lakeshore\2020 DC\Report\Final Report.docx
Town of Lakeshore
Service Standard Calculation Sheet
Service: Fire Small Equipment and Gear
Unit Measure: No. of equipment and gear
Description 2010 2011 2012 2013 2014 2015 2016 2017 2018 20192020 Value
($/item)
Firefighters Gear 118 118 118 118 118 118 118 118 118 118 $3,400
Rescue Tools 6 6 6 6 5 5 5 5 5 5 $35,200
Port-Tank, Portable pump 5 5 5 5 3 3 3 3 1 1 $3,000
Ice Water rescue Equipment 16 16 16 16 16 16 16 16 16 16 $2,000
Vehicle Exhaust System 5 5 5 5 5 5 5 5 5 5 $28,400
Thermal Imaging Camera and
Equipment2 3 4 5 5 5 5 5 5 5 $5,000
Portable Generator 14 14 14 14 10 10 10 10 10 10 $3,700
Generator 2 2 2 2 1 1 1 1 3 3 $25,000
SCBA's (Backpacks) 61 61 75 75 75 75 75 75 75 75 $7,000
Defibrilator 5 5 5 5 5 5 5 5 5 5 $3,000
Compressor for SCBA's 2 2 2 2 2 2 2 2 2 2 $38,500
SCBA Bottles 166 166 166 166 166 166 166 166 166 166 $1,800
Radios - base/mobile 33 33 33 33 33 33 33 33 33 33 $1,800
Portables 63 63 63 63 63 63 63 63 63 63 $1,200
Total 498 499 514 515 507 507 507 507 507 507
Population 34,259 34,546 34,982 35,431 35,803 36,052 36,610 37,213 37,938 38,465
Per Capita Standard 0.015 0.014 0.015 0.015 0.014 0.014 0.014 0.014 0.013 0.013
10 Year Average 2010-2019
Quantity Standard 0.0140
Quality Standard $3,794
Service Standard $53
D.C. Amount (before deductions) 20 Year
Forecast Population 8,302
$ per Capita $53
Eligible Amount $440,919
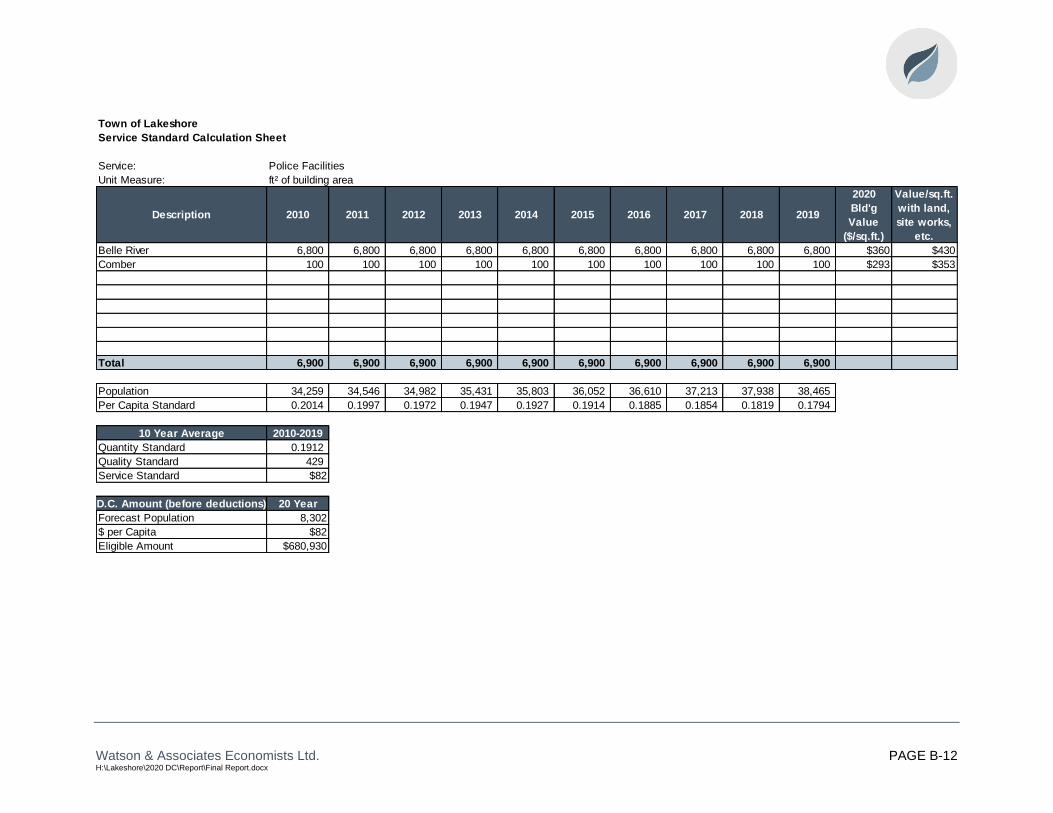
Watson & Associates Economists Ltd. PAGE B-12 H:\Lakeshore\2020 DC\Report\Final Report.docx
Town of Lakeshore
Service Standard Calculation Sheet
Service: Police Facilities
Unit Measure: ft² of building area
Description 2010 2011 2012 2013 2014 2015 2016 2017 2018 2019
2020
Bld'g
Value
($/sq.ft.)
Value/sq.ft.
with land,
site works,
etc.
Belle River 6,800 6,800 6,800 6,800 6,800 6,800 6,800 6,800 6,800 6,800 $360 $430
Comber 100 100 100 100 100 100 100 100 100 100 $293 $353
Total 6,900 6,900 6,900 6,900 6,900 6,900 6,900 6,900 6,900 6,900
Population 34,259 34,546 34,982 35,431 35,803 36,052 36,610 37,213 37,938 38,465
Per Capita Standard 0.2014 0.1997 0.1972 0.1947 0.1927 0.1914 0.1885 0.1854 0.1819 0.1794
10 Year Average 2010-2019
Quantity Standard 0.1912
Quality Standard 429
Service Standard $82
D.C. Amount (before deductions) 20 Year
Forecast Population 8,302
$ per Capita $82
Eligible Amount $680,930

Watson & Associates Economists Ltd. PAGE B-13 H:\Lakeshore\2020 DC\Report\Final Report.docx
Town of Lakeshore
Service Standard Calculation Sheet
Service: Police Small Equipment and Gear
Unit Measure: No. of equipment and gear
Description 2010 2011 2012 2013 2014 2015 2016 2017 2018 20192020 Value
($/item)
Police Equipment and Gear (FTE) 33 33 33 34 35 35 35 35 35 35 $6,100
Generator 1 1 1 1 1 1 1 1 1 1 $35,300
Trailer 1 1 1 1 1 1 1 2 2 2 $31,700
Total 35 35 35 36 37 37 37 38 38 38
Population 34,259 34,546 34,982 35,431 35,803 36,052 36,610 37,213 37,938 38,465
Per Capita Standard 0.0010 0.0010 0.0010 0.0010 0.0010 0.0010 0.0010 0.0010 0.0010 0.0010
10 Year Average 2010-2019
Quantity Standard 0.0010
Quality Standard $7,900
Service Standard $8
D.C. Amount (before deductions) 20 Year
Forecast Population 8,302
$ per Capita $8
Eligible Amount $65,586

Watson & Associates Economists Ltd. PAGE B-14 H:\Lakeshore\2020 DC\Report\Final Report.docx
Town of Lakeshore
Service Standard Calculation Sheet
Service: Parkland Development
Unit Measure: Acres of Parkland
Description 2010 2011 2012 2013 2014 2015 2016 2017 2018 20192020 Value
($/Acre)
Centennial 9.00 9.00 9.00 9.00 9.00 9.00 9.00 9.00 9.00 9.00 $70,500
Duck Creek 6.00 6.00 6.00 6.00 6.00 6.00 6.00 6.00 6.00 6.00 $70,500
Geralyn Tellier 37.00 37.00 37.00 37.00 37.00 37.00 37.00 37.00 37.00 37.00 $70,500
Helena 0.40 0.40 0.40 0.40 0.40 0.40 0.40 0.40 0.40 0.40 $70,500
Girard 0.60 0.60 0.60 0.60 0.60 0.60 0.60 0.60 0.60 0.60 $12,800
Johnson 0.20 0.20 0.20 0.20 0.20 0.20 0.20 0.20 0.20 0.20 $70,500
Ladouceur/Lions 7.00 7.00 7.00 7.00 7.00 7.00 7.00 7.00 7.00 7.00 $70,500
Lakeview 21.00 21.00 22.00 22.00 22.00 22.00 22.00 22.00 22.00 22.00 $70,500
Leffler Peace 11.00 11.00 11.00 11.00 11.00 11.00 11.00 11.00 11.00 11.00 $70,500
Lighthouse Cove 4.00 4.00 4.00 4.00 4.00 4.00 4.00 4.00 4.00 4.00 $70,500
Maidstone 10.00 10.00 10.00 10.00 10.00 10.00 10.00 10.00 10.00 10.00 $70,500
Millen 10.00 10.00 10.00 10.00 10.00 10.00 10.00 10.00 10.00 10.00 $70,500
Oakwood 1.00 1.00 1.00 1.00 1.00 1.00 1.00 1.00 1.00 1.00 $70,500
Optimist 12.00 12.00 12.00 12.00 12.00 12.00 12.00 12.00 12.00 12.00 $70,500
Optimist park in Comber Percy St 0.50 0.50 0.50 0.50 0.50 0.50 0.50 0.50 0.50 0.50 $70,500
Pleasant 6.00 6.00 6.00 6.00 6.00 6.00 6.00 6.00 6.00 6.00 $70,500
River Ridge 26.00 26.00 26.00 26.00 26.00 26.00 26.00 26.00 26.00 26.00 $70,500
Russell Woods 0.80 0.80 0.80 0.80 0.80 0.80 0.80 0.80 0.80 0.80 $70,500
River Downs 0.22 0.22 0.22 0.22 0.22 0.22 0.22 0.22 0.22 0.22 $70,500
Soccer park 77.00 77.00 77.00 77.00 77.00 77.00 77.00 77.00 77.00 77.00 $70,500
Next to soccer park 41.00 41.00 41.00 41.00 41.00 41.00 41.00 41.00 41.00 41.00 $70,500
St. Clair Shores 5.00 5.00 5.00 5.00 5.00 5.00 5.00 5.00 5.00 5.00 $70,500
Staples 2.00 2.00 2.00 2.00 2.00 2.00 2.00 2.00 2.00 2.00 $70,500
Terra Lou 0.08 0.08 0.08 0.08 0.08 0.08 0.08 0.08 0.08 0.08 $70,500
Tilbury North 23.00 23.00 23.00 23.00 23.00 23.00 23.00 23.00 23.00 23.00 $70,500
Wallace Woods - Tot Lot - - - - - - - - 0.22 0.22 $70,500
Woodslee Memorial 5.00 5.00 5.00 5.00 5.00 5.00 5.00 5.00 5.00 5.00 $70,500
Parkettes - - - 2.00 2.00 2.00 2.00 2.00 2.00 2.00 $193,500

Watson & Associates Economists Ltd. PAGE B-15 H:\Lakeshore\2020 DC\Report\Final Report.docx
Town of Lakeshore
Service Standard Calculation Sheet
Service: Parkland Development
Unit Measure: Acres of Parkland
Description 2010 2011 2012 2013 2014 2015 2016 2017 2018 20192020 Value
($/Acre)
St Joachim (not developed) 28.00 28.00 28.00 28.00 28.00 28.00 28.00 28.00 28.00 28.00 $5,700
Total 343.80 343.80 344.80 346.80 346.80 346.80 346.80 346.80 347.02 347.02
Population 34,259 34,546 34,982 35,431 35,803 36,052 36,610 37,213 37,938 38,465
Per Capita Standard 0.010 0.010 0.010 0.010 0.010 0.010 0.010 0.009 0.009 0.009
10 Year Average 2010-2019
Quantity Standard 0.0096
Quality Standard $65,567
Service Standard $629
D.C. Amount (before deductions) 10 Year
Forecast Population 4,542
$ per Capita $629
Eligible Amount $2,858,916
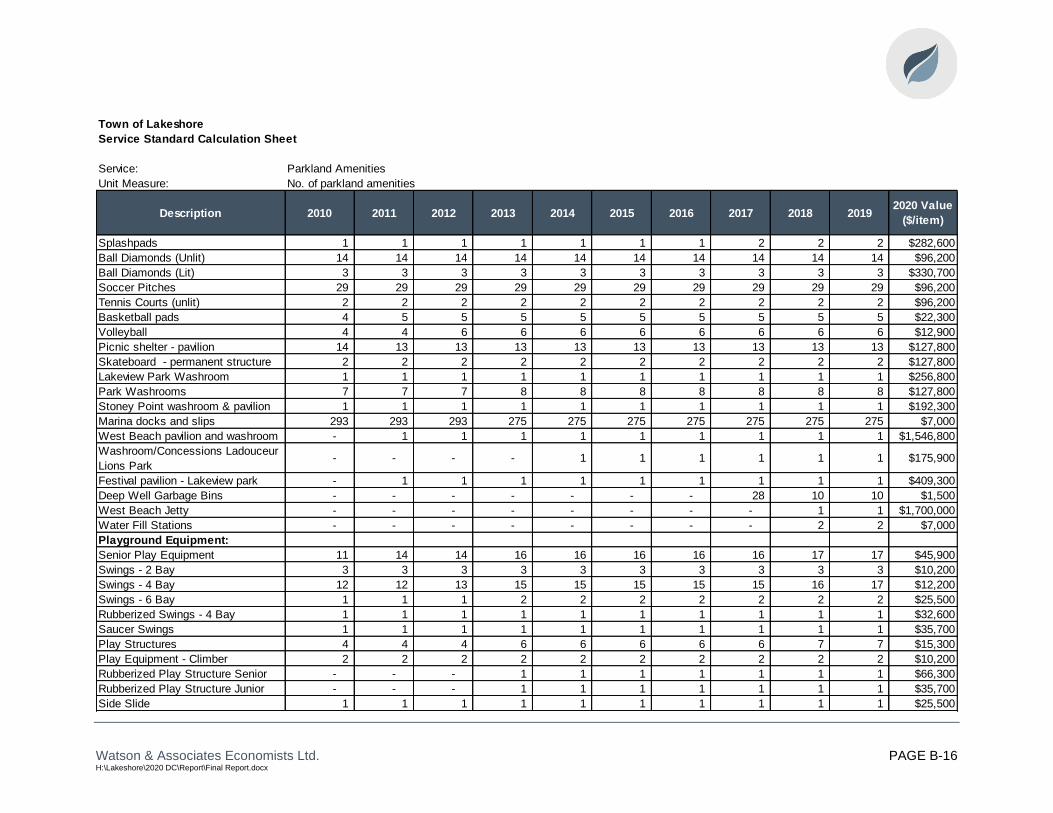
Watson & Associates Economists Ltd. PAGE B-16 H:\Lakeshore\2020 DC\Report\Final Report.docx
Town of Lakeshore
Service Standard Calculation Sheet
Service: Parkland Amenities
Unit Measure: No. of parkland amenities
Description 2010 2011 2012 2013 2014 2015 2016 2017 2018 20192020 Value
($/item)
Splashpads 1 1 1 1 1 1 1 2 2 2 $282,600
Ball Diamonds (Unlit) 14 14 14 14 14 14 14 14 14 14 $96,200
Ball Diamonds (Lit) 3 3 3 3 3 3 3 3 3 3 $330,700
Soccer Pitches 29 29 29 29 29 29 29 29 29 29 $96,200
Tennis Courts (unlit) 2 2 2 2 2 2 2 2 2 2 $96,200
Basketball pads 4 5 5 5 5 5 5 5 5 5 $22,300
Volleyball 4 4 6 6 6 6 6 6 6 6 $12,900
Picnic shelter - pavilion 14 13 13 13 13 13 13 13 13 13 $127,800
Skateboard - permanent structure 2 2 2 2 2 2 2 2 2 2 $127,800
Lakeview Park Washroom 1 1 1 1 1 1 1 1 1 1 $256,800
Park Washrooms 7 7 7 8 8 8 8 8 8 8 $127,800
Stoney Point washroom & pavilion 1 1 1 1 1 1 1 1 1 1 $192,300
Marina docks and slips 293 293 293 275 275 275 275 275 275 275 $7,000
West Beach pavilion and washroom - 1 1 1 1 1 1 1 1 1 $1,546,800
Washroom/Concessions Ladouceur
Lions Park- - - - 1 1 1 1 1 1 $175,900
Festival pavilion - Lakeview park - 1 1 1 1 1 1 1 1 1 $409,300
Deep Well Garbage Bins - - - - - - - 28 10 10 $1,500
West Beach Jetty - - - - - - - - 1 1 $1,700,000
Water Fill Stations - - - - - - - - 2 2 $7,000
Playground Equipment:
Senior Play Equipment 11 14 14 16 16 16 16 16 17 17 $45,900
Swings - 2 Bay 3 3 3 3 3 3 3 3 3 3 $10,200
Swings - 4 Bay 12 12 13 15 15 15 15 15 16 17 $12,200
Swings - 6 Bay 1 1 1 2 2 2 2 2 2 2 $25,500
Rubberized Swings - 4 Bay 1 1 1 1 1 1 1 1 1 1 $32,600
Saucer Swings 1 1 1 1 1 1 1 1 1 1 $35,700
Play Structures 4 4 4 6 6 6 6 6 7 7 $15,300
Play Equipment - Climber 2 2 2 2 2 2 2 2 2 2 $10,200
Rubberized Play Structure Senior - - - 1 1 1 1 1 1 1 $66,300
Rubberized Play Structure Junior - - - 1 1 1 1 1 1 1 $35,700
Side Slide 1 1 1 1 1 1 1 1 1 1 $25,500
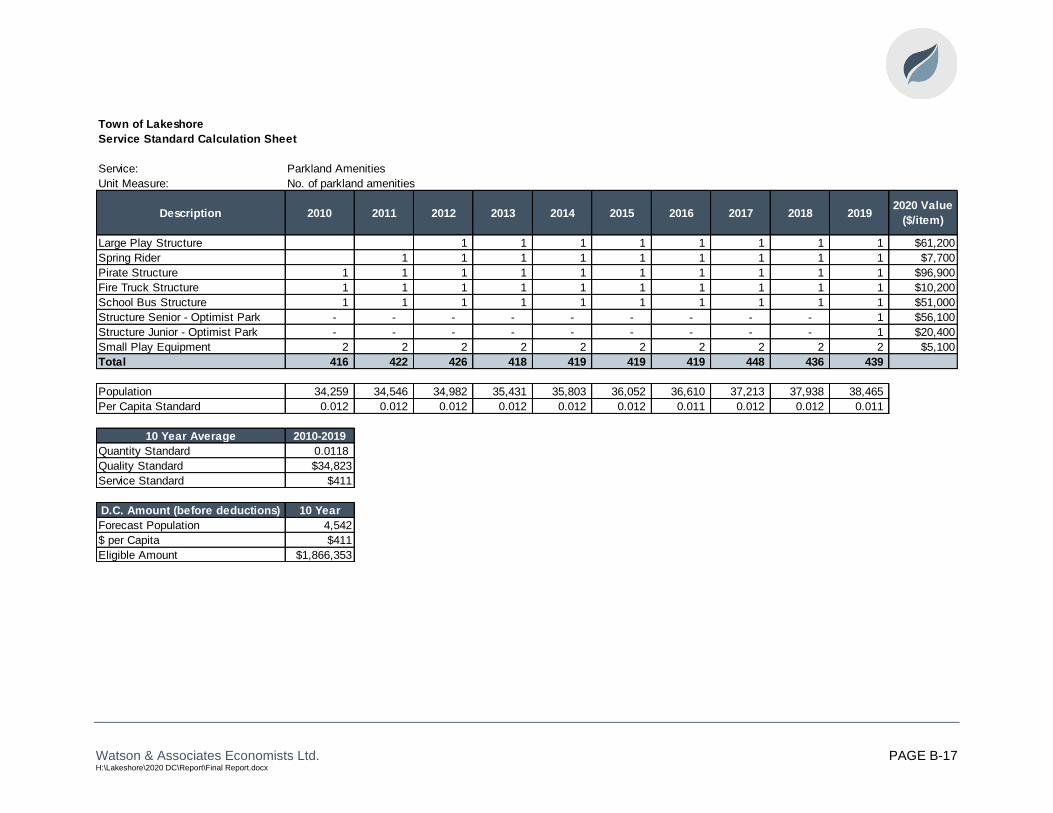
Watson & Associates Economists Ltd. PAGE B-17 H:\Lakeshore\2020 DC\Report\Final Report.docx
Town of Lakeshore
Service Standard Calculation Sheet
Service: Parkland Amenities
Unit Measure: No. of parkland amenities
Description 2010 2011 2012 2013 2014 2015 2016 2017 2018 20192020 Value
($/item)
Large Play Structure 1 1 1 1 1 1 1 1 $61,200
Spring Rider 1 1 1 1 1 1 1 1 1 $7,700
Pirate Structure 1 1 1 1 1 1 1 1 1 1 $96,900
Fire Truck Structure 1 1 1 1 1 1 1 1 1 1 $10,200
School Bus Structure 1 1 1 1 1 1 1 1 1 1 $51,000
Structure Senior - Optimist Park - - - - - - - - - 1 $56,100
Structure Junior - Optimist Park - - - - - - - - - 1 $20,400
Small Play Equipment 2 2 2 2 2 2 2 2 2 2 $5,100
Total 416 422 426 418 419 419 419 448 436 439
Population 34,259 34,546 34,982 35,431 35,803 36,052 36,610 37,213 37,938 38,465
Per Capita Standard 0.012 0.012 0.012 0.012 0.012 0.012 0.011 0.012 0.012 0.011
10 Year Average 2010-2019
Quantity Standard 0.0118
Quality Standard $34,823
Service Standard $411
D.C. Amount (before deductions) 10 Year
Forecast Population 4,542
$ per Capita $411
Eligible Amount $1,866,353

Watson & Associates Economists Ltd. PAGE B-18 H:\Lakeshore\2020 DC\Report\Final Report.docx
Town of Lakeshore
Service Standard Calculation Sheet
Service: Parkland Trails
Unit Measure: Linear kilometres of Paths and Trails
Description 2010 2011 2012 2013 2014 2015 2016 2017 2018 2019
2020 Value
($/ Linear
kilometre)
Leffler Park 0.60 0.60 0.60 0.60 0.60 0.60 0.60 0.60 0.60 0.60 $140,700
Centennial Park 0.60 0.60 0.60 0.60 0.60 0.60 0.60 0.60 0.60 0.60 $140,700
Lakeview Park 1.70 2.70 2.70 2.70 2.70 2.70 2.70 2.70 2.70 2.70 $140,700
Maidstone Park 0.70 0.70 0.70 0.70 0.70 0.70 0.70 0.70 0.70 0.70 $140,700
Tilbury North Park 1.40 1.40 1.40 1.40 1.40 1.40 1.40 1.40 1.40 1.40 $140,700
Optimist Park 0.40 0.40 0.40 0.40 0.40 1.00 1.00 1.00 1.00 1.00 $140,700
Pleasant Park 0.60 0.60 0.60 0.60 0.60 0.60 0.60 0.60 0.60 0.60 $140,700
St. Clair Shores Park 0.60 0.60 0.60 0.60 0.60 0.60 0.60 0.60 0.60 0.60 $140,700
Comber Fairgrounds 0.60 0.60 0.60 1.20 1.20 1.20 1.20 1.20 1.20 1.20 $140,700
Duck Creek 0.40 0.40 0.40 0.40 0.40 0.40 0.40 0.40 0.40 0.40 $140,700
Millen Centre 0.76 0.76 0.76 0.76 0.76 0.76 0.76 0.76 0.80 0.80 $140,700
River Ridge Park 1.00 1.00 1.00 1.00 1.00 1.00 1.00 1.00 1.00 1.00 $140,700
Geralyn Tellier Perdu Park 0.60 0.60 0.60 0.60 0.60 0.60 0.60 0.60 0.60 0.60 $140,700
Optimist Comber - - - 0.20 0.20 0.20 0.20 0.20 0.20 0.20 $140,700
Bridge over Belle River - Lakeview
park1.00 1.00 1.00 1.00 1.00 1.00 1.00 1.00 1.00 1.00 $187,600
Bridge over Duck Creek 1.00 1.00 1.00 1.00 1.00 1.00 1.00 1.00 1.00 1.00 $187,600
Bridge over 4th Conc Drain 2.00 2.00 2.00 2.00 2.00 2.00 2.00 2.00 2.00 2.00 $91,500
Bridge over Moison Creek 1.00 1.00 1.00 1.00 1.00 1.00 1.00 1.00 1.00 1.00 $129,000
Earth Walk Trail (ATC) - - - - - - - - 2.00 2.00 $300,000
River Downs Trail - - - - - 0.50 0.50 0.50 0.50 0.50 $150,000
Ladoucer Park - - - - - 0.08 0.08 0.08 0.08 0.08 $150,000
Total 14.96 15.96 15.96 16.76 16.76 17.94 17.94 17.94 19.98 19.98
Population 34,259 34,546 34,982 35,431 35,803 36,052 36,610 37,213 37,938 38,465
Per Capita Standard 0.0004 0.0005 0.0005 0.0005 0.0005 0.0005 0.0005 0.0005 0.0005 0.0005
10 Year Average 2010-2019
Quantity Standard 0.0005
Quality Standard $137,980
Service Standard $69
D.C. Amount (before deductions) 10 Year
Forecast Population 4,542
$ per Capita $69
Eligible Amount $313,353

Watson & Associates Economists Ltd. PAGE B-19 H:\Lakeshore\2020 DC\Report\Final Report.docx
Town of Lakeshore
Service Standard Calculation Sheet
Service: Parks and Recreation Vehicles and Equipment
Unit Measure: No. of vehicles and equipment
Description 2010 2011 2012 2013 2014 2015 2016 2017 2018 20192020 Value
($/Vehicle)
1/2 ton 2 2 2 2 2 2 2 2 2 2 $29,300
1 ton 1 1 1 2 2 2 2 2 2 2 $51,600
Tractors 3 4 4 4 4 4 4 4 4 4 $44,600
Top dresser 1 1 1 1 1 1 1 1 1 1 $23,500
Trailers - 2 2 3 5 5 5 5 5 5 $9,400
Overseeder - - - 1 2 2 2 2 2 2 $18,800
Beach cleaner - - - - 1 1 1 1 1 1 $52,800
Lawn aerators - - 1 2 2 2 2 2 2 2 $4,100
Rotary mower - - - - 1 1 1 1 1 1 $2,300
Golf cart - 1 1 1 1 1 1 1 1 1 $7,600
Zero radius mower - 1 1 1 1 1 1 1 1 1 $17,600
Finishing mower 2 2 2 2 2 2 2 2 2 2 $1,800
1/2 ton - facilities 1 1 1 1 - - - - - - $29,300
Van - facilities - - - - 1 1 1 1 1 1 $25,800
Ice Resurfacers 2 2 2 2 3 3 3 3 3 3 $100,000
Toro Utility Vehicle 1 1 $16,000
Total 12 17 18 22 28 28 28 28 29 29
Population 34,259 34,546 34,982 35,431 35,803 36,052 36,610 37,213 37,938 38,465
Per Capita Standard 0.0004 0.0005 0.0005 0.0006 0.0008 0.0008 0.0008 0.0008 0.0008 0.0008
10 Year Average 2010-2019
Quantity Standard 0.0007
Quality Standard $29,871
Service Standard $21
D.C. Amount (before deductions) 10 Year
Forecast Population 4,542
$ per Capita $21
Eligible Amount $94,973

Watson & Associates Economists Ltd. PAGE B-20 H:\Lakeshore\2020 DC\Report\Final Report.docx
Town of Lakeshore
Service Standard Calculation Sheet
Service: Indoor Recreation Facilities
Unit Measure: ft² of building area
Description 2010 2011 2012 2013 2014 2015 2016 2017 2018 2019
2020
Bld'g
Value
($/sq.ft.)
Value/sq.ft.
with land,
site works,
etc.
Arena - twin pad 82,660 82,660 82,660 82,660 - - - - - - $225 $263
Marina building and restaurant 4,368 4,368 4,368 4,368 4,368 4,368 4,368 4,368 4,368 4,368 $320 $367
Comber Community Centre 6,000 6,000 6,000 6,000 6,000 6,000 6,000 6,000 6,000 6,000 $192 $226
Libro Community Centre 6,600 6,600 6,600 6,600 5,615 5,615 5,615 5,615 5,615 5,615 $392 $447
Puce Leisure Centre 23,929 23,929 23,929 23,929 - - - - - - $320 $367
Atlas Tube Centre - - - - 164,465 164,465 164,465 164,465 189,465 189,465 $328 $377
Total 123,557 123,557 123,557 123,557 180,448 180,448 180,448 180,448 205,448 205,448
Population 34,259 34,546 34,982 35,431 35,803 36,052 36,610 37,213 37,938 38,465
Per Capita Standard 3.6066 3.5766 3.5320 3.4873 5.0400 5.0052 4.9289 4.8491 5.4154 5.3412
10 Year Average 2010-2019
Quantity Standard 4.4782
Quality Standard $349
Service Standard $1,563
D.C. Amount (before deductions) 10 Year
Forecast Population 4,542
$ per Capita $1,563
Eligible Amount $7,097,284

Watson & Associates Economists Ltd. PAGE B-21 H:\Lakeshore\2020 DC\Report\Final Report.docx
Town of Lakeshore
Service Standard Calculation Sheet
Service: Library Facilities
Unit Measure: ft² of building area
Description 2010 2011 2012 2013 2014 2015 2016 2017 2018 2019
2020
Bld'g
Value
($/sq.ft.)
Value/sq.ft
. with
land, site
works, etc.
Belle River (in arena) 4,400 4,400 4,400 4,400 - - - - - - $260 $328
Libro 600 600 600 600 2,035 2,035 2,035 2,035 2,035 2,035 $260 $328
Comber 1,600 1,600 1,600 1,600 1,600 1,600 1,600 1,600 1,600 1,600 $260 $328
Atlas Centre (Library) - - - - 7,535 7,535 7,535 7,535 7,535 7,535 $260 $328
Leased
Stoney Point 1,580 1,580 1,580 1,580 1,580 1,580 1,580 1,580 1,580 1,580 $11
Total 8,180 8,180 8,180 8,180 12,750 12,750 12,750 12,750 12,750 12,750
Population 34,259 34,546 34,982 35,431 35,803 36,052 36,610 37,213 37,938 38,465
Per Capita Standard 0.2388 0.2368 0.2338 0.2309 0.3561 0.3537 0.3483 0.3426 0.3361 0.3315
10 Year Average 2010-2019
Quantity Standard 0.3009
Quality Standard $282
Service Standard $85
D.C. Amount (before deductions) 10 Year
Forecast Population 4,542
$ per Capita $85
Eligible Amount $385,207
Watson & Associates Economists Ltd. PAGE C-1 H:\Lakeshore\2020 DC\Report\Final Report.docx
Appendix C Long-Term Capital and Operating Cost Examination

Watson & Associates Economists Ltd. PAGE C-2 H:\Lakeshore\2020 DC\Report\Final Report.docx
Appendix C: Long-Term Capital and Operating Cost Examination
Town of Lakeshore
Annual Capital and Operating Cost Impact
As a requirement of the D.C.A. under subsection 10 (2) (c), an analysis must be
undertaken to assess the long-term capital and operating cost impacts for the capital
infrastructure projects identified within the D.C. As part of this analysis, it was deemed
necessary to isolate the incremental operating expenditures directly associated with
these capital projects, factor in cost saving attributable to economies of scale or cost
sharing where applicable and prorate the cost on a per unit basis (i.e. sq.ft. of building
space, per vehicle, etc.). This was undertaken through a review of the Town’s approved
2018 Financial Information Return (F.I.R.).
In addition to the operational impacts, over time the initial capital projects will require
replacement. This replacement of capital is often referred to as life cycle cost. By
definition, life cycle costs are all the costs which are incurred during the life of a physical
asset, from the time its acquisition is first considered, to the time it is taken out of
service for disposal or redeployment. The method selected for life cycle costing is the
sinking fund method which provides that money will be contributed annually and
invested, so that those funds will grow over time to equal the amount required for future
replacement. The following factors were utilized to calculate the annual replacement
cost of the capital projects (annual contribution = factor X capital asset cost) and are
based on an annual growth rate of 2% (net of inflation) over the average useful life of
the asset:

Watson & Associates Economists Ltd. PAGE C-3 H:\Lakeshore\2020 DC\Report\Final Report.docx
Table C-1 depicts the annual operating impact resulting from the proposed gross capital
projects at the time they are all in place. It is important to note that, while Town
program expenditures will increase with growth in population, the costs associated with
the new infrastructure (i.e. facilities) would be delayed until the time these works are in
place.
Average Useful Life Factor
Water Distribution 100 0.00320274
Water Treatment 80 0.00516071
Wastewater Sewers 100 0.00320274
Wastewater Facilities 80 0.00516071
Public Works Vehicles & Equipment 11 0.08217794
Facilities 50 0.01182321
Parkland Development 30 0.02464992
Parks and Recreation Vehicles & Equipment 7 0.13451196
Facilities 60 0.00876797
Roads 20 0.04115672
Traffic Control Devices 25 0.03122044
Sidewalks 30 0.02464992
Fire Vehicles 10 0.09132653
Fire Equipment and Gear 10 0.09132653
AssetLifecycle Cost Factors

Watson & Associates Economists Ltd. PAGE C-4 H:\Lakeshore\2020 DC\Report\Final Report.docx
Table C-1 Town of Lakeshore
Operating and Capital Expenditure Impacts for Future Capital Expenditures
SERVICE/CLASS OF SERVICE
GROSS COST LESS
BENEFIT TO
EXISTING
ANNUAL LIFECYCLE
EXPENDITURES
ANNUAL
OPERATING
EXPENDITURES
TOTAL ANNUAL
EXPENDITURES
1. Wastewater Services
1.1 Treatment plants 48,441,293 2,041,172 700,405 2,741,577
1.2 Sewers 26,747,695 1,315,495 357,454 1,672,949
2. Water Services
2.1 Treatment plants and storage 25,009,873 888,881 592,499 1,481,380
2.2 Distribution systems 4,686,000 550,272 617,009 1,167,281
3. Services Related to a Highway
3.1 Roads 83,633,622 5,150,600 1,269,674 6,420,274
4. Fire Protection Services
4.1 Fire facilities, vehicles & equipment 4,386,721 340,907 473,211 814,118
5. Policing Services
5.1 Police facilities and equipment 600,000 29,545 1,094,552 1,124,097
6. Public Works Facilities, Vehicles and Equipment
6.1 Services Related to a Highway 2,153,500 182,271 32,693 214,964
6.2 Wastewater Services 2,559,000 142,979 37,000 179,979
6.3 Water Services 2,488,000 134,905 58,942 193,847
7. Parks and Recreation Services
7.1 Parkland development, amenities, trails, vehicles and facilities 27,852,846 1,477,270 252,434 1,729,704
8. Library Services
8.1 Library facilities - - - -
9. Growth Studies
9.1 Services Related to a Highway 785,210 - - -
9.2 Fire Protection Services 91,890 - - -
9.3 Policing Services 45,140 - - -
9.4 Parks and Recreation Services 176,030 - - -
9.5 Wastewater Services 273,260 - - -
9.6 Water Services 248,860 - - -
Total 230,178,940 12,254,297 5,485,873 17,740,170

Watson & Associates Economists Ltd. PAGE D-1 H:\Lakeshore\2020 DC\Report\Final Report.docx
Appendix D D.C. Reserve Fund Policy

Watson & Associates Economists Ltd. PAGE D-2 H:\Lakeshore\2020 DC\Report\Final Report.docx
Appendix D: D.C. Reserve Fund Policy
D.1 Legislative Requirements
The Development Charges Act, 1997 (D.C.A.) requires development charge collections
(and associated interest) to be placed in separate reserve funds. Sections 33 through
36 of the Act provide the following regarding reserve fund establishment and use:
• A municipality shall establish a reserve fund for each service to which the D.C.
by-law relates; subsection 7 (1), however, allows services to be grouped into
categories of services for reserve fund (and credit) purposes, although only
100% eligible and 90% eligible services may be combined (minimum of two
reserve funds).
• The municipality shall pay each development charge it collects into a reserve
fund or funds to which the charge relates.
• The money in a reserve fund shall be spent only for the “capital costs”
determined through the legislated calculation process (as per subsection 5 (1)
2-8).
• Money may be borrowed from the fund but must be paid back with interest
(O. Reg. 82/98, subsection 11 (1) defines this as Bank of Canada rate either on
the day the by-law comes into force or, if specified in the by-law, the first
business day of each quarter).
• D.C. reserve funds may not be consolidated with other municipal reserve funds
for investment purposes and may only be as an interim financing source for
capital undertakings for which development charges may be spent (section 37).
Annually, the Treasurer of the municipality is required to provide Council with a financial
statement related to the D.C. by-law(s) and reserve funds. This statement must be
made available to the public and may be requested to be forwarded to the Minister of
Municipal Affairs and Housing. The D.C.A. does not prescribe how the statement is to
be made available to the public. We would recommend that a resolution of Council
make the statement available on the municipality’s website or upon request.
Subsection 43 (2) and O. Reg. 82/98 prescribes the information that must be included in
the Treasurer’s statement, as follows:
• opening balance;
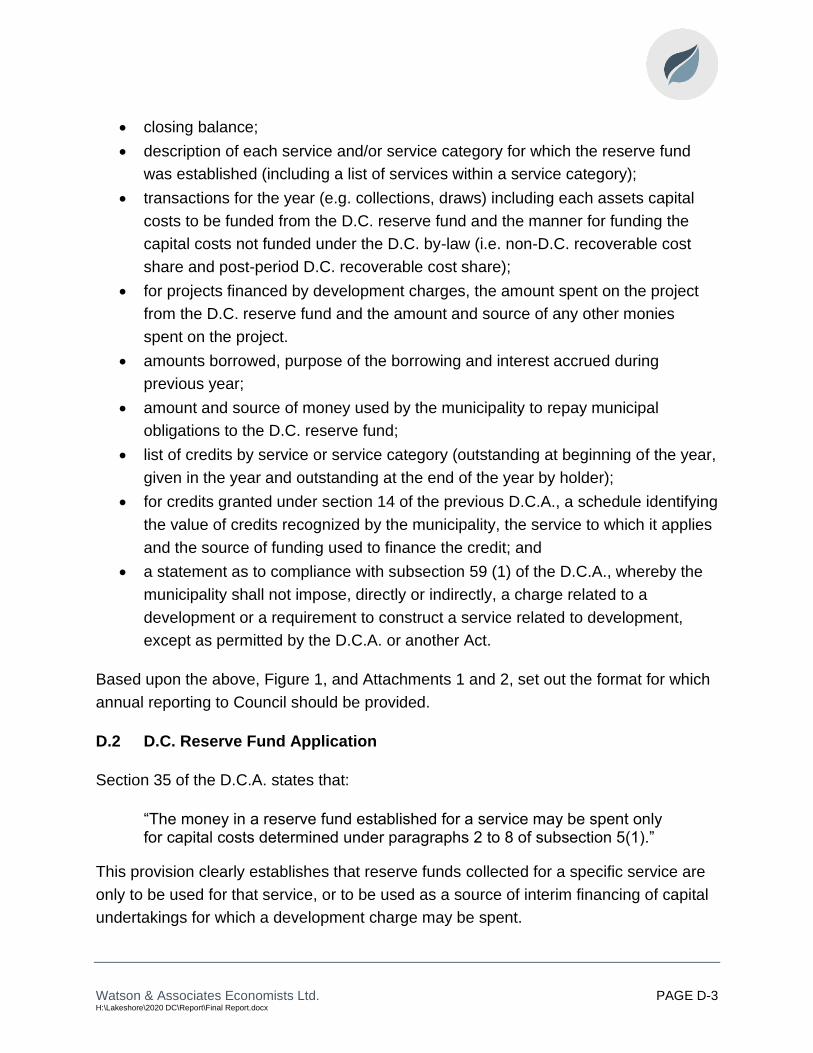
Watson & Associates Economists Ltd. PAGE D-3 H:\Lakeshore\2020 DC\Report\Final Report.docx
• closing balance;
• description of each service and/or service category for which the reserve fund
was established (including a list of services within a service category);
• transactions for the year (e.g. collections, draws) including each assets capital
costs to be funded from the D.C. reserve fund and the manner for funding the
capital costs not funded under the D.C. by-law (i.e. non-D.C. recoverable cost
share and post-period D.C. recoverable cost share);
• for projects financed by development charges, the amount spent on the project
from the D.C. reserve fund and the amount and source of any other monies
spent on the project.
• amounts borrowed, purpose of the borrowing and interest accrued during
previous year;
• amount and source of money used by the municipality to repay municipal
obligations to the D.C. reserve fund;
• list of credits by service or service category (outstanding at beginning of the year,
given in the year and outstanding at the end of the year by holder);
• for credits granted under section 14 of the previous D.C.A., a schedule identifying
the value of credits recognized by the municipality, the service to which it applies
and the source of funding used to finance the credit; and
• a statement as to compliance with subsection 59 (1) of the D.C.A., whereby the
municipality shall not impose, directly or indirectly, a charge related to a
development or a requirement to construct a service related to development,
except as permitted by the D.C.A. or another Act.
Based upon the above, Figure 1, and Attachments 1 and 2, set out the format for which
annual reporting to Council should be provided.
D.2 D.C. Reserve Fund Application
Section 35 of the D.C.A. states that:
“The money in a reserve fund established for a service may be spent only for capital costs determined under paragraphs 2 to 8 of subsection 5(1).”
This provision clearly establishes that reserve funds collected for a specific service are
only to be used for that service, or to be used as a source of interim financing of capital
undertakings for which a development charge may be spent.

Watson & Associates Economists Ltd. PAGE D-4 H:\Lakeshore\2020 DC\Report\Final Report.docx
Figure D-1 Town of Lakeshore
Annual Treasurer’s Statement of D.C. Reserve Funds
Description
Services
Related to a
Highway
Public
Works
Water
Services
Wastewater
Services
Policing
Services
Fire
Protection
Services
Parks and
Recreation
Services
Library
Services
Growth
Studies
Opening Balance, January 1, ________ 0
Plus:
Development Charge Collections 0
Accrued Interest 0
Repayment of Monies Borrowed from Fund and Associated Interest1 0
Sub-Total 0 0 0 0 0 0 0 0 0
Less:
Amount Transferred to Capital (or Other) Funds2 0
Amounts Refunded 0
Amounts Loaned to Other D.C. Service Category for Interim Financing 0
Credits3 0
Sub-Total 0 0 0 0 0 0 0 0 0
Closing Balance, December 31, ________ 0 0 0 0 0 0 0 0 01 Source of funds used to repay the D.C. reserve fund
2 See Attachment 1 for details
3 See Attachment 2 for details
The Town is compliant with s.s. 59.1 (1) of the Development Charges Act , whereby charges are not directly or indirectly imposed on development nor has a requirement to
construct a service related to development been imposed, except as permitted by the Development Charges Act or another Act.
Total
Service/Class to which the Development Charge Relates

Watson & Associates Economists Ltd. PAGE D-5 H:\Lakeshore\2020 DC\Report\Final Report.docx
Attachment D-1 Town of Lakeshore
Amount Transferred to Capital (or Other) Funds – Capital Fund Transaction D.C. Recoverable Cost Share Non-D.C. Recoverable Cost Share
D.C. Forecast Period Post D.C. Forecast Period
Capital Fund Transactions
Gross Capital
Cost
D.C. Reserve
Fund Draw
D.C. Debt
Financing
Grants,
Subsidies
Other
Contributions
Post-Period
Benefit/
Capacity Interim
Financing
Grants,
Subsidies
Other
Contributions
Other
Reserve/Reser
ve Fund Draws
Tax Supported
Operating Fund
Contributions
Rate Supported
Operating Fund
Contributions Debt Financing
Grants,
Subsidies
Other
Contributions
Services Related to a Highway
Capital Cost A
Capital Cost B
Capital Cost C
Sub-Total - Services Related to Highways $0 $0 $0 $0 $0 $0 $0 $0 $0 $0 $0
Water Services
Capital Cost D
Capita Cost E
Capital Cost F
Sub-Total - Water $0 $0 $0 $0 $0 $0 $0 $0 $0 $0 $0
Wastewater Services
Capital Cost G
Capita Cost H
Capital Cost I
Sub-Total - Wastewater $0 $0 $0 $0 $0 $0 $0 $0 $0 $0 $0

Watson & Associates Economists Ltd. PAGE D-6 H:\Lakeshore\2020 DC\Report\Final Report.docx
Attachment D-2 Town of Lakeshore
Statement of Credit Holder Transactions
Credit Holder
Applicable D.C.
Reserve Fund
Credit Balance
Outstanding
Beginning of
Year ________
Additional
Credits
Granted During
Year
Credits Used
by Holder
During Year
Credit Balance
Outstanding
End of Year
________
Credit Holder A
Credit Holder B
Credit Holder C
Credit Holder D
Credit Holder E
Credit Holder F
Watson & Associates Economists Ltd. PAGE E-1 H:\Lakeshore\2020 DC\Report\Final Report.docx
Appendix E Local Service Policy

Watson & Associates Economists Ltd. PAGE E-2 H:\Lakeshore\2020 DC\Report\Final Report.docx
Appendix E: Local Service Policy
This Appendix sets out the Town’s General Policy Guidelines on D.C.s and local service
funding for Services Related to:
• a Highway,
• Stormwater Management,
• Public transit Bus Stops and Amenities,
• Parkland Development, and
• Underground Linear Services.
The guidelines outline, in general terms, the size and nature of engineered infrastructure
that is included in the study as a development charge project, versus infrastructure that
is considered as a local service, to be emplaced separately by landowners, pursuant to
a development agreement.
The following policy guidelines are general principles by which staff will be guided in
considering development applications. However, each application will be considered, in
the context of these policy guidelines as subsection 59(2) of the Development Charges
Act, 1997, on its own merits having regard to, among other factors, the nature, type and
location of the development and any existing and proposed development in the
surrounding area, as well as the location and type of services required and their
relationship to the proposed development and to existing and proposed development in
the area.
E.1 Services Related to a Highway
A highway and services related to a highway are intended for the transportation of people
and goods via many different modes including, but not limited to passenger automobiles,
commercial vehicles, transit vehicles, bicycles and pedestrians. The highway shall consist
of all land and associated infrastructure built to support (or service) this movement of
people and goods regardless of the mode of transportation employed, thereby achieving
a complete street. A complete street is the concept whereby a highway is planned,
designed, operated and maintained to enable pedestrians, cyclists, public transit users

Watson & Associates Economists Ltd. PAGE E-3 H:\Lakeshore\2020 DC\Report\Final Report.docx
and motorists to safely and comfortably be moved, thereby allowing for the efficient
movement of persons and goods.
The associated infrastructure to achieve this concept shall include, but is not limited to:
road pavement structure and curbs; grade separation/bridge structures (for any vehicles,
railways and/or pedestrians); grading, drainage and retaining wall features; culvert
structures; storm water drainage systems; utilities; traffic control systems; signage;
gateway features; street furniture; active transportation facilities (e.g. sidewalks, bicycle
lanes, multi-use trails which interconnect the transportation network, etc.); Public Transit
lanes and lay-bys; roadway illumination systems; boulevard and median surfaces (e.g.
sod and topsoil, paving, etc.); street trees and landscaping; parking lanes and lay-bys;
(including on-street parking in urban areas) and driveway entrances; noise mitigation
systems; railings and safety barriers.
The classification of roads (i.e. “highways”) in the Town of Lakeshore are set out in the
Town’s Official Plan, and further referenced in the Transportation Master Plan. The
categories of roads described in this policy include:
• Provincial Highway
• Regional Roads: o Rural
• Arterial:
o Urban
• Collector Roads: o Rural o Urban Residential o Urban Commercial/Employment
• Rural Secondary Road
• Local Roads:
o Rural
o Urban Residential
o Urban Commercial/Employment
E.1.1 Local and Collector Roads (including land)
a. Collector Roads Internal to Development, inclusive of all land and associated
infrastructure – direct developer responsibility under s.59 of the D.C.A. as a local
service.

Watson & Associates Economists Ltd. PAGE E-4 H:\Lakeshore\2020 DC\Report\Final Report.docx
b. Collector Roads External to Development, inclusive of all land and associated
infrastructure – if needed to support a specific development or required to link with
the area to which the plan relates, direct developer responsibility under s.59 of the
D.C.A.; otherwise, included in D.C. calculation to the extent permitted under s.5(1) of
the D.C.A. (dependent on local circumstances).
c. All local roads are considered to be the developer’s responsibility.
d. Stream crossing and rail crossing road works, excluding underground utilities but
including all other works within lands to be dedicated to the Town or rail corridors –
include in DC calculation to the extent permitted under s.5(1) of the DCA (dependent
on local circumstances).
E.1.2 Rural Secondary Roads
a. Rural Secondary Roads Internal to Development, inclusive of all land and associated
infrastructure to be upgraded to a standard as defined in the Town of Lakeshore’s
Development Manual as amended from time to time – direct developer responsibility
under s.59 of the D.C.A. as a local service.
b. Rural Secondary Roads External to Development, inclusive of all land and
associated infrastructure – if needed to support a specific development or required
to link with the area to which the plan relates upgraded to a standard as defined in
the Town of Lakeshore’s Development Manual as amended from time to time – to be
direct developer responsibility under s.59 of the D.C.A.; otherwise, included in D.C.
calculation to the extent permitted under s.5(1) of the D.C.A. (dependent on local
circumstances).
E.1.3 Arterial Roads (Urban Arterial Roads)
a. New, widened, extended or upgraded arterial roads, inclusive of all associated
infrastructure: Included as part of road costing funded through D.C.A., s.5(1).
b. Land acquisition for arterial roads on existing rights-of-way to achieve a complete
street: dedication under the Planning Act provisions (s. 41, 51 and s. 53) through
development lands; in area with limited development: included in D.C.’s.
Watson & Associates Economists Ltd. PAGE E-5 H:\Lakeshore\2020 DC\Report\Final Report.docx
c. Land acquisition for arterial roads on new rights-of-way to achieve a complete street:
dedication, where possible, under the Planning Act provisions (s. 51 and s. 53)
through development lands up to the ROW specified in the Official Plan.
d. Land acquisition beyond normal dedication requirements to achieve transportation
corridors as services related to highways including grade separation infrastructure
for the movement of pedestrians, cyclists, public transit and/or railway vehicles:
included in D.C.’s.
E.1.4 Traffic Control Systems, Signals and IntersectionImprovements
a. On new arterial roads and arterial road improvements unrelated to a specific
development: included as part of road costing funded through D.C.’s.
b. On non-arterial roads, or for any private site entrances or entrances to specific
development: direct developer responsibility under s.59 of D.C.A. (as a local
service).
c. On arterial or collector road intersections with County roads: include in D.C.’s or in
certain circumstances, may be a direct developer responsibility
d. Intersection improvements, new or modified signalization, signal timing and
optimization plans, area traffic studies for highways attributed to growth and
unrelated to a specific development: included in D.C. calculation as permitted under
s.5(1) of the D.C.A.
E.1.5 Streetlights
a. Streetlights on new arterial roads and arterial road improvements: considered part of
the complete street and included as part of the road costing funded through D.C.’s or
in exceptional circumstances, may be direct developer responsibility through local
service provisions (s.59 of D.C.A.).
b. Streetlights on non-arterial roads internal to development: considered part of the
complete street and included as a direct developer responsibility under s. 59 of the
D.C.A. (as a local service).

Watson & Associates Economists Ltd. PAGE E-6 H:\Lakeshore\2020 DC\Report\Final Report.docx
c. Streetlights on non-arterial roads external to development, needed to support a
specific development or required to link with the area to which the plan relates:
considered part of the complete street and included as a direct developer
responsibility under s. 59 of the D.C.A. (as a local service).
E.1.6 Active Transportation Facilities - Pedestrian and Cycling
a. Sidewalks, multi-use trails, protected bicycle lanes, and on-road bicycle lanes,
inclusive of all required infrastructure, located within arterial roads, County roads and
provincial highway corridors: considered part of the complete street and included in
D.C.’s, or, in exceptional circumstances, may be direct developer responsibility
through local service provisions (s.59 of D.C.A.).
b. Sidewalks, multi-use trails, protected bicycle lanes, and on-road bicycle lanes,
inclusive of all required infrastructure, located within or linking to non-arterial road
corridors internal to development: considered part of the complete street and include
in D.C.’s.
c. Other sidewalks, multi-use trails, protected bicycle lanes, and on-road bicycle lanes,
inclusive of all required infrastructure, located within non-arterial road corridors
external to development and needed to support a specific development or required
to link with the area to which the plan relates: direct developer responsibility under
s.59 of D.C.A. (as a local service).
d. Multi-use trails (not associated with a road), inclusive of all land and required
infrastructure, that go beyond the function of a (parkland) recreational trail and form
part of the municipality’s active transportation network for cycling and/or walking:
included in D.C.’s.
E.1.7 Noise Mitigation Measures
a. Noise mitigation measures external and internal to development where it is related
to, or a requirement of a specific development: direct developer responsibility under
s.59 of D.C.A. (as a local service).
b. Noise mitigation measures on new arterial roads and arterial road improvements
abutting an existing community and unrelated to a specific development: included as
part of road costing funded through D.C.’s .
Watson & Associates Economists Ltd. PAGE E-7 H:\Lakeshore\2020 DC\Report\Final Report.docx
E.1.8 Public Transit Lanes and Lay-bys
a. Public transit lanes and lay-bys located within municipal arterial and County road
corridors: considered part of the complete street and included in D.C.’s
b. Public transit lanes and lay-bys located within non-arterial road corridors internal to
development: considered part of the complete street and direct developer
responsibility under s. 59 of the D.C.A. (as a local service).
c. Public transit lanes and lay-bys located within non-arterial road corridors external to
development and needed to support a specific development or required to link with
the area to which the plan relates: direct developer responsibility under s. 59 of the
D.C.A. (as a local service).
E.1.9 Public Transit Bus Stops and Amenities
a. Public Transit bus stops and amenities such as bus shelters, benches, garbage and
recycling receptacles, internal to development: direct developer responsibility under
s.59 of D.C.A. (as a local service).
b. Public Transit bus stops and amenities on arterial roads: included in the Town’s
Public Transit D.C.’s consistent with D.C.A., s.5(1).
E.2 Stormwater Management
a. Stormwater facilities servicing broad areas for quality and/or quantity management,
including downstream erosion works, inclusive of land and all associated
infrastructure, such as landscaping and perimeter fencing: included in D.C.s;
otherwise, if only serving a specific development then direct developer responsibility
under s.59 of D.C.A. as a local service (dependent on local circumstances).
b. Over-sizing cost of stormwater facilities capacity, excluding land, to accommodate
runoff from new, widened, extended or upgraded municipal arterial roads that are
funded as a development charges project: included as part of road costing funded
through D.C.’s.

Watson & Associates Economists Ltd. PAGE E-8 H:\Lakeshore\2020 DC\Report\Final Report.docx
c. Erosion works, inclusive of all restoration requirements, related to a development
application: direct developer responsibility under s. 59 of the D.C.A. (as a local
service).
d. Monitoring works: included in D.C.’s consistent with the D.C.A., s.5(1).
e. Storm sewer systems and drainage works that are required for a specific
development, either internal or external to the area to which the plan relates: direct
developer responsibility under s. 59 of the D.C.A. (as a local service).
Note: for stormwater minimum pipe sizes, refer to section E.5.
E.3 Parkland Development
E.3.1 Recreational Trails
a. Recreational trails (Multi-use trails) that do not form part of the Town’s active
transportation network, and their associated infrastructure (landscaping, bridges, trail
surface, etc.), are included in area municipal parkland D.C.’s.
E.3.2 Parkland
The Parks and Recreation Master Plan establishes the following park classifications:
• Regional Parks;
• Community Parks;
• Neighbourhood Parks;
• Parkettes; and
• Trails/Greenway.
a. Parkland Development for Regional and Waterfront Parks are included in D.C.’s.
b. Parkland Development for Community Parks, Neighbourhood Parks and
Parkettes: direct developer responsibility to provide at base condition, as follows:
• Clearing and grubbing. Tree removals as per the subdivision’s tree preservation
and removals plan.
• Topsoil Stripping, screening, and stockpiling.

Watson & Associates Economists Ltd. PAGE E-9 H:\Lakeshore\2020 DC\Report\Final Report.docx
• Rough grading (pre-grading) to allow for positive drainage of the Park, with
minimum slopes of 2%. If necessary, this may include some minor drainage tile
work and grading as per the overall subdivision grading design complete with any
required swales or catch basins. Runoff from the development property shall not
drain into the park unless approved by the Manager, Environment Services,
Public Works.
• Spreading of topsoil to 150mm depth (import topsoil if existing on-site is
insufficient to reach required depth).
• Seeding of site with Municipality-approved seed mix. Maintenance of seed until
acceptance by Municipality.
• Parks shall be free of any contaminated soil or subsoil.
• Parks shall not be mined for fill.
• Parks shall be conveyed free and clear of all encumbrances.
• 100% of 1.5m chain link perimeter fencing to the Municipal standards to separate
the development lands from the Municipal lands or lands to be dedicated to the
Municipality, unless the perimeter fencing is on land that will be dedicated to the
Municipality to fulfil the requirement of parkland dedication under the Planning
Act, in which case the cost shall be shared 50/50.
• When Park parcels cannot be developed in a timely manner, they shall be
graded to ensure positive drainage and seeded to minimize erosion and dust.
These shall be maintained by the developer until construction commences
thereon.
• The Park block shall not be used for topsoil or other construction material,
equipment storage, or sales pavilions.
• Required heritage features within the Park as set out within the Planning approval
conditions.
c. Program facilities, amenities, and furniture, within parkland: are included in
D.C.’s.
E.3.3. Landscape Buffer Blocks, Features, Cul-de-sac Islands, Berms,Grade Transition Areas, Walkway Connections to Adjacent Arterial Roads, Open Space, Etc.
a. The cost of developing all landscape buffer blocks, landscape features, cul-de- sac
islands, berms, grade transition areas, walkway connections to adjacent arterial
roads, open space and other remnant pieces of land conveyed to the municipality

Watson & Associates Economists Ltd. PAGE E-10 H:\Lakeshore\2020 DC\Report\Final Report.docx
shall be a direct developer responsibility as a local service. Such costs include but
are not limited to:
• pre-grading, sodding or seeding, supply and installation of amended topsoil, (to the
Towns’s required depth), landscape features, perimeter fencing and amenities and
all planting.
• Perimeter fencing to the Town standard located on the public property side of the
property line adjacent land uses (such as but limited to arterial roads) as directed
by the Town.
E.4 Natural Heritage System (N.H.S.)
N.H.S. includes engineered and in situ stream corridors, natural buffers for woodlots,
wetland remnants, etc. as well as subwatersheds within the boundaries of the Town.
Direct developer responsibility as a local service provision including but not limited to
the following:
a. Riparian planting and landscaping requirements (as required by the Town,
Conservation Authority or other authorities having jurisdiction) as a result of creation
of, or construction within in the N.H.S. and associated buffers.
b. Perimeter fencing of the N.H.S. to the Town standard located on the public property
side of the property line adjacent land uses (residential, industrial, commercial) as
required by the Town.
c. All works to be in conformance with the approved studies and reports related to the
Secondary Plan that development occurs in and/or the Environmental Impact
Assessment associated with the development.
E.4.1 Infrastructure Assets Constructed by Developers
a. All infrastructure assets constructed by Developers must be designed in accordance
with the Town’s Standards
b. All infrastructure assets shall be conveyed in accordance with the Town’s Standards
Watson & Associates Economists Ltd. PAGE E-11 H:\Lakeshore\2020 DC\Report\Final Report.docx
c. Any Parks and Open Space infrastructure assets approved to be built by the
developer on behalf of the Municipality shall be in accordance with the Town’s
Standards.
E.5 Underground Services (Stormwater, Water and SanitarySewers)
Underground services (linear infrastructure for stormwater, water, and sanitary services)
within the road allowance are not included in the cost of road infrastructure and are
treated separately. The responsibility for such services as well as stormwater
management ponds and pumping stations, which are undertaken as part of new
developments or redevelopments, will be determined by the following principles:
The costs of the following items shall be direct developer responsibilities as a
local service:
a. providing all underground services internal to the development, including storm,
water and sanitary services;
b. providing service connections from existing underground services to the
development;
c. providing new underground services or upgrading existing underground services
external to the development if the services are required to service the development,
and if the pipe sizes do not exceed 300mm for water and sanitary services and 900
mm for stormwater services. If external services are required by two or more
developments, the developer for the first development will be responsible for the
cost of the external services and may enter into front-ending/cost-sharing
agreements with other developers independent of the Municipality;
d. providing stormwater management ponds and other facilities required by the
development including all associated features such as landscaping and fencing;
e. water booster pumping stations, reservoir pumping stations and/or sanitary pumping
stations serving individual developments.
The costs of the following items shall be paid through development charges:
Watson & Associates Economists Ltd. PAGE E-12 H:\Lakeshore\2020 DC\Report\Final Report.docx
a. external underground services involving trunk infrastructure and pipe sizes
exceeding 300mm for water and sanitary services and 900mm for stormwater
services;
b. water, reservoir and/or sanitary pumping stations not required for the individual
development;
c. Services within the right-of-way of an arterial road or collector road external to a
development servicing more than one development;
d. Water treatment, storage facilities, transmission mains, re-chlorination/sampling
stations and wells associated with municipal service areas; and
e. Wastewater treatment plants and transmission mains associated with municipal
service areas.
Watson & Associates Economists Ltd. PAGE F-1 H:\Lakeshore\2020 DC\Report\Final Report.docx
Appendix F Asset Management Plan
Watson & Associates Economists Ltd. PAGE F-2 H:\Lakeshore\2020 DC\Report\Final Report.docx
Appendix F: Asset Management Plan
The recent changes to the D.C.A. (new subsection 10 (2) (c.2)) require that the
background study must include an asset management plan (A.M.P.) related to new
infrastructure. Section 10 (3) of the D.C.A. provides:
“The asset management plan shall,
(a) deal with all assets whose capital costs are proposed to befunded under the development charge by-law;
(b) demonstrate that all the assets mentioned in clause (a) arefinancially sustainable over their full life cycle;
(c) contain any other information that is prescribed; and
(d) be prepared in the prescribed manner.”
In regard to the above, section 8 of the Regulations was amended to include
subsections (2), (3) and (4) which set out for specific detailed requirements for transit
(only). For all services except transit, there are no prescribed requirements at this time
thus requiring the municipality to define the approach to include within the background
study.
At a broad level, the A.M.P. provides for the long-term investment in an asset over its
entire useful life along with the funding. The schematic below identifies the costs for an
asset through its entire lifecycle. For growth-related works, the majority of capital costs
will be funded by the D.C. Non-growth-related expenditures will then be funded from
non-D.C. revenues as noted below. During the useful life of the asset, there will be
minor maintenance costs to extend the life of the asset along with additional program
related expenditures to provide the full services to the residents. At the end of the life of
the asset, it will be replaced by non-D.C. financing sources.
It should be noted that with the recent passing of the Infrastructure for Jobs and
Prosperity Act (I.J.P.A.) municipalities are now required to complete A.M.P.s, based on
certain criteria, which are to be completed by 2021 for core municipal services and 2023
for all other services. The amendments to the D.C.A. do not require municipalities to
complete these A.M.P.s (required under I.J.P.A.) for the D.C. background study, rather
the D.C.A. requires that the D.C. background study include information to show the
assets to be funded by the D.C. are sustainable over their full lifecycle.

Watson & Associates Economists Ltd. PAGE F-3 H:\Lakeshore\2020 DC\Report\Final Report.docx
Purchase
Install
Commission
Operate
Maintain
Monitor
(Throughout Life
of Assets)
(To End of
Useful Life)
Removal/Decommission
Disposal
New Assets Replacement Assets
Reserves/Reserve Funds
Debentures
User Fees
Grants
Other
Proceeds on Disposal
Funding of Disposal /
Decommissioning Costs
Operating Budget
Financing Methods
Purchase
Install
Commission
Operate
Maintain
Monitor
(Throughout Life
of Assets)
(To End of
Useful Life)
Removal/Decommission
Disposal
In 2012, the Province developed Building Together: Guide for municipal asset
management plans which outlines the key elements for an A.M.P., as follows:
State of local infrastructure: asset types, quantities, age, condition, financial
accounting valuation and replacement cost valuation.
Desired levels of service: defines levels of service through performance measures
and discusses any external trends or issues that may affect expected levels of service
or the municipality’s ability to meet them (for example, new accessibility standards,
climate change impacts).
Asset management strategy: the asset management strategy is the set of planned
actions that will seek to generate the desired levels of service in a sustainable way,
while managing risk, at the lowest lifecycle cost.
Financing strategy: having a financial plan is critical for putting an A.M.P. into action.
By having a strong financial plan, municipalities can also demonstrate that they have

Watson & Associates Economists Ltd. PAGE F-4 H:\Lakeshore\2020 DC\Report\Final Report.docx
made a concerted effort to integrate the A.M.P. with financial planning and municipal
budgeting and are making full use of all available infrastructure financing tools.
Commensurate with the above, the Town prepared an A.M.P. in 2017 for its existing
assets however, did not take into account future growth-related assets. As a result, the
asset management requirement for the D.C. must be undertaken in the absence of this
information.
In recognition to the schematic above, the following table (presented in 2020 $) has
been developed to provide the annualized expenditures and revenues associated with
new growth. Note that the D.C.A. does not require an analysis of the non-D.C. capital
needs or their associated operating costs so these are omitted from the table below. As
well, as all capital costs included in the D.C.-eligible capital costs are not included in the
Town’s A.M.P., the present infrastructure gap and associated funding plan have not
been considered at this time. Hence the following does not represent a fiscal impact
assessment (including future tax/rate increases) but provides insight into the potential
affordability of the new assets:
1. The non-D.C. recoverable portion of the projects which will require financing from
municipal financial resources (i.e. taxation, rates, fees, etc.). This amount has
been presented on an annual debt charge amount based on 20-year financing.
2. Lifecycle costs for the 2020 D.C. capital works have been presented based on a
sinking fund basis. The assets have been considered over their estimated useful
lives.
3. Incremental operating costs for the D.C. services (only) have been included.
4. The resultant total annualized expenditures are $33.52 million.
5. Consideration was given to the potential new taxation and user fee revenues
which will be generated as a result of new growth. These revenues will be
available to finance the expenditures above. The new operating revenues are
$10.38 million. This amount, totalled with the existing operating revenues of
$63.21 million, provide annual revenues of $73.59 million by the end of the
period.

Watson & Associates Economists Ltd. PAGE F-5 H:\Lakeshore\2020 DC\Report\Final Report.docx
6. In consideration of the above, the capital plan is deemed to be financially
sustainable.
Town of Lakeshore Asset Management – Future Expenditures and Associated Revenues
2020$
2039 (Total)
Expenditures (Annualized)
Annual Debt Payment on Non-Growth
Related Capital1 6,955,978
Annual Debt Payment on Post Period
Capital2 3,796,119
Lifecycle:
Annual Lifecycle - Town Wide Services
Sub-Total - Annual Lifecycle $17,285,290
Incremental Operating Costs (for D.C.
Services) $5,485,873
Total Expenditures $33,523,260
Revenue (Annualized)
Total Existing Revenue3 $63,212,424
Incremental Tax and Non-Tax Revenue
(User Fees, Fines, Licences, etc.) $10,382,240
Total Revenues $73,594,664
3 As per Sch. 10 of FIR
1 Non-Growth Related component of Projects including 10%
mandatory deduction on soft services2 Interim Debt Financing for Post Period Benefit
Watson & Associates Economists Ltd. PAGE G-1 H:\Lakeshore\2020 DC\Report\Final Report.docx
Appendix G Proposed D.C. By-law
Watson & Associates Economists Ltd. PAGE G-2 H:\Lakeshore\2020 DC\Report\Final Report.docx
Appendix G: Proposed D.C. By-law
THE CORPORATION OF THE TOWN OF LAKESHORE
BY-LAW NUMBER ____
A by-law for the imposition of development charges
WHEREAS the Town of Lakeshore will experience growth through development and re-
development;
AND WHEREAS development and re-development requires the provision of capital
works by the Town of Lakeshore;
AND WHEREAS Council desires to ensure that the capital cost of meeting growth-
related demands for or burden on municipal services does not place an excessive
financial burden on the Town of Lakeshore or its existing taxpayers while at the same
time ensuring new taxpayers contribute no more than the net capital cost attributable to
providing the current level of municipal services;
AND WHEREAS the Development Charges Act, 1997 (the “Act”) provides that the
council of a municipality may by by-law impose development charges against land to pay
for increased capital costs required because of increased needs for services;
AND WHEREAS a development charge background study has been completed in
accordance with the Act;
AND WHEREAS the Council of The Corporation of the Town of Lakeshore has given
notice of and held a public meeting on the --th of November 2020 in accordance with the
Act and the regulations thereto;
NOW THEREFORE THE COUNCIL OF THE CORPORATION OF THE TOWN OF
LAKESHORE ENACTS AS FOLLOWS:
1. INTERPRETATION
1.1 In this By-law the following items shall have the corresponding meanings:

Watson & Associates Economists Ltd. PAGE G-3 H:\Lakeshore\2020 DC\Report\Final Report.docx
“Act” means the Development Charges Act, 1997, S.O. 1997, c.27, as amended,
or any successor thereof;
“Agricultural Use” means the cultivation of land, the production of crops and the
selling of such produce on the premises, and the breeding and care of livestock
and the selling of such livestock or the product of such livestock raised on the
premises and, without limiting the generality of the foregoing, includes aviaries,
apiaries, fish farming, animal husbandry, market gardening, nurseries and
greenhouses but excludes any Residential Use;
“Apartment Dwelling” means a Residential Dwelling comprised of a building
containing more than four Dwelling Units where the units are connected by an
interior corridor;
“Bedroom” means a habitable room which can be used as sleeping quarters, but
does not include a bathroom, living room, dining room or kitchen;
“Board of Education” has the same meaning as set out in the Education Act,
R.S.O. 1990, c. E.2, as amended, or any successor thereof;
“Bona Fide Farm Use” means an agricultural use carried out by a farm business
operating with a valid Farm Business Registration Number issued by the Ontario
Ministry of Agriculture, Food and Rural Affairs on lands assessed in the Farm
Property Class by the Municipal Property Assessment Corporation pursuant to the
Assessment Act, R.S.O. 1990, c.A.31, as amended;
“Building Code Act” means the Building Code Act, 1992, S.O. 1992, c.23, as
amended, or any successor thereof;
“Capital Cost” means costs incurred or proposed to be incurred by the municipality
or a local board thereof directly or by others on behalf of and as authorized by the
municipality or local board,
(a) to acquire land or an interest in land, including a leasehold interest,
(b) to improve land,
(c) to acquire, lease, construct or improve buildings and structures,
Watson & Associates Economists Ltd. PAGE G-4 H:\Lakeshore\2020 DC\Report\Final Report.docx
(d) to acquire, construct or improve facilities including,
(i) furniture and equipment other than computer equipment, and
(ii) material acquired for circulation, reference or information purposes
by a library board as defined in the Public Libraries Act, R.S.O.
1990, c. P.44, as amended, or any successor thereof; and
(iii) rolling stock with an estimated useful life of seven years or more,
and
(e) to undertake studies in connection with any matter under the Act and any of
the matters in clauses (a) to (d) above, including the development charge
background study required for the provision of services designated in this
By-law within or outside the municipality, including interest on borrowing for
those expenditures under clauses (a) to (e) above that are growth-related;
“Commercial-Retail” means land, buildings or portions thereof used, designed or
intended for use for the purpose of offering foods, wares, merchandise,
substances, articles or things for sale directly or providing entertainment to the
public and includes the rental of wares, merchandise, substances, articles or
things and includes offices and storage in connection with, related or ancillary to
such retail uses. Retail development includes, but is not limited to: fast food
restaurants; concert halls/theatres/cinemas/movie houses/drive-in theatres;
automotive fuel stations with or without service facilities; specialty automotive
shops/auto repairs/collision services/car or truck washes; auto dealerships;
regional shopping centres, including more than two stores attached and under one
ownership; department/discount stores; banks and similar financial institutions;
including credit unions (excluding freestanding bank kiosks); warehouse clubs,
retail warehouse;
“Commercial Non-Retail” means any non-residential development which is not a
commercial retail development, institutional development or industrial
development. Commercial Non-retail development includes greenhouses;
“Council” means the Council of the Town of Lakeshore;
Watson & Associates Economists Ltd. PAGE G-5 H:\Lakeshore\2020 DC\Report\Final Report.docx
“development” means the construction, erection or placing of one or more
buildings or structures on land or the making of an addition or alteration to a
building or structure that the effect of increasing the size of usability thereof, and
includes redevelopment;
“development charge” means a charge imposed with respect to this By-law;
“dwelling unit” means any part of a building or structure used, designed or
intended to be used as a domestic establishment in which one or more persons
may sleep and are provided with culinary and sanitary facilities for their exclusive
use;
“Existing” means the number, use and size that existed as of the date this by-law
was passed;
“existing industrial building” means a building or buildings existing on a site in the
Town of Lakeshore on June 15th, 2010 or the buildings or structures constructed
and occupied on a vacant site pursuant to site plan approval under section 41 of
the Planning Act, R.S.O. 1990, c. P.13 (the “Planning Act”) subsequent to June
15, 2010 for which full development charges were paid, and is used for or in
connection with,
(a) the production, compounding, processing, packaging, crating, bottling,
packaging
(b) or assembling of raw or semi-processed goods or materials
(“manufacturing”) in not less than seventy-five per cent of the total gross
floor area of the building or buildings on a site (“manufacturing”) or
warehousing related to the manufacturing use carried on in the building or
buildings,
(c) research or development in connection with manufacturing in not less than
seventy-five per cent of the total gross floor area of the building or buildings
on a site,
(d) retail sales by a manufacturer, if the retail sales are at the site where the
manufacturing is carried out, such retail sales are restricted to goods

Watson & Associates Economists Ltd. PAGE G-6 H:\Lakeshore\2020 DC\Report\Final Report.docx
manufactured at the site, and the building or part of a building where such
retail sales are carried out does not constitute greater than twenty-five per
cent of the total gross floor area of the building or buildings on the site, or
(e) office or administrative purposes, if they are,
(i) carried out with respect to the manufacturing or warehousing; and,
(ii) in or attached to the building or structure used for such
manufacturing or warehousing;
“farm building” means barns, silos and other development ancillary to a Bona Fire
Farming Use, but does not include a residential use;
“greenhouse” means a structure that used for commercially growing plants in
regulated temperatures, humidity and ventilation. A greenhouse is an immense
heated building, also referred to as a hothouse or conservatory, covering acres of
ground and used for growing fruits, vegetables or flowers;
“gross floor area” means:
(a) in the case of a residential building or structure, the total area of all floors
above grade of a dwelling unit measured between the outside surfaces of
exterior walls or between the outside surfaces of exterior walls and the
centre line of party walls dividing the dwelling unit from any other dwelling
unit or other portion of a building; and
(b) in the case of a non-residential building or structure, or in the case of a
mixed-use building or structure in respect of the non-residential portion
thereof, the total area of all building floors above or below grade measured
between the outside surfaces of the exterior walls, or between the outside
surfaces of exterior walls and the centre line of party walls dividing a non-
residential use and a residential use, except for:
(i) a room or enclosed area within the building or structure above or
below that is used exclusively for the accommodation of heating,
Watson & Associates Economists Ltd. PAGE G-7 H:\Lakeshore\2020 DC\Report\Final Report.docx
cooling, ventilating, electrical, mechanical or telecommunications
equipment that service the building;
(ii) loading facilities above or below grade; and
(iii) a part of the building or structure below grade that is used for the
parking of motor vehicles or for storage or other accessory use;
“industrial” means lands, buildings or structures used or designed or intended for
use for manufacturing, processing, fabricating or assembly of raw goods,
warehousing or bulk storage of goods, and includes office uses and the sale of
commodities to the general public where such uses are accessory to an industrial
use, but does not include the sale of commodities to the general public through a
warehouse club;
“Institutional development” means development of a building or structure intended
for use,
(a) as a long-term care home within the meaning of subsection 2 (1) of the
Long-Term Care Homes Act, 2007;
(b) as a retirement home within the meaning of subsection 2 (1) of the
Retirement Homes Act, 2010;
(c) by any of the following post-secondary institutions for the objects of the
institution:
(i) a university in Ontario that receives direct, regular and ongoing
operating funding from the Government of Ontario,
(ii) a college or university federated or affiliated with a university
described in subclause (i), or
(iii) an Indigenous Institute prescribed for the purposes of section 6
of the Indigenous Institutes Act, 2017;
(d) as a memorial home, clubhouse or athletic grounds by an Ontario
branch of the Royal Canadian Legion; or
Watson & Associates Economists Ltd. PAGE G-8 H:\Lakeshore\2020 DC\Report\Final Report.docx
(e) as a hospice to provide end of life care.
“Local Board” means a local board as defined in the Development Charges Act,
1997, S.O. 1997, c.27, as amended;
“local services” means those services, facilities or things which are under the
jurisdiction of the Town and are related to a plan under Sections 41, 51 or 53 of
the Planning Act, R.S.O. 1990, c. P.13, as amended, or any successor thereof, or
are within the area to which the plan relates in respect of the lands;
“multiple dwellings” means all dwellings other than single-detached, semi-
detached and apartment unit dwellings;
“municipality” means the Corporation of the Town of Lakeshore;
“Non-profit housing development” means development of a building or structure
intended for use as residential premises by,
(a) a corporation without share capital to which the Corporations Act
applies, that is in good standing under that Act and whose primary object is
to provide housing;
(b) a corporation without share capital to which the Canada Not-for-profit
Corporations Act applies, that is in good standing under that Act and whose
primary object is to provide housing; or
(c) a non-profit housing co-operative that is in good standing under the Co-
operative Corporations Act.
“non-residential use” means a building or structure of any kind whatsoever used,
designed or intended to be used for other than a residential use;
“Official Plan” means the Official Plan adopted for the Town, as amended and
approved;
“Owner” means the owner of land or a person who has made application for an
approval for the development of land upon which a development charge is
imposed’

Watson & Associates Economists Ltd. PAGE G-9 H:\Lakeshore\2020 DC\Report\Final Report.docx
“place of worship” means that part of a building or structure that is exempt from
taxation as a place of worship under the Assessment Act, R.S.O. 1990, Chap.
A.31, as amended, or any successor thereof;
“Rate” means the interest rate established weekly by the Bank of Canada based
on Treasury Bills having a term of 91 days;
“regulation” means any regulation made pursuant to the Act;
“Rental housing” means development of a building or structure with four or more
dwelling units all of which are intended for use as rented residential premises;
“Residential Dwelling” means a building, occupied or capable of being occupied
as a home, residence or sleeping place by one or more persons, containing one
or more Dwelling Units but not including motels, hotels, tents, truck campers,
tourist trailers, mobile camper trailers or boarding, lodging or rooming houses;
“residential use” means the use of a building or structure or portion thereof for one
or more Dwelling Units. This also includes a Dwelling Unit on land that is used for
an Agricultural Use;
“row dwelling” means a building containing three or more attached dwelling units
in a single row, each of which dwelling units has an independent entrance from
the outside and is vertically separated from any abutting dwelling unit;
“semi-detached dwelling” means a building divided vertically into two dwelling
units each of which has a separate entrance and access to grade;
“service” means a service designed in Schedule “A” to this By-law, and “services”
shall have a corresponding meaning;
“servicing agreement” means an agreement between a landowner and the Town
relative to the provision of municipal services to specified land within the
jurisdiction of the Town;
“single detached dwelling unit” means a residential building consisting of one
dwelling unit and not attached to another structure;

Watson & Associates Economists Ltd. PAGE G-10 H:\Lakeshore\2020 DC\Report\Final Report.docx
“Solar Farm” means any solar energy system comprised of one or more solar
panels and associated control or conversion electronics that converts sunlight into
electricity. A solar farm may be connected to the electricity grid in circuits at a
substation to provide electricity off-site for sale to an electrical utility or other
intermediary;
“Telecommunications Tower” – means any tower, apparatus, structure or other
thing that is used or is capable of being used for telecommunications of for any
operation directly connected with telecommunications, and includes a
transmission facility, as define in the Telecommunications Act;
“Town” means the area within the geographic limits of the Town of Lakeshore;
“Wind Turbine” means any wind energy system, comprising one or more turbines,
that converts energy into electricity, with a combined nameplate generating
capacity greater than 500 kilowatts and a height greater than 100 metres, that
converts energy into electricity, and consists of a wind turbine, a tower, and
associated control or conversion electronics. A wind turbine and energy system
may be connected to the electricity grid in circuits at a substation to provide
electricity off-site for sale to an electrical utility or other intermediary; and
“Zoning By-Law” means the Zoning By-Law of the Town of Lakeshore, or any
successor thereof passed pursuant to Section 34 of the Planning Act, S.O. 1998.
2. DESIGNATION OF SERVICES AND CLASSES
2.1 The categories of services and classes for which development charges are
imposed under this By-law are as follows:
(a) Water Services;
(b) Wastewater Services;
(c) Services Related to a Highway;
(d) Public Works;
(e) Fire protection Services;
Watson & Associates Economists Ltd. PAGE G-11 H:\Lakeshore\2020 DC\Report\Final Report.docx
(f) Policing Services;
(g) Library Services;
(h) Parks and Recreation Services; and
(i) Growth Studies.
2.2 The components of the services and classes designated in section 2.1 are
described in Schedule A.
3. APPLICATION OF BY-LAW RULES
3.1 Development charges shall be payable in the amounts set out in this By-law
where:
(a) the lands are located in the area described in section 3.2; and
(b) the development of the lands requires any of the approvals set out in
subsection 3.4(a).
Area to Which By-law Applies
3.2 Subject to section 3.3, this By-law applies to all lands within the jurisdiction of the
Town of Lakeshore whether or not the land or use thereof is exempt from
Development Charges under section 3 of this by-law or from taxation under the
Assessment Act, R.S.O. 1990, c.A.31, as amended.
3.3. Notwithstanding clause 3.2 above, this by-law shall not apply to lands that are
owned by and used for the purposes of:
(a) the Town or a local board thereof;
(b) a board of education; or
(c) the Corporation of the County of Essex or a local board thereof.

Watson & Associates Economists Ltd. PAGE G-12 H:\Lakeshore\2020 DC\Report\Final Report.docx
Approvals for Development
3.4 (a) Development charges shall be imposed on all lands, buildings or structures
that are developed for residential or non-residential uses if the development
requires:
(i) the passing of a zoning by-law or of an amendment to a zoning
by-law under section 34 of the Planning Act;
(ii) the approval of a minor variance under section 45 of the Planning
Act; a conveyance of land to which a by-law passed under
subsection 50(7) of the Planning Act applies;
(iii) the approval of a plan of subdivision under section 51 of the
Planning Act;
(iv) a consent under section 53 of the Planning Act;
(v) the approval of a description under section 50 of the
Condominium Act, R.S.O. 1990, Chap. C.26, as amended, or any
successor thereof; or
(vi) the issuing of a permit under the Building Code Act in relation to
a building or structure.
(b) No more than one development charge for each service designated in
subsection 2.1 shall be imposed upon any lands, buildings or structures to
which this By-law applies even though two or more of the actions described
in subsection 3.4(a) are required before the lands, buildings or structures
can be developed.
(c) Despite subsection 3.4(b), if two or more of the actions described in
subsection 3.4(a) occur at different times, additional development charges
shall be imposed if the subsequent action has the effect of increasing the
need for services.

Watson & Associates Economists Ltd. PAGE G-13 H:\Lakeshore\2020 DC\Report\Final Report.docx
Exemptions
3.5 Notwithstanding the provisions of this By-law, development charges shall not be
imposed with respect to:
(a) an enlargement to an existing dwelling unit;
(b) one or two additional dwelling units in an existing single detached
dwelling; or
(c) one additional dwelling unit in any other existing residential building;
3.6 Notwithstanding section 3.5(b), development charges shall be imposed if the total
gross floor area of the additional one or two units exceeds the gross floor area of
the existing dwelling unit.
3.7 Notwithstanding section 3.5, development charges shall be imposed if the
additional unit has a gross floor area greater than
(a) in the case of a semi-detached or row dwelling, the gross floor area of
the existing dwelling unit; and
(b) in the case of any other residential building, the gross floor area of the
smallest dwelling unit contained in the residential building.
3.8 Exemption for Industrial Development:
3.8.1 Notwithstanding any other provision of this by-law, there shall be an
exemption from the payment of development charges for one or more
enlargements of an existing industrial building on its site, whether attached
or separate from the existing industrial building, up to a maximum of fifty
per cent of the gross floor area before the first enlargement for which an
exemption from the payment of development charges was granted
pursuant to the Development Charges Act or this section. Development
charges shall be imposed in accordance with this by-law with respect to the
amount of the floor area of an enlargement that results in the gross floor
area of the industrial building being increased by greater than fifty per cent
of the gross floor area of the existing industrial building.
Watson & Associates Economists Ltd. PAGE G-14 H:\Lakeshore\2020 DC\Report\Final Report.docx
3.8.2 If the gross floor area of an existing industrial building is enlarged by
greater than 50 percent, the amount of the development charge payable in
respect of the enlargement is the amount of the development charge that
would otherwise be payable multiplied by the fraction determined as
follows:
1) determine the amount by which the enlargement exceeds 50
percent of the gross floor area before the enlargement;
2) divide the amount determined under subsection 1) by the amount
of the enlargement
3.9 For the purpose of section 3.8 herein, “existing industrial building” is used as
defined in the Regulation made pursuant to the Act.
3.10 Other Exemptions:
Notwithstanding the provision of this by-law, development charges shall not be
imposed with respect to:
a) lands, buildings or structures used or to be used for a place of worship
or for the purposes of a cemetery or burial ground exempt from taxation
under the Assessment Act;
b) the development of non-residential farm buildings constructed for bona
fide farm uses, which qualify as a farm business, being that which operates
with a valid Farm Business Registration Number and is assessed in the
Farmland Realty Tax Class.
Amount of Charges
Residential
3.11 The development charges set out in Schedule B shall be imposed on residential
uses of lands, buildings or structures, including a dwelling unit accessory to a non-
residential use and, in the case of a mixed use building or structure, on the
residential uses in the mixed use building or structure, according to the type of

Watson & Associates Economists Ltd. PAGE G-15 H:\Lakeshore\2020 DC\Report\Final Report.docx
residential unit, and calculated with respect to each of the services according to
the type of residential use.
Non-Residential
3.12 The development charges described in Schedule B to this by-law shall be
imposed on non-residential uses of lands, buildings or structures, and, in the case
of a mixed use building or structure, on the non-residential uses in the mixed use
building or structure, and calculated with respect to each of the services according
to the total floor area of the non-residential use.
Reduction of Development Charges for Redevelopment
3.13 Despite any other provisions of this By-law, where, as a result of the
redevelopment of land, a building or structure existing on the same land within 5
years prior to the date of payment of development charges in regard to such
redevelopment was, or is to be demolished, in whole or in part, or converted from
one principal use to another principal use on the same land, in order to facilitate
the redevelopment, the development charges otherwise payable with respect to
such redevelopment shall be reduced by the following amounts:
(a) in the case of a residential building or structure, or in the case of a
mixed-use building or structure, the residential uses in the mixed-use
building or structure, an amount calculated by multiplying the applicable
development charge under subsection 3.11 by the number, according to
type, of dwelling units that have been or will be demolished or converted to
another principal use; and
(b) in the case of a non-residential building or structure or, in the case of
mixed-use building or structure, the non-residential uses in the mixed-use
building or structure, an amount calculated by multiplying the applicable
development charges under subsection 3.12, by the gross floor area that
has been or will be demolished or converted to another principal use;
provided that such amounts shall not exceed, in total, the amount of the development
charges otherwise payable with respect to the redevelopment.
Watson & Associates Economists Ltd. PAGE G-16 H:\Lakeshore\2020 DC\Report\Final Report.docx
Time of Payment of Development Charges
3.14 Development charges imposed under this By-law are calculated, payable, and
collected upon issuance of the first building permit for the development.
3.15 Notwithstanding Subsections 3.11 and 3.12, Development Charges for rental
housing and institutional developments are due and payable in 6 installments
commencing with the first installment payable on the date of occupancy, and each
subsequent installment, including interest (as provided in the Town’s Development
Charge Interest Policy, as amended), payable on the anniversary date each year
thereafter.
3.16 Notwithstanding Subsections 3.11 and 3.12, Development Charges for non-profit
housing developments are due and payable in 21 installments commencing with
the first installment payable on the date of occupancy, and each subsequent
installment, including interest (as provided in the Town’s Development Charge
Interest Policy, as amended), payable on the anniversary date each year
thereafter.
3.17 Where the development of land results from the approval of a Site Plan or Zoning
Bylaw Amendment received on or after January 1, 2020, and the approval of the
application occurred within 2 years of building permit issuance, the Development
Charges under Subsections 3.11 and 3.12 shall be calculated on the rates set out
in Schedule "B" on the date of the planning application, including interest. Where
both planning applications apply Development Charges under Subsections 3.11
and 3.12 shall be calculated on the rates, including interest (as provided in the
Town’s Development Charge Interest Policy, as amended), set out in Schedules
"B" on the date of the later planning application, including interest.
3.18 Despite sections 3.14 to 3.17 and in accordance with section 27 of the Act,
Council from time to time, and at any time, may enter into agreements providing
for all or any part of a development charge to be paid before or after it would
otherwise be payable.

Watson & Associates Economists Ltd. PAGE G-17 H:\Lakeshore\2020 DC\Report\Final Report.docx
4. PAYMENT BY SERVICES
4.1 Despite the payment required under subsections 3.11 and 3.12, Council may, by
agreement, give a credit towards a development charge in exchange for work that
relates to a service to which a development charge relates under this By-law.
5. INDEXING
5.1 Development charges imposed pursuant to this By-law shall be adjusted annually,
without amendment to this By-law, commencing on the 1st of January 2021 and
each year thereafter, in accordance with the prescribed index in the Act.
6. UNDEVELOPED AND PREPAID LOTS
6.1 The Services Related to a Highway component of a Development Charge
imposed by this By-law shall be imposed upon all lands described on Schedule
“D” to this by-law. All other services imposed by this By-law, as identified in
Schedule “B”, are exempt from payment for those lands described in Schedule
“D”.
7. SCHEDULES
7.1 The following schedules shall form part of this By-law:
Schedule A - Components of Services and Classes Designated in section
2.1
Schedule B - Residential and Non-Residential Development Charges
Schedules C-1
through C-11 -
Maps Identifying Areas where Water and Wastewater
Services are Imposed
Schedule D- Undeveloped and Prepaid Development Charges as of
December 31, 2019
8. CONFLICTS
8.1 Where the Town and an owner or former owner have entered into an agreement
with respect to land within the area to which this By-law applies, and a conflict

Watson & Associates Economists Ltd. PAGE G-18 H:\Lakeshore\2020 DC\Report\Final Report.docx
exists between the provisions of this By-law and such agreement, the provisions
of the agreement shall prevail to the extent that there is a conflict.
8.2 Notwithstanding section 8.1, where a development which is the subject of an
agreement to which section 8.1 applies, is subsequently the subject of one or
more of the actions described in subsection 3.4(a), an additional development
charge in respect of the development permitted by the action shall be calculated,
payable and collected in accordance with the provisions of this By-law if the
development has the effect of increasing the need for services, unless such
agreement provides otherwise.
9. SEVERABILITY
9.1 If, for any reason, any provision of this By-law is held to be invalid by a court of
competent jurisdiction, it is hereby declared to be the intention of Council that
such provision be severable and the remainder of this By-law shall continue in full
force and effect until repealed, re-enacted, amended or modified.
10. DATE BY-LAW IN FORCE
10.1 This By-law shall come into effect at 12:01 AM on December --, 2020.
11. DATE BY-LAW EXPIRES
11.1 This By-law will expire at 12:01 AM on December --, 2025 unless it is repealed by
Council at an earlier date.

Watson & Associates Economists Ltd. PAGE G-19 H:\Lakeshore\2020 DC\Report\Final Report.docx
12. EXISTING BY-LAW REPEALED
12.1 By-law Number 46-2015 is hereby repealed as of the date and time of this By-law
coming into effect.
PASSED THIS xx day of December 2020.
Mayor
Town Clerk

Watson & Associates Economists Ltd. PAGE G-20 H:\Lakeshore\2020 DC\Report\Final Report.docx
SCHEDULE “A” TO BY-LAW XX-2020
COMPONENTS OF SERVICES AND CLASSES DESIGNATED IN SUBSECTION 2.1
D.C.-Eligible Services
• Water Services
o Facilities
o Distribution
• Wastewater Services
o Facilities
o Collection
• Services Related to a Highway
o Roads, Sidewalks, and Streetlights Rolling Stock and Equipment
• Fire Protection Services
o Fire Facilities
o Fire Vehicles
o Fire Fighter Equipment and Gear
• Policing Services
o Policing Facilities
o Policing Equipment and Gear
• Library
o Library Facilities
• Parks and Recreation Services
o Recreation Facilities
o Rolling Stock and Equipment
o Parkland Development
D.C.-Eligible Classes
• Public Works Facilities, Vehicles and Equipment
o Services Related to a Highway
o Water Services
o Wastewater Services
• Growth Studies
o Services Related to a Highway
o Water Services
o Wastewater Services
o Fire Protection Services
o Policing Services
o Parks and Recreation Services

Watson & Associates Economists Ltd. PAGE G-21 H:\Lakeshore\2020 DC\Report\Final Report.docx
SCHEDULE “B” TO BY-LAW XX-2020
RESIDENTIAL AND NON-RESIDENTIAL DEVELOPMENT CHARGES
NON-RESIDENTIAL
Single and Semi-
Detached DwellingOther Multiples
Apartments - 2
Bedrooms +
Apartments -
Bachelor and 1
Bedroom
Special
Care/Special
Dwelling Units
(per sq.ft. of Gross
Floor Area)
Municipal Wide Services/Classes of Services:
Services Related to a Highway 5,979 3,495 3,057 2,362 1,974 2.66 5,979 2.66
Public Works 566 331 289 224 187 0.25 - -
Fire Protection Services 711 416 364 281 235 0.31 711 0.31
Policing Services 106 62 54 42 35 0.05 106 0.05
Parks and Recreation Services 3,754 2,194 1,919 1,483 1,240 0.17 - -
Library Services - - - - - - - -
Growth Studies 460 269 235 182 152 0.20 460 0.20
Total Municipal Wide Services/Classes of Services 11,576 6,767 5,918 4,574 3,823 3.63 7,256 3.22
Urban Services
Wastewater Services 10,391 6,074 5,312 4,105 3,431 4.46 - -
Water Services 4,222 2,468 2,159 1,668 1,394 1.82 - -
Total Urban Services 14,613 8,542 7,471 5,773 4,825 6.27 - -
GRAND TOTAL RURAL AREA 11,576 6,767 5,918 4,574 3,823 3.63 7,256 3.22
GRAND TOTAL URBAN AREA 26,189 15,309 13,389 10,347 8,648 9.90 7,256 3.22
RESIDENTIAL
Service/Class of Service
Wind Turbines &
Communication
Towers (per
Turbine/Tower)
Solar Farm (per
sq. ft.)

Watson & Associates Economists Ltd. PAGE G-22 H:\Lakeshore\2020 DC\Report\Final Report.docx
Watson & Associates Economists Ltd. PAGE G-23 H:\Lakeshore\2020 DC\Report\Final Report.docx
Watson & Associates Economists Ltd. PAGE G-24 H:\Lakeshore\2020 DC\Report\Final Report.docx

Watson & Associates Economists Ltd. PAGE G-25 H:\Lakeshore\2020 DC\Report\Final Report.docx

Watson & Associates Economists Ltd. PAGE G-26 H:\Lakeshore\2020 DC\Report\Final Report.docx
Watson & Associates Economists Ltd. PAGE G-27 H:\Lakeshore\2020 DC\Report\Final Report.docx

Watson & Associates Economists Ltd. PAGE G-28 H:\Lakeshore\2020 DC\Report\Final Report.docx
Watson & Associates Economists Ltd. PAGE G-29 H:\Lakeshore\2020 DC\Report\Final Report.docx
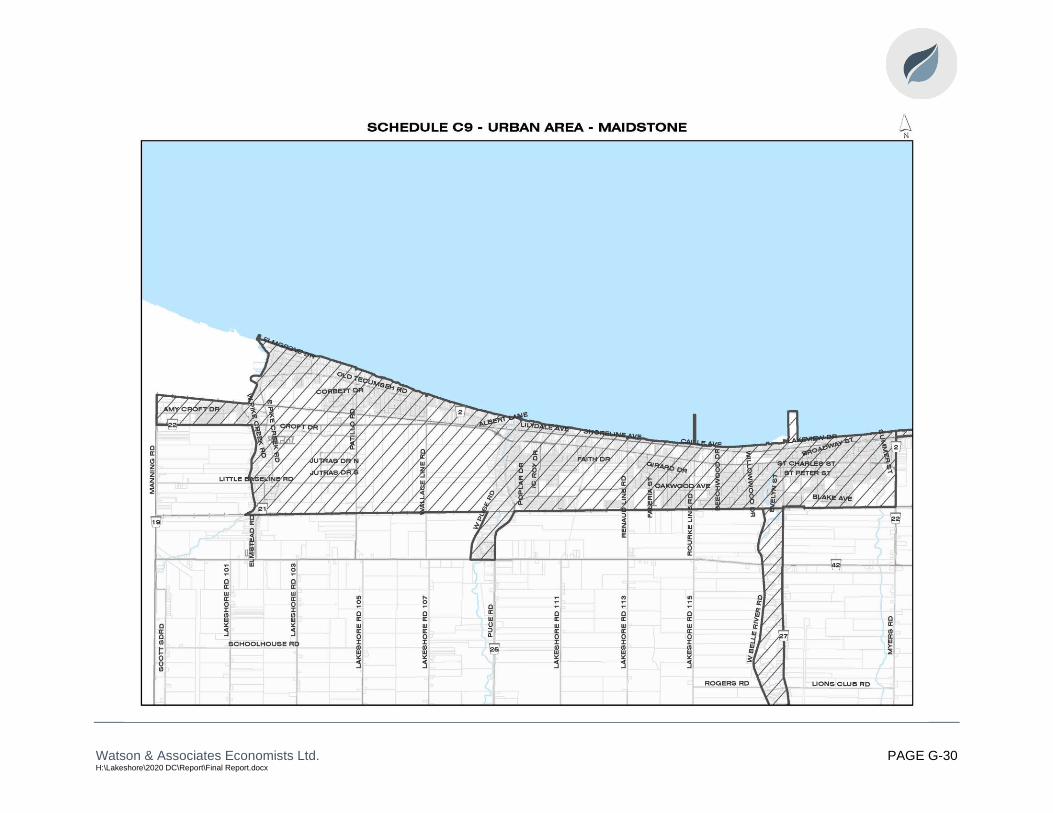
Watson & Associates Economists Ltd. PAGE G-30 H:\Lakeshore\2020 DC\Report\Final Report.docx
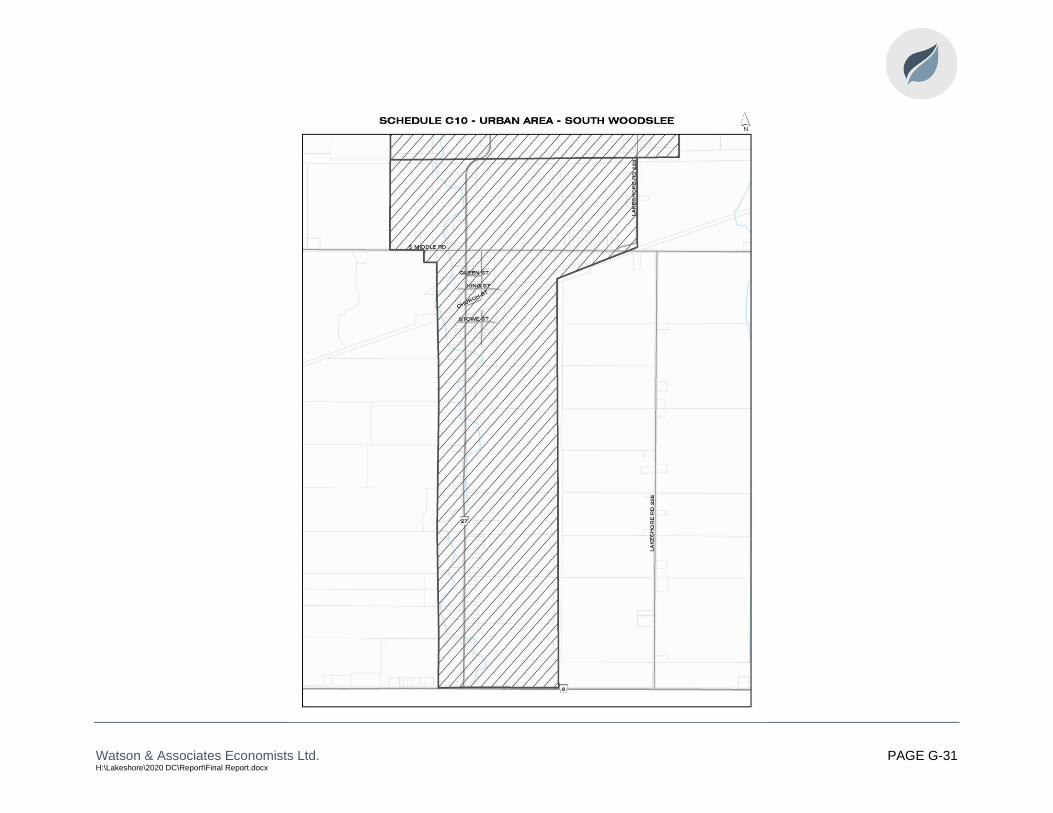
Watson & Associates Economists Ltd. PAGE G-31 H:\Lakeshore\2020 DC\Report\Final Report.docx
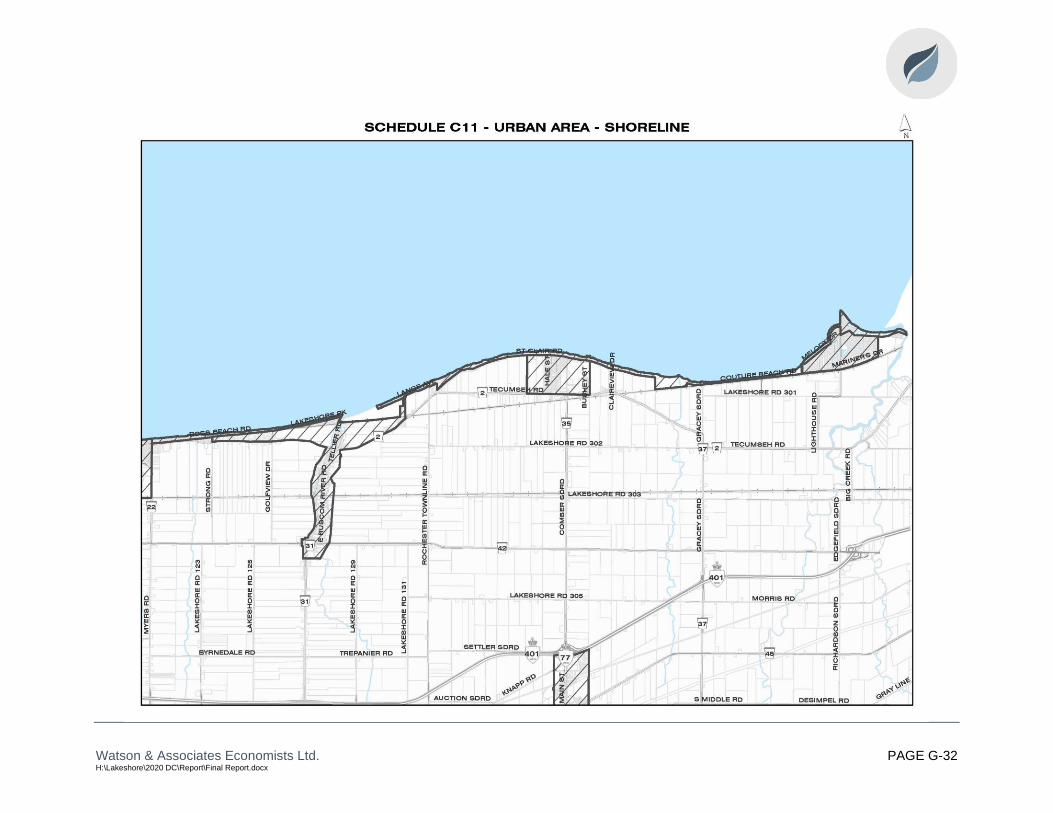
Watson & Associates Economists Ltd. PAGE G-32 H:\Lakeshore\2020 DC\Report\Final Report.docx

Watson & Associates Economists Ltd. PAGE G-33 H:\Lakeshore\2020 DC\Report\Final Report.docx
Schedule D Town of Lakeshore
Undeveloped and Prepaid Development Charges as of December 31, 2019
Legal Plan Lot Number or Part Number
Remaining # lots
January 1, 2020
Remaining # of lots
paying Services Related
to a Highway DC
12M 509
16,18,23-26,28,30,32-36,38,40-42,46-54,63,67-71,74-76,80-
83,86,89,102,110,112,116,120,127,128,130 19 19
12R 08732 Parts 1 & 2 ( 1 parcel, Roll: 580-00350) 1797 2nd Con 1 1
12R 12545 1 (County Rd 31) 1 1
12R 13737 2, 3 (County Rd 2, Rochester) 1 1
12R 14077 1, 3, 5, 6, 10 5 5
12R 17064 1 Lot (Roll: 130-00990) W Belle River Rd 1 1
12R 17938 Part 7 (Roll: 540-12170) 2231 County Rd 27 1 1
12R 20514 Part 4 1 1
12R 21248 2, 3 2 2
12R 21363 6 1 -
12R 21452 12 - -
12R 21910 46 - 1160 Regency 1 -
34 32
2
Total Lots
Number of Lots Not Subject to Services Related to a Highway Component of the DC