development & implementation of particle number ... · development & implementation of...
TRANSCRIPT

Development & Implementation of Particle
Number Measurement for Vehicle Emissions
Regulation
8 - 9 June 2010 : Metrology of Airborne
Nanoparticles, Standardisation and
Applications (MANSA)
Current Vehicle Emissions Regulations
• New cars and vans: Euro 4 (Directive 70/220/EEC as amended or ECE Regulation 83.05)
• Engines of new HGVs and buses: Euro V (Directive 2005/55/EC as amended or ECE Regulation 49.05)
• These standards all control particle emissions by means of limits on total Particulate Mass
• Measurement technique involves passing a sample of diluted exhaust through two filter papers in series and
measuring change in mass of (conditioned) filter papers
UNECE Working Party 29 & GRPE
• WP.29 is the United Nations working party with the mandate to develop harmonised regulations on motor
vehicle construction/performance e.g. UNECE
Regulations 49 and 83 on vehicle emissions.
• The Working Party on Pollution and Energy (GRPE) is
the subsidiary body of WP.29 that prepares regulatory proposals on pollution and energy efficiency.
• Within GRPE proposals are developed by “informal
groups” tasked with work on specific subject areas.

Particle Measurement Programme
• Concerns of health experts over nano-particles
• Concerns over the sensitivity of PM at advanced technology emissions levels and its ability to drive technology capable of efficiently controlling nanoparticles
• Decision taken to develop new metrics which would enable legislation to force highly efficient particle emissions controltechnologies, IF a political decision was taken to do so
• PMP established as a GRPE informal group in 2001 to develop these
Particle Measurement Programme Mandate
• To develop new techniques to replace or complement Particulate Mass measurement;
– Including a description of the test procedures, sampling and measurement equipment.
– Applicable to Light & Heavy Duty testing
– Suitable for use on transient test cycles
• To provide data on the performance of different
technologies, including wall-flow Diesel Particulate Filter
equipped vehicles, according to the new measurement procedures

PMP Participants
Governments
• France, Germany, Greece, Japan, Korea, Sweden,
Switzerland & UK
• European Commission DG JRC
Industry
• AECC, CONCAWE, OICA
Laboratories
• AEA, EMPA, JRC, LAT, AVL-MTC, NMVERL, NTSEL,
Ricardo, RWTUV, Shell, UTAC, Volvo, VTT,
Environment Canada, Daimler
PMP Phases I & II Identification &
Evaluation of Candidate Techniques
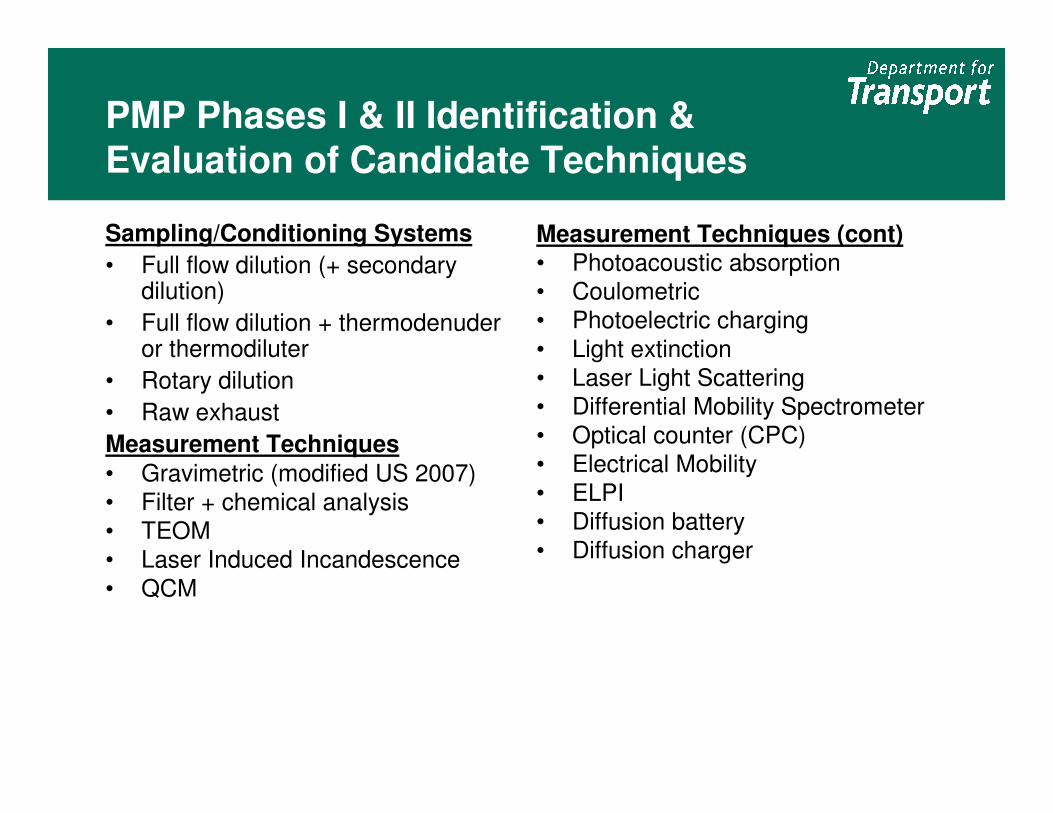
Sampling/Conditioning Systems
• Full flow dilution (+ secondary dilution)
• Full flow dilution + thermodenuderor thermodiluter
• Rotary dilution
• Raw exhaust
Measurement Techniques
• Gravimetric (modified US 2007)
• Filter + chemical analysis
• TEOM
• Laser Induced Incandescence
• QCM
Measurement Techniques (cont)• Photoacoustic absorption
• Coulometric
• Photoelectric charging
• Light extinction
• Laser Light Scattering
• Differential Mobility Spectrometer
• Optical counter (CPC)
• Electrical Mobility
• ELPI
• Diffusion battery
• Diffusion charger
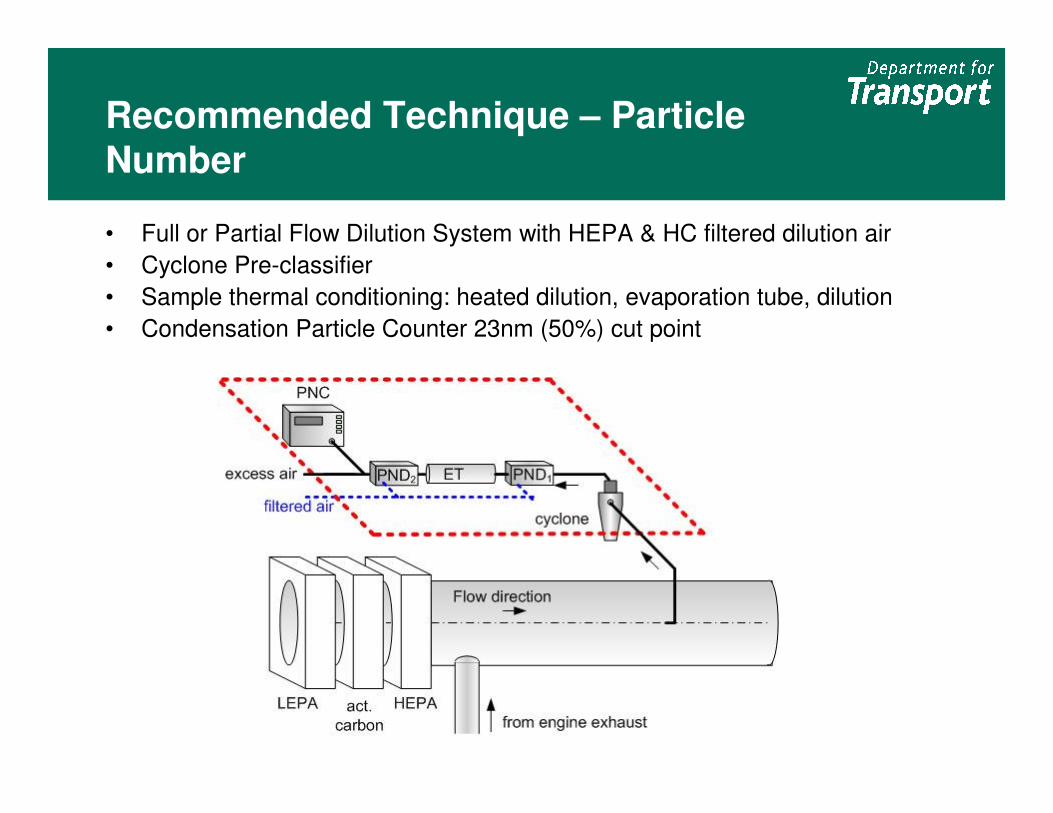
Recommended Technique – Particle
Number
• Full or Partial Flow Dilution System with HEPA & HC filtered dilution air
• Cyclone Pre-classifier
• Sample thermal conditioning: heated dilution, evaporation tube, dilution
• Condensation Particle Counter 23nm (50%) cut point

Merits of Recommended Technique
• Excellent sensitivity at low emissions levels
• Acceptable particle losses
• Fully compatible with existing regulatory emissions sampling systems
• Robust in a type approval environment
• Good repeatability
• Good reproducibility through good sample definition by sample pre-conditioning & defined CPC cut-point
• Availability of components

PMP Phase III - Validation
• Separate Light & Heavy Duty Validation Exercises
Aims
• Assess repeatability and lab-lab reproducibility of proposed technique
• Assess performance levels of different vehicle/engine technologies
• Assess performance of various measurement systems
Overview
• Measurements at ≥5 laboratories
• Bookend testing at DG-JRC
• Golden Engineer, Golden Vehicle/Engine & Golden System
• Optional additional vehicles & systems
• Additional industry Round Robin in parallel to Heavy Duty Validation Exercise
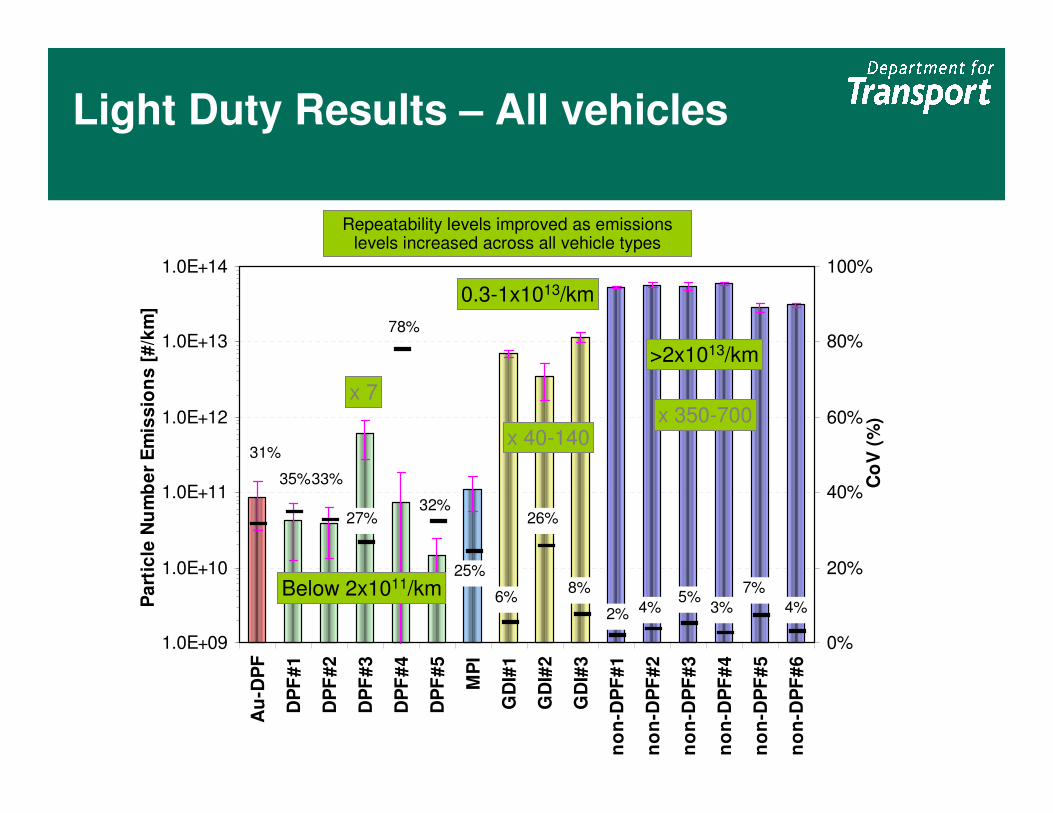
Light Duty Results – All vehicles
1.0E+09
1.0E+10
1.0E+11
1.0E+12
1.0E+13
1.0E+14A
u-D
PF
DP
F#
1
DP
F#
2
DP
F#
3
DP
F#
4
DP
F#
5
MP
I
GD
I#1
GD
I#2
GD
I#3
no
n-D
PF
#1
no
n-D
PF
#2
no
n-D
PF
#3
no
n-D
PF
#4
no
n-D
PF
#5
no
n-D
PF
#6
Pa
rtic
le N
um
be
r E
mis
sio
ns
[#
/km
]
0%
20%
40%
60%
80%
100%
Co
V (
%)
31%
35%33%
27%
78%
32%
25%
6%
26%
8%
2% 4%5%
3%
7%
4%
x 7
x 40-140x 350-700
Repeatability levels improved as emissions levels increased across all vehicle types
Below 2x10¹¹/km
0.3-1x10¹³/km
>2x10¹³/km

PN Sensitive To DPF Fill State
0
2E+10
4E+10
6E+10
8E+10
1E+11
1.2E+11
1.4E+11
1.6E+11
0 20 40 60 80 100 120 140
Distance (km)
Pa
rtic
les
/km
NEDC [#/km]
• DPF Regeneration occurred prior to first test
• PN decreased from test to test as DPF filled contributing to
apparent poor repeatability
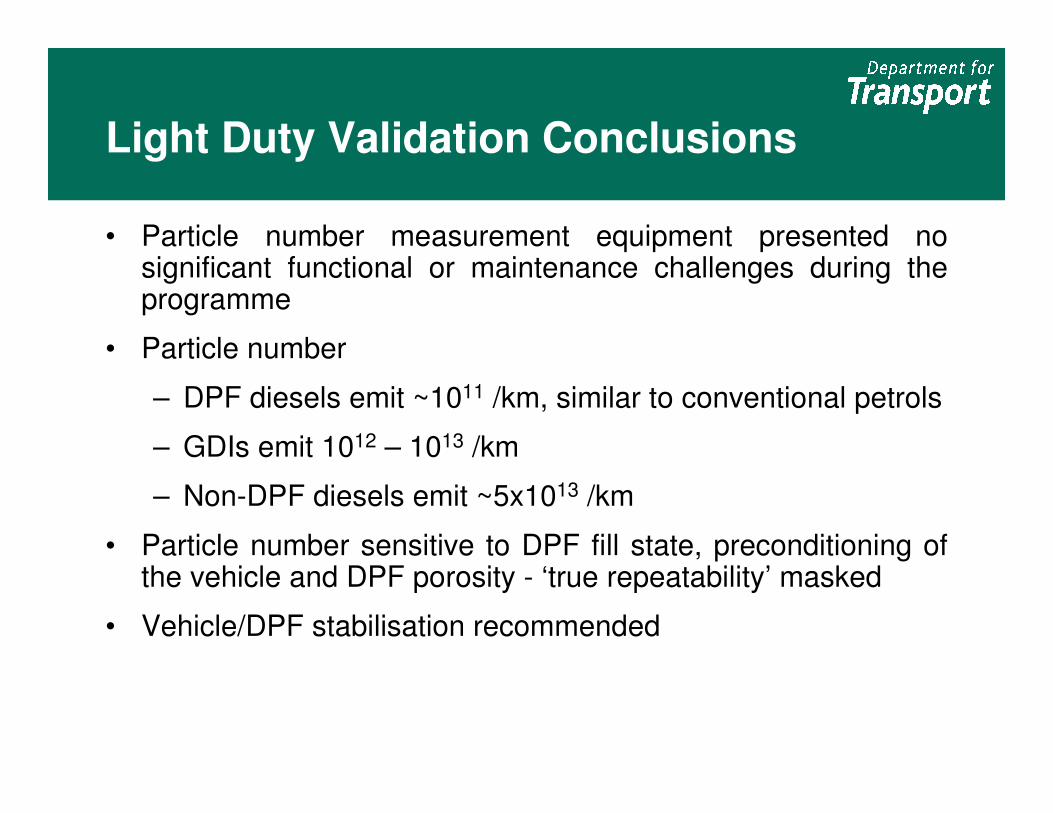
Light Duty Validation Conclusions
• Particle number measurement equipment presented no significant functional or maintenance challenges during the programme
• Particle number
– DPF diesels emit ~1011 /km, similar to conventional petrols
– GDIs emit 1012 – 1013 /km
– Non-DPF diesels emit ~5x10¹³ /km
• Particle number sensitive to DPF fill state, preconditioning of the vehicle and DPF porosity - ‘true repeatability’ masked
• Vehicle/DPF stabilisation recommended

June 2007 GRPE
• Adoption of Particle Number measurement in Regulation 83 (passenger car emissions) proposed
• Several nations expressed a view that proposal was premature with remaining issues to be resolved in particular regarding;
– calibration procedures
– VPR & PNC specifications
– Potential system to system offsets
• Proposal not adopted by GRPE
• GRPE endorsed a ‘Road Map’ of activities to allow a revised proposal to be considered by GRPE in Jan 2008
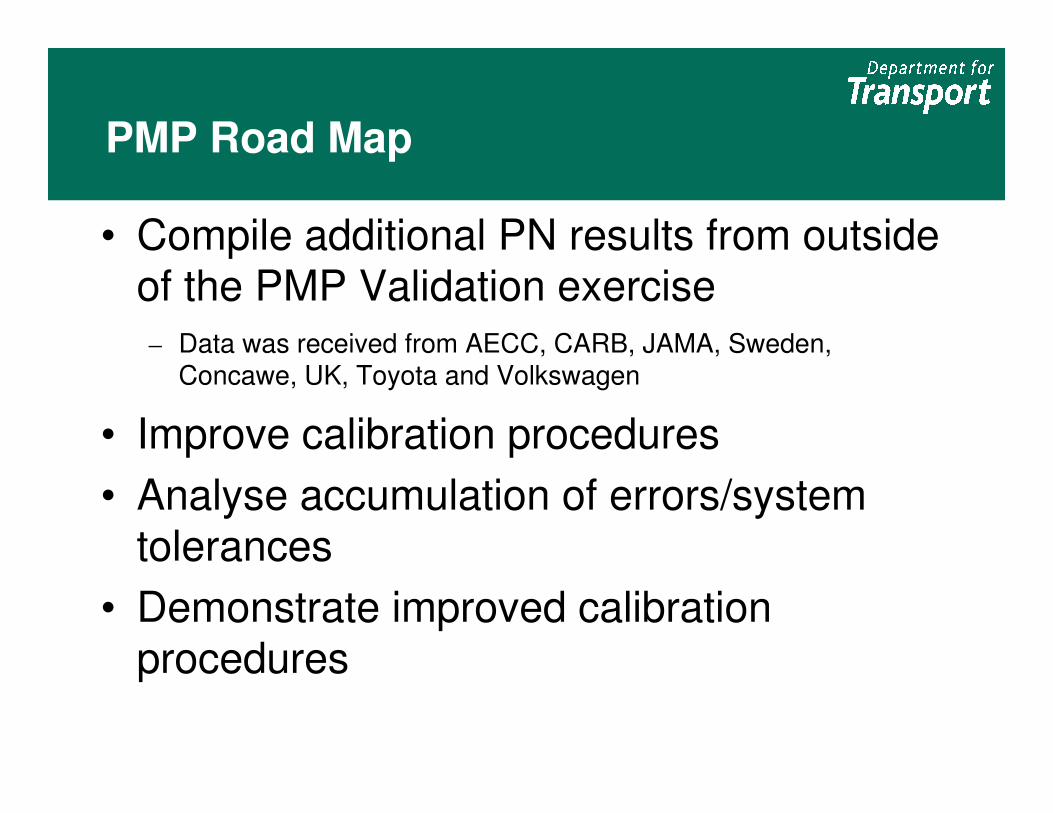
PMP Road Map
• Compile additional PN results from outside of the PMP Validation exercise
– Data was received from AECC, CARB, JAMA, Sweden, Concawe, UK, Toyota and Volkswagen
• Improve calibration procedures
• Analyse accumulation of errors/system tolerances
• Demonstrate improved calibration procedures
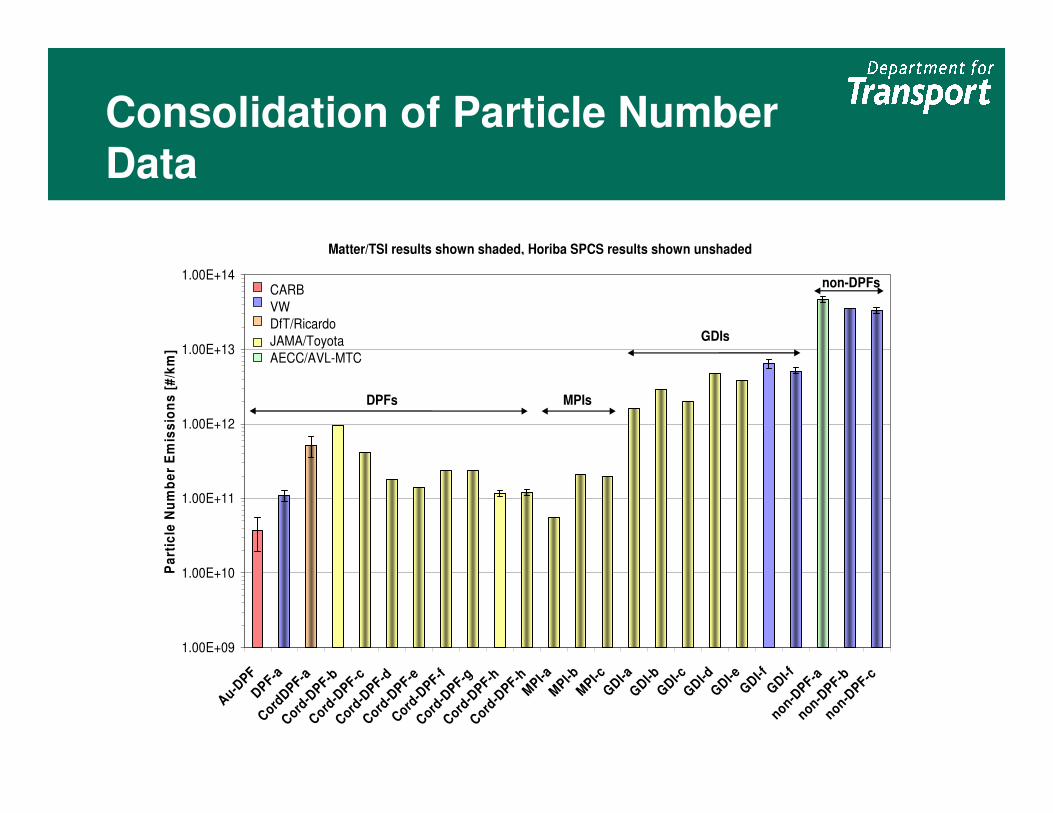
Consolidation of Particle Number Data
1.00E+09
1.00E+10
1.00E+11
1.00E+12
1.00E+13
1.00E+14
Au-DPF
DPF-aCord
DPF-a
Cord-D
PF-b
Cord-D
PF-c
Cord-D
PF-d
Cord-D
PF-e
Cord-D
PF-f
Cord-D
PF-g
Cord-D
PF-h
Cord-D
PF-hM
PI-aM
PI-bM
PI-cG
DI-aG
DI-b
GDI-c
GD
I-dG
DI-eG
DI-fG
DI-fnon-D
PF-anon-D
PF-bnon-D
PF-cP
art
icle
Nu
mb
er
Em
iss
ion
s [
#/k
m]
Matter/TSI results shown shaded, Horiba SPCS results shown unshaded
DPFs MPIs
GDIs
non-DPFsCARB
VW
DfT/Ricardo
JAMA/Toyota
AECC/AVL-MTC

Improved Calibration Procedures
• The following key revisions to the procedures were agreed
– VPR will be calibrated for “particle concentration reduction factor” (a combination of particle losses and dilution) which must not be excessively size dependent
– PNC will be calibrated to reference electrometer level, either directly or indirectly
• Correcting out differences in particle losses and PNC response reduces potential offset between systems
• EMPA, METAS, TSI & AEA undertook measurements demonstrating the improved calibration procedures and their repeatability

PNC Gradient Calibration
PNC All Validations - Gradient
0.7
0.75
0.8
0.85
0.9
0.95
1
TSI 3010
s/n
70410281
TSI 3010
s/n 2400
w ith
primary cal
factor
TSI 3010
s/n 2400
TSI 3010
s/n
70410281
TSI 3010
s/n 2435
TSI 3010
s/n 2400
TSI 3010
s/n
70410281
TSI 3010
s/n 2435
TSI 3790
s/n
70725185
TSI 3790
s/n
70725186
Grimm
5.403 s/n
54300307
Gra
die
nt
EMPA METAS
TSI
AEA
Validations by Secondary Procedure (reference PNC) Shaded
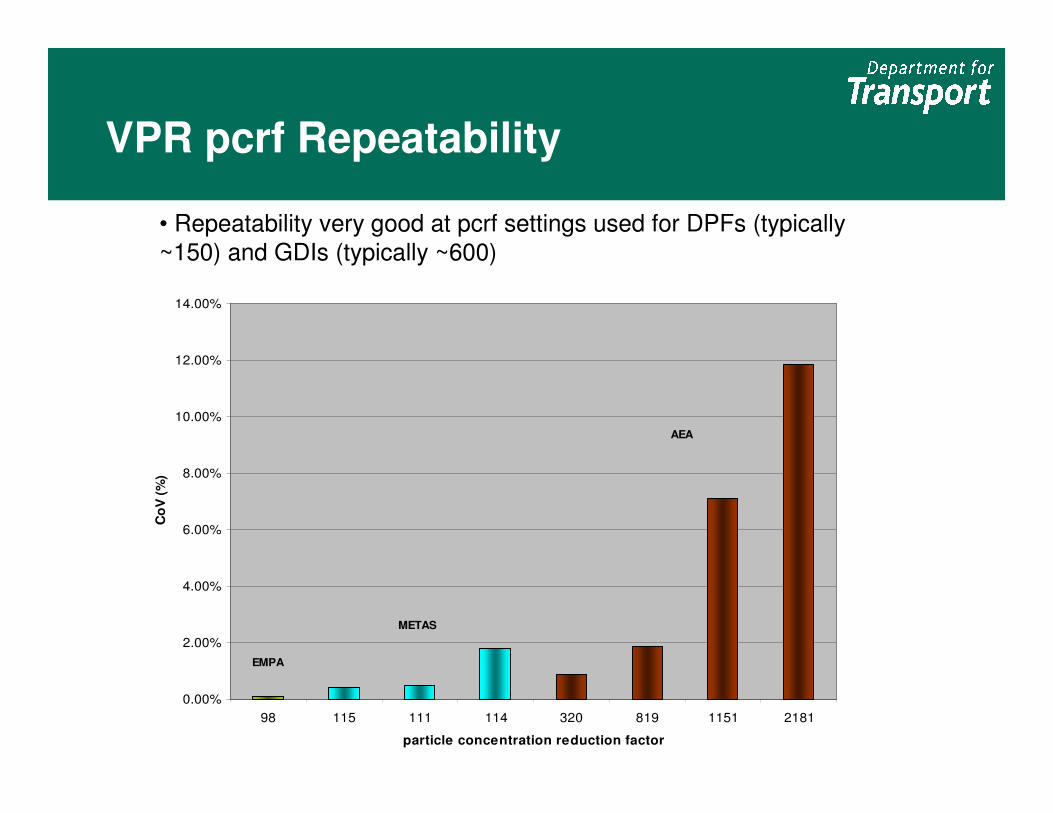
VPR pcrf Repeatability
• Repeatability very good at pcrf settings used for DPFs (typically
~150) and GDIs (typically ~600)
0.00%
2.00%
4.00%
6.00%
8.00%
10.00%
12.00%
14.00%
98 115 111 114 320 819 1151 2181
particle concentration reduction factor
Co
V (
%)
EMPA
METAS
AEA

Accumulation of Errors Analysis
• Analysis performed by the UK National Physical Laboratory according to ISO Guide to the Expression of
Uncertainty in Measurement (GUM) taking account of improvements made at August & October PMP
meetings.
• Uncertainty at typical settings for post DPF
measurement was estimated to be around 15%.
• The most significant factors contributing to uncertainty
are the PNC calibration and the allowable tolerance on
VPR pcrf validation checks

January 2008 GRPE & Reg692/2008
• Revised proposal inserting Particle Number
measurement into Regulation 83 adopted by
GRPE & subsequently by WP29 in June 2008
• EU Regulation 692/2008 adopted a PN limit for
diesel cars and vans of 6x10¹¹ /km as part of the
Euro 5 standard
• PN limit for GDI petrol cars to be adopted at
Euro 6 (2015)

Heavy Duty Validation Exercise
• Golden Engine Euro III + CRT
• Two Horiba SPCS Golden
Systems
• Participating Labs: JRC, AVL-
MTC, Ricardo, UTAC, EMPA
• Matrix of 5 test cycles including
steady state, transient, hot start,
cold start, current & future regulatory cycles
• Jan 2008 – Nov 2009
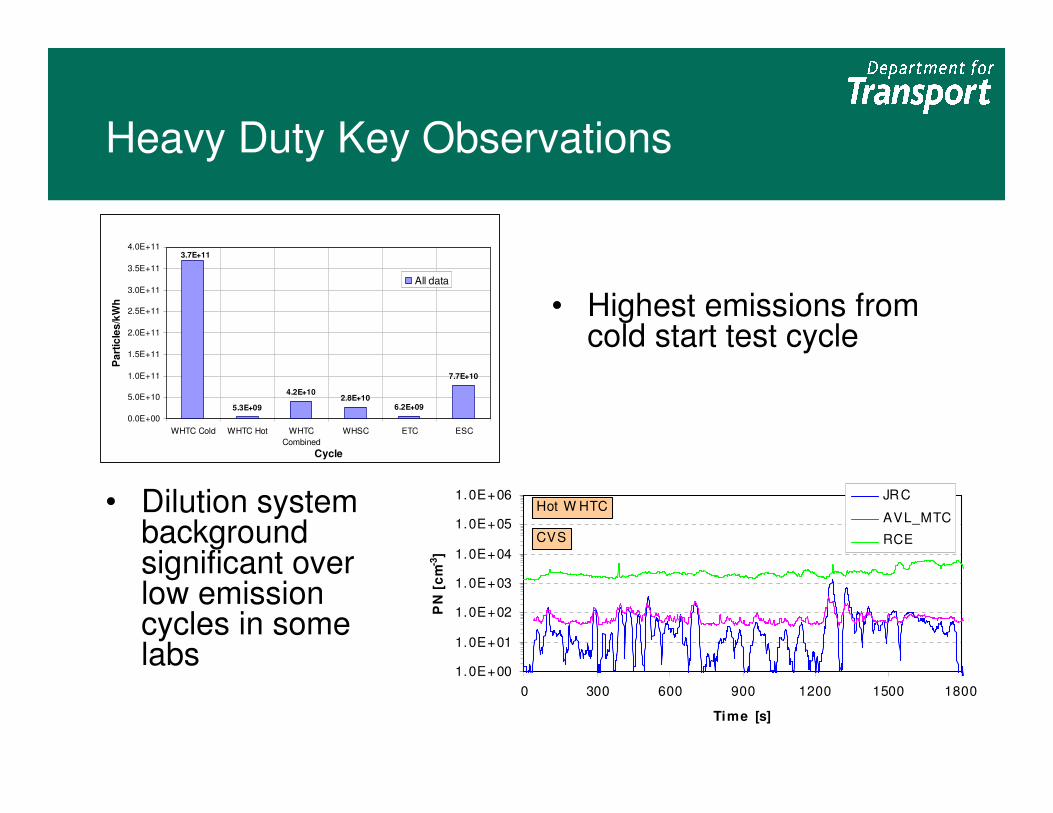
Heavy Duty Key Observations
1.0E+00
1.0E+01
1.0E+02
1.0E+03
1.0E+04
1.0E+05
1.0E+06
0 300 600 900 1200 1500 1800
Time [s]
PN
[c
m-3
]
JRC
AVL_MTC
RCECVS
Hot W HTC• Dilution system background significant over low emission cycles in some labs
5.3E+09
4.2E+102.8E+10
6.2E+09
7.7E+10
3.7E+11
0.0E+00
5.0E+10
1.0E+11
1.5E+11
2.0E+11
2.5E+11
3.0E+11
3.5E+11
4.0E+11
WHTC Cold WHTC Hot WHTC
Combined
WHSC ETC ESC
Cycle
Pa
rtic
les
/kW
h
All data
• Highest emissions from cold start test cycle
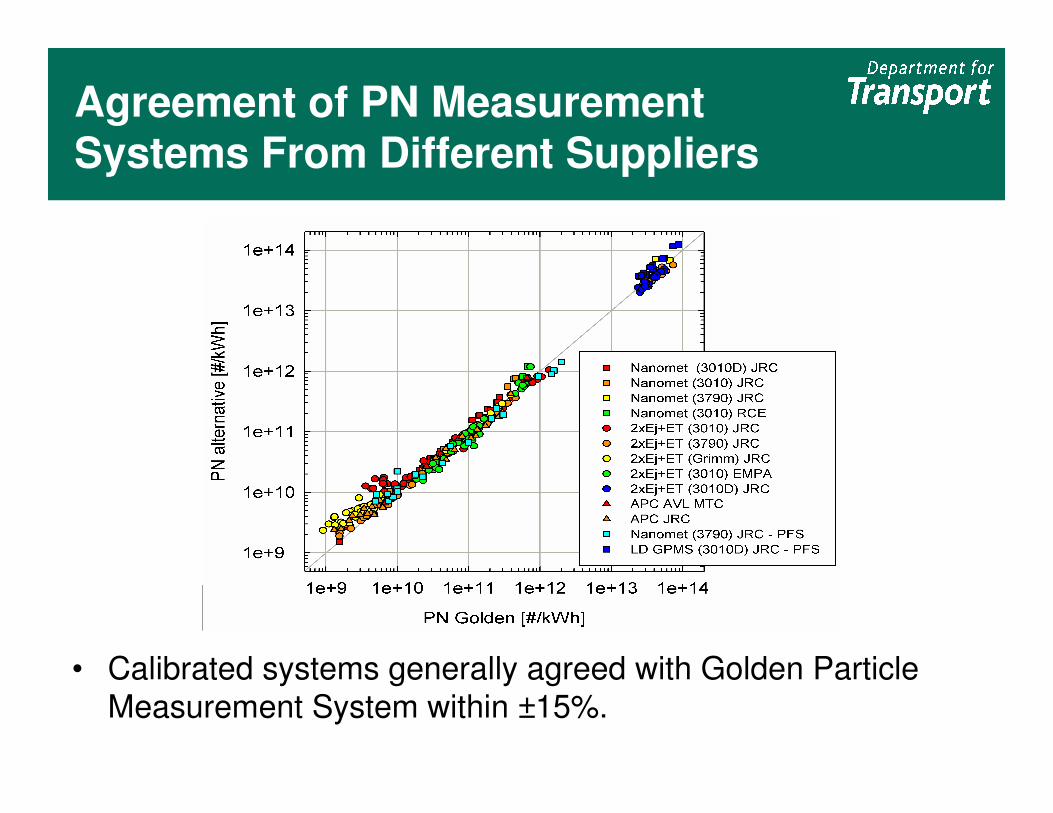
Agreement of PN Measurement Systems From Different Suppliers
• Calibrated systems generally agreed with Golden Particle
Measurement System within ±15%.
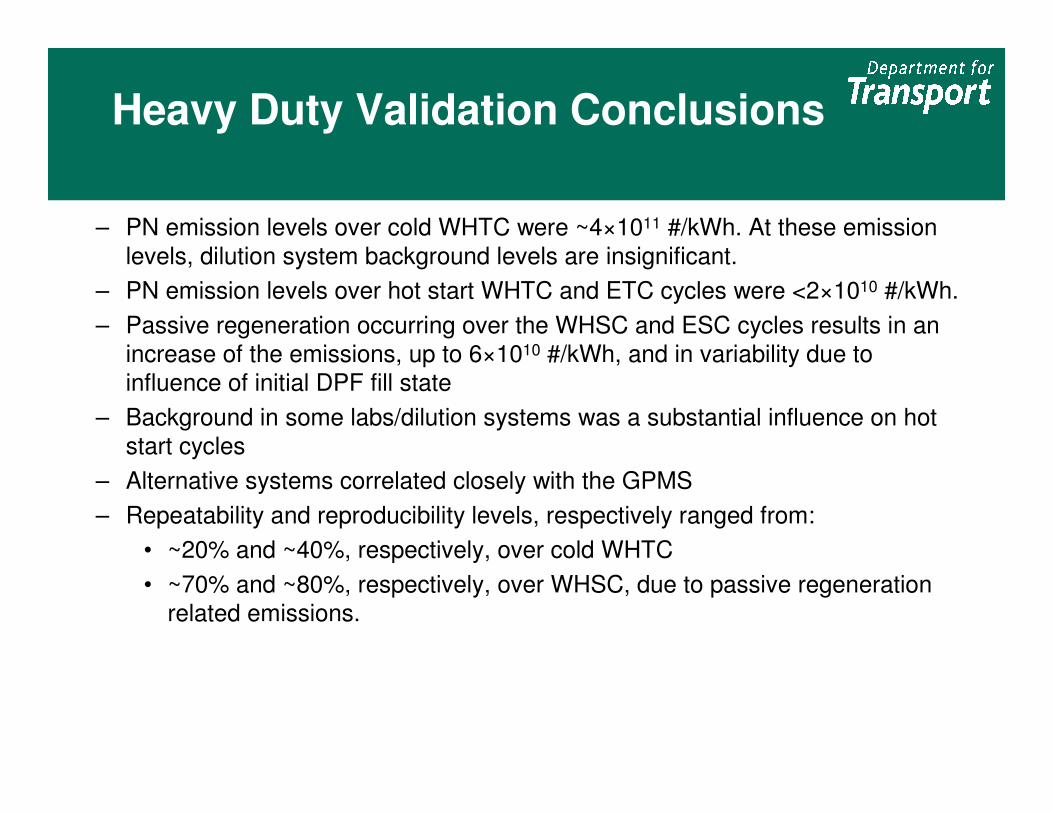
Heavy Duty Validation Conclusions
– PN emission levels over cold WHTC were ~4×10¹¹ #/kWh. At these emission
levels, dilution system background levels are insignificant.
– PN emission levels over hot start WHTC and ETC cycles were <2×10¹⁰ #/kWh.
– Passive regeneration occurring over the WHSC and ESC cycles results in an
increase of the emissions, up to 6×10¹⁰ #/kWh, and in variability due to
influence of initial DPF fill state
– Background in some labs/dilution systems was a substantial influence on hot
start cycles
– Alternative systems correlated closely with the GPMS
– Repeatability and reproducibility levels, respectively ranged from:
• ~20% and ~40%, respectively, over cold WHTC
• ~70% and ~80%, respectively, over WHSC, due to passive regeneration
related emissions.
Ongoing Issues
• Adoption of PN Measurement & Limits in Heavy
Duty Emissions legislation
• Further investigation of factors influencing
“particle concentration reduction factor”
calibration. Improvement & simplification of
procedures
• Investigation of significance of <23nm solid
particles

Thank you
Acknowledgements
Jon Andersson – Ricardo Consulting Engineers
Penny Dilara, Giorgio Martini, Barouch Giechaskiel, Thanasis Mamakos – DG JRC
Ian Marshall - AEA
Dirk Bosteels, John May – AECC; Markus Kasper – Matter Engineering;
Les Hill, Daniel Scheder – Horiba; Ken Rose - Concawe
Paul Quincey, Richard Gilham – NPL; Juerg Schlatter – METAS
All PMP Working Group Members