development of a crowdsourced-based mobile application for
TRANSCRIPT

_____________________________________________________________________________________________________ *Corresponding author: E-mail: [email protected];
Asian Journal of Research in Computer Science 8(3): 49-63, 2021; Article no.AJRCOS.67699 ISSN: 2581-8260
Development of a Crowdsourced-based Mobile Application for Measuring Quality of Internet
Service Offered by Mobile Network Operators
O. O. Obe1*, F. M. Dahunsi1 and Tolulade M. Adeniji1
1Department of Computer Science of the Federal University of Technology, Akure, Nigeria.
Authors’ contributions
This work was carried out in collaboration among all authors. Author TMA performed the statistical
analysis, wrote the protocol and wrote the first draft of the manuscript. Authors OOO and Author FMD designed the study, managed the analyses of the study and managed the literature searches.
All authors read and approved the final manuscript.
Article Information
DOI: 10.9734/AJRCOS/2021/v8i330203 Editor(s):
(1) Dr. Young Lee, University-Kingsville, USA. Reviewers:
(1) Yuichi Sei, Japan. (2) Dragana Bajic, University of Novi Sad, Serbia.
Complete Peer review History: http://www.sdiarticle4.com/review-history/67699
Received 26 February 2021 Accepted 02 May 2021
Published 12 May 2021
ABSTRACT
Wireless mobile internet is migrating towards an integrated system of internet and mobile communication network to fulfill the future of mobile network requirement: ubiquitous communication, where mobile users move freely almost anywhere and have access to the internet, communicate with anyone, anytime with any application using the best service available. This demands rapid progress in mobile communication networks and their internet technologies. This research project on the analysis of the Quality of Service (QoS) provided by Mobile Network Operators (MNOs) in the cellular internet networks. It aims to analyze and address the QoS of the internet network experienced by the user. QoS monitoring and analysis require the processing of large amounts of data and knowledge of which kinds of applications the traffic is generated by. To obtain satisfactory QoS based on internet network analysis, some network metrics must be measured and monitored at a regular time interval. In this research work, the network metric that will be measured for the internet service are signal strength, download speed, upload speed, and network transaction latency. This network metrics data will be collected from the consumer’s mobile
Original Research Article

Obe et al.; AJRCOS, 8(3): 49-63, 2021; Article no.AJRCOS.67699
50
device by the use of a crowdsourcing mobile application that is installed on the consumer’s mobile device. The investigation will cover mobile communication network providers in Nigeria. The data collated is then evaluated and analyzed.
Keywords: Mobile technology; global system for mobile communication; Mobile Network Operators
(MNO); quality of service; android-based smartphones applications.
1. INTRODUCTION Mobile technology evolution started with analog cellular technologies e.g. advanced mobile phone service (AMPS) and Total Access Communications System (TACS). The second-generation (2G) led by the digital technology global system for mobile communication (GSM) re-evaluated the concept of mobile telephony, with the rapid evolution of services. Then the 2.5G prepared its way with a packet-switched (PS) extension of the GSM network called General Packet Radio Service (GPRS) technology, providing quality in form of speed and efficient use of the network. Other technologies succeeded up to the arrival of the 3G Universal Mobile Telecommunication System (UMTS) and Code Division Multiple Access CDMA 2000. With this advancement in mobile technology, Data service has experienced a huge increase in terms of data transmission capabilities. Today end users just need an IP access connection, e.g. via a wireless local area network hotspot, a digital subscriber line DSL connection, or a GPRS/UMTS network to have access to these services. The success of Skype and other VoIP/ multimedia over IP provides in faces of dropping IP connectivity prices in providing evidence of this view. With the progress of these IP providers of networks, the competition of IP-based (telecommunication) services is growing and we can witness a changing value chain in connectivity charging decreases in favor of applications and content charging. The multiple IP telecommunication trends demand the outstanding provision of quality of service and also motivates the provision of service experience to users, to fulfill their expectations [1]. As the number of users on the internet and other telecommunication network grows, it becomes very clear that real-time applications become more difficult to implement because of erratic queuing and packet loss. With this increasing importance of internet service, it is important to do a comprehensive study on the quality of internet service offered by the mobile network operators, therefore, this project analyzes the quality of service provided by the IP providers to their consumers.
1.1 Previous Effort in Measuring Quality of Internet Service Offered by Mobile Network Operators
Related literature shows that previous studies have concentrated on the wireless cellular network in general. As a result, our literature review did not return any studies that are directly linked to our area of study i.e. understanding the QoS of internet service provided by the mobile operator from a user’s perspective by the help of a Crowdsourced-based mobile application. In the following section, we highlight a few of the studies that we found to be close to our study. A Quantitative Approach for Evaluating QoS in Wireless Cellular Networks done by Lawrence et al. in [2], was motivated by the need to quantitatively evaluate the quality of service of wireless cellular networks to make an informed decision about the state of the network for users and operators. The basic criteria used to evaluate the QoS were throughput, latency, data loss, and jitter - these factors indicate the state of each network’s responsiveness, reliability, and speed at any particular location. The output provided by the AHP approach is used as a unified measurement of the perceived QoS by users on different networks.
Mobile Device-Based Cellular Network Coverage Analysis Using Crowd Sourcing done by Jaymin et al. [3], they were motivated by the need for cellular network coverage analysis using crowdsourcing. The approach uses an application running on standard consumer mobile devices to measure various network and device parameters available to the mobile devices. These parameters include the level of received signal strength, coupled with accurate location information and automatically uploaded to a central server. The use of real measurement data makes this approach more accurate and the use of existing consumer mobile devices through crowdsourcing results in a large network measurement dataset. The implementation of this approach provides High Accuracy Coverage Mapping, Improved Cell Boundary Identification,

Obe et al.; AJRCOS, 8(3): 49-63, 2021; Article no.AJRCOS.67699
51
Detailed Cell Performance Measurements, and Dynamic Network Coverage Analysis, but the work was not fully implemented, the application use was a prototype therefore the measurement was taking in a fixed location. How existing mobile devices can be used to monitor the performance of mobile Internet services over cellular networks illustrated by Almudena, et al. [4], In order to achieve this, a mobile application called SymPA (Symbian Protocol Analyzer) was developed; SymPA is a tool which provides valuable information about user perceptions in relation to the availability and performance of applications running on mobile devices. This tool was implemented on Symbian OS. It makes it possible to analyze protocol which deals with the issue of identifying problems related to the behavior of IP based protocols on mobile communications by incorporating IP packet sniffing features into mobile devices. The tool has been tested in real networks. It is use to analyze the performance of video streaming services over mobile networks. The result of the analysis shows lost packets due to cell reselection. However, the tool is limited to only mobile device with Symbian OS platform. QoS in cellular network by analyzing the different schemes for providing QoS in cellular networks, its advantages and disadvantage presented by Dushyanth [5], The author also dealt with an important aspect of QoS which is the Individual QoS (iQoS). From the result of iQoS, it was seen that users who were not close to the Base Station (BS) were not getting good signal and the location of the users played a major role.
A model for crowdsourcing the evaluation of the Quality of Service (QoS) provided by Mobile Network Operators (MNOs) in cellular data/voice network proposed by Kolawole [6], it aims to address the gap between the reported technical capabilities of the telecoms infrastructure and the QoS experienced by the user. The work focused on measuring KPIs using subscribers’ mobile devices used in accessing the network, which led to the development of an android app that successfully measured some KPIs for voice service such as call setup success rate, channel congestion, traffic peak periods, average signal strength and cell handover rate. It is believed that the successful deployment of this app will enhance the ease, accuracy and size of data collated. However, the app could not successfully
measure call drop rates and could not distinguish between stand-alone channel congestion and traffic channel congestion. More detailed measurements and data analysis was not also carried out due to time constraints. A QoS assessment methodology for cellular communication networks by Kostanic, et al. [7], based on data collected through drive testing which is focused on the end user perception of service quality and independent of access technologies implemented by the cellular networks. QoS assessment for both the circuit switched and packet switched of the network was studied. The end goal of the proposed methodology is QoS comparison between cellular networks implementing different cellular technologies. However, the authors fail to provide QoS measurements as a function of both voice and data services simultaneously.
Strategies for improving QoS of GSM in Nigeria presented by Obata and Agbo [8], They develop a model of service quality and a set of dimension for comparative evaluation which could provide useful direction to regulators and service providers. At the end of the research work a recommendation on how to improve both the QoS in the country in order to enhance the mass-connectivity was made.
A methodology for evaluating the quality of the FTP data service in cellular (UMTS) networks based on data collected through drive testing and can be easily extended to other cellular data services by Weissberger, et. al. [9], In their work, the authors specify user experience as a key factor in determining the network operator's success. However, the proposed methodology concentrates on evaluating end-user experience based only on data services on a single network.
2. METHODOLOGY
Relevant literature in the area of QoS of data service was reviewed, their contributions to knowledge and limitations were highlighted. The purpose of this research is to analyze the quality of internet service provided by the four mobile network operators (MNO 1, MNO 2, MNO 3, and MNO 4) in major cities and towns in Nigeria. A wide range of Key Performance Indicator (KPIs) measurements for internet service was captured during the research including download speed, upload speed, and network transaction latency. KPIs measurements data were collected using a mobile application developed running on an

android smartphone and the data collected will be forwarded to a web server for proper evaluation and analysis. The overall design for the research methodology is illustrated in Fig. 1. Fig. 1 provides the overall system design used in this research from the application development to results through the following steps: Android software development, data collection, and data
Obe et al.; AJRCOS, 8(3): 49-63, 2021; Article no.
52
data collected will be forwarded to a web server for proper
overall design for the research methodology is illustrated in
design used in this research from the application development to results through the following steps: Android software development, data collection, and data
analysis. The metrics collected are: Internet services KPIs: including download speed, uploadspeed, network transaction latency and received signal strength, Location parameters: Latitude and Longitude and Network information: Network Operator Name, Location Area Code (LAC), Cell ID (ID of serving base transceiver stationand Network Type (GPRS, EDGE, CDMA, UMTS, HSDPA, HSUPA, HSPA) are collected for each data samples.
Fig. 1. System overall design
; Article no.AJRCOS.67699
analysis. The metrics collected are: Internet download speed, upload
ed, network transaction latency and received Location parameters: Latitude
Network information: Network Operator Name, Location Area Code (LAC), Cell
base transceiver station BTS) and Network Type (GPRS, EDGE, CDMA, UMTS, HSDPA, HSUPA, HSPA) are collected for

Obe et al.; AJRCOS, 8(3): 49-63, 2021; Article no.AJRCOS.67699
53
2.1 Android Application Development The QoS application used for data collection is developed using Java programming language with the aid of the Android Studio tool, Android Standard Development Kit (SDK) and Java SDK. The prototype developed sits at the application layer utilizing the underlying layers. The Android software stack is subdivided into five layers: The kernel and low-level tools, native libraries, the Android Runtime, the framework layer and on top of all the applications. The android operating system is a stack of software components that is roughly divided into five sections and four main layers. The specific metrics collected by the QoS application are: Internet services KPIs: Including download speed, upload speed, network transaction latency and Received Signal Strength (The current received signal strength in dBm). Location parameters: Latitude and Longitude. Network information: Network Operator Name, Location Area Code (LAC), Cell ID (ID of serving base transceiver station BTS), and Network Type (GPRS, EDGE, UMTS, HSDPA, HSUPA, HSPA). Location parameters were recorded by employing the GPS capabilities of the smartphone. If a GPS signal is not available, then the network location will be used. Also, other important data that will be collected are device-related information (device brand and SIM id) used to tag each data collected. Web server/web interface: The web application developed using ASP.NET and visual studio 2012 hosted online receives all measured data and the data are then loaded into MySQL database. Data is accessible through the web interface. Quality of Service for any of the mobile network operators or customers can be queried through the web interface which will aid ease in data evaluation and analysis.
3. SYSTEM IMPLEMENTATION The DataQoS Android application is the implementation of the Methodology specified in the previous chapter. The previous chapters focused on the smartphone application development and an overview of measuring specific parameters for the quality of internet services offered by mobile network operators and the methodology used to collect and transmit data between the Mobile Application (DataQoS Manager) and the Central Server hosted on the internet. The conceptual framework and workflow
were also covered. The DataQoS smartphone application is fully developed and distributed to various volunteers’ smart mobile devices. The main goal was to collect data to be used to measure the quality of data service of mobile network operators in Nigeria. The DataQoS App was developed base on android version 4.2, so any volunteers’ smart mobile devices with android version 4.2 and above can easily install it on their device. The following figures show some of the screenshots for the DataQoS manager application developed. Fig. 2 shows the home page of the app, which has six buttons: Signal strength, Mast details, Data history, Analyse data, my device and App settings, and also the traffic stats. The Signal Strength Page is to displays the signal strength currently received by the device. Fig. 3 shows the screenshot of the Signal Strength Page. The mast detail page is to displays mast information like the mast area code which the phone receives from and the mast id. It also displays the current location of the device. Fig. 4 shows the snapshot of the mast detail page. The data history page is to displays the history of the network measurement. It displays the date/time the measurement was taken, the current longitude and latitude of the device, received signal strength, mast id, mast area code, network type, network operator, SIM id(Subscriber Identity Module), country code, device brand, device CPU, device model, latency, upload speed, and download speed. Fig. 5 shows the snapshot of the data history page. The analyze data page is to displays the analysis of the total record taken by the device. It displays the Total data, Average upload rate, Average download rate, Average latency rate, Total GPRS connections, Total EDGE connections, Total EVDO connections, Total HSDPA connections, Total HSUPA connections, Total HSPA+ connections and Total HSPA connections. Fig. 6 shows the snapshot of the analyzed data page. My device page is to display the device information, like the IMEI, device type, IMSI, SIM state, device brand, CPU, manufacturer, model, and SDK number. Fig. 7 shows the snapshot of the My device page.

Fig. 2. Home page
Fig. 4. Page mast details
Obe et al.; AJRCOS, 8(3): 49-63, 2021; Article no.
54
Fig. 3. Signal strength
Fig. 4. Page mast details Fig. 5. Data history
; Article no.AJRCOS.67699
Fig. 3. Signal strength

Fig. 6. Analyze data page
Fig. 8. App settings page
Obe et al.; AJRCOS, 8(3): 49-63, 2021; Article no.
55
Fig. 6. Analyze data page
Fig. 7. My device page
Fig. 8. App settings page
Fig. 9. Traffic stats page
; Article no.AJRCOS.67699
device page
Fig. 9. Traffic stats page

Obe et al.; AJRCOS, 8(3): 49-63, 2021; Article no.AJRCOS.67699
56
Table 1. Data collected for internet service KPIs FUTA
Akure Akure/Ilesa road, Akure
Ijapo estate,Akure
Omotola street, Ibadan
UI road, Ibadan
Apata, Ibadan
Hughes Avenue, Lagos
LASU-Isheri road, Lagos
Fola agoro, Lagos
Zabutu, Nasarawa
Karudu, Nasarawa
Gwagwalada, Abuja
Total
MNO 1 607 728 854 738 769 812 926 672 752 591 580 604 8,6333 MNO 2 580 630 773 477 654 651 710 534 644 600 635 540 7,428 MNO 3 439 460 465 394 413 507 461 445 565 438 515 482 5,584 MNO 4 573 652 628 693 573 702 657 543 714 685 728 702 7,850 Total 2,199 2,470 2,720 2,302 2,409 2,672 2,754 2,194 2,675 2,314 2,458 2,328 29,495

The app settings page is to displays the general setting for the application. Fig. 8 shows the snapshot of the My device page. The Traffic stats display the download, upload, and latency statistic. Figure 9 shows the snapshot of the My device page.
4. RESULTS NAD DISCUSSION
Significant effort was taken to ensure all the four operators were collected from the close locations and at a close range of time. More than 29,495 internet service, KPIs measurements were captured from at least 50 volunteers’ devices during the specific period in twelve locations where volunteers were based. This is summarized in Table 1.
After completion of modeling and system implementation, the app was evaluated to determine if the Data QoS app was delivering the expected results. The procedure descriabove was used during the implementation to answer the research questions. The results of the research were stored in the hosting server
Fig. 10. Average signal strength provided by operator at particular location
Obe et al.; AJRCOS, 8(3): 49-63, 2021; Article no.
57
to displays the general setting for the application. Fig. 8 shows the
The Traffic stats display the download, upload, and latency statistic. Figure 9 shows the
4. RESULTS NAD DISCUSSION
Significant effort was taken to ensure all the four operators were collected from the close locations and at a close range of time. More than 29,495 internet service, KPIs measurements were captured from at least 50 volunteers’ devices
period in twelve locations where volunteers were based. This is
After completion of modeling and system implementation, the app was evaluated to determine if the Data QoS app was delivering the expected results. The procedure described above was used during the implementation to answer the research questions. The results of the research were stored in the hosting server
and analysis performed on the same data. The data analysis was done base on the specific internet KPIs used.
Signal strength: The target of the signal strength is -95dBm. If the signal strength is too high i.e. -95dBm, signal distortion may occur, leading to erratic connections.
Generally, a very strong signal is approximate 40dBm down to -75dBm. A weak signal is 95dBm or lower. All the operators met the target in all locations and times as shown in Figs. 10 and 11 above. But operator like MNO 3 has relatively weak signal strength in all location apart from Lagos this is because MNO 3 has more base station in Lagos compare to the other place and also MNO 1 has weaker signal strength in Nasarawa compare to other operators. It was observed that the period of the day affects the signal strength this is due to the increase in electromagnetic interference or noise in the environment during the day.
Average signal strength provided by operator at particular location
; Article no.AJRCOS.67699
and analysis performed on the same data. The data analysis was done base on the specific
The target of the signal the signal strength is too
95dBm, signal distortion may occur,
Generally, a very strong signal is approximate -75dBm. A weak signal is -
All the operators met the target in all locations and times as shown in Figs. 10 and 11 above. But operator like MNO 3 has relatively weak signal strength in all location apart from Lagos this is because MNO 3 has more base station in
os compare to the other place and also MNO 1 has weaker signal strength in Nasarawa compare to other operators. It was observed that the period of the day affects the signal strength this is due to the increase in electromagnetic
he environment during
Average signal strength provided by operator at particular location

Fig. 11. Average signal strength provided by operator at a particular time
Download speed: Speed is an important parameter as it is an indication of the waiting times consumers experience when performing
Fig. 12. Average download speed provided by operator at particular
Obe et al.; AJRCOS, 8(3): 49-63, 2021; Article no.
58
Average signal strength provided by operator at a particular time
Speed is an important parameter as it is an indication of the waiting times consumers experience when performing
tasks such as downloading files, web browsing, chatting, watching movies.
Average download speed provided by operator at particular location
; Article no.AJRCOS.67699
Average signal strength provided by operator at a particular time
tasks such as downloading files, web browsing,
location
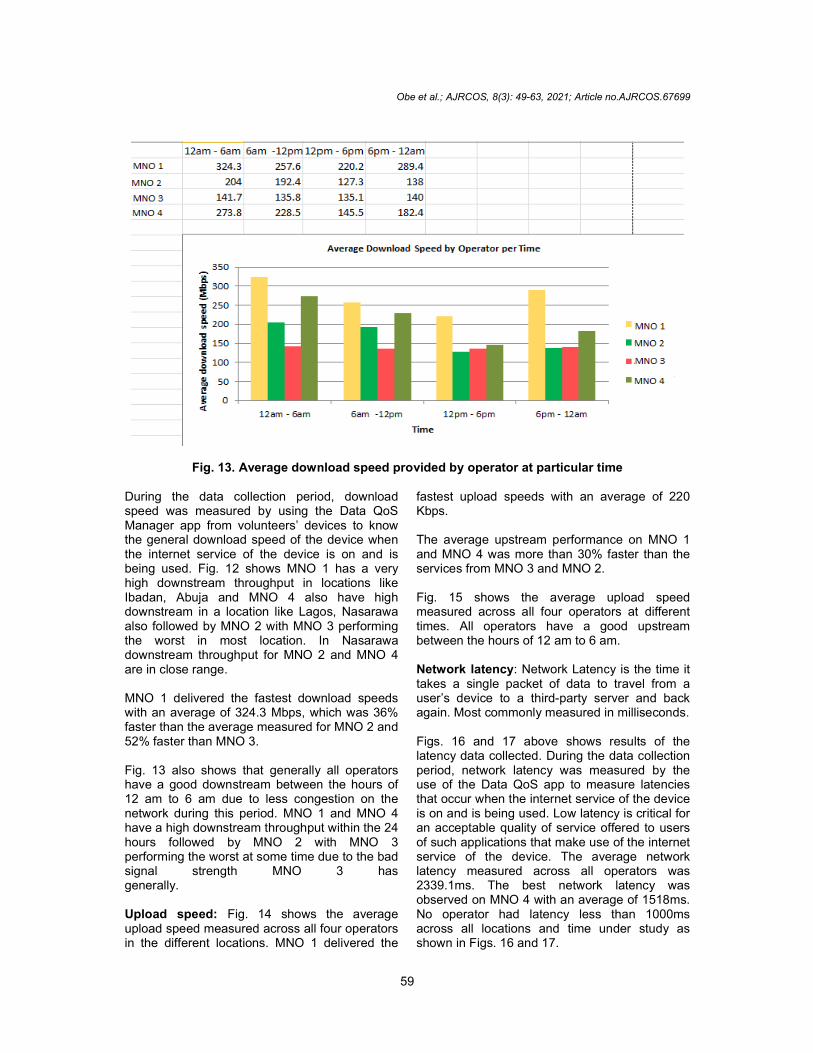
Fig. 13. Average download speed provided by operator at particular
During the data collection period, download speed was measured by using the Data QoS Manager app from volunteers’ devices to know the general download speed of the device when the internet service of the device is on and is being used. Fig. 12 shows MNO 1 has a very high downstream throughput in locations like Ibadan, Abuja and MNO 4 also have high downstream in a location like Lagos, Nasarawa also followed by MNO 2 with MNO 3 performing the worst in most location. In Nasarawa downstream throughput for MNO 2 and MNO 4 are in close range. MNO 1 delivered the fastest download speeds with an average of 324.3 Mbps, which was 36% faster than the average measured for MNO 2 and 52% faster than MNO 3. Fig. 13 also shows that generally all operahave a good downstream between the hours of 12 am to 6 am due to less congestion on the network during this period. MNO 1 and MNO 4 have a high downstream throughput within the 24 hours followed by MNO 2 with MNO 3 performing the worst at some time dsignal strength MNO 3 has generally. Upload speed: Fig. 14 shows the average upload speed measured across all four operators in the different locations. MNO 1 delivered the
Obe et al.; AJRCOS, 8(3): 49-63, 2021; Article no.
59
Average download speed provided by operator at particular time
During the data collection period, download speed was measured by using the Data QoS
pp from volunteers’ devices to know the general download speed of the device when the internet service of the device is on and is
12 shows MNO 1 has a very high downstream throughput in locations like Ibadan, Abuja and MNO 4 also have high downstream in a location like Lagos, Nasarawa also followed by MNO 2 with MNO 3 performing the worst in most location. In Nasarawa
oughput for MNO 2 and MNO 4
MNO 1 delivered the fastest download speeds with an average of 324.3 Mbps, which was 36% faster than the average measured for MNO 2 and
13 also shows that generally all operators have a good downstream between the hours of 12 am to 6 am due to less congestion on the network during this period. MNO 1 and MNO 4 have a high downstream throughput within the 24 hours followed by MNO 2 with MNO 3 performing the worst at some time due to the bad signal strength MNO 3 has
Fig. 14 shows the average upload speed measured across all four operators in the different locations. MNO 1 delivered the
fastest upload speeds with an averKbps. The average upstream performance on MNO 1 and MNO 4 was more than 30% faster than the services from MNO 3 and MNO 2. Fig. 15 shows the average upload speed measured across all four operators at different times. All operators have a good between the hours of 12 am to 6 am. Network latency: Network Latency is the time it takes a single packet of data to travel from a user’s device to a third-party server and back again. Most commonly measured in milliseconds. Figs. 16 and 17 above shows results of the latency data collected. During the data collection period, network latency was measured by the use of the Data QoS app to measure latencies that occur when the internet service of the device is on and is being used. Low latency ian acceptable quality of service offered to users of such applications that make use of the internet service of the device. The average network latency measured across all operators was 2339.1ms. The best network latency was observed on MNO 4 with an average of 1518ms. No operator had latency less than 1000ms across all locations and time under study as shown in Figs. 16 and 17.
; Article no.AJRCOS.67699
time
fastest upload speeds with an average of 220
The average upstream performance on MNO 1 and MNO 4 was more than 30% faster than the
Fig. 15 shows the average upload speed measured across all four operators at different times. All operators have a good upstream between the hours of 12 am to 6 am.
: Network Latency is the time it takes a single packet of data to travel from a
party server and back again. Most commonly measured in milliseconds.
above shows results of the latency data collected. During the data collection period, network latency was measured by the use of the Data QoS app to measure latencies that occur when the internet service of the device is on and is being used. Low latency is critical for an acceptable quality of service offered to users of such applications that make use of the internet service of the device. The average network latency measured across all operators was 2339.1ms. The best network latency was
4 with an average of 1518ms. No operator had latency less than 1000ms across all locations and time under study as

Fig. 14. Average upload speed provided by operator at particular location
Fig. 15. Average upload opeed provided by Operator at particular time
Obe et al.; AJRCOS, 8(3): 49-63, 2021; Article no.
60
Average upload speed provided by operator at particular location
Average upload opeed provided by Operator at particular time
; Article no.AJRCOS.67699
Average upload speed provided by operator at particular location
Average upload opeed provided by Operator at particular time

Fig. 16. Average latency provided by operator at particular location
Fig. 17. Average latency provided by operator at particular location
4.1 The Critical Evaluation Made Across all the locations and time under study, all operators had good signal strength on average,
Obe et al.; AJRCOS, 8(3): 49-63, 2021; Article no.
61
Average latency provided by operator at particular location
Average latency provided by operator at particular location
Made
Across all the locations and time under study, all operators had good signal strength on average,
meeting conditions set by the regulator which says (the target of the signal strength is It, therefore, means that signal strength is not the only factor determining the download speed and
; Article no.AJRCOS.67699
meeting conditions set by the regulator which says (the target of the signal strength is -95dBm). It, therefore, means that signal strength is not the only factor determining the download speed and

Obe et al.; AJRCOS, 8(3): 49-63, 2021; Article no.AJRCOS.67699
62
upload speed. The number of users on the network and the bandwidth of the network can also determine it. Also, signal strength is not the only factor determining the quality of service, some other factors that determine the quality of service are the bandwidth provided by the operators, types of device been use, and the distance of base station the user has access to. Across all the location MNO 1 had a high download and upload speed compared to other operators this is because MNO 1 has more base station compared to other operators; MNO 4 had good network latency, this is probably due to lesser congestion on the network. Base on time it is seen that download and upload speed for all network is better and higher between 12 am and 6 am compared to the period between 12 pm and 6 pm this is because there is more congestion on the network during the period of 12 pm and 6 pm which greatly affects the internet speed. GSM operators must be compelled to purchase enough bandwidth so that their service quality doesn‘t dwindle when users increase on the network.
5. CONCLUSION We have presented the results of the study of the quality of service of mobile network operators in twelve specific locations in Nigeria. Our results suggest the following: One, smartphone applications can be used to measure the quality of services offered by mobile network operators; Two, across all the twelve location understudy all operators had an average good signal strength meeting conditions set by the regulator. It, therefore, means signal strength is not the only factor determining the quality of service. Three, across all the locations MNO 1 had high download speeds compared to other operators; MNO 4 had good network latency.
We recommend that the regulator should check if mobile network operators meet key performance indicators related to data (internet). We also recommend the use of smartphone applications to be used by consumers to measure if the operator is providing them the kind of service they promised and which providers provide good quality of service. From the study we have five main statements to make; first, data analysis suggested that all
operators met the target set on Signal strengths. Secondly, signal strength is not only the determining factor to have a better quality of service. Thirdly, internet service performance varied across all operators with only two operators having a better quality of service. Fourthly, network latency is not only the limiting factor in download speeds (i.e. throughputs).
DISCLAIMER The products used for this research are commonly and predominantly use products in our area of research and country. There is absolutely no conflict of interest between the authors and producers of the products because we do not intend to use these products as an avenue for any litigation but for the advancement of knowledge. Also, the research was not funded by the producing company rather it was funded by personal efforts of the authors. COMPETING INTERESTS Authors have declared that no competing interests exist.
REFERENCES 1. Camarillo G. 3G IP multimedia subsystem,
merging the internet and the cellular worlds. John Willey & Sons Ltd West Sussex, England. 2004;480.
2. Lawrence O, Apkar S, Gregory O. A Quantitative Approach for Evaluating QOS in Wireless Cellular Networks using the Analytic Hierarchy Process Method. International Conference on System Engineering and Modeling (ICSEM 2012); 2012.
3. Jaymin DM, Andrew JP. Mobile device-based cellular network coverage analysis using crowd sourcing. Johannesburg: School of Electrical and Information Engineering, University of the Witwatersrand; 2011.
4. Almudena D, Pedro M, Javier FR. Customer-centric measurements on mobile phones. Dpto. de Lenguajesy Ciencias de la Computacion, University of Malaga, Spain; 2013.
5. Dushyanth B. “QoS in Cellular Networks”; 2010. Available:www-docs\cse574-06\ftp\cellular_qos.pdf
6. Kolawole GS. Crowdsourcing application for cellular network voice QoS analysis and

Obe et al.; AJRCOS, 8(3): 49-63, 2021; Article no.AJRCOS.67699
63
evaluation using mobile devices. An undergraduate project for the award of BTECH in computer science from the department of computer science, Federal University of Technology, Akure, Nigeria; 2014.
7. Kostanic I, Mijatovic N, Vest SD. Measurement-based QoS comparison of cellular communication networks, in proceedings of 2009 IEEE International CQR Workshop, Naples, FL; 2009.
8. Obata ME, Agbo PE. Strategies for improving Quality of Service (QoS) of the global system for mobile communication (gsm) in Nigeria; 2012.
9. Weissberger I, Mijatovic N, Kostanic I. Evaluating FTP QoS in a UMTS Networks." In proceedings of 2009 International Conference on Wireless Networks, Las Vegas, NV; 2009.
_________________________________________________________________________________ © 2021 Obe et al.; This is an Open Access article distributed under the terms of the Creative Commons Attribution License (http://creativecommons.org/licenses/by/4.0), which permits unrestricted use, distribution, and reproduction in any medium, provided the original work is properly cited.
Peer-review history: The peer review history for this paper can be accessed here:
http://www.sdiarticle4.com/review-history/67699