development of a descriptive fit statistic for the rasch model
TRANSCRIPT

HAL Id: hprints-01654099https://hal-hprints.archives-ouvertes.fr/hprints-01654099
Submitted on 3 Dec 2017
HAL is a multi-disciplinary open accessarchive for the deposit and dissemination of sci-entific research documents, whether they are pub-lished or not. The documents may come fromteaching and research institutions in France orabroad, or from public or private research centers.
L’archive ouverte pluridisciplinaire HAL, estdestinée au dépôt et à la diffusion de documentsscientifiques de niveau recherche, publiés ou non,émanant des établissements d’enseignement et derecherche français ou étrangers, des laboratoirespublics ou privés.
Development of a descriptive fit statistic for the Raschmodel
Purya Baghaei, Takuya Yanagida, Moritz Heene
To cite this version:Purya Baghaei, Takuya Yanagida, Moritz Heene. Development of a descriptive fit statistic for theRasch model . North American Journal of Psychology, North American Journal of Psychology, 2017.�hprints-01654099�

Seediscussions,stats,andauthorprofilesforthispublicationat:https://www.researchgate.net/publication/313708213
DevelopmentofadescriptivefitstatisticfortheRaschmodel
ArticleinNorthAmericanJournalofPsychology·February2017
CITATION
1
READS
87
3authors,including:
Someoftheauthorsofthispublicationarealsoworkingontheserelatedprojects:
BullyingViewproject
AlatentvariableanalysisofcontinuingprofessionaldevelopmentconstructsusingPLS-SEMmodeling
Viewproject
PuryaBaghaei
IslamicAzadUniversityMashhadBranch
47PUBLICATIONS233CITATIONS
SEEPROFILE
TakuyaYanagida
50PUBLICATIONS107CITATIONS
SEEPROFILE
AllcontentfollowingthispagewasuploadedbyPuryaBaghaeion15February2017.
Theuserhasrequestedenhancementofthedownloadedfile.

________________________________
Author info: Correspondence should be sent to: Dr. Purya Baghaei, English
Department, Mashhad Branch, Islamic Azad University, Mashhad, Iran.
North American Journal of Psychology, 2017, Vol. 19, No. 1, 155-168.
NAJP
Development of a Descriptive Fit Statistic for the
Rasch Model
Purya Baghaei Islamic Azad University, Iran
Takuya Yanagida University of Applied Sciences, Austria
Moritz Heene Ludwig-Maximilians University, Germany
Statistical hypothesis testing is commonly used to assess the fit of data to
the Rasch models. Such tests of fit are problematical as they are sensitive
to sample size and the number of parameters in the model. Furthermore,
the null distributions of the statistical test may deviate from a distribution
with a known parametric shape. Accordingly, in this study, a number of
descriptive fit statistics for the Rasch model, based on the tenets of
Andersen’s LR test and Fischer-Scheiblechner’s S test, are suggested and
compared using simulation studies. The results showed that some of the
measures were sensitive to sample size while some were insensitive to
model violations. Andersen’s χ2/df measure was found to be the best
measure of fit.
The Rasch model (Rasch 1960/1980) has become a standard
measurement model for the analysis and validation of educational and
psychological tests and for the purpose of scaling examinees (Embretson,
2000; Hambleton, 1991; Rupp, 2006). This is due to the appealing
properties of the model which are generally referred to as objective
measurement (Karabatsos, 2000). These properties include parameter
separability, existence of a common interval scale for both persons and
items, unidimensionality of measurement, and existence of a sufficient
statistic to estimate person and item parameters independently of each
other (Baghaei, 2009; Fischer, 2006). Nevertheless, these features are not
achieved automatically upon subjecting raw data to the Rasch model. The
degree to which these essential properties of measurement are attained
depends on the fit of data to the Rasch model.
The attractive properties of the Rasch model and the assumptions of
the model—that is, unidimensionality, parallel item characteristic curves,
156 NORTH AMERICAN JOURNAL OF PSYCHOLOGY
and stochastic independence—allow for elegant methods of testing the
model. Over the years, numerous global and local statistical tests have
been proposed to check the conformity of data to the Rasch model
principles (see Maydeu-Olivares, 2013).
Most of the fit tests available for the Rasch model rely on the
principles of statistical hypothesis testing based on the null hypothesis in
which the Rasch model holds, and an alternative hypothesis in which the
Rasch model does not hold. The most widely used methods for testing
the Rasch model are Andersen’s likelihood ratio test (LR test) (Andersen,
1973), Martin-Löf’s test (Martin-Löf, 1973), Q1 test (Van den
Wollenberg, 1982), and R1 test (Glas, 1988). However, statistical tests for
the Rasch model have certain disadvantages that affect their utility and
reliability as model checks. The most serious problem of statistical
significance testing is the sensitivity to sample size and the number of
items. For instance, statistical tests might lead to statistically significant
results even under practically negligible deviation from the Rasch model
when sample size is large (high statistical power) or statistically
nonsignificant results even under large deviations from the Rasch model
when samples are small and thus have low statistical power (Gustafsson,
1980). Thus, sample size determination given type-I-risk α, type-II-risk
β, and model deviation δ for testing the Rasch model is needed
(Kubinger, 2009). Nevertheless, only a few methods for sample size
determination under restrictive assumptions are available (Draxler, 2010;
Kubinger, 2011), while most of the statistical tests for the Rasch model
do not permit sample size determination. Lastly, statistical tests for the
Rasch model test perfect fit while an actual data set never fits a
mathematical model perfectly.
Due to the above-mentioned limitations of statistical testing,
descriptive fit statistics are used to provide a measure for the conformity
of data to the Rasch model, which can be either global or local. Local fit
statistics, such as the residual-based infit and outfit values (Wright,
1979), provide a measure for the conformity of portions of the data on
both items and persons to the Rasch model specifications. Global
descriptive fit statistics, i.e., measures for the overall conformity of data
to the Rasch model, appear to be rarely used in practice.
Consequently, the goal of the present study is to develop global
descriptive fit statistics for checking whether the Rasch model holds.
Such measures are commonly used in structural equation modeling
literature (see West, 2012) but are not used in IRT circles. A number of
statistics are proposed and evaluated under different conditions of
varying test length and sample size using a simulation study. The
proposed statistics are based on the rationale of two statistical tests for
the Rasch model, which are reviewed below.

Baghaei, Yanagida, & Heene RASCH MODEL FIT 157
Andersen’s likelihood ratio test
The rationale behind Andersen’s LR test (Andersen, 1973) is the
invariance property of the Rasch model: if the Rasch model holds,
equivalent item parameter estimates should be obtained from different
subsamples of the data within sampling error. For example, item
calibrations based on low scorers and high scorers should yield
approximately the same parameter estimates. In addition, Andersen
(1973) showed that if items have substantially different discriminations
they would have different difficulty estimates. Therefore, the approach is
sensitive to the violation of parallel item characteristic curves (ICC). The
power of the LR test against the property of parallel ICC’s was
confirmed by Van den Wollenberg (1979). Likewise, Gustafsson (1980)
demonstrated that the LR test has power against 2PL and 3PL models.
Nevertheless, Suarez-Falcon and Glas (Suarez-Falcon, 2003) showed that
the test has low power with respect to multidimensionality of the data.
Accordingly, to conduct Andersen’s LR test (Andersen, 1973), the
sample is divided into g score-level subsamples and the conditional
likelihood function for each subsample and the entire sample is
computed. If the Rasch model holds, the likelihood of the complete data
should be approximated by the product of the likelihoods of the
subsamples (Suarez-Falcon, 2003). Andersen (1973) showed that -2
times logarithm of the difference between the maximum likelihood (ML)
of the whole sample and sum of likelihoods of the subsamples is
asymptotically chi-square distributed with (g-1) (k-1) degrees of freedom,
where g and k are the number of score groups and the number of items,
respectively.
Fischer-Scheiblechner’s S test
In Fischer-Scheiblechner’s (Fischer & Scheiblechner, 1970)
approach, the sample is divided into two subsamples and the item
parameters are estimated in each of the subsamples. The difference
between the item parameters across the subsamples is tested with the
usual z-test of difference:
where and are the difficulty estimates of item i in subsamples 1
and 2, and and are variances of the estimates of and . Si

158 NORTH AMERICAN JOURNAL OF PSYCHOLOGY
is an approximate standard normal deviate and is approximately chi-
squared distributed. Overall, S statistic is calculated by summing up chi-
squared terms, i.e., values for all item parameter pairs. According to
Fischer and Scheiblechner (1970), S is chi-squared distributed with k-1
degrees of freedom, k being the number of items. However, van den
Wollenberg (1979) states that the summation of values is possible
only if chi-squared terms are independent. This condition is violated as
the covariance between item parameters must be negative due to the
norming condition of item parameters in each subsample. Since the
covariance matrix does not enter the equation of S, it cannot be chi-
squared distributed with k or k-1 degrees of freedom.
Present study
The goal of the present study is to develop global fit statistics for
checking the dichotomous Rasch model. In general, for descriptive fit
statistics to be useful they should meet several conditions. First, in the
absence of differential item functioning (DIF),- i.e., where items have
different parameter estimates based on different subsamples of the same
location on the latent trait- the fit statistic should be near a constant
value. Second, in the presence of DIF, the fit statistic should quantify the
extent of DIF. In particular, it should become larger depending on the
number of DIF items and the magnitude of DIF. Lastly, when
quantifying DIF, the fit statistic should not be affected by sample size.
More specifically, in the absence of DIF, the fit measure should be near a
constant value independent of the sample size while, in the presence of
DIF, the value should only quantify DIF without being affected by
sample size. In order to develop fit measures for testing the Rasch model,
the study investigated properties of various measures to evaluate if those
requirements are fulfilled.
METHOD
Proposed fit measures for testing the Rasch model
We propose some descriptive fit measures based on the principle of
stability of item parameter across subsamples, which will then be
examined with a simulation study.
Root-mean-square deviation (RMSD). RMSD is the square root of
the mean square difference between item parameters estimated in two
subgroups after bringing them onto a common scale:
Baghaei, Yanagida, & Heene RASCH MODEL FIT 159
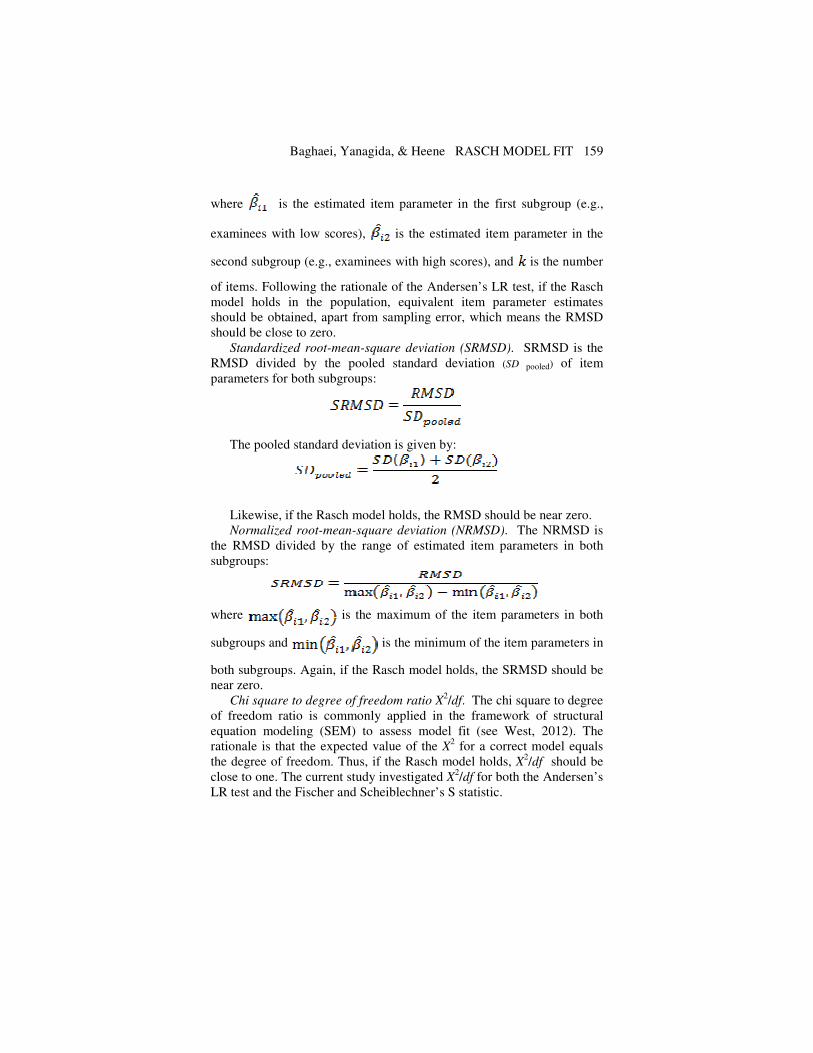
where is the estimated item parameter in the first subgroup (e.g.,
examinees with low scores), is the estimated item parameter in the
second subgroup (e.g., examinees with high scores), and is the number
of items. Following the rationale of the Andersen’s LR test, if the Rasch
model holds in the population, equivalent item parameter estimates
should be obtained, apart from sampling error, which means the RMSD
should be close to zero.
Standardized root-mean-square deviation (SRMSD). SRMSD is the
RMSD divided by the pooled standard deviation (SD pooled) of item
parameters for both subgroups:
The pooled standard deviation is given by:
Likewise, if the Rasch model holds, the RMSD should be near zero.
Normalized root-mean-square deviation (NRMSD). The NRMSD is
the RMSD divided by the range of estimated item parameters in both
subgroups:
where is the maximum of the item parameters in both
subgroups and is the minimum of the item parameters in
both subgroups. Again, if the Rasch model holds, the SRMSD should be
near zero.
Chi square to degree of freedom ratio X2/df. The chi square to degree
of freedom ratio is commonly applied in the framework of structural
equation modeling (SEM) to assess model fit (see West, 2012). The
rationale is that the expected value of the X2 for a correct model equals
the degree of freedom. Thus, if the Rasch model holds, X2/df should be
close to one. The current study investigated X2/df for both the Andersen’s
LR test and the Fischer and Scheiblechner’s S statistic.
160 NORTH AMERICAN JOURNAL OF PSYCHOLOGY
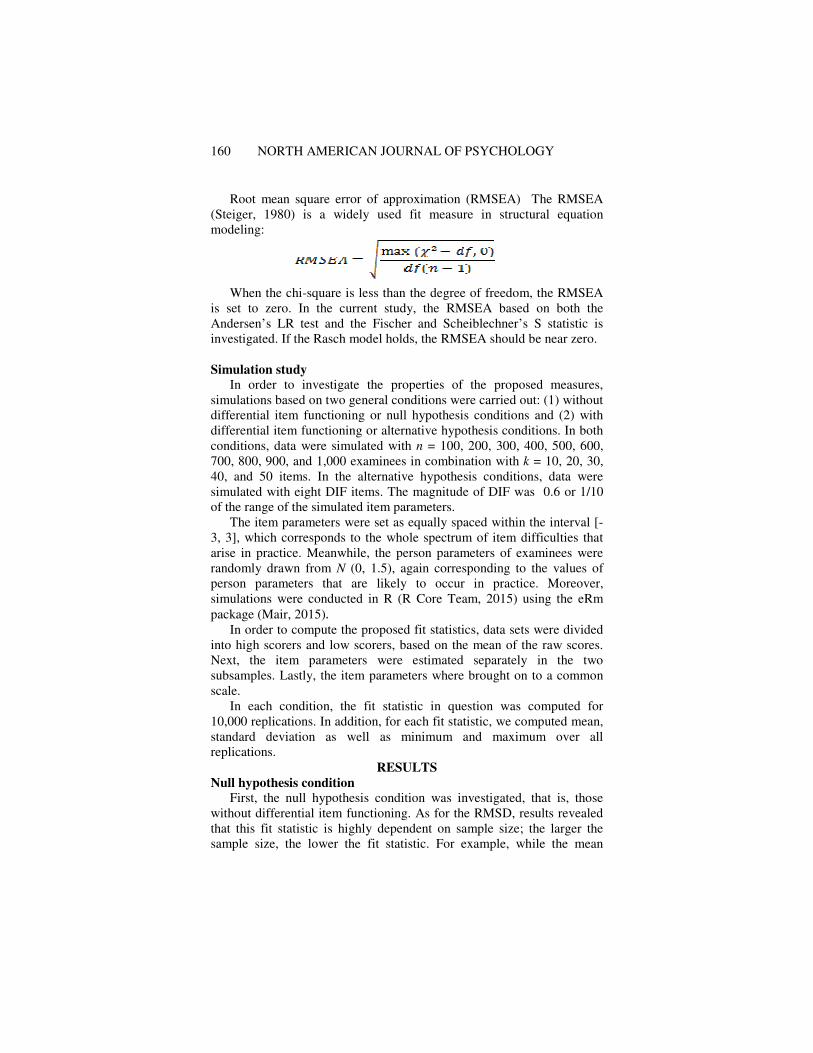
Root mean square error of approximation (RMSEA) The RMSEA
(Steiger, 1980) is a widely used fit measure in structural equation
modeling:
When the chi-square is less than the degree of freedom, the RMSEA
is set to zero. In the current study, the RMSEA based on both the
Andersen’s LR test and the Fischer and Scheiblechner’s S statistic is
investigated. If the Rasch model holds, the RMSEA should be near zero.
Simulation study
In order to investigate the properties of the proposed measures,
simulations based on two general conditions were carried out: (1) without
differential item functioning or null hypothesis conditions and (2) with
differential item functioning or alternative hypothesis conditions. In both
conditions, data were simulated with n = 100, 200, 300, 400, 500, 600,
700, 800, 900, and 1,000 examinees in combination with k = 10, 20, 30,
40, and 50 items. In the alternative hypothesis conditions, data were
simulated with eight DIF items. The magnitude of DIF was 0.6 or 1/10
of the range of the simulated item parameters.
The item parameters were set as equally spaced within the interval [-
3, 3], which corresponds to the whole spectrum of item difficulties that
arise in practice. Meanwhile, the person parameters of examinees were
randomly drawn from N (0, 1.5), again corresponding to the values of
person parameters that are likely to occur in practice. Moreover,
simulations were conducted in R (R Core Team, 2015) using the eRm
package (Mair, 2015).
In order to compute the proposed fit statistics, data sets were divided
into high scorers and low scorers, based on the mean of the raw scores.
Next, the item parameters were estimated separately in the two
subsamples. Lastly, the item parameters where brought on to a common
scale.
In each condition, the fit statistic in question was computed for
10,000 replications. In addition, for each fit statistic, we computed mean,
standard deviation as well as minimum and maximum over all
replications.
RESULTS
Null hypothesis condition
First, the null hypothesis condition was investigated, that is, those
without differential item functioning. As for the RMSD, results revealed
that this fit statistic is highly dependent on sample size; the larger the
sample size, the lower the fit statistic. For example, while the mean

Baghaei, Yanagida, & Heene RASCH MODEL FIT 161
RMSD is 0.61 with N = 100 examinees and k = 10 items, the mean
RMSD drops to 0.18 with N = 1,000. Since the SRMSD and the NRMSD
are based on the RMSD, these measures to a certain extent are also
dependent on the sample size. For instance, while the mean SRMSD is
1.47 with N = 100 examinees and k = 10 items, it drops to 0.41 with N =
1,000 examinees. Likewise, when the mean NRMSD is 0.09 with N =
100 examinees with k = 10 items, it drops to 0.03 with N = 1,000
examinees1.
As expected, the mean of χ2/df is around 1.00 for both the ratio based
on the test statistic of Andersen’s LR test and the S statistic. Moreover,
this fit statistic does not depend on the sample size or test length. For
example, the Andersen χ2/df with N = 100 and k = 10 items is 1.01, and
with N = 1,000, and k=10 is 0.99. But χ2/df based on the S statistic very
slightly changes with test length.
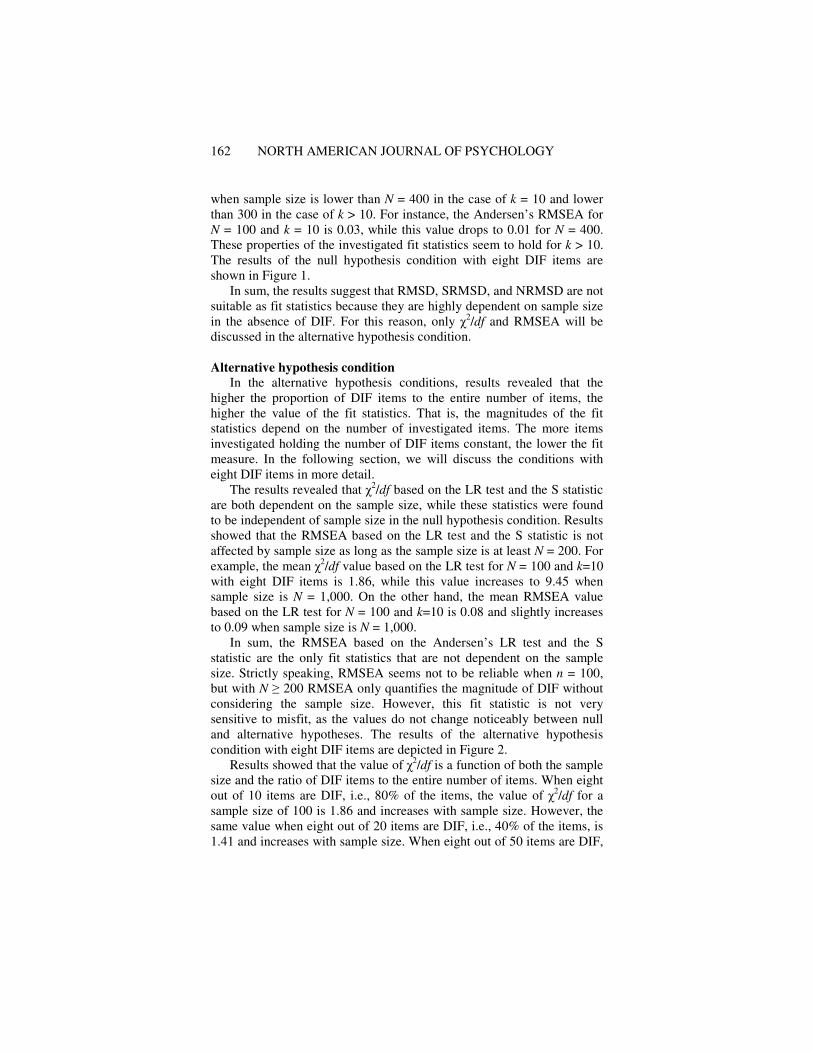
Regarding the RMSEA, the mean value of this fit statistic based on
the Andersen’s LR test and the S statistic is around zero as expected.
However, RMSEA seems to be somewhat dependent on sample size,
FIGURE 1 Mean LR test χ2/df statistic for N = 100, 200, 300, 400, 500,
600, 700, 800, 900, and 1,000 for k = 10, 20, 30, 40, and 50 items under
the null hypothesis condition (left panel) and alternative hypothesis
condition (right panel) with 8 DIF items
1 A table which depicts the mean of all proposed statistics in the null
hypothesis condition (when there is no DIF) for different sample sizes
and test lengths can be obtained from the authors.
162 NORTH AMERICAN JOURNAL OF PSYCHOLOGY
when sample size is lower than N = 400 in the case of k = 10 and lower
than 300 in the case of k > 10. For instance, the Andersen’s RMSEA for
N = 100 and k = 10 is 0.03, while this value drops to 0.01 for N = 400.
These properties of the investigated fit statistics seem to hold for k > 10.
The results of the null hypothesis condition with eight DIF items are
shown in Figure 1.
In sum, the results suggest that RMSD, SRMSD, and NRMSD are not
suitable as fit statistics because they are highly dependent on sample size
in the absence of DIF. For this reason, only χ2/df and RMSEA will be
discussed in the alternative hypothesis condition.
Alternative hypothesis condition
In the alternative hypothesis conditions, results revealed that the
higher the proportion of DIF items to the entire number of items, the
higher the value of the fit statistics. That is, the magnitudes of the fit
statistics depend on the number of investigated items. The more items
investigated holding the number of DIF items constant, the lower the fit
measure. In the following section, we will discuss the conditions with
eight DIF items in more detail.
The results revealed that χ2/df based on the LR test and the S statistic
are both dependent on the sample size, while these statistics were found
to be independent of sample size in the null hypothesis condition. Results
showed that the RMSEA based on the LR test and the S statistic is not
affected by sample size as long as the sample size is at least N = 200. For
example, the mean χ2/df value based on the LR test for N = 100 and k=10
with eight DIF items is 1.86, while this value increases to 9.45 when
sample size is N = 1,000. On the other hand, the mean RMSEA value
based on the LR test for N = 100 and k=10 is 0.08 and slightly increases
to 0.09 when sample size is N = 1,000.
In sum, the RMSEA based on the Andersen’s LR test and the S
statistic are the only fit statistics that are not dependent on the sample
size. Strictly speaking, RMSEA seems not to be reliable when n = 100,
but with N ≥ 200 RMSEA only quantifies the magnitude of DIF without
considering the sample size. However, this fit statistic is not very
sensitive to misfit, as the values do not change noticeably between null
and alternative hypotheses. The results of the alternative hypothesis
condition with eight DIF items are depicted in Figure 2.
Results showed that the value of χ2/df is a function of both the sample
size and the ratio of DIF items to the entire number of items. When eight
out of 10 items are DIF, i.e., 80% of the items, the value of χ2/df for a
sample size of 100 is 1.86 and increases with sample size. However, the
same value when eight out of 20 items are DIF, i.e., 40% of the items, is
1.41 and increases with sample size. When eight out of 50 items are DIF,

Baghaei, Yanagida, & Heene RASCH MODEL FIT 163
i.e., 16% of the items, the value is 1.15 for a sample size of 100.
Therefore, the interpretation of χ2/df depends on the amount of DIF we
are ready to accept in the data. If we consider 100 as the smallest
acceptable sample size for conducting Rasch model analysis and 0% as
the smallest tolerable magnitude of DIF in the data we need χ2/df values
FIGURE 2. Mean LR test RMSEA Statistic for N = 100, 200, 300, 400,
500, 600, 700, 800, 900, and 1,000 for k = 10, 20, 30, 40, and 50 Items
under the Null Hypothesis Condition (left panel) & Alternative
Hypothesis Condition (right panel) with 8 DIF Items.
a lot smaller than 1.15. Therefore, a maximum value of 1.03 (the largest
value for χ2/df in the null hypothesis condition where there was no DIF)
for this value should indicate perfect fit to the Racsh model. However,
note that this value has different standard errors for different test lengths
in the null hypothesis condition which allows for more generous cut-off
values2.
DISCUSSION
In this study, an attempt was made to develop descriptive measures of
fit for the dichotomous Rasch model. Accordingly, a number of fit
statistics based on the property of parameter invariance of the Rasch
model were evaluated in a simulation study. Furthermore, the simulation
2 A table which depicts the mean of χ
2/df and RMSEA for the Andersen’
LR test and the S statistic in the alternative hypothesis condition (with
eight DIF items) for different sample sizes and test lengths can be
obtained from the authors.
164 NORTH AMERICAN JOURNAL OF PSYCHOLOGY
studies were carried out under the specific conditions of test length and
sample size.
Most of the available global model fit measures are based on
statistical hypothesis testing. Such fit assessment procedures are sensitive
to large sample sizes since statistical power increases. Furthermore, such
methods evaluate perfect fit of the data to the Rasch model. In this study
a descriptive method, namely, Andersen’s χ2/df, is suggested to evaluate
the overall fit of data to the Rasch model. The proposed method in this
study is not based on statistical null hypothesis testing and is independent
of sample size. Based on simulation studies, cut-off values for the
statistic for different test lengths are suggested. The statistic is a
complement to the available fit statistics based on null hypothesis testing
and not a replacement.
Results showed that while all the fit statistics are more or less
independent of test length in the null hypothesis condition, three of
them—RMSD, SRMSD, and NRMSD—are dependent on sample size.
The means of these statistics vary substantially across sample sizes, and
therefore do not meet the requirements we specified above for efficient
fit values. Meanwhile, the other four measures—Andersen χ2/df, S
statistic χ2/df, Andersen RMSEA, and S statistic RMSEA—are
independent of sample size in the null hypothesis condition. In this
condition, the mean values for Andersen χ2/df and S statistic χ
2/df are
near one, and for Andersen RMSEA and S statistic RMSEA, they are
near zero across all sample sizes. As a result, the S statistic χ2/df seems to
be dependent on the test length to some degree, as the value for a test
length of 10 is around 1.10 but the value approaches one as test length
increases. However, the problem with Andersen RMSEA and S statistic
RMSEA values is that these measures, although being robust against
sample size and test length, are insensitive to model violations. In the H1
condition, where the Rasch model does not hold, these values are around
.10 (k=10) and .06 and .04 when k= 30 and k=40, respectively. This
indicates that there is not much difference in these values in the H0 and
H1 conditions, which limits their utility as indicators of model violation.
Hence, the practical measure seems to be Andersen’s χ2/df as it is
near one in the H0 condition across all sample sizes and test lengths and
noticeably deviates from one in the H1 condition. The standard deviation
of this measure, however, varies across different test lengths, which
restricts building a single confidence interval for use in applied settings.
Therefore, we need to devise different cut-off values depending on the
test length. Using the mean standard errors across all sample sizes the
one-sided 68% confidence intervals in Table 1 can be built as cut-off
values for Andersen χ2/df for different test lengths.
Baghaei, Yanagida, & Heene RASCH MODEL FIT 165
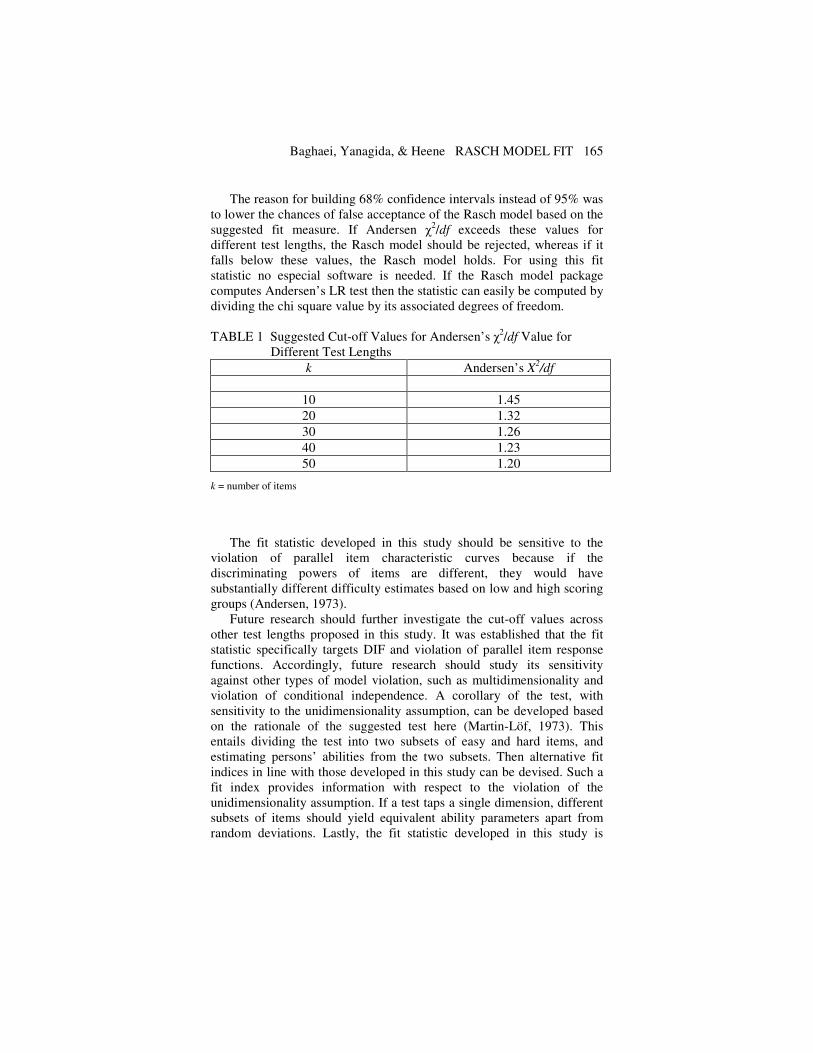
The reason for building 68% confidence intervals instead of 95% was
to lower the chances of false acceptance of the Rasch model based on the
suggested fit measure. If Andersen χ2/df exceeds these values for
different test lengths, the Rasch model should be rejected, whereas if it
falls below these values, the Rasch model holds. For using this fit
statistic no especial software is needed. If the Rasch model package
computes Andersen’s LR test then the statistic can easily be computed by
dividing the chi square value by its associated degrees of freedom.
TABLE 1 Suggested Cut-off Values for Andersen’s χ2/df Value for
Different Test Lengths
k Andersen’s X2/df
10 1.45
20 1.32
30 1.26
40 1.23
50 1.20
k = number of items
The fit statistic developed in this study should be sensitive to the
violation of parallel item characteristic curves because if the
discriminating powers of items are different, they would have
substantially different difficulty estimates based on low and high scoring
groups (Andersen, 1973).
Future research should further investigate the cut-off values across
other test lengths proposed in this study. It was established that the fit
statistic specifically targets DIF and violation of parallel item response
functions. Accordingly, future research should study its sensitivity
against other types of model violation, such as multidimensionality and
violation of conditional independence. A corollary of the test, with
sensitivity to the unidimensionality assumption, can be developed based
on the rationale of the suggested test here (Martin-Löf, 1973). This
entails dividing the test into two subsets of easy and hard items, and
estimating persons’ abilities from the two subsets. Then alternative fit
indices in line with those developed in this study can be devised. Such a
fit index provides information with respect to the violation of the
unidimensionality assumption. If a test taps a single dimension, different
subsets of items should yield equivalent ability parameters apart from
random deviations. Lastly, the fit statistic developed in this study is
166 NORTH AMERICAN JOURNAL OF PSYCHOLOGY
limited to dichotomous items and future research should focus on
developing a similar measure for polytomous items.
REFERENCES Andersen, E. B. (1973). A goodness of fit test for the Rasch model.
Psychometrika, 38, 123-140.
Baghaei, P. (2009). Understanding the Rasch model. Mashhad: Mashhad Islamic
Azad University Press.
Draxler, C. (2010). Sample size determination for Rasch model Tests.
Psychometrika, 75, 708-724.
Embretson, S. E., & Reise, S. P. (2000). Item response theory for psychologists.
Mahwah, NJ: Lawrence Erlbaum.
Fischer, G. H., & Scheiblechner, H. (1970). Algorithmen und Programme fuer
das probabilistische Testmodell von Rasch [Algorithms and programs for
Rasch's probabilistic test model]. Psychologische Beitraege, 12, 23-51.
Fisher, G. H. (2006). Rasch models. In C. Rao & S. Sinharay (Eds.). Handbook of
statistics, Volume 26: Psychometrics (pp. 979-1027). Amsterdam, The
Netherlands: Elsevier.
Gustafsson, J. E. (1980). Testing and obtaining fit of data to the Rasch model.
British Journal of Mathematical and Statistical Psychology, 33, 205-233.
Glas, C.A.W. (1988). The derivation of some tests for the Rasch model from the
multinomial distribution. Psychometrika, 53, 525–546.
Hambleton, R. K., Swaminathan, H., & Rogers, H. J. (1991). Fundamentals of
item response theory. Newbury Park, CA: Sage.
Karabatsos, G. (2000). A critique of Rasch residual fit statistics. Journal of
Applied Measurement, 1, 152-176.
Kubinger, K. D. (2005). Psychological test calibration using the Rasch model:
some critical suggestions on traditional approaches. International Journal of
Testing, 5, 377-394.
Kubinger, K. D., Rasch, D., & Yanagida, T. (2009). On designing data-sampling
for Rasch model calibrating an achievement test. Psychology Science
Quarterly, 51, 370-384.
Kubinger, K. D., Rasch, D., & Yanagida, T. (2011). A new approach for testing
the Rasch model. Educational Research and Evaluation, 17, 321-333.
Linacre J.M. (1998). Detecting multidimensionality: which residual data-type
works best? Journal of Outcome Measurement, 2, 266-283.
Linacre, J. M. (2009). A user’s guide to WINSTEPS. Chicago, IL: Winsteps.
Mair, P., & Hatzinger, R. (2015). eRm: Extended Rasch modeling. R package
version 0.15-5. http://erm.r-forge.r-project.org/
Martin-Löf, P. (1973). Statistiska modeller [Statistical models.] Anteckningar
från seminarier lasåret 1969-1970, utarbetade av Rolf Sundberg. Obetydligt
ändrat nytryck, Oktober 1973. Stockholm: Institütet för
Försäkringsmatemetik och Matematisk Statistisk vid Stockholms Universitet.
Maydeu-Olivares, A. (2013). Goodness-of-fit assessment of item response theory
models. Measurement, 11, 71–101.
Molenaar, I. W., and Hoijtink, H. (1990). The many null distributions of person
fit indices. Psychometrika, 55, 75-106.

Baghaei, Yanagida, & Heene RASCH MODEL FIT 167
Rasch, G. (1960/1980). Probabilistic models for some intelligence and
attainment tests. Copenhagen: Danish Institute for Educational Research,
1960. (Expanded edition, Chicago: The university of Chicago Press, 1980).
R Core Team (2015). R: A language and environment for statistical computing. R
Foundation for Statistical Computing, Vienna, Austria. URL http://www.R-
project.org/.
Rost, J., & von Davier, M. (1994). A conditional item-fit index for Rasch models.
Applied Psychological Measurement, 18, 171-182.
Rupp, A. A., & Zumbo, B. D. (2006). Understanding parameter invariance in
unidimensional IRT models. Educational and Psychological Measurement,
66, 63-84.
Steiger, J. H., & Lind, J. (1980). Statistically-based tests for the number of
common factors. Paper presented at the Annual Spring Meeting of the
Psychometric Society, Iowa City.
Suarez-Falcon, J. C., & Glas, C. A. W. (2003). Evaluation of global testing
procedures for item fit to the Rasch model. British Journal of Mathematical
and Statistical Psychology, 56, 127-143.
Van den Wollenberg, A. L. (1982). Two new test statistics for the Rasch model.
Psychometrika, 47, 123-139.
Van den Wollenberg, A. L. (1988). Testing a latent trait model. In R. Langeheine
& J. Rost, Latent trait and latent class models (pp. 31-50). New York:
Springer.
Van den Wollenberg, A. L. (1979). The Rasch model and time limit tests.
Unpublished Doctoral thesis. Nijmegen: University of Nijmegen.
Verguts, T., & De Boeck, P. (2000). A note on the Martin-Löf test for
unidimensionality. Methods of Psychological Research Online, 5, 77-82.
Verhelst, N. D. (2001). Testing the unidimensionality assumption of the Rasch
model. Methods of Psychological Research Online, 6, 231-271.
West, S. G., Taylor, A. B., & Wu, W. (2012). Model fit and model selection in
structural equation modeling, In R. H. Hoyle (Ed.), Handbook of structural
equation modeling. New York: Guilford Press.
Wolfe, E. W. (2013). A bootstrap approach to evaluating person and item fit to
the Rasch model. Journal of Applied Measurement, 14, 1–9.
Wright, B. D., & Stone, M. H. (1979). Best test design. Chicago: MESA Press.
Wright, B. D., & Panchapakesan, N. (1969). A procedure for sample-free item
analysis. Educational and Psychological Measurement, 29, 23-48.

168 NORTH AMERICAN JOURNAL OF PSYCHOLOGY
View publication statsView publication stats