21.12.14 descriptive statistic
TRANSCRIPT
Research Methods in Education
SPP 3042
ADIBAH BINTI ABDUL LATIF
Faculty of Education

DESCRIPTIVE STATISTIC
What is Statistic and Descriptive Statistic?
DESCRIPTIVE STATISTIC :- Describe the basic features of the data in a study Simple summaries What’s going on in our data Permit the researcher to describe many pieces of
data with a few indices


DISTRIBUTION
summary of the frequency of individual values or ranges of values for a variable.
Distribution of respondent is by year in working experience, list the number or percent
Describe gender by number or percent Describe income / CGPA ?

GRADE FREQUEENCY
A 123
B 456
C 78
D -
E -
F -
Table 1 : Frequency of Students Grade

INCOME VALUES PERCENTAGE
Below RM 1000 25
RM1001 to RM 3000 25
RM3001 to RM5000 30
Above RM5000 20
Table 2 : Percentage of Respondents’ Income

MEAN Sum of the scores divided by the
number of scores. The mean is represented by the symbol

Formula for Mean
= ΣX N
= Mean Σ = The sum of X = Individual scores N =The number of scores

Example:
Let say there were four students taking a test. The scores were 90, 70, 67 and 50.
The mean of the sample is,
= ΣX N
= 90 + 70 + 67 + 50 4 =69.25

Properties of the Mean The mean is sensitive to the exact
value of all the scores in the distribution
The mean is very sensitive to extreme scores.)

Median
the score found at the exact middle of the set of values.
List all scores in numerical order, and then locate the score in the center of the sample.
For example, if there are 1000 scores in the list, score #500 would be the median.

Mode
Most frequently occurring value in the set of scores. Order the scores, and then count each one. The
most frequently occurring value is the mode.
15,20,21,20,36,15,25,15
In our example, the value 15 occurs three times and is the mode.

DISPERSION
spread of the values from the central tendency. a) Range - the highest value minus the lowest value
15,20,21,20,36,15,25,15
Range is 36 - 15 = 21.

STANDARD DEVIATION
more accurate and detailed estimate of dispersion because an outlier can greatly exaggerate the range.
The deviation score tells how far away the raw score is from the mean of its distribution.

ScoresScores DeviationDeviation (Deviation)(Deviation)22
(x(xii))
22
55
44
11
6633
77
55
44
77
(X(Xii - X) - X)
(2 - 4.4) = -2.4(2 - 4.4) = -2.4
(5 – 4.4) = 0.6(5 – 4.4) = 0.6
(4 – 4.4) = -0.4(4 – 4.4) = -0.4
(1 – 4.4) = -3.4(1 – 4.4) = -3.4
(6 – 4.4) = 1.6(6 – 4.4) = 1.6(3 – 4.4) = -1.4(3 – 4.4) = -1.4
(7 – 4.4) = 2.6(7 – 4.4) = 2.6
(5 – 4.4) = 0.6(5 – 4.4) = 0.6
(4 – 4.4) = -0.4(4 – 4.4) = -0.4
(7 – 4.4) = 2.6(7 – 4.4) = 2.6
(X(Xii - X) - X) ²²
5.765.76
0.360.36
0.160.16
11.5611.56
2.562.561.961.96
6.766.76
0.360.36
0.160.16
6.766.76
Mean= 4.4Mean= 4.4 Total = 0Total = 0 ∑ ∑ = 36.4= 36.4
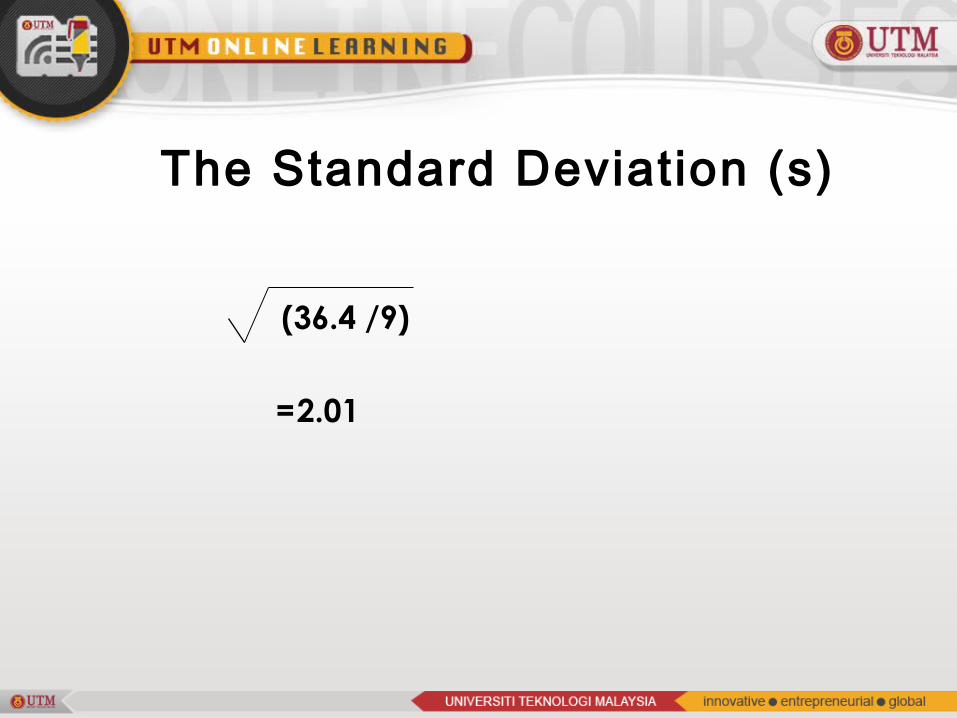
(36.4 /9)
=2.01
The Standard Deviation (s)
