development of a direct-injected natural gas engine … · · 2013-02-11development of a...
TRANSCRIPT
February 2000 � NREL/SR-540-27501
G.B. Cox, K.A. DelVecchio, W.J. Hays,J.D. Hiltner, R. Nagaraj, and C. EmmerCaterpillar, Inc.Peoria, Illinois
Development of a Direct-Injected Natural Gas EngineSystem for Heavy-Duty Vehicles
Final Report Phase II
National Renewable Energy Laboratory1617 Cole BoulevardGolden, Colorado 80401-3393NREL is a U.S. Department of Energy LaboratoryOperated by Midwest Research Institute •••• Battelle •••• Bechtel
Contract No. DE-AC36-99-GO10337
February 2000 � NREL/SR-540-27501
Development of a Direct-Injected Natural Gas EngineSystem for Heavy-Duty Vehicles
Final Report Phase II
G.B. Cox, K.A. DelVecchio, W.J. Hays,J.D. Hiltner, R. Nagaraj, and C. EmmerCaterpillar, Inc.Peoria, Illinois
NREL Technical Monitor: Keith VertinPrepared under Subcontract No. ZCI-6-15107-01
National Renewable Energy Laboratory1617 Cole BoulevardGolden, Colorado 80401-3393NREL is a U.S. Department of Energy LaboratoryOperated by Midwest Research Institute •••• Battelle •••• Bechtel
Contract No. DE-AC36-99-GO10337
This publication was reproduced from the best available copySubmitted by the subcontractor and received no editorial review at NREL
NOTICE
This report was prepared as an account of work sponsored by an agency of the United Statesgovernment. Neither the United States government nor any agency thereof, nor any of their employees,makes any warranty, express or implied, or assumes any legal liability or responsibility for the accuracy,completeness, or usefulness of any information, apparatus, product, or process disclosed, or representsthat its use would not infringe privately owned rights. Reference herein to any specific commercialproduct, process, or service by trade name, trademark, manufacturer, or otherwise does not necessarilyconstitute or imply its endorsement, recommendation, or favoring by the United States government or anyagency thereof. The views and opinions of authors expressed herein do not necessarily state or reflectthose of the United States government or any agency thereof.
Available electronically at http://www.doe.gov/bridge
Available for a processing fee to U.S. Department of Energyand its contractors, in paper, from:
U.S. Department of EnergyOffice of Scientific and Technical InformationP.O. Box 62Oak Ridge, TN 37831-0062phone: 865.576.8401fax: 865.576.5728email: [email protected]
Available for sale to the public, in paper, from:U.S. Department of CommerceNational Technical Information Service5285 Port Royal RoadSpringfield, VA 22161phone: 800.553.6847fax: 703.605.6900email: [email protected] ordering: http://www.ntis.gov/ordering.htm
Printed on paper containing at least 50% wastepaper, including 20% postconsumer waste

Acknowledgement
This research was sponsored by Stephen Goguen, Program Manager in the Department ofEnergy’s Office of Heavy Vehicle Technologies. The technical monitor for this project wasKeith Vertin, Senior Engineer at the National Renewable Energy Laboratory.
Table of Contents
Page 50Saturation as a Function of Vessel . . . . . . . . . . . . . . . . . . . . . . . . . . . . . . . .Page 50Net Positive Suction Head Requirements . . . . . . . . . . . . . . . . . . . . . . . . . .Page 49Effects of the Cryogenic Vessel on Pump Performance . . . . . . . . . . . . . . . . . .Page 49The Role of the Sump . . . . . . . . . . . . . . . . . . . . . . . . . . . . . . . . . . . . . . . . . .Page 47Warm End . . . . . . . . . . . . . . . . . . . . . . . . . . . . . . . . . . . . . . . . . . . . . . . . . . .Page 47Cold End . . . . . . . . . . . . . . . . . . . . . . . . . . . . . . . . . . . . . . . . . . . . . . . . . . . .Page 47Positive Displacement . . . . . . . . . . . . . . . . . . . . . . . . . . . . . . . . . . . . . . . . . .Page 44Pump Design Philosophy . . . . . . . . . . . . . . . . . . . . . . . . . . . . . . . . . . . . . . . . . .Page 42Current US Manufacturers . . . . . . . . . . . . . . . . . . . . . . . . . . . . . . . . . . . . . .Page 42The Predecessors . . . . . . . . . . . . . . . . . . . . . . . . . . . . . . . . . . . . . . . . . . . . .Page 41US Manufacturers . . . . . . . . . . . . . . . . . . . . . . . . . . . . . . . . . . . . . . . . . . . . . . . .Page 41Positive Displacement . . . . . . . . . . . . . . . . . . . . . . . . . . . . . . . . . . . . . . . . . .Page 41Principles . . . . . . . . . . . . . . . . . . . . . . . . . . . . . . . . . . . . . . . . . . . . . . . . . . . . . . .Page 40Accomplishment Details . . . . . . . . . . . . . . . . . . . . . . . . . . . . . . . . . . . . . . . . . . . . . .Page 40Accomplishment Summary: . . . . . . . . . . . . . . . . . . . . . . . . . . . . . . . . . . . . . . . . . . .Page 40Objective: . . . . . . . . . . . . . . . . . . . . . . . . . . . . . . . . . . . . . . . . . . . . . . . . . . . . . . . . . .Page 40Sub task 3.1: Demonstrate 3000 psi LNG Pump State-of-the Art . . . . . . . . .
Page 40Task 3: Durability Development of 3000 psi Fuel Handling System . . . . . . . . . . . . .
Page 39Summary . . . . . . . . . . . . . . . . . . . . . . . . . . . . . . . . . . . . . . . . . . . . . . . . . . . . . . . . . .Page 33
Bench Tests of Selective Catalyst Reduction to Achieve NOx < 1g/hp-hr. . . . . . . . . . . . . . . . . . . . . . . . . . . . . . . . . . . . . . . . . . . . . . . . . . . . . . . . .
Page 163501 DING Engine Tests to Improve Thermal Efficiency - NOxTradeoff . . . . . . . . . . . . . . . . . . . . . . . . . . . . . . . . . . . . . . . . . . . . . . . . . . . . . . . .
Page 16Accomplishment Details: . . . . . . . . . . . . . . . . . . . . . . . . . . . . . . . . . . . . . . . . . . . . . .Page 16Accomplishment Summary: . . . . . . . . . . . . . . . . . . . . . . . . . . . . . . . . . . . . . . . . . . .Page 16Objective: . . . . . . . . . . . . . . . . . . . . . . . . . . . . . . . . . . . . . . . . . . . . . . . . . . . . . . . . . .Page 16Sub task 2.3: Evaluate Feasibility of Meeting 1.0 gram/hp-hr NOx Goal . . . . .
Page 16Task 2: DI Natural Gas Engine NOx Development . . . . . . . . . . . . . . . . . . . . . . . . . . . .Page 93126 DING Engine Design, Procurement and Test . . . . . . . . . . . . . . . . . . . . . .Page 4Computational Fluid Dynamics Modeling of In-Cylinder Events. . . . . . . . . . . .Page 4Accomplishment Details: . . . . . . . . . . . . . . . . . . . . . . . . . . . . . . . . . . . . . . . . . . . . . . .Page 4Accomplishment Summary: . . . . . . . . . . . . . . . . . . . . . . . . . . . . . . . . . . . . . . . . . . . .Page 4Objective: . . . . . . . . . . . . . . . . . . . . . . . . . . . . . . . . . . . . . . . . . . . . . . . . . . . . . . . . . .Page 4
Sub task 1.3: Component Development, 3126 DING Assembly andDurability Testing . . . . . . . . . . . . . . . . . . . . . . . . . . . . . . . . . . . . . . . . . . . . . . . . . . . . . .
Page 4Task 1: DI Natural Gas Engine Development . . . . . . . . . . . . . . . . . . . . . . . . . . . . . . . . . .
Page 3SUMMARY OF PHASE 2: FINAL ENGINE DEVELOPMENT . . . . . . . . . . . . . . . .
Page 3EXECUTIVE SUMMARY . . . . . . . . . . . . . . . . . . . . . . . . . . . . . . . . . . . . . . . . . . . . . . . . .
Page 1BACKGROUND . . . . . . . . . . . . . . . . . . . . . . . . . . . . . . . . . . . . . . . . . . . . . . . . . . . . . . . . . .
Page 61Results and Discussion . . . . . . . . . . . . . . . . . . . . . . . . . . . . . . . . . . . . . . . . . . . .Page 57Analysis Method: . . . . . . . . . . . . . . . . . . . . . . . . . . . . . . . . . . . . . . . . . . . . . . . . .Page 56Introduction: . . . . . . . . . . . . . . . . . . . . . . . . . . . . . . . . . . . . . . . . . . . . . . . . . . . .Page 56Accomplishment Details: . . . . . . . . . . . . . . . . . . . . . . . . . . . . . . . . . . . . . . . . . . . . .Page 56Accomplishment Summary: . . . . . . . . . . . . . . . . . . . . . . . . . . . . . . . . . . . . . . . . . . .Page 56Objective: . . . . . . . . . . . . . . . . . . . . . . . . . . . . . . . . . . . . . . . . . . . . . . . . . . . . . . . . . . . .
Page 56Task 4: Commercial Applications Study . . . . . . . . . . . . . . . . . . . . . . . . . . . . . . . . . . . . .
Page 55Summary . . . . . . . . . . . . . . . . . . . . . . . . . . . . . . . . . . . . . . . . . . . . . . . . . . . . . . . . . .Page 54Conclusions . . . . . . . . . . . . . . . . . . . . . . . . . . . . . . . . . . . . . . . . . . . . . . . . . . . . . . . .Page 54Custom Vessels . . . . . . . . . . . . . . . . . . . . . . . . . . . . . . . . . . . . . . . . . . . . . . .Page 54Piston Rings . . . . . . . . . . . . . . . . . . . . . . . . . . . . . . . . . . . . . . . . . . . . . . . . . .Page 54Seals . . . . . . . . . . . . . . . . . . . . . . . . . . . . . . . . . . . . . . . . . . . . . . . . . . . . . . . .Page 52Areas to Investigate . . . . . . . . . . . . . . . . . . . . . . . . . . . . . . . . . . . . . . . . . . . . . .
FINAL REPORT - PHASE 2
SUBCONTRACT NO. ZCI-6-15107-1
DEVELOPMENT OF A DIRECT INJECTED NATURAL GAS ENGINE SYSTEM FORHEAVY-DUTY VEHICLES
BACKGROUND
The transportation sector accounts for approximately 65% of US petroleum consumption.Petroleum consumption for light-duty transportation has tended to stabilize in the last 10-15years, due largely to more efficient automotive systems. Petroleum consumption in theheavy-duty sector (approximately 150-550 hp) on the other hand, has continued to increase. Foreconomic and national security reasons, the US must reduce dependence on petroleum. Onesignificant way to reduce our dependence on petroleum is to substitute "alternative fuels", such asnatural gas, propane, alcohols and others in place of the petroleum fuels in heavy-dutyapplications. Most of the alternative fuels also have the additional benefit of reduced exhaustemissions relative to petroleum fuels, thus providing a cleaner environment.
Homogeneous-charge, spark ignited engines can burn most of these alternative fuels withrelatively minor modifications; however, generally, they do not match diesel power density andthey have lower thermal efficiency over the typical operating range. They also require additionalradiator capacity because of increased heat rejection. Modifications to incorporate pilot dieselignition in place of the spark plug, have potential to further improve efficiency, but such systemsonly approach diesel efficiency and they reduce the substitution of alternative fuel for diesel fuel(pilot diesel systems normally result in 50-80% substitution over a typical operating range). Thepower density of homogeneous-charge alternative fuel engines is sensitive to fuel quality (i.e.,they achieve their highest power density with pure methane and have lower power density withfuels such as propane). Regardless of the ignition system, homogeneous-charge engines areinherently limited to "less-than diesel" power density and efficiency by detonation. To becommercially viable, alternative fuel engines will have to match the diesel in power density andthermal efficiency, and will have to closely approach 100% fuel substitution.
The best long-term technology for heavy-duty alternative fuel engines is the 4-stroke cycle, directinjected (DI) engine using a single fuel. This DI, single fuel approach maximizes the substitutionof alternative fuel for diesel and retains the thermal efficiency and power density of the dieselengine.
This contract focuses on developing 4-stroke cycle, DI single fuel, alternative fuel technology thatwill duplicate or exceed diesel power density and thermal efficiency, while having exhaustemissions equal to or less than the diesel. Although current focus is on DI natural gas (DING)engine technology, the technology can relatively easily be applied to other alternative fuels such aspropane, DME, alcohols and hydrogen. DING engine technology was chosen for this initial
Page 1
development because it is the most challenging from a technical standpoint (natural gas has thepoorest ignition characteristics and gaseous fuels are the most challenging from a fuelhandling/injecting standpoint).
Prior to this NREL contract, Caterpillar had initiated DING engine technology development withGRI. In this prior work, DING engine power and efficiency equal or better than that of a dieselhad been demonstrated in a single cylinder version of a Caterpillar 3500 Series engine (4.3 litersper cylinder). A 3516 DING engine (16 cylinders) had been built. No emissions development ordurability development had been performed.
In Phase 1 of this NREL contract, the goal of operating a 3516 DING engine for 250 hours atvarious operating conditions to evaluate major component durability was achieved. The glowplug ignition assist and the gas injector system were identified as the primary componentsrequiring additional development. The 3516 was determined to be an inefficient test bed forDING technology development, and it was decided to design and procure a 3126 DING enginefor future DING development. A 3126 DING engine will also be a good candidate for fielddemonstration in the transportation sector. The goal of demonstrating DING engine NOxemissions = 2.5 gm/hp-hr was achieved on a single cylinder 3500-series DING engine (3501),although thermal efficiency was significantly reduced. Paths for minimizing the efficiency losswere identified and were planned for Phase 2. A survey of the state-of-the-art of 3000 psi fuelhandling systems was completed.
This report summarizes the results of Phase 2 of the NREL contract. Additional DINGtechnology development has been performed on a 3501 DING engine, and a 3126 DING enginehas been designed, procured and preliminary performance testing initiated. A DING enginecommercial application analysis has been performed, and a concept study identifying the majorissues and options in designing a 3000 psi LNG system for a DING engine has been completed.
Page 2
EXECUTIVE SUMMARY
1. A computational fluid dynamics (CFD) model of a 3500 DING engine gas injection/combustion system has been developed and has been utilized to identify DING ignition/combustion system improvements. Significant improvements in the thermal efficiency - NOxtradeoff have been demonstrated on a 3501 DING engine. For example, using EGR and splitinjection, the 8 mode, cycle-weighted average NOx levels of 2.5 g/hp-hr were achieved with37.8% thermal efficiency. This is approximately a 20% improvement in efficiency compared toPhase 1 testing. Catalyst bench testing has demonstrated the ability to reduce NOx emissions toless than 1 g/hp-hr.
2. Components for a 3126 DING engine (300 hp) have been designed and procured , and the3126 DING engine has been assembled. Preliminary performance testing has been initiated. Theengine ran successfully at low loads for approximately 2 hours before injector tip and checkfailures terminated the test. The injector failures are believed to be solvable problems; however, itwas decided to terminate this program phase at this point.
3. A Decision & Risk Analysis model has been developed comparing DING engine technology with various engine technologies in a number of commercial applications. The model shows themost likely commercial applications for DING technology and can be used to identify thesensitivity of variables that impact commercial viability. The model will be updated as needed andused as an ongoing tool in identifying DING engine commercial viability in various applications.
4. A preliminary concept design study by MVE Inc. has been completed that examines the majordesign issues involved in making a reliable and durable 3000 psi LNG pump. Primary concern isthe life of pump seals and piston rings.
5. Plans for the next phase of this program (Phase 3) have been put on indefinite hold. Caterpillarhas decided not to fund further Direct Injected Natural Gas work at this time due to limitedcurrent market potential for the DING engine. However, based on results from this program, it isbelieved that DI natural gas technology is viable for allowing a natural gas-fueled engine toachieve diesel power density and thermal efficiency for both the near and long terms
Page 3
SUMMARY OF PHASE 2: FINAL ENGINE DEVELOPMENT
Task 1: DI Natural Gas Engine Development
Sub task 1.3: Component Development, 3126 DING Assembly and Durability Testing
Objective: The subcontractor shall use the 3501 DING engine to identify and select glow plug ignition assistand injection system modifications that will provide acceptable performance/durability in a DINGapplication. Analytical models will be utilized to aid in selecting the best modifications. Thesubcontractor shall adapt the technology to a 3126 DING engine which will move the projectforward on a platform conducive to demonstration in an "over-the-road" transportation vehicle.The 3126 DING engine shall initiate performance/durability demonstration incorporating DINGcomponent modifications identified on the 3501 engine. The performance goal will be todemonstrate power and efficiency equal to a diesel engine.
Accomplishment Summary:
1. A computational fluid dynamics (CFD) model of the 3500 DING engine has been developedand is being utilized to identify thermal efficiency and NOx improvements on the 3501 DINGengine. Significant efficiency - NOx tradeoff improvements have been demonstrated and arereported in Task 2.
2. A 3126 DING engine has been designed, procured and preliminary performance testinginitiated. The engine ran successfully on all cylinders for approximately two hours before injectortip failures caused the tests to be terminated. No performance and durability data was acquired.
Accomplishment Details:
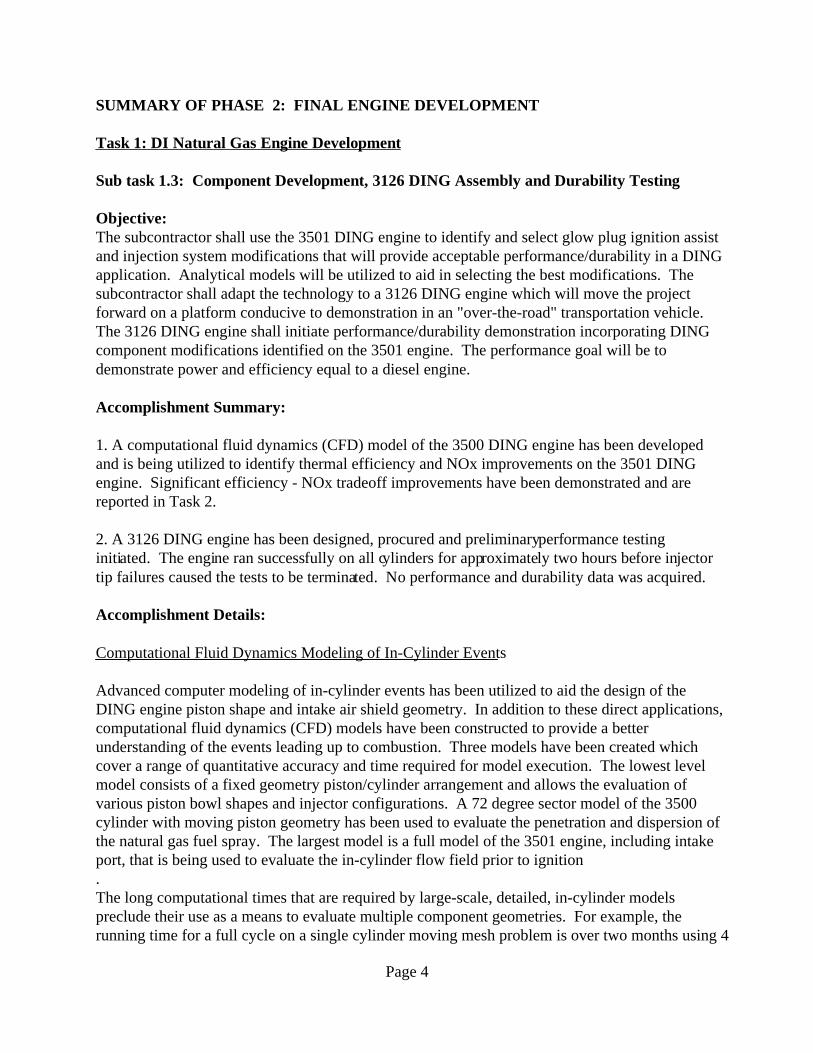
Computational Fluid Dynamics Modeling of In-Cylinder Events
Advanced computer modeling of in-cylinder events has been utilized to aid the design of theDING engine piston shape and intake air shield geometry. In addition to these direct applications,computational fluid dynamics (CFD) models have been constructed to provide a betterunderstanding of the events leading up to combustion. Three models have been created whichcover a range of quantitative accuracy and time required for model execution. The lowest levelmodel consists of a fixed geometry piston/cylinder arrangement and allows the evaluation ofvarious piston bowl shapes and injector configurations. A 72 degree sector model of the 3500cylinder with moving piston geometry has been used to evaluate the penetration and dispersion ofthe natural gas fuel spray. The largest model is a full model of the 3501 engine, including intakeport, that is being used to evaluate the in-cylinder flow field prior to ignition.The long computational times that are required by large-scale, detailed, in-cylinder modelspreclude their use as a means to evaluate multiple component geometries. For example, therunning time for a full cycle on a single cylinder moving mesh problem is over two months using 4
Page 4
processors on a Silicon Graphics Inc. Onyx 2 24 processor computer. The CFD files are typicallyrun on 4 processors which maximizes the speed of the current code. In order to use CFD as aviable design tool, smaller models have been constructed to offer insight into the qualitativeimpact of piston and injector nozzle geometry on gas mixing. The mesh shown in Figure 1 is oneexample of this variety of model. The piston face geometry can be easily modified to simulatepotential piston designs. In addition, the location, size, and number of nozzle holes can bemanipulated to determine the effect of various injection patterns on the in-cylinder distribution.The separation between cylinder head and piston face can be modified but is typically set to thelocation of the piston near the beginning of the injection event. The cylinder pressure andturbulence level are also given as inputs to the model. Figure 2 shows some of the basic resultsfrom this model. The impact of the geometry of the impingement point on the distribution ofnatural gas in the cylinder is shown, with the raised center region allowing the natural gas toseparate from the piston face. It is believed that the attachment of this center jet to the pistoncauses elevated CO and HC emissions at low loads. Because the piston location does not varywith time, the impact of the upward motion of the piston on in-cylinder flow is neglected in thismodel. Despite this drawback, several important design modifications have been guided bymodels of this type. With turnaround times on the order of a few hours, a large number ofdesigns can be evaluated in a short period of time. The piston configurations that produce themost stagnant, flammable mixture in the region of the glow plug have been procured for testing inthe 3501 DING engine.
Figure 1: Section View of Fixed Piston 3501 CFD Model
Page 5

In order to determine more accurately the distribution of fuel in the region of the glow plug, a piesector model of the 3501 cylinder was created. This model includes 72 degrees of the cylinderwith two of the nozzle holes straddling the glow plug and shield. Figure 3 shows the meshgeometry for this model. Piston motion is included so that the impact of increasing cylinderpressure and squish are present. Extensive information has been garnered from this modelincluding the importance of the glow plug shield in retaining flammable mixture near the glowplug, the impact of piston bowl shape and angle of inclination on the attachment of gas jets tosolid surfaces and the effect of injection parameters on the velocity of the gas jet at the nozzleoutlet. A section view of one of the gas jets is shown in Figure 4. The shading in the picturedistinguishes the mixture that is above the rich flammability limit of methane from that which isbelow the lean flammability limit. It is only the outside shell of the injection plume which can beignited by the glow plug. This is a major contributing factor to the long ignition delays that havebeen observed in the DING engine. In the future, this model, or variations of it, will be used tooptimize the glow plug shield geometry to: 1) retain flammable mixture in the region of the glowplug, 2) prevent cooling of the plug by the gas jet, and 3) minimize the cooling of the glow plugby in-cylinder air flow.
Figure 2: Methane Concentration Calculated From 3501 Model (Side View of CombustionChamber Near Top Dead Center)
Page 6

Figure 3: 72 Degree Sector Model of 3501 DING Engine Combustion Chamber
Figure 4: Fuel Concentration Profiles in 3501 DING Engine
Page 7
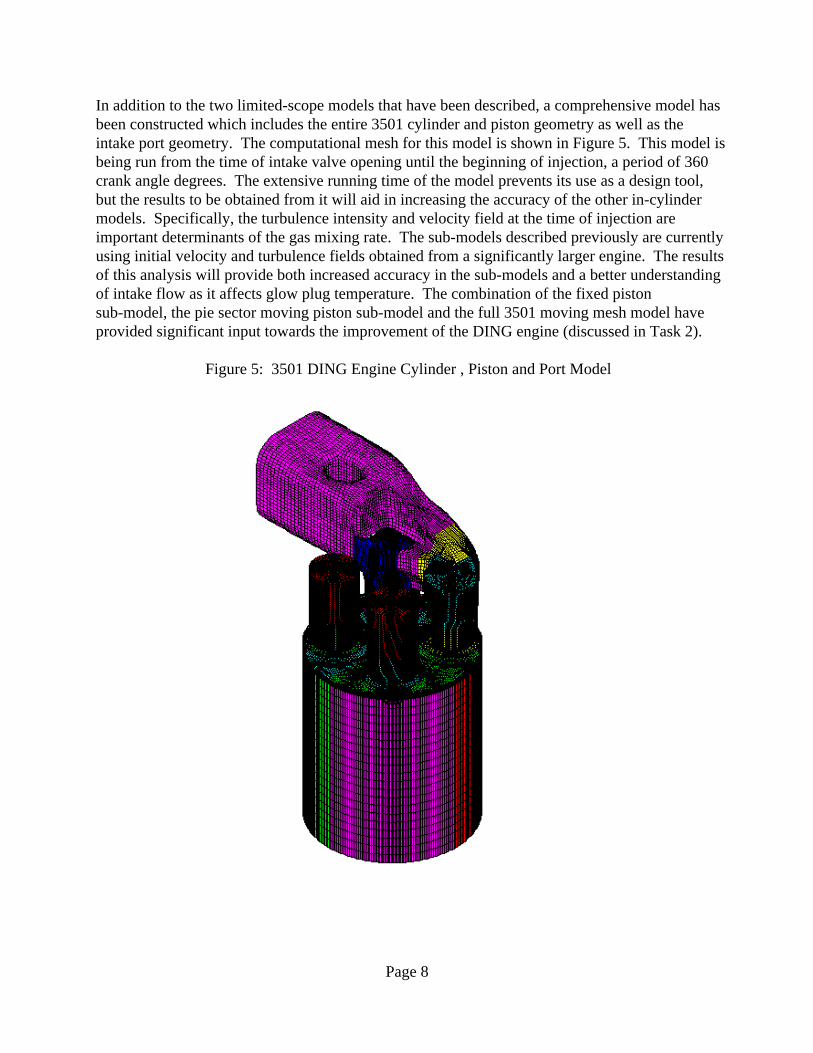
In addition to the two limited-scope models that have been described, a comprehensive model hasbeen constructed which includes the entire 3501 cylinder and piston geometry as well as theintake port geometry. The computational mesh for this model is shown in Figure 5. This model isbeing run from the time of intake valve opening until the beginning of injection, a period of 360crank angle degrees. The extensive running time of the model prevents its use as a design tool,but the results to be obtained from it will aid in increasing the accuracy of the other in-cylindermodels. Specifically, the turbulence intensity and velocity field at the time of injection areimportant determinants of the gas mixing rate. The sub-models described previously are currentlyusing initial velocity and turbulence fields obtained from a significantly larger engine. The resultsof this analysis will provide both increased accuracy in the sub-models and a better understandingof intake flow as it affects glow plug temperature. The combination of the fixed pistonsub-model, the pie sector moving piston sub-model and the full 3501 moving mesh model haveprovided significant input towards the improvement of the DING engine (discussed in Task 2).
Figure 5: 3501 DING Engine Cylinder , Piston and Port Model
Page 8
3126 DING Engine Design, Procurement and Test
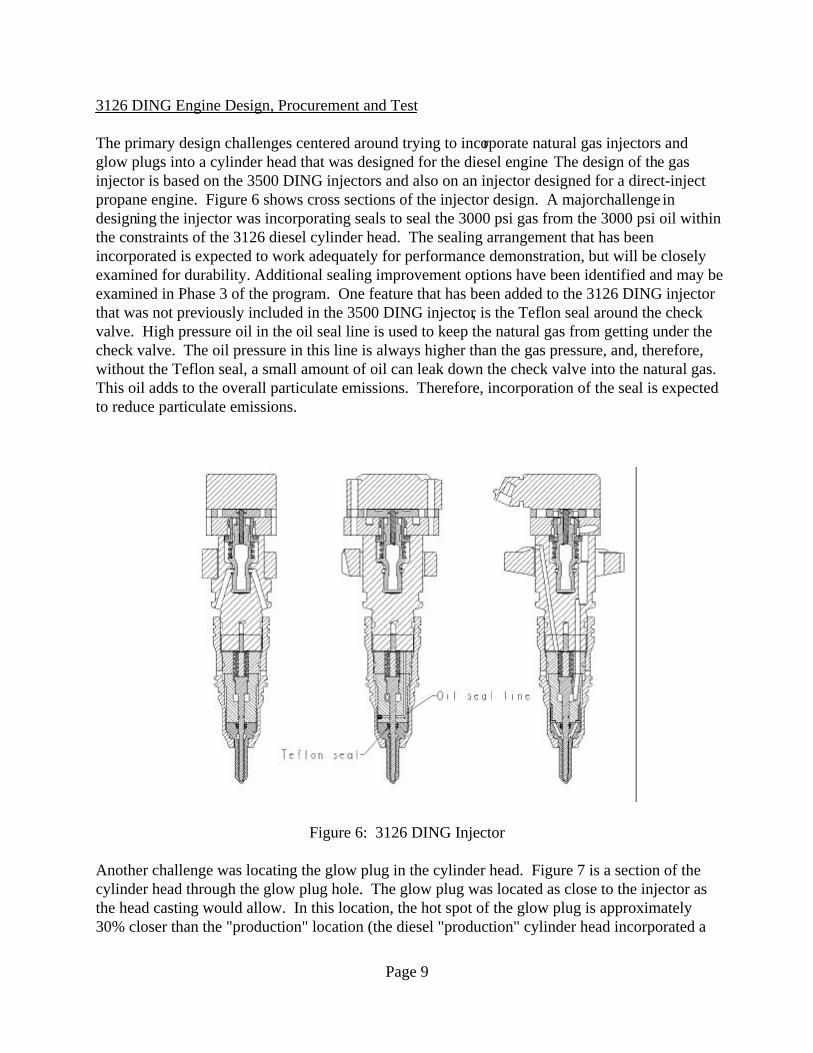
The primary design challenges centered around trying to incorporate natural gas injectors andglow plugs into a cylinder head that was designed for the diesel engine. The design of the gasinjector is based on the 3500 DING injectors and also on an injector designed for a direct-injectpropane engine. Figure 6 shows cross sections of the injector design. A major challenge indesigning the injector was incorporating seals to seal the 3000 psi gas from the 3000 psi oil withinthe constraints of the 3126 diesel cylinder head. The sealing arrangement that has beenincorporated is expected to work adequately for performance demonstration, but will be closelyexamined for durability. Additional sealing improvement options have been identified and may beexamined in Phase 3 of the program. One feature that has been added to the 3126 DING injectorthat was not previously included in the 3500 DING injector, is the Teflon seal around the checkvalve. High pressure oil in the oil seal line is used to keep the natural gas from getting under thecheck valve. The oil pressure in this line is always higher than the gas pressure, and, therefore,without the Teflon seal, a small amount of oil can leak down the check valve into the natural gas.This oil adds to the overall particulate emissions. Therefore, incorporation of the seal is expectedto reduce particulate emissions.
Figure 6: 3126 DING Injector
Another challenge was locating the glow plug in the cylinder head. Figure 7 is a section of thecylinder head through the glow plug hole. The glow plug was located as close to the injector asthe head casting would allow. In this location, the hot spot of the glow plug is approximately30% closer than the "production" location (the diesel "production" cylinder head incorporated a
Page 9
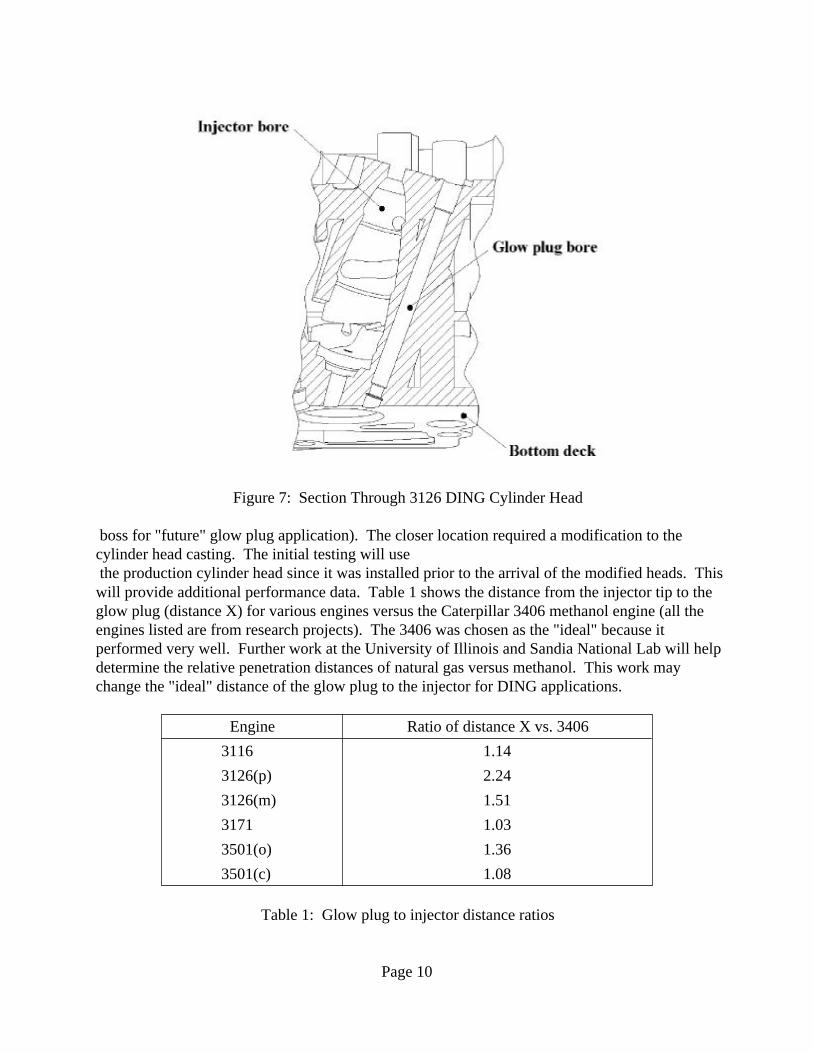
Figure 7: Section Through 3126 DING Cylinder Head
boss for "future" glow plug application). The closer location required a modification to thecylinder head casting. The initial testing will use the production cylinder head since it was installed prior to the arrival of the modified heads. Thiswill provide additional performance data. Table 1 shows the distance from the injector tip to theglow plug (distance X) for various engines versus the Caterpillar 3406 methanol engine (all theengines listed are from research projects). The 3406 was chosen as the "ideal" because itperformed very well. Further work at the University of Illinois and Sandia National Lab will helpdetermine the relative penetration distances of natural gas versus methanol. This work maychange the "ideal" distance of the glow plug to the injector for DING applications.
1.083501(c)1.363501(o)1.0331711.513126(m)2.243126(p)1.143116
Ratio of distance X vs. 3406Engine
Table 1: Glow plug to injector distance ratios
Page 10
In the previous table the (p) denotes the production boss location in the 3126 cylinder head. The(m) denotes the modified design with the glow plug closer to the injector. The (o) stands for theoriginal 3500 cylinder head design, the (c) means the closer version.
Another design issue was the exhaust gas recirculation (EGR) system. Several modifications andadditions to the diesel EGR system were required for the DING engine. The production systemdid not include a cooler. To be comparable to the 3501 data, cooled EGR was needed. A heatexchanger capable of cooling 20% EGR at rated power from 660o C to 140o C was designed andprocured.
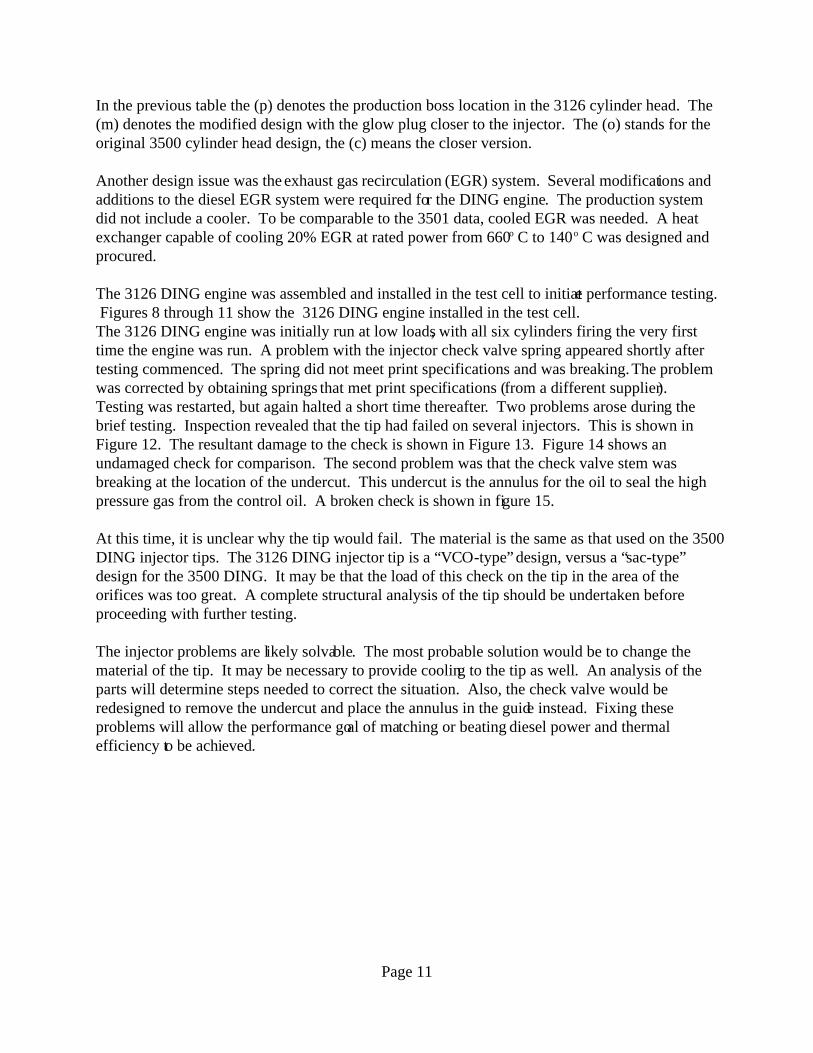
The 3126 DING engine was assembled and installed in the test cell to initiate performance testing. Figures 8 through 11 show the 3126 DING engine installed in the test cell.The 3126 DING engine was initially run at low loads, with all six cylinders firing the very firsttime the engine was run. A problem with the injector check valve spring appeared shortly aftertesting commenced. The spring did not meet print specifications and was breaking. The problemwas corrected by obtaining springs that met print specifications (from a different supplier).Testing was restarted, but again halted a short time thereafter. Two problems arose during thebrief testing. Inspection revealed that the tip had failed on several injectors. This is shown inFigure 12. The resultant damage to the check is shown in Figure 13. Figure 14 shows anundamaged check for comparison. The second problem was that the check valve stem wasbreaking at the location of the undercut. This undercut is the annulus for the oil to seal the highpressure gas from the control oil. A broken check is shown in figure 15.
At this time, it is unclear why the tip would fail. The material is the same as that used on the 3500DING injector tips. The 3126 DING injector tip is a “VCO-type” design, versus a “sac-type”design for the 3500 DING. It may be that the load of this check on the tip in the area of theorifices was too great. A complete structural analysis of the tip should be undertaken beforeproceeding with further testing.
The injector problems are likely solvable. The most probable solution would be to change thematerial of the tip. It may be necessary to provide cooling to the tip as well. An analysis of theparts will determine steps needed to correct the situation. Also, the check valve would beredesigned to remove the undercut and place the annulus in the guide instead. Fixing theseproblems will allow the performance goal of matching or beating diesel power and thermalefficiency to be achieved.
Page 11
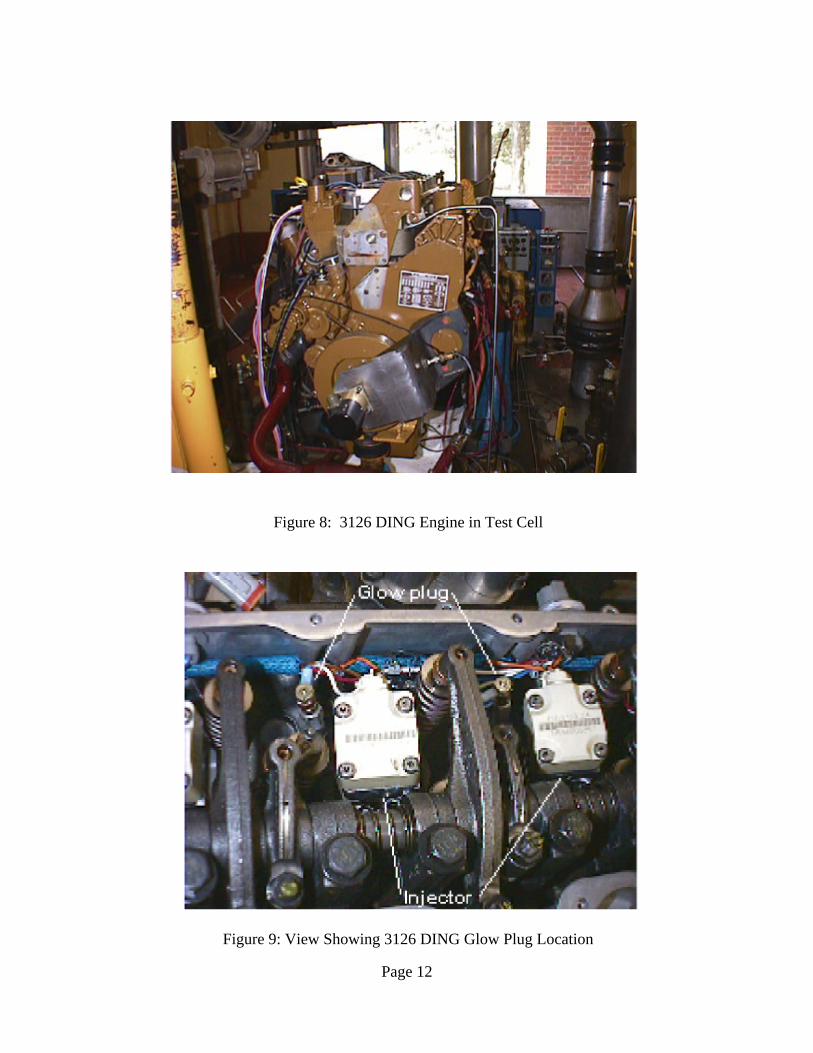
Figure 8: 3126 DING Engine in Test Cell
Figure 9: View Showing 3126 DING Glow Plug Location
Page 12
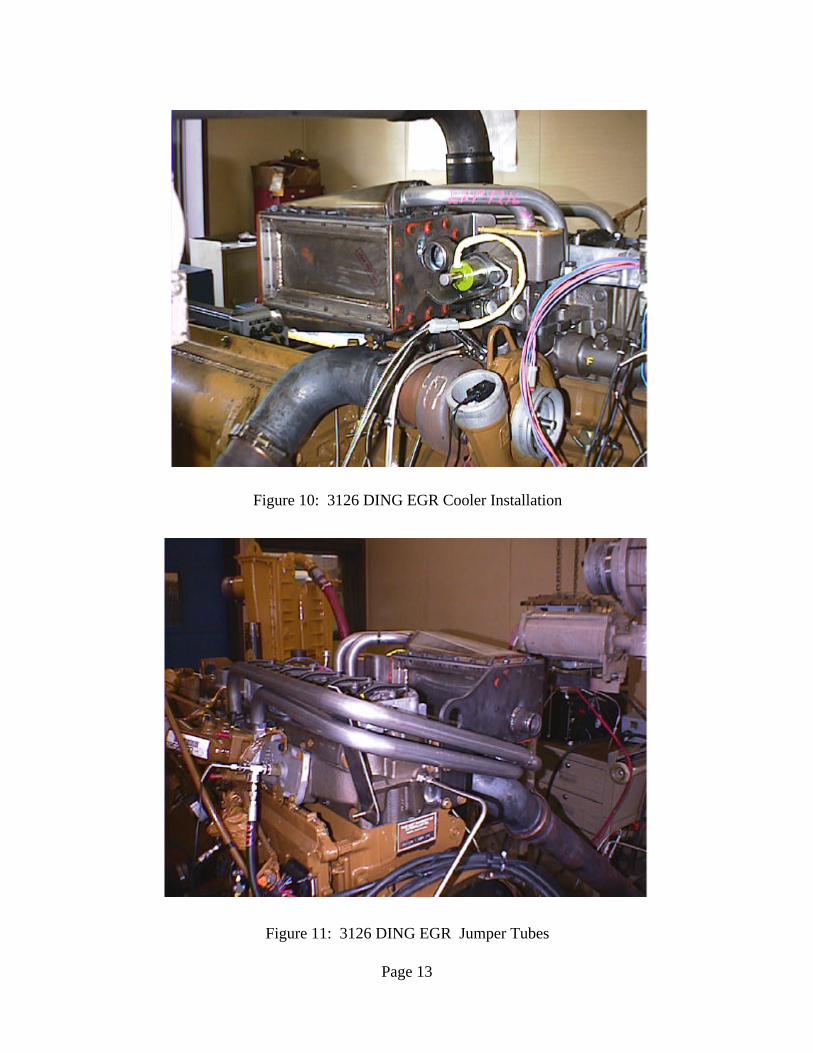
Figure 10: 3126 DING EGR Cooler Installation
Figure 11: 3126 DING EGR Jumper Tubes
Page 13
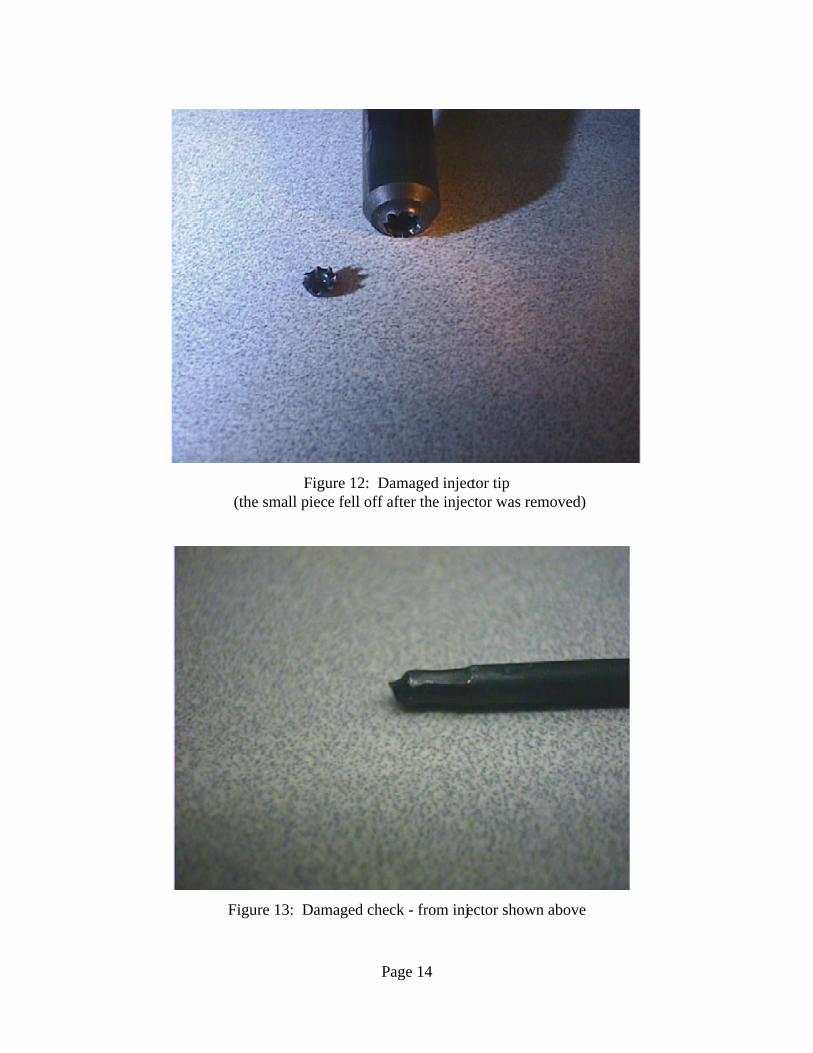
Figure 12: Damaged injector tip(the small piece fell off after the injector was removed)
Figure 13: Damaged check - from injector shown above
Page 14
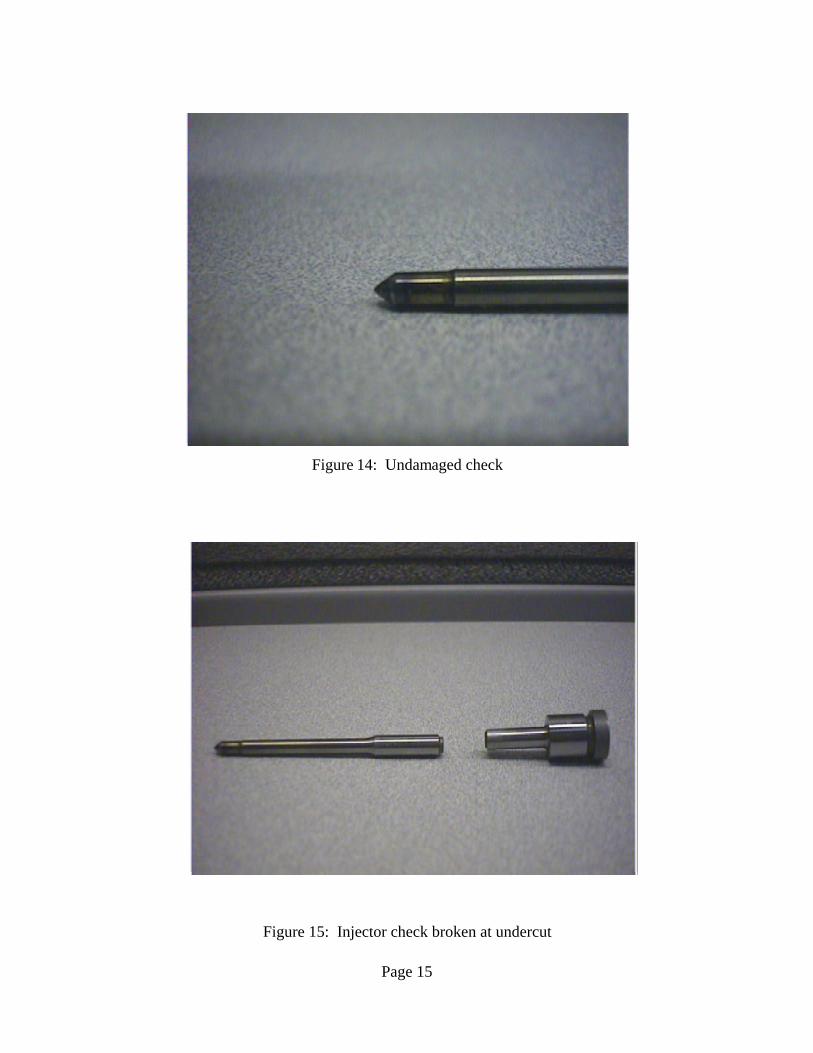
Figure 14: Undamaged check
Figure 15: Injector check broken at undercut
Page 15
Task 2: DI Natural Gas Engine NOx Development
Sub task 2.3: Evaluate Feasibility of Meeting 1.0 gram/hp-hr NOx Goal
Objective:
Based on the results from Sub task 2.2 (Phase 1), the subcontractor shall explore the feasibility ofmeeting 1.0 g/hp-hr NOx goal. In this task, the subcontractor shall determine whether additionalengine modifications and aftertreatment systems are necessary to meet this goal. Thesubcontractor shall then design, fabricate, procure, and integrate these changes to the engine andperform emissions testing as specified in Sub task 2.2.
Accomplishment Summary:
1. With the aid of computational fluid dynamics (CFD) modeling, significant improvements in theNOx - thermal efficiency tradeoff have been demonstrated on the 3501 DING engine, relative toPhase 1 of the program. Without exhaust aftertreatment, rated power thermal efficiency at 2.5gm/hp-hr NOx is 39%, while 8-mode cycle-averaged NOx levels of 2.5 gm/hp-hr weredemonstrated at above 37% thermal efficiency. Light load performance has increased as much as20% utilizing split injection.
2. Selective catalyst reduction bench tests have demonstrated that NOx levels below 1.0 gm/hp-hrare achievable on the DING engine. Such techniques are planned for demonstration on the 3126DING engine in Phase 3.
Accomplishment Details:
3501 DING Engine Tests to Improve Thermal Efficiency - NOx Tradeoff
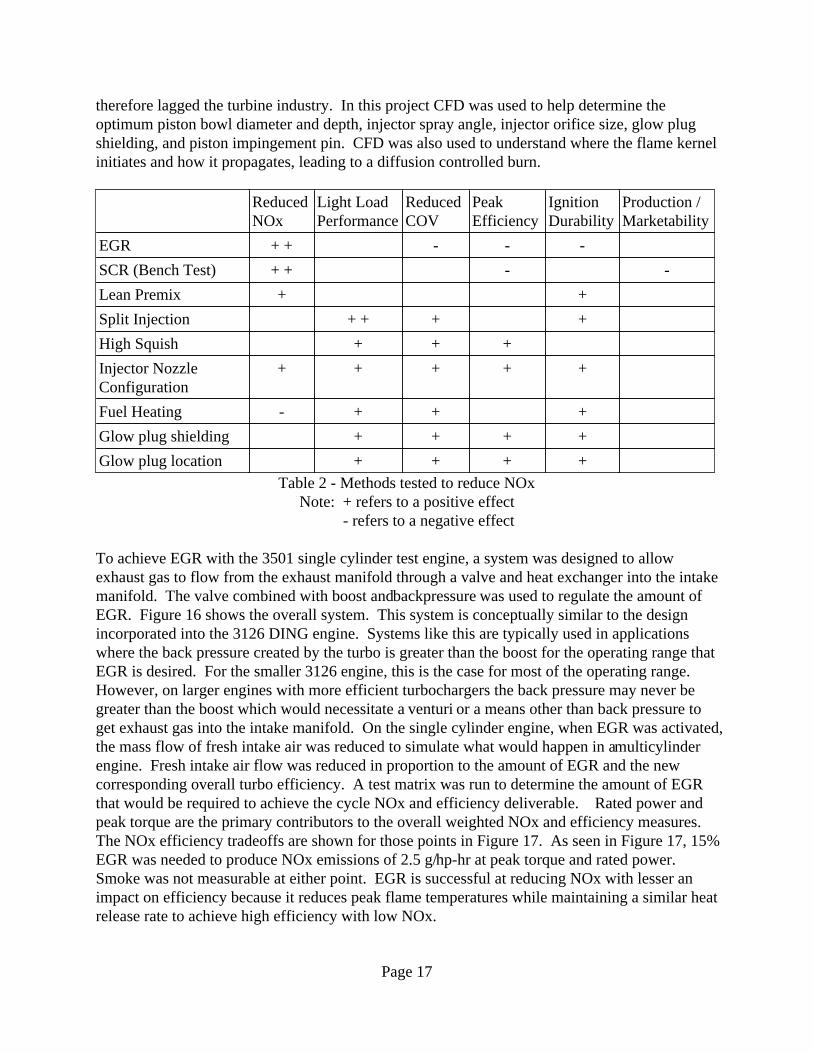
From a combustion standpoint, natural gas is a desirable fuel because it has a lower adiabaticflame temperature as well as a simpler hydrocarbon structure that allows equivalence ratios as richas 2:1 to occur before significant soot formation begins. This has allowed direct inject natural gasengines to run with further retarded injection timings than diesel fueled engines while stillmaintaining acceptable particulate levels at reduced NOx emissions. However, retarding injectiontiming increases fuel consumption and therefore CO2 emissions which are a known green housegas. To find a better solution to this NOx - efficiency trade off, many methods other thanretarded injection timings were evaluated in this phase of the program. Table 2 gives a list of themethods tested as well as a brief matrix showing other variables of concern that would beaffected. Improved modeling strategies were needed to meet the NOx goal of 2.5 g/hp-hr at 40%thermal efficiency.
Computational Fluid Dynamics (CFD) is being utilized to fill this need. CFD has proven to beextremely beneficial in reducing NOx in turbine combustors by allowing leaner air/fuel ratios andachieving a more uniform air-fuel mixture. Reciprocating engines are more complicated to modeldue to their moving valves, pistons, and complicated geometry. This type of modeling has
Page 16
therefore lagged the turbine industry. In this project CFD was used to help determine theoptimum piston bowl diameter and depth, injector spray angle, injector orifice size, glow plugshielding, and piston impingement pin. CFD was also used to understand where the flame kernelinitiates and how it propagates, leading to a diffusion controlled burn.
++++Glow plug location++++Glow plug shielding+++-Fuel Heating
+++++Injector NozzleConfiguration
+++High Squish +++ +Split Injection++Lean Premix
--+ +SCR (Bench Test)---+ +EGR
Production /Marketability
IgnitionDurability
PeakEfficiency
ReducedCOV
Light LoadPerformance
ReducedNOx
Table 2 - Methods tested to reduce NOxNote: + refers to a positive effect - refers to a negative effect
To achieve EGR with the 3501 single cylinder test engine, a system was designed to allowexhaust gas to flow from the exhaust manifold through a valve and heat exchanger into the intakemanifold. The valve combined with boost and backpressure was used to regulate the amount ofEGR. Figure 16 shows the overall system. This system is conceptually similar to the designincorporated into the 3126 DING engine. Systems like this are typically used in applicationswhere the back pressure created by the turbo is greater than the boost for the operating range thatEGR is desired. For the smaller 3126 engine, this is the case for most of the operating range.However, on larger engines with more efficient turbochargers the back pressure may never begreater than the boost which would necessitate a venturi or a means other than back pressure toget exhaust gas into the intake manifold. On the single cylinder engine, when EGR was activated,the mass flow of fresh intake air was reduced to simulate what would happen in a multicylinderengine. Fresh intake air flow was reduced in proportion to the amount of EGR and the newcorresponding overall turbo efficiency. A test matrix was run to determine the amount of EGRthat would be required to achieve the cycle NOx and efficiency deliverable. Rated power andpeak torque are the primary contributors to the overall weighted NOx and efficiency measures.The NOx efficiency tradeoffs are shown for those points in Figure 17. As seen in Figure 17, 15%EGR was needed to produce NOx emissions of 2.5 g/hp-hr at peak torque and rated power.Smoke was not measurable at either point. EGR is successful at reducing NOx with lesser animpact on efficiency because it reduces peak flame temperatures while maintaining a similar heatrelease rate to achieve high efficiency with low NOx.
Page 17
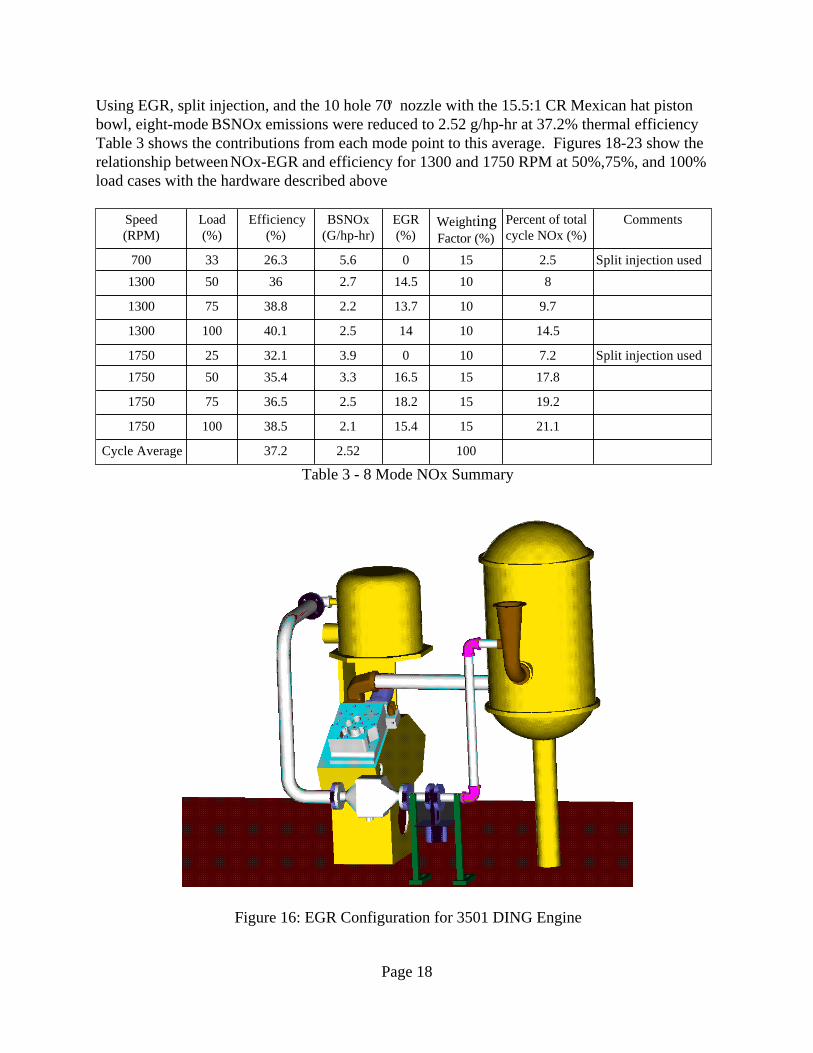
Using EGR, split injection, and the 10 hole 70o nozzle with the 15.5:1 CR Mexican hat pistonbowl, eight-mode BSNOx emissions were reduced to 2.52 g/hp-hr at 37.2% thermal efficiency Table 3 shows the contributions from each mode point to this average. Figures 18-23 show therelationship between NOx-EGR and efficiency for 1300 and 1750 RPM at 50%,75%, and 100%load cases with the hardware described above
1002.5237.2Cycle Average
21.11515.42.138.51001750
19.21518.22.536.5751750
17.81516.53.335.4501750
Split injection used7.21003.932.1251750
14.510142.540.11001300
9.71013.72.238.8751300
81014.52.736501300
Split injection used2.51505.626.333700
CommentsPercent of totalcycle NOx (%)
WeightingFactor (%)
EGR(%)
BSNOx(G/hp-hr)
Efficiency(%)
Load(%)
Speed(RPM)
Table 3 - 8 Mode NOx Summary
Figure 16: EGR Configuration for 3501 DING Engine
Page 18
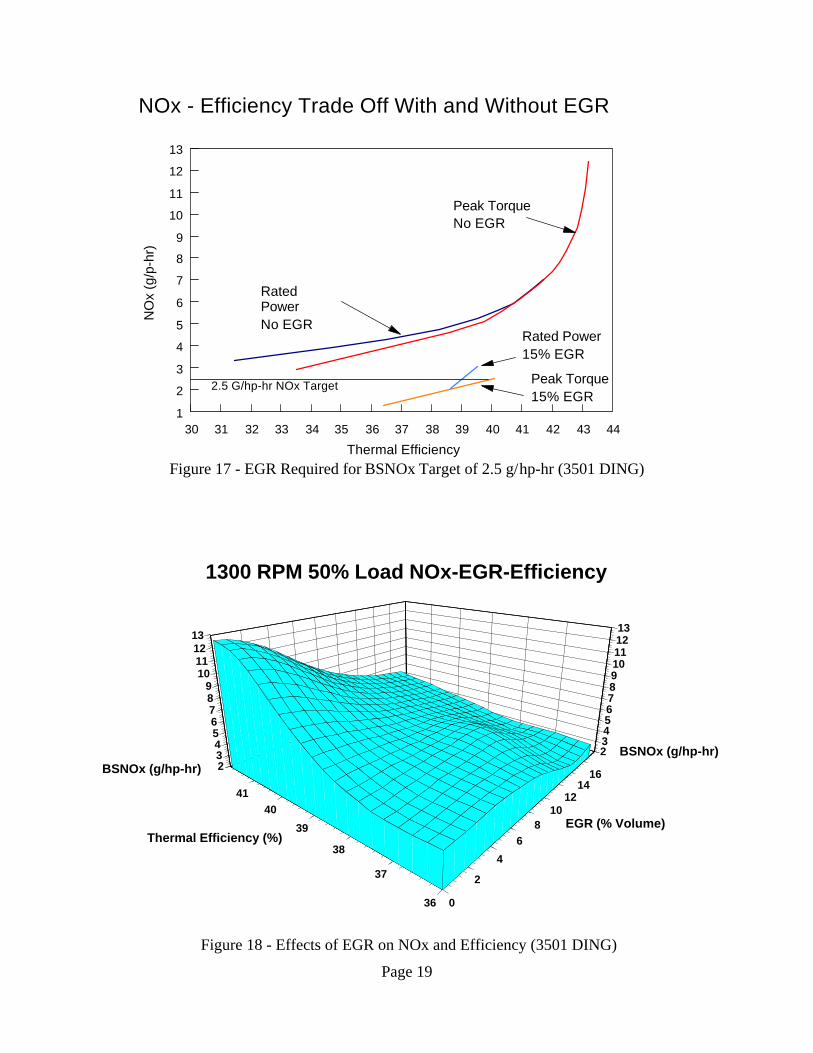
Figure 17 - EGR Required for BSNOx Target of 2.5 g/hp-hr (3501 DING)
Figure 18 - Effects of EGR on NOx and Efficiency (3501 DING)
Page 19
0
2
4
68
1012
1416
EGR (% Volume)
36
37
38
39
4041
Thermal Efficiency (%)
2345678910111213
BSNOx (g/hp-hr)23456789
10111213
BSNOx (g/hp-hr)
1300 RPM 50% Load NOx-EGR-Efficiency
30 31 32 33 34 35 36 37 38 39 40 41 42 43 441
2
3
4
5
6
7
8
9
10
11
12
13
Thermal Efficiency
NO
x (g
/p-h
r)
Peak TorqueNo EGR
Rated PowerNo EGR
Rated Power15% EGR
Peak Torque15% EGR
2.5 G/hp-hr NOx Target
NOx - Efficiency Trade Off With and Without EGR
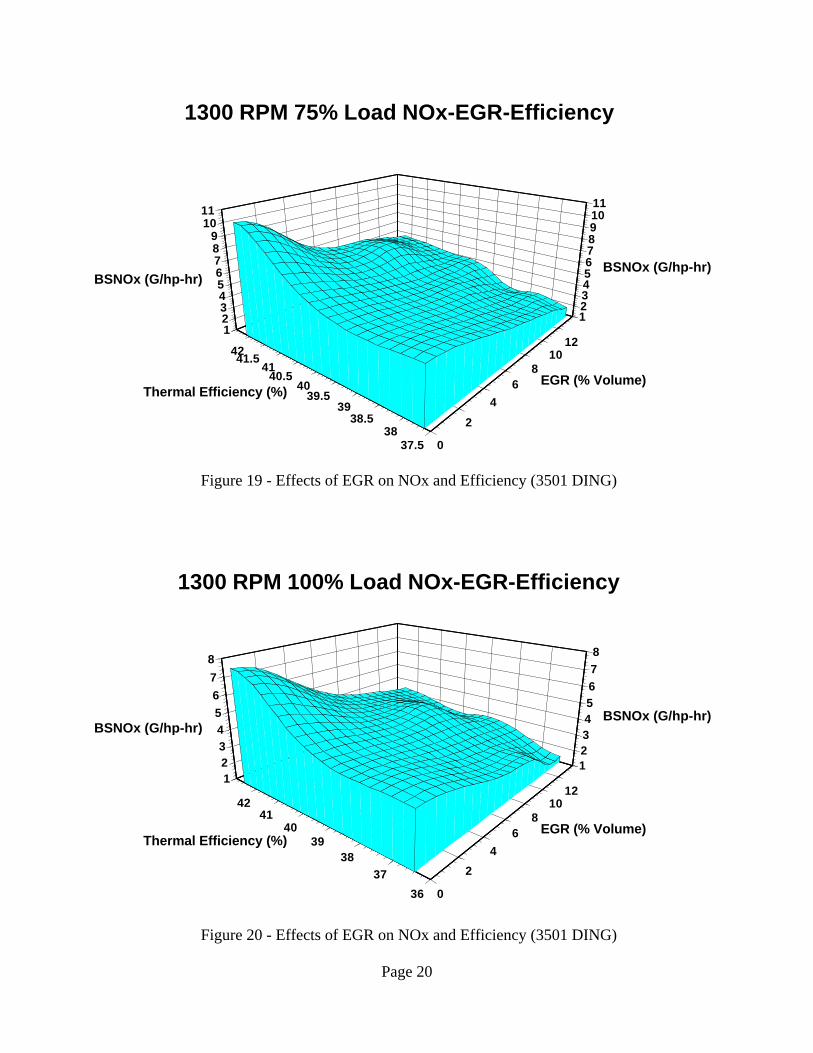
Figure 19 - Effects of EGR on NOx and Efficiency (3501 DING)
Figure 20 - Effects of EGR on NOx and Efficiency (3501 DING)
Page 20
0
2
46
810
12
EGR (% Volume)
36
3738
3940
4142
Thermal Efficiency (%)
12345678
BSNOx (G/hp-hr)
12345678
BSNOx (G/hp-hr)
1300 RPM 100% Load NOx-EGR-Efficiency
0
2
46
810
12
EGR (% Volume)
37.538
38.539
39.540
40.541
41.542
Thermal Efficiency (%)
1234567891011
BSNOx (G/hp-hr)
123456789
1011
BSNOx (G/hp-hr)
1300 RPM 75% Load NOx-EGR-Efficiency
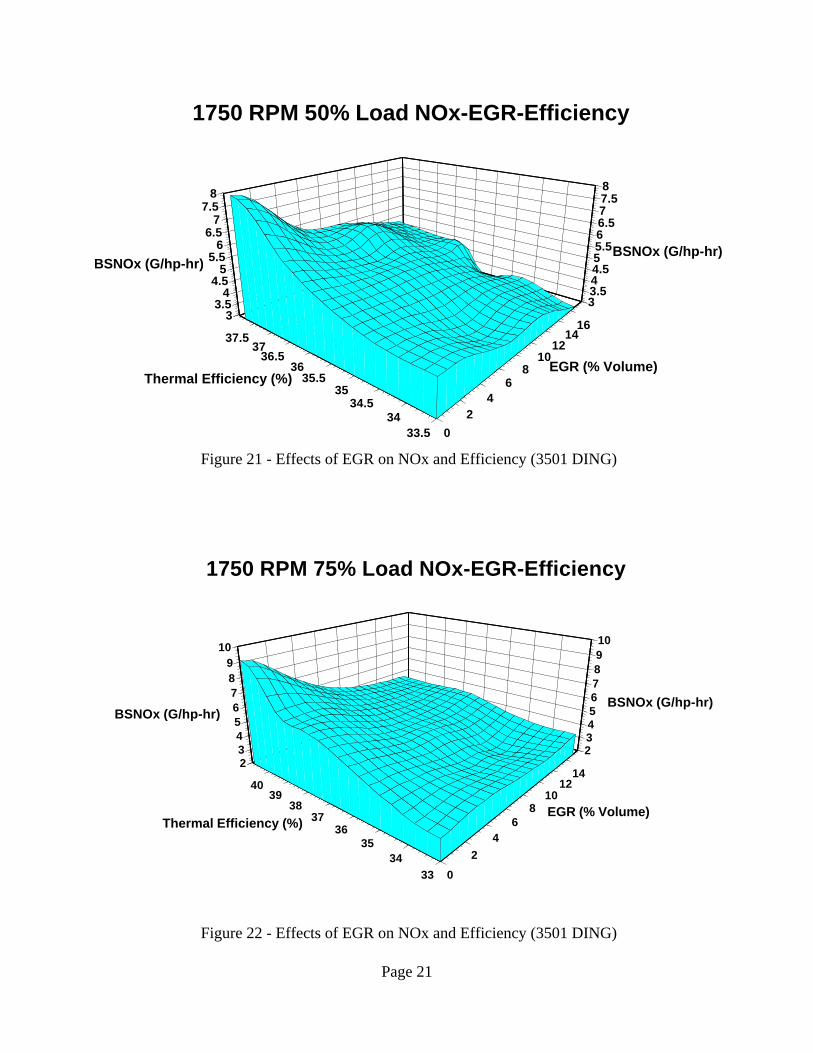
Figure 21 - Effects of EGR on NOx and Efficiency (3501 DING)
Figure 22 - Effects of EGR on NOx and Efficiency (3501 DING)
Page 21
0
24
68
1012
14
EGR (% Volume)
3334
3536
3738
3940
Thermal Efficiency (%)
2345678910
BSNOx (G/hp-hr)
23456789
10
BSNOx (G/hp-hr)
1750 RPM 75% Load NOx-EGR-Efficiency
02
46
810
1214
16
EGR (% Volume)
33.534
34.535
35.536
36.537
37.5
Thermal Efficiency (%)
33.544.555.566.577.58
BSNOx (G/hp-hr)
33.5
44.5
55.5
66.5
77.5
8
BSNOx (G/hp-hr)
1750 RPM 50% Load NOx-EGR-Efficiency
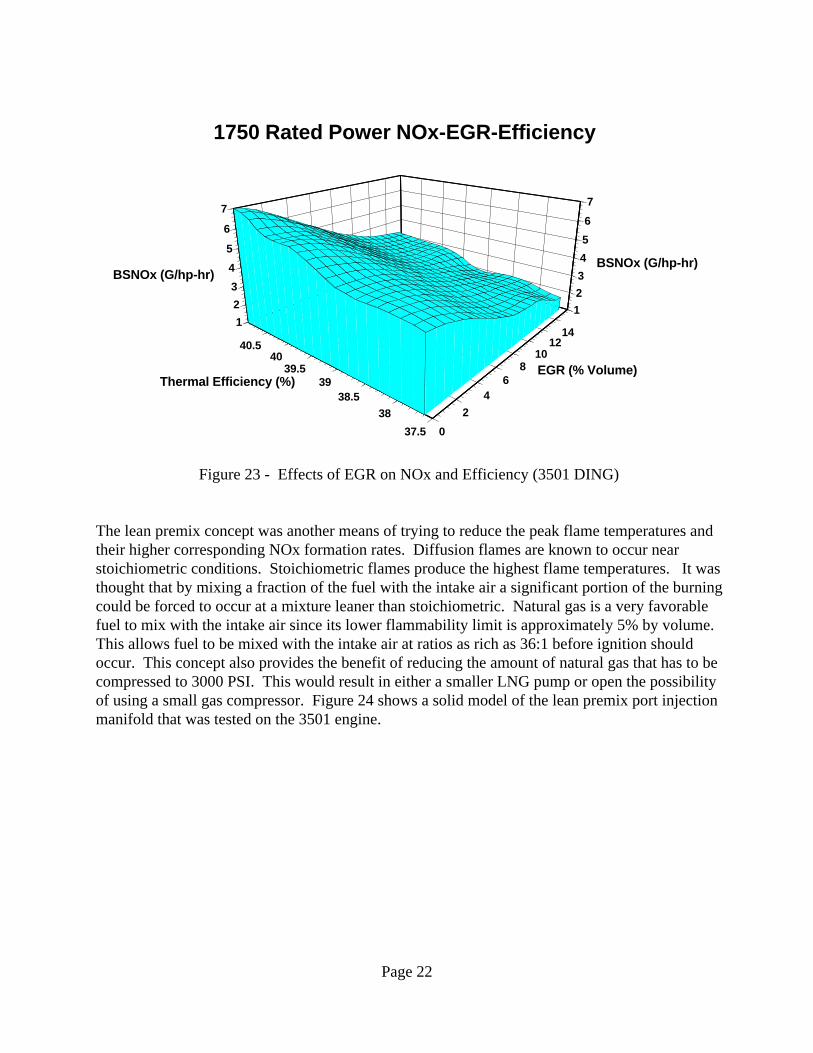
Figure 23 - Effects of EGR on NOx and Efficiency (3501 DING)
The lean premix concept was another means of trying to reduce the peak flame temperatures andtheir higher corresponding NOx formation rates. Diffusion flames are known to occur nearstoichiometric conditions. Stoichiometric flames produce the highest flame temperatures. It wasthought that by mixing a fraction of the fuel with the intake air a significant portion of the burningcould be forced to occur at a mixture leaner than stoichiometric. Natural gas is a very favorablefuel to mix with the intake air since its lower flammability limit is approximately 5% by volume.This allows fuel to be mixed with the intake air at ratios as rich as 36:1 before ignition shouldoccur. This concept also provides the benefit of reducing the amount of natural gas that has to becompressed to 3000 PSI. This would result in either a smaller LNG pump or open the possibilityof using a small gas compressor. Figure 24 shows a solid model of the lean premix port injectionmanifold that was tested on the 3501 engine.
Page 22
0
24
68
1012
14
EGR (% Volume)
37.5
3838.5
3939.5
4040.5
Thermal Efficiency (%)
123
4
5
6
7
BSNOx (G/hp-hr)
12
3
4
5
6
7
BSNOx (G/hp-hr)
1750 Rated Power NOx-EGR-Efficiency
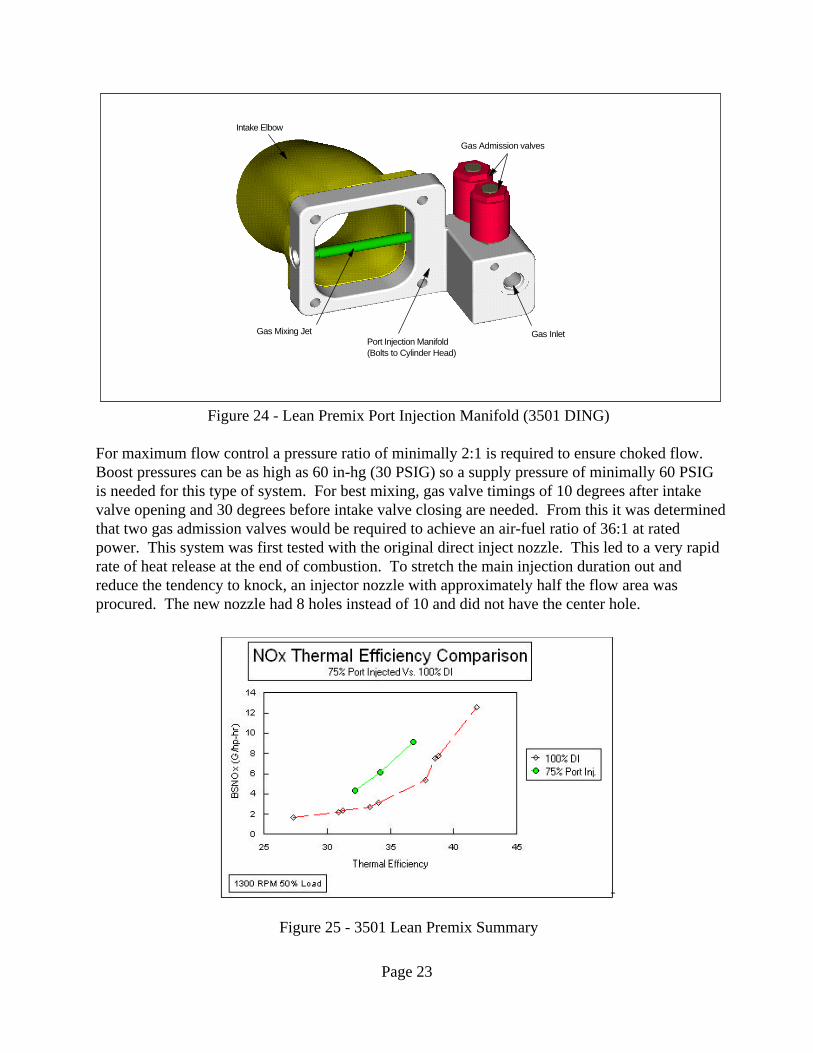
Figure 24 - Lean Premix Port Injection Manifold (3501 DING)
For maximum flow control a pressure ratio of minimally 2:1 is required to ensure choked flow.Boost pressures can be as high as 60 in-hg (30 PSIG) so a supply pressure of minimally 60 PSIGis needed for this type of system. For best mixing, gas valve timings of 10 degrees after intakevalve opening and 30 degrees before intake valve closing are needed. From this it was determinedthat two gas admission valves would be required to achieve an air-fuel ratio of 36:1 at ratedpower. This system was first tested with the original direct inject nozzle. This led to a very rapidrate of heat release at the end of combustion. To stretch the main injection duration out andreduce the tendency to knock, an injector nozzle with approximately half the flow area wasprocured. The new nozzle had 8 holes instead of 10 and did not have the center hole.
Figure 25 - 3501 Lean Premix Summary
Page 23
Intake Elbow
Gas Admission valves
Gas InletGas Mixing JetPort Injection Manifold(Bolts to Cylinder Head)
Fewer holes were used in order to maintain maximum penetration. The angle between the sprayswas 36 degrees for the sprays that straddled the glow plug and 46.3 degrees for all the othersprays. Data acquired at 50% load with this nozzle is presented above in Figure 25. As shown inthe figure, the NOx-efficiency trade off was worse with the port injection. With lower portinjection substitution rates the NOx-efficiency trade off approached that of the 100% direct injectcase. The negative impact on the NOx-efficiency trade off is a result of a significant increase inthe unburned hydrocarbons and a decrease in the rate of heat release that occurred as a result ofless turbulence. At rated power and peak torque the NOx-efficiency relationship was found to bemuch the same. However, the maximum substitution to avoid knock was between 40-60% of thetotal fuel rate depending on speed and load. With the large flow area nozzle the maximumsubstitution was between 25-50% of the total fuel rate. Results of this testing indicate there is noNOx advantage to port injecting a fraction of the fuel with the intake air and igniting with a DInatural gas pilot.
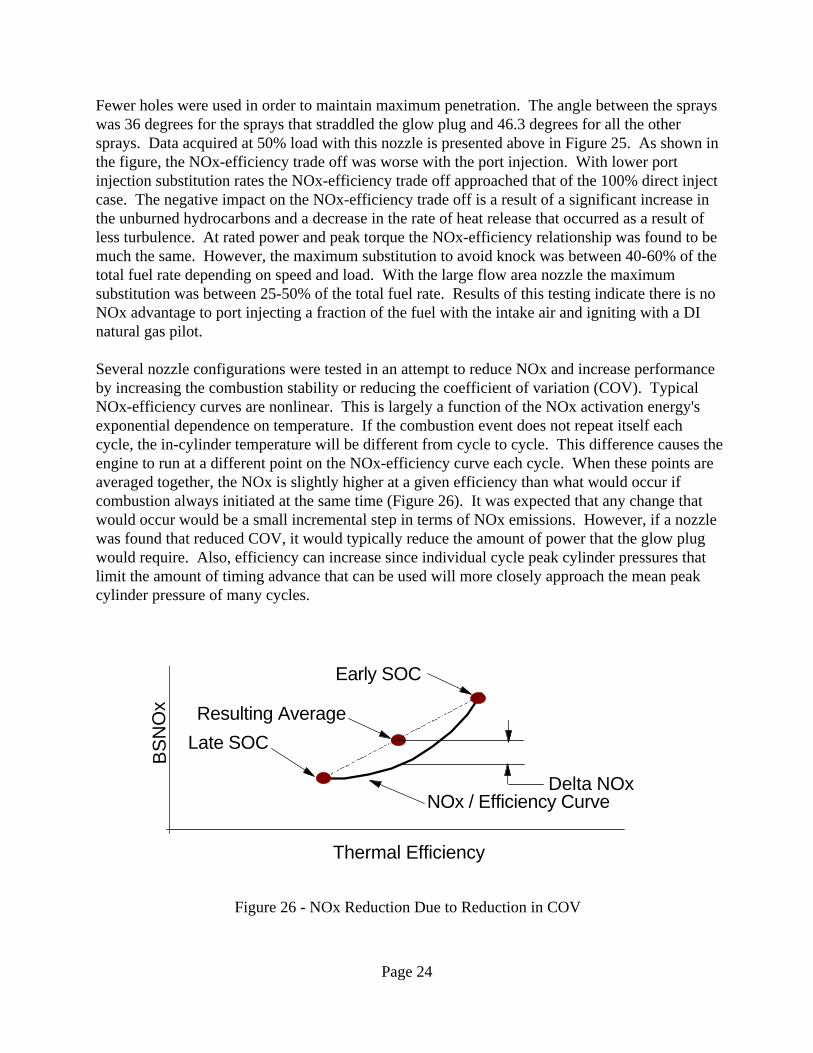
Several nozzle configurations were tested in an attempt to reduce NOx and increase performanceby increasing the combustion stability or reducing the coefficient of variation (COV). TypicalNOx-efficiency curves are nonlinear. This is largely a function of the NOx activation energy'sexponential dependence on temperature. If the combustion event does not repeat itself eachcycle, the in-cylinder temperature will be different from cycle to cycle. This difference causes theengine to run at a different point on the NOx-efficiency curve each cycle. When these points areaveraged together, the NOx is slightly higher at a given efficiency than what would occur ifcombustion always initiated at the same time (Figure 26). It was expected that any change thatwould occur would be a small incremental step in terms of NOx emissions. However, if a nozzlewas found that reduced COV, it would typically reduce the amount of power that the glow plugwould require. Also, efficiency can increase since individual cycle peak cylinder pressures thatlimit the amount of timing advance that can be used will more closely approach the mean peakcylinder pressure of many cycles.
Figure 26 - NOx Reduction Due to Reduction in COV
Page 24
NOx / Efficiency Curve
Early SOC
Late SOC
BS
NO
x
Thermal Efficiency
Resulting Average
Delta NOx
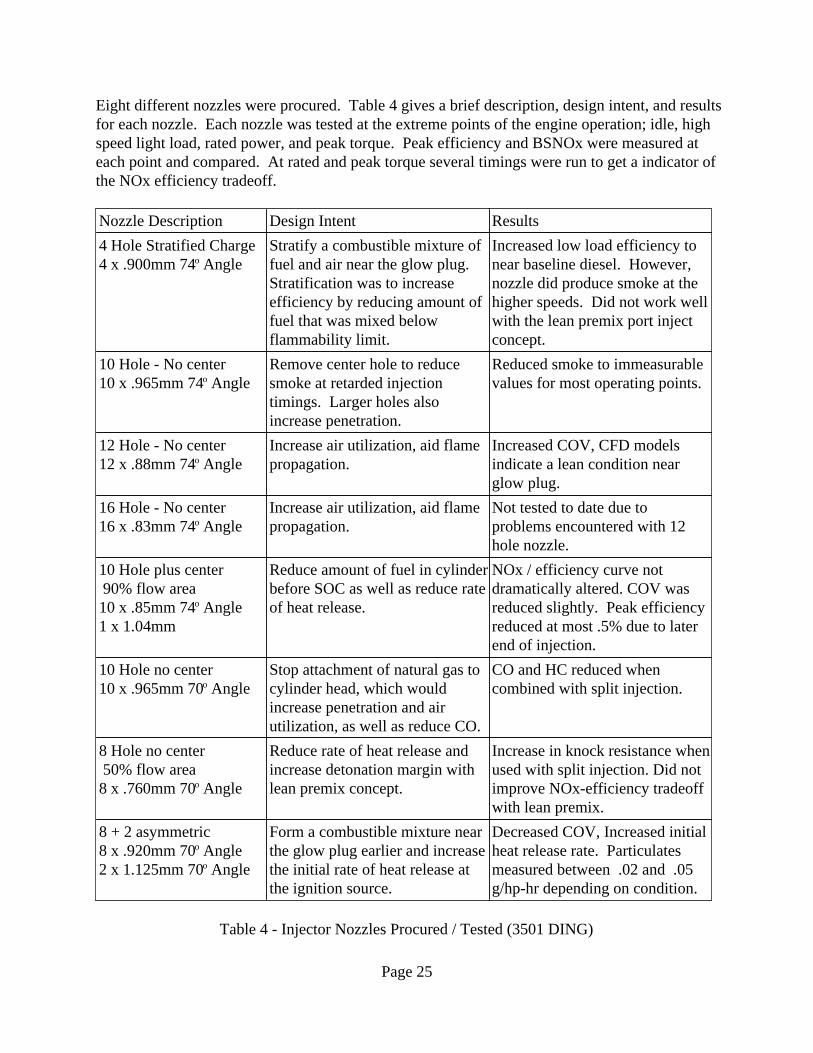
Eight different nozzles were procured. Table 4 gives a brief description, design intent, and resultsfor each nozzle. Each nozzle was tested at the extreme points of the engine operation; idle, highspeed light load, rated power, and peak torque. Peak efficiency and BSNOx were measured ateach point and compared. At rated and peak torque several timings were run to get a indicator ofthe NOx efficiency tradeoff.
Decreased COV, Increased initialheat release rate. Particulatesmeasured between .02 and .05g/hp-hr depending on condition.
Form a combustible mixture nearthe glow plug earlier and increasethe initial rate of heat release atthe ignition source.
8 + 2 asymmetric 8 x .920mm 70o Angle2 x 1.125mm 70o Angle
Increase in knock resistance whenused with split injection. Did notimprove NOx-efficiency tradeoffwith lean premix.
Reduce rate of heat release andincrease detonation margin withlean premix concept.
8 Hole no center 50% flow area8 x .760mm 70o Angle
CO and HC reduced whencombined with split injection.
Stop attachment of natural gas tocylinder head, which wouldincrease penetration and airutilization, as well as reduce CO.
10 Hole no center 10 x .965mm 70o Angle
NOx / efficiency curve notdramatically altered. COV wasreduced slightly. Peak efficiencyreduced at most .5% due to laterend of injection.
Reduce amount of fuel in cylinderbefore SOC as well as reduce rateof heat release.
10 Hole plus center 90% flow area10 x .85mm 74o Angle1 x 1.04mm
Not tested to date due toproblems encountered with 12hole nozzle.
Increase air utilization, aid flamepropagation.
16 Hole - No center16 x .83mm 74o Angle
Increased COV, CFD modelsindicate a lean condition nearglow plug.
Increase air utilization, aid flamepropagation.
12 Hole - No center12 x .88mm 74o Angle
Reduced smoke to immeasurablevalues for most operating points.
Remove center hole to reducesmoke at retarded injectiontimings. Larger holes alsoincrease penetration.
10 Hole - No center10 x .965mm 74o Angle
Increased low load efficiency tonear baseline diesel. However,nozzle did produce smoke at thehigher speeds. Did not work wellwith the lean premix port injectconcept.
Stratify a combustible mixture offuel and air near the glow plug.Stratification was to increaseefficiency by reducing amount offuel that was mixed belowflammability limit.
4 Hole Stratified Charge4 x .900mm 74o Angle
ResultsDesign IntentNozzle Description
Table 4 - Injector Nozzles Procured / Tested (3501 DING)
Page 25
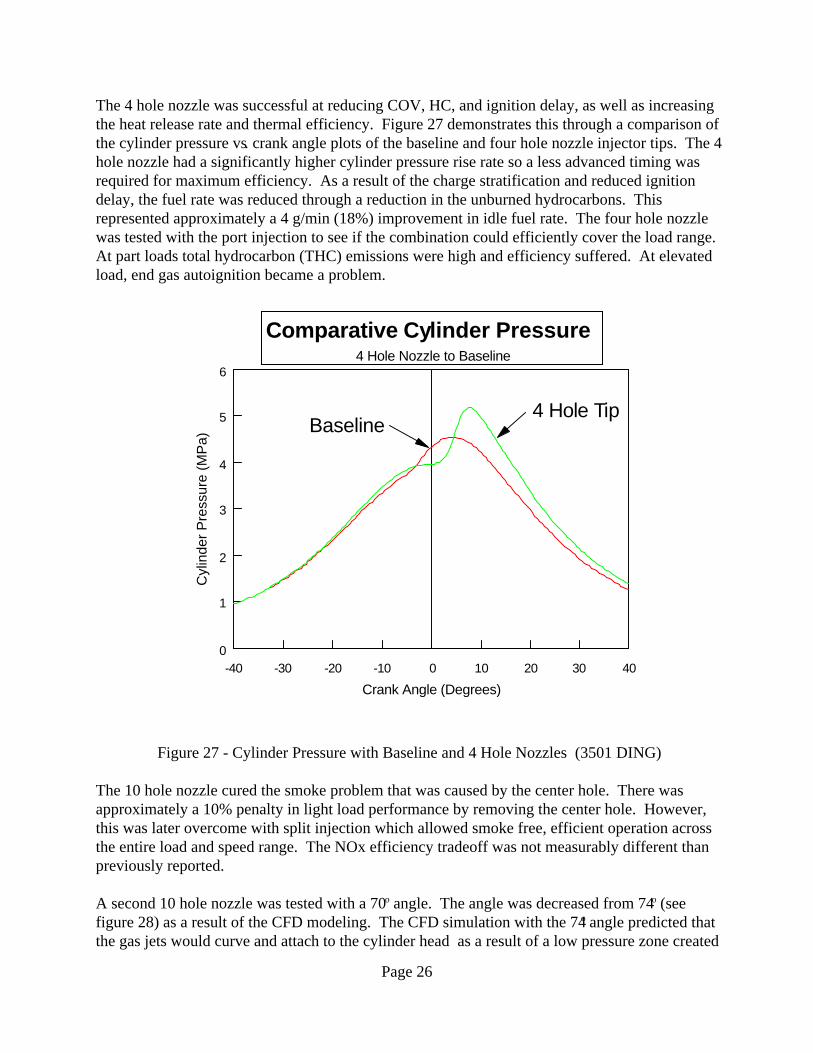
The 4 hole nozzle was successful at reducing COV, HC, and ignition delay, as well as increasingthe heat release rate and thermal efficiency. Figure 27 demonstrates this through a comparison ofthe cylinder pressure vs. crank angle plots of the baseline and four hole nozzle injector tips. The 4hole nozzle had a significantly higher cylinder pressure rise rate so a less advanced timing wasrequired for maximum efficiency. As a result of the charge stratification and reduced ignitiondelay, the fuel rate was reduced through a reduction in the unburned hydrocarbons. Thisrepresented approximately a 4 g/min (18%) improvement in idle fuel rate. The four hole nozzlewas tested with the port injection to see if the combination could efficiently cover the load range.At part loads total hydrocarbon (THC) emissions were high and efficiency suffered. At elevatedload, end gas autoignition became a problem.
Figure 27 - Cylinder Pressure with Baseline and 4 Hole Nozzles (3501 DING)
The 10 hole nozzle cured the smoke problem that was caused by the center hole. There wasapproximately a 10% penalty in light load performance by removing the center hole. However,this was later overcome with split injection which allowed smoke free, efficient operation acrossthe entire load and speed range. The NOx efficiency tradeoff was not measurably different thanpreviously reported.
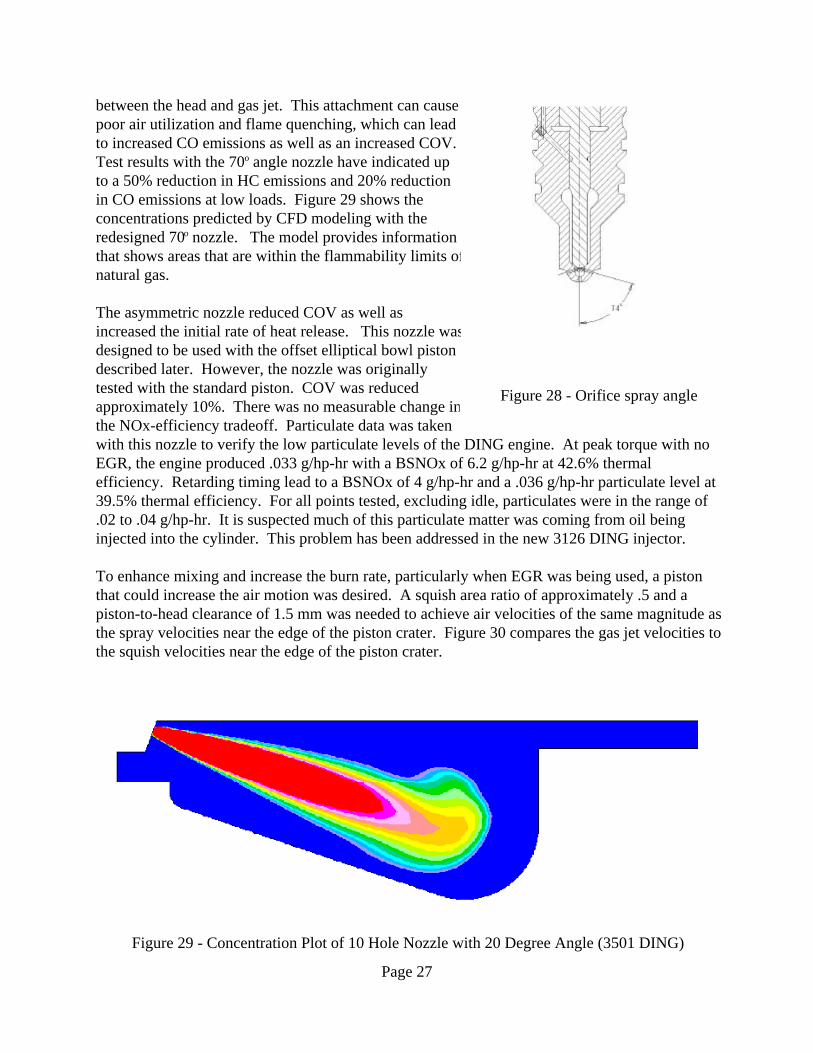
A second 10 hole nozzle was tested with a 70o angle. The angle was decreased from 74o (seefigure 28) as a result of the CFD modeling. The CFD simulation with the 74o angle predicted thatthe gas jets would curve and attach to the cylinder head as a result of a low pressure zone created
Page 26
-40 -30 -20 -10 0 10 20 30 400
1
2
3
4
5
6
Crank Angle (Degrees)
Cyl
inde
r Pre
ssur
e (M
Pa)
Comparative Cylinder Pressure 4 Hole Nozzle to Baseline
4 Hole TipBaseline
between the head and gas jet. This attachment can causepoor air utilization and flame quenching, which can leadto increased CO emissions as well as an increased COV.Test results with the 70o angle nozzle have indicated upto a 50% reduction in HC emissions and 20% reductionin CO emissions at low loads. Figure 29 shows theconcentrations predicted by CFD modeling with theredesigned 70o nozzle. The model provides informationthat shows areas that are within the flammability limits ofnatural gas.
The asymmetric nozzle reduced COV as well asincreased the initial rate of heat release. This nozzle wasdesigned to be used with the offset elliptical bowl pistondescribed later. However, the nozzle was originallytested with the standard piston. COV was reducedapproximately 10%. There was no measurable change inthe NOx-efficiency tradeoff. Particulate data was takenwith this nozzle to verify the low particulate levels of the DING engine. At peak torque with noEGR, the engine produced .033 g/hp-hr with a BSNOx of 6.2 g/hp-hr at 42.6% thermalefficiency. Retarding timing lead to a BSNOx of 4 g/hp-hr and a .036 g/hp-hr particulate level at39.5% thermal efficiency. For all points tested, excluding idle, particulates were in the range of.02 to .04 g/hp-hr. It is suspected much of this particulate matter was coming from oil beinginjected into the cylinder. This problem has been addressed in the new 3126 DING injector.
To enhance mixing and increase the burn rate, particularly when EGR was being used, a pistonthat could increase the air motion was desired. A squish area ratio of approximately .5 and apiston-to-head clearance of 1.5 mm was needed to achieve air velocities of the same magnitude asthe spray velocities near the edge of the piston crater. Figure 30 compares the gas jet velocities tothe squish velocities near the edge of the piston crater.
Figure 29 - Concentration Plot of 10 Hole Nozzle with 20 Degree Angle (3501 DING)
Page 27
Figure 28 - Orifice spray angle
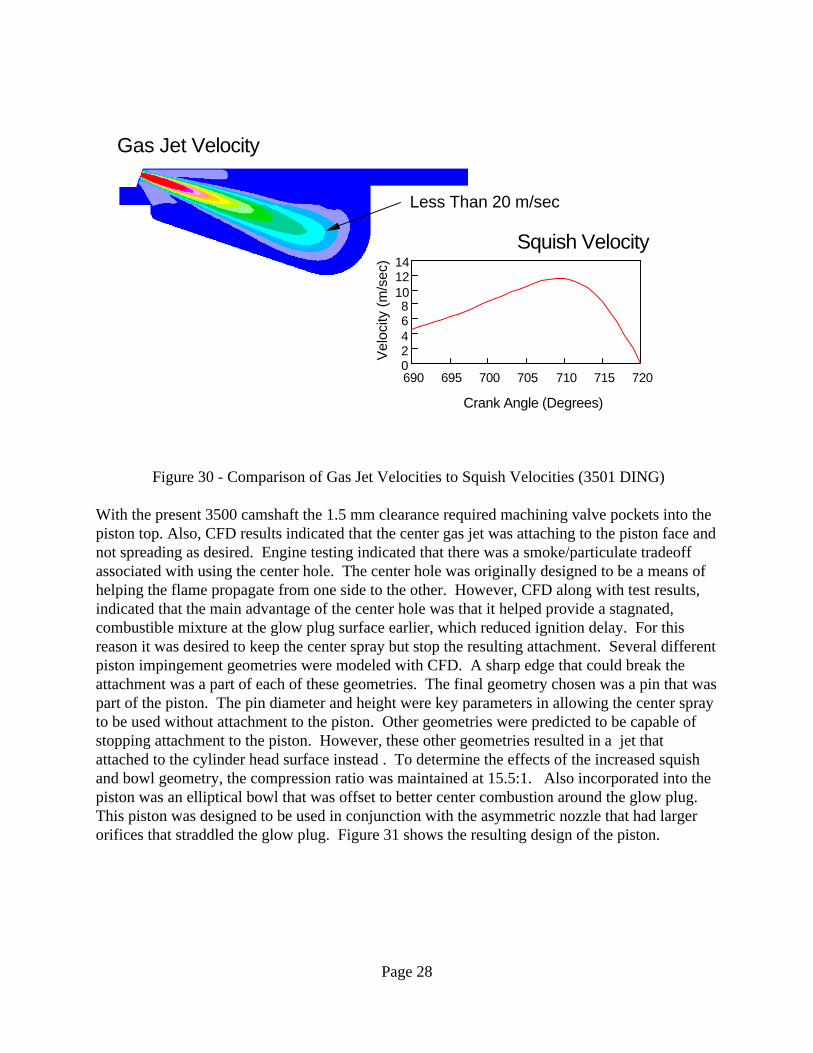
Figure 30 - Comparison of Gas Jet Velocities to Squish Velocities (3501 DING)
With the present 3500 camshaft the 1.5 mm clearance required machining valve pockets into thepiston top. Also, CFD results indicated that the center gas jet was attaching to the piston face andnot spreading as desired. Engine testing indicated that there was a smoke/particulate tradeoffassociated with using the center hole. The center hole was originally designed to be a means ofhelping the flame propagate from one side to the other. However, CFD along with test results,indicated that the main advantage of the center hole was that it helped provide a stagnated,combustible mixture at the glow plug surface earlier, which reduced ignition delay. For thisreason it was desired to keep the center spray but stop the resulting attachment. Several differentpiston impingement geometries were modeled with CFD. A sharp edge that could break theattachment was a part of each of these geometries. The final geometry chosen was a pin that waspart of the piston. The pin diameter and height were key parameters in allowing the center sprayto be used without attachment to the piston. Other geometries were predicted to be capable ofstopping attachment to the piston. However, these other geometries resulted in a jet thatattached to the cylinder head surface instead . To determine the effects of the increased squishand bowl geometry, the compression ratio was maintained at 15.5:1. Also incorporated into thepiston was an elliptical bowl that was offset to better center combustion around the glow plug.This piston was designed to be used in conjunction with the asymmetric nozzle that had largerorifices that straddled the glow plug. Figure 31 shows the resulting design of the piston.
Page 28
Crank Angle (Degrees)
690 695 700 705 710 715 72002468
101214
Vel
ocity
(m/s
ec)
Squish Velocity
Less Than 20 m/sec
Gas Jet Velocity
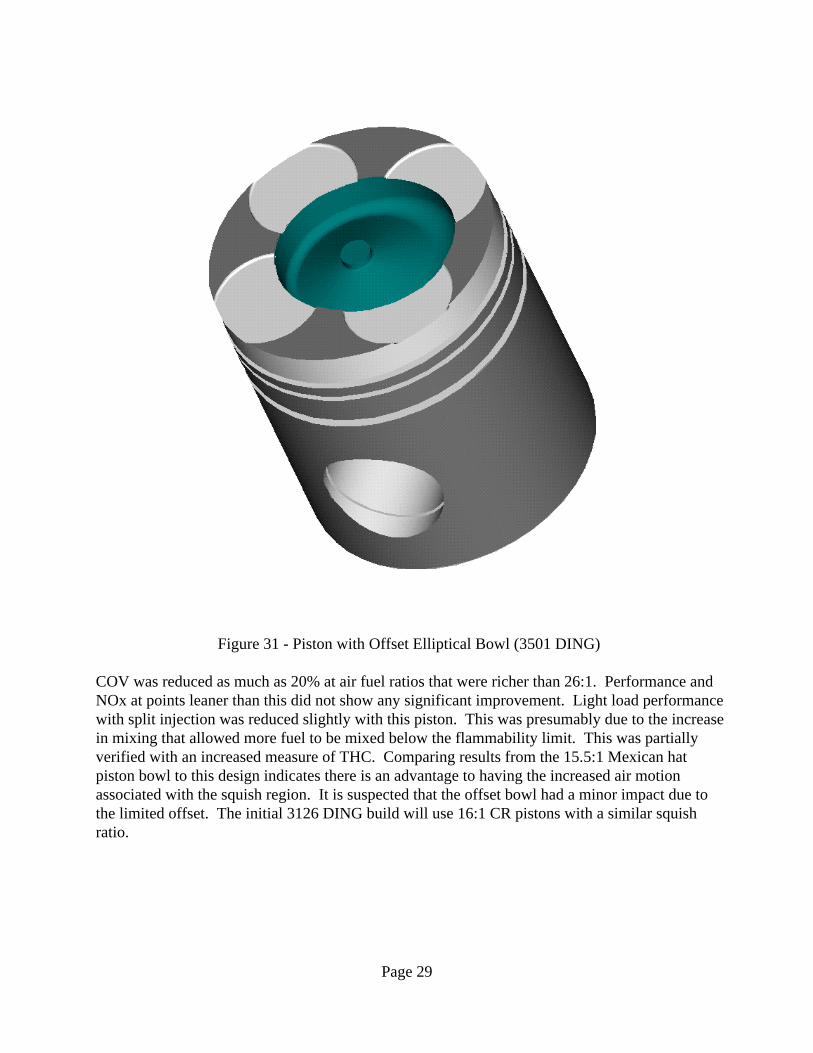
Figure 31 - Piston with Offset Elliptical Bowl (3501 DING)
COV was reduced as much as 20% at air fuel ratios that were richer than 26:1. Performance andNOx at points leaner than this did not show any significant improvement. Light load performancewith split injection was reduced slightly with this piston. This was presumably due to the increasein mixing that allowed more fuel to be mixed below the flammability limit. This was partiallyverified with an increased measure of THC. Comparing results from the 15.5:1 Mexican hatpiston bowl to this design indicates there is an advantage to having the increased air motionassociated with the squish region. It is suspected that the offset bowl had a minor impact due tothe limited offset. The initial 3126 DING build will use 16:1 CR pistons with a similar squishratio.
Page 29

A cylinder head with the glow plug located closer to the injector was procured and tested. Thecloser glow plug decreases the physical time required for the gas jet to reach the glow plug. Thiscan reduce the ignition delay which would help improve COV, light load efficiency, andhydrocarbons. A slight reduction in ignition delay was measured with the new cylinder head.However, glow plug power had increased significantly due to the higher gas velocities by theplug. After comparing the benefit of a slightly shorter ignition delay (.50 to 10) to the decrease inexpected glow plug life, it was decided to return to the original cylinder head to complete the restof the test plans. The closer glow plug could be better optimized with an injector nozzle with alarger separation angle between the jets that straddle the plug. However, this was not availablefor testing at this time. Therefore, the cylinder head was removed and testing was continued withthe original cylinder head.
Split injection has proven to reduce noise and NOx emissions in diesel fueled engines. This is dueto a reduction in the amount of fuel that is premixed and autoignites, which would not be adiffusion controlled burn. The DING engine does not have this rapid initial heat release, evenwith its longer ignition delay. This is due to the fact that the mixture is ignited at a point sourceand the flame must propagate. However, it was thought that a split injection could reduce theamount of fuel in the cylinder before the start of combustion, which in turn, would reduce CO,HC, and COV, and would help the NOx - efficiency trade off. Previously, a mechanical splitinjection was built into the original gas injector. Those early test results indicated there was nobenefit in using the split injection. However, this split was very fast, similar to a diesel split.There was not sufficient time for a significant amount of gas to form a combustible mixture nearthe glow plug or to allow sufficient residence time to ignite the fuel. It was decided that anelectronic split injection may provide better results than the previous mechanical split. Theelectronic split is simply a modification to the controller software. This modification allows avariable pilot quantity of fuel to be injected into the cylinder and pauses a variable amount of timebefore the controller injects the remaining amount of fuel that is needed to maintain engine speed.This was very successful at reducing the light load fuel rate and hydrocarbon problem at low andhigh speeds. In fact, the DING engine was able to closely match the diesel efficiency across theentire load range. This was done without reducing air flow or skip firing, as was done in previousattempts at matching the diesel efficiency. Table 5 shows two points tested with and without thesplit injection.
-32%25%1,750Diesel3.932.1%25%1,750Split426.2%25% 1,750No Split
5.626.3%10%700Split5.320%10%700No Split
BSNOx(g/hp-hr)
Thermal Efficiency (%)
Load(%)
Speed(RPM)
Table 5 - Low Load Efficiency with Split Injection (3501 DING)
Page 30
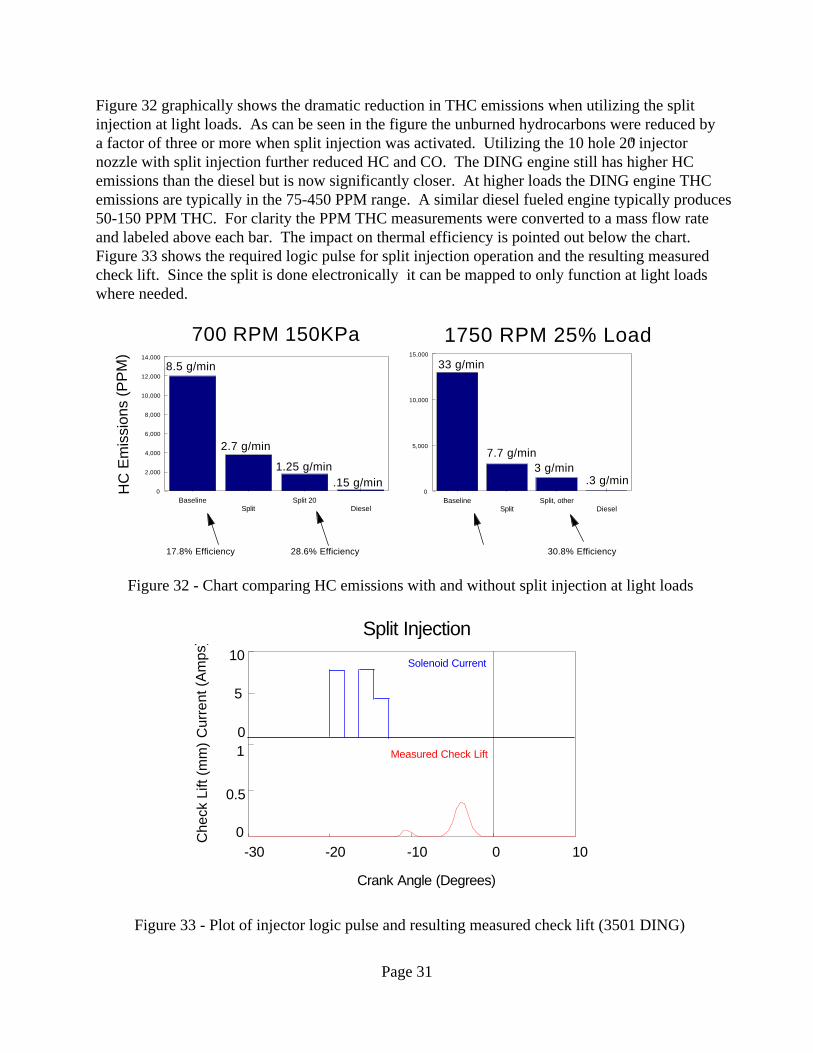
Figure 32 graphically shows the dramatic reduction in THC emissions when utilizing the splitinjection at light loads. As can be seen in the figure the unburned hydrocarbons were reduced bya factor of three or more when split injection was activated. Utilizing the 10 hole 20o injectornozzle with split injection further reduced HC and CO. The DING engine still has higher HCemissions than the diesel but is now significantly closer. At higher loads the DING engine THCemissions are typically in the 75-450 PPM range. A similar diesel fueled engine typically produces50-150 PPM THC. For clarity the PPM THC measurements were converted to a mass flow rateand labeled above each bar. The impact on thermal efficiency is pointed out below the chart.Figure 33 shows the required logic pulse for split injection operation and the resulting measuredcheck lift. Since the split is done electronically it can be mapped to only function at light loadswhere needed.
Figure 32 - Chart comparing HC emissions with and without split injection at light loads
Figure 33 - Plot of injector logic pulse and resulting measured check lift (3501 DING)
Page 31
-30 -20 -10 0 100
0.5
1
Crank Angle (Degrees)
Che
ck L
ift (m
m)
Measured Check Lift
Cur
rent
(Am
ps)
0
Solenoid Current10
5
Split Injection
BaselineSplit
Split 20Diesel
0
2,000
4,000
6,000
8,000
10,000
12,000
14,000
HC
Em
issi
ons
(PP
M)
8.5 g/min
2.7 g/min
1.25 g/min.15 g/min
700 RPM 150KPa
BaselineSplit
Split, otherDiesel
0
5,000
10,000
15,000
1750 RPM 25% Load33 g/min
7.7 g/min
.3 g/min3 g/min
30.8% Efficiency17.8% Efficiency 28.6% Efficiency
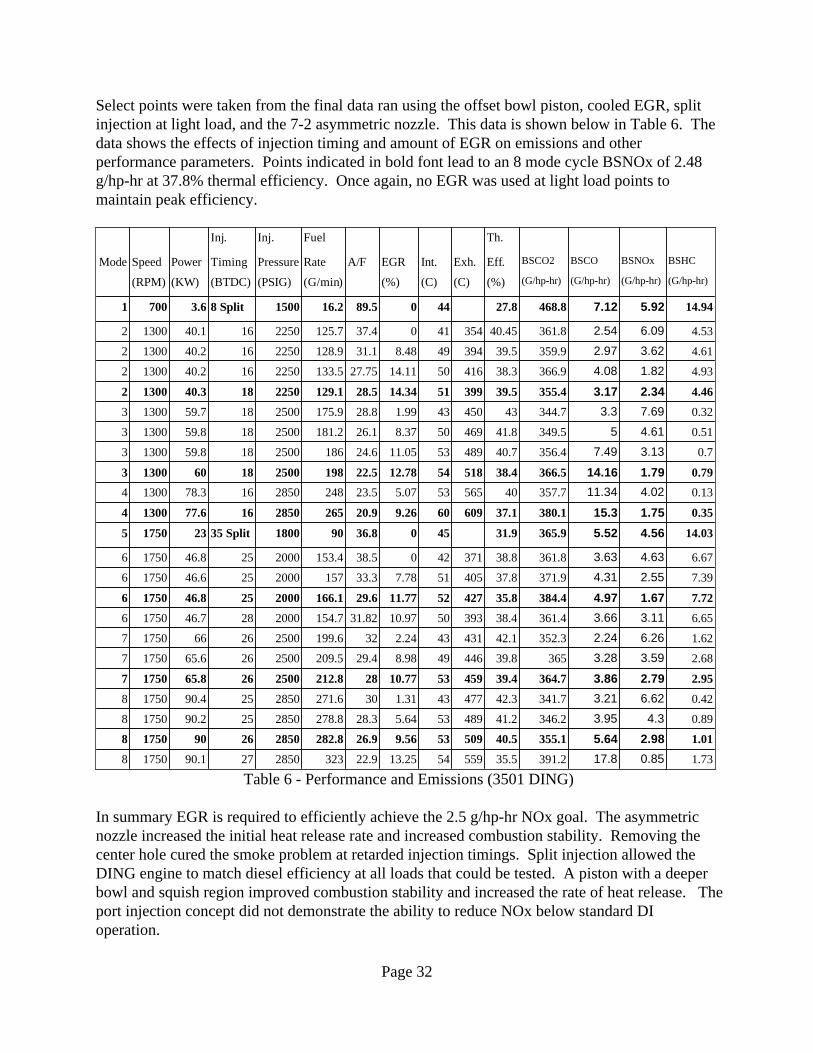
Select points were taken from the final data ran using the offset bowl piston, cooled EGR, splitinjection at light load, and the 7-2 asymmetric nozzle. This data is shown below in Table 6. Thedata shows the effects of injection timing and amount of EGR on emissions and otherperformance parameters. Points indicated in bold font lead to an 8 mode cycle BSNOx of 2.48g/hp-hr at 37.8% thermal efficiency. Once again, no EGR was used at light load points tomaintain peak efficiency.
1.730.8517.8391.235.55595413.2522.932328502790.117508
1.012.985.64355.140.5509539.5626.9282.82850269017508
0.894.33.95346.241.2489535.6428.3278.828502590.217508
0.426.623.21341.742.3477431.3130271.628502590.417508
2.952.793.86364.739.44595310.7728212.825002665.817507
2.683.593.2836539.8446498.9829.4209.525002665.617507
1.626.262.24352.342.1431432.2432199.62500266617507
6.653.113.66361.438.43935010.9731.82154.720002846.717506
7.721.674.97384.435.84275211.7729.6166.120002546.817506
7.392.554.31371.937.8405517.7833.315720002546.617506
6.674.633.63361.838.837142038.5153.420002546.817506
14.034.565.52365.931.945036.890180035 Split2317505
0.351.7515.3380.137.1609609.2620.926528501677.613004
0.134.0211.34357.740565535.0723.524828501678.313004
0.791.7914.16366.538.45185412.7822.51982500186013003
0.73.137.49356.440.74895311.0524.618625001859.813003
0.514.615349.541.8469508.3726.1181.225001859.813003
0.327.693.3344.743450431.9928.8175.925001859.713003
4.462.343.17355.439.53995114.3428.5129.122501840.313002
4.931.824.08366.938.34165014.1127.75133.522501640.213002
4.613.622.97359.939.5394498.4831.1128.922501640.213002
4.536.092.54361.840.4535441037.4125.722501640.113002
14.945.927.12468.827.844089.516.215008 Split3.67001
(G/hp-hr)(G/hp-hr)(G/hp-hr)(G/hp-hr)(%)(C)(C)(%)(G/min)(PSIG)(BTDC)(KW)(RPM)
BSHCBSNOxBSCOBSCO2Eff.Exh.Int.EGRA/FRatePressureTimingPowerSpeedMode
Th.FuelInj.Inj.
Table 6 - Performance and Emissions (3501 DING)
In summary EGR is required to efficiently achieve the 2.5 g/hp-hr NOx goal. The asymmetricnozzle increased the initial heat release rate and increased combustion stability. Removing thecenter hole cured the smoke problem at retarded injection timings. Split injection allowed theDING engine to match diesel efficiency at all loads that could be tested. A piston with a deeperbowl and squish region improved combustion stability and increased the rate of heat release. Theport injection concept did not demonstrate the ability to reduce NOx below standard DIoperation.
Page 32
Bench Tests of Selective Catalyst Reduction to Achieve NOx < 1 g/hp-hr.
Selective catalytic reduction (SCR) is another means of reducing NOx emissions in an exhauststream containing oxygen. Selective catalytic reduction requires injecting a fuel into the catalystbed where a surface reaction occurs converting fuel, oxygen, and NO to N2, CO2, and H2O.Ammonia and ethanol are common fuels to use as a reductant. To eliminate the need to carrytwo fuels, a catalyst that is reactive with the simpler CH4 hydrocarbon is being sought. Severalcatalyst materials have been tested with methane but did not show a significant conversionefficiency. To demonstrate SCR catalyst capabilities, a catalyst sample was tested using ethanolas a reductant with an exhaust stream that matched the concentrations of the DING engine'sexhaust. Conversion efficiencies were above 90%, for almost all testing performed at exhausttemperatures between 350C and 450C. Part of this high conversion efficiency is due to theexhaust stream not containing sulfur, a known catalyst poison. Another part of the highconversion efficiency was due to the formation of nitrogen-containing intermediate gases that arenot measured as NOx. Since these emissions are undesirable as well, follow-on bench tests wereconducted incorporating an oxidation catalyst after the SCR catalyst to ensure NOx was beingcatalyzed to pure nitrogen. The addition of the oxidizing catalyst reduced conversion efficiencyfrom the original 90% to approximately 80%, which is still very good. An experiment was set up to evaluate catalyst performance at various engine operating points aswell as to gain quantitative measurements of what the effects the different exhaust gas specieshave on conversion efficiency. Throughout this testing the reductant ratio was maintained at 3:1,while the space velocity was maintained at 50,000/hr. Figure 34 shows the effect increased waterconcentration has on conversion efficiency. Water in the exhaust increases when the air fuel ratiobecomes richer. This can happen as a result of a decrease in air flow due to utilizing EGR or adecrease in efficiency due to retarding injection timing. Figure 35 demonstrates the effect ofdecreasing the initial NOx (ppm)/exhaust (ppm) ratio. Also shown on Figure 35 is the resultingdecrease in conversion efficiency found when using the oxidizing catalyst. Even when using theoxidizing catalyst conversion efficiencies were as high as 90%. Figures 32 and 33 show theeffects of reducing the amount of oxygen and carbon monoxide in the exhaust stream. NeitherCO or O2 had a large impact on conversion efficiency.
The resulting conversion efficiency of three different fuel/NOx (F/NO) ratios are shown in Figure38. In all the following cases, the fuel used was ethanol. Performance at an F/NO ratio of 1 isvery poor (<45%) over the entire temperature range. At this ratio, there is insufficient ethanolreductant present in the exhaust stream to react with all the NOx present. As the ratio isincreased to 2, the NOx conversion performance improves dramatically with a high of 89%conversion at 350° C. As is typical for this catalyst, performance decreases with increasingtemperature. Increasing the F/NO ratio from 2 to 3 yields a slight improvement in the NOxconversion efficiency (3% at 350° C increasing up to 8.5% at 520° C). However, this is only amarginal improvement in NOx conversion for the extra 50% of ethanol that is being consumed.Engine testing is needed to arrive at the optimum amount of ethanol that should be added toachieve the appropriate balance between NOx conversion performance and operating cost.
Page 33
The effect of F/NO ratio on the performance of the SDS-16 catalyst system at a space velocity of100,000 hr-1 is shown in Figure 39. The same performance trends are present as were observedfor the 50,000 hr-1 space velocity tests. However, the improvement in NOx conversionperformance seen when the ratio is increased from 2 to 3 is greater at 100,000 hr-1 than 50,000hr-1. This trend is likely due to the deNOx reaction being diffusion limited and therefore at thehigher space velocity (i.e. shorter residence time) the additional ethanol provides a greateropportunity for the species to arrive at the catalyst sites.
Figure 40 shows the effect of both space velocity and SO2 presence on the performance of theSDS-16 deNOx catalyst system. All tests were run at an F/NO of 3. In comparing theperformance at the two space velocities, it appears that there is slight improvement (4-6%) in theNOx conversion performance at the lower temperatures (350° and 400° C) for the 50,000 hr-1test. This is understandable since the longer residence time results in an improved chance for theNOx to nitrogen reaction to occur. This trend, however, disappears and then reverses itself as thetemperature increases to 450° and 520° C respectively. At the higher temperatures there is agreater tendency for the SDS-16 catalyst to form the nitrogen containing intermediate species. Atthe lower space velocity, there is a greater quantity of intermediates formed due to the increasedresidence time. These intermediate species are subsequently re-oxidized back to NOx by thedownstream oxidation catalyst and hence are reflected in the overall poorer NOx conversionperformance. The presence of SO2 in the gas stream results in a general reduction of the NOxconversion performance of the SDS-16 DeNOx catalyst system. SO2 tends to adsorb onto thecatalyst sites at lower temperatures (<450° C) and thus inhibit the NOx conversion reaction. Athigher temperatures (>450° C) the SO2 is desorbed and thus the catalyst performs the same as ifthere were no SO2 present. The presence of the SO2 resulted in an overall flattening of the NOxconversion performance to a value of approximately 70 % over the temperature range of350°-520° C. This test does not reflect how the catalyst will perform with exposure to SO2 forextended times. Often there can be permanent catalyst degradation due to long term exposure toSO2. A value of 15 ppm SO2 may be an unrealistically high simulation of what would actually bepresent in engine exhaust since lubricating oil is the only source of SO2 for the DING engine.However, 15 ppm was the lowest achievable limit with the current bench test setup and at thevery least represents a "worst case" scenario.
Page 34

Figure 34 - Effect of H2O on Conversion Efficiency (Bench test data)
Figure 35 - Effect of NOx Concentration on Conversion Efficiency (Bench test data)
Page 35
300 350 400 450 500 55050
60
70
80
90
100
Temperature (C)
NO
x C
onve
rsio
n (%
)
500 ppm
1000 ppm
1500 ppm
1000 ppm w/oxicat
Effect of NOx ConcentrationSDS-16 DeNOx Catalyst
3500 DING engine exhaust conditions, F/NO = 3 (ethanol), SV = 50,000 hr-1, DC530LS (40g Pt) oxicat
NOxconcentration
300 350 400 450 500 55060
70
80
90
100
Temperature (C)
NO
x C
onve
rsio
n (%
)
7%
10%
13%
2%
Effect of Water ConcentrationSDS-16 DeNOx Catalyst
3500 DING engine exhaust conditions, F/NO = 3 (ethanol), SV = 50,000 hr-1
waterconcentration
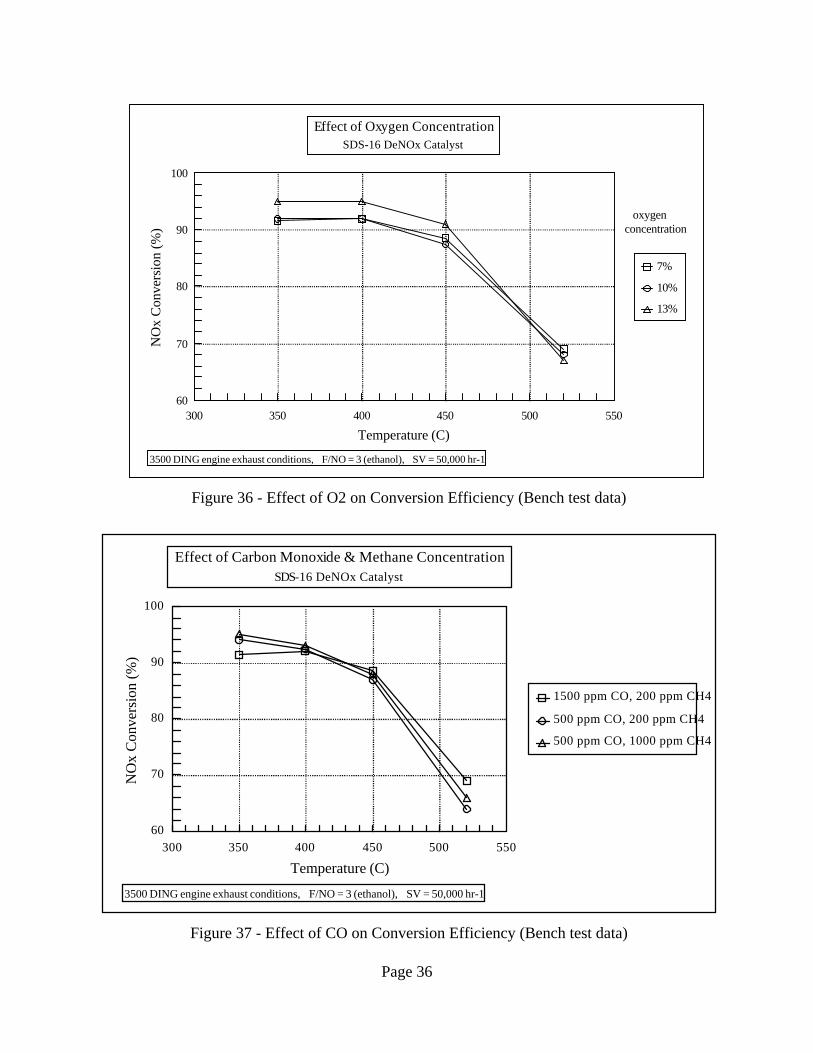
Figure 36 - Effect of O2 on Conversion Efficiency (Bench test data)
Figure 37 - Effect of CO on Conversion Efficiency (Bench test data)
Page 36
300 350 400 450 500 55060
70
80
90
100
Temperature (C)
NO
x C
onve
rsio
n (%
)
1500 ppm CO, 200 ppm CH4
500 ppm CO, 200 ppm CH4
500 ppm CO, 1000 ppm CH4
Effect of Carbon Monoxide & Methane ConcentrationSDS-16 DeNOx Catalyst
3500 DING engine exhaust conditions, F/NO = 3 (ethanol), SV = 50,000 hr-1
300 350 400 450 500 55060
70
80
90
100
Temperature (C)
NO
x C
onve
rsio
n (%
)
7%
10%
13%
Effect of Oxygen ConcentrationSDS-16 DeNOx Catalyst
3500 DING engine exhaust conditions, F/NO = 3 (ethanol), SV = 50,000 hr-1
oxygenconcentration
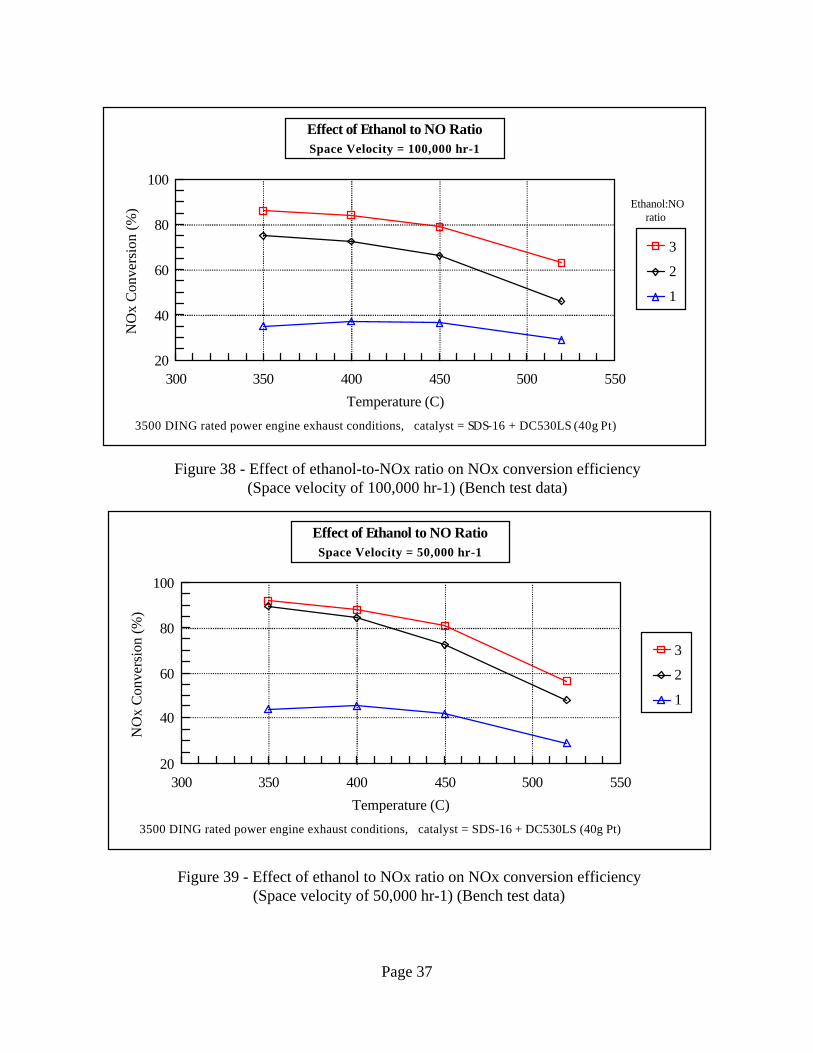
Figure 38 - Effect of ethanol-to-NOx ratio on NOx conversion efficiency (Space velocity of 100,000 hr-1) (Bench test data)
Figure 39 - Effect of ethanol to NOx ratio on NOx conversion efficiency (Space velocity of 50,000 hr-1) (Bench test data)
Page 37
300 350 400 450 500 55020
40
60
80
100
Temperature (C)
NO
x C
onve
rsio
n (%
)
3
2
1
Effect of Ethanol to NO RatioSpace Velocity = 50,000 hr-1
3500 DING rated power engine exhaust conditions, catalyst = SDS-16 + DC530LS (40g Pt)
300 350 400 450 500 55020
40
60
80
100
Temperature (C)
NO
x C
onve
rsio
n (%
)
3
2
1
Effect of Ethanol to NO RatioSpace Velocity = 100,000 hr-1
3500 DING rated power engine exhaust conditions, catalyst = SDS-16 + DC530LS (40g Pt)
Ethanol:NO ratio
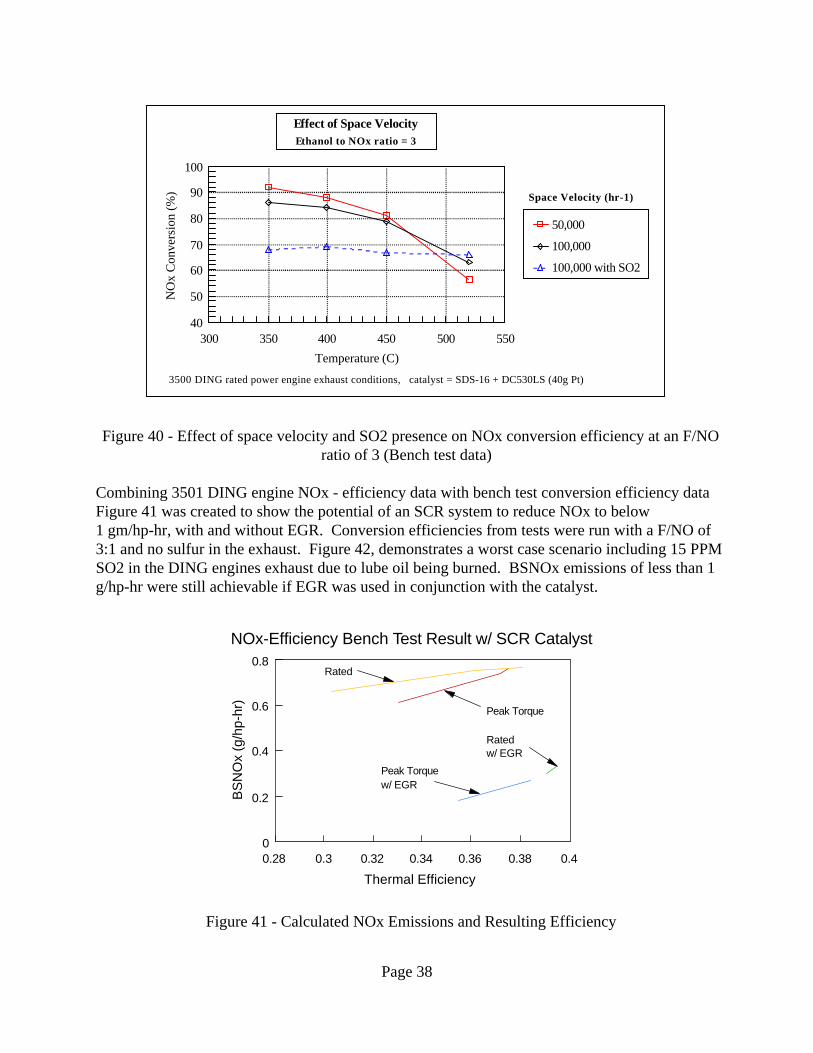
Figure 40 - Effect of space velocity and SO2 presence on NOx conversion efficiency at an F/NOratio of 3 (Bench test data)
Combining 3501 DING engine NOx - efficiency data with bench test conversion efficiency dataFigure 41 was created to show the potential of an SCR system to reduce NOx to below 1 gm/hp-hr, with and without EGR. Conversion efficiencies from tests were run with a F/NO of3:1 and no sulfur in the exhaust. Figure 42, demonstrates a worst case scenario including 15 PPMSO2 in the DING engines exhaust due to lube oil being burned. BSNOx emissions of less than 1g/hp-hr were still achievable if EGR was used in conjunction with the catalyst.
Figure 41 - Calculated NOx Emissions and Resulting Efficiency
Page 38
0.28 0.3 0.32 0.34 0.36 0.38 0.40
0.2
0.4
0.6
0.8
Thermal Efficiency
BS
NO
x (g
/hp-
hr)
Peak Torquew/ EGR
Rated w/ EGR
Rated
Peak Torque
NOx-Efficiency Bench Test Result w/ SCR Catalyst
300 350 400 450 500 55040
50
60
70
80
90
100
Temperature (C)
NO
x C
onve
rsio
n (%
)
50,000
100,000
100,000 with SO2
Effect of Space Velocity Ethanol to NOx ratio = 3
3500 DING rated power engine exhaust conditions, catalyst = SDS-16 + DC530LS (40g Pt)
Space Velocity (hr-1)
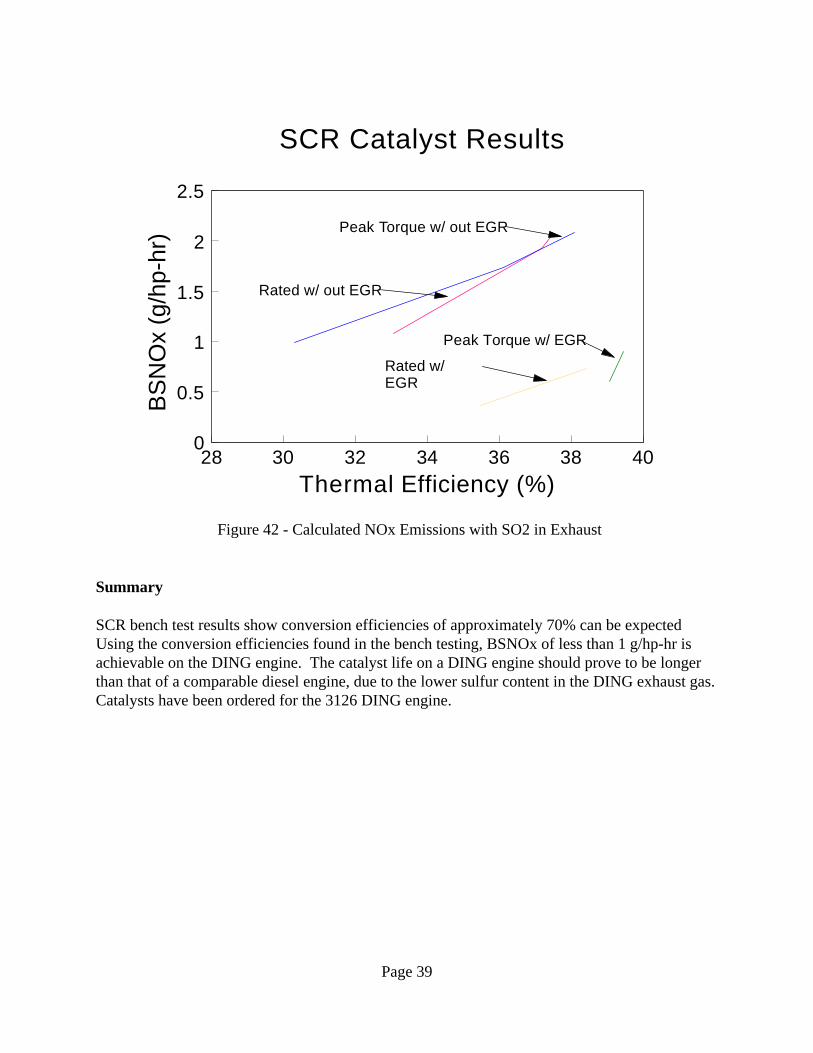
Figure 42 - Calculated NOx Emissions with SO2 in Exhaust
Summary
SCR bench test results show conversion efficiencies of approximately 70% can be expected Using the conversion efficiencies found in the bench testing, BSNOx of less than 1 g/hp-hr isachievable on the DING engine. The catalyst life on a DING engine should prove to be longerthan that of a comparable diesel engine, due to the lower sulfur content in the DING exhaust gas.Catalysts have been ordered for the 3126 DING engine.
Page 39
SCR Catalyst Results
28 30 32 34 36 38 400
0.5
1
1.5
2
2.5
Thermal Efficiency (%)
BS
NO
x (g
/hp-
hr)
Peak Torque w/ EGR
Rated w/ EGR
Peak Torque w/ out EGR
Rated w/ out EGR
Task 3: Durability Development of 3000 psi Fuel Handling System
Sub task 3.1: Demonstrate 3000 psi LNG Pump State-of-the Art
Objective:
In this sub task the subcontractor shall be responsible for demonstrating currently-available 3000psi LNG pumps to determine their suitability for DING engine applications. Thesecurrently-available LNG pumps have not been utilized in vehicular applications. The pumps willbe tested to see if they can handle the continuous operation through transient conditions that isrequired of a vehicular pump. The subcontractor shall investigate the different options, such assubmersing the entire pump/motor assembly in the fuel tank and determine the best design forbench performance evaluation.
Accomplishment Summary:
The planned 3000 psi LNG pump development that was planned in Phase 2 was not performeddue to the inability of the subcontractor (MVE) to perform the work in this time frame. A reporton the state-of -the-art of high-pressure positive displacement cryogenic pumps was performed This includes a history of cryogenic pump designs. Also included are some of the parameterswhich drive the design of the cryogenic pump.
Accomplishment Details
The following pages were taken from a report created by MVE, the subcontractor for this subtask.
Page 40
Page 41
Generic Saturation Curve
050
100150200250300350
-320
-300
-280
-260
-240
-220
-200
-180
Temperature
PS
I
Liquid
Gas
0 5,000 10,000 15,000 20,000
PSI
Tanks
Transfer Pumps
Trifectas
High Pressure Pumps
VHP Pumps
UHP Pumps
HP Transfer Pumps
Pressure Ranges
Principles
High-pressure cryogenic pumps are positive displacement pumps, used to pump a liquid cryogento high pressures, force it through a heater, and then use the resulting gas at high pressures.Typical applications are to fill high-pressure storage systems, such as cylinders and storagetubes. In other cases, the gas is used directly in high-pressure autoclaves, to fracture rockformations in oil wells, etc. High-pressure pumps will pump a variety of cryogenic fluids –from Hydrogen at -432 Deg F to Carbon dioxide at 0 Deg F. Obviously, each fluid has itsparticular problems; oxygen requires special cleaning and materials, hydrogen requires specialinsulation, and CO2 requires judicious selection of materials.
Pressure ranges for high-pressure pumpsrange from approximately 1,200 PSI to16,000 PSI. HP Transfer Pumps and UHPpumps are prohibitively expensive fornormal applications. With the exceptionof certain rocket engine pumps, highpressures are achieved through positivedisplacement pumps.
Positive DisplacementPositive displacement cryogenic pumpsare – essentially – a variation of onedesign. Pumps have pistons with ringswithin a cylinder, inlet and outlet valves,and some mechanism to push the piston inand out of the cylinder. Most pumps havepiston packing that prevents the cryogen
from bleeding past the piston to the outside. Some recent pumps have intermediate compressionstrokes.
Pump output is a function of piston diameter,stroke, and speed (otherwise known as liquiddisplacement). Typically, pump manufacturerswill standardize on a piston diameter andstroke, and vary the speed to displace more orless fluid over a given unit of time. There is alimited range of adjustment – too slow and toomuch product seeps by the rings – too fast andnot enough fluid can enter the cylinder throughthe inlet valve.
Figure 43
Figure 44
Page 42
There are three basic challenges in positive displacement pumps for cryogens:
1. The fluid that is being pumped is almost always on the verge of boiling – “flashing” - tovapor.
2. Low lubricity of liquid cryogens – CO2 even acts as a solvent and degreaser.
3. Dealing with atmospheric and ambient conditions while pumping at cryogenictemperatures.
Cryogenic fluids are in a state of equilibrium with pressure and temperature. If the pressure on afluid is reduced, it will boil to cool until it is in equilibrium with the lowered pressure.Conversely, a cryogenic liquid will not boil until the temperature of the liquid is in equilibriumwith the increased pressure.
The challenge in positive displacement cryogenic pumps is to prevent the fluid from flashing intovapor as it enters into the cylinder on the suction stroke. Subcooling1, artificial pressure heads,and two stage pumps are used to ensure that the liquid does not flash into vapor. When flashingdoes occur, and the pump goes into cavitation, catastrophic damage to the drive train may occur.
Cryogenic liquid has a relatively low viscosity. This is typically a problem when dealing withwearing of parts such as packing and piston rings. Effective pump designs must address and dealwith this issue with specific material selection that may provide greater resistance to wear andsome added lubricity.
Since most cryogenic liquid boils well below the normal ambient temperature, any added heatdue to operational conditions (such as pump cavitation or advance component wear) mayprohibit the pump from performing in the normal manner. This condition, if left in a prolongedstate, may provide aggressive wear and excessive damage to the pump.
US Manufacturers
The PredecessorsCryogenic pumps have been in use for a considerable length of time. Initially, cryogenic pumpswere built into the cold boxes of Air Separation Units (ASU), and the product was pumped out ofthe rectification column through a vaporizer into high-pressure cylinders. The liquid goingthrough the vaporizer was used to help cool incoming air to make the operation of the ASU moreefficient. Withdrawal from the column was controlled by the speed of the pump.
As distribution systems were set up, liquid was shipped from increasingly larger – and thus moreefficient - ASU’s to storage tanks. Major gas producers – AIRCO, Air Products, LiquidCarbonic, Linde, NCG, etc. developed versions of cryogenic pumps that could operate fromstorage vessels. Gradually, various designs were weeded out – largely due to cost. Current
1 To bring a fluid below the saturation curve of the particular cryogen. It is done either by maintaining the samepressure and cooling the liquid, or maintaining the same temperature and raising the pressure - or a combinationof both.
Page 43
pump technology – though not mature – has not been very innovative. Advances typically arelimited to small improvements in sealing materials.
Airco Cryogenics
Airco Cryogenics was what could be considered the originator of the low cost positivedisplacement cylinder filling pump. Designed by Paul Duran, the pump was a small, very highpiston speed pump. Piston shaft seals were “hat seals” made of Teflon™ gaskets supported bymetal supports. Airco Cryogenics resulted in two spin-off companies – Cryo-Mech and CCI.AIRCO Cryogenics was later divested to become ACD. The European division was notdivested, and now operates under the name of CryoStar. Reported MTBF’s of the Paul pump isaround 560 hours.
Figure 45
Figure 46
Page 44
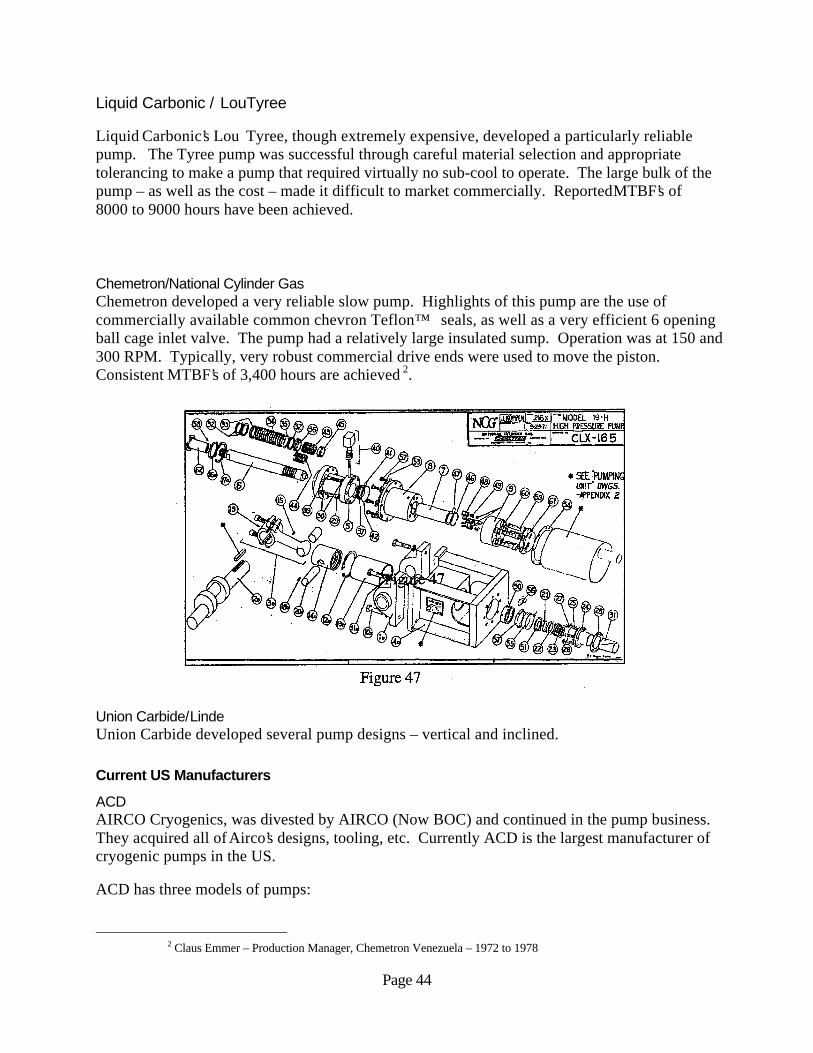
Liquid Carbonic / LouTyree
Liquid Carbonic’s Lou Tyree, though extremely expensive, developed a particularly reliablepump. The Tyree pump was successful through careful material selection and appropriatetolerancing to make a pump that required virtually no sub-cool to operate. The large bulk of thepump – as well as the cost – made it difficult to market commercially. Reported MTBF’s of8000 to 9000 hours have been achieved.
Chemetron/National Cylinder GasChemetron developed a very reliable slow pump. Highlights of this pump are the use ofcommercially available common chevron Teflon™ seals, as well as a very efficient 6 openingball cage inlet valve. The pump had a relatively large insulated sump. Operation was at 150 and300 RPM. Typically, very robust commercial drive ends were used to move the piston.Consistent MTBF’s of 3,400 hours are achieved 2.
Union Carbide/LindeUnion Carbide developed several pump designs – vertical and inclined.
Current US Manufacturers
ACDAIRCO Cryogenics, was divested by AIRCO (Now BOC) and continued in the pump business.They acquired all of Airco’s designs, tooling, etc. Currently ACD is the largest manufacturer ofcryogenic pumps in the US.
ACD has three models of pumps:
2 Claus Emmer – Production Manager, Chemetron Venezuela – 1972 to 1978
Figure 47
Figure 47
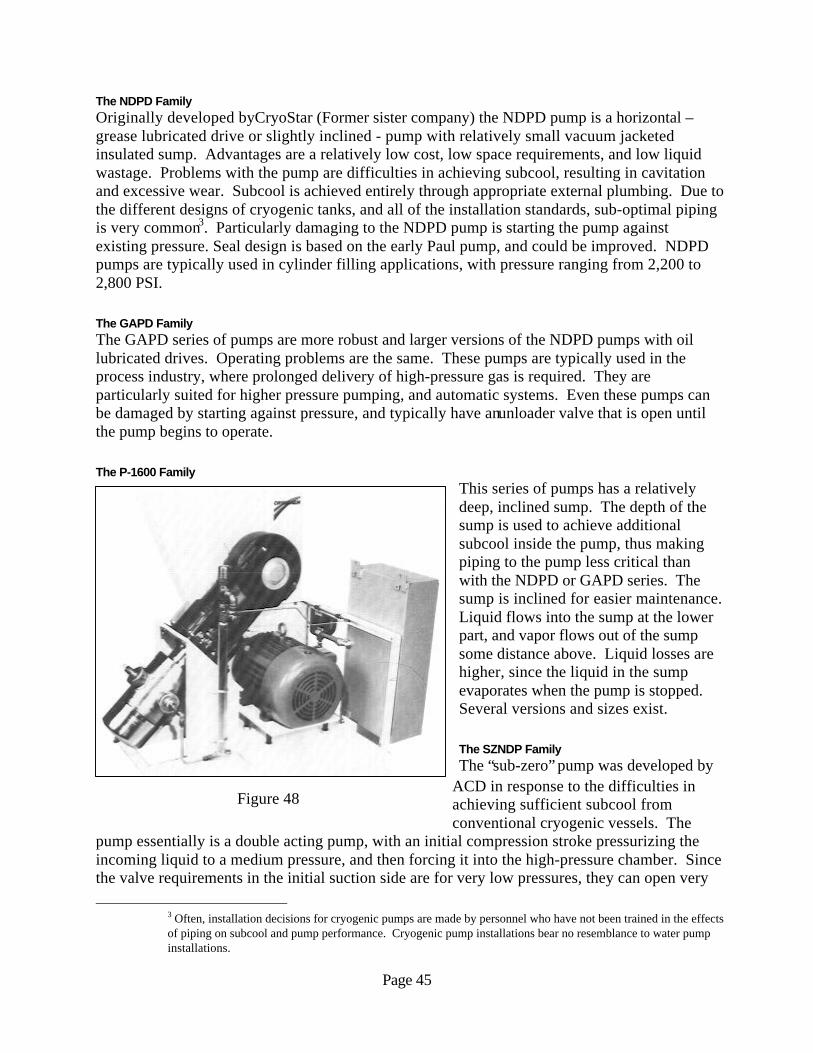
Page 45
The NDPD FamilyOriginally developed by CryoStar (Former sister company) the NDPD pump is a horizontal –grease lubricated drive or slightly inclined - pump with relatively small vacuum jacketedinsulated sump. Advantages are a relatively low cost, low space requirements, and low liquidwastage. Problems with the pump are difficulties in achieving subcool, resulting in cavitationand excessive wear. Subcool is achieved entirely through appropriate external plumbing. Due tothe different designs of cryogenic tanks, and all of the installation standards, sub-optimal pipingis very common3. Particularly damaging to the NDPD pump is starting the pump againstexisting pressure. Seal design is based on the early Paul pump, and could be improved. NDPDpumps are typically used in cylinder filling applications, with pressure ranging from 2,200 to2,800 PSI.
The GAPD FamilyThe GAPD series of pumps are more robust and larger versions of the NDPD pumps with oillubricated drives. Operating problems are the same. These pumps are typically used in theprocess industry, where prolonged delivery of high-pressure gas is required. They areparticularly suited for higher pressure pumping, and automatic systems. Even these pumps canbe damaged by starting against pressure, and typically have an unloader valve that is open untilthe pump begins to operate.
The P-1600 FamilyThis series of pumps has a relativelydeep, inclined sump. The depth of thesump is used to achieve additionalsubcool inside the pump, thus makingpiping to the pump less critical thanwith the NDPD or GAPD series. Thesump is inclined for easier maintenance.Liquid flows into the sump at the lowerpart, and vapor flows out of the sumpsome distance above. Liquid losses arehigher, since the liquid in the sumpevaporates when the pump is stopped.Several versions and sizes exist.
The SZNDP FamilyThe “sub-zero” pump was developed by
ACD in response to the difficulties inachieving sufficient subcool fromconventional cryogenic vessels. The
pump essentially is a double acting pump, with an initial compression stroke pressurizing theincoming liquid to a medium pressure, and then forcing it into the high-pressure chamber. Sincethe valve requirements in the initial suction side are for very low pressures, they can open very
3 Often, installation decisions for cryogenic pumps are made by personnel who have not been trained in the effectsof piping on subcool and pump performance. Cryogenic pump installations bear no resemblance to water pumpinstallations.
Figure 48
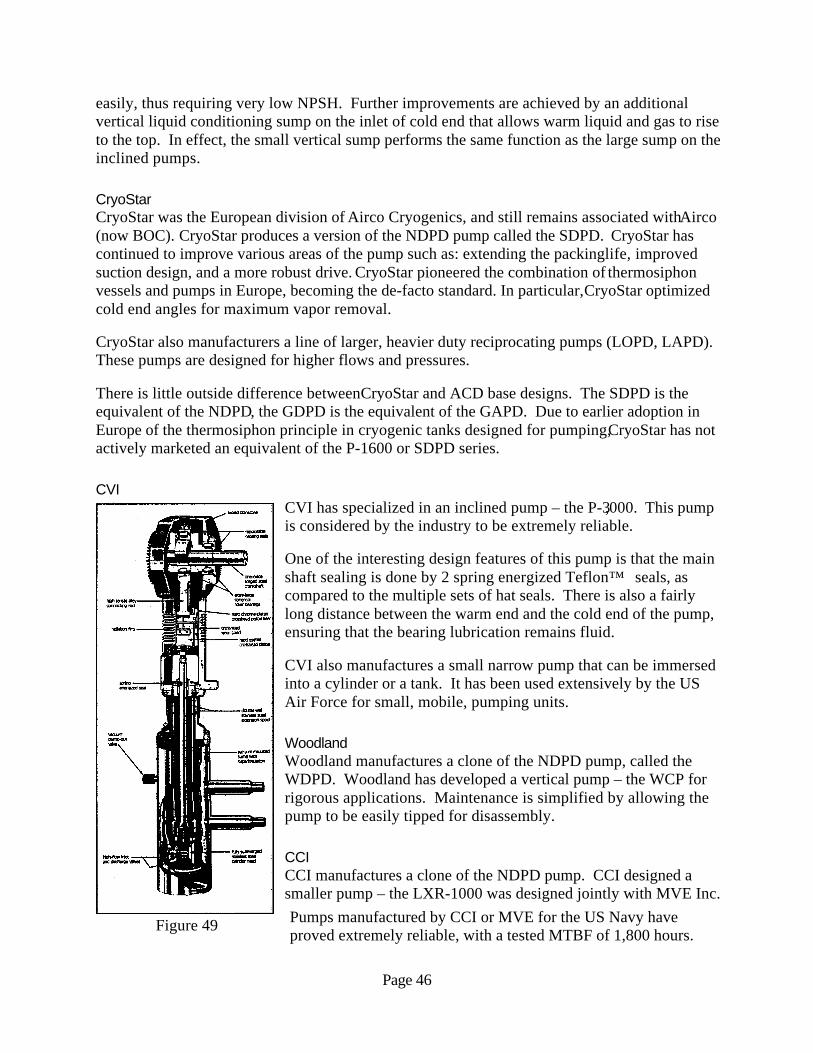
Page 46
easily, thus requiring very low NPSH. Further improvements are achieved by an additionalvertical liquid conditioning sump on the inlet of cold end that allows warm liquid and gas to riseto the top. In effect, the small vertical sump performs the same function as the large sump on theinclined pumps.
CryoStarCryoStar was the European division of Airco Cryogenics, and still remains associated with Airco(now BOC). CryoStar produces a version of the NDPD pump called the SDPD. CryoStar hascontinued to improve various areas of the pump such as: extending the packing life, improvedsuction design, and a more robust drive. CryoStar pioneered the combination of thermosiphonvessels and pumps in Europe, becoming the de-facto standard. In particular, CryoStar optimizedcold end angles for maximum vapor removal.
CryoStar also manufacturers a line of larger, heavier duty reciprocating pumps (LOPD, LAPD).These pumps are designed for higher flows and pressures.
There is little outside difference between CryoStar and ACD base designs. The SDPD is theequivalent of the NDPD, the GDPD is the equivalent of the GAPD. Due to earlier adoption inEurope of the thermosiphon principle in cryogenic tanks designed for pumping, CryoStar has notactively marketed an equivalent of the P-1600 or SDPD series.
CVICVI has specialized in an inclined pump – the P-3,000. This pumpis considered by the industry to be extremely reliable.
One of the interesting design features of this pump is that the mainshaft sealing is done by 2 spring energized Teflon™ seals, ascompared to the multiple sets of hat seals. There is also a fairlylong distance between the warm end and the cold end of the pump,ensuring that the bearing lubrication remains fluid.
CVI also manufactures a small narrow pump that can be immersedinto a cylinder or a tank. It has been used extensively by the USAir Force for small, mobile, pumping units.
WoodlandWoodland manufactures a clone of the NDPD pump, called theWDPD. Woodland has developed a vertical pump – the WCP forrigorous applications. Maintenance is simplified by allowing thepump to be easily tipped for disassembly.
CCICCI manufactures a clone of the NDPD pump. CCI designed asmaller pump – the LXR-1000 was designed jointly with MVE Inc.Pumps manufactured by CCI or MVE for the US Navy haveproved extremely reliable, with a tested MTBF of 1,800 hours.Figure 49
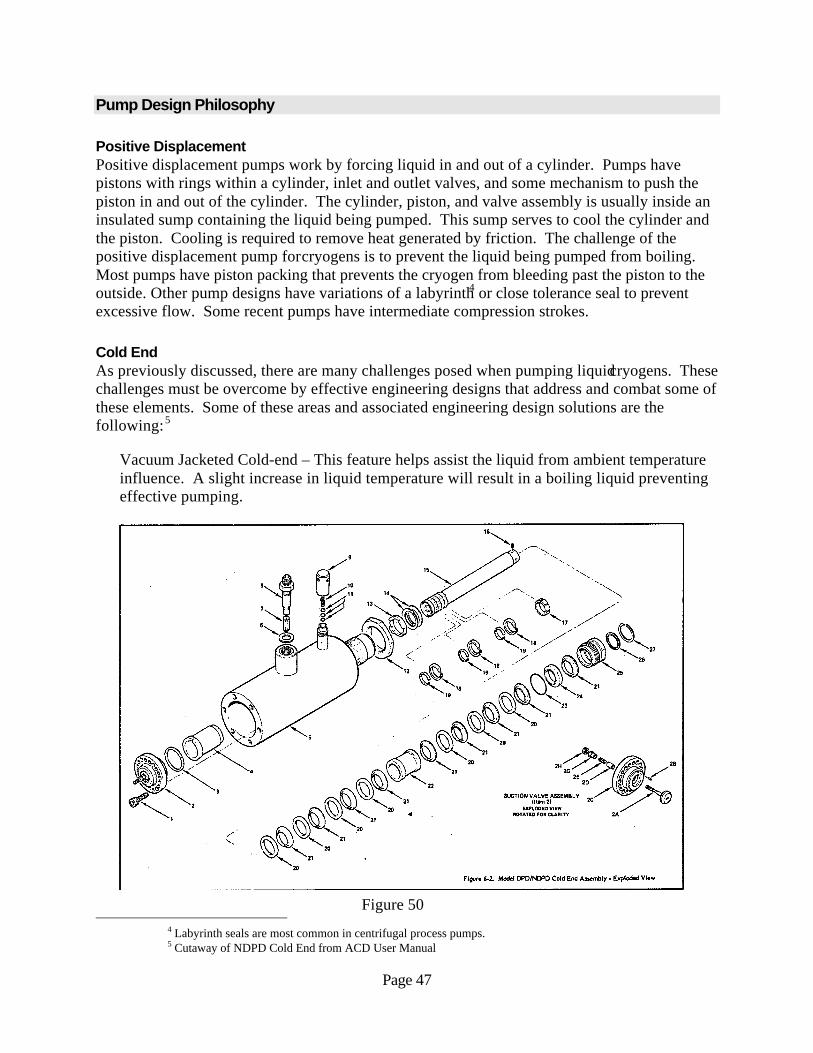
Page 47
Pump Design Philosophy
Positive DisplacementPositive displacement pumps work by forcing liquid in and out of a cylinder. Pumps havepistons with rings within a cylinder, inlet and outlet valves, and some mechanism to push thepiston in and out of the cylinder. The cylinder, piston, and valve assembly is usually inside aninsulated sump containing the liquid being pumped. This sump serves to cool the cylinder andthe piston. Cooling is required to remove heat generated by friction. The challenge of thepositive displacement pump for cryogens is to prevent the liquid being pumped from boiling.Most pumps have piston packing that prevents the cryogen from bleeding past the piston to theoutside. Other pump designs have variations of a labyrinth4 or close tolerance seal to preventexcessive flow. Some recent pumps have intermediate compression strokes.
Cold EndAs previously discussed, there are many challenges posed when pumping liquid cryogens. Thesechallenges must be overcome by effective engineering designs that address and combat some ofthese elements. Some of these areas and associated engineering design solutions are thefollowing: 5
• Vacuum Jacketed Cold-end – This feature helps assist the liquid from ambient temperatureinfluence. A slight increase in liquid temperature will result in a boiling liquid preventingeffective pumping.
4 Labyrinth seals are most common in centrifugal process pumps.5 Cutaway of NDPD Cold End from ACD User Manual
Figure 50
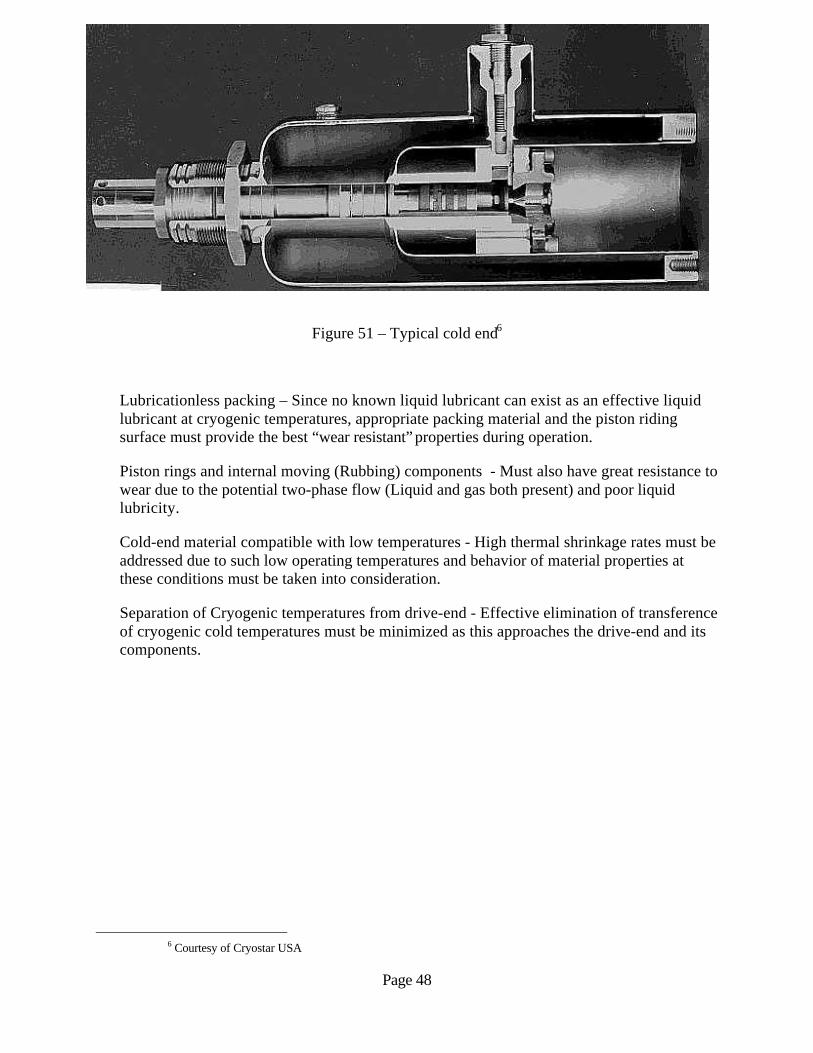
Page 48
Figure 51 – Typical cold end6
• Lubricationless packing – Since no known liquid lubricant can exist as an effective liquidlubricant at cryogenic temperatures, appropriate packing material and the piston ridingsurface must provide the best “wear resistant” properties during operation.
• Piston rings and internal moving (Rubbing) components - Must also have great resistance towear due to the potential two-phase flow (Liquid and gas both present) and poor liquidlubricity.
• Cold-end material compatible with low temperatures - High thermal shrinkage rates must beaddressed due to such low operating temperatures and behavior of material properties atthese conditions must be taken into consideration.
• Separation of Cryogenic temperatures from drive-end - Effective elimination of transferenceof cryogenic cold temperatures must be minimized as this approaches the drive-end and itscomponents.
6 Courtesy of Cryostar USA
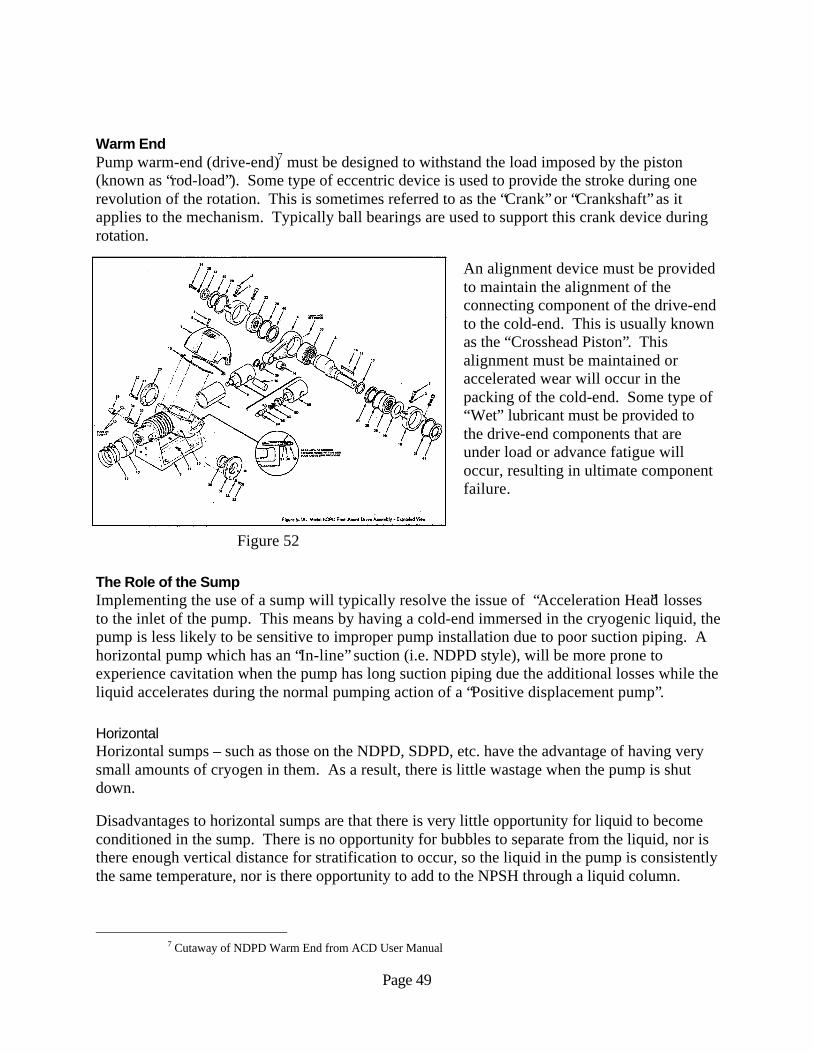
Page 49
Warm EndPump warm-end (drive-end)7 must be designed to withstand the load imposed by the piston(known as “rod-load”). Some type of eccentric device is used to provide the stroke during onerevolution of the rotation. This is sometimes referred to as the “Crank” or “Crankshaft” as itapplies to the mechanism. Typically ball bearings are used to support this crank device duringrotation.
An alignment device must be providedto maintain the alignment of theconnecting component of the drive-endto the cold-end. This is usually knownas the “Crosshead Piston”. Thisalignment must be maintained oraccelerated wear will occur in thepacking of the cold-end. Some type of“Wet” lubricant must be provided tothe drive-end components that areunder load or advance fatigue willoccur, resulting in ultimate componentfailure.
The Role of the SumpImplementing the use of a sump will typically resolve the issue of “Acceleration Head” lossesto the inlet of the pump. This means by having a cold-end immersed in the cryogenic liquid, thepump is less likely to be sensitive to improper pump installation due to poor suction piping. Ahorizontal pump which has an “In-line” suction (i.e. NDPD style), will be more prone toexperience cavitation when the pump has long suction piping due the additional losses while theliquid accelerates during the normal pumping action of a “Positive displacement pump”.
HorizontalHorizontal sumps – such as those on the NDPD, SDPD, etc. have the advantage of having verysmall amounts of cryogen in them. As a result, there is little wastage when the pump is shutdown.
Disadvantages to horizontal sumps are that there is very little opportunity for liquid to becomeconditioned in the sump. There is no opportunity for bubbles to separate from the liquid, nor isthere enough vertical distance for stratification to occur, so the liquid in the pump is consistentlythe same temperature, nor is there opportunity to add to the NPSH through a liquid column.
7 Cutaway of NDPD Warm End from ACD User Manual
Figure 52
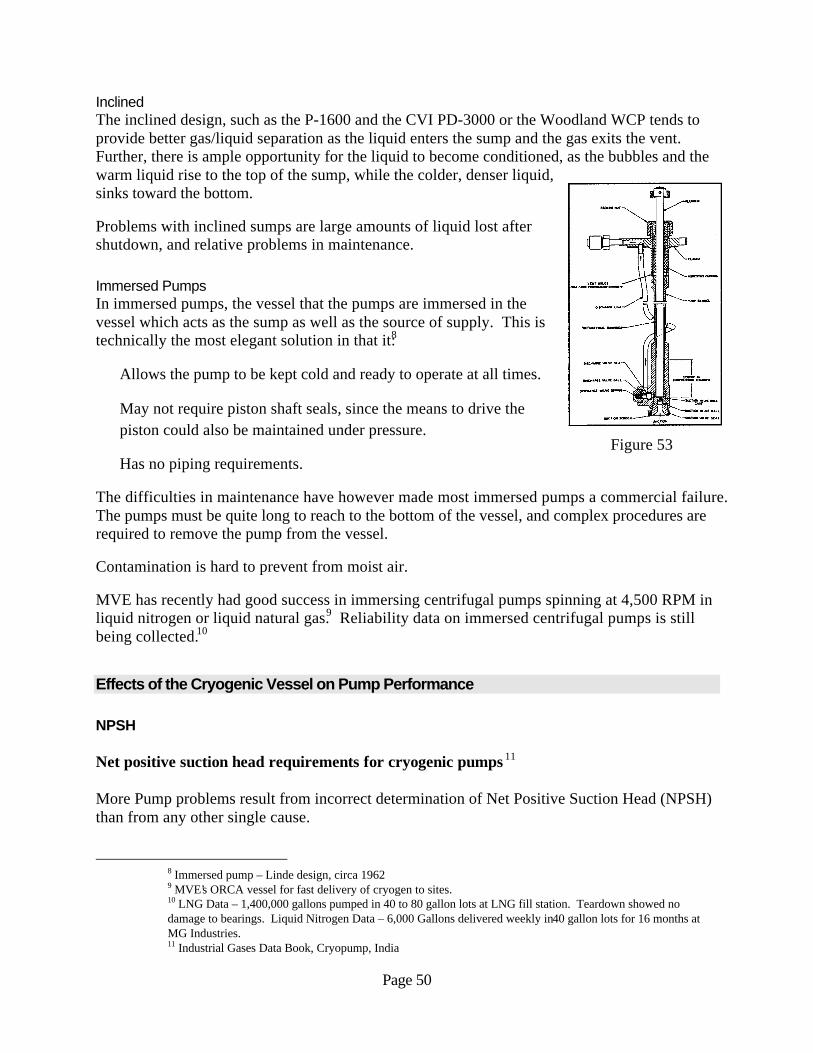
Page 50
InclinedThe inclined design, such as the P-1600 and the CVI PD-3000 or the Woodland WCP tends toprovide better gas/liquid separation as the liquid enters the sump and the gas exits the vent.Further, there is ample opportunity for the liquid to become conditioned, as the bubbles and thewarm liquid rise to the top of the sump, while the colder, denser liquid,sinks toward the bottom.
Problems with inclined sumps are large amounts of liquid lost aftershutdown, and relative problems in maintenance.
Immersed PumpsIn immersed pumps, the vessel that the pumps are immersed in thevessel which acts as the sump as well as the source of supply. This istechnically the most elegant solution in that it:8
• Allows the pump to be kept cold and ready to operate at all times.
• May not require piston shaft seals, since the means to drive thepiston could also be maintained under pressure.
• Has no piping requirements.
The difficulties in maintenance have however made most immersed pumps a commercial failure.The pumps must be quite long to reach to the bottom of the vessel, and complex procedures arerequired to remove the pump from the vessel.
Contamination is hard to prevent from moist air.
MVE has recently had good success in immersing centrifugal pumps spinning at 4,500 RPM inliquid nitrogen or liquid natural gas.9 Reliability data on immersed centrifugal pumps is stillbeing collected.10
Effects of the Cryogenic Vessel on Pump Performance
NPSH
Net positive suction head requirements for cryogenic pumps 11
More Pump problems result from incorrect determination of Net Positive Suction Head (NPSH)than from any other single cause.
8 Immersed pump – Linde design, circa 19629 MVE’s ORCA vessel for fast delivery of cryogen to sites.10 LNG Data – 1,400,000 gallons pumped in 40 to 80 gallon lots at LNG fill station. Teardown showed nodamage to bearings. Liquid Nitrogen Data – 6,000 Gallons delivered weekly in 40 gallon lots for 16 months atMG Industries.11 Industrial Gases Data Book, Cryopump, India
Figure 53
Page 51
Liquids at any temperature above their freezing have a corresponding vapor pressure that mustbe taken into account when planning a pumping system. NPSH can be defined as the differencebetween the actual pressure and the vapor pressure of the liquid at the suction port of the pump.This is also sometimes referred to as “sub-cooling'' or super pressure
While sitting idle, the liquid in a storage vessel will gradually absorb heat and, with all the ventsclosed, will generate pressures that are directly related to the temperature of the liquid. Thesepressures are called the ''saturated vapor pressure.'' This saturated condition exists as long as theliquid is at its boiling point for any given pressure in the vessel. The important point to rememberis that no matter what the tank pressure is, any reduction in pressure will cause the saturatedliquid to boil.
No cryogenic pump can operate on saturated liquid since in order to establish flow into the pumpsuction there must be lower pressure in the pump. This pressure drop causes the saturated liquidto boil, and the resultant vapors enter the pump causing it to cavitate and loose prime.
To prevent cavitation, some NPSH must be provided to the pump. The amount of minimumNPSH varies with size, type and make of pump, and is generally indicated on the nameplate. TheNPSH can be provided by static head, or elevation of liquid above the pump suction and/or bybuilding an artificial pressure in the supply tank with a pressure building coil. This artificialpressure must be maintained throughout the pumping cycle to insure proper and efficient pumpoperation.
It is easy to lose, or offset, this ''artificial'' pressure or liquid head, by warming the liquid in thesuction line to the pump by heat from the atmosphere. It is possible to have a high ''superpressure'' in the storage lank so that the liquid is highly subcooled and still have saturated liquidat the pump suction. To prevent this, pump suction lines should be short and well insulated.
One important factor that must be recognized is that the condition of ... liquid products are veryfrequently near the boiling point.12
“A simple statement of what is necessary to make pumps operate is "the pressure pushing theliquid into the pump must be great enough to
a) Overcome the frictional and turbulent pressure losses in the suction pathb) Accelerate the movement of liquid product into the compression chamberc) Lift the suction valve.d) Have enough pressure left to keep the liquid from boiling when it enters the compression
chamber
Unless these requirements are fulfilled the pump will not operate satisfactorily even though thepump is in perfect mechanical condition.”“... pressure is needed to fill the compression chamber while the pump is on the suction part ofthe stroke. The faster the pump runs the faster the liquid has to accelerate and move to be surethe compression chamber is full when the compression part of the stroke is started. A pump,
12 1962 Linde Distribution Equipment Manual:
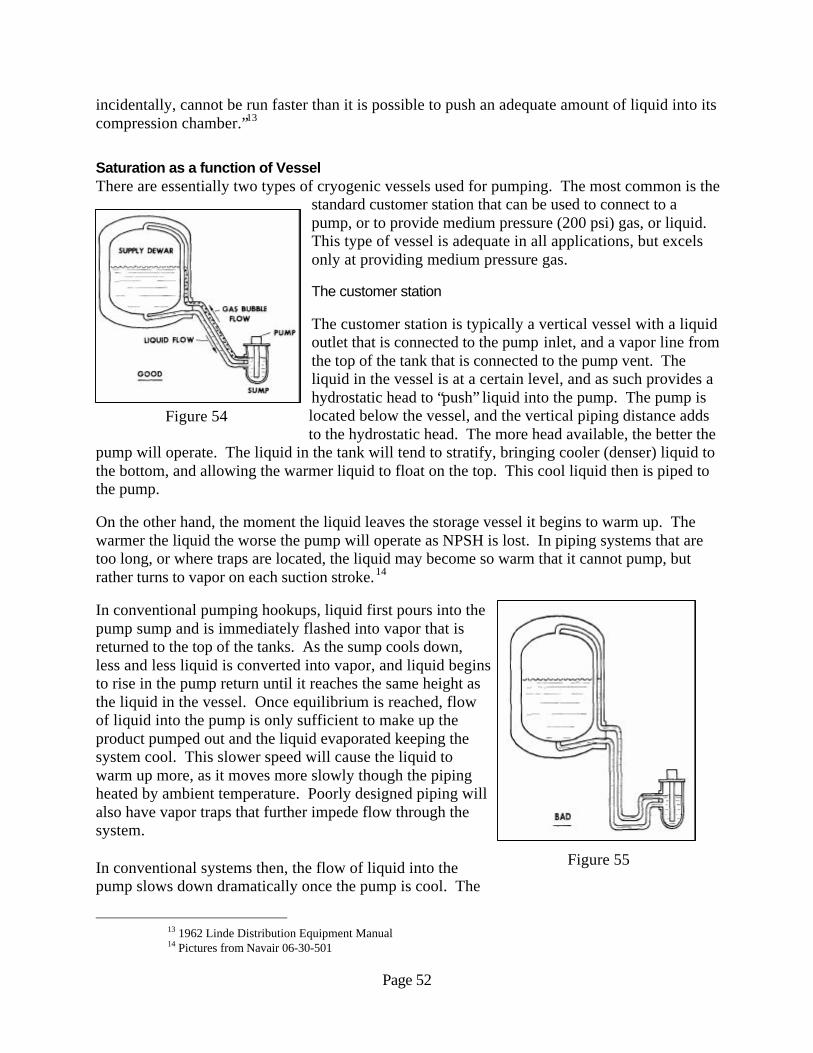
Page 52
incidentally, cannot be run faster than it is possible to push an adequate amount of liquid into itscompression chamber.”13
Saturation as a function of VesselThere are essentially two types of cryogenic vessels used for pumping. The most common is the
standard customer station that can be used to connect to apump, or to provide medium pressure (200 psi) gas, or liquid.This type of vessel is adequate in all applications, but excelsonly at providing medium pressure gas.
The customer station
The customer station is typically a vertical vessel with a liquidoutlet that is connected to the pump inlet, and a vapor line fromthe top of the tank that is connected to the pump vent. Theliquid in the vessel is at a certain level, and as such provides ahydrostatic head to “push” liquid into the pump. The pump islocated below the vessel, and the vertical piping distance addsto the hydrostatic head. The more head available, the better the
pump will operate. The liquid in the tank will tend to stratify, bringing cooler (denser) liquid tothe bottom, and allowing the warmer liquid to float on the top. This cool liquid then is piped tothe pump.
On the other hand, the moment the liquid leaves the storage vessel it begins to warm up. Thewarmer the liquid the worse the pump will operate as NPSH is lost. In piping systems that aretoo long, or where traps are located, the liquid may become so warm that it cannot pump, butrather turns to vapor on each suction stroke.14
In conventional pumping hookups, liquid first pours into thepump sump and is immediately flashed into vapor that isreturned to the top of the tanks. As the sump cools down,less and less liquid is converted into vapor, and liquid beginsto rise in the pump return until it reaches the same height asthe liquid in the vessel. Once equilibrium is reached, flowof liquid into the pump is only sufficient to make up theproduct pumped out and the liquid evaporated keeping thesystem cool. This slower speed will cause the liquid towarm up more, as it moves more slowly though the pipingheated by ambient temperature. Poorly designed piping willalso have vapor traps that further impede flow through thesystem.
In conventional systems then, the flow of liquid into thepump slows down dramatically once the pump is cool. The
13 1962 Linde Distribution Equipment Manual14 Pictures from Navair 06-30-501
Figure 54
Figure 55
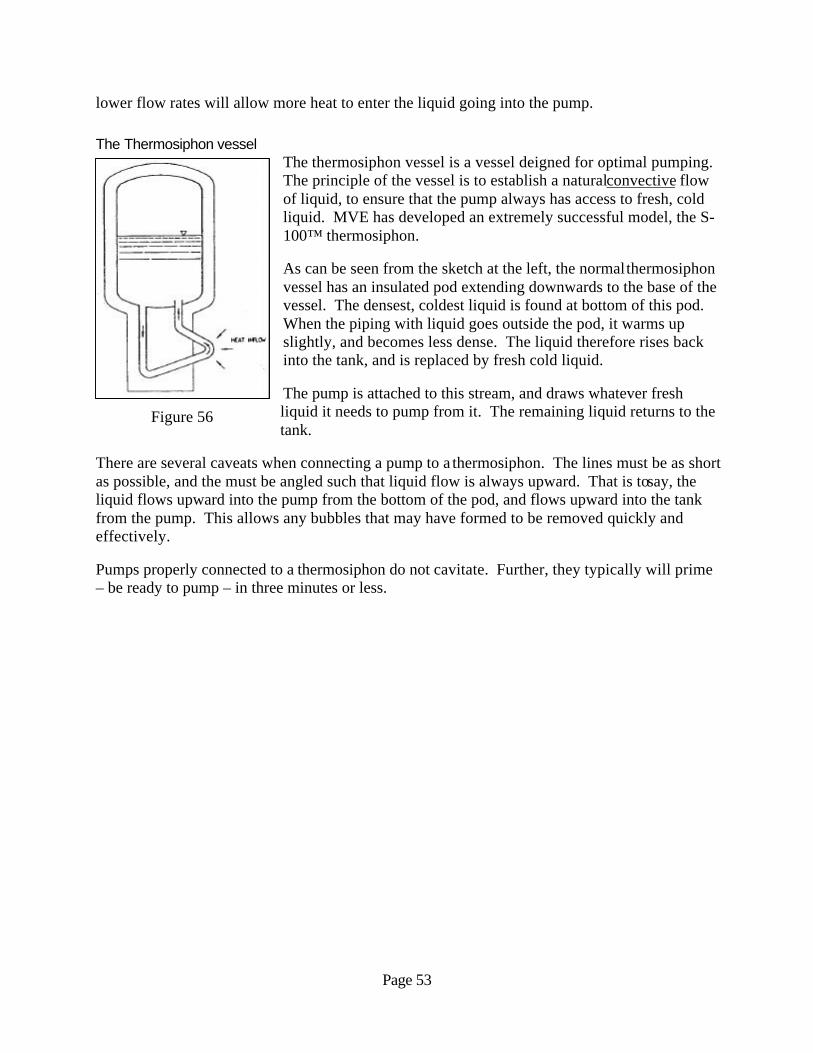
Page 53
lower flow rates will allow more heat to enter the liquid going into the pump.
The Thermosiphon vesselThe thermosiphon vessel is a vessel deigned for optimal pumping.The principle of the vessel is to establish a natural convective flowof liquid, to ensure that the pump always has access to fresh, coldliquid. MVE has developed an extremely successful model, the S-100™ thermosiphon.
As can be seen from the sketch at the left, the normal thermosiphonvessel has an insulated pod extending downwards to the base of thevessel. The densest, coldest liquid is found at bottom of this pod.When the piping with liquid goes outside the pod, it warms upslightly, and becomes less dense. The liquid therefore rises backinto the tank, and is replaced by fresh cold liquid.
The pump is attached to this stream, and draws whatever freshliquid it needs to pump from it. The remaining liquid returns to thetank.
There are several caveats when connecting a pump to a thermosiphon. The lines must be as shortas possible, and the must be angled such that liquid flow is always upward. That is to say, theliquid flows upward into the pump from the bottom of the pod, and flows upward into the tankfrom the pump. This allows any bubbles that may have formed to be removed quickly andeffectively.
Pumps properly connected to a thermosiphon do not cavitate. Further, they typically will prime– be ready to pump – in three minutes or less.
Figure 56
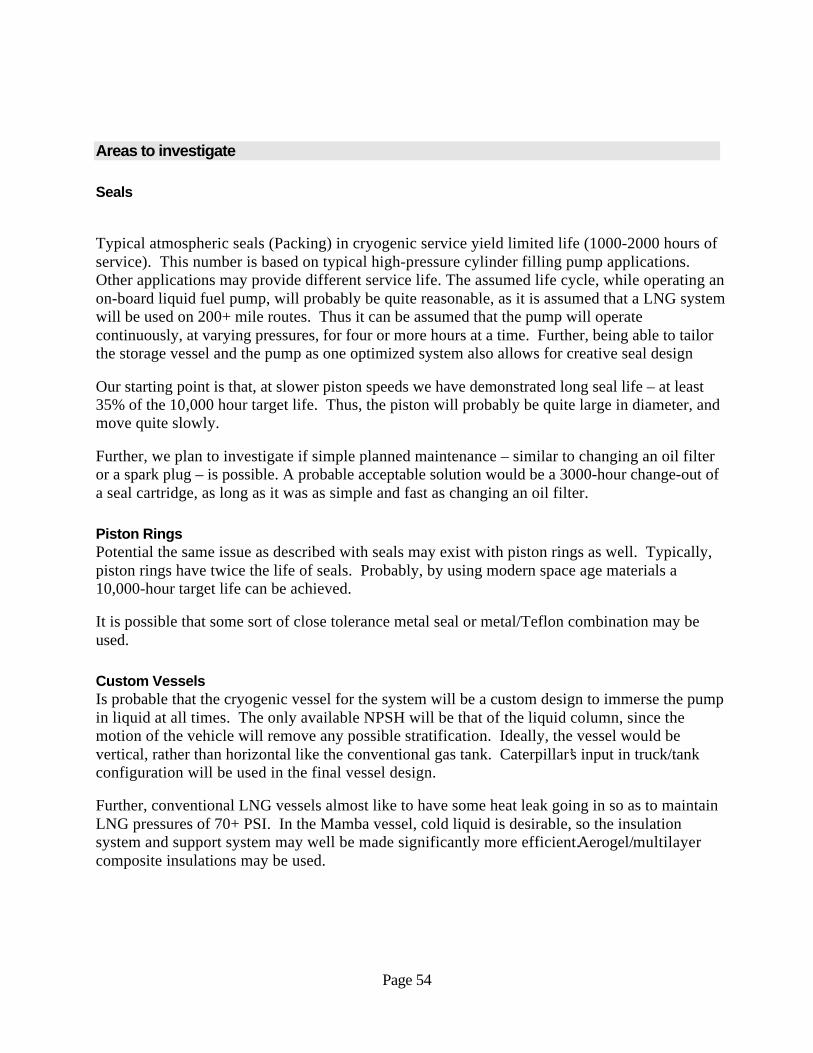
Page 54
Areas to investigate
Seals
Typical atmospheric seals (Packing) in cryogenic service yield limited life (1000-2000 hours ofservice). This number is based on typical high-pressure cylinder filling pump applications.Other applications may provide different service life. The assumed life cycle, while operating anon-board liquid fuel pump, will probably be quite reasonable, as it is assumed that a LNG systemwill be used on 200+ mile routes. Thus it can be assumed that the pump will operatecontinuously, at varying pressures, for four or more hours at a time. Further, being able to tailorthe storage vessel and the pump as one optimized system also allows for creative seal design
Our starting point is that, at slower piston speeds we have demonstrated long seal life – at least35% of the 10,000 hour target life. Thus, the piston will probably be quite large in diameter, andmove quite slowly.
Further, we plan to investigate if simple planned maintenance – similar to changing an oil filteror a spark plug – is possible. A probable acceptable solution would be a 3000-hour change-out ofa seal cartridge, as long as it was as simple and fast as changing an oil filter.
Piston RingsPotential the same issue as described with seals may exist with piston rings as well. Typically,piston rings have twice the life of seals. Probably, by using modern space age materials a10,000-hour target life can be achieved.
It is possible that some sort of close tolerance metal seal or metal/Teflon combination may beused.
Custom VesselsIs probable that the cryogenic vessel for the system will be a custom design to immerse the pumpin liquid at all times. The only available NPSH will be that of the liquid column, since themotion of the vehicle will remove any possible stratification. Ideally, the vessel would bevertical, rather than horizontal like the conventional gas tank. Caterpillar’s input in truck/tankconfiguration will be used in the final vessel design.
Further, conventional LNG vessels almost like to have some heat leak going in so as to maintainLNG pressures of 70+ PSI. In the Mamba vessel, cold liquid is desirable, so the insulationsystem and support system may well be made significantly more efficient. Aerogel/multilayercomposite insulations may be used.
Page 55
Conclusions
ReliabilityIt has been very difficult to obtain meaningful reliability data. Efforts have been made to contactACD, Woodland, CTR, CryoStar. With the exception of CryoStar, reliability and lifeinformation was limited to “...you know – about a thousand hours, maybe – depends how youuse it… ”
The next report will:
• Address existing reliability data
• Address new data and patents that have been reviewed.
• Propose Test Plans
• Propose designs to be discussed at the preliminary design review.
Summary
The information provided in this report serves as a background to the existing state-of-the-art inhigh pressure LNG pumps, as well as insight into the considerations of the design of a reliableand durable LNG pump and fuel handling system. A system capable of handling the conditionspresent in a vehicle will be required for a field test demonstration of the 3126 DING engine.
Task 4: Commercial Applications Study
Objective:
In this task, the subcontractor shall perform a study on the commercial potential of DING enginetechnology for a variety of heavy-duty engine applications. The study shall include use of thetechnology on a variety of applications ranging from pickup/delivery trucks, buses, andon-highway trucks to earthmoving, marine and locomotive applications. The subcontractor shallalso examine the potential of DING engine technology for alternative fuels such as propane, thealcohols, dimethyl ether and hydrogen. The study shall incorporate the effect the total system(3000 psi fuel handling system, fuel storage, emissions results and requirements, etc.) will have onthe commercial viability of the technology. The study shall identify the most likely applicationsfor the DING technology.
Accomplishment Summary:
An investigation was completed to determine the applications where the DING engine wouldoffer the most economic advantage. Decision and Risk Analysis (DRA) was applied to aspreadsheet which was constructed to dissect the costs associated with engine owning andoperating expenses into: 1) the cost of the engine, 2) the cost of the onboard fuel system 3) thecost of the required infrastructure enhancements, 3) the yearly maintenance expense and 4) theyearly fuel expense. In addition to these factors, the emissions reduction produced by eachtechnology in any given application is included so that the environmental impact of newtechnology can be quantified. The above information is summarized in terms of the overall capitalexpenditure required, the yearly operating costs, and the period of time required for the newtechnology to pay back the needed capital expenditure. This information will lead to improvedunderstanding of the sensitivity of the overall cost/benefit balance to each of the contributingfactors.
The study concluded that, as there is no current economic incentive to reduce NOx emissions inmobile sources, only vehicles which have a very high fuel consumption compared to engine costwill offer any economic advantage to customers, and these market opportunities exist only if thefuel cost differential between natural gas and diesel fuel remains consistently above 30 cent/DEGfor the duration of the payback period.
Accomplishment Details:
Introduction:The primary reason for the development of DING engine technology is the potential economicbenefits such an engine would offer over its competitors in terms of fuel cost, power density, andinitial engine cost. The engine under development essentially duplicates diesel engine fuelefficiency over the entire operating range, yielding significant reductions in fuel consumption incomparison with a traditional lean burn gas engine. Engine cost benefits are expected to accrue
Page 56
due to the increased power density of the DING engine, resulting in a smaller required engine andthus lower manufacturing costs.
In order to evaluate the potential benefits of the DING engine and explore the emissions reductionpotential of the engine as well, a spreadsheet analysis has been conducted. The spreadsheetcompares the DING engine with its most likely competitors for a number of different possibleapplications. In order to succeed in the engine marketplace the DING engine must not only offercost savings over a diesel engine, but must also outpace the other gas engine competitors, namely:lean burn natural gas engines, stoichiometric natural gas engines, and dual fuel natural gasengines. A spreadsheet has been created that takes into account initial engine cost, fuel systemcost, engine maintenance expense, and fuel efficiency in comparing each of these engineconfigurations for five different applications. These applications were chosen to span the range ofengine cost/fuel consumption ratio, which is the main factor in determining the number of yearsrequired for an investment in natural gas technology to yield a savings to the customer. Inaddition to analyzing the costs involved, the total NOx emissions of each engine platform havebeen calculated such that the cost of emissions reduction can be portrayed accurately. Thisinformation may offer insight into the most cost-efficient way a customer with multiple engineplatforms, for example railroads or large industrial plants, can meet impending emissionsregulations.
The purpose of this analysis is to offer insight during the development process into the cost andemissions implications of various technologies. In order to be useful in this capacity a number ofassumptions must be made in order for the study to yield comprehensible results. These includeassumptions as to the costs of engines which are not currently produced, the costs to thecustomer beyond the incremental cost of the initial engine purchase, the future differentialbetween the available supply of natural gas and diesel fuel etc. Assumptions that have been madein the course of the analysis are described in detail in the following discussion. Changes in thesebasic assumptions can yield significant alterations in the overall economic analysis, so wheneverpossible, a range of values has been tested which span the envelope of reasonable quantities.Specifically, the cost differential between natural gas and diesel fuel has been allowed to vary overa wide range (10 cents to 80 cents per diesel equivalent gallon (DEG)) with the resulting variationin payback period expressed in the discussion section. In the future, this spreadsheet analysiswill allow the optimum engine to be developed to suit any desired application and will aid inrevealing markets in which natural gas engines can effectively compete.
Analysis Method:
The five applications that were selected for evaluation in this study were line-haul locomotive,stationary power generation, switcher locomotive, line haul truck, and transit bus. Each of theseapplications either already has significant penetration by natural gas engines or is expected to offerpotential for high levels of penetration in the future. Natural gas locomotives have been underconsideration at least since the early 1970's and several demonstration projects have been carriedout by Burlington Northern Santa Fe and Union Pacific. These projects utilize dual-fuel enginesdue to their relatively high power density and potential for fuel flexibility. Stationary powergeneration is one of the largest current markets for gas engines, with penetration expected to
Page 57
increase rapidly in the near future due to deregulation of the utilities industry. This market isdominated by lean burn natural gas engines as a result of their efficiency at full load and lowemissions relative to their diesel counterpart. Several switcher locomotives are in operationutilizing lean burn natural gas engines. The primary driving factor for this application is emissionsreduction in regions with poor air quality. Simplicity in fuel storage and transportation makesnatural gas a reasonable choice for switcher locomotives. Line haul trucking has the potential fornatural gas engine penetration due to the fixed nature of the truck route and very high yearly fuelconsumption relative to engine cost. One of the main limiting factors at present is the absence ofa high power density natural gas engine that can directly replace a diesel engine. The transit busindustry has seen a large influx of natural gas powered vehicles in the last decade. This transitionhas been driven by the desire to reduce emissions in urban areas where governing agencies do notsolely rely on economics to drive decision making. Central refueling and limited route lengthsalso contribute to the viability of natural gas engines in transit buses. In each of the potentialapplications described, the DING engine offers some advantages over its competitors, typically ineither overall fuel consumption or lower initial engine cost due to increased power density. Thedegree to which these advantages influence the overall economies of the engine purchase decisionare discussed in the results section.
The five different engines considered for each application are the traditional diesel engine, astoichiometric natural gas engine, a lean burn natural gas engine, a dual fuel engine, and the directinjection natural gas engine. Data for the traditional diesel engine was taken directly fromproduction engines for each application. Engine cost was extracted directly from the Caterpillarprice list and represents the retail price for the engine unit only, i.e. generator sets were notincluded for the locomotive or power generation applications. The fuel economy and emissionsare for current engines and do not include any of the upcoming advances in EGR and injectortechnology. Data for stoichiometric natural gas engines are based on the 3516 stoichiometricengine sold by Caterpillar. Emissions are based on a catalyst efficiency of 90% NOx conversion,a typical value for catalyst systems. Lean burn gas engine data was taken from current productioncost and performance literature. The engine used for the study is a "high" compression ratio(11:1) 3516 which runs on high methane number gas. Additional derating would be required if alower quality fuel was to be utilized. The dual fuel engine data is based on a compilation ofengines taken from the literature. It is not representative of the current "micro-pilot" engines thatare becoming available, but is similar to traditional dual fuel engines. The basic assumptions forthis engine are that the replacement rate varies linearly from 0% at idle to 95% at full load, withthe peak load 5% less than the diesel and the efficiency equal to the diesel at full load and varyinglinearly down to 80% of the diesel at idle. The NOx emissions were taken to be 2.5 g/hp-hrthroughout the load range. As additional data on modern micro-pilot engines becomes availablethey can be included in the model. The DING engine performance data has been taken from themost recent DING engine tests. It does not include EGR in order that a direct comparison withnon-EGR equipped diesel engines can be made. The NOx emissions are those taken atefficiency levels that closely mimic the diesel engine.
The cost of a natural gas engine with respect to its diesel counterpart is one of the mainimpediments to penetration of natural gas engines into the marketplace. Because many of themarkets being considered in this study are not currently served by Caterpillar products, a method
Page 58
of accurately gauging the price of a production version of these engines had to be established.The technique that has been applied is based on the assumption that the incremental engine cost isa combination of the cost increase due to limited production runs and the cost associated with theneed to overcome the BMEP penalty inflicted by most natural gas engines. For each application,the base engine cost is the current price of the diesel engine which would satisfy the customerrequirements, for example a 3612 diesel engine rated at 4964 h.p. was used for the line haullocomotive application. This cost was then multiplied by a BMEP size factor for each engine.The size factors were determined by comparing the highest rated 3516 diesel engine with thehighest rated engine in each other category. For instance, a 3516 diesel engine is capable of 1900hp at full load, while the stoichiometric version of the 3516 gas engine is rated at only 1085 hp,yielding a BMEP size factor of 1.75. The base engine cost is thus multiplied by the BMEP sizefactor to account for the larger engine that would be required if a natural gas engine were chosen.This method assumes that the cost of a given engine scales linearly with engine displacement,which is relatively valid for most of the Caterpillar engine line. For example the cost of the basediesel 3608 is $412,000 compared to $842,000 for the 3616. This scaling of engine price withsize is a large impediment to the penetration of spark ignited natural gas engines into themarketplace. The second contribution to increased prices for natural gas engines is the cost oflimited production versus mass production. While natural gas engines share many componentswith their diesel counterparts, a number of key features including fuel injectors, pistons, valves,camshafts, etc. are not shared between applications, significantly increasing the cost of limitedproduction gas engines. For each application in the study, limited production incremental enginecost was determined by comparing the cost of the base diesel with the natural gas engine of thesame size, i.e. 3516 diesel versus 3516 natural gas. This incremental cost varies from about 30%for large engines up to over 100% for smaller engines. A portion of this price difference is theactual cost of producing limited numbers of distinct engines, a second portion is the increasedprofit margin required by the producer to be induced into investing in a limited market outside ofthe traditional diesel field. These two components have not been analyzed separately and are bothtaken under the heading of incremental engine cost.
Another weakness of natural gas engines, particularly for mobile applications is the incrementalfuel system cost in comparison with the diesel engine. This incremental cost can include the fueltanks, fuel pump, regulators, safety systems, etc. While light duty natural gas vehicles are oftenpowered with compressed natural gas, the higher fuel consumption of heavy duty vehiclestypically dictates liquefied natural gas as the fuel source. For the purpose of this study, all costsbeyond the fuel tanks and the fuel pump have been neglected. This provides a best case scenariofor comparing the natural gas engine to its diesel competitor. In addition, the availability offueling stations is assumed. The cost of an LNG fueling station is at present a large impedimentto natural gas engine penetration into the mobile market and will need to be overcome in someway if natural gas is ever to become a significant mobile engine fuel. Fuel system costs for thisstudy are based on the best available data for each application. Line haul locomotives are easilyequipped for LNG operation as cryogenic rail cars are already available for general transportationapplications. The $225,000 cost used in the study is based on the demonstration projects beingcarried out. The cost of an LNG fuel pump is an unknown as there are not any mass produced,high pressure, mobile LNG pumps available. It is estimated that a high pressure LNG pump willfall between $5000 and $15000 for the various applications used. The fuel tank cost for other
Page 59
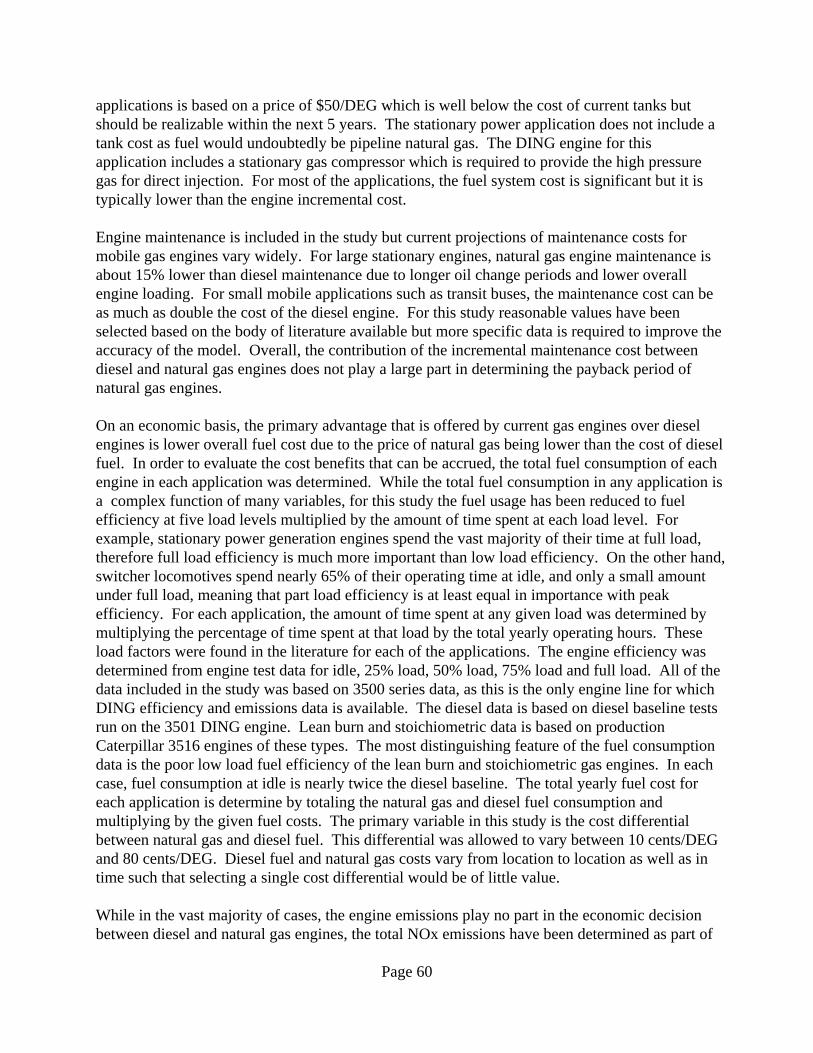
applications is based on a price of $50/DEG which is well below the cost of current tanks butshould be realizable within the next 5 years. The stationary power application does not include atank cost as fuel would undoubtedly be pipeline natural gas. The DING engine for thisapplication includes a stationary gas compressor which is required to provide the high pressuregas for direct injection. For most of the applications, the fuel system cost is significant but it istypically lower than the engine incremental cost.
Engine maintenance is included in the study but current projections of maintenance costs formobile gas engines vary widely. For large stationary engines, natural gas engine maintenance isabout 15% lower than diesel maintenance due to longer oil change periods and lower overallengine loading. For small mobile applications such as transit buses, the maintenance cost can beas much as double the cost of the diesel engine. For this study reasonable values have beenselected based on the body of literature available but more specific data is required to improve theaccuracy of the model. Overall, the contribution of the incremental maintenance cost betweendiesel and natural gas engines does not play a large part in determining the payback period ofnatural gas engines.
On an economic basis, the primary advantage that is offered by current gas engines over dieselengines is lower overall fuel cost due to the price of natural gas being lower than the cost of dieselfuel. In order to evaluate the cost benefits that can be accrued, the total fuel consumption of eachengine in each application was determined. While the total fuel consumption in any application isa complex function of many variables, for this study the fuel usage has been reduced to fuelefficiency at five load levels multiplied by the amount of time spent at each load level. Forexample, stationary power generation engines spend the vast majority of their time at full load,therefore full load efficiency is much more important than low load efficiency. On the other hand,switcher locomotives spend nearly 65% of their operating time at idle, and only a small amountunder full load, meaning that part load efficiency is at least equal in importance with peakefficiency. For each application, the amount of time spent at any given load was determined bymultiplying the percentage of time spent at that load by the total yearly operating hours. Theseload factors were found in the literature for each of the applications. The engine efficiency wasdetermined from engine test data for idle, 25% load, 50% load, 75% load and full load. All of thedata included in the study was based on 3500 series data, as this is the only engine line for whichDING efficiency and emissions data is available. The diesel data is based on diesel baseline testsrun on the 3501 DING engine. Lean burn and stoichiometric data is based on productionCaterpillar 3516 engines of these types. The most distinguishing feature of the fuel consumptiondata is the poor low load fuel efficiency of the lean burn and stoichiometric gas engines. In eachcase, fuel consumption at idle is nearly twice the diesel baseline. The total yearly fuel cost foreach application is determine by totaling the natural gas and diesel fuel consumption andmultiplying by the given fuel costs. The primary variable in this study is the cost differentialbetween natural gas and diesel fuel. This differential was allowed to vary between 10 cents/DEGand 80 cents/DEG. Diesel fuel and natural gas costs vary from location to location as well as intime such that selecting a single cost differential would be of little value.
While in the vast majority of cases, the engine emissions play no part in the economic decisionbetween diesel and natural gas engines, the total NOx emissions have been determined as part of
Page 60
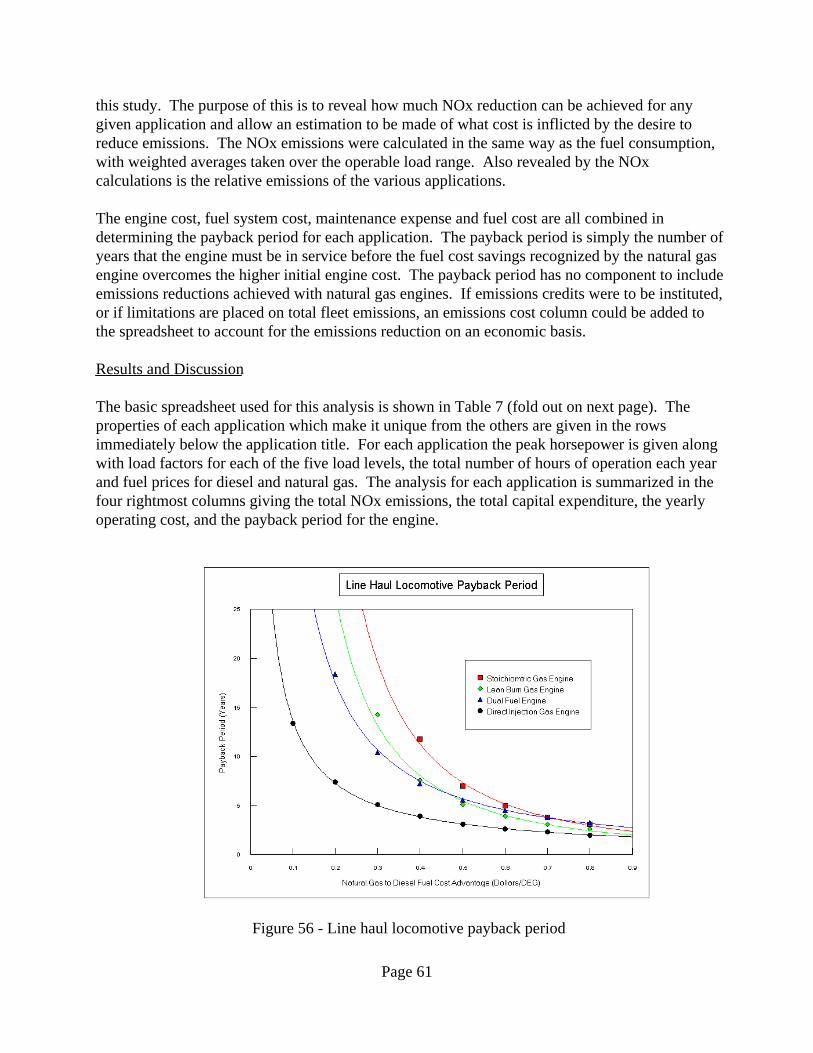
this study. The purpose of this is to reveal how much NOx reduction can be achieved for anygiven application and allow an estimation to be made of what cost is inflicted by the desire toreduce emissions. The NOx emissions were calculated in the same way as the fuel consumption,with weighted averages taken over the operable load range. Also revealed by the NOxcalculations is the relative emissions of the various applications.
The engine cost, fuel system cost, maintenance expense and fuel cost are all combined indetermining the payback period for each application. The payback period is simply the number ofyears that the engine must be in service before the fuel cost savings recognized by the natural gasengine overcomes the higher initial engine cost. The payback period has no component to includeemissions reductions achieved with natural gas engines. If emissions credits were to be instituted,or if limitations are placed on total fleet emissions, an emissions cost column could be added tothe spreadsheet to account for the emissions reduction on an economic basis.
Results and Discussion
The basic spreadsheet used for this analysis is shown in Table 7 (fold out on next page). Theproperties of each application which make it unique from the others are given in the rowsimmediately below the application title. For each application the peak horsepower is given alongwith load factors for each of the five load levels, the total number of hours of operation each yearand fuel prices for diesel and natural gas. The analysis for each application is summarized in thefour rightmost columns giving the total NOx emissions, the total capital expenditure, the yearlyoperating cost, and the payback period for the engine.
Figure 56 - Line haul locomotive payback period
Page 61
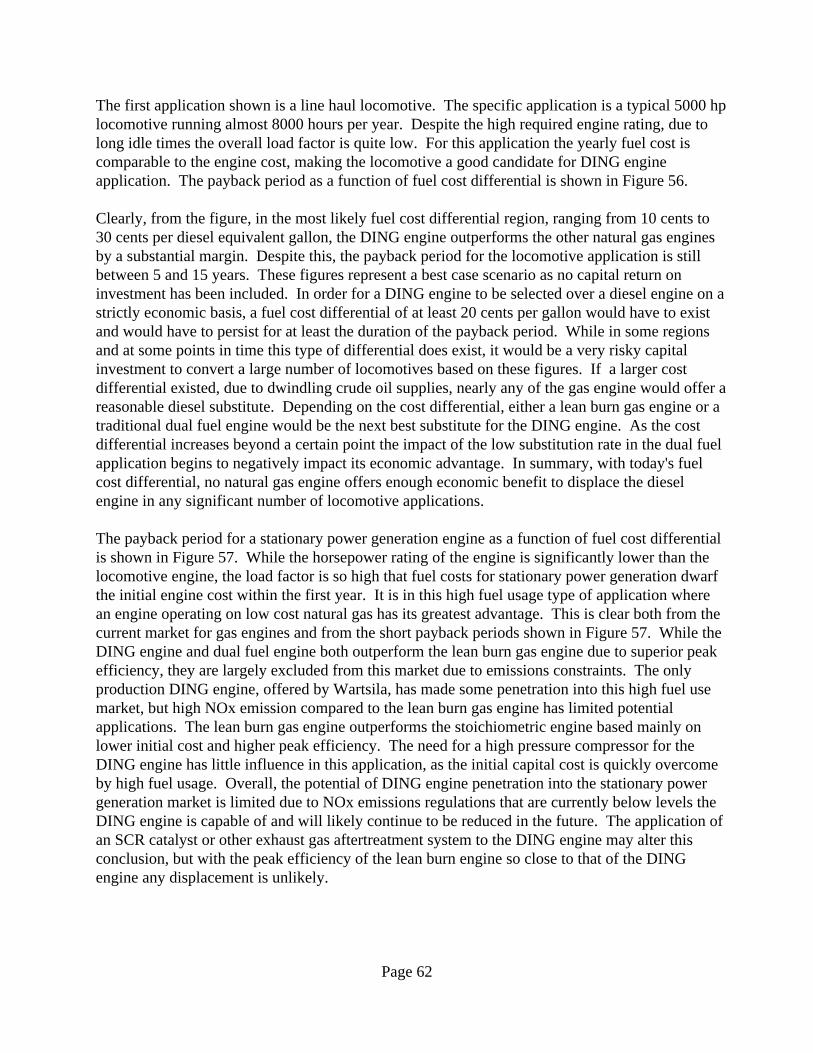
The first application shown is a line haul locomotive. The specific application is a typical 5000 hplocomotive running almost 8000 hours per year. Despite the high required engine rating, due tolong idle times the overall load factor is quite low. For this application the yearly fuel cost iscomparable to the engine cost, making the locomotive a good candidate for DING engineapplication. The payback period as a function of fuel cost differential is shown in Figure 56.
Clearly, from the figure, in the most likely fuel cost differential region, ranging from 10 cents to30 cents per diesel equivalent gallon, the DING engine outperforms the other natural gas enginesby a substantial margin. Despite this, the payback period for the locomotive application is stillbetween 5 and 15 years. These figures represent a best case scenario as no capital return oninvestment has been included. In order for a DING engine to be selected over a diesel engine on astrictly economic basis, a fuel cost differential of at least 20 cents per gallon would have to existand would have to persist for at least the duration of the payback period. While in some regionsand at some points in time this type of differential does exist, it would be a very risky capitalinvestment to convert a large number of locomotives based on these figures. If a larger costdifferential existed, due to dwindling crude oil supplies, nearly any of the gas engine would offer areasonable diesel substitute. Depending on the cost differential, either a lean burn gas engine or atraditional dual fuel engine would be the next best substitute for the DING engine. As the costdifferential increases beyond a certain point the impact of the low substitution rate in the dual fuelapplication begins to negatively impact its economic advantage. In summary, with today's fuelcost differential, no natural gas engine offers enough economic benefit to displace the dieselengine in any significant number of locomotive applications.
The payback period for a stationary power generation engine as a function of fuel cost differentialis shown in Figure 57. While the horsepower rating of the engine is significantly lower than thelocomotive engine, the load factor is so high that fuel costs for stationary power generation dwarfthe initial engine cost within the first year. It is in this high fuel usage type of application wherean engine operating on low cost natural gas has its greatest advantage. This is clear both from thecurrent market for gas engines and from the short payback periods shown in Figure 57. While theDING engine and dual fuel engine both outperform the lean burn gas engine due to superior peakefficiency, they are largely excluded from this market due to emissions constraints. The onlyproduction DING engine, offered by Wartsila, has made some penetration into this high fuel usemarket, but high NOx emission compared to the lean burn gas engine has limited potentialapplications. The lean burn gas engine outperforms the stoichiometric engine based mainly onlower initial cost and higher peak efficiency. The need for a high pressure compressor for theDING engine has little influence in this application, as the initial capital cost is quickly overcomeby high fuel usage. Overall, the potential of DING engine penetration into the stationary powergeneration market is limited due to NOx emissions regulations that are currently below levels theDING engine is capable of and will likely continue to be reduced in the future. The application ofan SCR catalyst or other exhaust gas aftertreatment system to the DING engine may alter thisconclusion, but with the peak efficiency of the lean burn engine so close to that of the DINGengine any displacement is unlikely.
Page 62
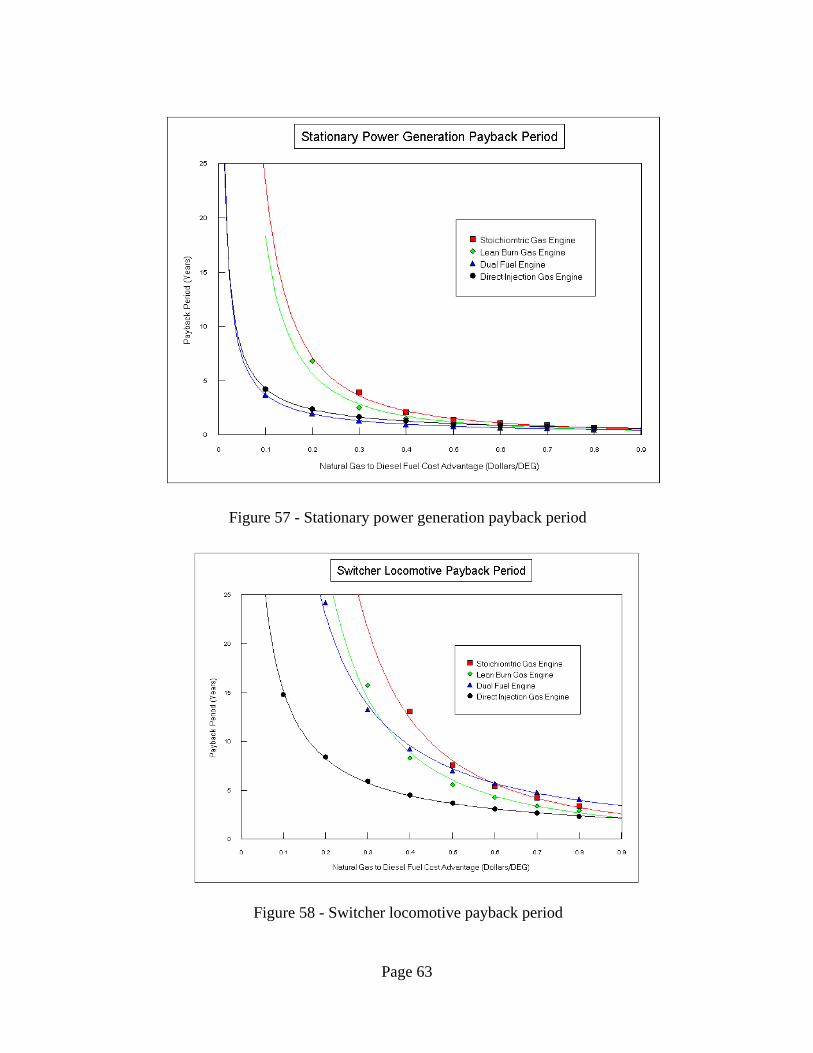
Figure 57 - Stationary power generation payback period
Figure 58 - Switcher locomotive payback period
Page 63
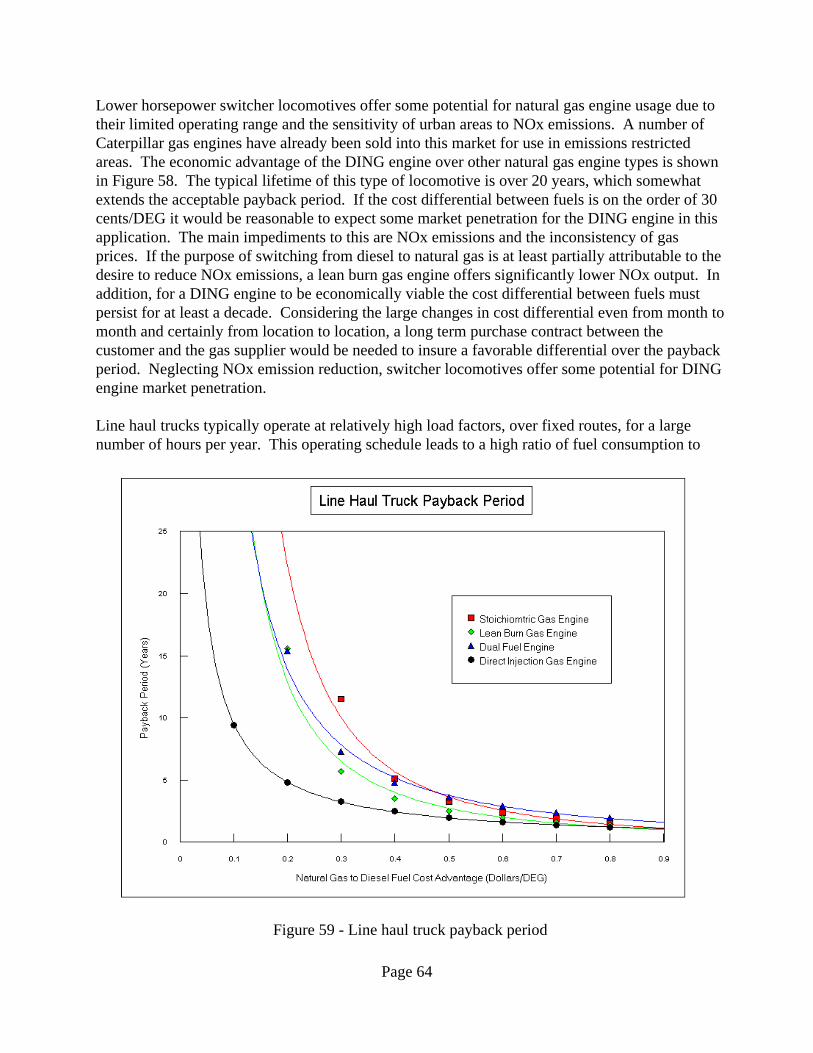
Lower horsepower switcher locomotives offer some potential for natural gas engine usage due totheir limited operating range and the sensitivity of urban areas to NOx emissions. A number ofCaterpillar gas engines have already been sold into this market for use in emissions restrictedareas. The economic advantage of the DING engine over other natural gas engine types is shownin Figure 58. The typical lifetime of this type of locomotive is over 20 years, which somewhatextends the acceptable payback period. If the cost differential between fuels is on the order of 30cents/DEG it would be reasonable to expect some market penetration for the DING engine in thisapplication. The main impediments to this are NOx emissions and the inconsistency of gas prices. If the purpose of switching from diesel to natural gas is at least partially attributable to thedesire to reduce NOx emissions, a lean burn gas engine offers significantly lower NOx output. Inaddition, for a DING engine to be economically viable the cost differential between fuels mustpersist for at least a decade. Considering the large changes in cost differential even from month tomonth and certainly from location to location, a long term purchase contract between thecustomer and the gas supplier would be needed to insure a favorable differential over the paybackperiod. Neglecting NOx emission reduction, switcher locomotives offer some potential for DINGengine market penetration.
Line haul trucks typically operate at relatively high load factors, over fixed routes, for a large number of hours per year. This operating schedule leads to a high ratio of fuel consumption to
Figure 59 - Line haul truck payback period
Page 64
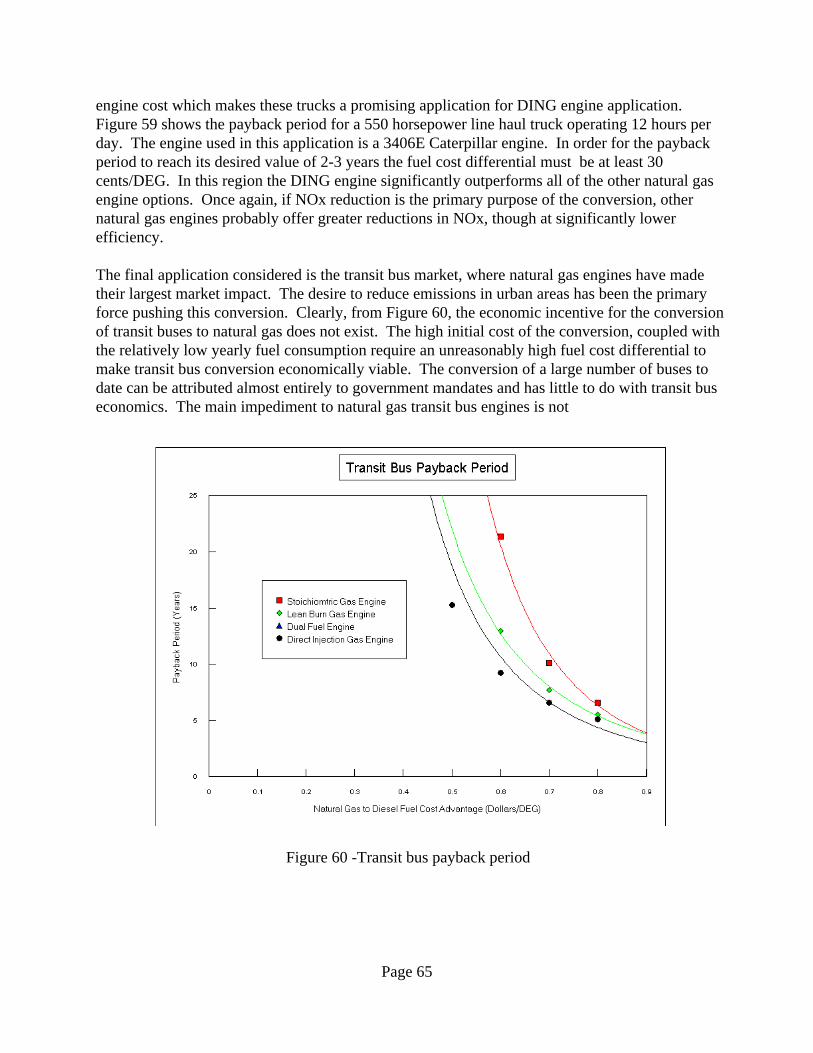
engine cost which makes these trucks a promising application for DING engine application.Figure 59 shows the payback period for a 550 horsepower line haul truck operating 12 hours perday. The engine used in this application is a 3406E Caterpillar engine. In order for the paybackperiod to reach its desired value of 2-3 years the fuel cost differential must be at least 30cents/DEG. In this region the DING engine significantly outperforms all of the other natural gasengine options. Once again, if NOx reduction is the primary purpose of the conversion, othernatural gas engines probably offer greater reductions in NOx, though at significantly lowerefficiency.
The final application considered is the transit bus market, where natural gas engines have madetheir largest market impact. The desire to reduce emissions in urban areas has been the primaryforce pushing this conversion. Clearly, from Figure 60, the economic incentive for the conversionof transit buses to natural gas does not exist. The high initial cost of the conversion, coupled withthe relatively low yearly fuel consumption require an unreasonably high fuel cost differential tomake transit bus conversion economically viable. The conversion of a large number of buses todate can be attributed almost entirely to government mandates and has little to do with transit buseconomics. The main impediment to natural gas transit bus engines is not
Figure 60 -Transit bus payback period
Page 65
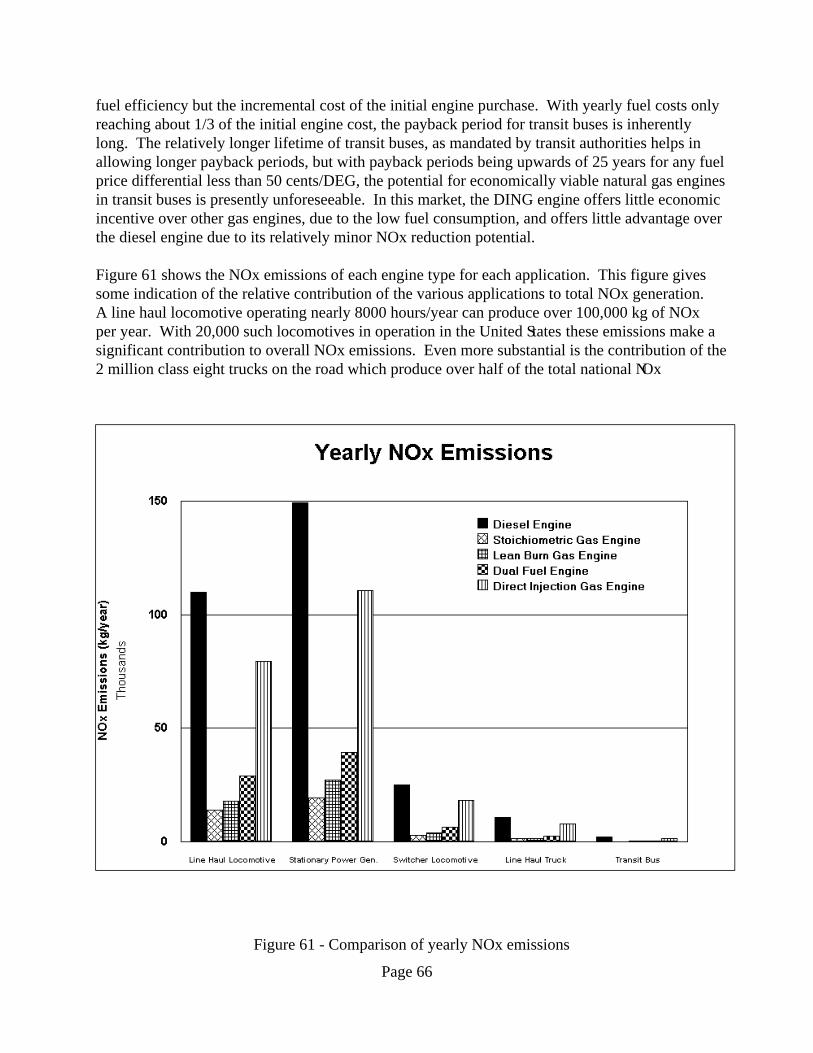
fuel efficiency but the incremental cost of the initial engine purchase. With yearly fuel costs onlyreaching about 1/3 of the initial engine cost, the payback period for transit buses is inherentlylong. The relatively longer lifetime of transit buses, as mandated by transit authorities helps inallowing longer payback periods, but with payback periods being upwards of 25 years for any fuelprice differential less than 50 cents/DEG, the potential for economically viable natural gas enginesin transit buses is presently unforeseeable. In this market, the DING engine offers little economicincentive over other gas engines, due to the low fuel consumption, and offers little advantage overthe diesel engine due to its relatively minor NOx reduction potential.
Figure 61 shows the NOx emissions of each engine type for each application. This figure givessome indication of the relative contribution of the various applications to total NOx generation.A line haul locomotive operating nearly 8000 hours/year can produce over 100,000 kg of NOxper year. With 20,000 such locomotives in operation in the United States these emissions make asignificant contribution to overall NOx emissions. Even more substantial is the contribution of the2 million class eight trucks on the road which produce over half of the total national NOx
Figure 61 - Comparison of yearly NOx emissions
Page 66
emissions from mobile sources. The relatively low fuel usage combined with a small number ofvehicles (2000 switcher locomotives and 60,000 transit buses) makes emissions from either transit buses or switcher locomotives inconsequential in terms of overall NOx. Theseapplications may still make a significant contribution on a local level, as their emissions aretypically concentrated in high population density urban areas. In summary, as there is no currenteconomic incentive to reduce NOx emissions in mobile sources, only vehicles which have a veryhigh fuel consumption compared to engine cost will offer any economic advantage to customers,and these market opportunities exist only if the fuel cost differential between natural gas anddiesel fuel remains consistently above 30 cent/DEG for the duration of the payback period.
Page 67
REPORT DOCUMENTATION PAGE Form ApprovedOMB NO. 0704-0188
Public reporting burden for this collection of information is estimated to average 1 hour per response, including the time for reviewing instructions, searching existing datasources, gathering and maintaining the data needed, and completing and reviewing the collection of information. Send comments regarding this burden estimate or anyother aspect of this collection of information, including suggestions for reducing this burden, to Washington Headquarte rs Se rvic e s, Dire c torate for Information Operationsand Reports, 1215 Jefferson Davis Highway, Suite 1204, Arlington, VA 22202-4302, and to the Office of Management and Budget, Paperwork Reduction Project (0704-0188),Washington, DC 20503.
1. AGENCY USE ONLY (Leave blank) 2. REPORT DATEFebruary 2000
3. REPORT TYPE AND DATES COVEREDSubcontract Report
4. TITLE AND SUBTITLEDevelopment of a Direct Injected Natural Gas Engine System for Heavy-Duty Vehicles
6. AUTHOR(S)G.B. Cox, K.A. DelVecchio, W.J. Hays, J.D. Hiltner, R. Nagaraj, C. Emmer
5. FUNDING NUMBERS
7. PERFORMING ORGANIZATION NAME(S) AND ADDRESS(ES)Caterpillar, Inc.Peoria, Illinois
8. PERFORMING ORGANIZATIONREPORT NUMBERSR-540-27501
9. SPONSORING/MONITORING AGENCY NAME(S) AND ADDRESS(ES)National Renewable Energy Laboratory1617 Cole Blvd.Golden, CO 80401-3393
10. SPONSORING/MONITORINGAGENCY REPORT NUMBER
11. SUPPLEMENTARY NOTES
NREL Technical Monitor: Keith Vertin12a. DISTRIBUTION/AVAILABILITY STATEMENT
National Technical Information ServiceU.S. Department of Commerce5285 Port Royal RoadSpringfield, VA 22161
12b. DISTRIBUTION CODE
13. ABSTRACT (Maximum 200 words)This report summarizes the results of Phase 2 of this contract. We completed four tasks under this phase of the subcontract. (1) Wedeveloped a computational fluid dynamics (CFD) model of a 3500 direct injected natural gas (DING) engine gas injection/combustionsystem and used it to identify DING ignition/combustion system improvements. The results were a 20% improvement in efficiencycompared to Phase 1 testing. (2) We designed and procured the components for a 3126 DING engine (300 hp) and finished assembling it.During preliminary testing, the engine ran successfully at low loads for approximately 2 hours before injector tip and check failuresterminated the test. The problems are solvable; however, this phase of the program was terminated. (3) We developed a Decision & RiskAnalysis model to compare DING engine technology with various other engine technologies in a number of commercial applications. Themodel shows the most likely commercial applications for DING technology and can also be used to identify the sensitivity of variablesthat impact commercial viability. (4) MVE, Inc., completed a preliminary design concept study that examines the major design issuesinvolved in making a reliable and durable 3000 psi LNG pump. A primary concern is the life of pump seals and piston rings.
Plans for the next phase of this program (Phase 3) have been put on indefinite hold. Caterpillar has decided not to fund further DINGwork at this time due to limited current market potential for the DING engine. However, based on results from this program, we believethat DI natural gas technology is viable for allowing a natural gas-fueled engine to achieve diesel power density and thermal efficiency forboth the near and long terms.
15. NUMBER OF PAGES 14. SUBJECT TERMS
Direct injected natural gas engine; heavy-duty vehicles16. PRICE CODE
17. SECURITY CLASSIFICATIONOF REPORT
18. SECURITY CLASSIFICATIONOF THIS PAGE
19. SECURITY CLASSIFICATIONOF ABSTRACT
20. LIMITATION OF ABSTRACT
NSN 7540-01-280-5500 Standard Form 298 (Rev. 2-89)Prescribed by ANSI Std. Z39-18
298-102