development of a precast bridge deck overhang system · pdf filedevelopment of a precast...
TRANSCRIPT

Technical Report Documentation Page
Form DOT F 1700.7 (8-72) Reproduction of completed page authorized
1. Report No. FHWA/TX-10/0-6100-1
2. Government Accession No.
3. Recipient's Catalog No.
4. Title and Subtitle DEVELOPMENT OF A PRECAST BRIDGE DECK OVERHANG SYSTEM
5. Report Date February 2010 Published: February 2011 6. Performing Organization Code
7. Author(s) David Trejo, Monique Hite Head, John Mander, Thomas Mander, Mathew Henley, Reece Scott, Tyler Ley, and Siddharth Patil
8. Performing Organization Report No. Report 0-6100-1
9. Performing Organization Name and Address Texas Transportation Institute The Texas A&M University System College Station, Texas 77843-3135
10. Work Unit No. (TRAIS) 11. Contract or Grant No. Project 0-6100
12. Sponsoring Agency Name and Address Texas Department of Transportation Research and Technology Implementation Office P. O. Box 5080 Austin, Texas 78763-5080
13. Type of Report and Period Covered Technical Report October 2007–August 2009 14. Sponsoring Agency Code
15. Supplementary Notes Project performed in cooperation with the Texas Department of Transportation and the Federal Highway Administration. Project Title: Development of a Precast Bridge Deck Overhang URL: http://tti.tamu.edu/documents/0-6100-1.pdf 16. Abstract Prestressed-precast panels are commonly used at interior beams for bridge decks in Texas. The use of these panels can provide ease of construction, sufficient capacity, and good economy for the construction of bridge decks in Texas. Current practice for the overhang deck sections require that formwork be constructed at the outer edges of the bridge. The cost of constructing the bridge overhang is significantly higher than that of the interior sections where precast panels are used. The development of a precast overhang system has the potential to improve economy and safety in bridge construction. This research investigated the overhang and shear capacity of a precast overhang system for potential use during the construction of bridges with precast overhang panels. The research was performed in three phases: the Phase 1 research including work specifically for the Rock Creek Bridge in Parker County, Texas; the Phase 2 research for general precast overhang panels, and; the Phase 3 research investigating the shear capacity. Grout material characteristics were also assessed for possible use in the haunch; constructability issues were also addressed. Results indicate that the capacity of the precast overhang system is sufficient to carry factored AASHTO loads with no or very limited cracking. Results from the shear study indicate that the shear capacity of threaded rods with couplers is lower than the conventional R-bar system. However, sufficient shear capacity can be achieved if sufficient pockets in the precast overhang panel are provided. A recommendation for the haunch form system for use on the bridge is also provided. The use of the precast overhang system evaluated can be implemented in bridge construction. However, further testing is needed to determine the number of pockets on the overhang panel—an issue critical to the constructability and economy of the system. This will be further addressed in report 0-6100-3.
17. Key Words Precast, Prestressed, Bridge Overhang, Grout, Constructability, Bridge Deck Panel
18. Distribution Statement No restrictions. This document is available to the public through NTIS: National Technical Information Service Springfield, Virginia 22161 http://www.ntis.gov
19. Security Classif.(of this report) Unclassified
20. Security Classif.(of this page) Unclassified
21. No. of Pages 228
22. Price


DEVELOPMENT OF A PRECAST BRIDGE DECK OVERHANG SYSTEM by
David Trejo, Ph.D., P.E., Professor and CEF Endowed Chair
School of Civil and Construction Engineering Oregon State University
(formerly at the Texas Transportation Institute)
Monique Hite Head, Ph.D., Assistant Research Engineer John Mander, Ph.D., Associate Research Engineer Thomas J. Mander, Graduate Student Researcher
Mathew Henley, Graduate Student Researcher Reece Scott, Graduate Student Researcher
Zachry Department of Civil Engineering
Texas Transportation Institute Texas A&M University
Tyler Ley, Ph.D., P.E., Assistant Professor Siddharth Patil, Graduate Student Researcher
Department of Civil and Environmental Engineering
Oklahoma State University
Report 0-6100-1 Project 0-6100
Project Title: Development of a Precast Bridge Deck Overhang
Performed in cooperation with the Texas Department of Transportation
and the Federal Highway Administration
February 2010 Published: February 2011
TEXAS TRANSPORTATION INSTITUTE
The Texas A&M University System College Station, Texas 77843-3135


v
DISCLAIMER
The contents of this report reflect the views of the authors, who are responsible for the facts and
accuracy of the data herein. The results from this research do not constitute a specification or
standard and care should be used when using these results for conditions other than tested herein.
The contents do not necessarily reflect the official view or policies of the Federal Highway
Administration (FHWA) or the Texas Department of Transportation (TxDOT). This report does
not constitute a standard, specification, or regulation. The engineer in charge was David Trejo,
P.E. #93490.
The United States Government and the State of Texas do not endorse products or
manufacturers. Trade or manufacturers’ names appear herein solely because they are considered
essential to the objective of this report.

vi
ACKNOWLEDGMENTS
This project was conducted at Texas A&M University and Oklahoma State University and was
supported by TxDOT and FHWA through the Texas Transportation Institute (TTI). The
researchers would like to gratefully acknowledge the assistance provided by TxDOT officials, in
particular, Mr. Ricardo Gonzalez, Mr. Ralph Browne, Mr. Graham Bettis, Mr. Loyl Bussell,
Dr. German Claros, Mr. Lewis Gamboa, Mr. John Holt, Mr. Manuel Padron, Mr. Jason Tucker,
and Mr. Alfredo Valles. The contributions of Dr. Young Hoon Kim and Dr. Radhakrishna Pillai
are also graciously appreciated.
vii
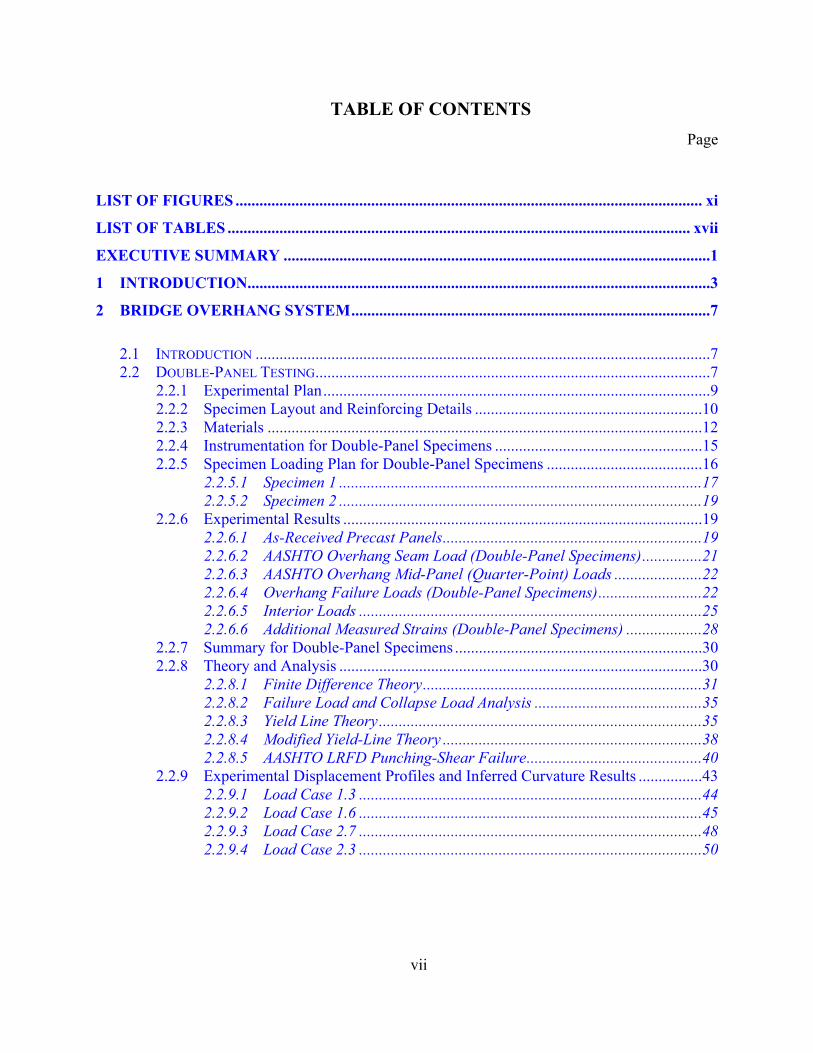
TABLE OF CONTENTS Page
LIST OF FIGURES ..................................................................................................................... xi
LIST OF TABLES .................................................................................................................... xvii
EXECUTIVE SUMMARY ...........................................................................................................1
1 INTRODUCTION....................................................................................................................3
2 BRIDGE OVERHANG SYSTEM ..........................................................................................7
2.1 INTRODUCTION ..................................................................................................................7 2.2 DOUBLE-PANEL TESTING ...................................................................................................7
2.2.1 Experimental Plan .................................................................................................9 2.2.2 Specimen Layout and Reinforcing Details .........................................................10 2.2.3 Materials .............................................................................................................12 2.2.4 Instrumentation for Double-Panel Specimens ....................................................15 2.2.5 Specimen Loading Plan for Double-Panel Specimens .......................................16
2.2.5.1 Specimen 1 ...........................................................................................17 2.2.5.2 Specimen 2 ...........................................................................................19
2.2.6 Experimental Results ..........................................................................................19 2.2.6.1 As-Received Precast Panels .................................................................19 2.2.6.2 AASHTO Overhang Seam Load (Double-Panel Specimens) ...............21 2.2.6.3 AASHTO Overhang Mid-Panel (Quarter-Point) Loads ......................22 2.2.6.4 Overhang Failure Loads (Double-Panel Specimens) ..........................22 2.2.6.5 Interior Loads ......................................................................................25 2.2.6.6 Additional Measured Strains (Double-Panel Specimens) ...................28
2.2.7 Summary for Double-Panel Specimens ..............................................................30 2.2.8 Theory and Analysis ...........................................................................................30
2.2.8.1 Finite Difference Theory ......................................................................31 2.2.8.2 Failure Load and Collapse Load Analysis ..........................................35 2.2.8.3 Yield Line Theory .................................................................................35 2.2.8.4 Modified Yield-Line Theory .................................................................38 2.2.8.5 AASHTO LRFD Punching-Shear Failure ............................................40
2.2.9 Experimental Displacement Profiles and Inferred Curvature Results ................43 2.2.9.1 Load Case 1.3 ......................................................................................44 2.2.9.2 Load Case 1.6 ......................................................................................45 2.2.9.3 Load Case 2.7 ......................................................................................48 2.2.9.4 Load Case 2.3 ......................................................................................50
viii
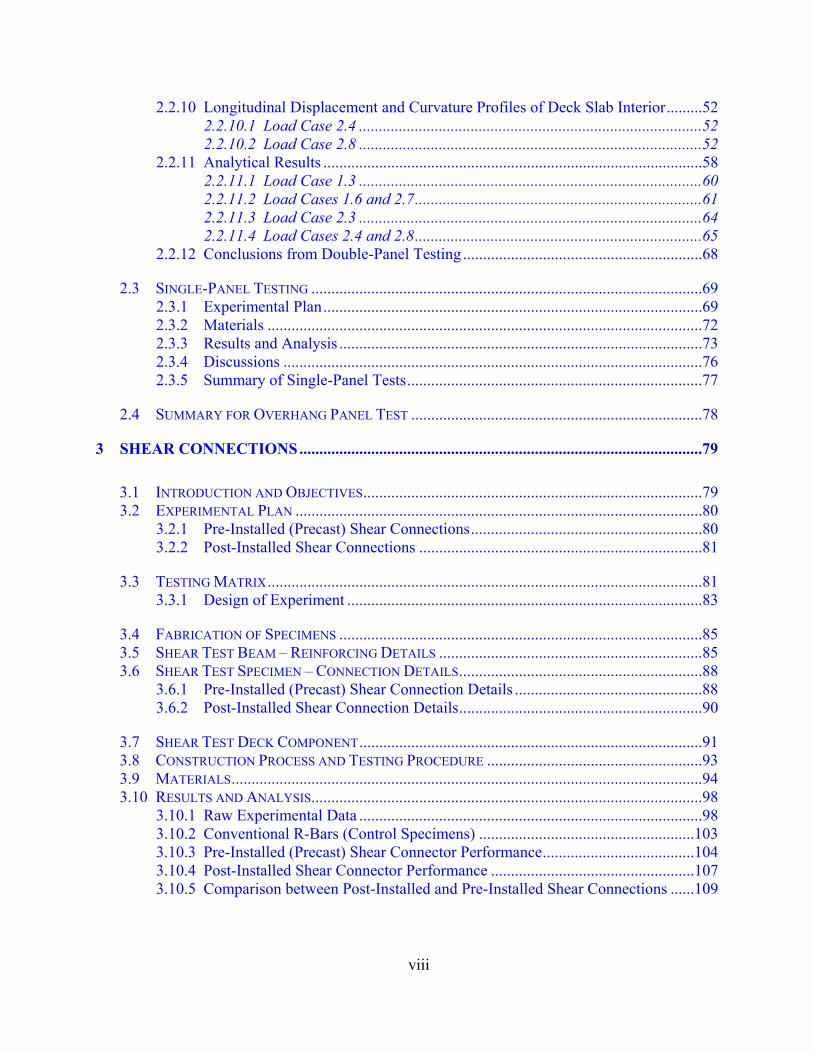
2.2.10 Longitudinal Displacement and Curvature Profiles of Deck Slab Interior .........52 2.2.10.1 Load Case 2.4 ......................................................................................52 2.2.10.2 Load Case 2.8 ......................................................................................52
2.2.11 Analytical Results ...............................................................................................58 2.2.11.1 Load Case 1.3 ......................................................................................60 2.2.11.2 Load Cases 1.6 and 2.7 ........................................................................61 2.2.11.3 Load Case 2.3 ......................................................................................64 2.2.11.4 Load Cases 2.4 and 2.8 ........................................................................65
2.2.12 Conclusions from Double-Panel Testing ............................................................68
2.3 SINGLE-PANEL TESTING ..................................................................................................69 2.3.1 Experimental Plan ...............................................................................................69 2.3.2 Materials .............................................................................................................72 2.3.3 Results and Analysis ...........................................................................................73 2.3.4 Discussions .........................................................................................................76 2.3.5 Summary of Single-Panel Tests ..........................................................................77
2.4 SUMMARY FOR OVERHANG PANEL TEST .........................................................................78
3 SHEAR CONNECTIONS .....................................................................................................79
3.1 INTRODUCTION AND OBJECTIVES .....................................................................................79 3.2 EXPERIMENTAL PLAN ......................................................................................................80
3.2.1 Pre-Installed (Precast) Shear Connections ..........................................................80 3.2.2 Post-Installed Shear Connections .......................................................................81
3.3 TESTING MATRIX .............................................................................................................81 3.3.1 Design of Experiment .........................................................................................83
3.4 FABRICATION OF SPECIMENS ...........................................................................................85 3.5 SHEAR TEST BEAM – REINFORCING DETAILS ..................................................................85 3.6 SHEAR TEST SPECIMEN – CONNECTION DETAILS .............................................................88
3.6.1 Pre-Installed (Precast) Shear Connection Details ...............................................88 3.6.2 Post-Installed Shear Connection Details .............................................................90
3.7 SHEAR TEST DECK COMPONENT ......................................................................................91 3.8 CONSTRUCTION PROCESS AND TESTING PROCEDURE ......................................................93 3.9 MATERIALS ......................................................................................................................94 3.10 RESULTS AND ANALYSIS ..................................................................................................98
3.10.1 Raw Experimental Data ......................................................................................98 3.10.2 Conventional R-Bars (Control Specimens) ......................................................103 3.10.3 Pre-Installed (Precast) Shear Connector Performance ......................................104 3.10.4 Post-Installed Shear Connector Performance ...................................................107 3.10.5 Comparison between Post-Installed and Pre-Installed Shear Connections ......109

ix
3.10.6 Parametric Studies ............................................................................................110 3.10.6.1 Effect of 2.0-in. (51 mm) versus 3.5-in. (89 mm) Haunch .................110 3.10.6.2 Effect of Surface Roughness ...............................................................112 3.10.6.3 Performance of Alternative Grout versus SikaGrout™ 212 ..............114 3.10.6.4 Performance of Alternative Shear Connectors ..................................115 3.10.6.5 Grouping Effects of Shear Connectors ..............................................116
3.10.7 Analysis of Interface Shear ...............................................................................119 3.10.8 The Importance of System Detailing on Performance and Failure
Mechanisms ......................................................................................................120 3.10.8.1 Failure Mechanisms Observed ..........................................................123
3.10.9 Discussion and Redesign of Pocket Requirements ...........................................128
3.11 SUMMARY ......................................................................................................................132
4 MATERIALS .......................................................................................................................135
4.1 HAUNCH GROUT MATERIAL ..........................................................................................135 4.1.1 Experimental Plan .............................................................................................135
4.1.1.1 Design Considerations and Testing Procedures................................135 4.1.1.2 Flowability .........................................................................................135 4.1.1.3 Segregation ........................................................................................137 4.1.1.4 Bleeding .............................................................................................139 4.1.1.5 Expansion/Subsidence........................................................................139 4.1.1.6 Fresh Density .....................................................................................140 4.1.1.7 Compressive Strength ........................................................................140 4.1.1.8 Length Change ...................................................................................140
4.1.2 Prepackaged Grout Testing ...............................................................................141 4.1.2.1 Mixing Variables ................................................................................141 4.1.2.2 Materials ............................................................................................142
4.1.3 Results and Analysis of Prepackaged Grout .....................................................143 4.1.3.1 Flowability .........................................................................................143 4.1.3.2 Bleeding .............................................................................................144 4.1.3.3 Expansion/Subsidence........................................................................145 4.1.3.4 Compressive Strength ........................................................................146 4.1.3.5 Shrinkage ...........................................................................................148 4.1.3.6 Summary ............................................................................................149
4.1.4 Conventional Grout Testing ..............................................................................150 4.1.4.1 Experimental Plan .............................................................................150 4.1.4.2 Materials ............................................................................................151
4.1.5 Results and Analysis of Conventional Grout Testing .......................................153 4.1.5.1 Preliminary Testing ...........................................................................153 4.1.5.2 Control Mixture .................................................................................158 4.1.5.3 Full Factorial Analysis of Grout Parameters ....................................159
4.1.6 Summary of Haunch Grout Mixtures ...............................................................169 4.1.7 Constructability and Proposed Special Specifications ......................................169
x
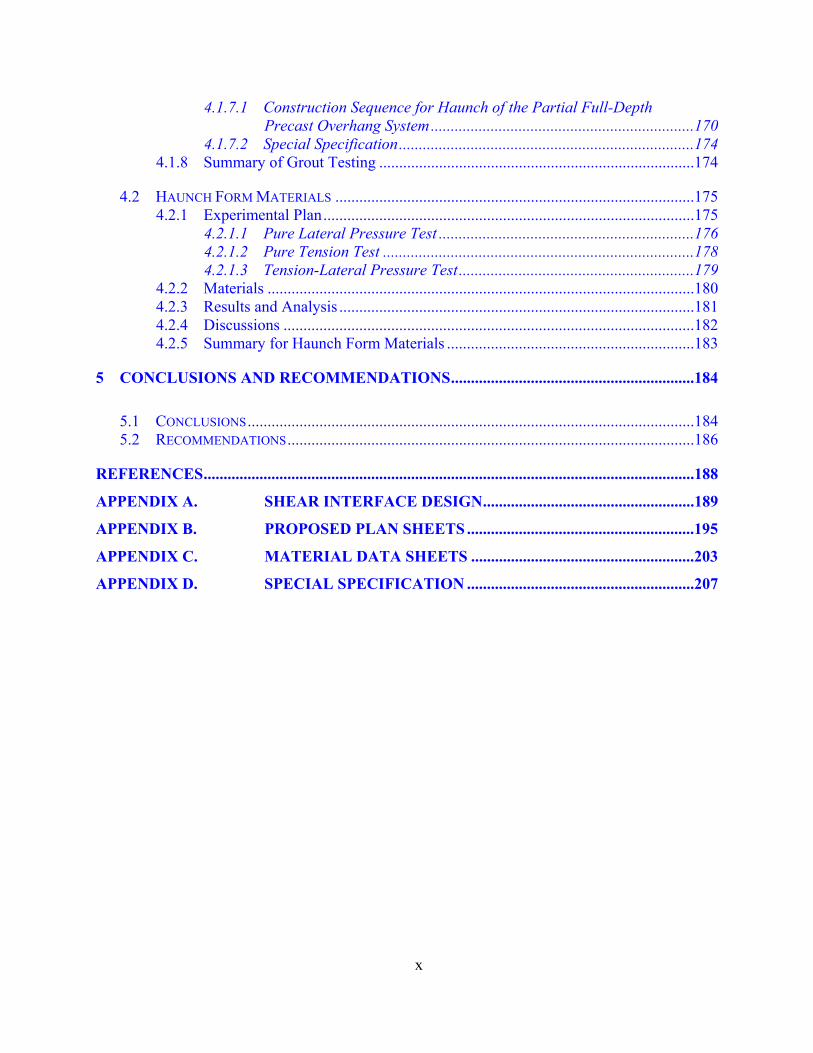
4.1.7.1 Construction Sequence for Haunch of the Partial Full-Depth Precast Overhang System ..................................................................170
4.1.7.2 Special Specification ..........................................................................174 4.1.8 Summary of Grout Testing ...............................................................................174
4.2 HAUNCH FORM MATERIALS ..........................................................................................175 4.2.1 Experimental Plan .............................................................................................175
4.2.1.1 Pure Lateral Pressure Test ................................................................176 4.2.1.2 Pure Tension Test ..............................................................................178 4.2.1.3 Tension-Lateral Pressure Test ...........................................................179
4.2.2 Materials ...........................................................................................................180 4.2.3 Results and Analysis .........................................................................................181 4.2.4 Discussions .......................................................................................................182 4.2.5 Summary for Haunch Form Materials ..............................................................183
5 CONCLUSIONS AND RECOMMENDATIONS .............................................................184
5.1 CONCLUSIONS ................................................................................................................184 5.2 RECOMMENDATIONS ......................................................................................................186
REFERENCES ...........................................................................................................................188
APPENDIX A. SHEAR INTERFACE DESIGN .....................................................189
APPENDIX B. PROPOSED PLAN SHEETS .........................................................195
APPENDIX C. MATERIAL DATA SHEETS ........................................................203
APPENDIX D. SPECIAL SPECIFICATION .........................................................207
xi
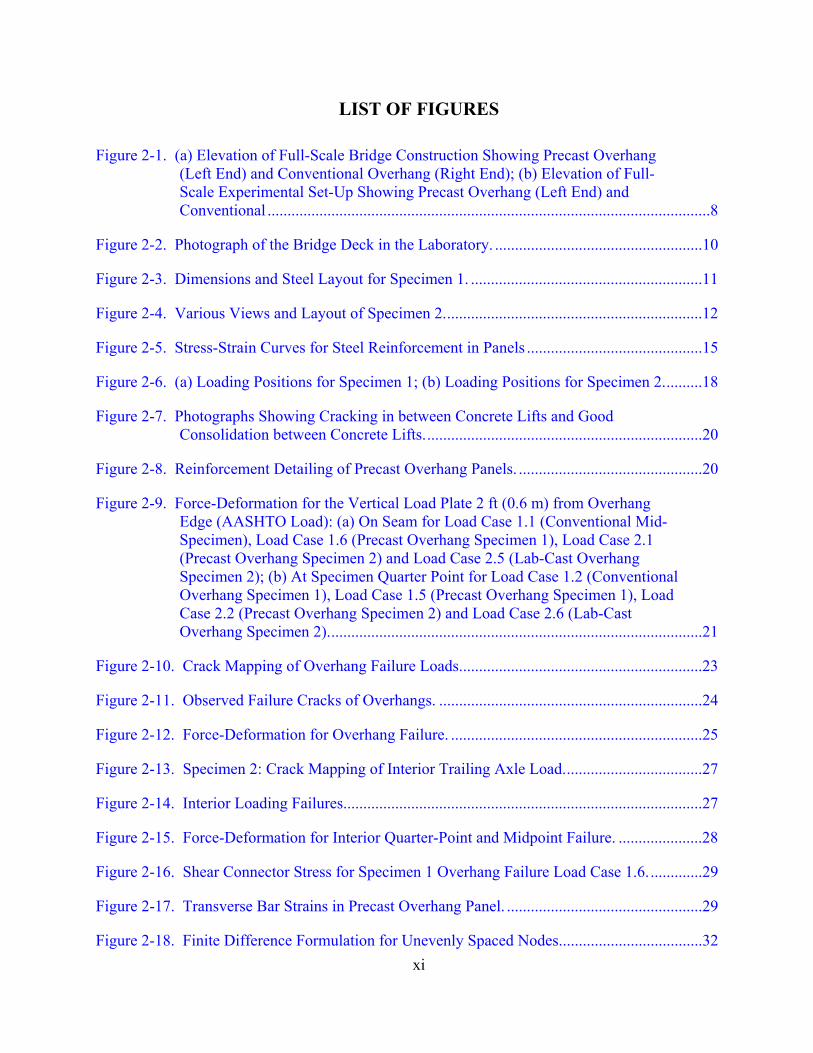
LIST OF FIGURES
Figure 2-1. (a) Elevation of Full-Scale Bridge Construction Showing Precast Overhang (Left End) and Conventional Overhang (Right End); (b) Elevation of Full-Scale Experimental Set-Up Showing Precast Overhang (Left End) and Conventional ...............................................................................................................8
Figure 2-2. Photograph of the Bridge Deck in the Laboratory. ....................................................10
Figure 2-3. Dimensions and Steel Layout for Specimen 1. ..........................................................11
Figure 2-4. Various Views and Layout of Specimen 2. ................................................................12
Figure 2-5. Stress-Strain Curves for Steel Reinforcement in Panels ............................................15
Figure 2-6. (a) Loading Positions for Specimen 1; (b) Loading Positions for Specimen 2. .........18
Figure 2-7. Photographs Showing Cracking in between Concrete Lifts and Good Consolidation between Concrete Lifts. .....................................................................20
Figure 2-8. Reinforcement Detailing of Precast Overhang Panels. ..............................................20
Figure 2-9. Force-Deformation for the Vertical Load Plate 2 ft (0.6 m) from Overhang Edge (AASHTO Load): (a) On Seam for Load Case 1.1 (Conventional Mid-Specimen), Load Case 1.6 (Precast Overhang Specimen 1), Load Case 2.1 (Precast Overhang Specimen 2) and Load Case 2.5 (Lab-Cast Overhang Specimen 2); (b) At Specimen Quarter Point for Load Case 1.2 (Conventional Overhang Specimen 1), Load Case 1.5 (Precast Overhang Specimen 1), Load Case 2.2 (Precast Overhang Specimen 2) and Load Case 2.6 (Lab-Cast Overhang Specimen 2). .............................................................................................21
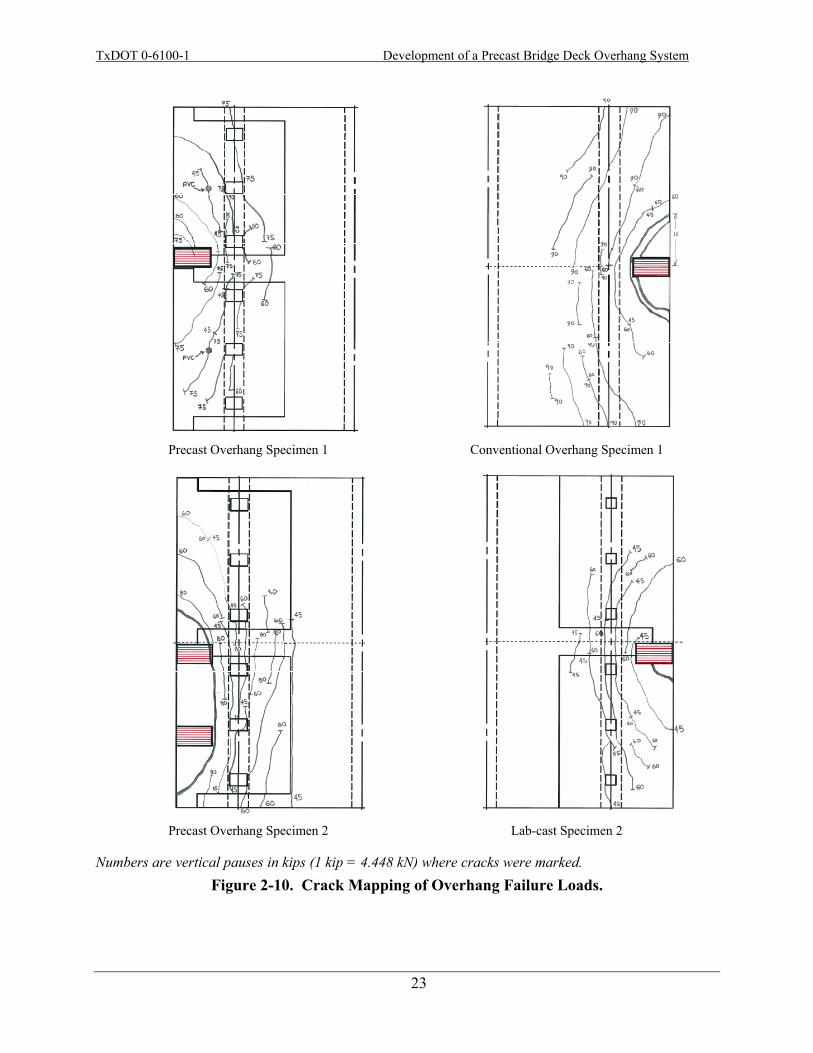
Figure 2-10. Crack Mapping of Overhang Failure Loads. ............................................................23
Figure 2-11. Observed Failure Cracks of Overhangs. ..................................................................24
Figure 2-12. Force-Deformation for Overhang Failure. ...............................................................25
Figure 2-13. Specimen 2: Crack Mapping of Interior Trailing Axle Load. ..................................27
Figure 2-14. Interior Loading Failures..........................................................................................27
Figure 2-15. Force-Deformation for Interior Quarter-Point and Midpoint Failure. .....................28
Figure 2-16. Shear Connector Stress for Specimen 1 Overhang Failure Load Case 1.6. .............29
Figure 2-17. Transverse Bar Strains in Precast Overhang Panel. .................................................29
Figure 2-18. Finite Difference Formulation for Unevenly Spaced Nodes. ...................................32
xii
Figure 2-19. Assumed Yield Line Mechanism for Conventional Overhang Loaded to Failure. ......................................................................................................................37
Figure 2-20. Plan and Side Elevations Showing Punching-Shear Failure of Interior of Deck Slab. ..........................................................................................................................41
Figure 2-21. Flexural-Shear Failure of Interior Bridge Deck Specimen. .....................................43
Figure 2-22. Load Case 1.3 – the Conventional Overhang Loaded to Failure at 97 kips (432 kN). (a) Longitudinal Displacement Profile; (b) Longitudinal Curvature Profile; (c) Transverse Displacement Profile. ...........................................................46
Figure 2-23. Load Case 1.6 – the Prestressed-Precast Overhang Loaded to Failure at 84 kips (374 kN). (a) Longitudinal Displacement Profile; (b) Longitudinal Curvature Profile; (c) Transverse Displacement Profile. ..........................................47
Figure 2-24. Load Case 2.7 – the Lab-Cast Overhang Loaded to Failure at 67 kips (298 kN). (a) Longitudinal Displacement Profile; (b) Longitudinal Curvature Profile; (c) Transverse Displacement Profile. ...........................................................49
Figure 2-25. Load Case 2.3 – the Prestressed-Precast Overhang, Trailing Wheel Load Loaded to Failure at 81 kips (360 kN). (a) Longitudinal Displacement Profile; (b) Longitudinal Curvature Profile; (c) Transverse Displacement Profile. ..............51
Figure 2-26. Load Case 2.4 – the Prestressed-Precast Interior Failure Longitudinal Results, (Trailing Wheel load on Single Panel) Loaded to Failure at 127 kips (565 kN). (a) Longitudinal Displacement Profile; (b) Longitudinal Curvature Profile. ...........54
Figure 2-27. Load Case 2.4 – the Prestressed-Precast Interior Failure Transverse Results, (Trailing Wheel Load on Single Panel) Loaded to Failure at 127 kips (565 kN). (a) Transverse Displacement Profile; (b) Transverse Curvature Profile. .........55
Figure 2-28. Load Case 2.8 – the Lab-Cast Interior Failure Longitudinal Results, (Trailing Wheel Load Straddling Seam) Loaded to Failure at 149 kips (663 kN). (a) Longitudinal Displacement Profile; (b) Longitudinal Curvature Profile. ...........56
Figure 2-29. Load Case 2.8 – the Lab-Cast Interior Failure Transverse Results, (Trailing Wheel Load Straddling Seam) Loaded to Failure at 149 kips (663 kN). (a) Transverse Displacement Profile; (b) Transverse Curvature Profile. .................57
Figure 2-30. Experimental/Theoretical Load Ratio for Failure Load Cases Using Different Analysis Techniques. ................................................................................................60
Figure 2-31. Load Case 1.3 – Credible Failure Modes for Conventional Overhang. ...................61
Figure 2-32. Surface Cracks and Failure Mechanism Loads for Load Case 1.6 and Load Case 2.7; the Prestressed-Precast Overhang and Lab-Cast Overhang, Respectively. .............................................................................................................63
xiii
Figure 2-33. Load Case 2.3; Credible Failure Modes for Prestressed-Precast Overhang with Trailing Wheel Load. ........................................................................................64
Figure 2-34. Load Case 2.4; Credible Failure Modes for Precast Interior with Trailing Wheel Load on Single Panel. ....................................................................................66
Figure 2-35. Load Case 2.8; Credible Failure Modes for Lab-Cast Interior with Trailing Wheel Load Straddling Seam. ..................................................................................67
Figure 2-36. Typical Layout of a Test Specimen. ........................................................................70
Figure 2-37. The Intended and Actual Detail Used in Specimens 3 and 4. ..................................71
Figure 2-38. The Load Points Investigated for Specimens 3 and 4. .............................................72
Figure 2-39. Locations of Materials Used in Specimens 3 and 4. ................................................73
Figure 2-40. Crack Pattern for the Conventional and Precast Systems for the Midspan Loading Investigated in Specimen 3. ........................................................................74
Figure 2-41. Crack Pattern for the Conventional and Precast Systems for the Corner Loading Investigated in Specimen 4. ........................................................................74
Figure 2-42. The Load versus Surface Strain for the Precast and Conventional Overhangs for the Midspan Loading of Specimen 3. ..................................................................75
Figure 2-43. The Load versus Load Point Deflection for the Precast and Conventional Overhangs for the Midspan Loading of Specimen 3. ...............................................75
Figure 2-44. The Load versus Surface Strain for the Precast and Conventional Overhangs for the Corner Loading of Specimen 4. ....................................................................76
Figure 3-1. Specimen ID Designation Key. ..................................................................................82
Figure 3-2. Experimental Test Setup: (a) Photograph from Laboratory Floor; (b) Photograph from Laboratory Balcony; (c) Side Elevation. .................................85
Figure 3-3. Reinforcing Details for Shear Test Beams. ................................................................87
Figure 3-4. CIP Details of Beam-to-Slab Shear Connections.......................................................88
Figure 3-5. Beam Cross Sectional Views of Shear Connectors and Photographs of the TRC and TR Shear Connections Tested. ...........................................................................89
Figure 3-6. Photograph of BC Pre-Installed Shear Connections Specimens. ...............................90
Figure 3-7. Photographs of post-Installed Shear Connections Specimens: (a) NS, (b) TRS, (c) KB, and (d) TRE..................................................................................................91
xiv
Figure 3-8. Typical Reinforcement Layout of Precast Shear Deck Specimens. ...........................92
Figure 3-9. Photograph of Typical Reinforcing Layout of a CIP Shear Test Deck Specimen. ..................................................................................................................93
Figure 3-10. Photograph of LVDTs and String Potentiometers Connected to a Shear Test Specimen. ..................................................................................................................94
Figure 3-11. Stress-Strain Curve from Tensile Test of High-Strength Threaded Rod (ASTM A193 B7). ....................................................................................................96
Figure 3-12. (a) Experimental Data for Tests #1-13; (b) Experimental Data for Tests #14-24...............................................................................................................................99
Figure 3-13. Typical Plot of Lateral Force versus Relative Displacement for Shear Specimens with Critical Parameters Noted and Referred to in Table 3-3. .............100
Figure 3-14. Normalized Lateral Force versus Relative Displacement for 2.0-in. (51 mm) Haunch R-bar Specimens. .......................................................................................103
Figure 3-15. Plot of Normalized Lateral Force versus Relative Displacement for 2.0-in. (51 mm) and 3.5-in. (89 mm) Haunch Specimens with TR and TRC Connectors. .............................................................................................................105
Figure 3-16. Plot of Normalized Lateral Force versus Relative Displacement for Each Type of Post-Installed Specimen. ...........................................................................109
Figure 3-17. Plot of Normalized Lateral Force versus Relative Displacement for All 2.0-in. (51 mm) Haunch Pre-Installed (Precast) Specimens. .............................................111
Figure 3-18. Plot of Normalized Lateral Force versus Relative Displacement for All 3.5-in. (89 mm) Haunch Pre-Installed (Precast) Specimens along with the 2_TRC_2.0_A as a Baseline for Comparison. ........................................................111
Figure 3-19. Photographs of Shear Connections in from the Research Specimens with Roughened Surfaces: (a) Overhead View of a Mechanically Roughened Beam Top; (b) Elevation View of a Beam Surface, Mechanically Roughened to ~0.25-in (6.4 mm) Amplitude; (c) TRS Connectors in a Roughened Beam. .........112
Figure 3-20. Plot of Normalized Lateral Force versus Relative Displacement for All Specimens with Mechanically Roughened Mating Surfaces. .................................113
Figure 3-21. Plot of Normalized Lateral Force versus Relative Displacement to Show the Effect of an Alternative Grout between Otherwise Identical Specimens. ..............114
Figure 3-22. Plot of Normalized Lateral Force versus Relative Displacement of the Alternative Connector Types – BC and NS. ...........................................................115

xv
Figure 3-23. Normalized Lateral Force versus Relative Displacement to Show Grouping Effects among the BC Specimens. ..........................................................................117
Figure 3-24. Normalized Lateral Force versus Relative Displacement to Show Grouping Effects between the NS Specimens. ........................................................................118
Figure 3-25. Normalized Lateral Force versus Relative Displacement to Show Grouping Effects between the TRS_Rough Specimens. .........................................................119
Figure 3-26. Strut-and-Tie Mechanism within the Beams Tested. .............................................121
Figure 3-27. Hoopsets Grouped on Either Side of the Fasteners. ...............................................122
Figure 3-28. Examples of Specimens that Exhibited a Sliding Shear Failure Mechanism. .......123
Figure 3-29. 2_NS_2.0 Exhibited a Sliding Shear Failure that Resulted in both NSs Shearing. .................................................................................................................124
Figure 3-30. After Exhibiting Sliding Shear past 1.0 in. (25 mm) Relative Displacement, One of the Threaded Rods in 2_TRC_2.0_A Sheared at the Top of the Coupler and the Beam Cover Concrete Spalled off as the Load Was Redistributed to the Other Connector. ....................................................................124
Figure 3-31. Photographs of Shear Test Specimens that Exhibited a Brittle Beam Failure. ......125
Figure 3-32. (a) Plot of Lateral Force versus Relative Displacement for Specimens Exhibiting Complex Failure Mechanism; (b) Plot of Normalized Lateral Force versus Relative Displacement for Specimens Exhibiting Complex Failure Mechanism. .............................................................................................................126
Figure 3-33. Photographs of 2_TR_2.0_B after Testing. ...........................................................127
Figure 3-34. Photographs of the Cone Pullout Failure Exhibited by 2_BC_2.0. .......................128
Figure 3-35. Schematic of the Design Spectrum for TRC Shear Connections. ..........................132
Figure 4-1. Efflux Cone Test. .....................................................................................................136
Figure 4-2. Testing Procedures for the Flow Cone Test. ............................................................137
Figure 4-3. Examples of Good Flow Cone Tests and Tests that Show Clear Signs of Segregation. ............................................................................................................138
Figure 4-4. Sand Particle Size Distribution Curve......................................................................143
Figure 4-5. Influence of Time and Sand Content on Efflux Time. .............................................144
Figure 4-6. Efflux Time and Flow Cone Results. .......................................................................144
xvi
Figure 4-7. (a) Bleed Water Percentages for Increasing Sand Contents; (b) Expansion/Subsidence Profile of Prepackaged Grout Mixtures. ......................145
Figure 4-8. Volume Change Profiles of Mixes with Varying Sand Percentages. .......................147
Figure 4-9. Strength Development Curves for Different w/p. ....................................................148
Figure 4-10. Volume Change Curves for Different w/p. ............................................................149
Figure 4-11. Comparison of 7-Day Compressive Strength versus Efflux Time. ........................150
Figure 4-12. Effects of Increasing Dosages of Grout Expanding Aid. .......................................155
Figure 4-13. Effects of Increasing Dosages of GEA. .................................................................156
Figure 4-14. Detailed Analysis on the Effects of Individual Constitiuent Changes to Flowability. .............................................................................................................161
Figure 4-15. Detailed Analysis on the Effects of Individual Constituent Changes to Subsidence/Expansion. ...........................................................................................163
Figure 4-16. The Effects of Individual Constitiuent Changes on 7-Day Compressive Strength. ..................................................................................................................164
Figure 4-17. Shrinkage Curves for Changes in Individual Constituents. ...................................166
Figure 4-18. Sensitivity Analysis of Test Results for Conventional Grout. ...............................168
Figure 4-19. Experimental Setup for the Lateral Pressure Test. .................................................177
Figure 4-20. A Lateral Pressure Test Specimen at Failure. ........................................................178
Figure 4-21. Experimental Setup for the Tension Test. ..............................................................179
TxDOT 0-6100-1 Development of a Precast Bridge Deck Overhang System
xvii
LIST OF TABLES
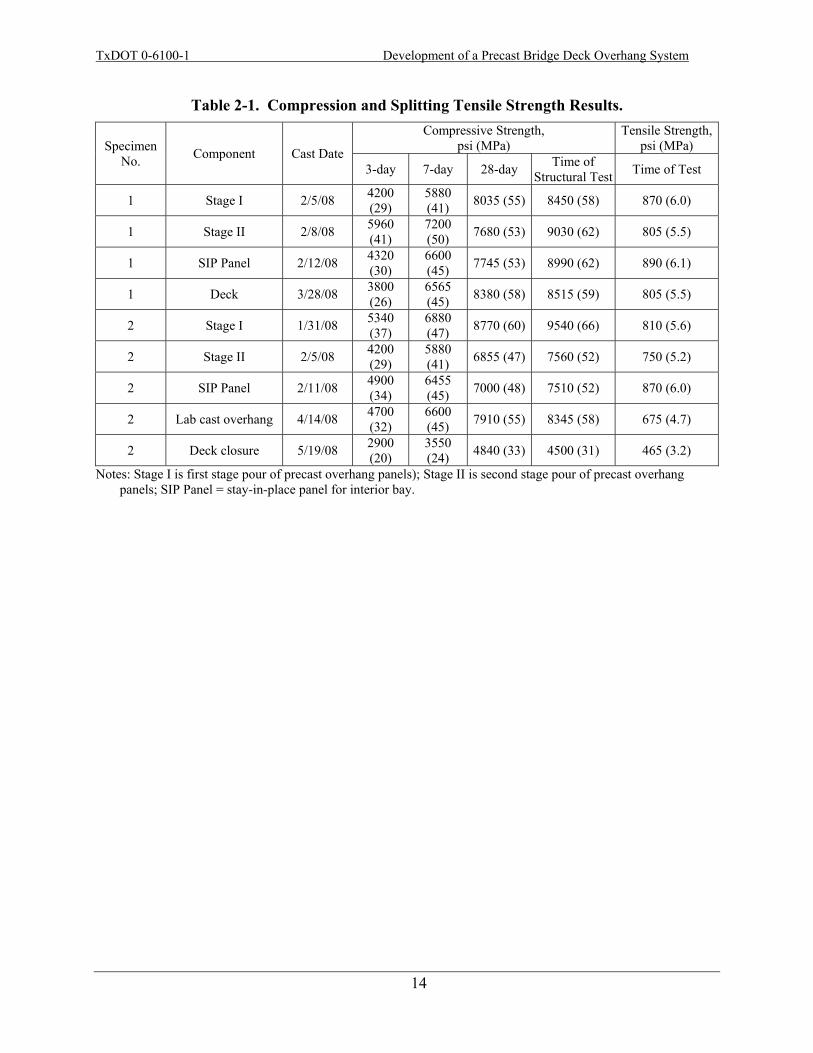
Table 2-1. Compression and Splitting Tensile Strength Results. .................................................14
Table 2-2. Stress and Strain Values for Steel Reinforcement. ......................................................15
Table 2-3. Peak Loads and Factors of Safety for Tested Double-Panel Bridge Deck System. ......................................................................................................................30
Table 2-4. Summary of Yield Loads and Failure Curvatures for Longitudinal Profiles. .............44
Table 2-5. Moment Capacities per Unit Width for All Bridge Deck Sections Using Actual Material Properties. ...................................................................................................58
Table 2-6. Experimental and Theoretical Failure Loads and Their Ratios. ..................................59
Table 2-7. Experimental/Theoretical Failure Load Ratios. ..........................................................59
Table 2-8. Summary of the Average Material Properties of the Mixtures Used in Specimens 3 and 4. ...................................................................................................73
Table 2-9. The Cracking Load, Maximum Load, and Safety Factor for Specimens 3 and 4. ......74
Table 3-1. Matrix of Shear Test Specimens. .................................................................................83
Table 3-2. Matrix of Compressive Strengths for Shear Test Haunch, Deck, Pocket, and Beam. ........................................................................................................................97
Table 3-3. Raw Experimental Data for All Shear Tests. ............................................................101
Table 3-4. Analysis of Data from All Shear Tests. .....................................................................102
Table 3-5. Key Data from NS Specimens Compared with the Same Data from Similar Specimens from Previous Research (Scholz et al., 2007). .....................................116
Table 3-6. Number of Pockets Needed in Panels for Shear Distribution for 1 and 2 TRC Fasteners Assuming an Effective Coefficient of Friction of 0.4, 0.6, and 0.8, and Grouping of Hoopsets around the Connector based on the Design Assumptions Noted Earlier and a 2-inch (51 mm) Haunch. ...................................130
Table 4-1. Degree of Segregation Table Considering VGSI. .....................................................139
Table 4-2. Test Matrix of Prepackaged Grout Mix Designs. .......................................................141
Table 4-3. Characteristics of Sand. ..............................................................................................142
Table 4-4. Chemical Composition of Cement Used, in Percent. .................................................152
TxDOT 0-6100-1 Development of a Precast Bridge Deck Overhang System
xviii
Table 4-5. Physical Properties of Cement Used. ........................................................................152
Table 4-6. Chemical Composition of Class C Fly Ash Used, in Percent. ..................................152
Table 4-7. Fresh and Hardened Properties of Grout with Varying Mixing Speeds. ...................154
Table 4-8. Test Matrix of Prepackaged Grout Mix Designs. ......................................................157
Table 4-9. Range of Mixture Proportions Evaluated in Study. ....................................................160
Table 4-10. Recommended Ranges for Grout Properties. ..........................................................169
Table 4-11. Grout Placement Procedure. .....................................................................................171
Table 4-12. Laboratory Model. ....................................................................................................173
Table 4-13. Summary of the Foam Properties Reported by the Manufacturer. ..........................180
Table 4-14. Summary of the Testing for the Foams and Adhesives Investigated. .....................181
TxDOT 0-6100-1 Development of a Precast Bridge Deck Overhang System
1
EXECUTIVE SUMMARY
This report contains a summary of the testing and analysis completed through December 2008
under Texas Department of Transportation (TxDOT) project 0-6100, “Development of a Precast
Bridge Deck Overhang System.” An initial report (0-6100-2) was submitted to TxDOT
specifically addressing needs for the Rock Creek Bridge; this report includes much of the same
information and data, however, with a more comprehensive analysis. The system characteristics
investigated in this report includes: the structural capacity of the precast overhang system and the
corresponding deck joints; the interface shear capacity of the connectors, grout materials, and
performance parameters; and the development of a haunch form system. The girder and rail
performance were not evaluated and no recommendations are provided on the performance of
these systems. The design for the precast overhang panels assessed in the research and presented
in this report performed satisfactorily in all of the testing conducted for the loading specified by
the AASHTO LRFD 2007 Bridge Design Specifications, with the exception of the shear
capacity. Further testing was required to develop a connector system that increased the shear
capacity of the deck-girder connectors; the results of this test program are presented in report
0-6100-3.
In review of the test results and recommendations contained in this report, it is the
authors’ opinion that the precast overhang system can provide a system with comparable
structural performance to a bridge deck system using the conventional reinforced overhang
details typically used by TxDOT assuming sufficient pockets can be included on the overhang
panels. After the shear capacity issue is resolved, it appears that this system can provide
significant improvements in safety, constructability, and economy over the conventional
overhang system.
Insofar as the interface shear is concerned between the prestressed-precast full-depth
deck panels that are seated on a grout bed connected by threaded-rods with couplers in concrete
filled pockets, the performance did not meet the requirements assumed in the initial design. The
interface roughness between the deck-haunch-beam-system may be a critical parameter in
providing shear resistance once the breakaway strength of the concrete is exceeded. Testing

TxDOT 0-6100-1 Development of a Precast Bridge Deck Overhang System
2
indicates that the grout has a dependable coefficient of friction of not more than 0.4. This was
reported as not being sufficient in the initial report (0-6100-2), and special roughening of the
girder top and panel bottom may improve the performance. However, the additional testing
reported herein indicate that the number of shear pockets could be reduced, although not
significantly. As noted in the first report, it is imperative that the threaded-rod shear connectors
are appropriately anchored with sufficient beam hoop steel nearby to ensure distress to the
prestressed concrete web of the girders does not occur. However, no testing was done on the
beam (girder) system.
In conclusion, the research team supports the approach of constructing the precast
overhang system with the modified details, design procedures, and material recommendations
contained in this report. This recommendation is based on testing results from the laboratory.
Results from the additional shear testing will provide more data to make a recommendation on
the number of pockets needed for the overhang system (included in 0-6100-3). Optimizing the
number of pockets will provide better economy, constructability, and safety leading to a system
that will more likely be implemented.
Portions of this report are duplicated from the initial report, 0-6100-2, to provide the
reader with sufficient information without the need to read report 0-6100-2.

TxDOT 0-6100-1 Development of a Precast Bridge Deck Overhang System
3
1 INTRODUCTION
The construction of bridges is costly. In addition, workers constructing these bridges can often
be placed in unsafe conditions. Optimizing design and construction processes for accelerated
bridge construction can provide significant benefits, including the improved economy and safety.
Badie et al. recently reviewed the state-of-the-art of accelerated bridge deck construction (2006).
Research and case studies were presented in this document and a description of several
methodologies for accelerated construction was provided. Guidance was also provided to
overcome the following challenges with full-depth bridge deck construction:
• adjustment of precast panel grading to meet construction tolerances,
• methodologies to provide structural compatibility between the girders and bridge deck, and
• performance of different cementitious grouts needed for the accelerated bridge deck systems.
Some issues that received limited coverage in the document but still are in need of more
research work include:
• ability to provide a durable design,
• ability to achieve an acceptable ride (smoothness),
• impact on safety,
• ability to provide a functioning form between the variable area between the beam and the deck panel (haunch),
• verification of the composite action between the precast deck system and girder,
• comparison between the accelerated and conventional methodologies to determine the impact on construction schedule and cost,

TxDOT 0-6100-1 Development of a Precast Bridge Deck Overhang System
4
• validation testing of full-scale beams to observe the shear/flexure interaction of various system components subjected to field conditions, and
• resolution of potential challenges associated with proper seating of warped panels due to differential drying and shrinkage.
While the use of full-depth bridge decks have the ability to increase the speed of bridge
deck construction, care should be taken to be sure that the above items have been addressed and
that the resulting system provides benefits, both short- and long-term, not achieved with
conventional construction techniques. This research investigated precast, prestressed panels for
bridge overhang systems. The research team investigated four specific areas, including:
• the evaluation of precast, prestressed overhang capacity;
• the evaluation of the performance and constructability of the shear connection details;
• the evaluation of grout materials for the haunch; and
• the assessment of constructability issues, including haunch forming and grout placement.
This research program was divided into two general phases. Phase I included the
evaluation and reporting of the above listed items necessary for the Rock Creek Bridge in Parker
County, Texas. The objective of this phase was to assess the system design, materials, and
methods specifically for this bridge, not necessarily to optimize these issues but instead to
identify systems, materials, and methods that could be used in the Rock Creek Bridge. The
research team, in collaboration with engineers from the Texas Department of Transportation
(TxDOT), identified potential systems and processes that could be used, and these were
evaluated by the research group. Phase II of the research will focus more on the optimization of
materials and design issues. A report will be submitted after the conclusion of the Phase II
research.
As a result of the very aggressive research schedule and need to deliver a report before
the letting of the Rock Creek Bridge, researchers from the Texas Transportation Institute (TTI)
teamed with researchers from Oklahoma State University (OSU). The TTI researchers focused
their efforts on the capacity testing of double-panel, overhang deck systems, shear capacity of

TxDOT 0-6100-1 Development of a Precast Bridge Deck Overhang System
5
shear connections, and grout performance. OSU researchers focused their efforts on capacity
testing of a single overhang deck system and the development and testing of haunch forms. TTI
and OSU researchers worked closely with TxDOT personnel on the preliminary design and
testing plan for the research. Constructability issues were addressed at both research institutes.
This report is organized into five chapters: 1–Introduction; 2–Bridge Overhang System;
3–Shear Connections; 4–Materials; and 5–Conclusions and Recommendations.

TxDOT 0-6100-1 Development of a Precast Bridge Deck Overhang System
7
2 BRIDGE OVERHANG SYSTEM
2.1 INTRODUCTION
The research team and TxDOT personnel met on several occasions to develop and review
designs options for precast, prestressed overhang panels for the Rock Creek Bridge. Appendix A
shows the design of the overhang panel system with the shear design. Testing was performed at
TTI and OSU laboratories. Researchers at TTI experimentally evaluated deck systems with
double-panel specimens, with an emphasis on examining the panel-to-panel seams. Researchers
at OSU evaluated single-panel systems.
Approximately 85 percent of new concrete bridge decks in the state of Texas use
stay-in-place (SIP), precast, prestressed panels spanning between adjacent beams (right end of
Figure 2-1a). These panels are nominally 4-in. (102 mm) thick and prestressed transversely to
the direction of traffic flow. A second stage concrete pour of 4 in. (102 mm) in thickness is cast
on top of the stay-in-place panels. One of the main difficulties with this system is forming the
deck overhang to cast a full 8-in. (203 mm) thick deck section. Formwork has to be attached to
the outside girder, making it a time-consuming and potentially unsafe operation. TxDOT has
recently developed a precast, full-depth overhang system that potentially reduces the cost of
construction and improves safety, long-term durability, and the speed of construction of the
bridge (left end of Figure 2-1a).
2.2 DOUBLE-PANEL TESTING
This section presents results from an investigation on the performance of full-depth, double-
panel precast overhang systems, where the flexural capacity and failure modes of the panels were
evaluated. In particular, the general capacity and the effect of the transverse seam between
adjacent panels was assessed and compared with the conventional cast-in-place (CIP) system
with continuous longitudinal reinforcement and no transverse seams. Figure 2-1b shows the set-
up for experimental testing. This system consists of a standard TxDOT bridge overhang and the
TxDOT 0-6100-1 Development of a Precast Bridge Deck Overhang System
8
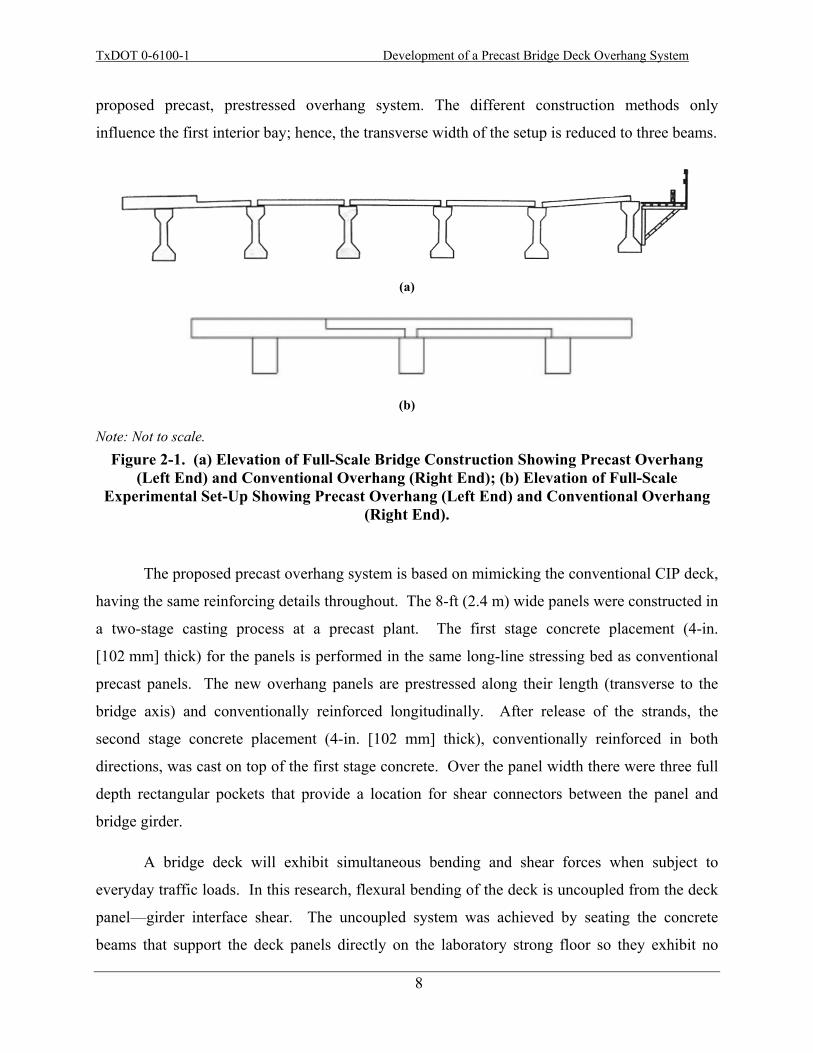
proposed precast, prestressed overhang system. The different construction methods only
influence the first interior bay; hence, the transverse width of the setup is reduced to three beams.
(a)
(b)
Note: Not to scale.
Figure 2-1. (a) Elevation of Full-Scale Bridge Construction Showing Precast Overhang (Left End) and Conventional Overhang (Right End); (b) Elevation of Full-Scale
Experimental Set-Up Showing Precast Overhang (Left End) and Conventional Overhang (Right End).
The proposed precast overhang system is based on mimicking the conventional CIP deck,
having the same reinforcing details throughout. The 8-ft (2.4 m) wide panels were constructed in
a two-stage casting process at a precast plant. The first stage concrete placement (4-in.
[102 mm] thick) for the panels is performed in the same long-line stressing bed as conventional
precast panels. The new overhang panels are prestressed along their length (transverse to the
bridge axis) and conventionally reinforced longitudinally. After release of the strands, the
second stage concrete placement (4-in. [102 mm] thick), conventionally reinforced in both
directions, was cast on top of the first stage concrete. Over the panel width there were three full
depth rectangular pockets that provide a location for shear connectors between the panel and
bridge girder.
A bridge deck will exhibit simultaneous bending and shear forces when subject to
everyday traffic loads. In this research, flexural bending of the deck is uncoupled from the deck
panel—girder interface shear. The uncoupled system was achieved by seating the concrete
beams that support the deck panels directly on the laboratory strong floor so they exhibit no
TxDOT 0-6100-1 Development of a Precast Bridge Deck Overhang System
9
longitudinal bending. The full-scale test investigated the failure modes and the capacity of the
new system compared to the conventional CIP overhang system. Two double-panel specimens
were tested at TTI to evaluate load-deformation behavior, map crack formations, and to identify
failure modes. Two single-panel systems were tested and evaluated at OSU.
2.2.1 Experimental Plan
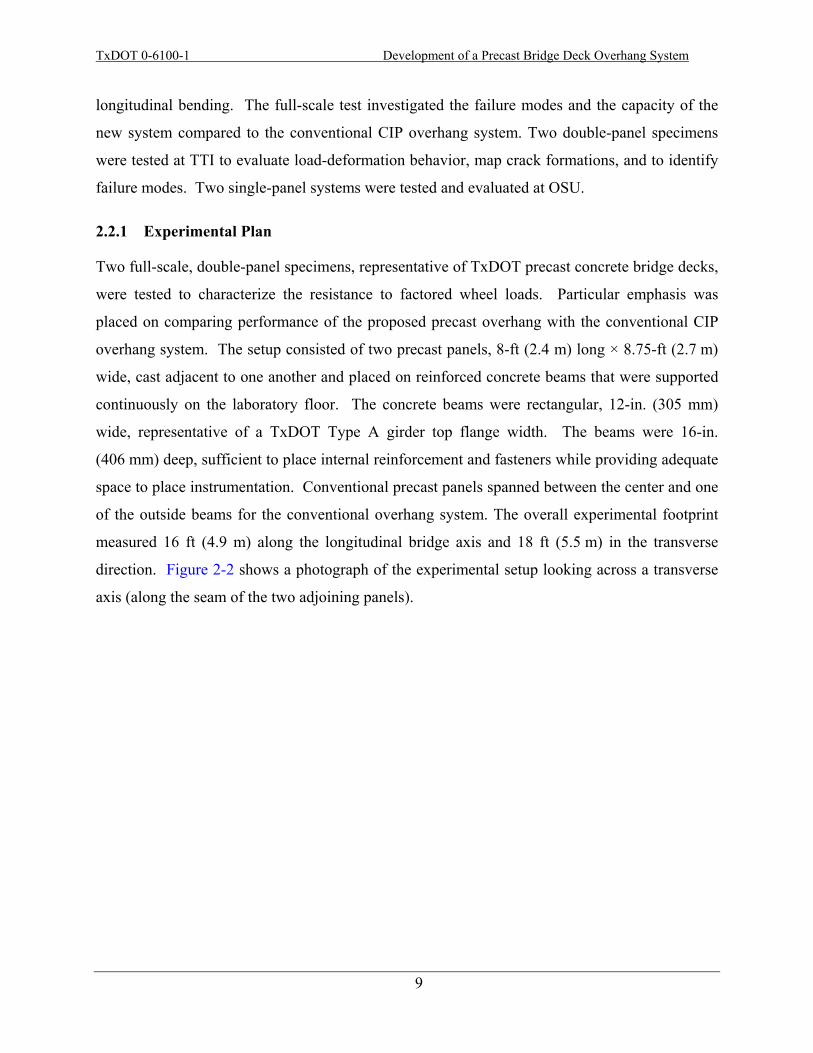
Two full-scale, double-panel specimens, representative of TxDOT precast concrete bridge decks,
were tested to characterize the resistance to factored wheel loads. Particular emphasis was
placed on comparing performance of the proposed precast overhang with the conventional CIP
overhang system. The setup consisted of two precast panels, 8-ft (2.4 m) long × 8.75-ft (2.7 m)
wide, cast adjacent to one another and placed on reinforced concrete beams that were supported
continuously on the laboratory floor. The concrete beams were rectangular, 12-in. (305 mm)
wide, representative of a TxDOT Type A girder top flange width. The beams were 16-in.
(406 mm) deep, sufficient to place internal reinforcement and fasteners while providing adequate
space to place instrumentation. Conventional precast panels spanned between the center and one
of the outside beams for the conventional overhang system. The overall experimental footprint
measured 16 ft (4.9 m) along the longitudinal bridge axis and 18 ft (5.5 m) in the transverse
direction. Figure 2-2 shows a photograph of the experimental setup looking across a transverse
axis (along the seam of the two adjoining panels).
TxDOT 0-6100-1 Development of a Precast Bridge Deck Overhang System
10
Figure 2-2. Photograph of the Bridge Deck in the Laboratory.
2.2.2 Specimen Layout and Reinforcing Details
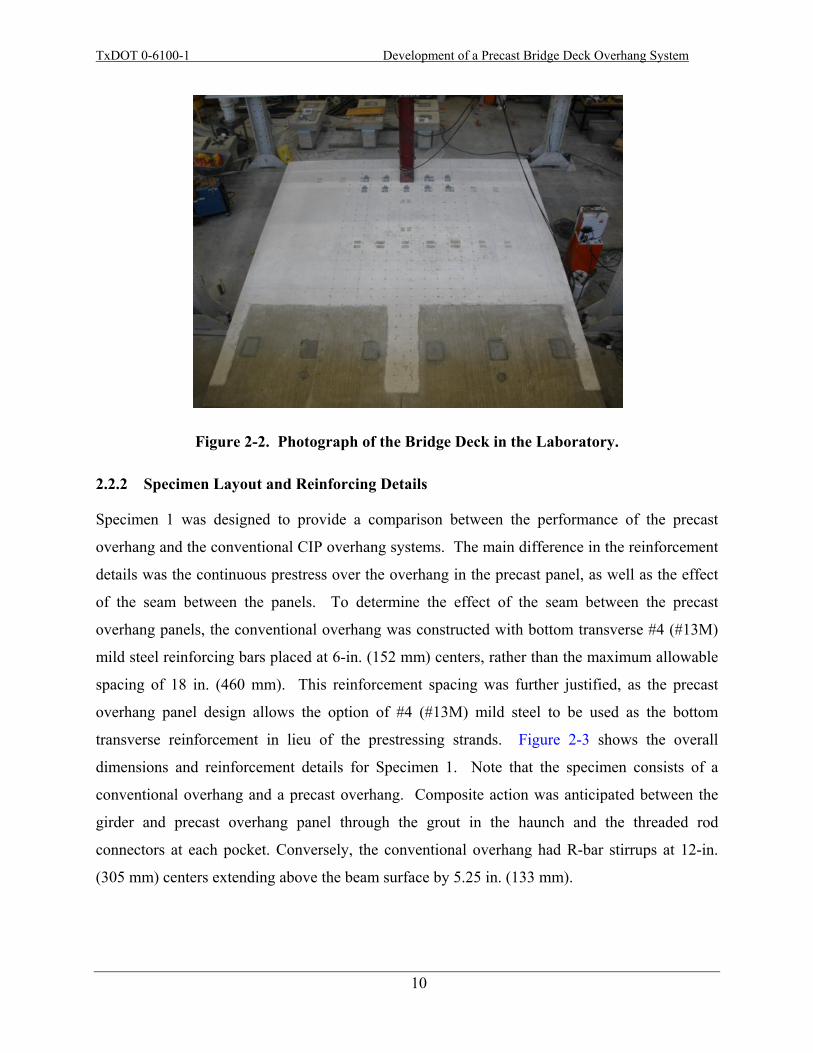
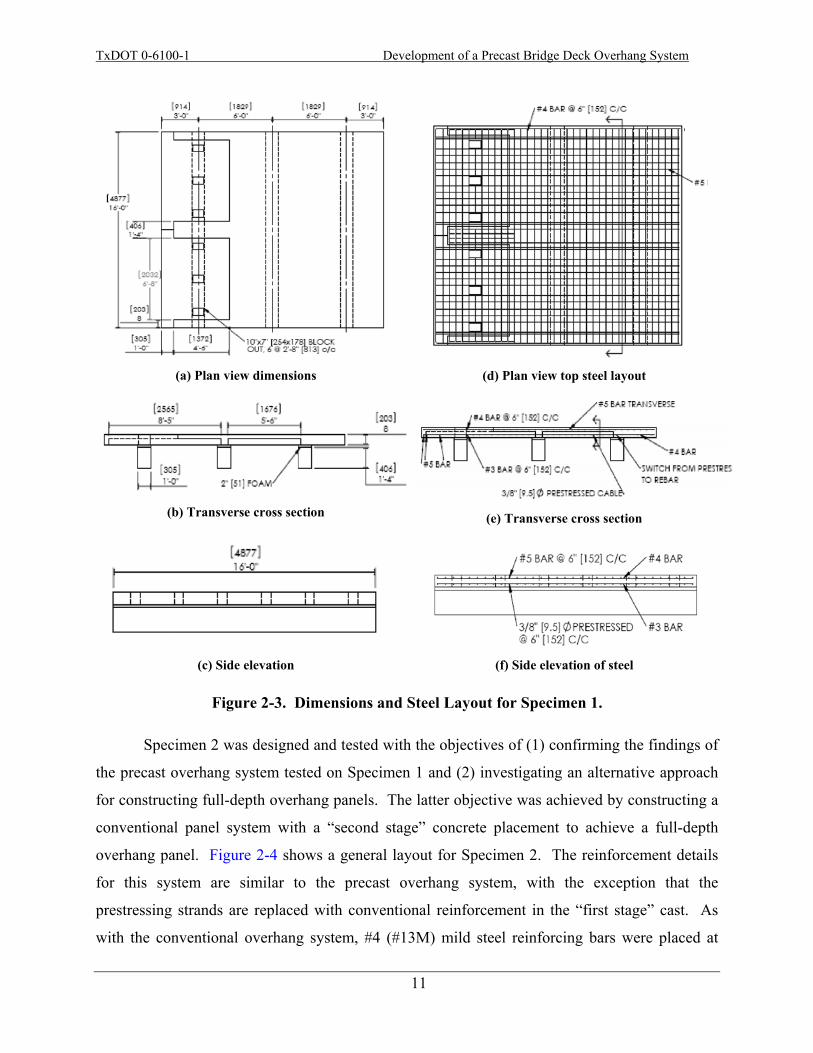
Specimen 1 was designed to provide a comparison between the performance of the precast
overhang and the conventional CIP overhang systems. The main difference in the reinforcement
details was the continuous prestress over the overhang in the precast panel, as well as the effect
of the seam between the panels. To determine the effect of the seam between the precast
overhang panels, the conventional overhang was constructed with bottom transverse #4 (#13M)
mild steel reinforcing bars placed at 6-in. (152 mm) centers, rather than the maximum allowable
spacing of 18 in. (460 mm). This reinforcement spacing was further justified, as the precast
overhang panel design allows the option of #4 (#13M) mild steel to be used as the bottom
transverse reinforcement in lieu of the prestressing strands. Figure 2-3 shows the overall
dimensions and reinforcement details for Specimen 1. Note that the specimen consists of a
conventional overhang and a precast overhang. Composite action was anticipated between the
girder and precast overhang panel through the grout in the haunch and the threaded rod
connectors at each pocket. Conversely, the conventional overhang had R-bar stirrups at 12-in.
(305 mm) centers extending above the beam surface by 5.25 in. (133 mm).
TxDOT 0-6100-1 Development of a Precast Bridge Deck Overhang System
11
(a) Plan view dimensions
(d) Plan view top steel layout
(b) Transverse cross section (e) Transverse cross section
(c) Side elevation
(f) Side elevation of steel
Figure 2-3. Dimensions and Steel Layout for Specimen 1.
Specimen 2 was designed and tested with the objectives of (1) confirming the findings of
the precast overhang system tested on Specimen 1 and (2) investigating an alternative approach
for constructing full-depth overhang panels. The latter objective was achieved by constructing a
conventional panel system with a “second stage” concrete placement to achieve a full-depth
overhang panel. Figure 2-4 shows a general layout for Specimen 2. The reinforcement details
for this system are similar to the precast overhang system, with the exception that the
prestressing strands are replaced with conventional reinforcement in the “first stage” cast. As
with the conventional overhang system, #4 (#13M) mild steel reinforcing bars were placed at
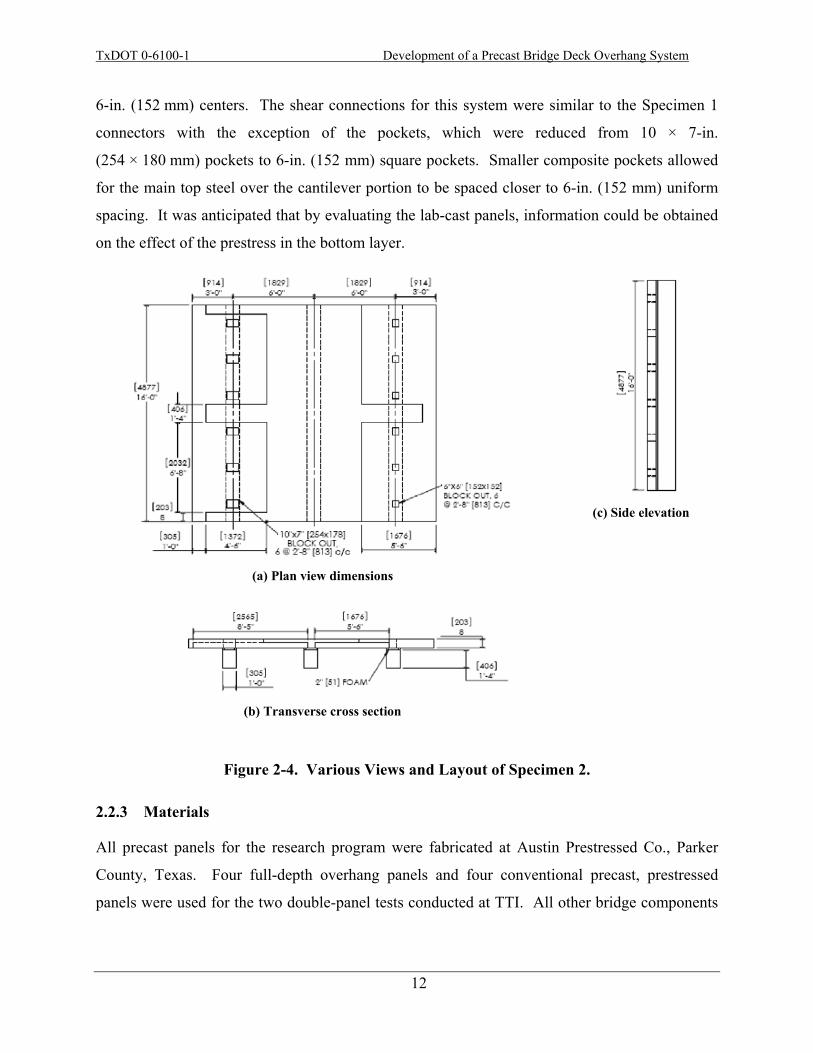
TxDOT 0-6100-1 Development of a Precast Bridge Deck Overhang System
12
6-in. (152 mm) centers. The shear connections for this system were similar to the Specimen 1
connectors with the exception of the pockets, which were reduced from 10 × 7-in.
(254 × 180 mm) pockets to 6-in. (152 mm) square pockets. Smaller composite pockets allowed
for the main top steel over the cantilever portion to be spaced closer to 6-in. (152 mm) uniform
spacing. It was anticipated that by evaluating the lab-cast panels, information could be obtained
on the effect of the prestress in the bottom layer.
(a) Plan view dimensions
(b) Transverse cross section
(c) Side elevation
Figure 2-4. Various Views and Layout of Specimen 2.
2.2.3 Materials
All precast panels for the research program were fabricated at Austin Prestressed Co., Parker
County, Texas. Four full-depth overhang panels and four conventional precast, prestressed
panels were used for the two double-panel tests conducted at TTI. All other bridge components
TxDOT 0-6100-1 Development of a Precast Bridge Deck Overhang System
13
were constructed in the High Bay Structural and Materials Laboratory (HBSML) at Texas A&M
University.
All concrete placed in the laboratory was supplied by Transit Mix Inc., Bryan, Texas, an
approved TxDOT supplier. Type H concrete, with a specified target strength of 5000 psi
(34 MPa), was used for the laboratory beams. Type S concrete, with a target strength of 4000 psi
(28 MPa), was used for the deck. A slump of 4 in. (102 mm) was specified for all concrete
mixtures. Cylinders were cast from each concrete batch in accordance with Tex-447-A, Making
and Curing Concrete Test Specimens. Compression tests were conducted at 3, 7, and 28 days
after casting and at the time of testing of the test specimens following Tex-418-A, Compressive
Strength of Cylindrical Concrete Specimens. Splitting tensile tests were also conducted on the
day of testing in accordance with Tex-421-A, Splitting Tensile Strength of Cylindrical Concrete
Specimens. Table 2-1 shows the compressive strengths of the different concretes used in the
research at 3, 7, and 28 days after casting, and at the time of structural testing. Splitting tensile
strengths are also shown in the table.
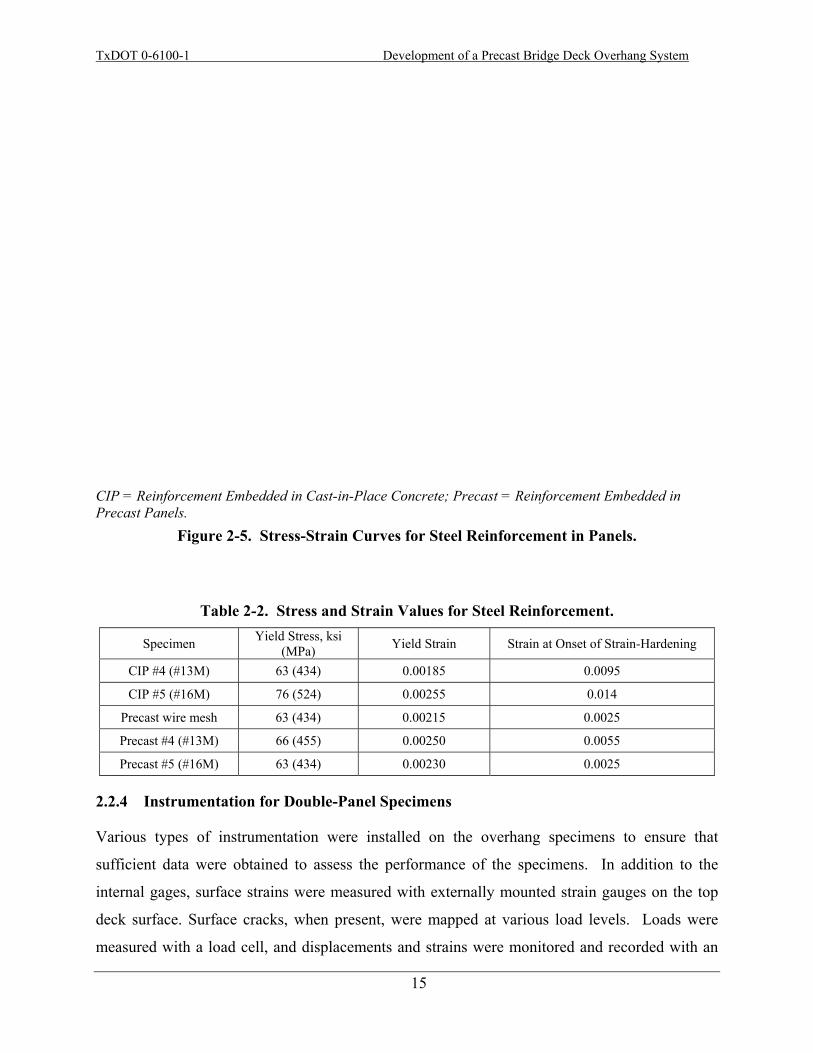
Tensile tests were also conducted to characterize the mild steel and prestressing strands
used in the panels and CIP decks. Figure 2-5 shows the stress-strain curves for the steel
reinforcement used in the precast panels (this includes a wire mesh used in the panels) and the
CIP deck. All steel met the 60 ksi (414 MPa) yield requirements of ASTM A615, Standard
Specification for Deformed and Plain Carbon-Steel Bars for Concrete Reinforcement. Table 2-2
also shows critical values from the tension tests.
Specimens 1 and 2 had a 2-in. (51 mm) haunch. SikaGrout™ 212 was used to fill the
haunch (Section 4 provides a more comprehensive analysis of the grout material). A water-to-
powder ratio (w/p) of 0.19 was used for all grouts placed in the haunch area. A grout with a w/p
of 0.16 was used for the pockets in Specimen 1. Because subsidence cracks were observed
within 12 hours after the grout placement in Specimen 1 around the pocket perimeter, Class S
concrete was used in the pockets for Specimen 2. No visible cracks were observed when
concrete was placed in the pockets in Specimen 2.
TxDOT 0-6100-1 Development of a Precast Bridge Deck Overhang System
14
Table 2-1. Compression and Splitting Tensile Strength Results.
Specimen No. Component Cast Date
Compressive Strength, psi (MPa)
Tensile Strength, psi (MPa)
3-day 7-day 28-day Time of Structural Test Time of Test
1 Stage I 2/5/08 4200 (29)
5880 (41) 8035 (55) 8450 (58) 870 (6.0)
1 Stage II 2/8/08 5960 (41)
7200 (50) 7680 (53) 9030 (62) 805 (5.5)
1 SIP Panel 2/12/08 4320 (30)
6600 (45) 7745 (53) 8990 (62) 890 (6.1)
1 Deck 3/28/08 3800 (26)
6565 (45) 8380 (58) 8515 (59) 805 (5.5)
2 Stage I 1/31/08 5340 (37)
6880 (47) 8770 (60) 9540 (66) 810 (5.6)
2 Stage II 2/5/08 4200 (29)
5880 (41) 6855 (47) 7560 (52) 750 (5.2)
2 SIP Panel 2/11/08 4900 (34)
6455 (45) 7000 (48) 7510 (52) 870 (6.0)
2 Lab cast overhang 4/14/08 4700 (32)
6600 (45) 7910 (55) 8345 (58) 675 (4.7)
2 Deck closure 5/19/08 2900 (20)
3550 (24) 4840 (33) 4500 (31) 465 (3.2)
Notes: Stage I is first stage pour of precast overhang panels); Stage II is second stage pour of precast overhang panels; SIP Panel = stay-in-place panel for interior bay.
TxDOT 0-6100-1 Development of a Precast Bridge Deck Overhang System
15
CIP = Reinforcement Embedded in Cast-in-Place Concrete; Precast = Reinforcement Embedded in Precast Panels.
Figure 2-5. Stress-Strain Curves for Steel Reinforcement in Panels.
Table 2-2. Stress and Strain Values for Steel Reinforcement.
Specimen Yield Stress, ksi (MPa) Yield Strain Strain at Onset of Strain-Hardening
CIP #4 (#13M) 63 (434) 0.00185 0.0095
CIP #5 (#16M) 76 (524) 0.00255 0.014
Precast wire mesh 63 (434) 0.00215 0.0025
Precast #4 (#13M) 66 (455) 0.00250 0.0055
Precast #5 (#16M) 63 (434) 0.00230 0.0025
2.2.4 Instrumentation for Double-Panel Specimens
Various types of instrumentation were installed on the overhang specimens to ensure that
sufficient data were obtained to assess the performance of the specimens. In addition to the
internal gages, surface strains were measured with externally mounted strain gauges on the top
deck surface. Surface cracks, when present, were mapped at various load levels. Loads were
measured with a load cell, and displacements and strains were monitored and recorded with an
TxDOT 0-6100-1 Development of a Precast Bridge Deck Overhang System
16
electronic data acquisition system programmed to scan and record all channels at 3-second
intervals.
A total of 24 string pots were used for measuring vertical deflection at various locations
on Specimen 1, with a line of nine string pots placed along the longitudinal axis of the wheel
load. Ten surface gauges were used, measuring transverse strains over the beam. The two shear
connectors were instrumented with quarter-bridge strain gauges to determine the axial force
acting on the shear connector while loading the overhang.
The instrumentation plan was altered for Specimen 2 to include 6 additional string pots
and 10 internal strain gauges. The number of string pots increased from 9 to 14 along the
longitudinal direction beneath the wheel loads. String pots were spaced at 15-in. (380 mm)
centers, with a string pot on both sides of the seam. Transverse displacement profiles were also
measured in the plane of the wheel load. There were six strain gauges placed on the #5 (#16M)
transverse bars closest to the seam edge. These were spaced such that they were at the beam
centerline and interior face for the exterior beams and both beam faces on the interior beam. An
additional four gauges were placed on the middle longitudinal bar, at 4 and 24 in. (102 and
610 mm) on both sides of the seam.
2.2.5 Specimen Loading Plan for Double-Panel Specimens
Hydraulic jacks were used to represent truck wheel loads over a rectangular tire footprint
measuring 10-in. (254 mm) long by 20-in. (508 mm) wide. Steel load plates, 3-in. (76 mm)
thick, were seated on a 0.5-in. (13 mm) thick neoprene pad (Shore 70, similar in hardness to a
tire tread). The loads that were placed on the concrete deck surface were positioned at various
locations on the deck to represent the most adverse design scenarios required by the American
Association of State Highway and Transportation Officials Load and Resistance Factor Design
(AASHTO LRFD) Bridge Design Specification (2007). Specific aspects of the loading for each
specimen are described next.

TxDOT 0-6100-1 Development of a Precast Bridge Deck Overhang System
17
2.2.5.1 Specimen 1 Figure 2-6a illustrates the load cases tested on Specimen 1. Load Cases 1.1 and 1.2 are the
required AASHTO factored load at the longitudinal midpoint (or seam), and the longitudinal
quarter-point (center of a panel), respectively. For the overhang, this positioned the center of the
load plate 6 in. (152 mm) off the beam face, resulting in 2 in. (51 mm) of the load plate bearing
over the grout bed (haunch). This load location is referenced in Section 3.6.1.3 of the AASHTO
LRFD Bridge Design Specifications (2007). Load Case 1.3 is the edge failure load, where the
wheel load edge is on the edge of the panel. This may be representative of a crash load, with an
increased moment due to the overturning force from the barrier resistance. The shear force will
be the same as the AASHTO required load point; however, a greater moment at the beam face
makes it more critical. Load Cases 1.3 and 1.4 are similar to 1.1 and 1.6, while Load Case 1.5
differs from Load Case 1.3, as it is on the seam edge. Load Case 1.7 is an axle load at the
midpoint of each panel. Load Case 1.8 is the interior failure load for an axle. Axle wheel loads
are spaced at 6-ft (1.8 m) centers.

TxDOT 0-6100-1 Development of a Precast Bridge Deck Overhang System
18
(a)
(b)
Load Case 1.7 was loaded to 120 kips (534 kN) per wheel load. All other load cases were loaded to failure. Load Cases 2.1, 2.2, 2.5 and 2.6 were loaded up to 60 kips (267 kN). All other load cases were loaded to failure. Load Cases 1.1, 1.2, 1.4 and 1.5 were loaded up to 60 kips (267 kN).
Figure 2-6. (a) Loading Positions for Specimen 1; (b) Loading Positions for Specimen 2.
TxDOT 0-6100-1 Development of a Precast Bridge Deck Overhang System
19
2.2.5.2 Specimen 2 Figure 2-6b shows loading for Specimen 2. The overhang loading on the lab-cast side was the
same as Specimen 1 for the conventional and precast overhang to allow direct comparison of
results. The failure load on the precast side was a trailing wheel load on the same panel as
shown in Figure 2-6b. Load Case 2.4 was a trailing wheel load on one panel. Load Case 2.8 is
similar; however, one wheel load is on the adjacent panel, closest to the seam. The trailing
wheel load is 4 ft (1.2 m), whereas in Specimen 1, Load Cases 1.7 and 1.8 represent a total axle
load with the two wheel loads spaced 6 ft (1.8 m) apart.
2.2.6 Experimental Results
For all 16 loading conditions, force-displacement data were obtained based on the wheel load
and the vertical displacement below the center of the load plate. String pots were placed along
the beam face to obtain the true panel deflection by allowing for compression and “bedding in”
of the beam to the strong floor.
2.2.6.1 As-Received Precast Panels The precast panels were constructed with Class H concrete with a specified 28-day compressive
strength of 5000 psi (34 MPa). Observations of the as-received panels indicated that the
reinforcement may not have been placed per the drawings. This section will provide a
description of the as-received panels.
As noted, the panels were constructed in two stages. Stage I concrete was broom-finished
to provide enhanced friction between the Stage I and II interface. Delivered panels exhibited
signs of cracking between the Stage I and II concrete placements, likely due to differential
shrinkage or curling of the panels. Cracks propagated approximately 2 ft (0.6 m) in both
directions from the corner, as shown in Figure 2-7a. Figure 2-7b shows that satisfactory
compaction was achieved at other locations between the two concretes placed in different stages.
Following the conclusion of the first experiment, a full-depth panel was carefully
dissected to examine the steel layout. This was considered necessary, as it was earlier observed
that the top longitudinal steel was placed above the transverse steel, instead of below it.
Undamaged steel samples were extracted from the dismantled specimen to characterize the
tensile strengths of the steel used. A longitudinal and transverse section of the dismantled

TxDOT 0-6100-1 Development of a Precast Bridge Deck Overhang System
20
overhang is shown in Figure 2-8a and Figure 2-8b, respectively. The white rectangle represents
the typical undamaged cross section slab size, with the red bars showing the correct reinforcing
that should have been cast. Welded wire mesh was continuously used for the bottom longitudinal
reinforcement to the edge of the panel. The drawings specify three #5 (#16M) bars should have
been used, spaced as shown in Figure 2-8a. Figure 2-8b illustrates the correct layout of the top
steel, with the longitudinal #4 (#13M) bars laying beneath the #5 (#16M) transverse bars with
2 in. (51 mm) clear cover to the top.
(a) Cracking between Stage I and II
(b) Cross section of Stage I and II concrete
Figure 2-7. Photographs Showing Cracking in between Concrete Lifts and Good Consolidation between Concrete Lifts.
(a) Longitudinal cross section of overhang (b) Longitudinal cross section of overhang
Figure 2-8. Reinforcement Detailing of Precast Overhang Panels.
Stage I
Stage II
Interface
12” 3” 2” (305mm) (76mm) (51mm)
#5s (16M)
#4 (12M)
TxDOT 0-6100-1 Development of a Precast Bridge Deck Overhang System
21
2.2.6.2 AASHTO Overhang Seam Load (Double-Panel Specimens) Both precast overhang panel setups and lab-cast panels behaved in a similar fashion. Some
hairline cracks were only observed at loads of 60 kips (267 kN) between the seam above the
exterior beam face. The conventional overhang had three cracks on the underside of the deck
propagating from the beam face. The cracks were continuous to the overhang free edge. Top
surface cracks were observed above the beam face and along the beam centerline.
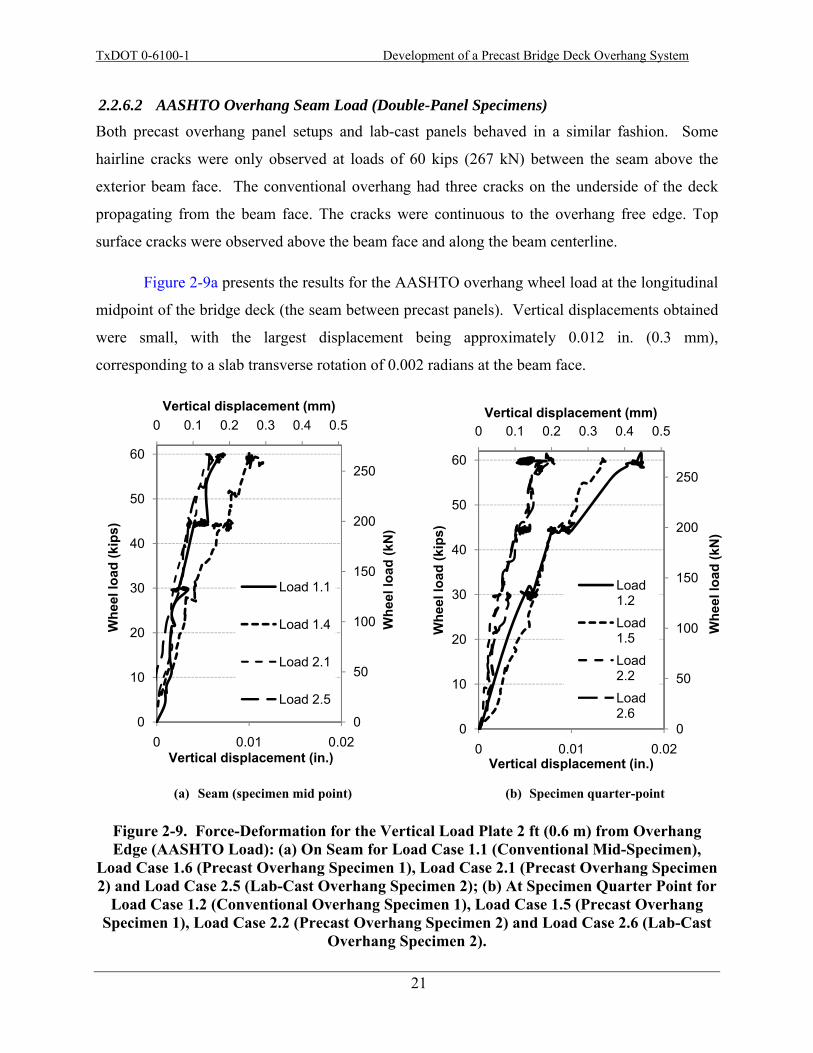
Figure 2-9a presents the results for the AASHTO overhang wheel load at the longitudinal
midpoint of the bridge deck (the seam between precast panels). Vertical displacements obtained
were small, with the largest displacement being approximately 0.012 in. (0.3 mm),
corresponding to a slab transverse rotation of 0.002 radians at the beam face.
(a) Seam (specimen mid point) (b) Specimen quarter-point
Figure 2-9. Force-Deformation for the Vertical Load Plate 2 ft (0.6 m) from Overhang Edge (AASHTO Load): (a) On Seam for Load Case 1.1 (Conventional Mid-Specimen),
Load Case 1.6 (Precast Overhang Specimen 1), Load Case 2.1 (Precast Overhang Specimen 2) and Load Case 2.5 (Lab-Cast Overhang Specimen 2); (b) At Specimen Quarter Point for
Load Case 1.2 (Conventional Overhang Specimen 1), Load Case 1.5 (Precast Overhang Specimen 1), Load Case 2.2 (Precast Overhang Specimen 2) and Load Case 2.6 (Lab-Cast
Overhang Specimen 2).
0 0.1 0.2 0.3 0.4 0.5
0
50
100
150
200
250
0
10
20
30
40
50
60
0 0.01 0.02
Vertical displacement (mm)W
heel
load
(kN
)
Whe
el lo
ad (k
ips)
Vertical displacement (in.)
Load 1.1
Load 1.4
Load 2.1
Load 2.5
0 0.1 0.2 0.3 0.4 0.5
0
50
100
150
200
250
0
10
20
30
40
50
60
0 0.01 0.02
Vertical displacement (mm)
Whe
el lo
ad (k
N)
Whe
el lo
ad (k
ips)
Vertical displacement (in.)
Load 1.2
Load 1.5
Load 2.2
Load 2.6
TxDOT 0-6100-1 Development of a Precast Bridge Deck Overhang System
22
2.2.6.3 AASHTO Overhang Mid-Panel (Quarter-Point) Loads The design AASHTO loading was applied at the longitudinal quarter point of both specimens.
For the precast overhang, this corresponded to the longitudinal midpoint of a precast panel. The
sole crack observed on the precast panel propagated from the PVC tubing hole that was cast in
the full-depth section of the panel. The hole was cast in the panel to accommodate testing at
OSU; hence, it does not provide any representation of the in-field panel construction. The
conventional overhang had two hairline cracks on the underside of the deck in line with the load
plate. Figure 2-9b presents load-displacement curves for these tests. In Specimen 1 the stiffness
of the precast deck was similar to the stiffness of the conventional overhang. The stiffness
values of the precast overhang panel and lab-cast of Specimen 2 were greater than that of
Specimen 1. Both displayed no residual displacement or cracks in the deck.
2.2.6.4 Overhang Failure Loads (Double-Panel Specimens) A flexural failure mechanism in the double-panel overhang specimen was achieved by moving
the loading footprint to the edge of the deck. In Specimen 1, a singular wheel load was placed
on the edge of the seam for the precast overhang (Load Case 1.6). The lab-cast overhang in
Specimen 2 was loaded the same way (Load Case 2.7). This provides an indication of the staple
bar strength between adjacent panels in comparison to the continuous reinforcement in the
conventional panel failure load (Load Case 1.3). Specimen 2 uses a trailing wheel load applied
over the same precast overhang panel (Load Case 2.3).
Cracks were mapped at selected loads based on the force-deformation data during the
experiment. Figure 2-10 shows the cracks that were observed during the experiments on the top
deck surface. Figure 2-11 shows photographs taken at the time of failure. The conventional
overhang failure was close to symmetrical about the load plate. For the precast loads, cracks
were observed in the panel adjacent to the panel loaded.
TxDOT 0-6100-1 Development of a Precast Bridge Deck Overhang System
23
Precast Overhang Specimen 1
Conventional Overhang Specimen 1
Precast Overhang Specimen 2
Lab-cast Specimen 2
Numbers are vertical pauses in kips (1 kip = 4.448 kN) where cracks were marked. Figure 2-10. Crack Mapping of Overhang Failure Loads.
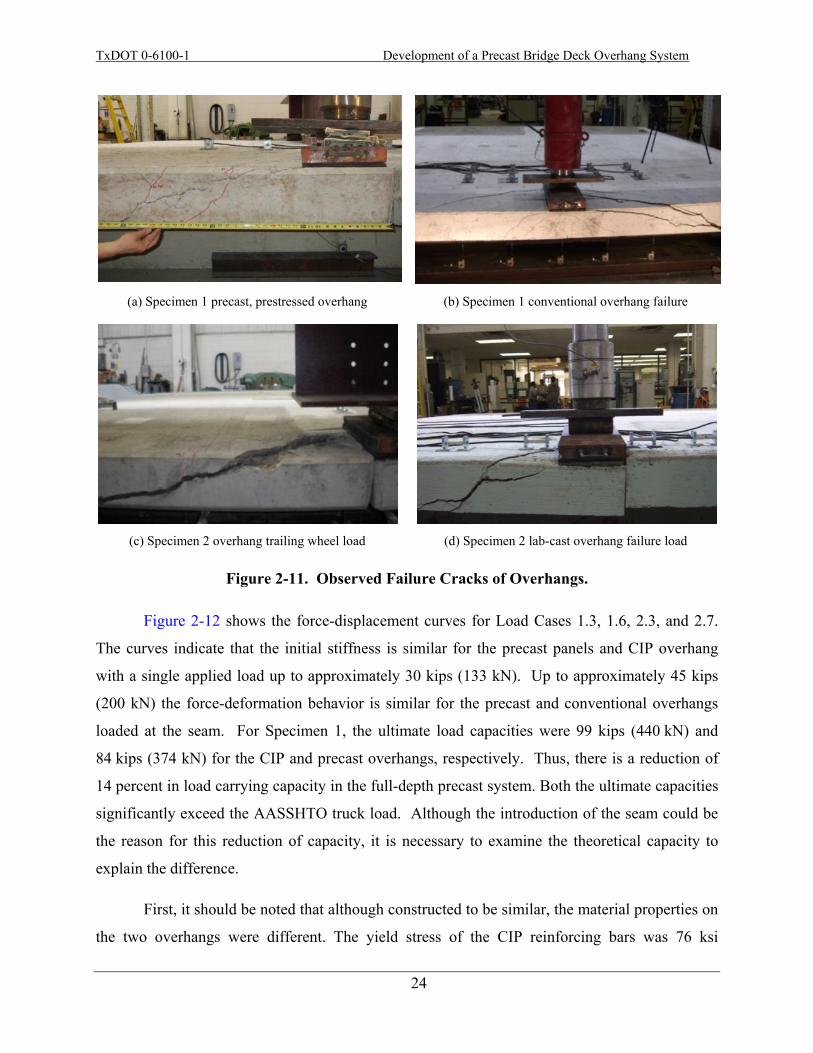
TxDOT 0-6100-1 Development of a Precast Bridge Deck Overhang System
24
(a) Specimen 1 precast, prestressed overhang
(b) Specimen 1 conventional overhang failure
(c) Specimen 2 overhang trailing wheel load
(d) Specimen 2 lab-cast overhang failure load
Figure 2-11. Observed Failure Cracks of Overhangs.
Figure 2-12 shows the force-displacement curves for Load Cases 1.3, 1.6, 2.3, and 2.7.
The curves indicate that the initial stiffness is similar for the precast panels and CIP overhang
with a single applied load up to approximately 30 kips (133 kN). Up to approximately 45 kips
(200 kN) the force-deformation behavior is similar for the precast and conventional overhangs
loaded at the seam. For Specimen 1, the ultimate load capacities were 99 kips (440 kN) and
84 kips (374 kN) for the CIP and precast overhangs, respectively. Thus, there is a reduction of
14 percent in load carrying capacity in the full-depth precast system. Both the ultimate capacities
significantly exceed the AASSHTO truck load. Although the introduction of the seam could be
the reason for this reduction of capacity, it is necessary to examine the theoretical capacity to
explain the difference.
First, it should be noted that although constructed to be similar, the material properties on
the two overhangs were different. The yield stress of the CIP reinforcing bars was 76 ksi
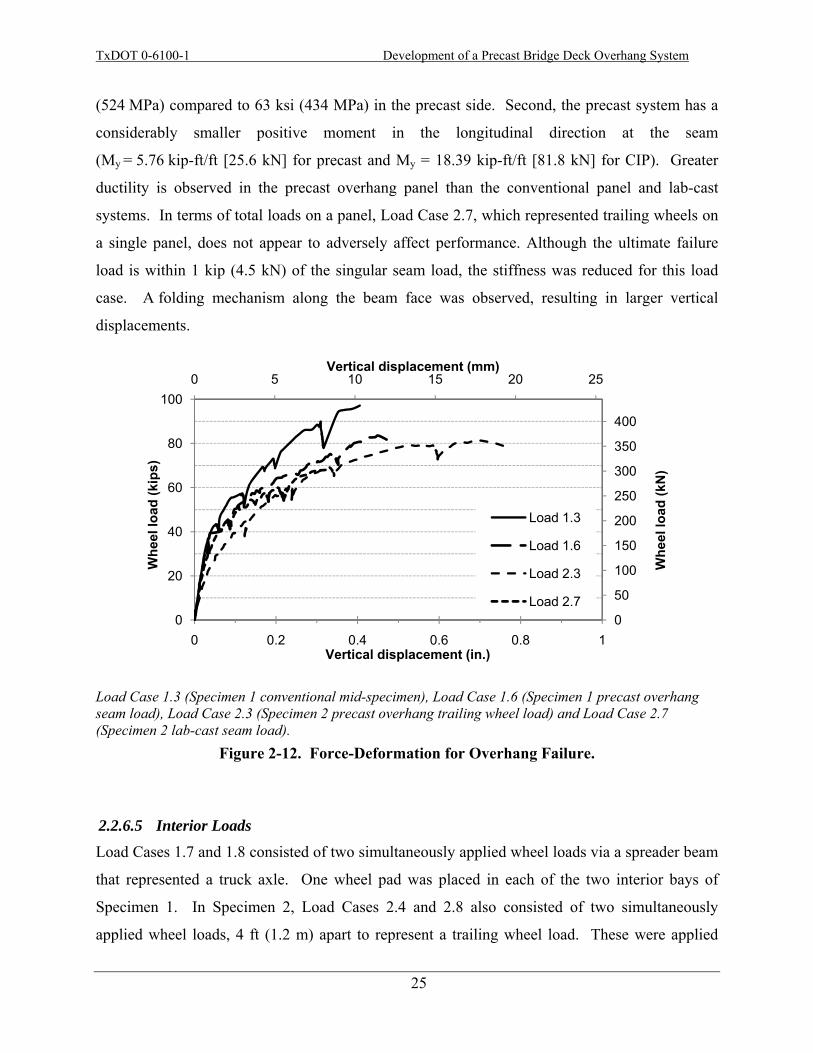
TxDOT 0-6100-1 Development of a Precast Bridge Deck Overhang System
25
(524 MPa) compared to 63 ksi (434 MPa) in the precast side. Second, the precast system has a
considerably smaller positive moment in the longitudinal direction at the seam
(My = 5.76 kip-ft/ft [25.6 kN] for precast and My = 18.39 kip-ft/ft [81.8 kN] for CIP). Greater
ductility is observed in the precast overhang panel than the conventional panel and lab-cast
systems. In terms of total loads on a panel, Load Case 2.7, which represented trailing wheels on
a single panel, does not appear to adversely affect performance. Although the ultimate failure
load is within 1 kip (4.5 kN) of the singular seam load, the stiffness was reduced for this load
case. A folding mechanism along the beam face was observed, resulting in larger vertical
displacements.
Load Case 1.3 (Specimen 1 conventional mid-specimen), Load Case 1.6 (Specimen 1 precast overhang seam load), Load Case 2.3 (Specimen 2 precast overhang trailing wheel load) and Load Case 2.7 (Specimen 2 lab-cast seam load).
Figure 2-12. Force-Deformation for Overhang Failure.
2.2.6.5 Interior Loads Load Cases 1.7 and 1.8 consisted of two simultaneously applied wheel loads via a spreader beam
that represented a truck axle. One wheel pad was placed in each of the two interior bays of
Specimen 1. In Specimen 2, Load Cases 2.4 and 2.8 also consisted of two simultaneously
applied wheel loads, 4 ft (1.2 m) apart to represent a trailing wheel load. These were applied
0 5 10 15 20 25
0
50
100
150
200
250
300
350
400
0
20
40
60
80
100
0 0.2 0.4 0.6 0.8 1
Vertical displacement (mm)
Whe
el lo
ad (k
N)
Whe
el lo
ad (k
ips)
Vertical displacement (in.)
Load 1.3
Load 1.6
Load 2.3
Load 2.7
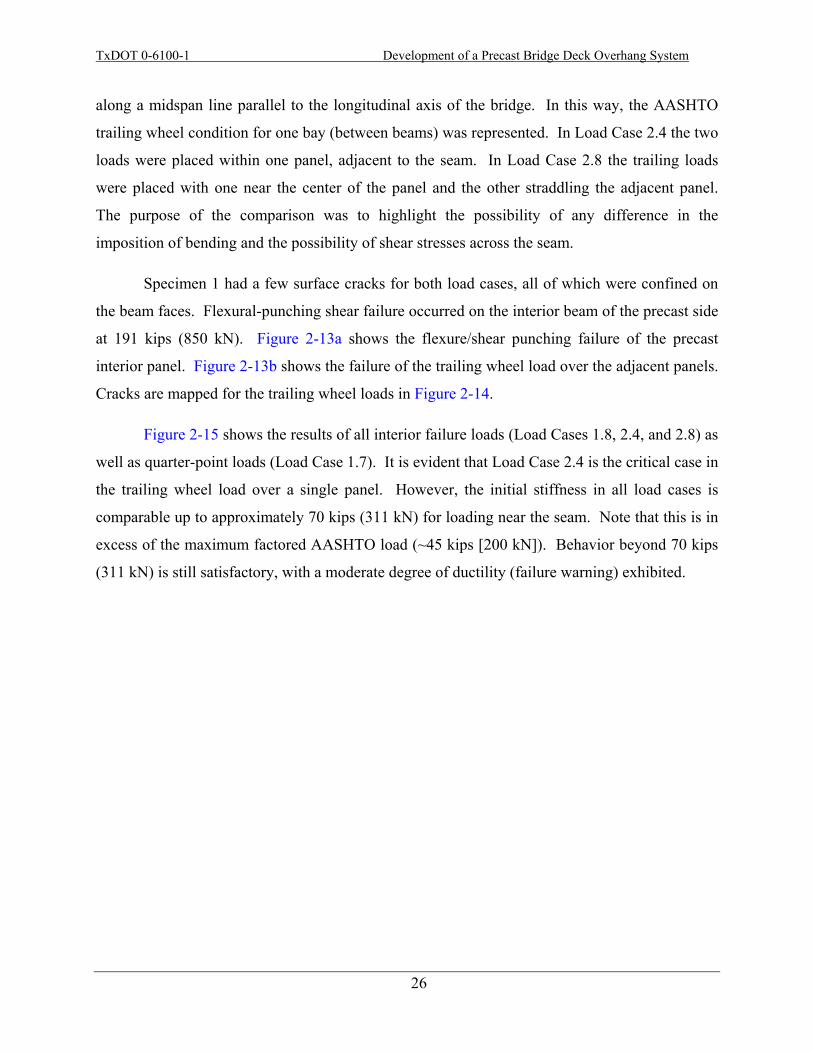
TxDOT 0-6100-1 Development of a Precast Bridge Deck Overhang System
26
along a midspan line parallel to the longitudinal axis of the bridge. In this way, the AASHTO
trailing wheel condition for one bay (between beams) was represented. In Load Case 2.4 the two
loads were placed within one panel, adjacent to the seam. In Load Case 2.8 the trailing loads
were placed with one near the center of the panel and the other straddling the adjacent panel.
The purpose of the comparison was to highlight the possibility of any difference in the
imposition of bending and the possibility of shear stresses across the seam.
Specimen 1 had a few surface cracks for both load cases, all of which were confined on
the beam faces. Flexural-punching shear failure occurred on the interior beam of the precast side
at 191 kips (850 kN). Figure 2-13a shows the flexure/shear punching failure of the precast
interior panel. Figure 2-13b shows the failure of the trailing wheel load over the adjacent panels.
Cracks are mapped for the trailing wheel loads in Figure 2-14.
Figure 2-15 shows the results of all interior failure loads (Load Cases 1.8, 2.4, and 2.8) as
well as quarter-point loads (Load Case 1.7). It is evident that Load Case 2.4 is the critical case in
the trailing wheel load over a single panel. However, the initial stiffness in all load cases is
comparable up to approximately 70 kips (311 kN) for loading near the seam. Note that this is in
excess of the maximum factored AASHTO load (~45 kips [200 kN]). Behavior beyond 70 kips
(311 kN) is still satisfactory, with a moderate degree of ductility (failure warning) exhibited.
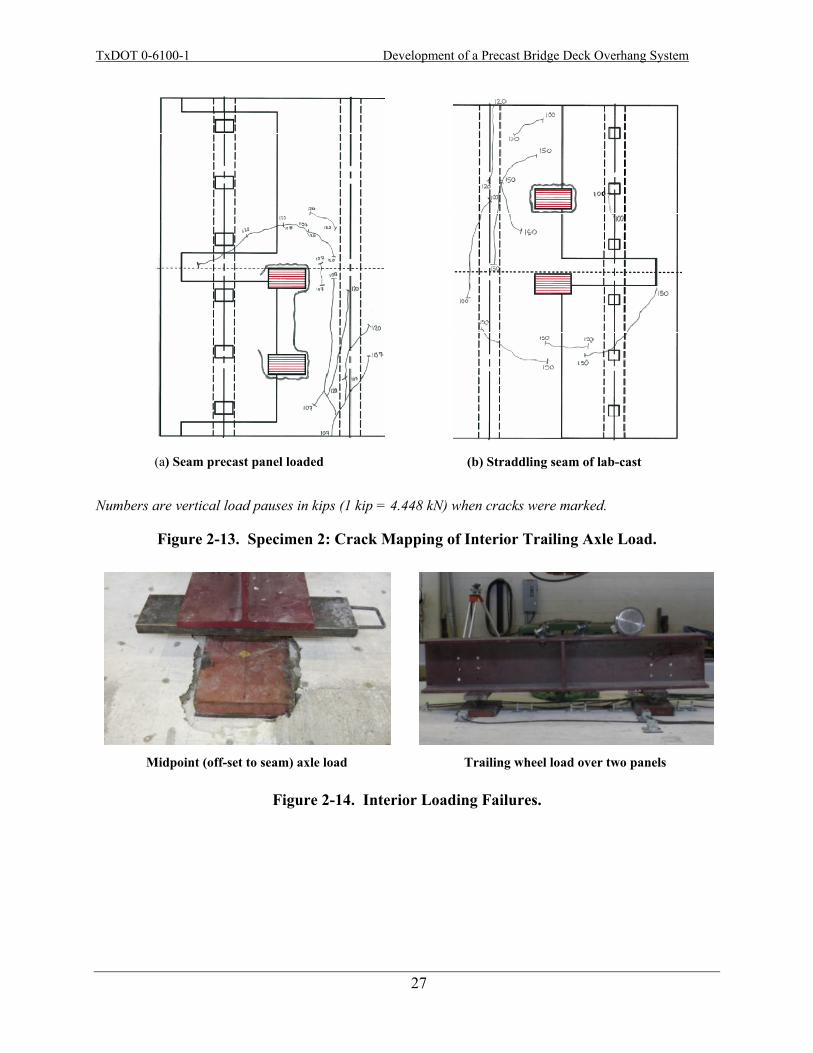
TxDOT 0-6100-1 Development of a Precast Bridge Deck Overhang System
27
(a) Seam precast panel loaded
(b) Straddling seam of lab-cast
Numbers are vertical load pauses in kips (1 kip = 4.448 kN) when cracks were marked.
Figure 2-13. Specimen 2: Crack Mapping of Interior Trailing Axle Load.
Midpoint (off-set to seam) axle load
Trailing wheel load over two panels
Figure 2-14. Interior Loading Failures.
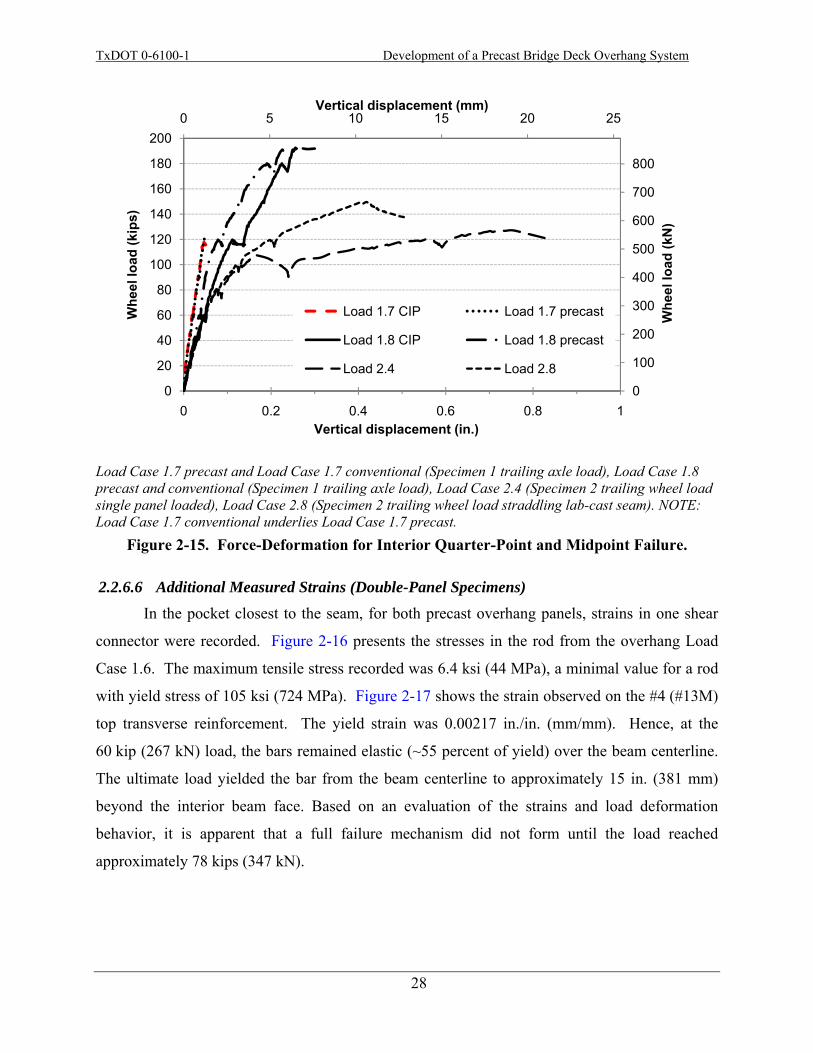
TxDOT 0-6100-1 Development of a Precast Bridge Deck Overhang System
28
Load Case 1.7 precast and Load Case 1.7 conventional (Specimen 1 trailing axle load), Load Case 1.8 precast and conventional (Specimen 1 trailing axle load), Load Case 2.4 (Specimen 2 trailing wheel load single panel loaded), Load Case 2.8 (Specimen 2 trailing wheel load straddling lab-cast seam). NOTE: Load Case 1.7 conventional underlies Load Case 1.7 precast.
Figure 2-15. Force-Deformation for Interior Quarter-Point and Midpoint Failure.
2.2.6.6 Additional Measured Strains (Double-Panel Specimens) In the pocket closest to the seam, for both precast overhang panels, strains in one shear
connector were recorded. Figure 2-16 presents the stresses in the rod from the overhang Load
Case 1.6. The maximum tensile stress recorded was 6.4 ksi (44 MPa), a minimal value for a rod
with yield stress of 105 ksi (724 MPa). Figure 2-17 shows the strain observed on the #4 (#13M)
top transverse reinforcement. The yield strain was 0.00217 in./in. (mm/mm). Hence, at the
60 kip (267 kN) load, the bars remained elastic (~55 percent of yield) over the beam centerline.
The ultimate load yielded the bar from the beam centerline to approximately 15 in. (381 mm)
beyond the interior beam face. Based on an evaluation of the strains and load deformation
behavior, it is apparent that a full failure mechanism did not form until the load reached
approximately 78 kips (347 kN).
0 5 10 15 20 25
0
100
200
300
400
500
600
700
800
0
20
40
60
80
100
120
140
160
180
200
0 0.2 0.4 0.6 0.8 1
Vertical displacement (mm)
Whe
el lo
ad (k
N)
Whe
el lo
ad (k
ips)
Vertical displacement (in.)
Load 1.7 CIP Load 1.7 precast
Load 1.8 CIP Load 1.8 precast
Load 2.4 Load 2.8
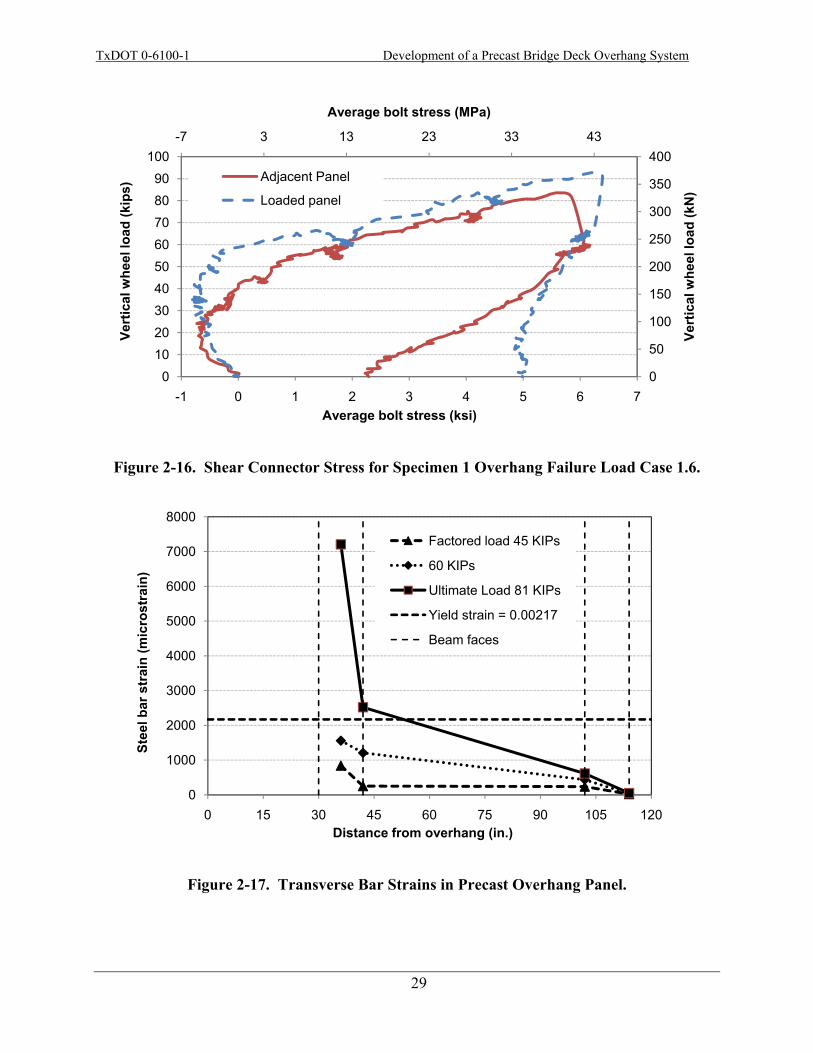
TxDOT 0-6100-1 Development of a Precast Bridge Deck Overhang System
29
Figure 2-16. Shear Connector Stress for Specimen 1 Overhang Failure Load Case 1.6.
Figure 2-17. Transverse Bar Strains in Precast Overhang Panel.
-7 3 13 23 33 43
0
50
100
150
200
250
300
350
400
0102030405060708090
100
-1 0 1 2 3 4 5 6 7
Average bolt stress (MPa)
Vert
ical
whe
el lo
ad (k
N)
Vert
ical
whe
el lo
ad (k
ips)
Average bolt stress (ksi)
Adjacent Panel
Loaded panel
0
1000
2000
3000
4000
5000
6000
7000
8000
0 15 30 45 60 75 90 105 120
Stee
l bar
str
ain
(mic
rost
rain
)
Distance from overhang (in.)
Factored load 45 KIPs
60 KIPs
Ultimate Load 81 KIPs
Yield strain = 0.00217
Beam faces
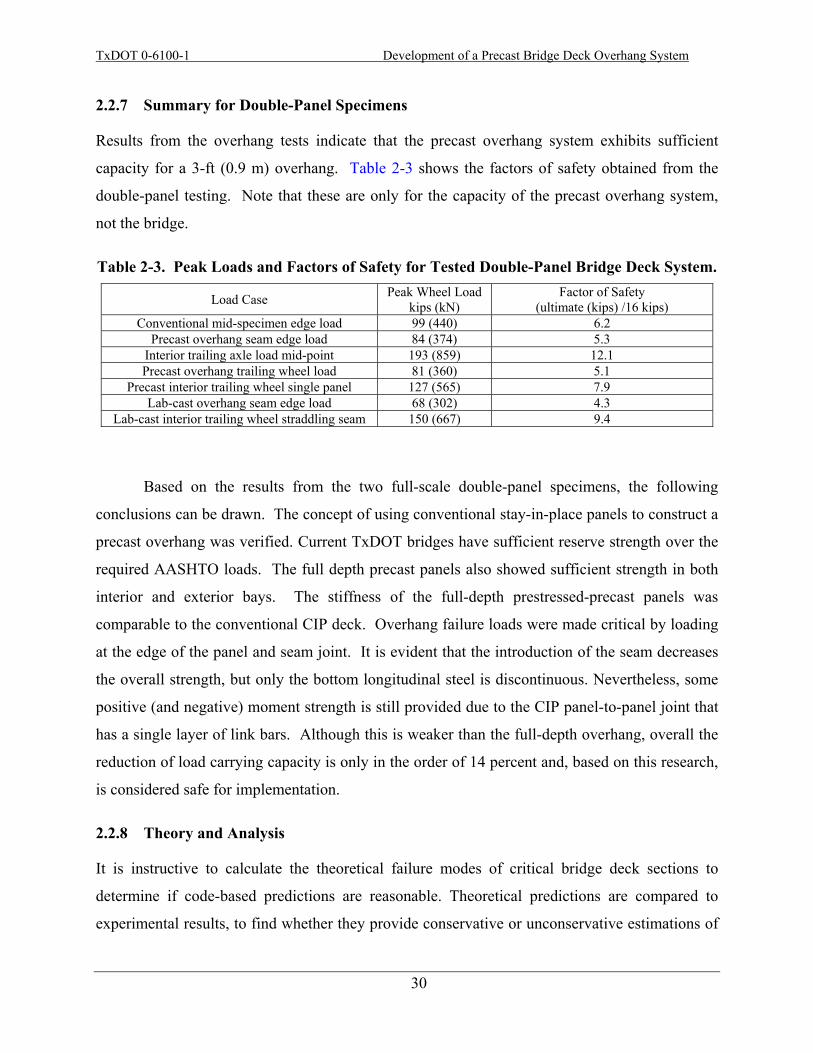
TxDOT 0-6100-1 Development of a Precast Bridge Deck Overhang System
30
2.2.7 Summary for Double-Panel Specimens
Results from the overhang tests indicate that the precast overhang system exhibits sufficient
capacity for a 3-ft (0.9 m) overhang. Table 2-3 shows the factors of safety obtained from the
double-panel testing. Note that these are only for the capacity of the precast overhang system,
not the bridge.
Table 2-3. Peak Loads and Factors of Safety for Tested Double-Panel Bridge Deck System.
Load Case Peak Wheel Load kips (kN)
Factor of Safety (ultimate (kips) /16 kips)
Conventional mid-specimen edge load 99 (440) 6.2 Precast overhang seam edge load 84 (374) 5.3
Interior trailing axle load mid-point 193 (859) 12.1 Precast overhang trailing wheel load 81 (360) 5.1
Precast interior trailing wheel single panel 127 (565) 7.9 Lab-cast overhang seam edge load 68 (302) 4.3
Lab-cast interior trailing wheel straddling seam 150 (667) 9.4
Based on the results from the two full-scale double-panel specimens, the following
conclusions can be drawn. The concept of using conventional stay-in-place panels to construct a
precast overhang was verified. Current TxDOT bridges have sufficient reserve strength over the
required AASHTO loads. The full depth precast panels also showed sufficient strength in both
interior and exterior bays. The stiffness of the full-depth prestressed-precast panels was
comparable to the conventional CIP deck. Overhang failure loads were made critical by loading
at the edge of the panel and seam joint. It is evident that the introduction of the seam decreases
the overall strength, but only the bottom longitudinal steel is discontinuous. Nevertheless, some
positive (and negative) moment strength is still provided due to the CIP panel-to-panel joint that
has a single layer of link bars. Although this is weaker than the full-depth overhang, overall the
reduction of load carrying capacity is only in the order of 14 percent and, based on this research,
is considered safe for implementation.
2.2.8 Theory and Analysis
It is instructive to calculate the theoretical failure modes of critical bridge deck sections to
determine if code-based predictions are reasonable. Theoretical predictions are compared to
experimental results, to find whether they provide conservative or unconservative estimations of
TxDOT 0-6100-1 Development of a Precast Bridge Deck Overhang System
31
capacity. Traditional yield line theory and AASHTO LRFD punching-shear failure modes are
analyzed using the material properties of the deck. Theoretical yield line failure modes are
validated from the crack patterns observed in the experiments. Crack patterns are tied to
longitudinal and transverse curvature distributions. Observations and code-based predictions
suggest that an interaction between flexure and shear is the likely to occur as neither method
provides an accurate estimate of load carrying capacity.
Slab behavior is difficult to predict due to complex two-way interaction, and simplified
analysis techniques do not consider combined failure modes such as flexural-shear failure. Such
failure modes are investigated using a combination of yield line theory and punching-shear of the
4 in. (102 mm) CIP deck or shear failure of the transverse seam connecting the adjacent panels
for the interior and exterior load cases, respectively. From the experiments conducted it is
desirable to have knowledge of the strains in the steel reinforcement at failure and the loads
required to cause first yield. As the overhang panels were precast offsite, strain gauges could not
be placed on the reinforcement. Numerical methods are used to determine the distribution of
curvature of the deck, particularly near the applied load and the support regions.
2.2.8.1 Finite Difference Theory The experiments used a longitudinal and transverse line of displacement transducers to measure
slab deflections. Using these vertical displacement measurements it is possible to infer
curvatures using the method of finite differences. Because certain key displacements (i.e., at the
ends of the slab) were not measured, and not all displacement transducers were evenly spaced, it
was necessary to develop new finite difference equations to solve for the curvature, φ, given by
2
2''Curvature, ; [denoted as herein]j
d z zdx
φ = (2.1)
where z is the measured deflection and x the position along the slab. The following two sections
provide these finite difference equations for unequally and equally spaced nodes.
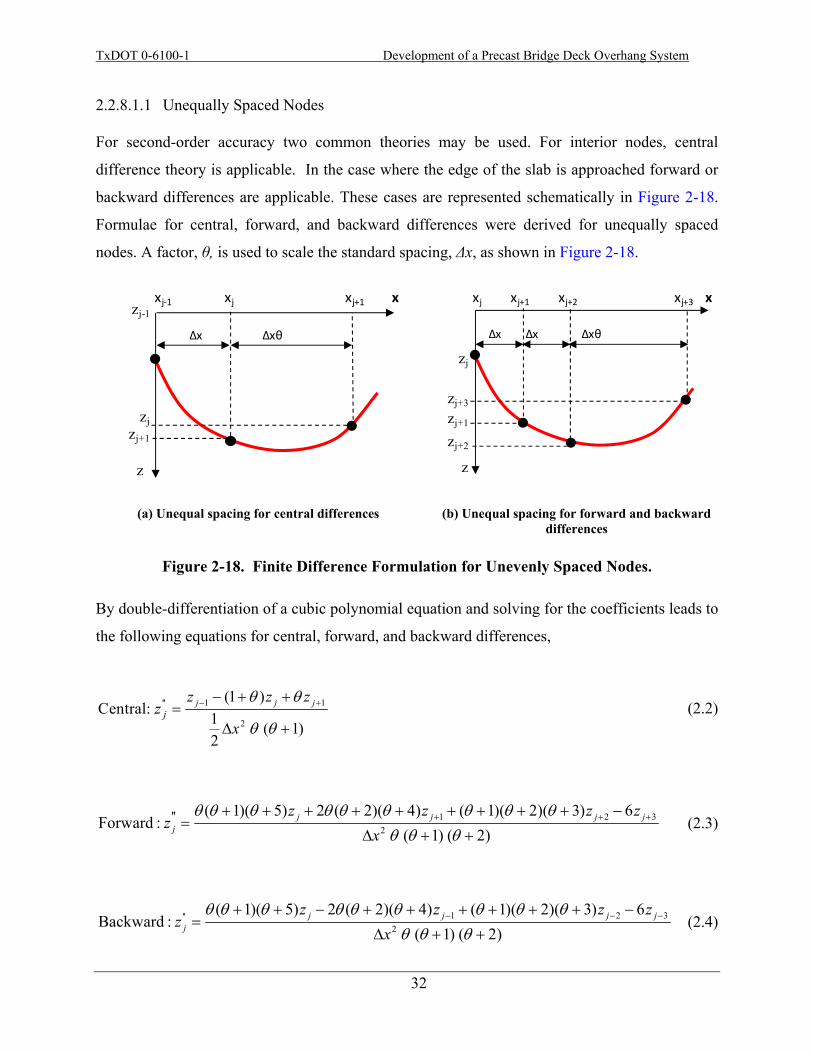
TxDOT 0-6100-1 Development of a Precast Bridge Deck Overhang System
32
2.2.8.1.1 Unequally Spaced Nodes
For second-order accuracy two common theories may be used. For interior nodes, central
difference theory is applicable. In the case where the edge of the slab is approached forward or
backward differences are applicable. These cases are represented schematically in Figure 2-18.
Formulae for central, forward, and backward differences were derived for unequally spaced
nodes. A factor, θ, is used to scale the standard spacing, Δx, as shown in Figure 2-18.
(a) Unequal spacing for central differences (b) Unequal spacing for forward and backward differences
Figure 2-18. Finite Difference Formulation for Unevenly Spaced Nodes.
By double-differentiation of a cubic polynomial equation and solving for the coefficients leads to
the following equations for central, forward, and backward differences,
1 1
2
'' (1 )Central: 1 ( 1)
2
j j jj
z z zz
x
θ θ
θ θ
− +− + +=
Δ + (2.2)
1 2 32
'' ( 1)( 5) 2 ( 2)( 4) ( 1)( 2)( 3) 6Forward :
( 1) ( 2)j j j j
j
z z z zz
xθ θ θ θ θ θ θ θ θ
θ θ θ+ + ++ + + + + + + + + −
=Δ + +
(2.3)
1 2 3''2
( 1)( 5) 2 ( 2)( 4) ( 1)( 2)( 3) 6Backward :
( 1) ( 2)j j j j
j
z z z zz
xθ θ θ θ θ θ θ θ θ
θ θ θ− − −+ + − + + + + + + −
=Δ + +
(2.4)
xj‐1 xj xj+1 xzj-1
zjzj+1
z
Δx Δxθ
zj
zj+3
zj+1
zj+2
z
xj xj+1 xj+2 xj+3 x
Δx Δx Δxθ

TxDOT 0-6100-1 Development of a Precast Bridge Deck Overhang System
33
where j = node number, zj = deflection of the jth node (etc.), ' 'jz = curvature at the jth node, and
Δx = spacing between nodes. The curvature at each node point along the slab can be written in
matrix form, denoting the node at the free end as 1, as follows.
{ } [ ]{ }C zφ = (2.5)
where, [C] = matrix of finite differences coefficients. This is expanded as follows:
1 1
2 2
3 32
0.55 1.5 1.75 0.8 00.25 0.5 0.25 0 0
1 0 1 3 2 00 0 1 2 10 0.25 2.5 4 1.75n n
zzz
x
z
φφφ
φ
− −⎧ ⎫ ⎧ ⎫⎡ ⎤⎪ ⎪ ⎪ ⎪⎢ ⎥−⎪ ⎪ ⎪ ⎪⎢ ⎥⎪ ⎪ ⎪ ⎪⎢ ⎥= −⎨ ⎬ ⎨ ⎬Δ ⎢ ⎥⎪ ⎪ ⎪ ⎪−⎢ ⎥⎪ ⎪ ⎪ ⎪
⎢ ⎥− −⎪ ⎪ ⎪ ⎪⎣ ⎦⎩ ⎭ ⎩ ⎭
M M
(2.6)
where Δx = 15 in. (380 mm) with θ modified according to the position of the node (θ=½ or 2).
2.2.8.1.2 Equally Spaced Nodes
If θ = 1 is substituted into Eq. (2.2) to (2.4), the following well-known results are obtained for
equally spaced nodes (Hornbeck, 1982):
1 1' '2
2Central: j j j
j
z z zz
x− +− +
=Δ (2.7)
1 2 3' '2
2 5 4Forward: j j j j
j
z z z zz
x+ + +− + −
=Δ (2.8)
1 2 3' '2
2 5 4Backward: j j j j
j
z z z zz
x− − −− + −
=Δ (2.9)
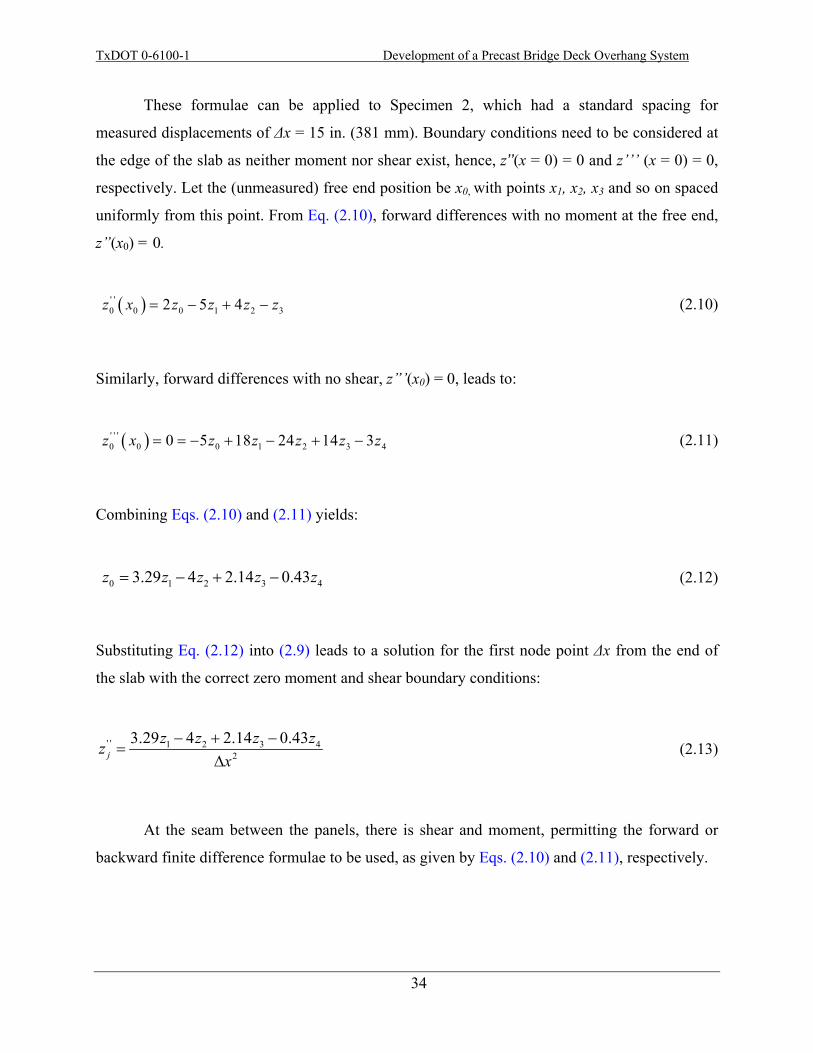
TxDOT 0-6100-1 Development of a Precast Bridge Deck Overhang System
34
These formulae can be applied to Specimen 2, which had a standard spacing for
measured displacements of Δx = 15 in. (381 mm). Boundary conditions need to be considered at
the edge of the slab as neither moment nor shear exist, hence, z’’(x = 0) = 0 and z’’’ (x = 0) = 0,
respectively. Let the (unmeasured) free end position be x0, with points x1, x2, x3 and so on spaced
uniformly from this point. From Eq. (2.10), forward differences with no moment at the free end,
z”(x0) = 0.
( )' '0 0 0 1 2 3 2 5 4z x z z z z= − + − (2.10)
Similarly, forward differences with no shear, z”’(x0) = 0, leads to:
( )' ' '0 0 0 1 2 3 4 0 5 18 24 14 3z x z z z z z= = − + − + − (2.11)
Combining Eqs. (2.10) and (2.11) yields:
0 1 2 3 4 3.29 4 2.14 0.43z z z z z= − + − (2.12)
Substituting Eq. (2.12) into (2.9) leads to a solution for the first node point Δx from the end of
the slab with the correct zero moment and shear boundary conditions:
' ' 1 2 3 42
3.29 4 2.14 0.43j
z z z zzx
− + −=
Δ (2.13)
At the seam between the panels, there is shear and moment, permitting the forward or
backward finite difference formulae to be used, as given by Eqs. (2.10) and (2.11), respectively.
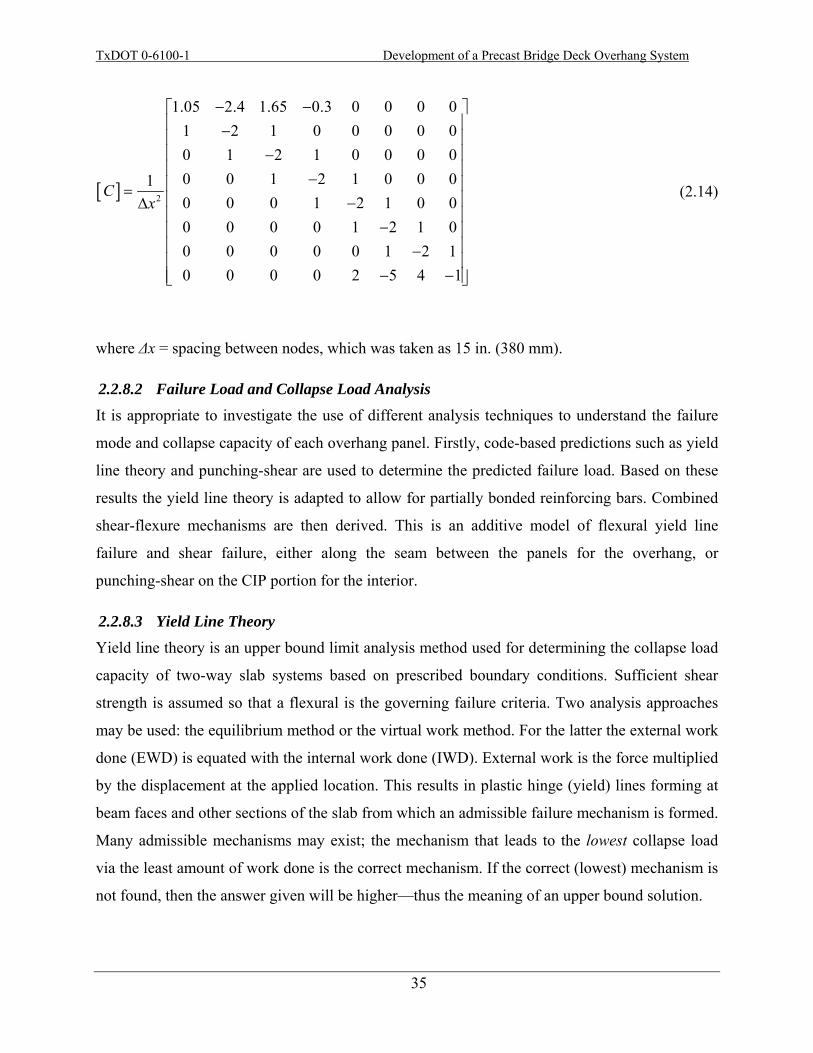
TxDOT 0-6100-1 Development of a Precast Bridge Deck Overhang System
35
[ ] 2
1.05 2.4 1.65 0.3 0 0 0 01 2 1 0 0 0 0 00 1 2 1 0 0 0 00 0 1 2 1 0 0 010 0 0 1 2 1 0 00 0 0 0 1 2 1 00 0 0 0 0 1 2 10 0 0 0 2 5 4 1
Cx
− −⎡ ⎤⎢ ⎥−⎢ ⎥⎢ ⎥−⎢ ⎥−⎢ ⎥= ⎢ ⎥−Δ⎢ ⎥
−⎢ ⎥⎢ ⎥−⎢ ⎥
− −⎢ ⎥⎣ ⎦
(2.14)
where Δx = spacing between nodes, which was taken as 15 in. (380 mm).
2.2.8.2 Failure Load and Collapse Load Analysis It is appropriate to investigate the use of different analysis techniques to understand the failure
mode and collapse capacity of each overhang panel. Firstly, code-based predictions such as yield
line theory and punching-shear are used to determine the predicted failure load. Based on these
results the yield line theory is adapted to allow for partially bonded reinforcing bars. Combined
shear-flexure mechanisms are then derived. This is an additive model of flexural yield line
failure and shear failure, either along the seam between the panels for the overhang, or
punching-shear on the CIP portion for the interior.
2.2.8.3 Yield Line Theory Yield line theory is an upper bound limit analysis method used for determining the collapse load
capacity of two-way slab systems based on prescribed boundary conditions. Sufficient shear
strength is assumed so that a flexural is the governing failure criteria. Two analysis approaches
may be used: the equilibrium method or the virtual work method. For the latter the external work
done (EWD) is equated with the internal work done (IWD). External work is the force multiplied
by the displacement at the applied location. This results in plastic hinge (yield) lines forming at
beam faces and other sections of the slab from which an admissible failure mechanism is formed.
Many admissible mechanisms may exist; the mechanism that leads to the lowest collapse load
via the least amount of work done is the correct mechanism. If the correct (lowest) mechanism is
not found, then the answer given will be higher—thus the meaning of an upper bound solution.

TxDOT 0-6100-1 Development of a Precast Bridge Deck Overhang System
36
Consider the case of the conventional overhang, with the assumed yield line shapes, as
shown in Figure 2-19. Note that positive moments (compression on top surface or tensile cracks
on the soffit) are drawn in jagged solid lines while negative moments (tension cracks on top
surface) are drawn in dashed lines.
In yield line theory it is implicitly assumed that sufficient ductility is available to allow
plastic rotation to occur at sections while plastic hinging occurs elsewhere to form the collapse
mechanism. It is therefore shown that the principle of virtual work requires the following:
' 'x y x y x y x y x y x y
EWD P
IWD M l M l M l M l
δ
θ θ θ θ
=
= + + +∑ ∑ ∑ ∑ (2.15)
where x and y denote transverse and longitudinal directions, respectively; Mx and My are positive
moment capacities per unit length in the transverse and longitudinal directions; M’x and M’y are
negative moment capacities per unit length in the transverse and longitudinal directions; lx and ly
are length of the yield lines in the transverse and longitudinal directions; and θx and θy are
rotation angle at yield line about transverse and longitudinal axes. For the displacement profiles
of Figure 2-19b and Figure 2-19c, this results in the following outcome:
( ) [ ] ( ) [ ] ( ) [ ]
( ) ( )2
' '
' '
2 5 2 210 10 10
52 2
10 10
x x xx y y x y x
x x y x y x
y xx y y
x y x
l l lIWD M l M l M ll l l l l l
l lM M Ml l l
δ δ δ
δδ
⎛ ⎞ ⎛ ⎞⎛ ⎞⎡ ⎤= + + +⎜ ⎟ ⎜ ⎟⎜ ⎟⎣ ⎦ ⎜ ⎟ ⎜ ⎟ ⎜ ⎟− − −⎝ ⎠ ⎝ ⎠ ⎝ ⎠+
= + +− −
(2.16)
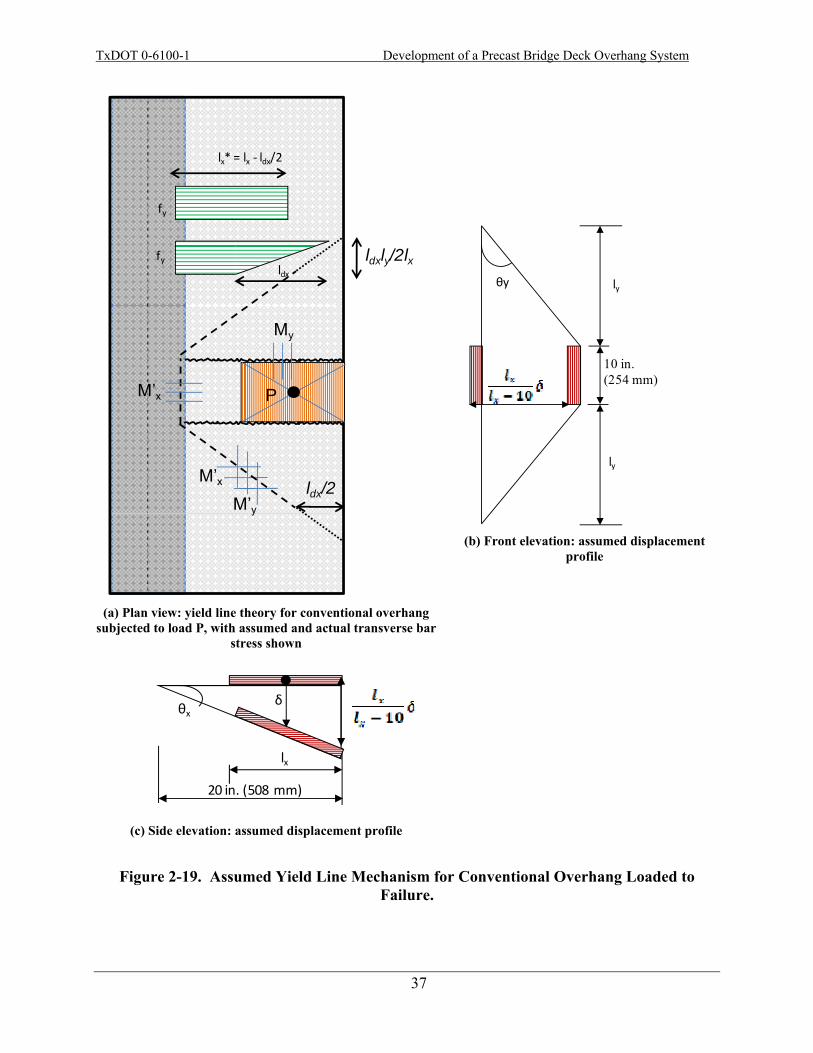
TxDOT 0-6100-1 Development of a Precast Bridge Deck Overhang System
37
(a) Plan view: yield line theory for conventional overhang
subjected to load P, with assumed and actual transverse bar stress shown
(c) Side elevation: assumed displacement profile
(b) Front elevation: assumed displacement
profile
Figure 2-19. Assumed Yield Line Mechanism for Conventional Overhang Loaded to Failure.
My
M’x
M’y
M’x
P
ldx/2
ldxly/2lx
fy
fyldx
lx* = lx ‐ ldx/2
lx
20 in. (508 mm)
θxδ
10 in.(254 mm)
θy ly
ly
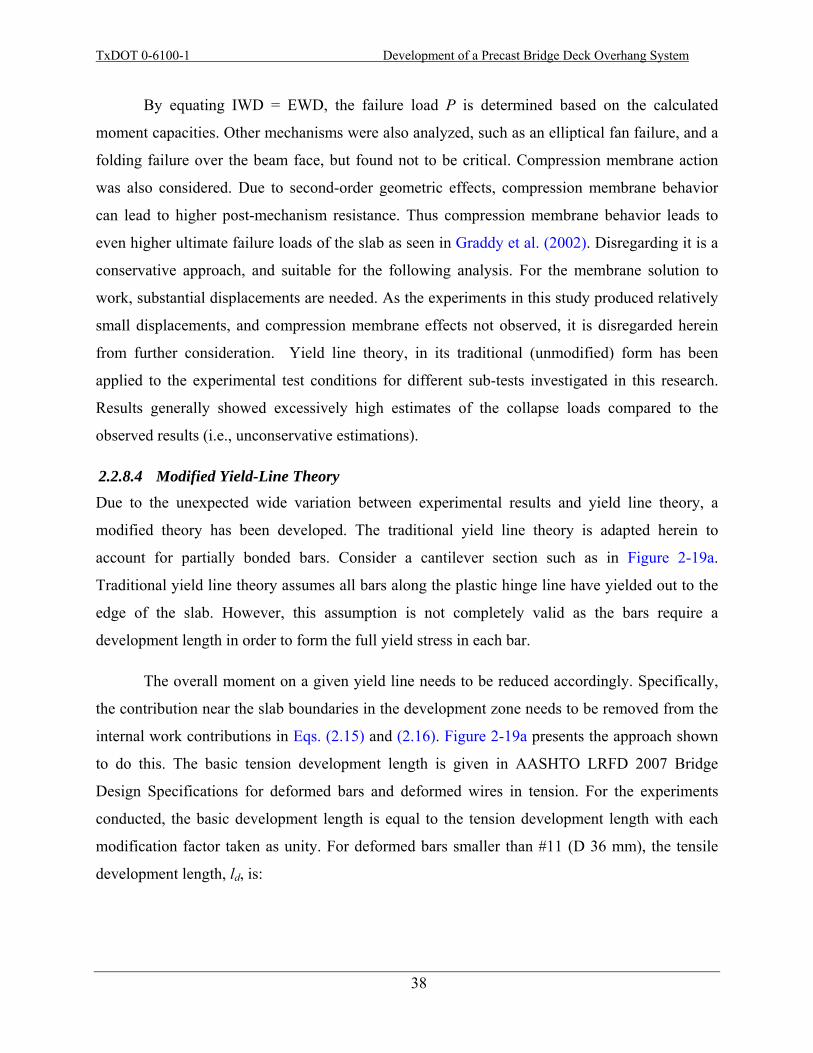
TxDOT 0-6100-1 Development of a Precast Bridge Deck Overhang System
38
By equating IWD = EWD, the failure load P is determined based on the calculated
moment capacities. Other mechanisms were also analyzed, such as an elliptical fan failure, and a
folding failure over the beam face, but found not to be critical. Compression membrane action
was also considered. Due to second-order geometric effects, compression membrane behavior
can lead to higher post-mechanism resistance. Thus compression membrane behavior leads to
even higher ultimate failure loads of the slab as seen in Graddy et al. (2002). Disregarding it is a
conservative approach, and suitable for the following analysis. For the membrane solution to
work, substantial displacements are needed. As the experiments in this study produced relatively
small displacements, and compression membrane effects not observed, it is disregarded herein
from further consideration. Yield line theory, in its traditional (unmodified) form has been
applied to the experimental test conditions for different sub-tests investigated in this research.
Results generally showed excessively high estimates of the collapse loads compared to the
observed results (i.e., unconservative estimations).
2.2.8.4 Modified Yield-Line Theory Due to the unexpected wide variation between experimental results and yield line theory, a
modified theory has been developed. The traditional yield line theory is adapted herein to
account for partially bonded bars. Consider a cantilever section such as in Figure 2-19a.
Traditional yield line theory assumes all bars along the plastic hinge line have yielded out to the
edge of the slab. However, this assumption is not completely valid as the bars require a
development length in order to form the full yield stress in each bar.
The overall moment on a given yield line needs to be reduced accordingly. Specifically,
the contribution near the slab boundaries in the development zone needs to be removed from the
internal work contributions in Eqs. (2.15) and (2.16). Figure 2-19a presents the approach shown
to do this. The basic tension development length is given in AASHTO LRFD 2007 Bridge
Design Specifications for deformed bars and deformed wires in tension. For the experiments
conducted, the basic development length is equal to the tension development length with each
modification factor taken as unity. For deformed bars smaller than #11 (D 36 mm), the tensile
development length, ld, is:
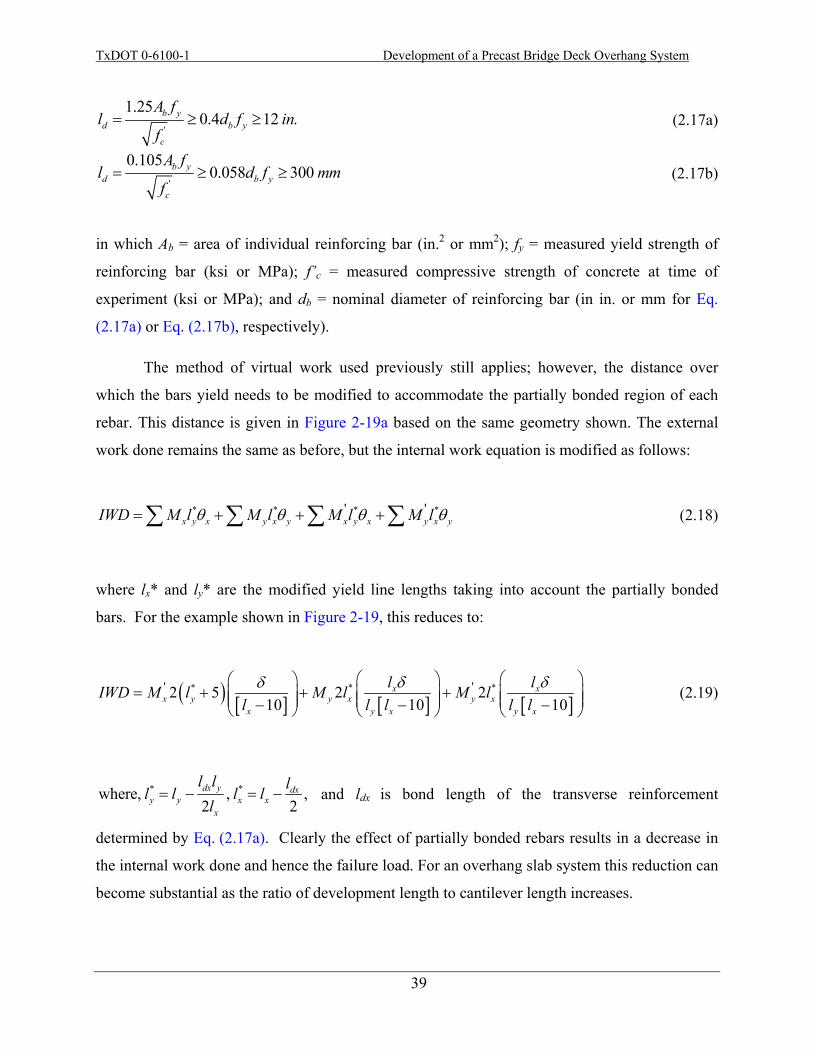
TxDOT 0-6100-1 Development of a Precast Bridge Deck Overhang System
39
'
1.250.4 12 .b y
d b y
c
A fl d f in
f= ≥ ≥ (2.17a)
'
0.1050.058 300b y
d b y
c
A fl d f mm
f= ≥ ≥ (2.17b)
in which Ab = area of individual reinforcing bar (in.2 or mm2); fy = measured yield strength of
reinforcing bar (ksi or MPa); f’c = measured compressive strength of concrete at time of
experiment (ksi or MPa); and db = nominal diameter of reinforcing bar (in in. or mm for Eq.
(2.17a) or Eq. (2.17b), respectively).
The method of virtual work used previously still applies; however, the distance over
which the bars yield needs to be modified to accommodate the partially bonded region of each
rebar. This distance is given in Figure 2-19a based on the same geometry shown. The external
work done remains the same as before, but the internal work equation is modified as follows:
* * * *' 'x y x y x y x y x y x yIWD M l M l M l M lθ θ θ θ= + + +∑ ∑ ∑ ∑ (2.18)
where lx* and ly* are the modified yield line lengths taking into account the partially bonded
bars. For the example shown in Figure 2-19, this reduces to:
( ) [ ] [ ] [ ]* * *' '2 5 2 2
10 10 10x x
x y y x y xx y x y x
l lIWD M l M l M ll l l l l
δ δδ ⎛ ⎞ ⎛ ⎞⎛ ⎞= + + +⎜ ⎟ ⎜ ⎟⎜ ⎟⎜ ⎟ ⎜ ⎟ ⎜ ⎟− − −⎝ ⎠ ⎝ ⎠ ⎝ ⎠
(2.19)
* *where, , ,2 2dx y dx
y y x xx
l l ll l l ll
= − = − and ldx is bond length of the transverse reinforcement
determined by Eq. (2.17a). Clearly the effect of partially bonded rebars results in a decrease in
the internal work done and hence the failure load. For an overhang slab system this reduction can
become substantial as the ratio of development length to cantilever length increases.
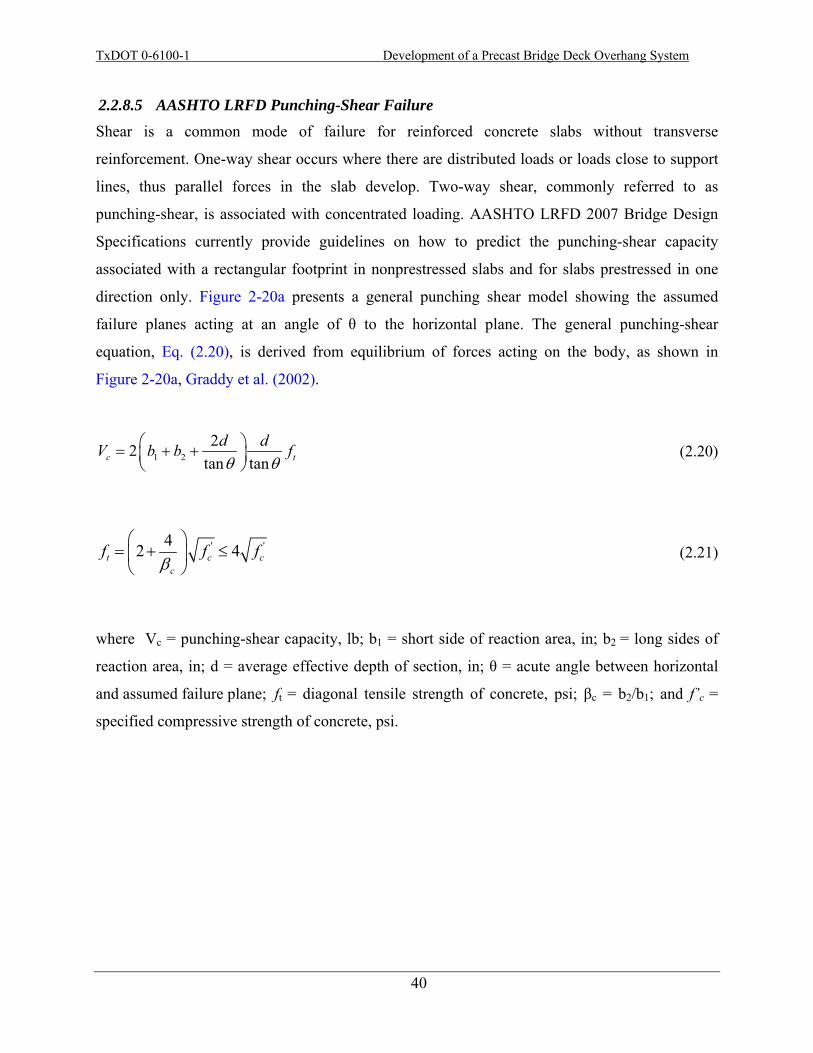
TxDOT 0-6100-1 Development of a Precast Bridge Deck Overhang System
40
2.2.8.5 AASHTO LRFD Punching-Shear Failure Shear is a common mode of failure for reinforced concrete slabs without transverse
reinforcement. One-way shear occurs where there are distributed loads or loads close to support
lines, thus parallel forces in the slab develop. Two-way shear, commonly referred to as
punching-shear, is associated with concentrated loading. AASHTO LRFD 2007 Bridge Design
Specifications currently provide guidelines on how to predict the punching-shear capacity
associated with a rectangular footprint in nonprestressed slabs and for slabs prestressed in one
direction only. Figure 2-20a presents a general punching shear model showing the assumed
failure planes acting at an angle of θ to the horizontal plane. The general punching-shear
equation, Eq. (2.20), is derived from equilibrium of forces acting on the body, as shown in
Figure 2-20a, Graddy et al. (2002).
1 222
tan tanc td dV b b fθ θ
⎛ ⎞= + +⎜ ⎟⎝ ⎠
(2.20)
' '42 4t c cc
f f fβ
⎛ ⎞= + ≤⎜ ⎟
⎝ ⎠ (2.21)
where Vc = punching-shear capacity, lb; b1 = short side of reaction area, in; b2 = long sides of
reaction area, in; d = average effective depth of section, in; θ = acute angle between horizontal
and assumed failure plane; ft = diagonal tensile strength of concrete, psi; βc = b2/b1; and f’c =
specified compressive strength of concrete, psi.
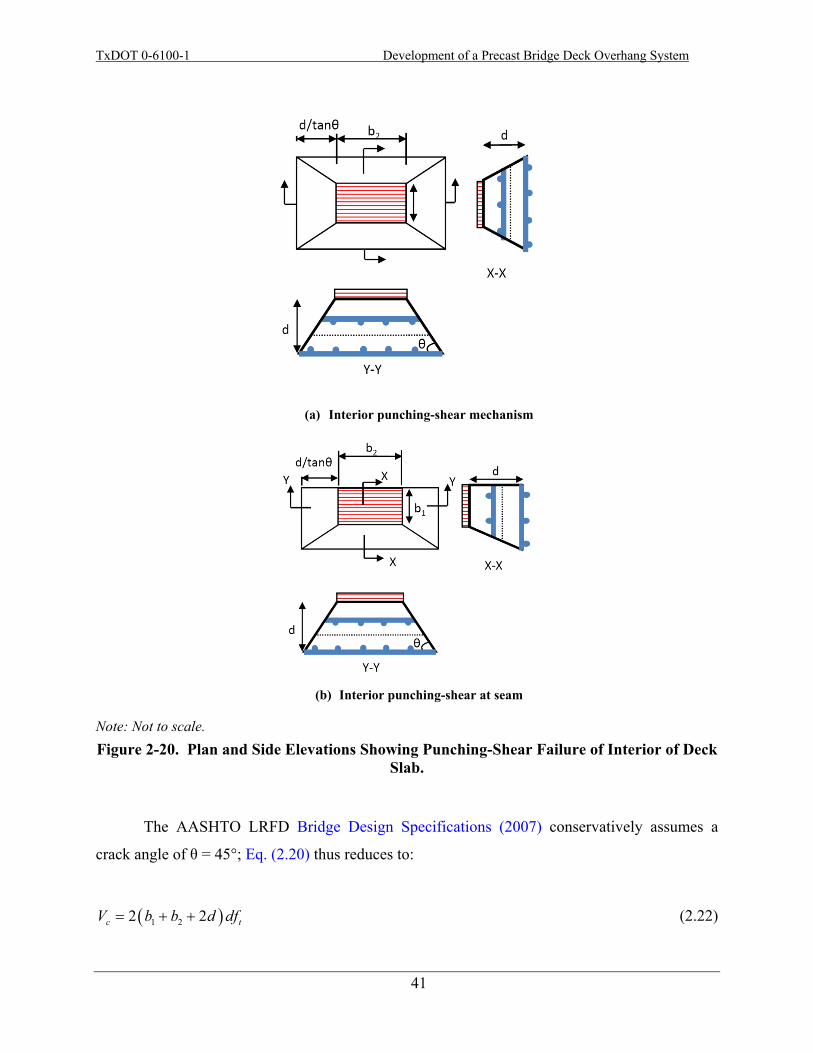
TxDOT 0-6100-1 Development of a Precast Bridge Deck Overhang System
41
(a) Interior punching-shear mechanism
(b) Interior punching-shear at seam
Note: Not to scale. Figure 2-20. Plan and Side Elevations Showing Punching-Shear Failure of Interior of Deck
Slab.
The AASHTO LRFD Bridge Design Specifications (2007) conservatively assumes a
crack angle of θ = 45°; Eq. (2.20) thus reduces to:
( )1 22 2c tV b b d df= + + (2.22)
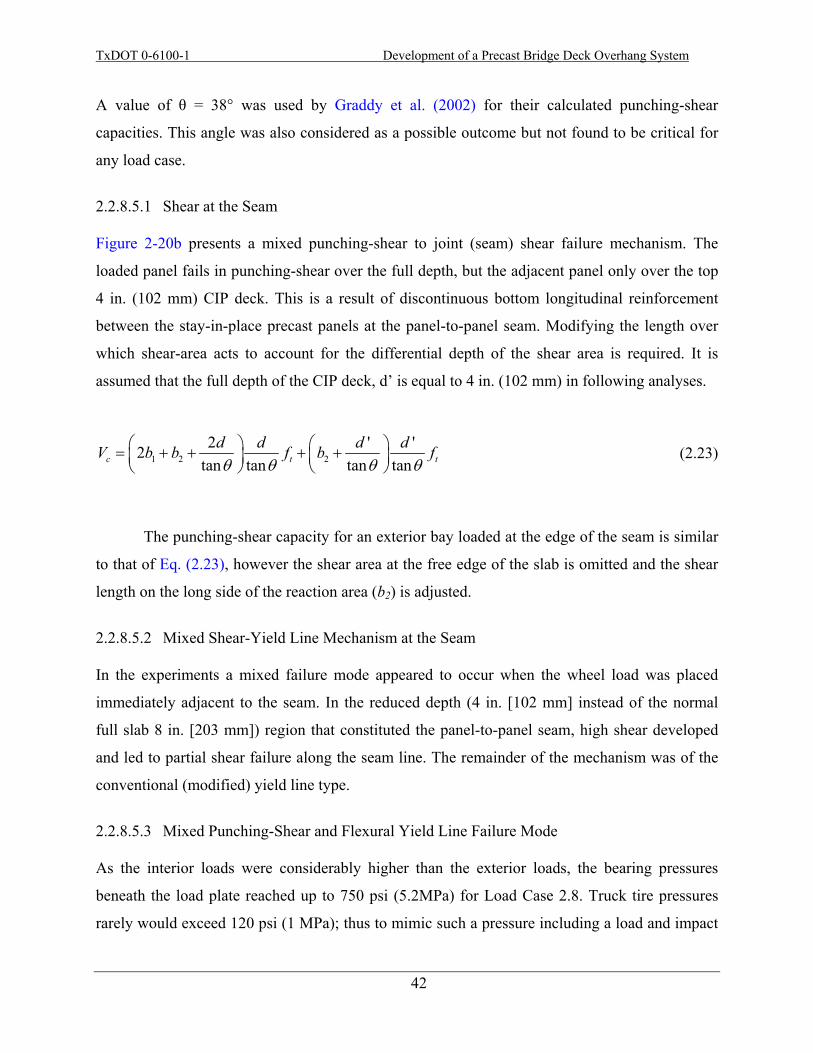
TxDOT 0-6100-1 Development of a Precast Bridge Deck Overhang System
42
A value of θ = 38° was used by Graddy et al. (2002) for their calculated punching-shear
capacities. This angle was also considered as a possible outcome but not found to be critical for
any load case.
2.2.8.5.1 Shear at the Seam
Figure 2-20b presents a mixed punching-shear to joint (seam) shear failure mechanism. The
loaded panel fails in punching-shear over the full depth, but the adjacent panel only over the top
4 in. (102 mm) CIP deck. This is a result of discontinuous bottom longitudinal reinforcement
between the stay-in-place precast panels at the panel-to-panel seam. Modifying the length over
which shear-area acts to account for the differential depth of the shear area is required. It is
assumed that the full depth of the CIP deck, d’ is equal to 4 in. (102 mm) in following analyses.
1 2 22 ' '2
tan tan tan tanc t td d d dV b b f b fθ θ θ θ
⎛ ⎞ ⎛ ⎞= + + + +⎜ ⎟ ⎜ ⎟⎝ ⎠ ⎝ ⎠
(2.23)
The punching-shear capacity for an exterior bay loaded at the edge of the seam is similar
to that of Eq. (2.23), however the shear area at the free edge of the slab is omitted and the shear
length on the long side of the reaction area (b2) is adjusted.
2.2.8.5.2 Mixed Shear-Yield Line Mechanism at the Seam
In the experiments a mixed failure mode appeared to occur when the wheel load was placed
immediately adjacent to the seam. In the reduced depth (4 in. [102 mm] instead of the normal
full slab 8 in. [203 mm]) region that constituted the panel-to-panel seam, high shear developed
and led to partial shear failure along the seam line. The remainder of the mechanism was of the
conventional (modified) yield line type.
2.2.8.5.3 Mixed Punching-Shear and Flexural Yield Line Failure Mode
As the interior loads were considerably higher than the exterior loads, the bearing pressures
beneath the load plate reached up to 750 psi (5.2MPa) for Load Case 2.8. Truck tire pressures
rarely would exceed 120 psi (1 MPa); thus to mimic such a pressure including a load and impact

TxDOT 0-6100-1 Development of a Precast Bridge Deck Overhang System
43
factor an upper limit of some 250 psi (1.7 MPa) would seem reasonable for testing. But the
excessively high pressures observed could not be achieved on an actual bridge deck.
Consequently the tests tend to unrealistically change the failure mechanism from a flexural
failure to a partial shear failure.
In previous research by Graddy et al. (2002), a combined flexural-shear failure mode was
reported to occur for the interior regions in their experiments. This was also observed in the
present investigation. The limit failure load was based on a combined punching-shear in the top
reinforced concrete portion of the deck while a flexural mode of failure was observed in the
lower prestressed deck panel portion. This visual observation was also supported by the
instrumental readings. To this end, a new theory that uses the internal virtual work approach to
capture the effects of the mixed punching-shear and flexure failure mode is advanced herein. The
model developed uses an additive approach of combining the positive yield line moments over
the stay-in-place prestressed-precast concrete panel with a punching-shear failure over the top
cast-in-place deck, as illustrated in Figure 2-21. The delamination between the CIP and SIP
panels is assumed in the model and was also observed in the experiment at the longitudinal ends
of the deck during the experimental loading.
Figure 2-21. Flexural-Shear Failure of Interior Bridge Deck Specimen.
2.2.9 Experimental Displacement Profiles and Inferred Curvature Results
Slab behavior is difficult to predict due to complex two-way interaction. It is therefore
instructive to first examine the experimental deformation patterns observed during testing. This
sub-section provides experimental results for the four exterior load cases (Load Cases 1.3, 1.6,
2.3 and 2.7), as well as the two trailing wheel loads on the interior bays (Load Cases 2.4 and
2.8). Displacement profiles are plotted at various loads up to those measured just prior to failure.
From the displacement profiles corresponding curvatures were calculated based on the finite
differences solutions for Specimen 1 and 2, respectively. Curvature plots include the yield
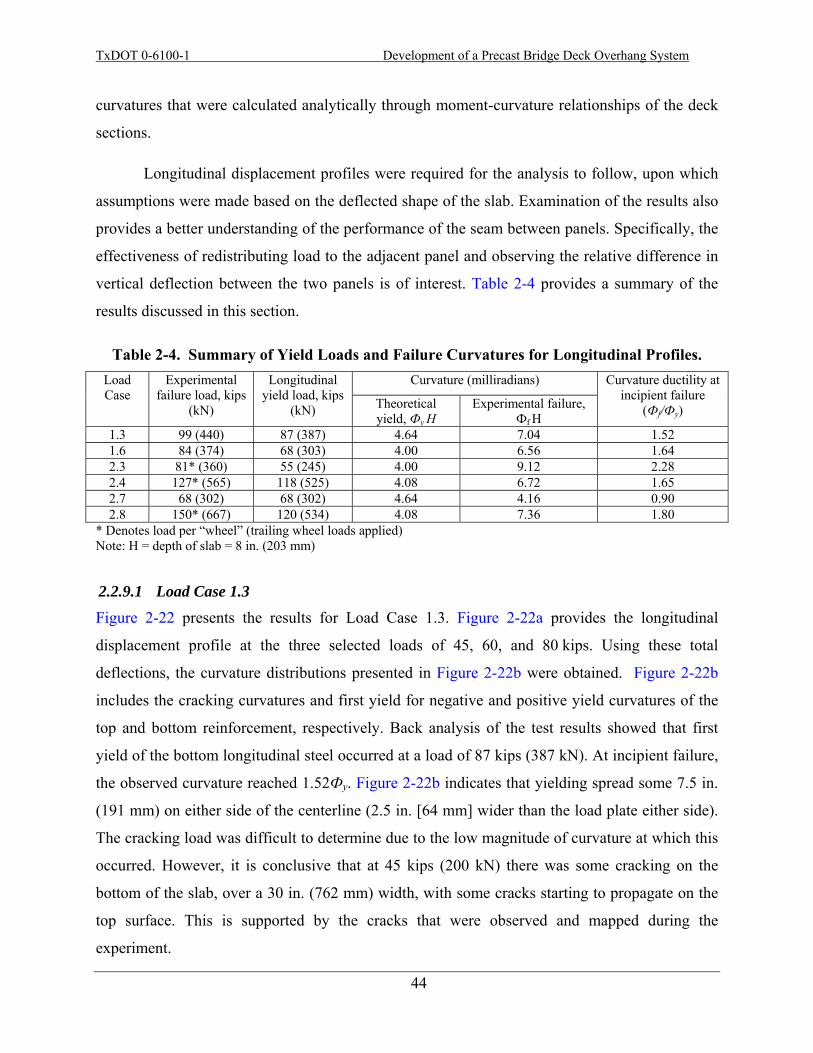
TxDOT 0-6100-1 Development of a Precast Bridge Deck Overhang System
44
curvatures that were calculated analytically through moment-curvature relationships of the deck
sections.
Longitudinal displacement profiles were required for the analysis to follow, upon which
assumptions were made based on the deflected shape of the slab. Examination of the results also
provides a better understanding of the performance of the seam between panels. Specifically, the
effectiveness of redistributing load to the adjacent panel and observing the relative difference in
vertical deflection between the two panels is of interest. Table 2-4 provides a summary of the
results discussed in this section.
Table 2-4. Summary of Yield Loads and Failure Curvatures for Longitudinal Profiles. Load Case
Experimental failure load, kips
(kN)
Longitudinal yield load, kips
(kN)
Curvature (milliradians) Curvature ductility at incipient failure
(Фf/Фy) Theoretical yield, Фy H
Experimental failure, Фf H
1.3 99 (440) 87 (387) 4.64 7.04 1.52 1.6 84 (374) 68 (303) 4.00 6.56 1.64 2.3 81* (360) 55 (245) 4.00 9.12 2.28 2.4 127* (565) 118 (525) 4.08 6.72 1.65 2.7 68 (302) 68 (302) 4.64 4.16 0.90 2.8 150* (667) 120 (534) 4.08 7.36 1.80
* Denotes load per “wheel” (trailing wheel loads applied) Note: H = depth of slab = 8 in. (203 mm)
2.2.9.1 Load Case 1.3 Figure 2-22 presents the results for Load Case 1.3. Figure 2-22a provides the longitudinal
displacement profile at the three selected loads of 45, 60, and 80 kips. Using these total
deflections, the curvature distributions presented in Figure 2-22b were obtained. Figure 2-22b
includes the cracking curvatures and first yield for negative and positive yield curvatures of the
top and bottom reinforcement, respectively. Back analysis of the test results showed that first
yield of the bottom longitudinal steel occurred at a load of 87 kips (387 kN). At incipient failure,
the observed curvature reached 1.52Фy. Figure 2-22b indicates that yielding spread some 7.5 in.
(191 mm) on either side of the centerline (2.5 in. [64 mm] wider than the load plate either side).
The cracking load was difficult to determine due to the low magnitude of curvature at which this
occurred. However, it is conclusive that at 45 kips (200 kN) there was some cracking on the
bottom of the slab, over a 30 in. (762 mm) width, with some cracks starting to propagate on the
top surface. This is supported by the cracks that were observed and mapped during the
experiment.
TxDOT 0-6100-1 Development of a Precast Bridge Deck Overhang System
45
Figure 2-22c presents the transverse displacement profile for Load Case 1.3. Due to an
unleveled laboratory floor surface the beam displaced downward with the application of the
vertical load. An inadequate number of displacement transducers prevented curvatures from
being calculated at the beam face, but it is evident from Figure 2-22c that the rotation at the
beam face increased greatly from the 60 kip (267 kN) load to the 80 kip (356 kN) load, implying
non-linear behavior of the overhang due to yielding of the reinforcement transverse to the
support beams.
2.2.9.2 Load Case 1.6 Figure 2-23 presents the results for Load Case 1.6 (prestressed-precast overhang failure) at
intermediate loads and ultimate failure load. Figure 2-23a shows the differential displacement at
the seam of the panels due to the load plate being positioned on the edge of a panel. This resulted
in the most adverse load case, as the seam was required to transfer load to the adjacent panel.
The loaded panel reached the longitudinal yield load at approximately 68 kips (302 kN). The
curvature at the failure of the loaded panel was 6.56 milliradians, a factor of 1.64Фy. The adjacent
panel was subjected to a hogging moment, with tensile curvatures on the top deck surface just
exceeding the cracking curvature capacity. This agreed with the cracking patterns observed, as in
Figure 2-10, with cracks only occurring on the top slab surface. Figure 2-23c presents the
transverse displacement profile for Load Case 1.6. The displacement of the interior section is
negligible at the first measured location, and remains null for all load increments. Similar to
Load Case 1.3, insufficient data points were recorded to calculate curvatures at the beam face. It
is observed that the vertical displacement increased substantially when loaded from 60 kips
(267 kN) to 80 kips (356 kN) due to plastic rotation.
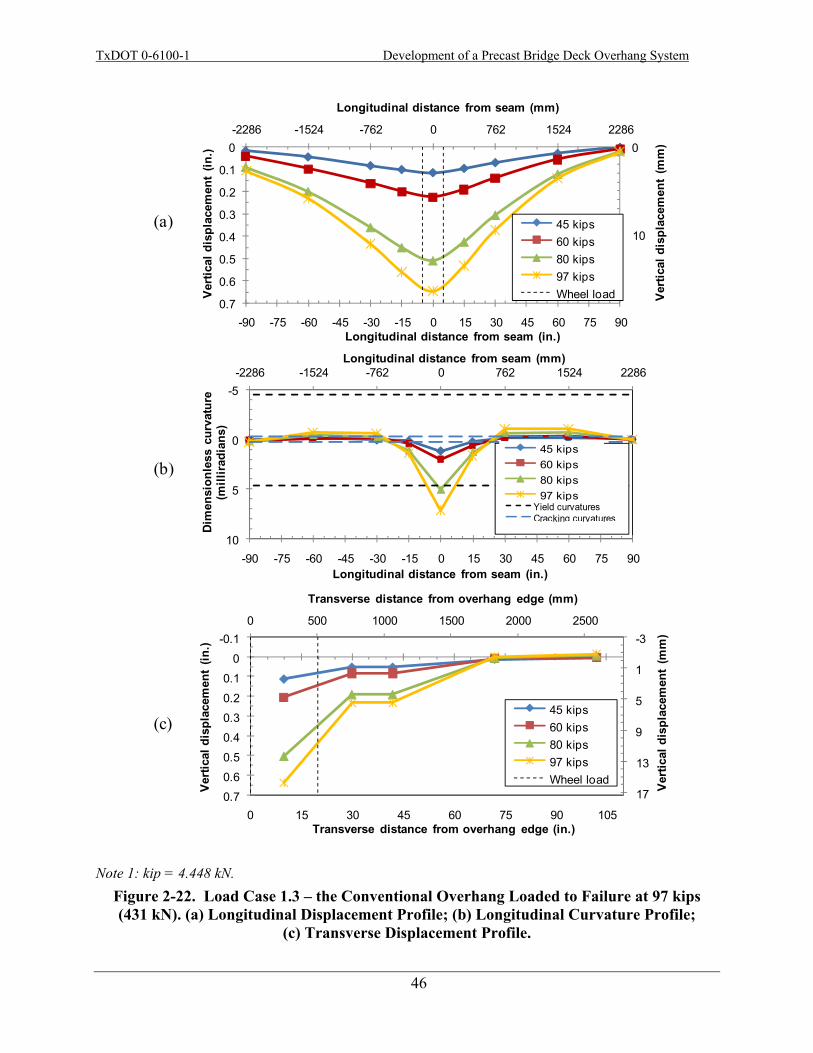
TxDOT 0-6100-1 Development of a Precast Bridge Deck Overhang System
46
Note 1: kip = 4.448 kN. Figure 2-22. Load Case 1.3 – the Conventional Overhang Loaded to Failure at 97 kips (431 kN). (a) Longitudinal Displacement Profile; (b) Longitudinal Curvature Profile;
(c) Transverse Displacement Profile.
-2286 -1524 -762 0 762 1524 22860
10
0
0.1
0.2
0.3
0.4
0.5
0.6
0.7-90 -75 -60 -45 -30 -15 0 15 30 45 60 75 90
Longitudinal distance from seam (mm)
Ver
tical
dis
plac
emen
t (m
m)
Ver
tical
dis
plac
emen
t (in
.)
Longitudinal distance from seam (in.)
45 kips
60 kips
80 kips
-2286 -1524 -762 0 762 1524 2286-5
0
5
10-90 -75 -60 -45 -30 -15 0 15 30 45 60 75 90
Longitudinal distance from seam (mm)
Dim
ensi
onle
ss c
urva
ture
(m
illir
adia
ns)
Longitudinal distance from seam (in.)
45 kips
60 kips
80 kips
0 500 1000 1500 2000 2500-3
1
5
9
13
17
-0.1
0
0.1
0.2
0.3
0.4
0.5
0.6
0.70 15 30 45 60 75 90 105
Transverse distance from overhang edge (mm)
Ver
tical
dis
plac
emen
t (m
m)
Ver
tical
dis
plac
emen
t (in
.)
Transverse distance from overhang edge (in.)
45 kips60 kips80 kips97 kipsWheel load
(a)
(b)
(c)
45 kips60 kips80 kips97 kipsWheel load
45 kips60 kips80 kips97 kipsWheel load
Yield curvaturesCracking curvatures
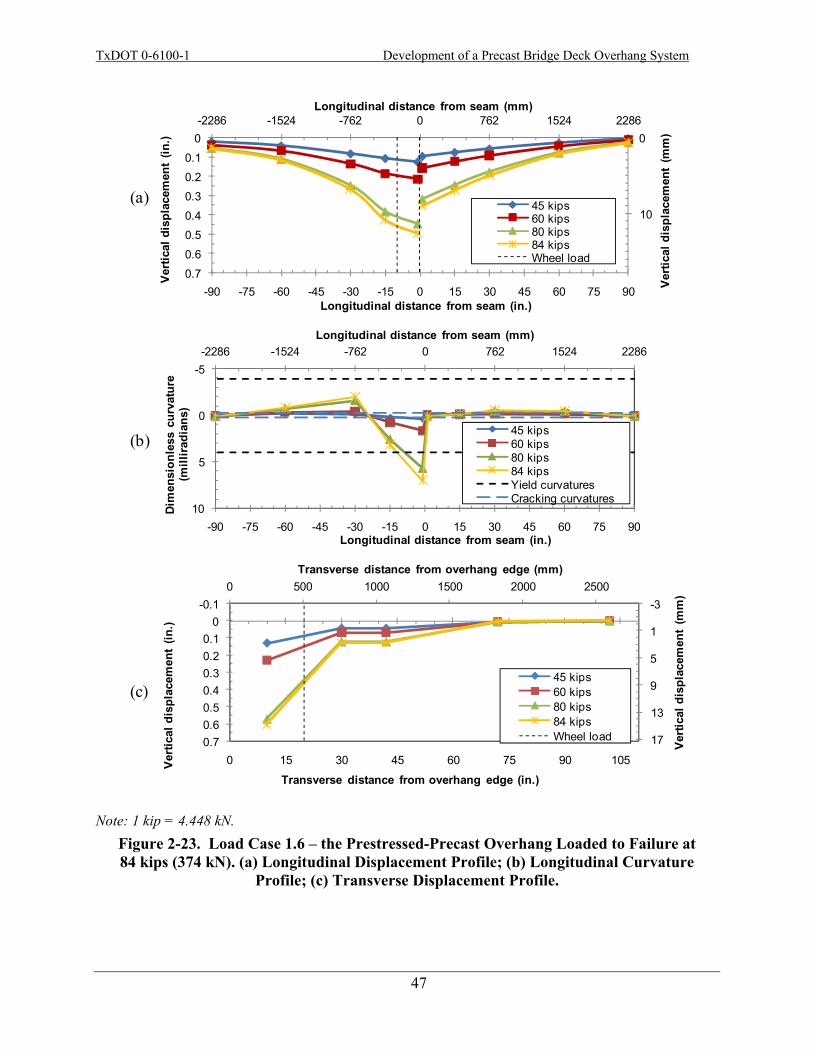
TxDOT 0-6100-1 Development of a Precast Bridge Deck Overhang System
47
Note: 1 kip = 4.448 kN. Figure 2-23. Load Case 1.6 – the Prestressed-Precast Overhang Loaded to Failure at 84 kips (374 kN). (a) Longitudinal Displacement Profile; (b) Longitudinal Curvature
Profile; (c) Transverse Displacement Profile.
(a)
(b)
(c)
-2286 -1524 -762 0 762 1524 22860
10
0
0.10.20.30.40.5
0.60.7
-90 -75 -60 -45 -30 -15 0 15 30 45 60 75 90
Longitudinal distance from seam (mm)
Verti
cal d
ispl
acem
ent
(mm
)
Verti
cal d
ispl
acem
ent
(in.)
Longitudinal distance from seam (in.)
45 kips60 kips80 kips84 kipsWheel load
-2286 -1524 -762 0 762 1524 2286-5
0
5
10-90 -75 -60 -45 -30 -15 0 15 30 45 60 75 90
Longitudinal distance from seam (mm)
Dim
ensi
onle
ss c
urva
ture
(m
illira
dian
s)
Longitudinal distance from seam (in.)
45 kips60 kips80 kips84 kipsYield curvaturesCracking curvatures
0 500 1000 1500 2000 2500-3
1
5
9
13
17
-0.10
0.10.20.30.40.50.60.7
0 15 30 45 60 75 90 105
Transverse distance from overhang edge (mm)
Ver
tical
dis
plac
emen
t (m
m)
Vert
ical
dis
plac
emen
t (in
.)
Transverse distance from overhang edge (in.)
45 kips60 kips80 kips84 kipsWheel load
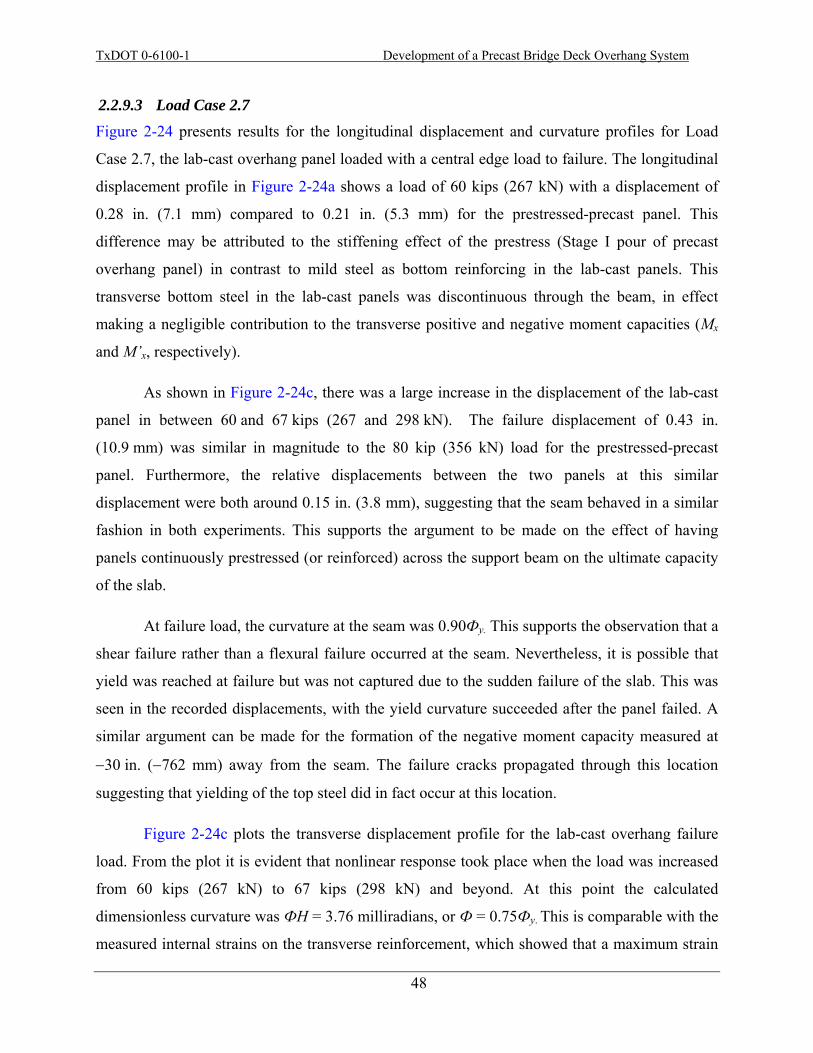
TxDOT 0-6100-1 Development of a Precast Bridge Deck Overhang System
48
2.2.9.3 Load Case 2.7 Figure 2-24 presents results for the longitudinal displacement and curvature profiles for Load
Case 2.7, the lab-cast overhang panel loaded with a central edge load to failure. The longitudinal
displacement profile in Figure 2-24a shows a load of 60 kips (267 kN) with a displacement of
0.28 in. (7.1 mm) compared to 0.21 in. (5.3 mm) for the prestressed-precast panel. This
difference may be attributed to the stiffening effect of the prestress (Stage I pour of precast
overhang panel) in contrast to mild steel as bottom reinforcing in the lab-cast panels. This
transverse bottom steel in the lab-cast panels was discontinuous through the beam, in effect
making a negligible contribution to the transverse positive and negative moment capacities (Mx
and M’x, respectively).
As shown in Figure 2-24c, there was a large increase in the displacement of the lab-cast
panel in between 60 and 67 kips (267 and 298 kN). The failure displacement of 0.43 in.
(10.9 mm) was similar in magnitude to the 80 kip (356 kN) load for the prestressed-precast
panel. Furthermore, the relative displacements between the two panels at this similar
displacement were both around 0.15 in. (3.8 mm), suggesting that the seam behaved in a similar
fashion in both experiments. This supports the argument to be made on the effect of having
panels continuously prestressed (or reinforced) across the support beam on the ultimate capacity
of the slab.
At failure load, the curvature at the seam was 0.90Фy. This supports the observation that a
shear failure rather than a flexural failure occurred at the seam. Nevertheless, it is possible that
yield was reached at failure but was not captured due to the sudden failure of the slab. This was
seen in the recorded displacements, with the yield curvature succeeded after the panel failed. A
similar argument can be made for the formation of the negative moment capacity measured at
−30 in. (−762 mm) away from the seam. The failure cracks propagated through this location
suggesting that yielding of the top steel did in fact occur at this location.
Figure 2-24c plots the transverse displacement profile for the lab-cast overhang failure
load. From the plot it is evident that nonlinear response took place when the load was increased
from 60 kips (267 kN) to 67 kips (298 kN) and beyond. At this point the calculated
dimensionless curvature was ФH = 3.76 milliradians, or Ф = 0.75Фy. This is comparable with the
measured internal strains on the transverse reinforcement, which showed that a maximum strain
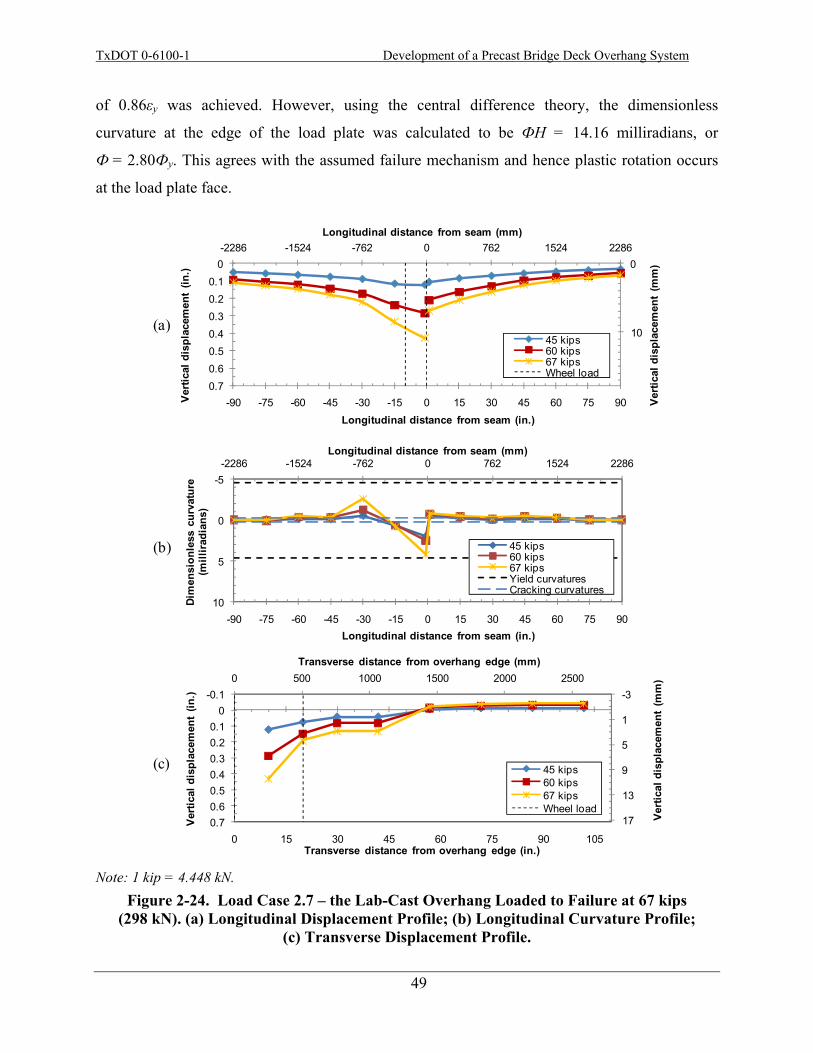
TxDOT 0-6100-1 Development of a Precast Bridge Deck Overhang System
49
of 0.86εy was achieved. However, using the central difference theory, the dimensionless
curvature at the edge of the load plate was calculated to be ФH = 14.16 milliradians, or
Ф = 2.80Фy. This agrees with the assumed failure mechanism and hence plastic rotation occurs
at the load plate face.
Note: 1 kip = 4.448 kN.
Figure 2-24. Load Case 2.7 – the Lab-Cast Overhang Loaded to Failure at 67 kips (298 kN). (a) Longitudinal Displacement Profile; (b) Longitudinal Curvature Profile;
(c) Transverse Displacement Profile.
(a)
(b)
(c)
-2286 -1524 -762 0 762 1524 22860
10
00.10.20.30.40.50.60.7
-90 -75 -60 -45 -30 -15 0 15 30 45 60 75 90
Longitudinal distance from seam (mm)
Verti
cal d
ispl
acem
ent
(mm
)
Ver
tical
dis
plac
emen
t (in
.)
Longitudinal distance from seam (in.)
45 kips60 kips67 kipsWheel load
-2286 -1524 -762 0 762 1524 2286-5
0
5
10-90 -75 -60 -45 -30 -15 0 15 30 45 60 75 90
Longitudinal distance from seam (mm)
Dim
ensi
onle
ss c
urva
ture
(m
illir
adia
ns)
Longitudinal distance from seam (in.)
45 kips60 kips67 kipsYield curvaturesCracking curvatures
0 500 1000 1500 2000 2500-3
1
5
9
13
17
-0.10
0.10.20.30.40.50.60.7
0 15 30 45 60 75 90 105
Transverse distance from overhang edge (mm)Ve
rtica
l dis
plac
emen
t (m
m)
Verti
cal d
ispl
acem
ent
(in.)
Transverse distance from overhang edge (in.)
45 kips60 kips67 kipsWheel load
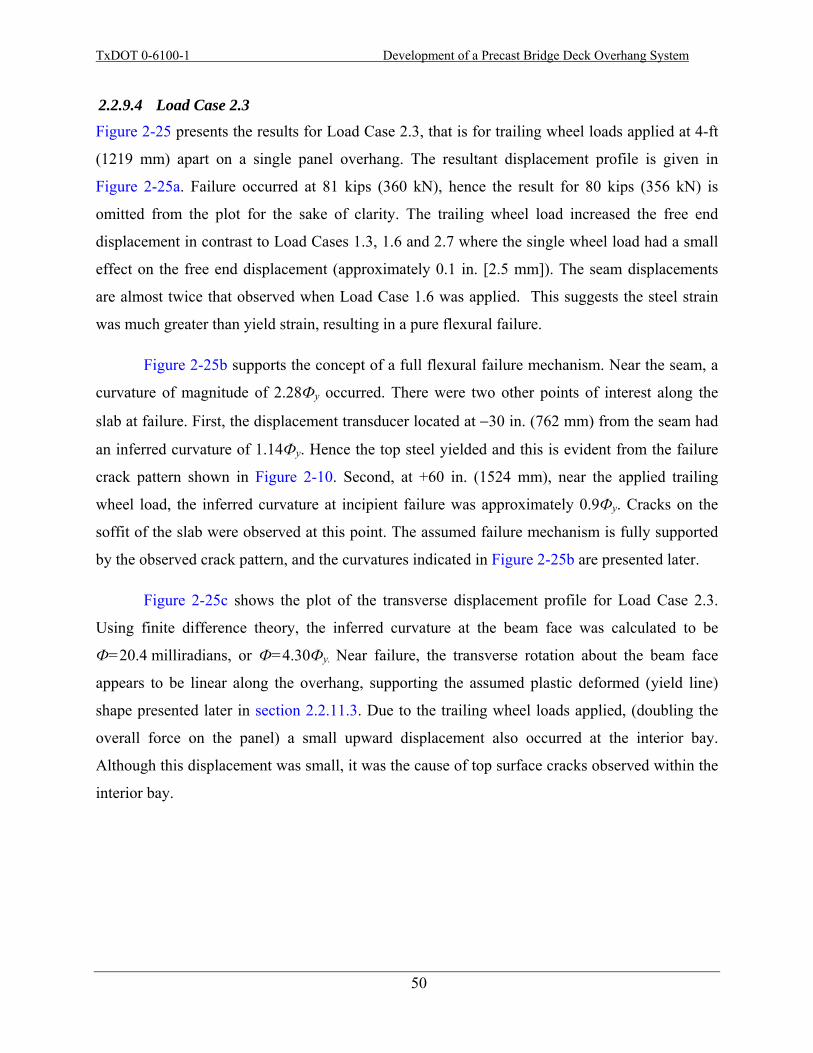
TxDOT 0-6100-1 Development of a Precast Bridge Deck Overhang System
50
2.2.9.4 Load Case 2.3 Figure 2-25 presents the results for Load Case 2.3, that is for trailing wheel loads applied at 4-ft
(1219 mm) apart on a single panel overhang. The resultant displacement profile is given in
Figure 2-25a. Failure occurred at 81 kips (360 kN), hence the result for 80 kips (356 kN) is
omitted from the plot for the sake of clarity. The trailing wheel load increased the free end
displacement in contrast to Load Cases 1.3, 1.6 and 2.7 where the single wheel load had a small
effect on the free end displacement (approximately 0.1 in. [2.5 mm]). The seam displacements
are almost twice that observed when Load Case 1.6 was applied. This suggests the steel strain
was much greater than yield strain, resulting in a pure flexural failure.
Figure 2-25b supports the concept of a full flexural failure mechanism. Near the seam, a
curvature of magnitude of 2.28Фy occurred. There were two other points of interest along the
slab at failure. First, the displacement transducer located at −30 in. (762 mm) from the seam had
an inferred curvature of 1.14Фy. Hence the top steel yielded and this is evident from the failure
crack pattern shown in Figure 2-10. Second, at +60 in. (1524 mm), near the applied trailing
wheel load, the inferred curvature at incipient failure was approximately 0.9Фy. Cracks on the
soffit of the slab were observed at this point. The assumed failure mechanism is fully supported
by the observed crack pattern, and the curvatures indicated in Figure 2-25b are presented later.
Figure 2-25c shows the plot of the transverse displacement profile for Load Case 2.3.
Using finite difference theory, the inferred curvature at the beam face was calculated to be
Ф=20.4 milliradians, or Ф=4.30Фy. Near failure, the transverse rotation about the beam face
appears to be linear along the overhang, supporting the assumed plastic deformed (yield line)
shape presented later in section 2.2.11.3. Due to the trailing wheel loads applied, (doubling the
overall force on the panel) a small upward displacement also occurred at the interior bay.
Although this displacement was small, it was the cause of top surface cracks observed within the
interior bay.
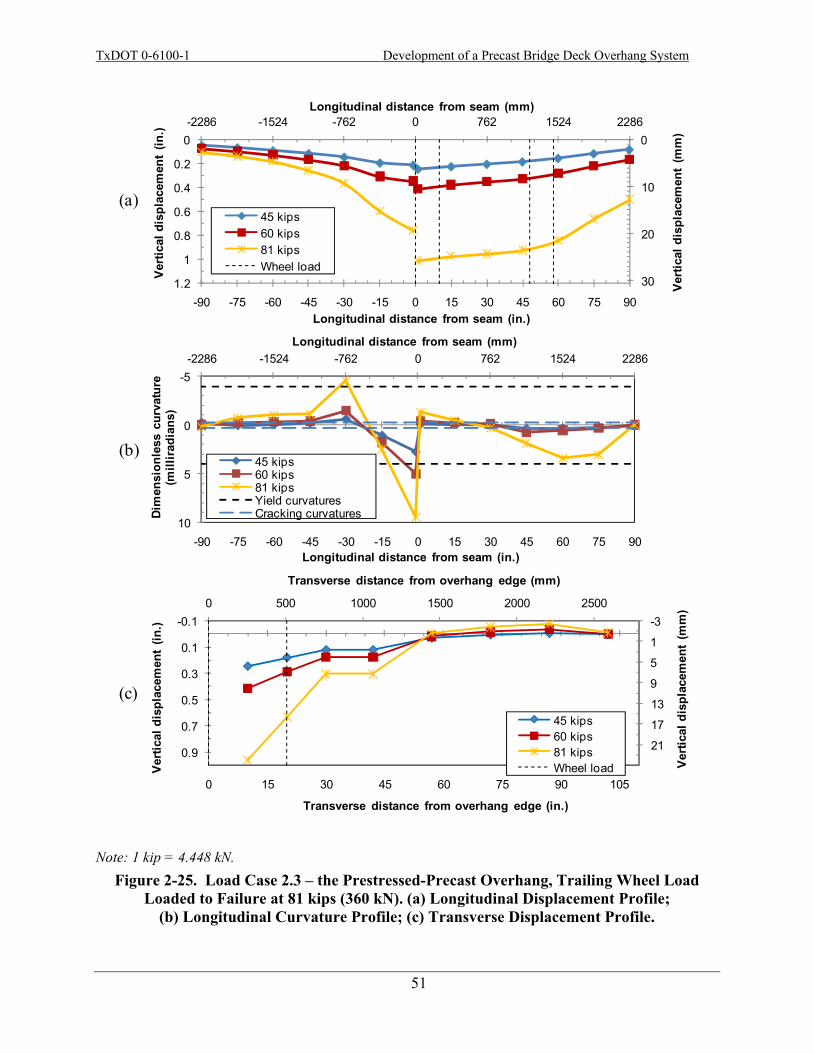
TxDOT 0-6100-1 Development of a Precast Bridge Deck Overhang System
51
Note: 1 kip = 4.448 kN. Figure 2-25. Load Case 2.3 – the Prestressed-Precast Overhang, Trailing Wheel Load
Loaded to Failure at 81 kips (360 kN). (a) Longitudinal Displacement Profile; (b) Longitudinal Curvature Profile; (c) Transverse Displacement Profile.
(a)
(b)
(c)
-2286 -1524 -762 0 762 1524 22860
10
20
30
0
0.2
0.4
0.6
0.8
1
1.2-90 -75 -60 -45 -30 -15 0 15 30 45 60 75 90
Longitudinal distance from seam (mm)
Vert
ical
dis
plac
emen
t (m
m)
Ver
tical
dis
plac
emen
t (in
.)
Longitudinal distance from seam (in.)
45 kips60 kips81 kipsWheel load
-2286 -1524 -762 0 762 1524 2286-5
0
5
10-90 -75 -60 -45 -30 -15 0 15 30 45 60 75 90
Longitudinal distance from seam (mm)
Dim
ensi
onle
ss c
urva
ture
(m
illir
adia
ns)
Longitudinal distance from seam (in.)
45 kips60 kips81 kipsYield curvaturesCracking curvatures
0 500 1000 1500 2000 2500-3
1
5
9
13
17
21
-0.1
0.1
0.3
0.5
0.7
0.9
0 15 30 45 60 75 90 105
Transverse distance from overhang edge (mm)
Ver
tical
dis
plac
emen
t (m
m)
Ver
tical
dis
plac
emen
t (in
.)
Transverse distance from overhang edge (in.)
45 kips60 kips81 kipsWheel load

TxDOT 0-6100-1 Development of a Precast Bridge Deck Overhang System
52
2.2.10 Longitudinal Displacement and Curvature Profiles of Deck Slab Interior
2.2.10.1 Load Case 2.4 Figure 2-26 presents longitudinal results for Load Case 2.4, the interior precast panel loaded with
trailing wheels, with one load area at the face of the seam. Figure 2-26a presents the longitudinal
displacement profile that is a similar shape (but different magnitudes) to that observed in
Figure 2-25a for the companion overhang case. As expected, the magnitudes are somewhat less
than the overhang trailing wheel load due to additional support from two boundaries when
loaded on the interior bay. At a load of 80 kips (356 kN), Load Case 2.4 measured a
displacement of approximately 0.17 in. (4.3 mm) at the seam compared to 1 in. (25 mm) for
Load Case 2.3. The yield curvature was reached at approximately 118 kips (525 kN) at the seam
as shown in Figure 2-26b. Similarly to Load Case 2.3, yield curvature was almost attained at the
trailing wheel load and on the adjacent panel at the incipient failure load of 127 kips (565 kN).
The maximum inferred curvature at incipient failure occurred adjacent to the seam and was
1.65Фy.
Transverse displacement profiles for varying load increments for Load Case 2.4 are
plotted in Figure 2-27a. Although it appears as though there was substantial bending in the load
plate at 127 kips (565 kN), the difference in magnitude between the edge and center of the plate
is only 0.1 in. (2.5 mm). Hence it is suitable to interpolate between measured points to get the
assumed displacement profile. Figure 2-26a shows that there is a large increase in displacement
when loading from 80 kips (356 kN) to 120 kips (534 kN), suggesting that the transverse
reinforcement had yielded. This is supported by the plot of dimensionless curvatures in Figure 2-
27b. From the recorded data it can be inferred that transverse yield occurred at 105 kips (467
kN). Thus the reinforcement behaved elastically at 80 kips (356 kN), and the curvature in the
panel exceeded the yield curvature at loads more than 105 kips (467 kN). Also, note that the
curvature at the exterior beam face (i.e., at +30 in. [+762 mm]) exceeded negative yield
curvature, as assumed in subsequent analysis.
2.2.10.2 Load Case 2.8 Figure 2-28 presents the longitudinal results for Load Case 2.8. This test was similar to Load
Case 2.4 in the sense that it is an interior trailing wheel load, however it differs as the leading
wheel straddles the seam. Figure 2-28a illustrates this and demonstrates how the displacement is

TxDOT 0-6100-1 Development of a Precast Bridge Deck Overhang System
53
reduced in comparison to Load Case 2.8. At a load of 120 kips (534 kN) the seam displacement
was 0.3 in. (7.6 mm), less than half of the 0.63 in. (16 mm) observed for Load Case 2.4. The
relative displacement between the two panels is negligible, with similar vertical displacements at
both load plates. Regardless of reduced displacements in comparison to Load Case 2.4, yield is
first achieved at 120 kips (534 kN), which is similar to that observed with Load Case 2.4. The
final failure curvature at the seam is 1.80Фy and at the trailing wheel load is 1.31Фy.
Figure 2-29a plots the transverse displacement profile for Load Case 2.8, an interior
trailing wheel load straddling the seam. There is a notable increase in displacement between
80 kips (356 kN) and 120 kips (534 kN), and again until the failure load of 149 kips (663 kN)
was reached. Figure 2-29b infers that the transverse reinforcement yielded at approximately
120 kips (534 kN). This was over 10 percent higher than the yield load of Load Case 2.4,
105 kips (467 kN), with trailing wheels on the same panel. Note that this Load Case 2.8 with the
wheel loads on adjacent panels is not critical, whereas Load Case 2.4 with both the wheel loads
on the same panel was critical.
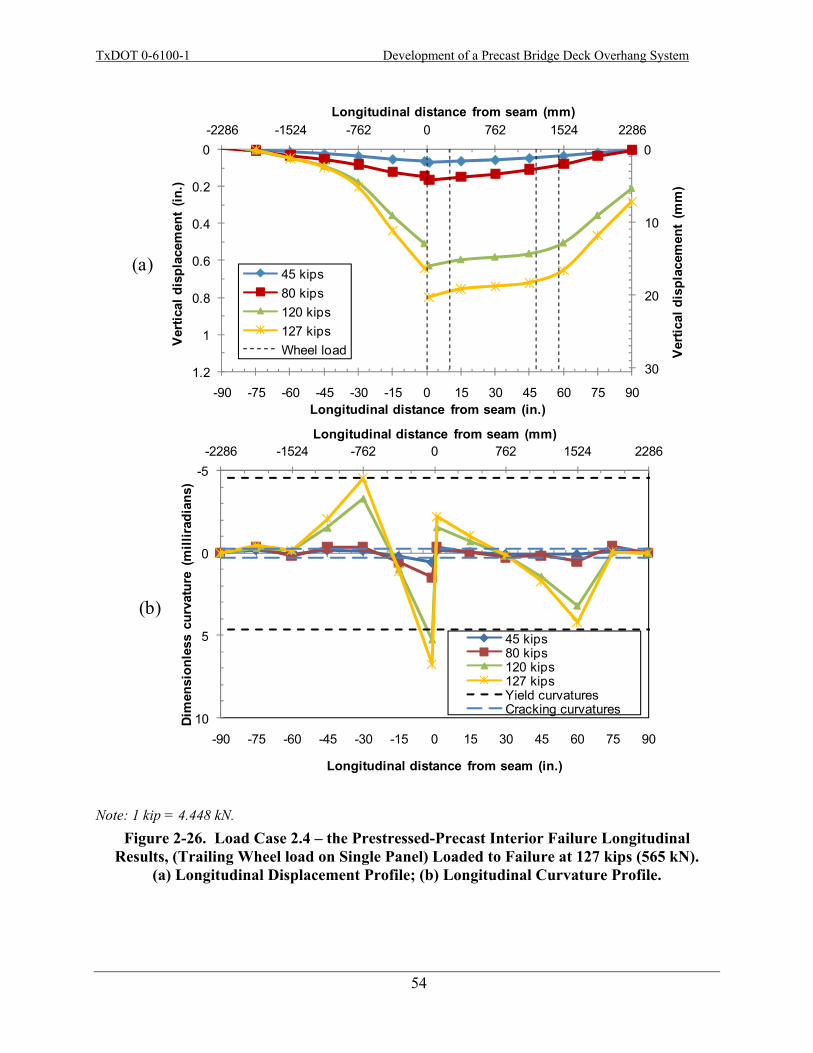
TxDOT 0-6100-1 Development of a Precast Bridge Deck Overhang System
54
Note: 1 kip = 4.448 kN. Figure 2-26. Load Case 2.4 – the Prestressed-Precast Interior Failure Longitudinal
Results, (Trailing Wheel load on Single Panel) Loaded to Failure at 127 kips (565 kN). (a) Longitudinal Displacement Profile; (b) Longitudinal Curvature Profile.
(a)
(b)
-2286 -1524 -762 0 762 1524 22860
10
20
30
0
0.2
0.4
0.6
0.8
1
1.2-90 -75 -60 -45 -30 -15 0 15 30 45 60 75 90
Longitudinal distance from seam (mm)
Ver
tical
dis
plac
emen
t (m
m)
Ver
tical
dis
plac
emen
t (in
.)
Longitudinal distance from seam (in.)
45 kips80 kips120 kips127 kipsWheel load
-2286 -1524 -762 0 762 1524 2286-5
0
5
10-90 -75 -60 -45 -30 -15 0 15 30 45 60 75 90
Longitudinal distance from seam (mm)
Dim
ensi
onle
ss c
urva
ture
(m
illir
adia
ns)
Longitudinal distance from seam (in.)
45 kips80 kips120 kips127 kipsYield curvaturesCracking curvatures

TxDOT 0-6100-1 Development of a Precast Bridge Deck Overhang System
55
Note: 1 kip = 4.448 kN. Figure 2-27. Load Case 2.4 – the Prestressed-Precast Interior Failure Transverse Results,
(Trailing Wheel Load on Single Panel) Loaded to Failure at 127 kips (565 kN). (a) Transverse Displacement Profile; (b) Transverse Curvature Profile.
(a)
(b)
-762 -508 -254 0 254 508 762-3
1
5
9
13
17
21
0
0.2
0.4
0.6
0.8
1
1.2-30 -15 0 15 30
Transverse distance from "wheel" centroid (mm)
Verti
cal d
ispl
acem
ent
(mm
)
Ver
tical
dis
plac
emen
t (in
.)
Transverse distance from "wheel" centroid (in.)
45 kips80 kips120 kips127 kipsWheel load
-762 -508 -254 0 254 508 762-10
-5
0
5
10
15
20-30 -15 0 15 30
Transverse distance from "wheel" centroid (mm)
Dim
ensi
onle
ss c
urva
ture
(m
illira
dian
s)
Transverse distance from "wheel" centroid (in.)
45 kips80 kips120 kips127 kipsYield curvatures
TxDOT 0-6100-1 Development of a Precast Bridge Deck Overhang System
56
Note: 1 kip = 4.448 kN. Figure 2-28. Load Case 2.8 – the Lab-Cast Interior Failure Longitudinal Results, (Trailing
Wheel Load Straddling Seam) Loaded to Failure at 149 kips (663 kN). (a) Longitudinal Displacement Profile; (b) Longitudinal Curvature Profile.
(a)
(b)
-2286 -1524 -762 0 762 1524 22860
10
20
30
0
0.2
0.4
0.6
0.8
1
1.2-90 -75 -60 -45 -30 -15 0 15 30 45 60 75 90
Longitudinal distance from seam (mm)
Ver
tical
dis
plac
emen
t (m
m)
Ver
tical
dis
plac
emen
t (in
.)
Longitudinal distance from seam (in.)
45 kips80 kips120 kips149 kipsWheel load
-2286 -1524 -762 0 762 1524 2286-5
0
5
10-90 -75 -60 -45 -30 -15 0 15 30 45 60 75 90
Longitudinal distance from seam (mm)
Dim
ensi
onle
ss c
urva
ture
(m
illira
dian
s)
Longitudinal distance from seam (in.)
45 kips80 kips120 kips149 kipsYield curvaturesCracking curvatures
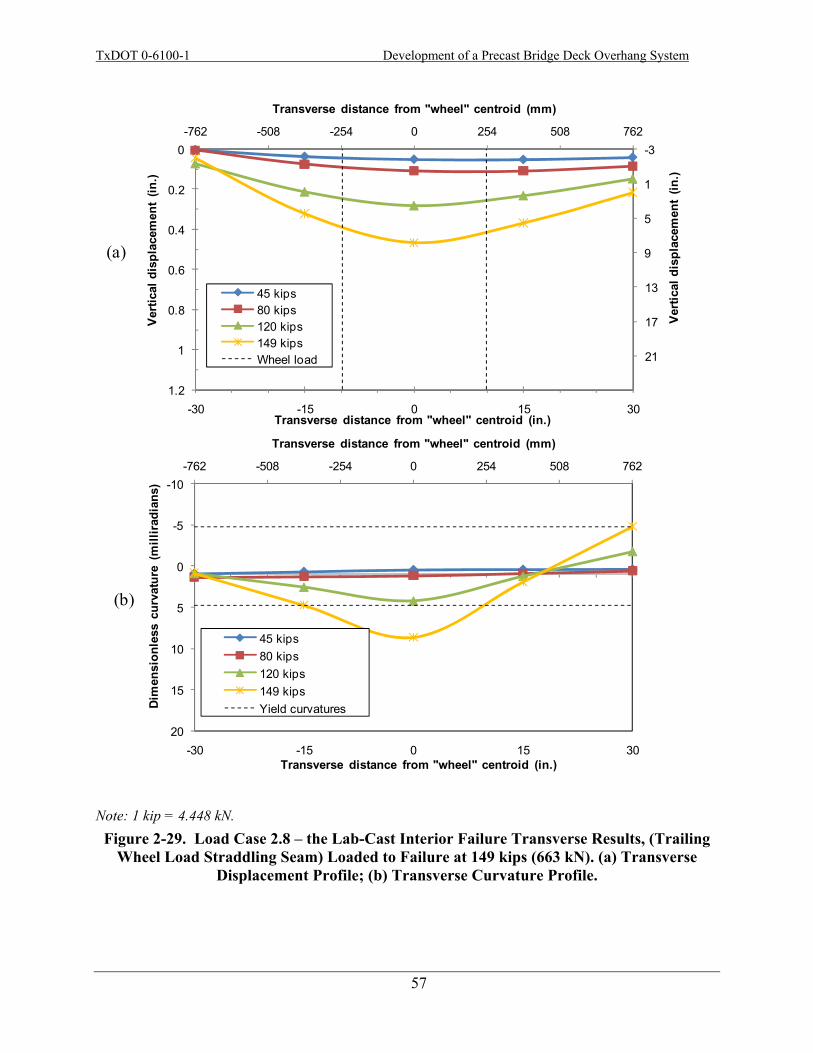
TxDOT 0-6100-1 Development of a Precast Bridge Deck Overhang System
57
Note: 1 kip = 4.448 kN. Figure 2-29. Load Case 2.8 – the Lab-Cast Interior Failure Transverse Results, (Trailing
Wheel Load Straddling Seam) Loaded to Failure at 149 kips (663 kN). (a) Transverse Displacement Profile; (b) Transverse Curvature Profile.
(a)
(b)
-762 -508 -254 0 254 508 762-3
1
5
9
13
17
21
0
0.2
0.4
0.6
0.8
1
1.2-30 -15 0 15 30
Transverse distance from "wheel" centroid (mm)
Verti
cal d
ispl
acem
ent
(in.)
Vert
ical
dis
plac
emen
t (in
.)
Transverse distance from "wheel" centroid (in.)
45 kips80 kips120 kips149 kipsWheel load
-762 -508 -254 0 254 508 762-10
-5
0
5
10
15
20-30 -15 0 15 30
Transverse distance from "wheel" centroid (mm)
Dim
ensi
onle
ss c
urva
ture
(m
illira
dian
s)
Transverse distance from "wheel" centroid (in.)
45 kips80 kips120 kips149 kipsYield curvatures
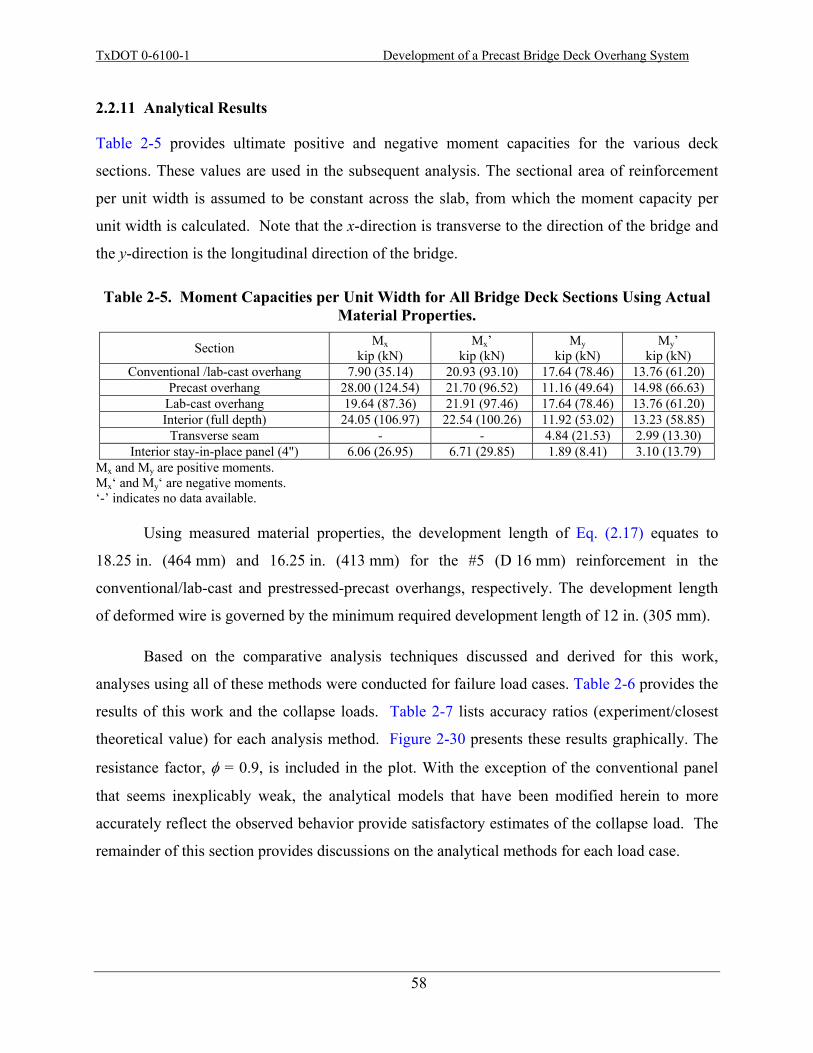
TxDOT 0-6100-1 Development of a Precast Bridge Deck Overhang System
58
2.2.11 Analytical Results
Table 2-5 provides ultimate positive and negative moment capacities for the various deck
sections. These values are used in the subsequent analysis. The sectional area of reinforcement
per unit width is assumed to be constant across the slab, from which the moment capacity per
unit width is calculated. Note that the x-direction is transverse to the direction of the bridge and
the y-direction is the longitudinal direction of the bridge.
Table 2-5. Moment Capacities per Unit Width for All Bridge Deck Sections Using Actual Material Properties.
Section Mx kip (kN)
Mx’ kip (kN)
My kip (kN)
My’ kip (kN)
Conventional /lab-cast overhang 7.90 (35.14) 20.93 (93.10) 17.64 (78.46) 13.76 (61.20) Precast overhang 28.00 (124.54) 21.70 (96.52) 11.16 (49.64) 14.98 (66.63)
Lab-cast overhang 19.64 (87.36) 21.91 (97.46) 17.64 (78.46) 13.76 (61.20) Interior (full depth) 24.05 (106.97) 22.54 (100.26) 11.92 (53.02) 13.23 (58.85)
Transverse seam - - 4.84 (21.53) 2.99 (13.30) Interior stay-in-place panel (4") 6.06 (26.95) 6.71 (29.85) 1.89 (8.41) 3.10 (13.79)
Mx and My are positive moments. Mx‘ and My‘ are negative moments. ‘-’ indicates no data available.
Using measured material properties, the development length of Eq. (2.17) equates to
18.25 in. (464 mm) and 16.25 in. (413 mm) for the #5 (D 16 mm) reinforcement in the
conventional/lab-cast and prestressed-precast overhangs, respectively. The development length
of deformed wire is governed by the minimum required development length of 12 in. (305 mm).
Based on the comparative analysis techniques discussed and derived for this work,
analyses using all of these methods were conducted for failure load cases. Table 2-6 provides the
results of this work and the collapse loads. Table 2-7 lists accuracy ratios (experiment/closest
theoretical value) for each analysis method. Figure 2-30 presents these results graphically. The
resistance factor, φ = 0.9, is included in the plot. With the exception of the conventional panel
that seems inexplicably weak, the analytical models that have been modified herein to more
accurately reflect the observed behavior provide satisfactory estimates of the collapse load. The
remainder of this section provides discussions on the analytical methods for each load case.
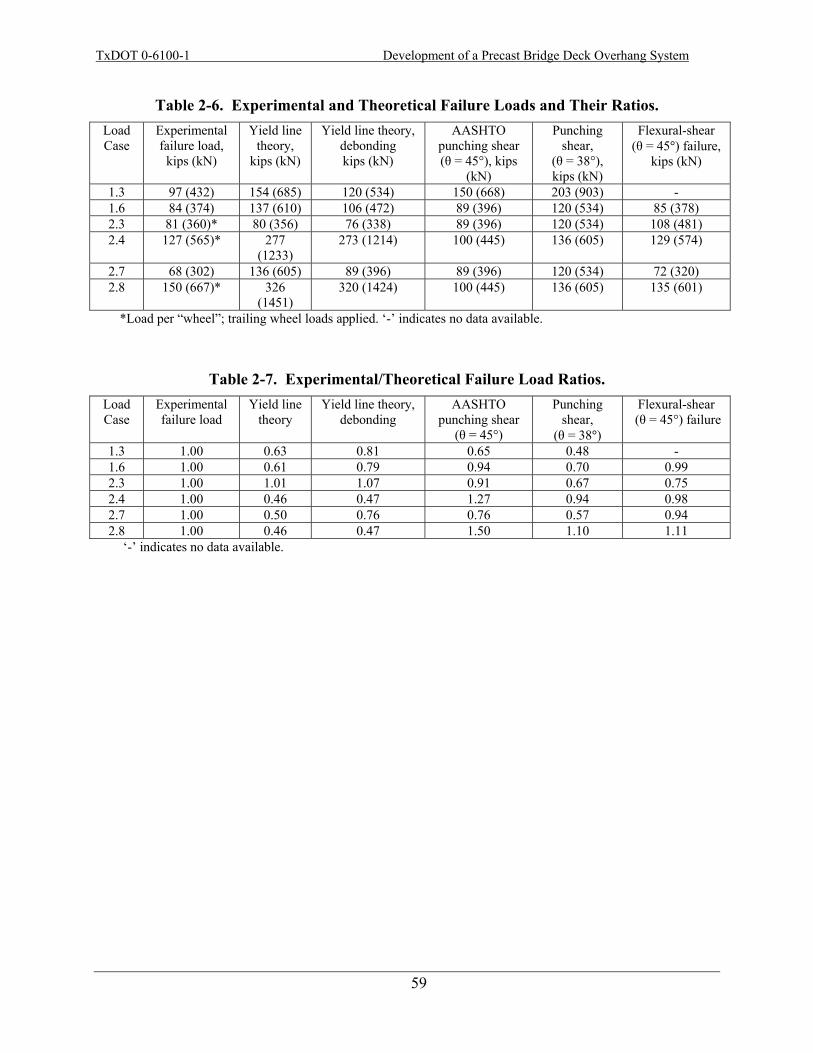
TxDOT 0-6100-1 Development of a Precast Bridge Deck Overhang System
59
Table 2-6. Experimental and Theoretical Failure Loads and Their Ratios. Load Case
Experimental failure load,
kips (kN)
Yield line theory,
kips (kN)
Yield line theory, debonding kips (kN)
AASHTO punching shear (θ = 45°), kips
(kN)
Punching shear,
(θ = 38°), kips (kN)
Flexural-shear (θ = 45°) failure,
kips (kN)
1.3 97 (432) 154 (685) 120 (534) 150 (668) 203 (903) - 1.6 84 (374) 137 (610) 106 (472) 89 (396) 120 (534) 85 (378) 2.3 81 (360)* 80 (356) 76 (338) 89 (396) 120 (534) 108 (481) 2.4 127 (565)* 277
(1233) 273 (1214) 100 (445) 136 (605) 129 (574)
2.7 68 (302) 136 (605) 89 (396) 89 (396) 120 (534) 72 (320) 2.8 150 (667)* 326
(1451) 320 (1424) 100 (445) 136 (605) 135 (601)
*Load per “wheel”; trailing wheel loads applied. ‘-’ indicates no data available.
Table 2-7. Experimental/Theoretical Failure Load Ratios. Load Case
Experimental failure load
Yield line theory
Yield line theory, debonding
AASHTO punching shear
(θ = 45°)
Punching shear,
(θ = 38°)
Flexural-shear (θ = 45°) failure
1.3 1.00 0.63 0.81 0.65 0.48 - 1.6 1.00 0.61 0.79 0.94 0.70 0.99 2.3 1.00 1.01 1.07 0.91 0.67 0.75 2.4 1.00 0.46 0.47 1.27 0.94 0.98 2.7 1.00 0.50 0.76 0.76 0.57 0.94 2.8 1.00 0.46 0.47 1.50 1.10 1.11
‘-’ indicates no data available.
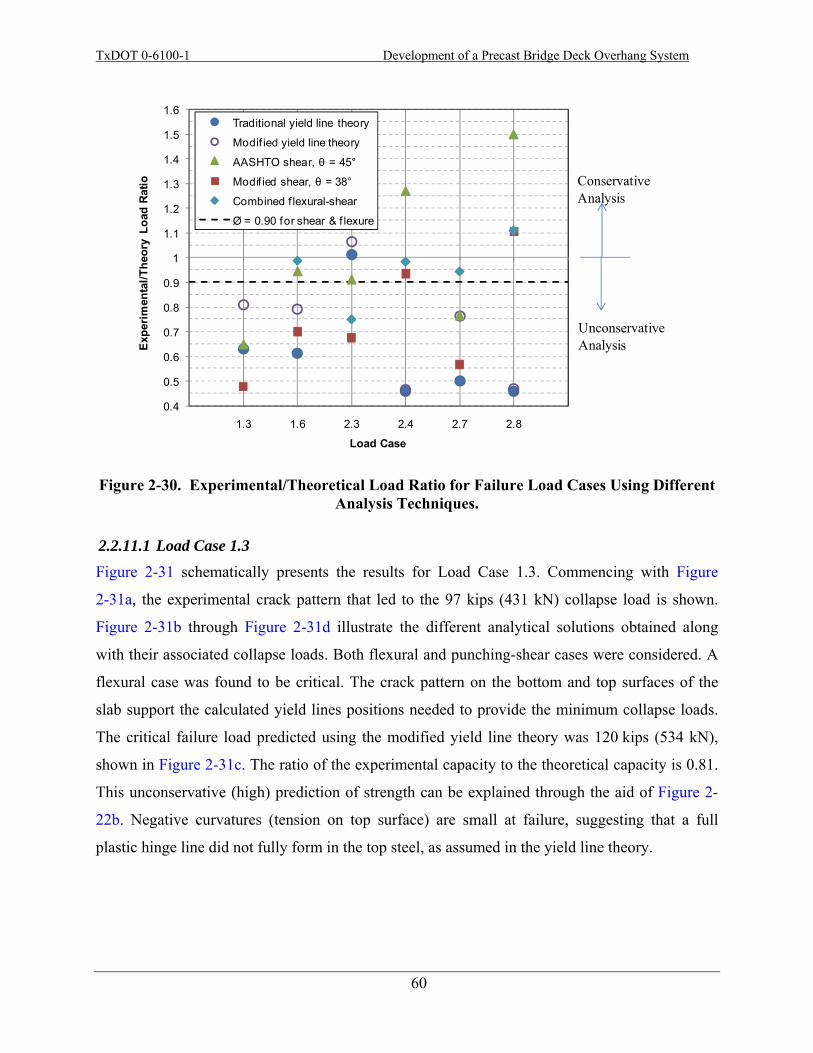
TxDOT 0-6100-1 Development of a Precast Bridge Deck Overhang System
60
Figure 2-30. Experimental/Theoretical Load Ratio for Failure Load Cases Using Different Analysis Techniques.
2.2.11.1 Load Case 1.3 Figure 2-31 schematically presents the results for Load Case 1.3. Commencing with Figure
2-31a, the experimental crack pattern that led to the 97 kips (431 kN) collapse load is shown.
Figure 2-31b through Figure 2-31d illustrate the different analytical solutions obtained along
with their associated collapse loads. Both flexural and punching-shear cases were considered. A
flexural case was found to be critical. The crack pattern on the bottom and top surfaces of the
slab support the calculated yield lines positions needed to provide the minimum collapse loads.
The critical failure load predicted using the modified yield line theory was 120 kips (534 kN),
shown in Figure 2-31c. The ratio of the experimental capacity to the theoretical capacity is 0.81.
This unconservative (high) prediction of strength can be explained through the aid of Figure 2-
22b. Negative curvatures (tension on top surface) are small at failure, suggesting that a full
plastic hinge line did not fully form in the top steel, as assumed in the yield line theory.
0.4
0.5
0.6
0.7
0.8
0.9
1
1.1
1.2
1.3
1.4
1.5
1.6
1.3 1.6 2.3 2.4 2.7 2.8
Expe
rimen
tal/T
heor
y Lo
ad R
atio
Load Case
Traditional yield line theory
Modif ied yield line theory
AASHTO shear, θ = 45°
Modif ied shear, θ = 38°
Combined f lexural-shear
Ø = 0.90 for shear & f lexure
Conservative Analysis
UnconservativeAnalysis
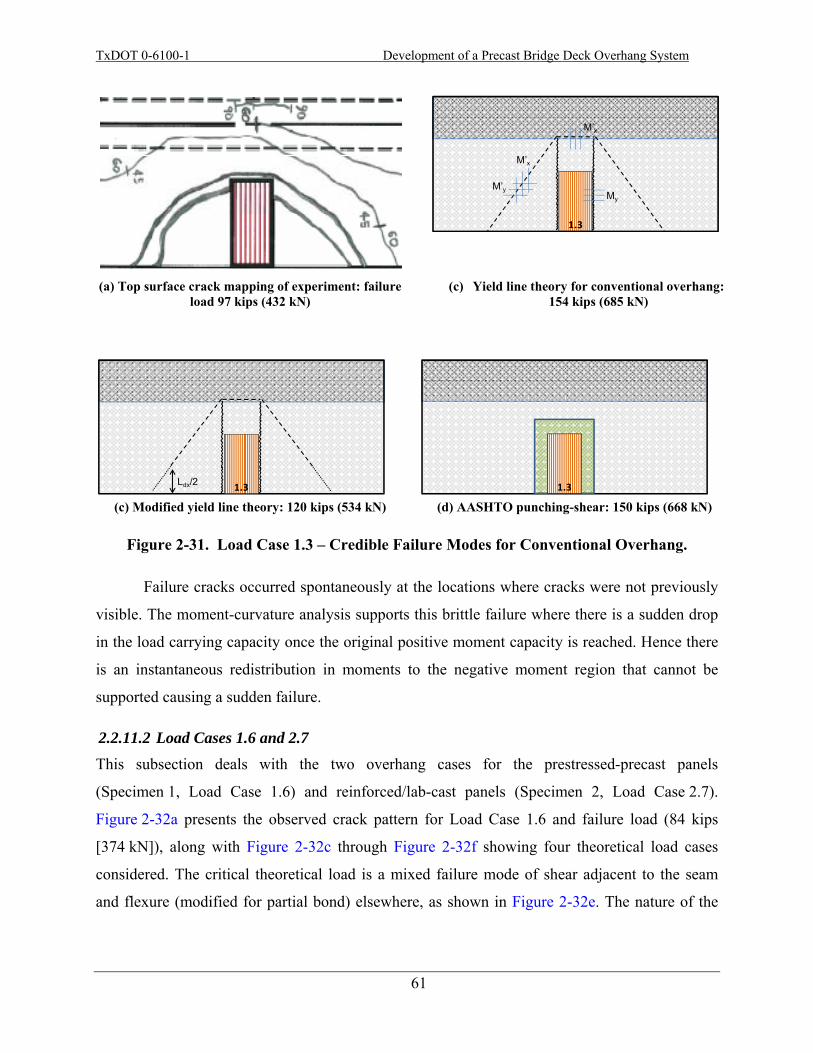
TxDOT 0-6100-1 Development of a Precast Bridge Deck Overhang System
61
Figure 2-31. Load Case 1.3 – Credible Failure Modes for Conventional Overhang.
Failure cracks occurred spontaneously at the locations where cracks were not previously
visible. The moment-curvature analysis supports this brittle failure where there is a sudden drop
in the load carrying capacity once the original positive moment capacity is reached. Hence there
is an instantaneous redistribution in moments to the negative moment region that cannot be
supported causing a sudden failure.
2.2.11.2 Load Cases 1.6 and 2.7 This subsection deals with the two overhang cases for the prestressed-precast panels
(Specimen 1, Load Case 1.6) and reinforced/lab-cast panels (Specimen 2, Load Case 2.7).
Figure 2-32a presents the observed crack pattern for Load Case 1.6 and failure load (84 kips
[374 kN]), along with Figure 2-32c through Figure 2-32f showing four theoretical load cases
considered. The critical theoretical load is a mixed failure mode of shear adjacent to the seam
and flexure (modified for partial bond) elsewhere, as shown in Figure 2-32e. The nature of the
(a) Top surface crack mapping of experiment: failure load 97 kips (432 kN)
(c) Yield line theory for conventional overhang: 154 kips (685 kN)
(c) Modified yield line theory: 120 kips (534 kN)
(d) AASHTO punching-shear: 150 kips (668 kN)
1.3
My
M’x
M’y
M’x
1.3Ldx/2 1.3
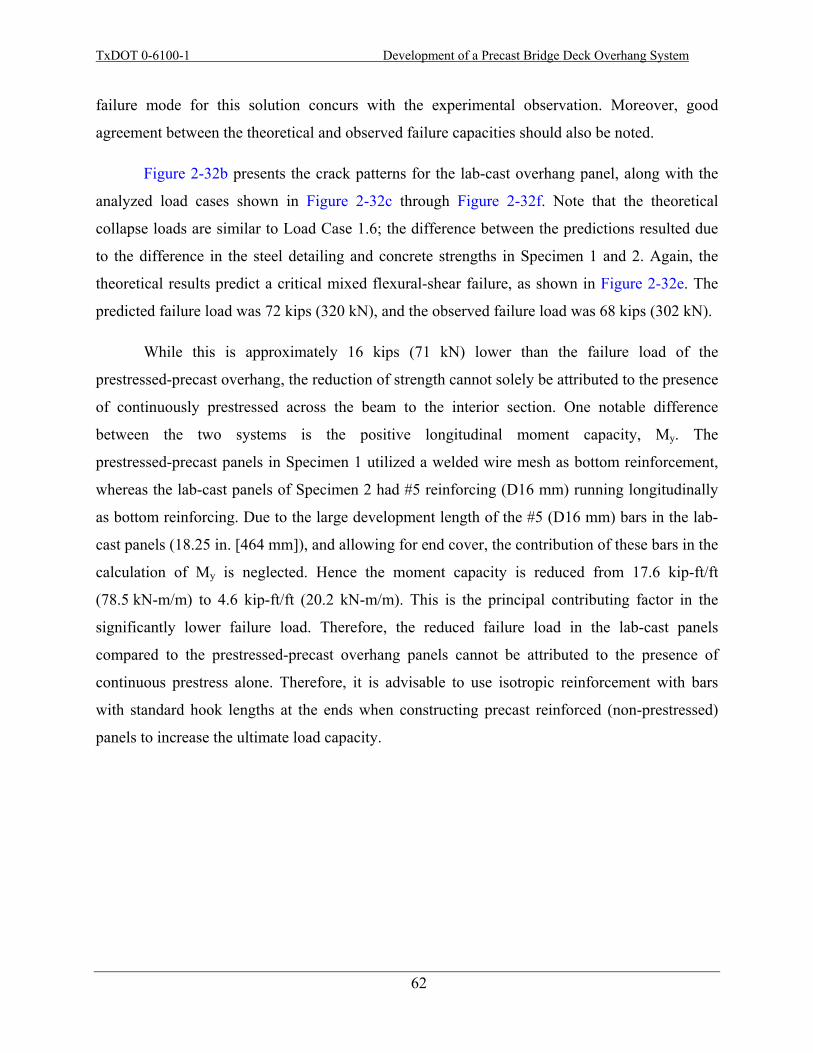
TxDOT 0-6100-1 Development of a Precast Bridge Deck Overhang System
62
failure mode for this solution concurs with the experimental observation. Moreover, good
agreement between the theoretical and observed failure capacities should also be noted.
Figure 2-32b presents the crack patterns for the lab-cast overhang panel, along with the
analyzed load cases shown in Figure 2-32c through Figure 2-32f. Note that the theoretical
collapse loads are similar to Load Case 1.6; the difference between the predictions resulted due
to the difference in the steel detailing and concrete strengths in Specimen 1 and 2. Again, the
theoretical results predict a critical mixed flexural-shear failure, as shown in Figure 2-32e. The
predicted failure load was 72 kips (320 kN), and the observed failure load was 68 kips (302 kN).
While this is approximately 16 kips (71 kN) lower than the failure load of the
prestressed-precast overhang, the reduction of strength cannot solely be attributed to the presence
of continuously prestressed across the beam to the interior section. One notable difference
between the two systems is the positive longitudinal moment capacity, My. The
prestressed-precast panels in Specimen 1 utilized a welded wire mesh as bottom reinforcement,
whereas the lab-cast panels of Specimen 2 had #5 reinforcing (D16 mm) running longitudinally
as bottom reinforcing. Due to the large development length of the #5 (D16 mm) bars in the lab-
cast panels (18.25 in. [464 mm]), and allowing for end cover, the contribution of these bars in the
calculation of My is neglected. Hence the moment capacity is reduced from 17.6 kip-ft/ft
(78.5 kN-m/m) to 4.6 kip-ft/ft (20.2 kN-m/m). This is the principal contributing factor in the
significantly lower failure load. Therefore, the reduced failure load in the lab-cast panels
compared to the prestressed-precast overhang panels cannot be attributed to the presence of
continuous prestress alone. Therefore, it is advisable to use isotropic reinforcement with bars
with standard hook lengths at the ends when constructing precast reinforced (non-prestressed)
panels to increase the ultimate load capacity.
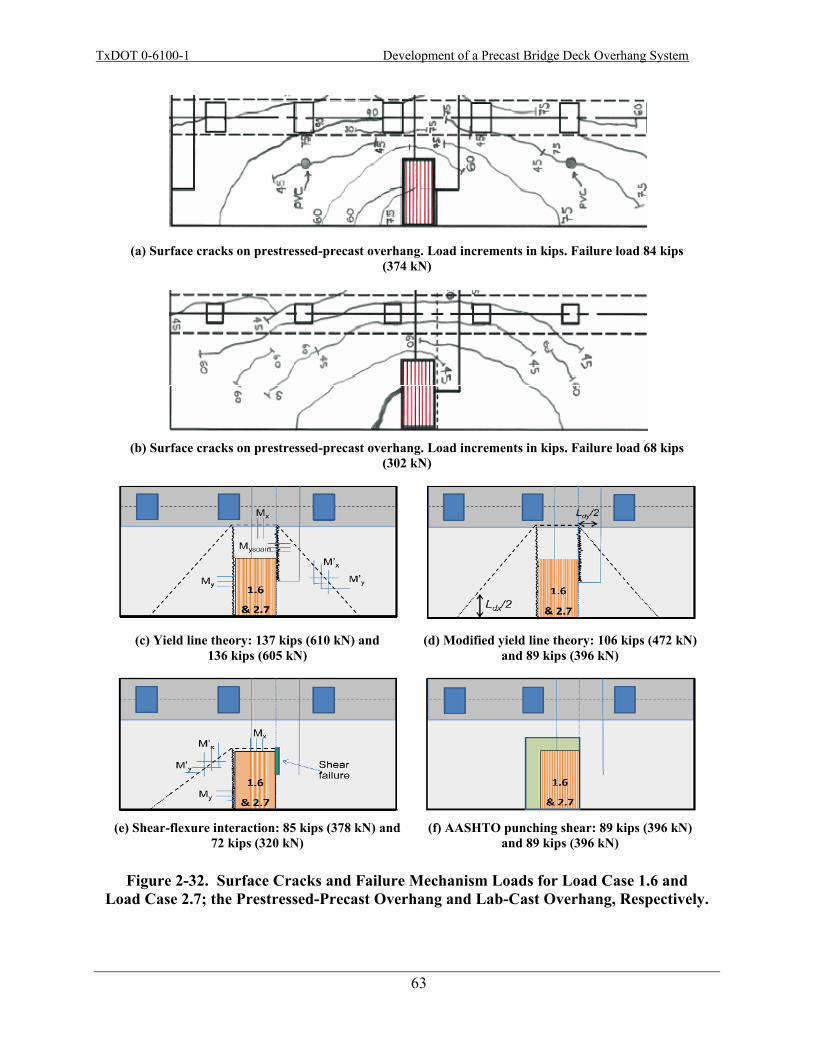
TxDOT 0-6100-1 Development of a Precast Bridge Deck Overhang System
63
(a) Surface cracks on prestressed-precast overhang. Load increments in kips. Failure load 84 kips
(374 kN)
(b) Surface cracks on prestressed-precast overhang. Load increments in kips. Failure load 68 kips
(302 kN)
(c) Yield line theory: 137 kips (610 kN) and
136 kips (605 kN) (d) Modified yield line theory: 106 kips (472 kN)
and 89 kips (396 kN)
(e) Shear-flexure interaction: 85 kips (378 kN) and
72 kips (320 kN) (f) AASHTO punching shear: 89 kips (396 kN)
and 89 kips (396 kN)
Figure 2-32. Surface Cracks and Failure Mechanism Loads for Load Case 1.6 and Load Case 2.7; the Prestressed-Precast Overhang and Lab-Cast Overhang, Respectively.
TxDOT 0-6100-1 Development of a Precast Bridge Deck Overhang System
64
2.2.11.3 Load Case 2.3 Figure 2-33 presents the results for Load Case 2.3. This case was for the trailing wheel loads for
the precast overhang in Specimen 2 and is similar to Load Case 1.6 in Specimen 1, except that it
was only for a single wheel load. The observed surface crack patterns are shown in Figure 2-33a,
while Figure 2-33b through Figure 2-33d present the analyzed failure mechanisms. In contrast to
Load Case 1.6, where the prestressed-precast panel was loaded at the seam, the trailing wheel
load caused failure cracks to propagate to the adjacent panel. This suggests that a flexural failure
mode, under which moments were redistributed from the loaded panel to the adjacent panel,
occurred. Further support for a flexural mechanism is based on Figure 2-25b, where curvatures
exceed the yield curvature at the seam and also on the adjacent panel. The modified yield line
theory allowing for the partially bonded bars is the critical (lowest) case with a predicted failure
load of 76 kips (338 kN) in comparison to the experimentally observed failure load of 81 kips
(360 kN).
(a) Surface cracks observed on prestressed-precast overhang. Failure load 81 kips (360 kN)
(b) Yield line theory for prestressed-precast overhang: 80 kips (356 kN)
(c) Yield line theory accounting for partially bonded
bars: 76 kips (338 kN) (d) Shear-flexure interaction failure:
481 kips (108 kN)
Figure 2-33. Load Case 2.3; Credible Failure Modes for Prestressed-Precast Overhang with Trailing Wheel Load.
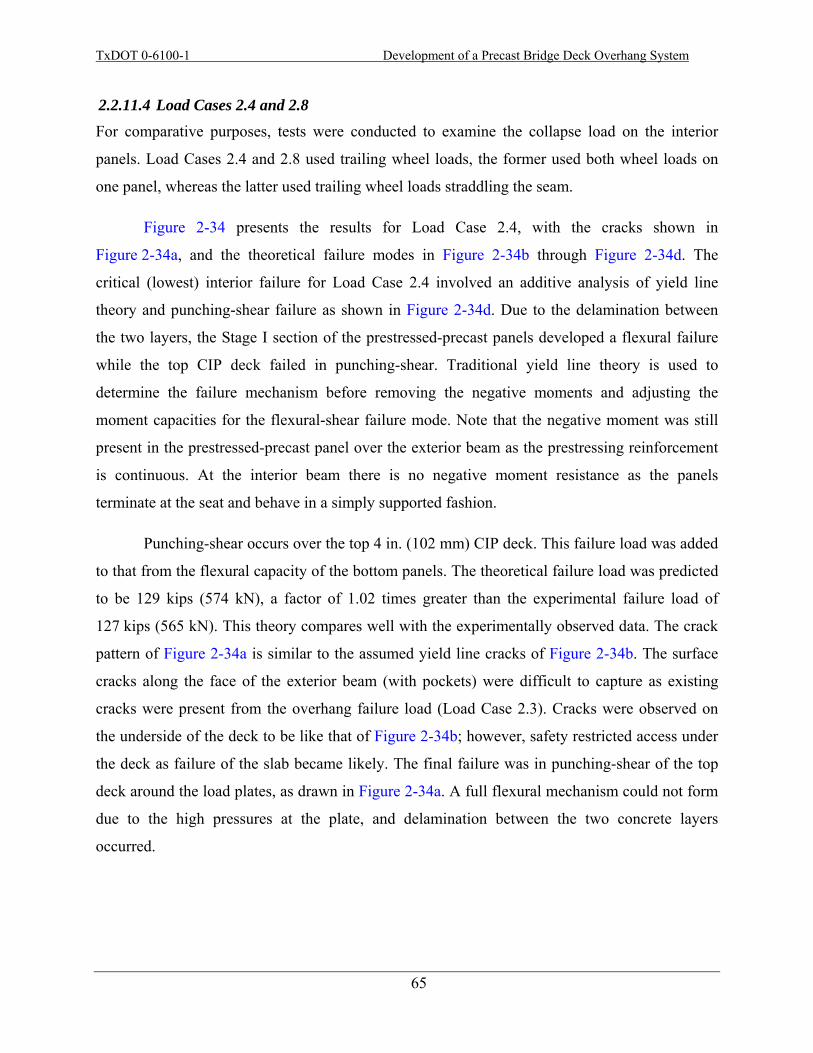
TxDOT 0-6100-1 Development of a Precast Bridge Deck Overhang System
65
2.2.11.4 Load Cases 2.4 and 2.8 For comparative purposes, tests were conducted to examine the collapse load on the interior
panels. Load Cases 2.4 and 2.8 used trailing wheel loads, the former used both wheel loads on
one panel, whereas the latter used trailing wheel loads straddling the seam.
Figure 2-34 presents the results for Load Case 2.4, with the cracks shown in
Figure 2-34a, and the theoretical failure modes in Figure 2-34b through Figure 2-34d. The
critical (lowest) interior failure for Load Case 2.4 involved an additive analysis of yield line
theory and punching-shear failure as shown in Figure 2-34d. Due to the delamination between
the two layers, the Stage I section of the prestressed-precast panels developed a flexural failure
while the top CIP deck failed in punching-shear. Traditional yield line theory is used to
determine the failure mechanism before removing the negative moments and adjusting the
moment capacities for the flexural-shear failure mode. Note that the negative moment was still
present in the prestressed-precast panel over the exterior beam as the prestressing reinforcement
is continuous. At the interior beam there is no negative moment resistance as the panels
terminate at the seat and behave in a simply supported fashion.
Punching-shear occurs over the top 4 in. (102 mm) CIP deck. This failure load was added
to that from the flexural capacity of the bottom panels. The theoretical failure load was predicted
to be 129 kips (574 kN), a factor of 1.02 times greater than the experimental failure load of
127 kips (565 kN). This theory compares well with the experimentally observed data. The crack
pattern of Figure 2-34a is similar to the assumed yield line cracks of Figure 2-34b. The surface
cracks along the face of the exterior beam (with pockets) were difficult to capture as existing
cracks were present from the overhang failure load (Load Case 2.3). Cracks were observed on
the underside of the deck to be like that of Figure 2-34b; however, safety restricted access under
the deck as failure of the slab became likely. The final failure was in punching-shear of the top
deck around the load plates, as drawn in Figure 2-34a. A full flexural mechanism could not form
due to the high pressures at the plate, and delamination between the two concrete layers
occurred.
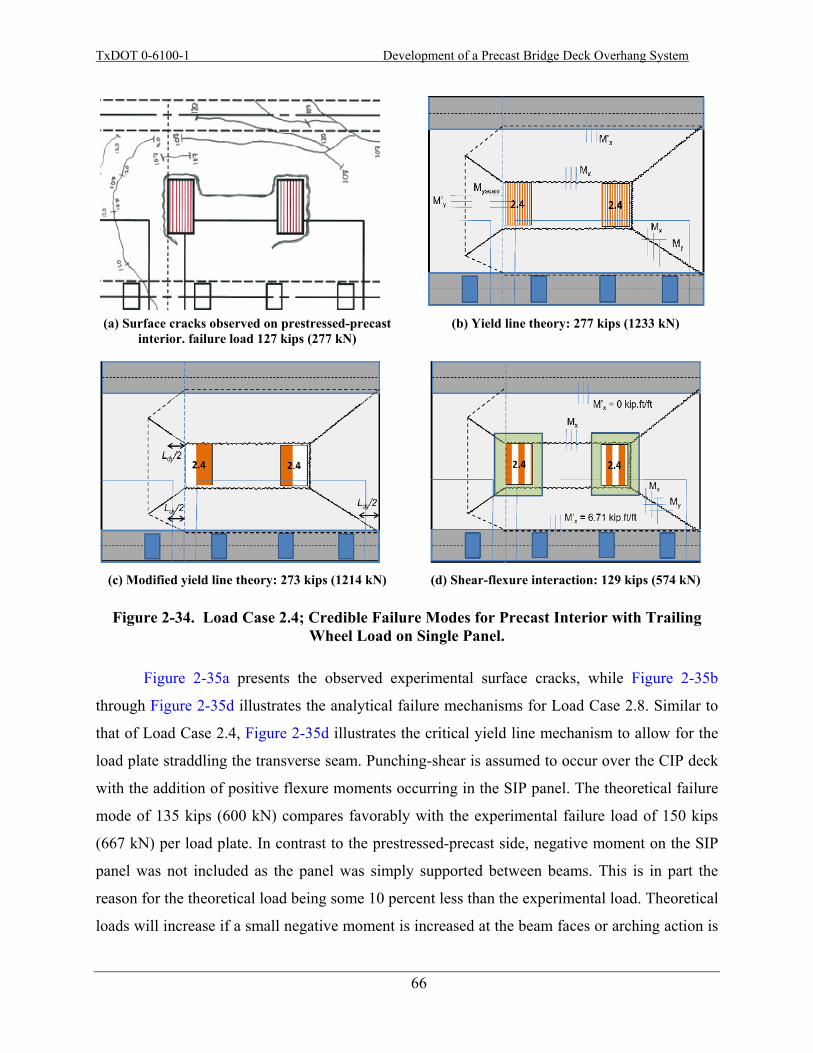
TxDOT 0-6100-1 Development of a Precast Bridge Deck Overhang System
66
(a) Surface cracks observed on prestressed-precast
interior. failure load 127 kips (277 kN)
(b) Yield line theory: 277 kips (1233 kN)
(c) Modified yield line theory: 273 kips (1214 kN) (d) Shear-flexure interaction: 129 kips (574 kN)
Figure 2-34. Load Case 2.4; Credible Failure Modes for Precast Interior with Trailing Wheel Load on Single Panel.
Figure 2-35a presents the observed experimental surface cracks, while Figure 2-35b
through Figure 2-35d illustrates the analytical failure mechanisms for Load Case 2.8. Similar to
that of Load Case 2.4, Figure 2-35d illustrates the critical yield line mechanism to allow for the
load plate straddling the transverse seam. Punching-shear is assumed to occur over the CIP deck
with the addition of positive flexure moments occurring in the SIP panel. The theoretical failure
mode of 135 kips (600 kN) compares favorably with the experimental failure load of 150 kips
(667 kN) per load plate. In contrast to the prestressed-precast side, negative moment on the SIP
panel was not included as the panel was simply supported between beams. This is in part the
reason for the theoretical load being some 10 percent less than the experimental load. Theoretical
loads will increase if a small negative moment is increased at the beam faces or arching action is
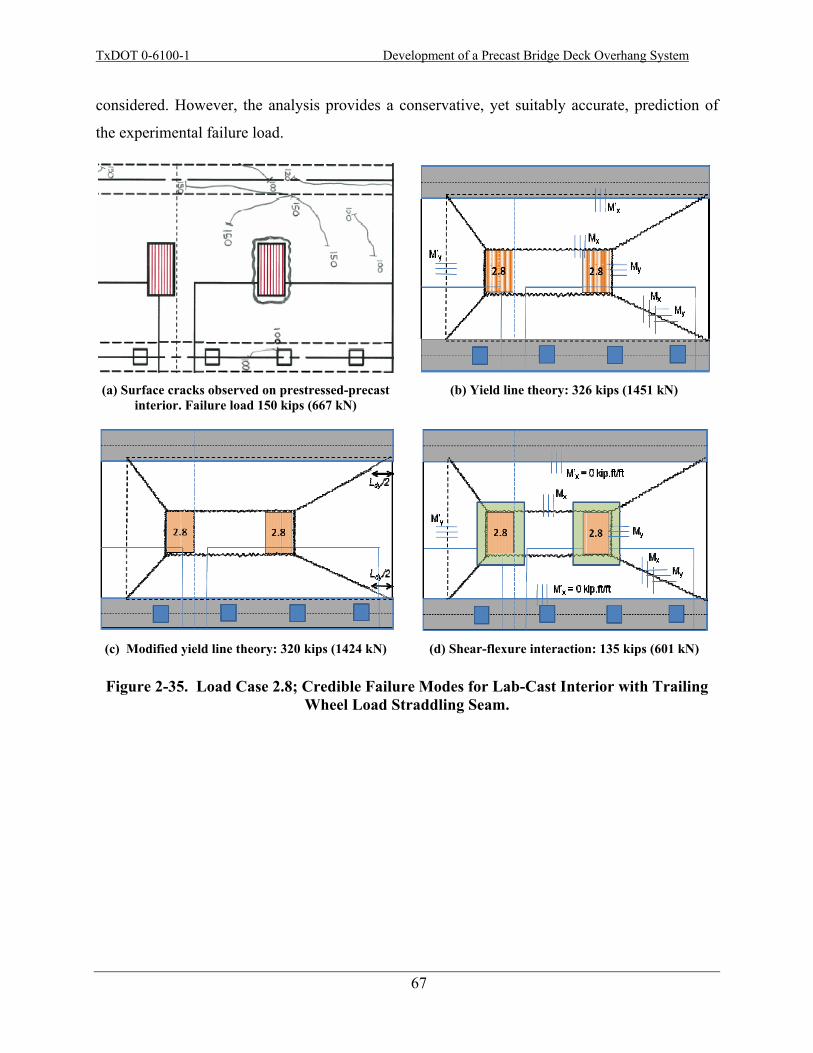
TxDOT 0-6100-1 Development of a Precast Bridge Deck Overhang System
67
considered. However, the analysis provides a conservative, yet suitably accurate, prediction of
the experimental failure load.
(a) Surface cracks observed on prestressed-precast
interior. Failure load 150 kips (667 kN)
(b) Yield line theory: 326 kips (1451 kN)
(c) Modified yield line theory: 320 kips (1424 kN) (d) Shear-flexure interaction: 135 kips (601 kN)
Figure 2-35. Load Case 2.8; Credible Failure Modes for Lab-Cast Interior with Trailing Wheel Load Straddling Seam.
TxDOT 0-6100-1 Development of a Precast Bridge Deck Overhang System
68
2.2.12 Conclusions from Double-Panel Testing
Based on the evaluation of the experimental results the following conclusions can be drawn:
• Longitudinal displacement profiles were plotted to show the relative displacement between panels when loading on the edge of the seam between precast panels. This provides a useful indication on the performance of the seam and whether it adequately transfers the load to the adjacent panel. Although the relative displacements measured approximately 0.2 in. (5.1 mm) at loads of approximately 80 kips (356 kN) for a trailing wheel load on the overhang, the relative displacement between panels at a load of 45 kips (200 kN) was only 0.05 in. (1.3 mm). Hence the seam provides sufficient strength transfer under normal loads. Full flexural failure in both the loaded and adjacent panel would need to develop to increase the failure load capacity. This would require an increased shear capacity of the seam, which can be achieved by increasing the depth of the seam to say 6 in. (152 mm) or by providing a roughened surface or shear key.
• Finite difference solutions were developed to predict the critical curvatures based on measured displacements. Due to a relatively sparse number of displacement transducers in Specimen 1 this was only moderately successful. It is recommended for future experiments of a similar nature that displacement transducers are spaced evenly at less than one panel thickness (8 in. [203 mm]) apart.
• Traditional yield line theory did not agree particularly well with the experimental observations. If flexural theory does not agree well, there is a tendency for one to assume shear failure is critical. However, the AASHTO LRFD punching-shear theory gave poor predictions. Traditional yield line theory was adapted in this work to account for the gradual development of stress over the anchorage length of the bars. This leads to a straightforward modification of the internal work done equations. A more reasonable estimate for the collapse load was obtained when the modified equations of internal work done were used to include the effect of stress development.
• Experimental observations indicated a mixed flexure-shear failure for exterior overhang panels loaded on the seam edge between adjacent panels. Flexural failure using the modified yield line theory occurred on the loaded panel, while a shear failure of the seam prevented the formation of plastic hinges on the adjacent panel. This gave predictions of the theoretical failure mode with an accuracy ranging from 0.94 to 1.01 of the experimental load/closest theoretical value.
• A mixed failure was also observed at the interior panels. This cannot be adequately predicted by either shear or flexural theories alone but rather
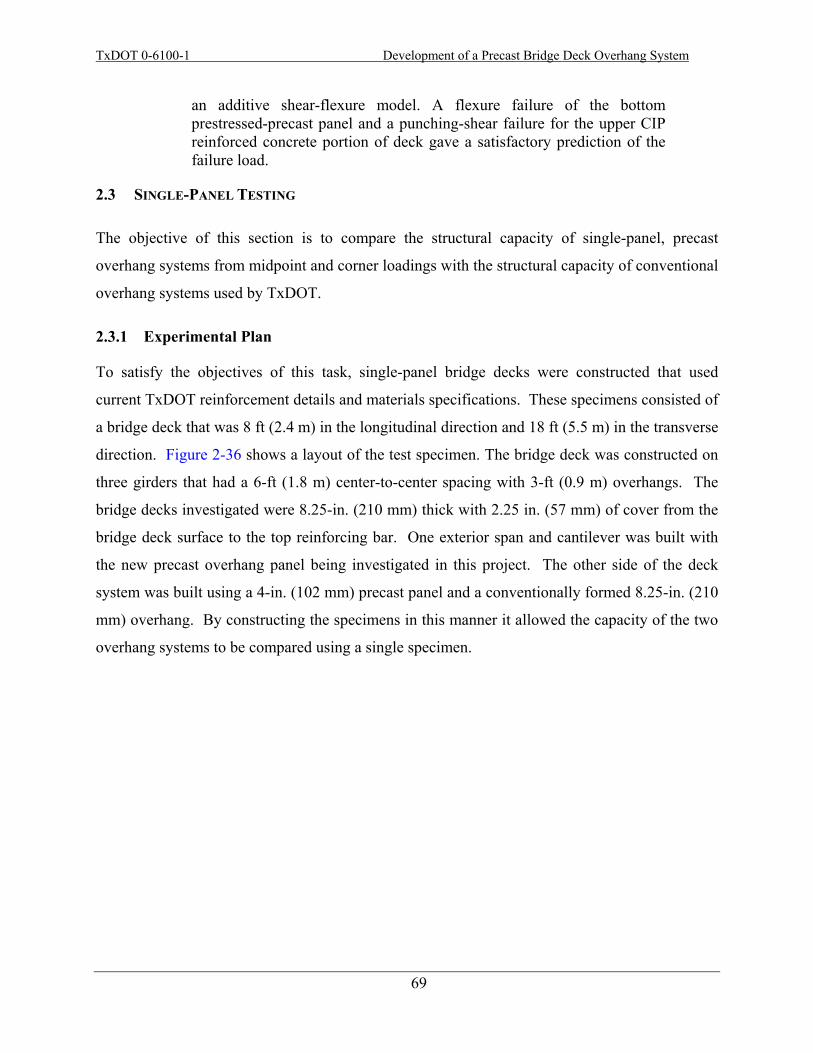
TxDOT 0-6100-1 Development of a Precast Bridge Deck Overhang System
69
an additive shear-flexure model. A flexure failure of the bottom prestressed-precast panel and a punching-shear failure for the upper CIP reinforced concrete portion of deck gave a satisfactory prediction of the failure load.
2.3 SINGLE-PANEL TESTING
The objective of this section is to compare the structural capacity of single-panel, precast
overhang systems from midpoint and corner loadings with the structural capacity of conventional
overhang systems used by TxDOT.
2.3.1 Experimental Plan
To satisfy the objectives of this task, single-panel bridge decks were constructed that used
current TxDOT reinforcement details and materials specifications. These specimens consisted of
a bridge deck that was 8 ft (2.4 m) in the longitudinal direction and 18 ft (5.5 m) in the transverse
direction. Figure 2-36 shows a layout of the test specimen. The bridge deck was constructed on
three girders that had a 6-ft (1.8 m) center-to-center spacing with 3-ft (0.9 m) overhangs. The
bridge decks investigated were 8.25-in. (210 mm) thick with 2.25 in. (57 mm) of cover from the
bridge deck surface to the top reinforcing bar. One exterior span and cantilever was built with
the new precast overhang panel being investigated in this project. The other side of the deck
system was built using a 4-in. (102 mm) precast panel and a conventionally formed 8.25-in. (210
mm) overhang. By constructing the specimens in this manner it allowed the capacity of the two
overhang systems to be compared using a single specimen.
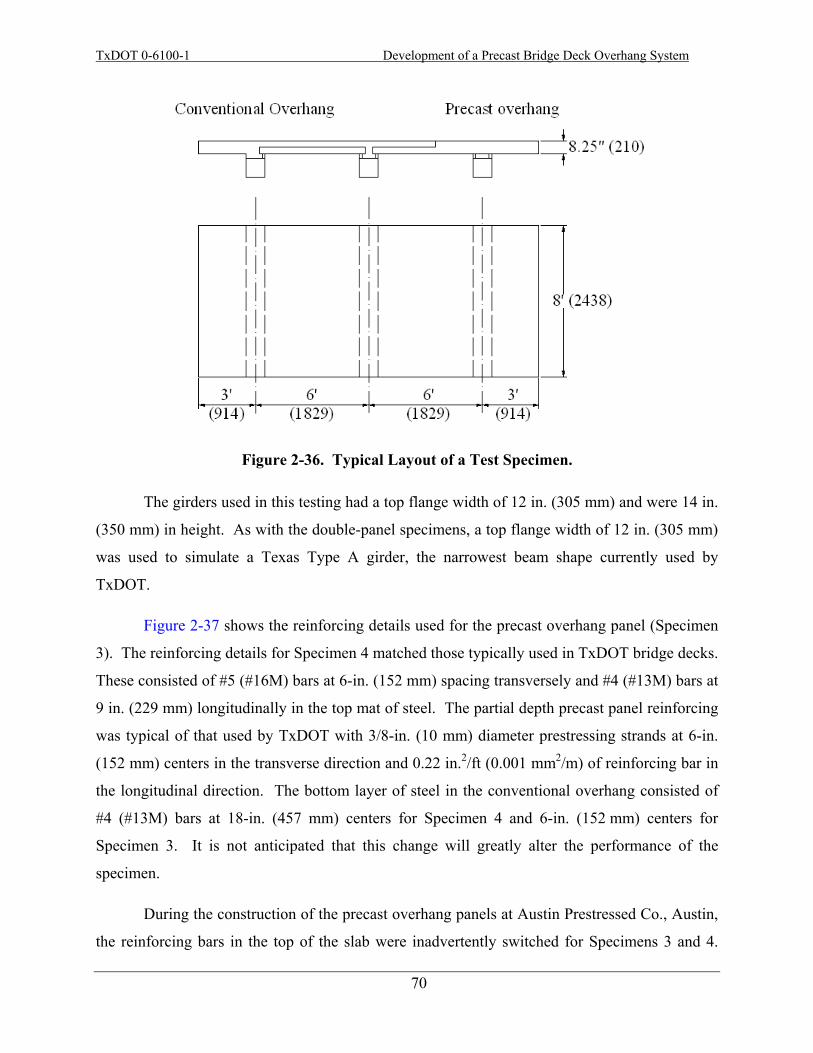
TxDOT 0-6100-1 Development of a Precast Bridge Deck Overhang System
70
Figure 2-36. Typical Layout of a Test Specimen.
The girders used in this testing had a top flange width of 12 in. (305 mm) and were 14 in.
(350 mm) in height. As with the double-panel specimens, a top flange width of 12 in. (305 mm)
was used to simulate a Texas Type A girder, the narrowest beam shape currently used by
TxDOT.
Figure 2-37 shows the reinforcing details used for the precast overhang panel (Specimen
3). The reinforcing details for Specimen 4 matched those typically used in TxDOT bridge decks.
These consisted of #5 (#16M) bars at 6-in. (152 mm) spacing transversely and #4 (#13M) bars at
9 in. (229 mm) longitudinally in the top mat of steel. The partial depth precast panel reinforcing
was typical of that used by TxDOT with 3/8-in. (10 mm) diameter prestressing strands at 6-in.
(152 mm) centers in the transverse direction and 0.22 in.2/ft (0.001 mm2/m) of reinforcing bar in
the longitudinal direction. The bottom layer of steel in the conventional overhang consisted of
#4 (#13M) bars at 18-in. (457 mm) centers for Specimen 4 and 6-in. (152 mm) centers for
Specimen 3. It is not anticipated that this change will greatly alter the performance of the
specimen.
During the construction of the precast overhang panels at Austin Prestressed Co., Austin,
the reinforcing bars in the top of the slab were inadvertently switched for Specimens 3 and 4.
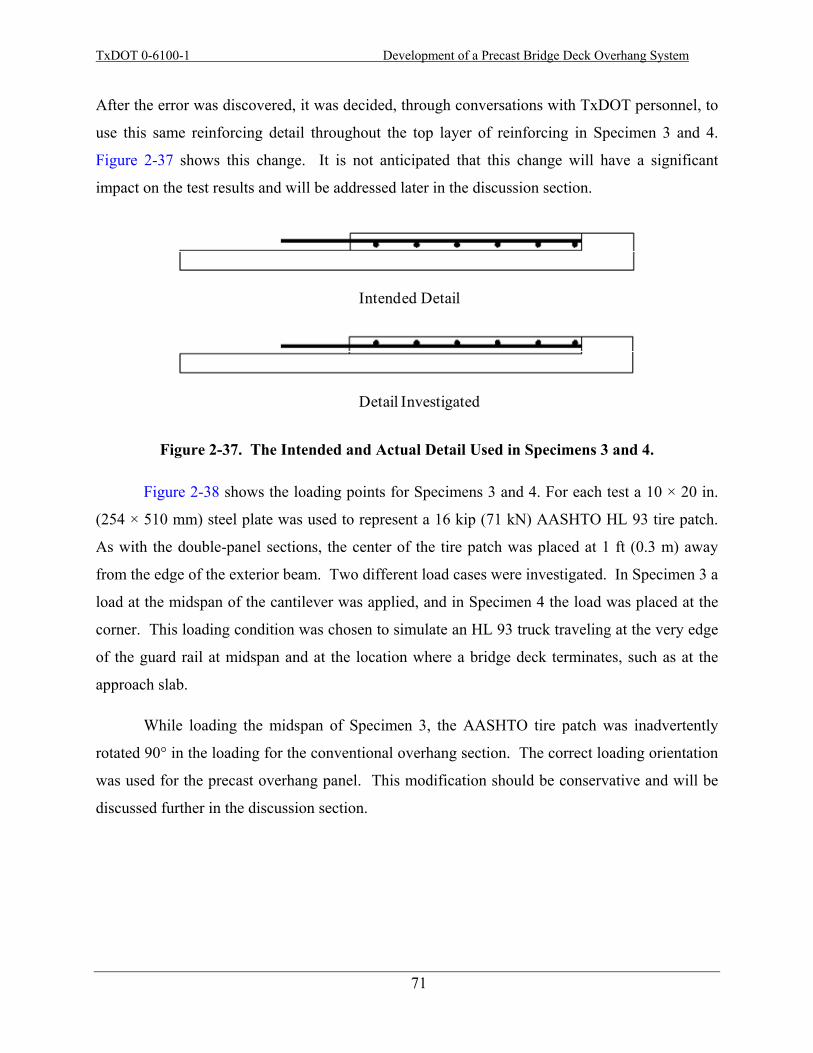
TxDOT 0-6100-1 Development of a Precast Bridge Deck Overhang System
71
After the error was discovered, it was decided, through conversations with TxDOT personnel, to
use this same reinforcing detail throughout the top layer of reinforcing in Specimen 3 and 4.
Figure 2-37 shows this change. It is not anticipated that this change will have a significant
impact on the test results and will be addressed later in the discussion section.
Figure 2-37. The Intended and Actual Detail Used in Specimens 3 and 4.
Figure 2-38 shows the loading points for Specimens 3 and 4. For each test a 10 × 20 in.
(254 × 510 mm) steel plate was used to represent a 16 kip (71 kN) AASHTO HL 93 tire patch.
As with the double-panel sections, the center of the tire patch was placed at 1 ft (0.3 m) away
from the edge of the exterior beam. Two different load cases were investigated. In Specimen 3 a
load at the midspan of the cantilever was applied, and in Specimen 4 the load was placed at the
corner. This loading condition was chosen to simulate an HL 93 truck traveling at the very edge
of the guard rail at midspan and at the location where a bridge deck terminates, such as at the
approach slab.
While loading the midspan of Specimen 3, the AASHTO tire patch was inadvertently
rotated 90° in the loading for the conventional overhang section. The correct loading orientation
was used for the precast overhang panel. This modification should be conservative and will be
discussed further in the discussion section.
Intended Detail
Detail Investigated
TxDOT 0-6100-1 Development of a Precast Bridge Deck Overhang System
72
Figure 2-38. The Load Points Investigated for Specimens 3 and 4.
The structural response of the specimens was evaluated with surface demec strain
readings with 4.4-microstrain accuracy and by deflection measurements using MituyoTM
electronic dial gages (0.0005 in. [0.01 mm]) accuracy. These systems provided flexible and
accurate methods to investigate the performance of the overhang systems.
2.3.2 Materials
Table 2-8 provides a summary of the concrete and grout mixtures, along with the relevant
material properties. All mixtures met the requirements for TxDOT 421 Class S concrete. The
grout used in the haunch did not contain coarse aggregate and so did not meet the TxDOT
gradation requirements. Figure 2-39 shows the location where each mixture was used in the
specimen. The reinforcing steel used in Specimens 3 and 4 was reported to meet the
specification in “Item 440 - Reinforcing Steel” in TxDOT Standard Specifications for
Construction and Maintenance of Highways, Streets, and Bridges TxDOT (2004) and ASTM
A 615 grade 60 requirements. Actual values will be determined with testing for the final report.
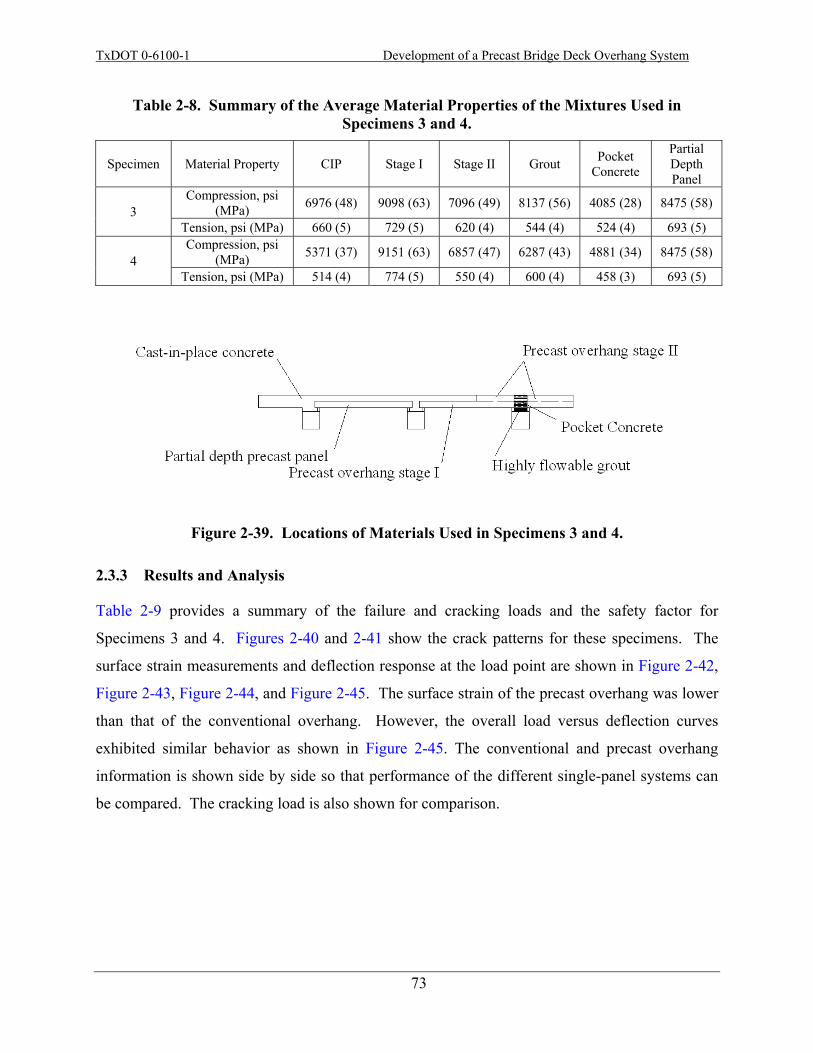
TxDOT 0-6100-1 Development of a Precast Bridge Deck Overhang System
73
Table 2-8. Summary of the Average Material Properties of the Mixtures Used in Specimens 3 and 4.
Specimen Material Property CIP Stage I Stage II Grout Pocket Concrete
Partial Depth Panel
3 Compression, psi
(MPa) 6976 (48) 9098 (63) 7096 (49) 8137 (56) 4085 (28) 8475 (58)
Tension, psi (MPa) 660 (5) 729 (5) 620 (4) 544 (4) 524 (4) 693 (5)
4 Compression, psi
(MPa) 5371 (37) 9151 (63) 6857 (47) 6287 (43) 4881 (34) 8475 (58)
Tension, psi (MPa) 514 (4) 774 (5) 550 (4) 600 (4) 458 (3) 693 (5)
Figure 2-39. Locations of Materials Used in Specimens 3 and 4.
2.3.3 Results and Analysis
Table 2-9 provides a summary of the failure and cracking loads and the safety factor for
Specimens 3 and 4. Figures 2-40 and 2-41 show the crack patterns for these specimens. The
surface strain measurements and deflection response at the load point are shown in Figure 2-42,
Figure 2-43, Figure 2-44, and Figure 2-45. The surface strain of the precast overhang was lower
than that of the conventional overhang. However, the overall load versus deflection curves
exhibited similar behavior as shown in Figure 2-45. The conventional and precast overhang
information is shown side by side so that performance of the different single-panel systems can
be compared. The cracking load is also shown for comparison.
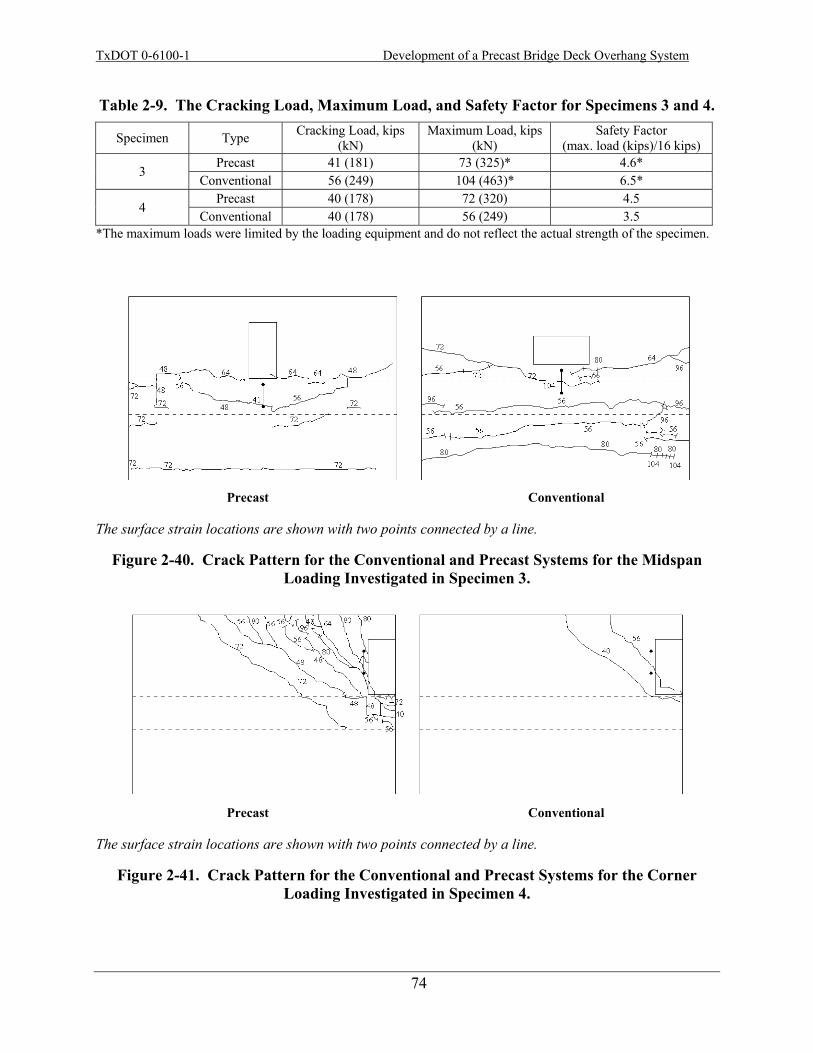
TxDOT 0-6100-1 Development of a Precast Bridge Deck Overhang System
74
Table 2-9. The Cracking Load, Maximum Load, and Safety Factor for Specimens 3 and 4.
Specimen Type Cracking Load, kips (kN)
Maximum Load, kips (kN)
Safety Factor (max. load (kips)/16 kips)
3 Precast 41 (181) 73 (325)* 4.6*
Conventional 56 (249) 104 (463)* 6.5*
4 Precast 40 (178) 72 (320) 4.5
Conventional 40 (178) 56 (249) 3.5 *The maximum loads were limited by the loading equipment and do not reflect the actual strength of the specimen.
Precast
Conventional
The surface strain locations are shown with two points connected by a line.
Figure 2-40. Crack Pattern for the Conventional and Precast Systems for the Midspan Loading Investigated in Specimen 3.
Precast
Conventional
The surface strain locations are shown with two points connected by a line.
Figure 2-41. Crack Pattern for the Conventional and Precast Systems for the Corner Loading Investigated in Specimen 4.
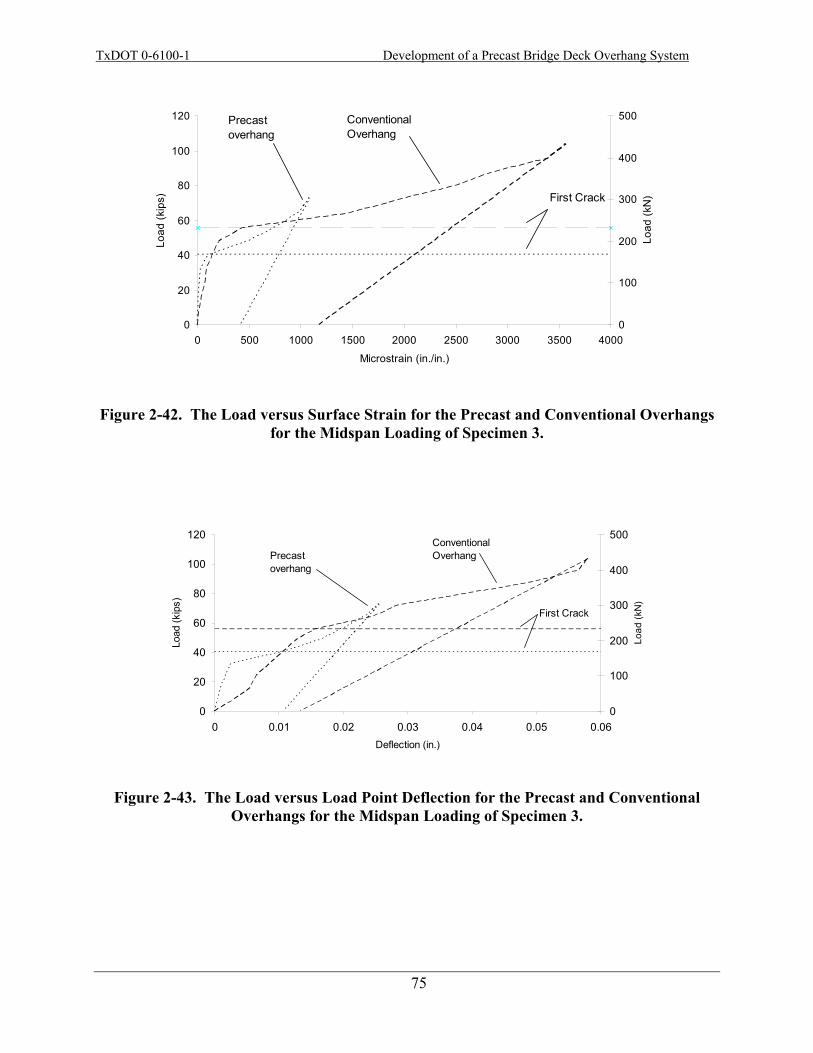
TxDOT 0-6100-1 Development of a Precast Bridge Deck Overhang System
75
Figure 2-42. The Load versus Surface Strain for the Precast and Conventional Overhangs for the Midspan Loading of Specimen 3.
Figure 2-43. The Load versus Load Point Deflection for the Precast and Conventional Overhangs for the Midspan Loading of Specimen 3.
0
20
40
60
80
100
120
0 500 1000 1500 2000 2500 3000 3500 4000
Microstrain (in./in.)
Load
(kip
s)
0
100
200
300
400
500
Load
(kN
)
ConventionalOverhang
Precast overhang
First Crack
0
20
40
60
80
100
120
0 0.01 0.02 0.03 0.04 0.05 0.06Deflection (in.)
Load
(kip
s)
0
100
200
300
400
500
Load
(kN
)
Conventional OverhangPrecast
overhang
First Crack
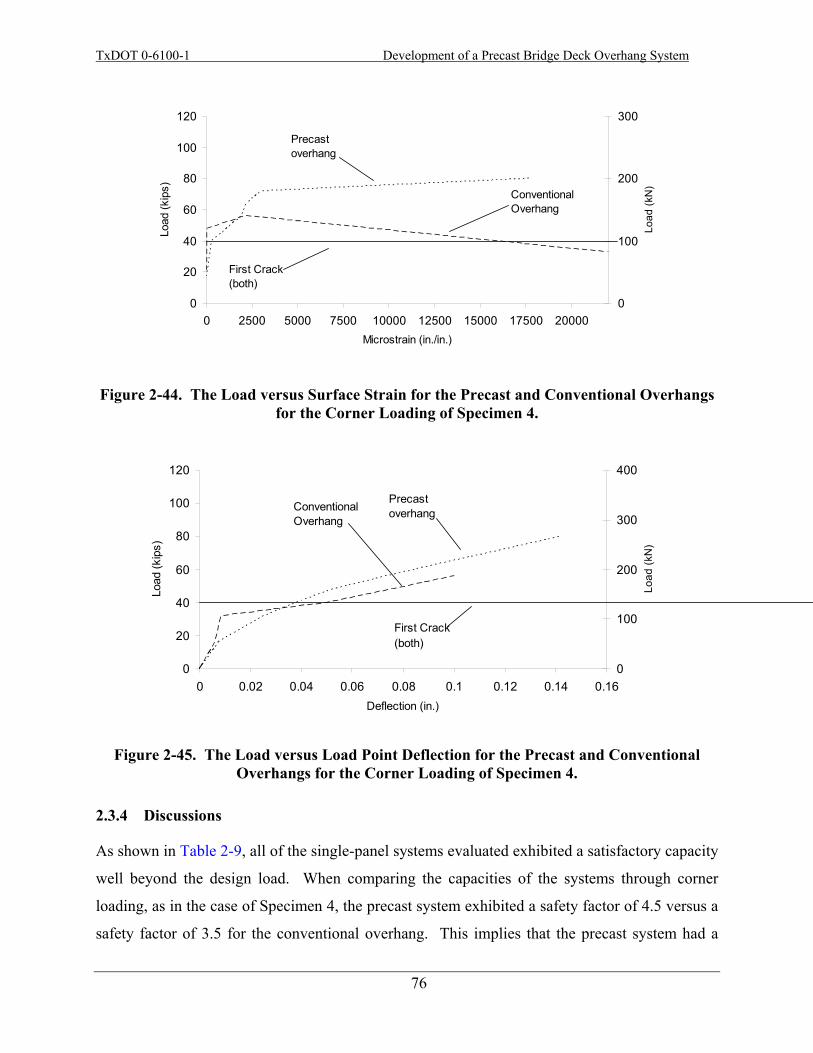
TxDOT 0-6100-1 Development of a Precast Bridge Deck Overhang System
76
Figure 2-44. The Load versus Surface Strain for the Precast and Conventional Overhangs for the Corner Loading of Specimen 4.
Figure 2-45. The Load versus Load Point Deflection for the Precast and Conventional Overhangs for the Corner Loading of Specimen 4.
2.3.4 Discussions
As shown in Table 2-9, all of the single-panel systems evaluated exhibited a satisfactory capacity
well beyond the design load. When comparing the capacities of the systems through corner
loading, as in the case of Specimen 4, the precast system exhibited a safety factor of 4.5 versus a
safety factor of 3.5 for the conventional overhang. This implies that the precast system had a
0
20
40
60
80
100
120
0 2500 5000 7500 10000 12500 15000 17500 20000Microstrain (in./in.)
Load
(kip
s)
0
100
200
300
Load
(kN
)
ConventionalOverhang
Precastoverhang
First Crack(both)
0
20
40
60
80
100
120
0 0.02 0.04 0.06 0.08 0.1 0.12 0.14 0.16Deflection (in.)
Load
(kip
s)
0
100
200
300
400
Load
(kN
)
PrecastoverhangConventional
Overhang
First Crack(both)

TxDOT 0-6100-1 Development of a Precast Bridge Deck Overhang System
77
measurable increase in its capacity over the conventional overhang. In Figure 2-42, Figure 2-43,
Figure 2-44, and Figure 2-45, both overhang systems exhibit the ability to strain significantly
after the initial cracking of the system. This is a performance that is consistent with the ductile
behavior of structures.
Three inadvertent details were introduced into the testing: (1) including rotation of the
conventional overhang load point by 90° for Specimen 3, (2) increased amount of compression
steel in the conventional overhang in Specimen 3, and (3) the modification of the top layer of
reinforcing. In all three cases, these modifications are thought to have minimal impact on the
measured performance of the final structure. These will be discussed next. While the load point
was rotated by 90°, the centroid of the load point did not change, so the equivalent moment and
results between the conventional and precast overhang should be comparable.
While casting Specimen 4, it was realized that excessive compression steel was used in
the conventional overhang tested in Specimen 3. This additional steel would definitely have had
an impact on the capacity if it was on the tension face of the specimen. However, this additional
steel had little impact on the performance of the system because it is in the compression face.
The addition of compression steel caused very little increase in the capacity of a reinforced
concrete member.
Upon delivery of the precast overhang panels from Austin Prestressed Co., Austin, Texas,
it was realized that the longitudinal and transverse reinforcing in stage II had been switched.
This change in the reinforcing layout should have a reduction in the capacity of the system by
approximately 10 percent. This is caused because the effective depth of the main reinforcing
bars (transverse #5 [#16M] bars at 6-in. [152 mm] spacings) would have been reduced because
they were placed under the longitudinal reinforcing.
2.3.5 Summary of Single-Panel Tests
The single-panel precast overhang system investigated was found to provide comparable
strength, stiffness, and ductility when compared with the conventional overhang system.
Furthermore, the precast overhang system had a sufficient safety factor of 4.5 above the design
load of 16 kips (71 kN) in the corner loading of Specimen 4. A safety factor above 4.6 was
found for the midspan loading investigated in Specimen 3. During the testing of both specimens,

TxDOT 0-6100-1 Development of a Precast Bridge Deck Overhang System
78
there were no signs of cracking in the precast overhang system until a load of 40 kips (178 kN),
which is 2.5 times the design load. While fatigue testing was not completed on this project, the
large factor of safety encountered indicates that the service level stresses are expected to be low,
indicating satisfactory fatigue performance for the system in service. The conventional
overhangs were also found to provide satisfactory strength and cracking performance in this
testing.
2.4 SUMMARY FOR OVERHANG PANEL TEST
Testing performed in this research program of both single-panel and double-panel overhang
specimens indicate that the prestressed overhang panels provide reasonably similar performance
to conventional CIP overhang systems. Testing indicated that the capacity of the precast
overhang system is sufficient to resist significant cracking for AASHTO factored loads and can
provide reasonably high factors of safety.
TxDOT 0-6100-1 Development of a Precast Bridge Deck Overhang System
79
3 SHEAR CONNECTIONS
3.1 INTRODUCTION AND OBJECTIVES
For typical bridge construction, the composite action between the deck and girder occurs through
girder reinforcement that is extended beyond the top surface of the beam. This reinforcement
commonly consists of inverted U-shaped bars, referred to in TxDOT drawings as R-bars.
Continuity is established from a second stage concrete pour, thereby linking a second layer of
continuous reinforcement to the existing reinforcement located between the panels at the deck-
girder interface. Due to the inherent nature of having a precast overhang, options are needed to
achieve precast deck panel to concrete girder composite action through the use of shear pockets
within the panels. However, AASTHO LRFD (2007) does not address this design consideration
for interface shear transfer (shear friction) in full-depth panels. More specifically, AASHTO
LRFD C5.8.4.1 states, “composite section design utilizing full-depth precast deck panels is not
addressed by these provisions. Design specifications for such systems should be established by,
or coordinated with, the Owner.” Therefore, the connection detail of these shear pockets needs
to be examined in terms of both force-deformation performance and constructability, and
compared to conventional construction to ensure that the new precast system is not inferior to
existing systems.
To evaluate the performance and constructability of the shear connection detail, an
investigation was conducted that included push-off (interface shear) tests of specimens that
mimic options in the proposed design for a bridge replacement project. It should be noted that
the research team designed, constructed, and evaluated 24 test specimens while only 8 were
required in the project. The corresponding objectives and outcomes of the push-off tests
conducted were threefold.
Objective #1: To capture the force-displacement behavior of various connectors and
configurations due to increasing applied lateral load.

TxDOT 0-6100-1 Development of a Precast Bridge Deck Overhang System
80
Outcome #1: The initial breakaway shear strength, post-breakaway resistance in terms of
the implied coefficient of friction, and ultimate displacement limits of various connectors from
the force-displacement curves are quantified and presented.
Objective #2: To compare the performance of these connectors within the deck-haunch-
beam system to assess the proposed standard construction practice of shear connections for
precast bridge deck overhangs.
Outcome #2: Recommendations for the redesign of the pocket requirements for this
system are made so that adequate shear resistance will be provided based on experimental test
results.
Objective #3: To evaluate different alternatives to improve the performance of the
system while considering constructability, cost, and accessibility of materials.
Outcome #3: The effects of different connection types (pre-installed versus post-
installed), 2.0-in. (51 mm) vs. 3.5-in. (89 mm) haunch height, grout mixes, surface roughness,
and grouping of the connectors on the performance of the deck-haunch-beam system response is
determined through parametric studies. This could provide the contractor with options that could
yield similar desired results and system optimization.
3.2 EXPERIMENTAL PLAN
A total of 24 tests, evaluating both pre-installed (precast) and post-installed connectors, were
conducted in two parts to compare the performance of various connection types, the number of
connectors, the effectiveness of the grout, haunch height, and surface roughness. Tests 1 through
13 (described in section 3.3, Testing Matrix) were conducted first, followed by tests 14 through
24. Tests 14 through 24 were designed, fabricated, and evaluated based on the system
performance from the first set of 13 tests. This ultimately yielded 16 pre-installed (precast)
specimens and 8 post-installed specimens.
3.2.1 Pre-Installed (Precast) Shear Connections
A total of 16 pre-installed (precast) shear connection specimens were tested. Twelve of the
specimens were tested for validation of the TxDOT design (two tests for each of the two
TxDOT 0-6100-1 Development of a Precast Bridge Deck Overhang System
81
threaded rod connection options and the CIP control, each having haunch heights of 2.0 and
3.5 in. [51 and 89 mm]). To provide supplementary information, three additional specimens
were tested with a bolt with a coupler connection, and an additional specimen was tested with
two R-bars grouted in a precast pocket. Further information on the design of the 16 pre-installed
(precast) shear specimen connections can be found in section 3.4.2.1.
3.2.2 Post-Installed Shear Connections
Eight additional specimens assembled with post-installed shear connectors were tested to
investigate the effects of the following variables: types of post-installation connections, surface
roughness of the mating concrete faces in the connection, grouping effects, and alternative
grouts. Having post-installed shear connectors that have a comparable performance to
pre-installed shear connectors would provide options for misaligned pockets and connectors in
construction or for deliberate design to reduce the complexity of precast components. To
maximize the variety of systems investigated, no two specimens were identical, thus providing a
broad exploratory look at a myriad of options that are available. Section 3.4.2.2 describes these
eight specimens in greater detail.
3.3 TESTING MATRIX
The nomenclature for the test specimens was based on the number of connectors within a
specimen, connector type, whether the specimen was cast with a 2.0-in. (51 mm) or 3.5-in.
(89 mm) haunch, and test number reference. To assist with sample identification, a summary of
acronyms used are as follows:
• BC – 1-in. (25 mm) diameter bolt (SAE Grade 8) with coupler,
• CIP – specimen’s deck is cast-in-place as a monolithic member (control),
• TR – 1-in. (25 mm) diameter threaded rod (ASTM A193 B7) with high-strength nut,
• KB – mechanical anchor (Kwik-Bolt 3),
• NS – Nelson stud (headed, welded),
• R – R-bars installed in a pocket system,
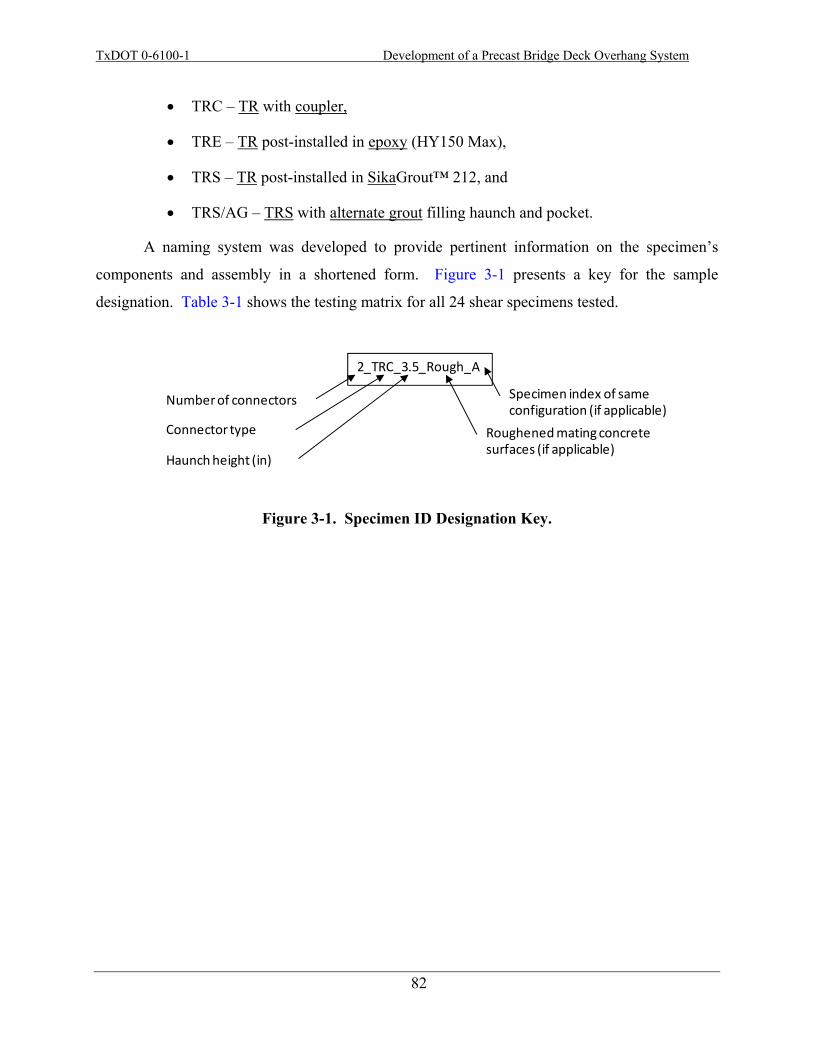
TxDOT 0-6100-1 Development of a Precast Bridge Deck Overhang System
82
• TRC – TR with coupler,
• TRE – TR post-installed in epoxy (HY150 Max),
• TRS – TR post-installed in SikaGrout™ 212, and
• TRS/AG – TRS with alternate grout filling haunch and pocket.
A naming system was developed to provide pertinent information on the specimen’s
components and assembly in a shortened form. Figure 3-1 presents a key for the sample
designation. Table 3-1 shows the testing matrix for all 24 shear specimens tested.
Figure 3-1. Specimen ID Designation Key.
2_TRC_3.5_Rough_A
Number of connectors
Connector type
Haunch height (in)
Roughened mating concrete surfaces (if applicable)
Specimen index of same configuration (if applicable)
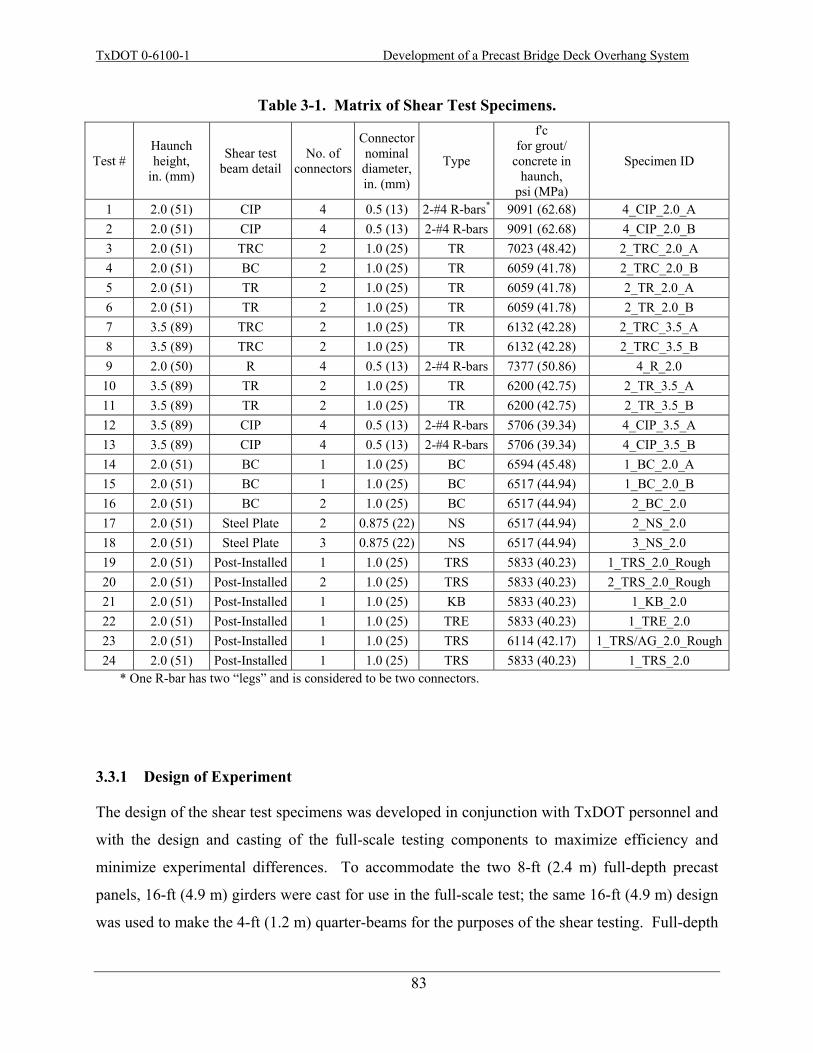
TxDOT 0-6100-1 Development of a Precast Bridge Deck Overhang System
83
Table 3-1. Matrix of Shear Test Specimens.
Test # Haunch height,
in. (mm)
Shear test beam detail
No. of connectors
Connectornominal diameter, in. (mm)
Type
f'c for grout/
concrete in haunch,
psi (MPa)
Specimen ID
1 2.0 (51) CIP 4 0.5 (13) 2-#4 R-bars* 9091 (62.68) 4_CIP_2.0_A 2 2.0 (51) CIP 4 0.5 (13) 2-#4 R-bars 9091 (62.68) 4_CIP_2.0_B 3 2.0 (51) TRC 2 1.0 (25) TR 7023 (48.42) 2_TRC_2.0_A 4 2.0 (51) BC 2 1.0 (25) TR 6059 (41.78) 2_TRC_2.0_B 5 2.0 (51) TR 2 1.0 (25) TR 6059 (41.78) 2_TR_2.0_A 6 2.0 (51) TR 2 1.0 (25) TR 6059 (41.78) 2_TR_2.0_B 7 3.5 (89) TRC 2 1.0 (25) TR 6132 (42.28) 2_TRC_3.5_A 8 3.5 (89) TRC 2 1.0 (25) TR 6132 (42.28) 2_TRC_3.5_B 9 2.0 (50) R 4 0.5 (13) 2-#4 R-bars 7377 (50.86) 4_R_2.0
10 3.5 (89) TR 2 1.0 (25) TR 6200 (42.75) 2_TR_3.5_A 11 3.5 (89) TR 2 1.0 (25) TR 6200 (42.75) 2_TR_3.5_B 12 3.5 (89) CIP 4 0.5 (13) 2-#4 R-bars 5706 (39.34) 4_CIP_3.5_A 13 3.5 (89) CIP 4 0.5 (13) 2-#4 R-bars 5706 (39.34) 4_CIP_3.5_B 14 2.0 (51) BC 1 1.0 (25) BC 6594 (45.48) 1_BC_2.0_A 15 2.0 (51) BC 1 1.0 (25) BC 6517 (44.94) 1_BC_2.0_B 16 2.0 (51) BC 2 1.0 (25) BC 6517 (44.94) 2_BC_2.0 17 2.0 (51) Steel Plate 2 0.875 (22) NS 6517 (44.94) 2_NS_2.0 18 2.0 (51) Steel Plate 3 0.875 (22) NS 6517 (44.94) 3_NS_2.0 19 2.0 (51) Post-Installed 1 1.0 (25) TRS 5833 (40.23) 1_TRS_2.0_Rough 20 2.0 (51) Post-Installed 2 1.0 (25) TRS 5833 (40.23) 2_TRS_2.0_Rough 21 2.0 (51) Post-Installed 1 1.0 (25) KB 5833 (40.23) 1_KB_2.0 22 2.0 (51) Post-Installed 1 1.0 (25) TRE 5833 (40.23) 1_TRE_2.0 23 2.0 (51) Post-Installed 1 1.0 (25) TRS 6114 (42.17) 1_TRS/AG_2.0_Rough24 2.0 (51) Post-Installed 1 1.0 (25) TRS 5833 (40.23) 1_TRS_2.0
* One R-bar has two “legs” and is considered to be two connectors.
3.3.1 Design of Experiment
The design of the shear test specimens was developed in conjunction with TxDOT personnel and
with the design and casting of the full-scale testing components to maximize efficiency and
minimize experimental differences. To accommodate the two 8-ft (2.4 m) full-depth precast
panels, 16-ft (4.9 m) girders were cast for use in the full-scale test; the same 16-ft (4.9 m) design
was used to make the 4-ft (1.2 m) quarter-beams for the purposes of the shear testing. Full-depth
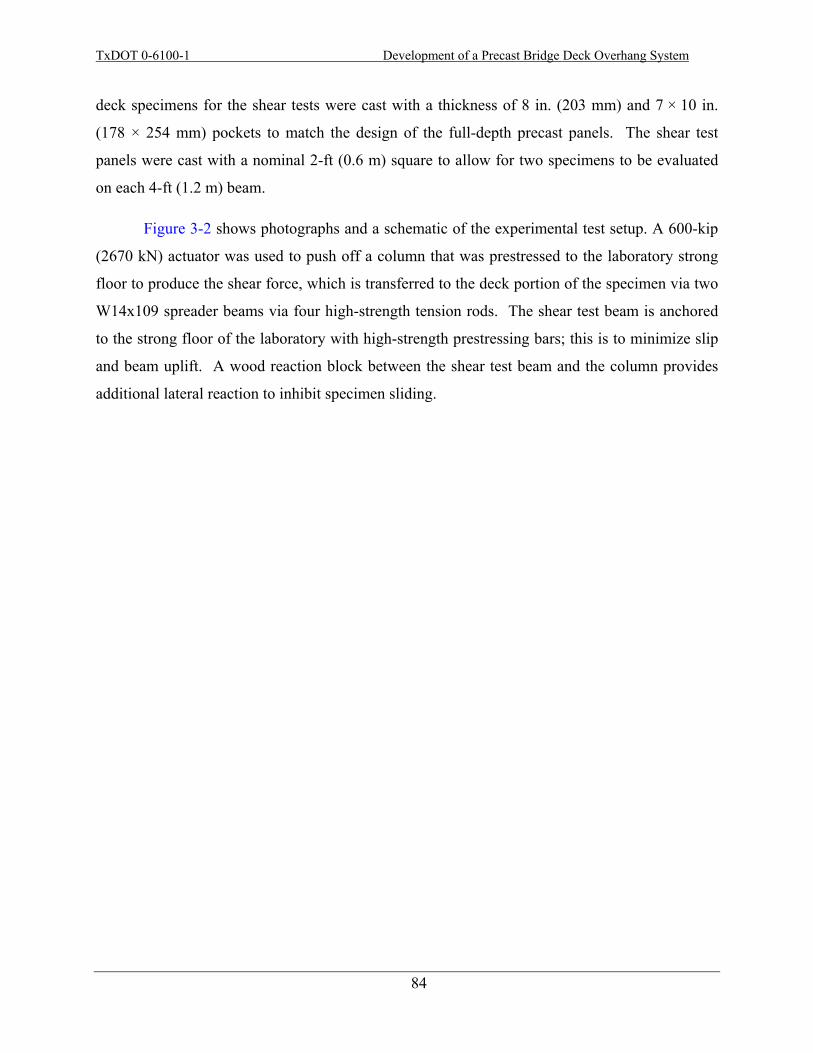
TxDOT 0-6100-1 Development of a Precast Bridge Deck Overhang System
84
deck specimens for the shear tests were cast with a thickness of 8 in. (203 mm) and 7 × 10 in.
(178 × 254 mm) pockets to match the design of the full-depth precast panels. The shear test
panels were cast with a nominal 2-ft (0.6 m) square to allow for two specimens to be evaluated
on each 4-ft (1.2 m) beam.
Figure 3-2 shows photographs and a schematic of the experimental test setup. A 600-kip
(2670 kN) actuator was used to push off a column that was prestressed to the laboratory strong
floor to produce the shear force, which is transferred to the deck portion of the specimen via two
W14x109 spreader beams via four high-strength tension rods. The shear test beam is anchored
to the strong floor of the laboratory with high-strength prestressing bars; this is to minimize slip
and beam uplift. A wood reaction block between the shear test beam and the column provides
additional lateral reaction to inhibit specimen sliding.
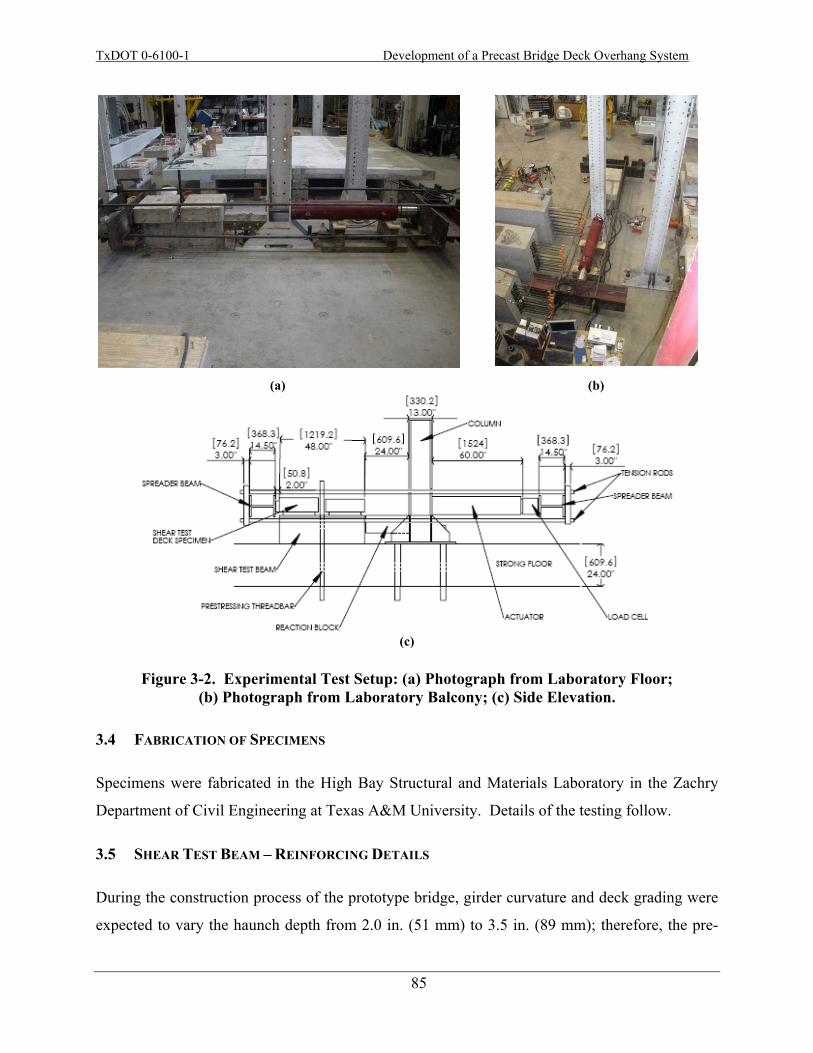
TxDOT 0-6100-1 Development of a Precast Bridge Deck Overhang System
85
(a) (b)
(c)
Figure 3-2. Experimental Test Setup: (a) Photograph from Laboratory Floor; (b) Photograph from Laboratory Balcony; (c) Side Elevation.
3.4 FABRICATION OF SPECIMENS
Specimens were fabricated in the High Bay Structural and Materials Laboratory in the Zachry
Department of Civil Engineering at Texas A&M University. Details of the testing follow.
3.5 SHEAR TEST BEAM – REINFORCING DETAILS
During the construction process of the prototype bridge, girder curvature and deck grading were
expected to vary the haunch depth from 2.0 in. (51 mm) to 3.5 in. (89 mm); therefore, the pre-
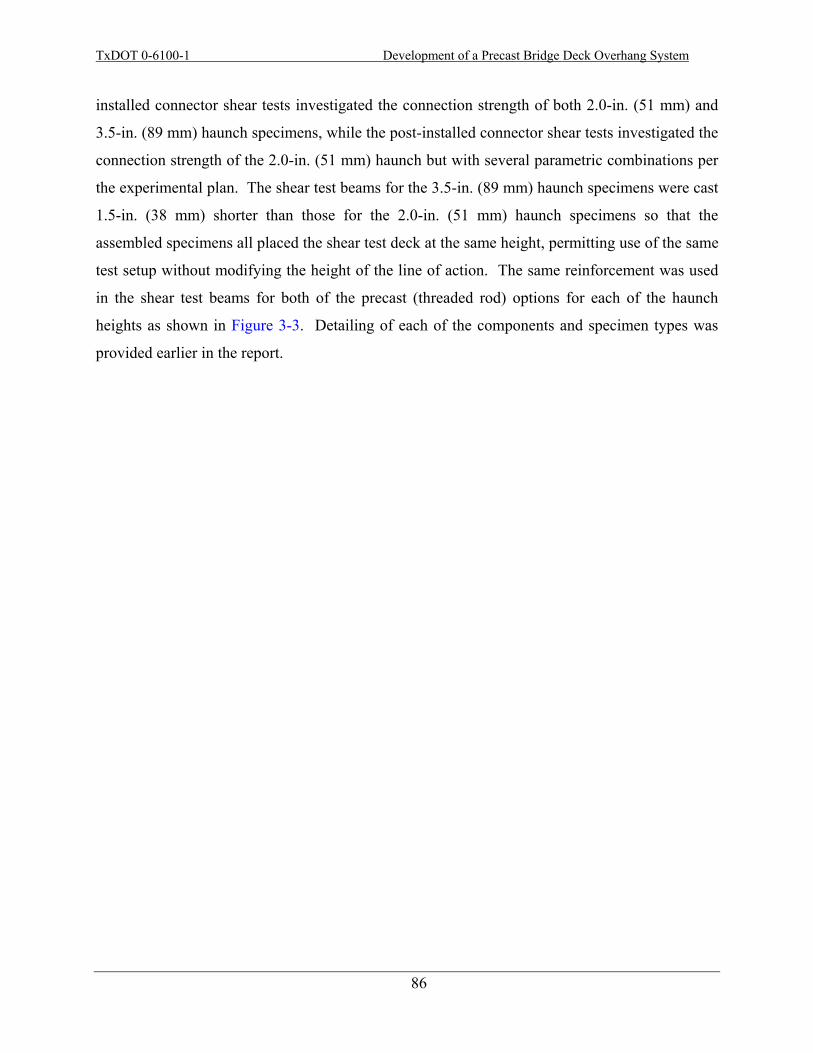
TxDOT 0-6100-1 Development of a Precast Bridge Deck Overhang System
86
installed connector shear tests investigated the connection strength of both 2.0-in. (51 mm) and
3.5-in. (89 mm) haunch specimens, while the post-installed connector shear tests investigated the
connection strength of the 2.0-in. (51 mm) haunch but with several parametric combinations per
the experimental plan. The shear test beams for the 3.5-in. (89 mm) haunch specimens were cast
1.5-in. (38 mm) shorter than those for the 2.0-in. (51 mm) haunch specimens so that the
assembled specimens all placed the shear test deck at the same height, permitting use of the same
test setup without modifying the height of the line of action. The same reinforcement was used
in the shear test beams for both of the precast (threaded rod) options for each of the haunch
heights as shown in Figure 3-3. Detailing of each of the components and specimen types was
provided earlier in the report.
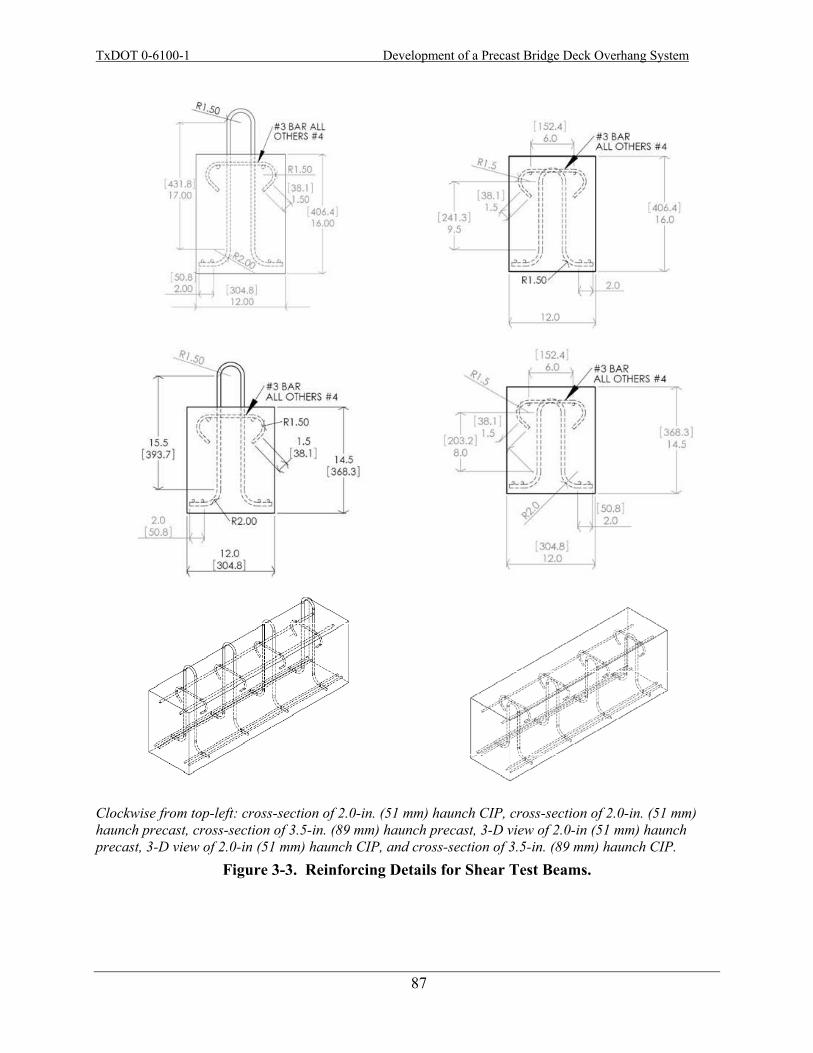
TxDOT 0-6100-1 Development of a Precast Bridge Deck Overhang System
87
Clockwise from top-left: cross-section of 2.0-in. (51 mm) haunch CIP, cross-section of 2.0-in. (51 mm) haunch precast, cross-section of 3.5-in. (89 mm) haunch precast, 3-D view of 2.0-in (51 mm) haunch precast, 3-D view of 2.0-in (51 mm) haunch CIP, and cross-section of 3.5-in. (89 mm) haunch CIP.
Figure 3-3. Reinforcing Details for Shear Test Beams.
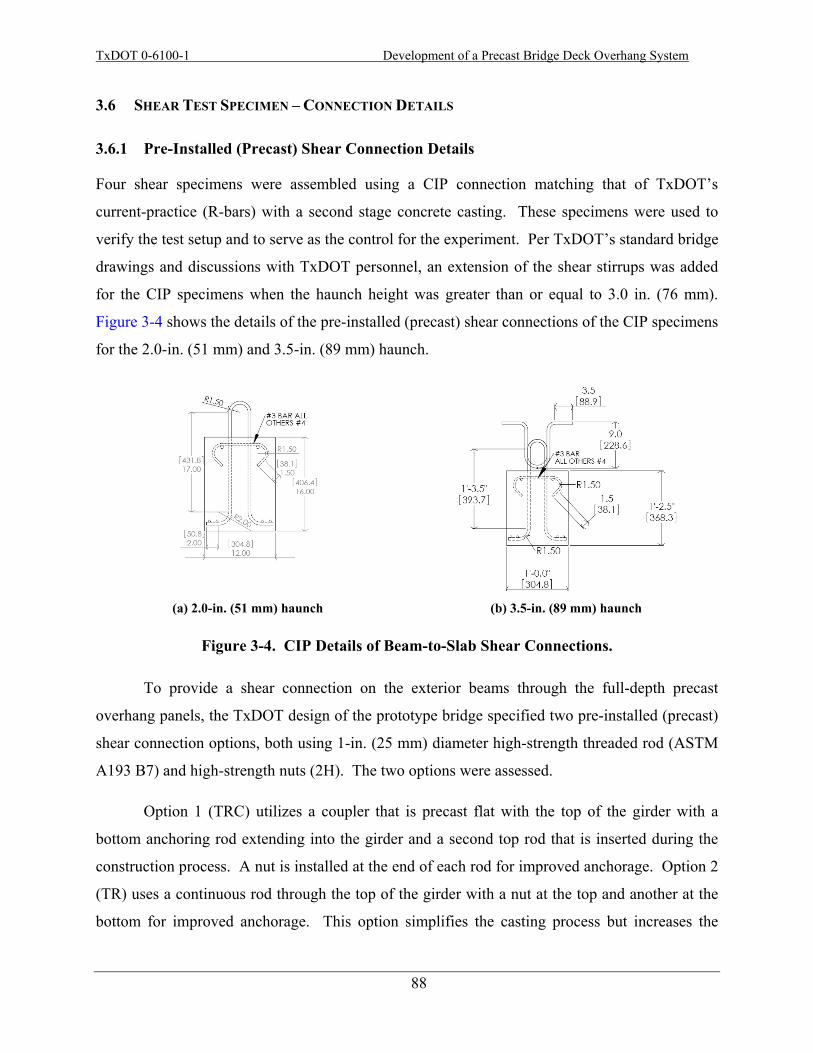
TxDOT 0-6100-1 Development of a Precast Bridge Deck Overhang System
88
3.6 SHEAR TEST SPECIMEN – CONNECTION DETAILS
3.6.1 Pre-Installed (Precast) Shear Connection Details
Four shear specimens were assembled using a CIP connection matching that of TxDOT’s
current-practice (R-bars) with a second stage concrete casting. These specimens were used to
verify the test setup and to serve as the control for the experiment. Per TxDOT’s standard bridge
drawings and discussions with TxDOT personnel, an extension of the shear stirrups was added
for the CIP specimens when the haunch height was greater than or equal to 3.0 in. (76 mm).
Figure 3-4 shows the details of the pre-installed (precast) shear connections of the CIP specimens
for the 2.0-in. (51 mm) and 3.5-in. (89 mm) haunch.
(a) 2.0-in. (51 mm) haunch (b) 3.5-in. (89 mm) haunch
Figure 3-4. CIP Details of Beam-to-Slab Shear Connections.
To provide a shear connection on the exterior beams through the full-depth precast
overhang panels, the TxDOT design of the prototype bridge specified two pre-installed (precast)
shear connection options, both using 1-in. (25 mm) diameter high-strength threaded rod (ASTM
A193 B7) and high-strength nuts (2H). The two options were assessed.
Option 1 (TRC) utilizes a coupler that is precast flat with the top of the girder with a
bottom anchoring rod extending into the girder and a second top rod that is inserted during the
construction process. A nut is installed at the end of each rod for improved anchorage. Option 2
(TR) uses a continuous rod through the top of the girder with a nut at the top and another at the
bottom for improved anchorage. This option simplifies the casting process but increases the
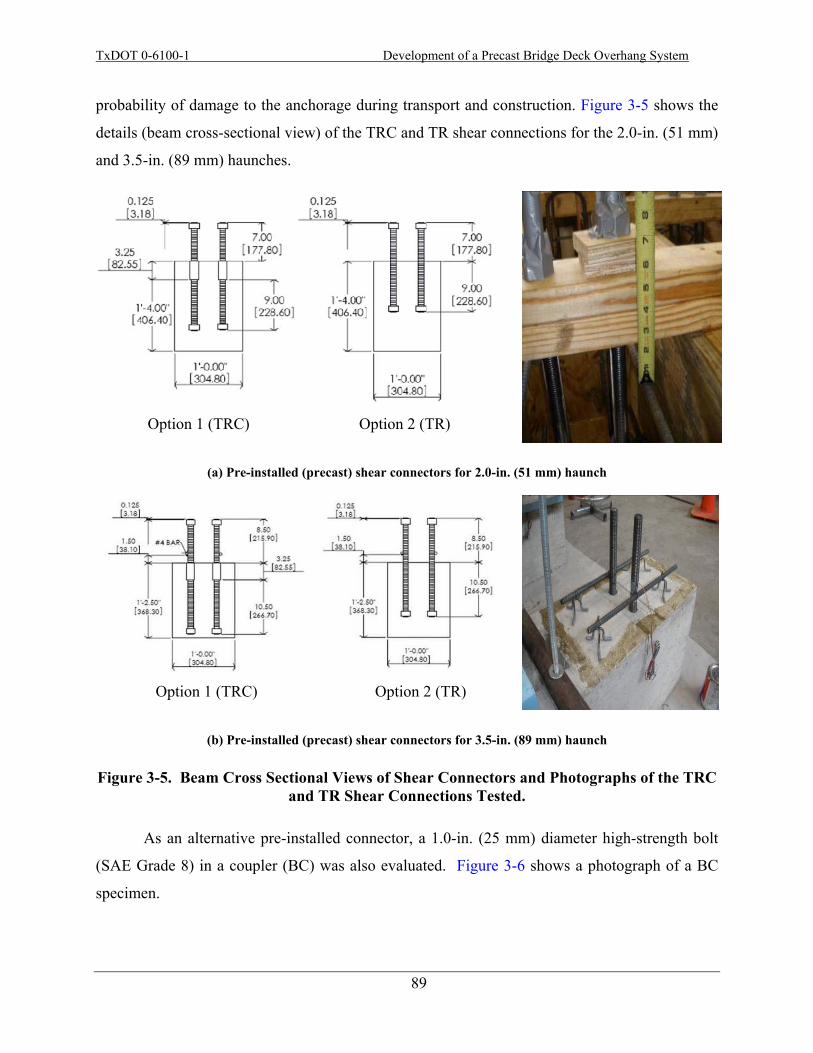
TxDOT 0-6100-1 Development of a Precast Bridge Deck Overhang System
89
probability of damage to the anchorage during transport and construction. Figure 3-5 shows the
details (beam cross-sectional view) of the TRC and TR shear connections for the 2.0-in. (51 mm)
and 3.5-in. (89 mm) haunches.
Option 1 (TRC) Option 2 (TR)
(a) Pre-installed (precast) shear connectors for 2.0-in. (51 mm) haunch
Option 1 (TRC) Option 2 (TR)
(b) Pre-installed (precast) shear connectors for 3.5-in. (89 mm) haunch
Figure 3-5. Beam Cross Sectional Views of Shear Connectors and Photographs of the TRC and TR Shear Connections Tested.
As an alternative pre-installed connector, a 1.0-in. (25 mm) diameter high-strength bolt
(SAE Grade 8) in a coupler (BC) was also evaluated. Figure 3-6 shows a photograph of a BC
specimen.
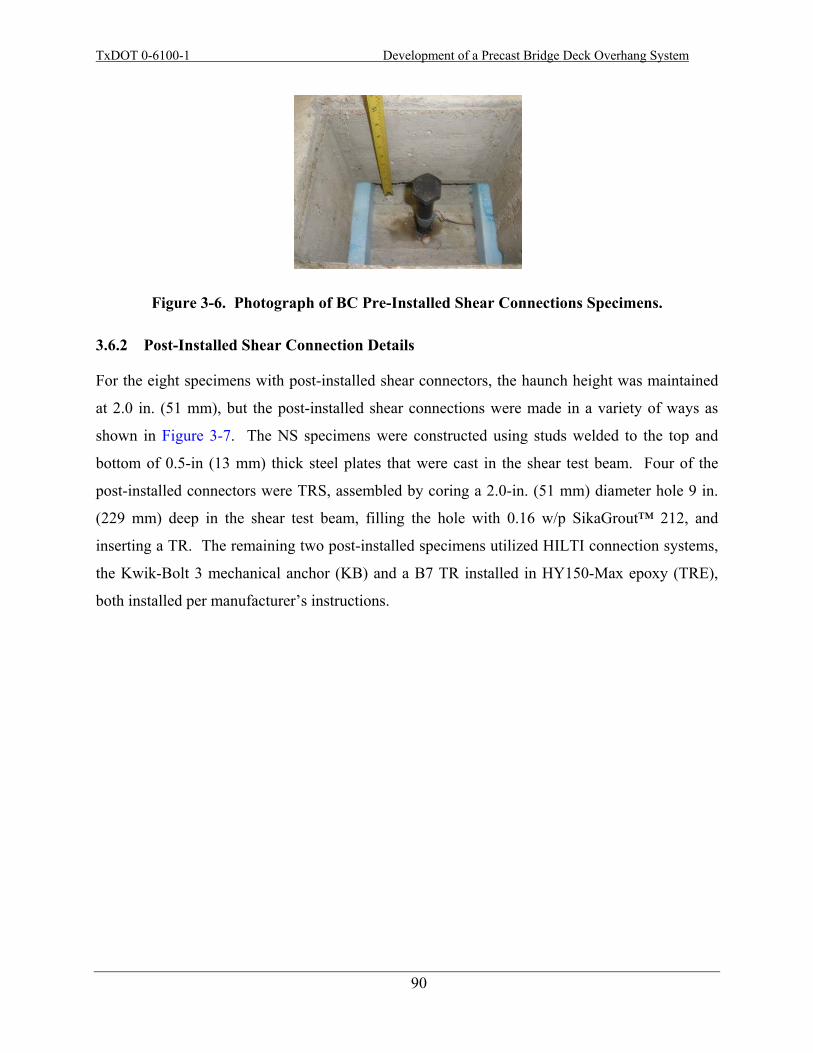
TxDOT 0-6100-1 Development of a Precast Bridge Deck Overhang System
90
Figure 3-6. Photograph of BC Pre-Installed Shear Connections Specimens.
3.6.2 Post-Installed Shear Connection Details
For the eight specimens with post-installed shear connectors, the haunch height was maintained
at 2.0 in. (51 mm), but the post-installed shear connections were made in a variety of ways as
shown in Figure 3-7. The NS specimens were constructed using studs welded to the top and
bottom of 0.5-in (13 mm) thick steel plates that were cast in the shear test beam. Four of the
post-installed connectors were TRS, assembled by coring a 2.0-in. (51 mm) diameter hole 9 in.
(229 mm) deep in the shear test beam, filling the hole with 0.16 w/p SikaGrout™ 212, and
inserting a TR. The remaining two post-installed specimens utilized HILTI connection systems,
the Kwik-Bolt 3 mechanical anchor (KB) and a B7 TR installed in HY150-Max epoxy (TRE),
both installed per manufacturer’s instructions.
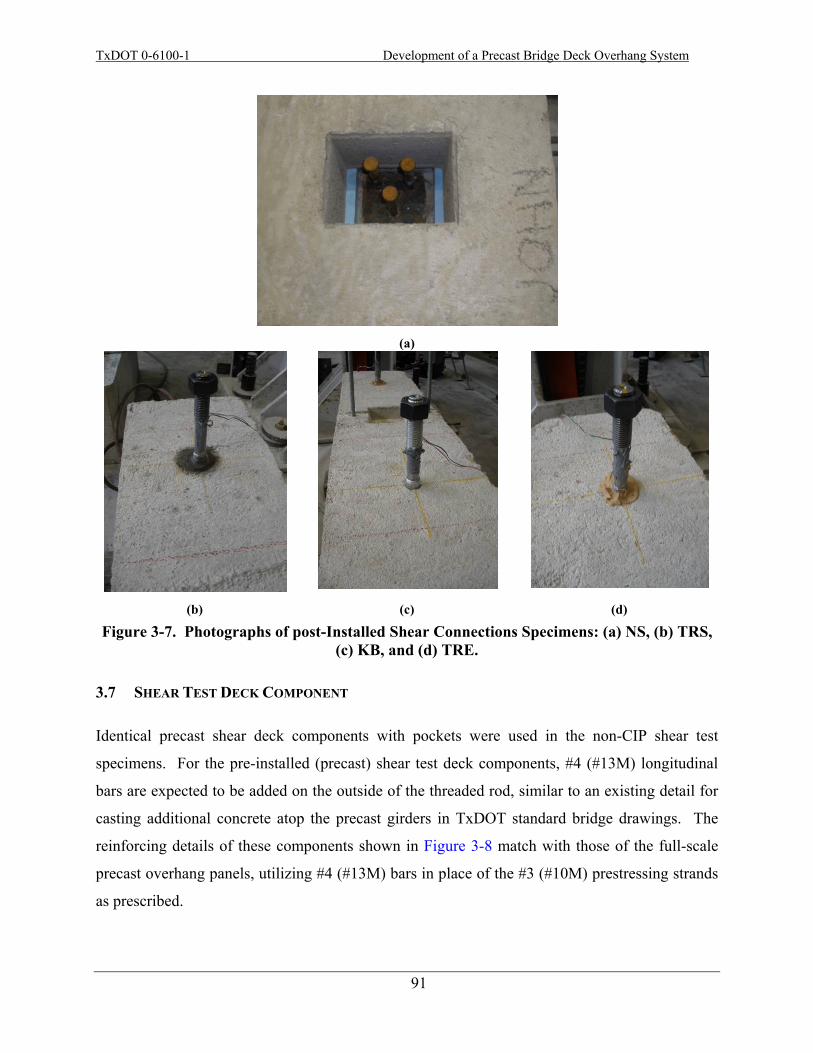
TxDOT 0-6100-1 Development of a Precast Bridge Deck Overhang System
91
(a)
(b) (c) (d)
Figure 3-7. Photographs of post-Installed Shear Connections Specimens: (a) NS, (b) TRS, (c) KB, and (d) TRE.
3.7 SHEAR TEST DECK COMPONENT
Identical precast shear deck components with pockets were used in the non-CIP shear test
specimens. For the pre-installed (precast) shear test deck components, #4 (#13M) longitudinal
bars are expected to be added on the outside of the threaded rod, similar to an existing detail for
casting additional concrete atop the precast girders in TxDOT standard bridge drawings. The
reinforcing details of these components shown in Figure 3-8 match with those of the full-scale
precast overhang panels, utilizing #4 (#13M) bars in place of the #3 (#10M) prestressing strands
as prescribed.
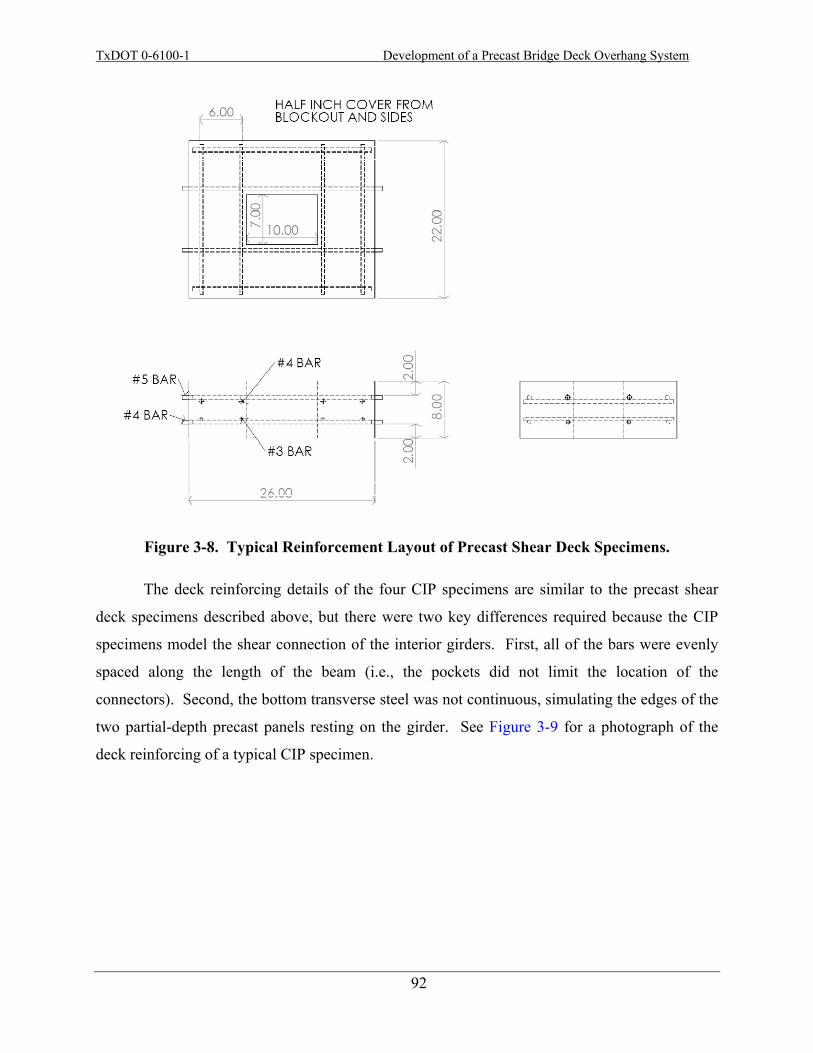
TxDOT 0-6100-1 Development of a Precast Bridge Deck Overhang System
92
Figure 3-8. Typical Reinforcement Layout of Precast Shear Deck Specimens.
The deck reinforcing details of the four CIP specimens are similar to the precast shear
deck specimens described above, but there were two key differences required because the CIP
specimens model the shear connection of the interior girders. First, all of the bars were evenly
spaced along the length of the beam (i.e., the pockets did not limit the location of the
connectors). Second, the bottom transverse steel was not continuous, simulating the edges of the
two partial-depth precast panels resting on the girder. See Figure 3-9 for a photograph of the
deck reinforcing of a typical CIP specimen.
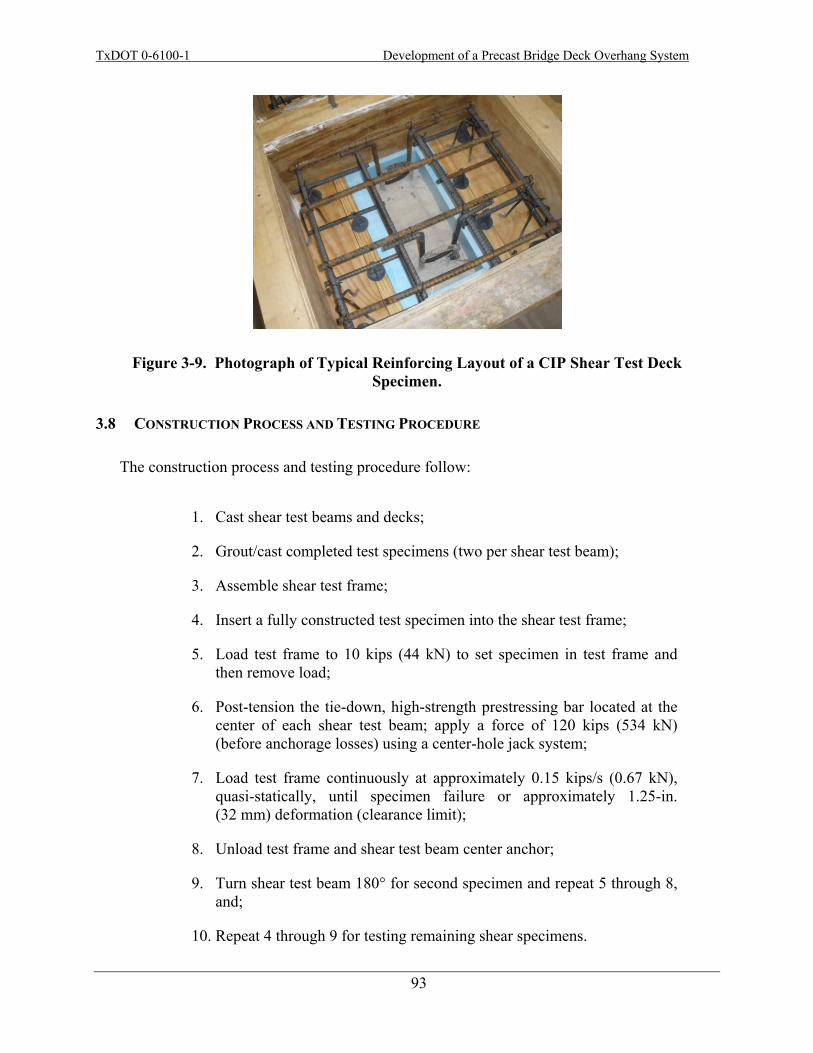
TxDOT 0-6100-1 Development of a Precast Bridge Deck Overhang System
93
Figure 3-9. Photograph of Typical Reinforcing Layout of a CIP Shear Test Deck Specimen.
3.8 CONSTRUCTION PROCESS AND TESTING PROCEDURE
The construction process and testing procedure follow:
1. Cast shear test beams and decks;
2. Grout/cast completed test specimens (two per shear test beam);
3. Assemble shear test frame;
4. Insert a fully constructed test specimen into the shear test frame;
5. Load test frame to 10 kips (44 kN) to set specimen in test frame and then remove load;
6. Post-tension the tie-down, high-strength prestressing bar located at the center of each shear test beam; apply a force of 120 kips (534 kN) (before anchorage losses) using a center-hole jack system;
7. Load test frame continuously at approximately 0.15 kips/s (0.67 kN), quasi-statically, until specimen failure or approximately 1.25-in. (32 mm) deformation (clearance limit);
8. Unload test frame and shear test beam center anchor;
9. Turn shear test beam 180° for second specimen and repeat 5 through 8, and;
10. Repeat 4 through 9 for testing remaining shear specimens.
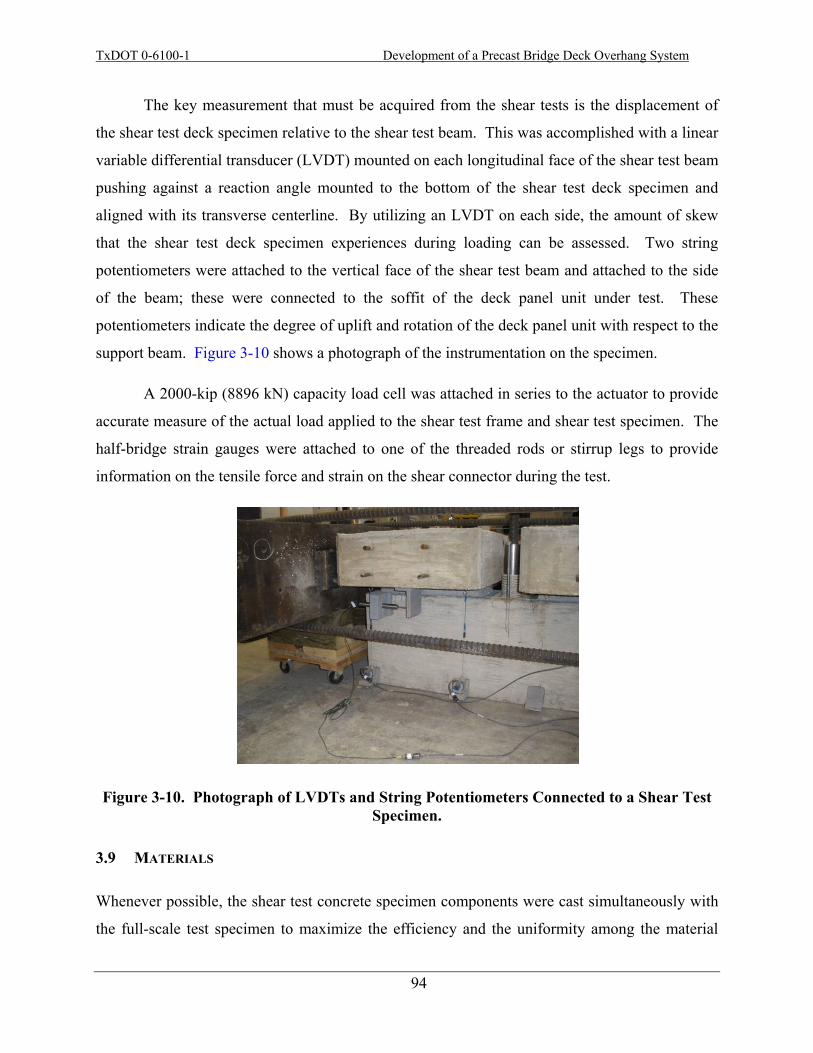
TxDOT 0-6100-1 Development of a Precast Bridge Deck Overhang System
94
The key measurement that must be acquired from the shear tests is the displacement of
the shear test deck specimen relative to the shear test beam. This was accomplished with a linear
variable differential transducer (LVDT) mounted on each longitudinal face of the shear test beam
pushing against a reaction angle mounted to the bottom of the shear test deck specimen and
aligned with its transverse centerline. By utilizing an LVDT on each side, the amount of skew
that the shear test deck specimen experiences during loading can be assessed. Two string
potentiometers were attached to the vertical face of the shear test beam and attached to the side
of the beam; these were connected to the soffit of the deck panel unit under test. These
potentiometers indicate the degree of uplift and rotation of the deck panel unit with respect to the
support beam. Figure 3-10 shows a photograph of the instrumentation on the specimen.
A 2000-kip (8896 kN) capacity load cell was attached in series to the actuator to provide
accurate measure of the actual load applied to the shear test frame and shear test specimen. The
half-bridge strain gauges were attached to one of the threaded rods or stirrup legs to provide
information on the tensile force and strain on the shear connector during the test.
Figure 3-10. Photograph of LVDTs and String Potentiometers Connected to a Shear Test Specimen.
3.9 MATERIALS
Whenever possible, the shear test concrete specimen components were cast simultaneously with
the full-scale test specimen to maximize the efficiency and the uniformity among the material
TxDOT 0-6100-1 Development of a Precast Bridge Deck Overhang System
95
properties across the specimens. Concrete was provided by Transit Mix Inc., Bryan, Texas, with
a mix proportioned to achieve a 4-in. (102 mm) slump and a specified 28-day compressive
strength of 4000 psi (28 MPa). More information about the compressive strengths of the
concrete was reported earlier. Standard, grade 60 reinforcing bar was used in the reinforced
concrete components, with #3 (#10M), #4 (#13M), and #5 (#16M) bars used as shown in the
reinforcing details. For the validation shear connectors, 1-in. (25-mm) high-strength TR (ASTM
A193 B7) specimens were used with high-strength (2H) nuts. This threaded rod has a specified
minimum yield and ultimate tensile strengths of 105 and 125 ksi (724 and 862 MPa),
respectively. Tensile tests were conducted to verify the tensile strength of both the reinforcing
bar and threaded rods used for the validation tests. The measured yield and tensile strengths of
the #4 (#13M) rebar stirrups were 63 and 100 ksi (434 and 689 MPa), respectively. The
measured yield and tensile strengths of the TR were 120 and 137 ksi (827 and 945 MPa),
respectively, with a complete stress-strain curve shown in Figure 3-11. The shear connection
specimens per “Option 1” were followed in accordance with the initial Prestressed Concrete I-
Beam Details External Beams that were prescribed with 3.5-in. (89 mm) couplers.
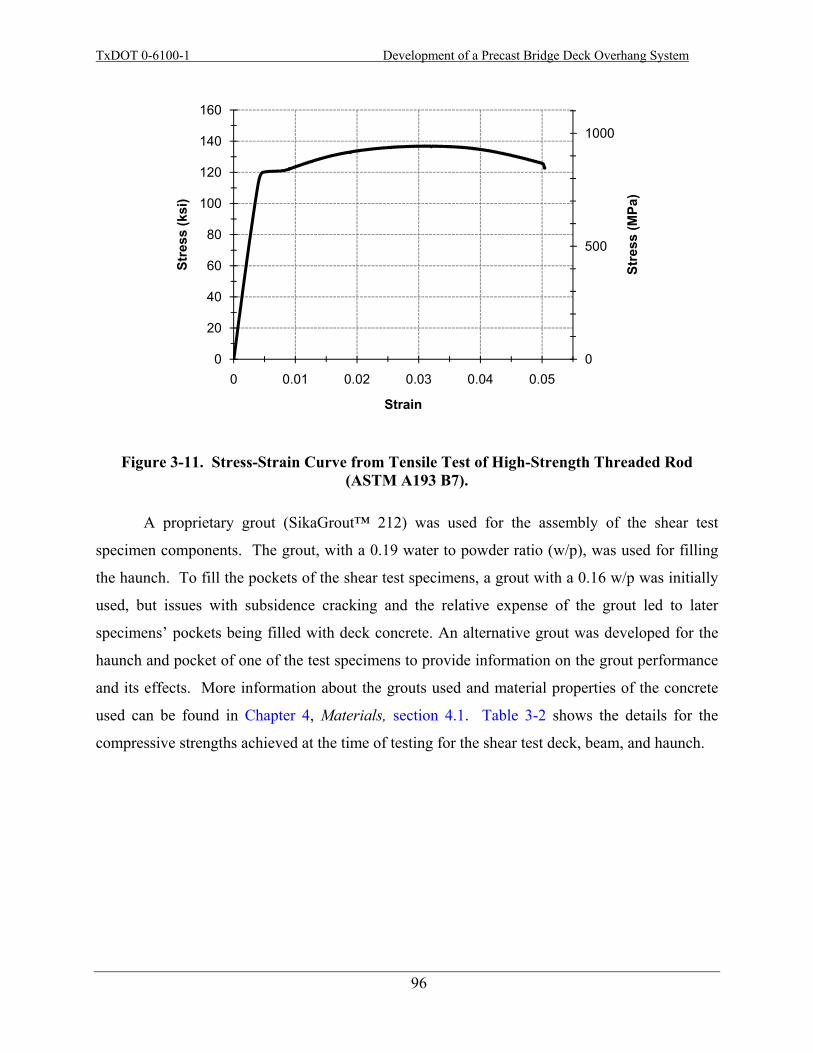
TxDOT 0-6100-1 Development of a Precast Bridge Deck Overhang System
96
Figure 3-11. Stress-Strain Curve from Tensile Test of High-Strength Threaded Rod (ASTM A193 B7).
A proprietary grout (SikaGrout™ 212) was used for the assembly of the shear test
specimen components. The grout, with a 0.19 water to powder ratio (w/p), was used for filling
the haunch. To fill the pockets of the shear test specimens, a grout with a 0.16 w/p was initially
used, but issues with subsidence cracking and the relative expense of the grout led to later
specimens’ pockets being filled with deck concrete. An alternative grout was developed for the
haunch and pocket of one of the test specimens to provide information on the grout performance
and its effects. More information about the grouts used and material properties of the concrete
used can be found in Chapter 4, Materials, section 4.1. Table 3-2 shows the details for the
compressive strengths achieved at the time of testing for the shear test deck, beam, and haunch.
0
500
1000
0
20
40
60
80
100
120
140
160
0 0.01 0.02 0.03 0.04 0.05
Stre
ss (M
Pa)
Stre
ss (k
si)
Strain
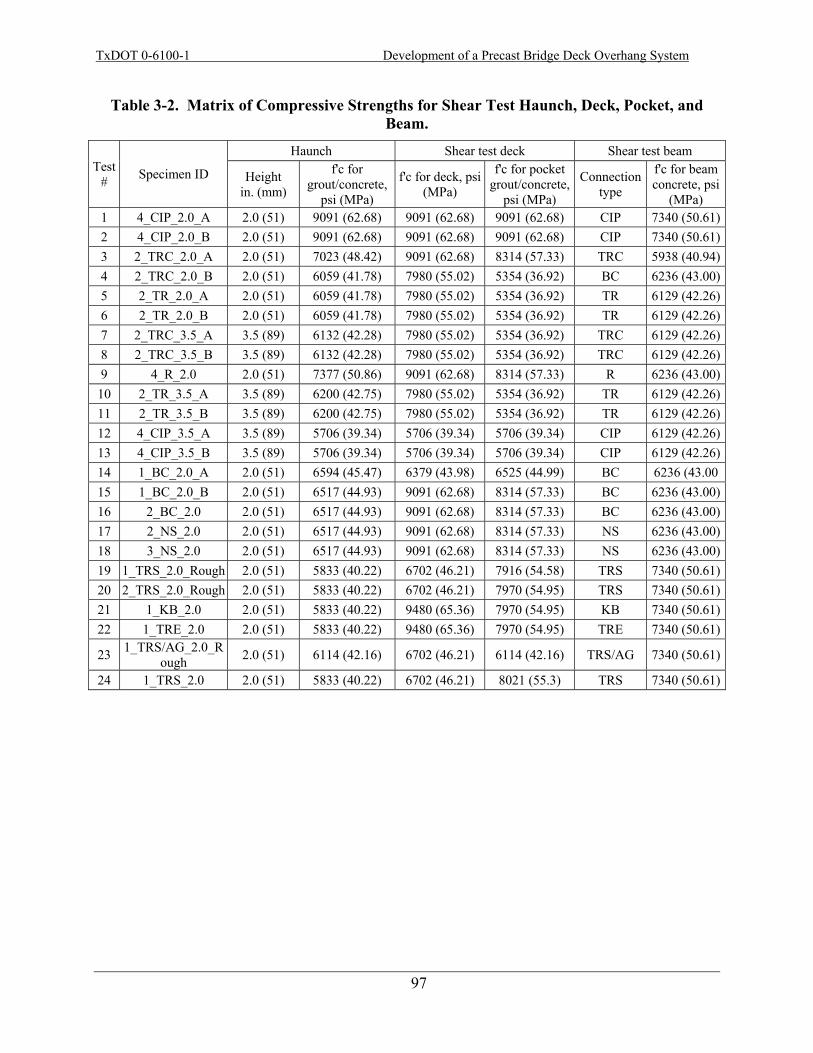
TxDOT 0-6100-1 Development of a Precast Bridge Deck Overhang System
97
Table 3-2. Matrix of Compressive Strengths for Shear Test Haunch, Deck, Pocket, and Beam.
Test # Specimen ID
Haunch Shear test deck Shear test beam
Height in. (mm)
f'c for grout/concrete,
psi (MPa)
f'c for deck, psi (MPa)
f'c for pocket grout/concrete,
psi (MPa)
Connection type
f'c for beam concrete, psi
(MPa) 1 4_CIP_2.0_A 2.0 (51) 9091 (62.68) 9091 (62.68) 9091 (62.68) CIP 7340 (50.61)2 4_CIP_2.0_B 2.0 (51) 9091 (62.68) 9091 (62.68) 9091 (62.68) CIP 7340 (50.61)3 2_TRC_2.0_A 2.0 (51) 7023 (48.42) 9091 (62.68) 8314 (57.33) TRC 5938 (40.94)4 2_TRC_2.0_B 2.0 (51) 6059 (41.78) 7980 (55.02) 5354 (36.92) BC 6236 (43.00)5 2_TR_2.0_A 2.0 (51) 6059 (41.78) 7980 (55.02) 5354 (36.92) TR 6129 (42.26)6 2_TR_2.0_B 2.0 (51) 6059 (41.78) 7980 (55.02) 5354 (36.92) TR 6129 (42.26)7 2_TRC_3.5_A 3.5 (89) 6132 (42.28) 7980 (55.02) 5354 (36.92) TRC 6129 (42.26)8 2_TRC_3.5_B 3.5 (89) 6132 (42.28) 7980 (55.02) 5354 (36.92) TRC 6129 (42.26)9 4_R_2.0 2.0 (51) 7377 (50.86) 9091 (62.68) 8314 (57.33) R 6236 (43.00)
10 2_TR_3.5_A 3.5 (89) 6200 (42.75) 7980 (55.02) 5354 (36.92) TR 6129 (42.26)11 2_TR_3.5_B 3.5 (89) 6200 (42.75) 7980 (55.02) 5354 (36.92) TR 6129 (42.26)12 4_CIP_3.5_A 3.5 (89) 5706 (39.34) 5706 (39.34) 5706 (39.34) CIP 6129 (42.26)13 4_CIP_3.5_B 3.5 (89) 5706 (39.34) 5706 (39.34) 5706 (39.34) CIP 6129 (42.26)14 1_BC_2.0_A 2.0 (51) 6594 (45.47) 6379 (43.98) 6525 (44.99) BC 6236 (43.00 15 1_BC_2.0_B 2.0 (51) 6517 (44.93) 9091 (62.68) 8314 (57.33) BC 6236 (43.00)16 2_BC_2.0 2.0 (51) 6517 (44.93) 9091 (62.68) 8314 (57.33) BC 6236 (43.00)17 2_NS_2.0 2.0 (51) 6517 (44.93) 9091 (62.68) 8314 (57.33) NS 6236 (43.00)18 3_NS_2.0 2.0 (51) 6517 (44.93) 9091 (62.68) 8314 (57.33) NS 6236 (43.00)19 1_TRS_2.0_Rough 2.0 (51) 5833 (40.22) 6702 (46.21) 7916 (54.58) TRS 7340 (50.61)20 2_TRS_2.0_Rough 2.0 (51) 5833 (40.22) 6702 (46.21) 7970 (54.95) TRS 7340 (50.61)21 1_KB_2.0 2.0 (51) 5833 (40.22) 9480 (65.36) 7970 (54.95) KB 7340 (50.61)22 1_TRE_2.0 2.0 (51) 5833 (40.22) 9480 (65.36) 7970 (54.95) TRE 7340 (50.61)
23 1_TRS/AG_2.0_Rough 2.0 (51) 6114 (42.16) 6702 (46.21) 6114 (42.16) TRS/AG 7340 (50.61)
24 1_TRS_2.0 2.0 (51) 5833 (40.22) 6702 (46.21) 8021 (55.3) TRS 7340 (50.61)
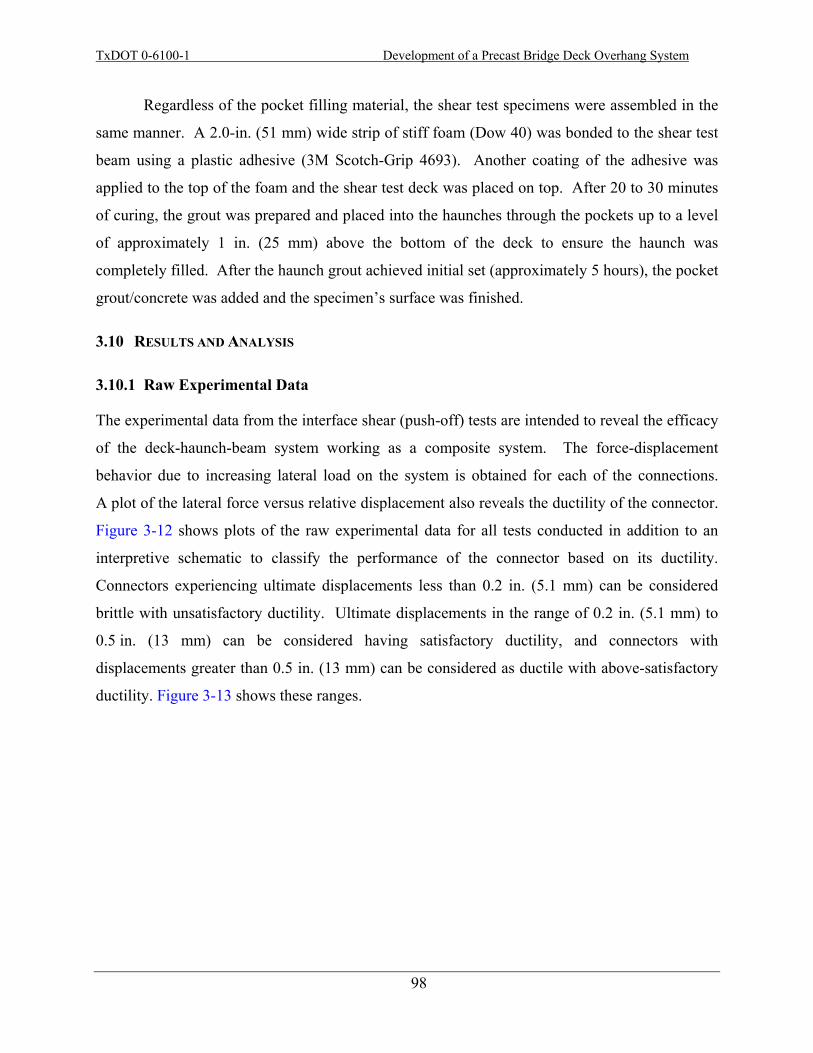
TxDOT 0-6100-1 Development of a Precast Bridge Deck Overhang System
98
Regardless of the pocket filling material, the shear test specimens were assembled in the
same manner. A 2.0-in. (51 mm) wide strip of stiff foam (Dow 40) was bonded to the shear test
beam using a plastic adhesive (3M Scotch-Grip 4693). Another coating of the adhesive was
applied to the top of the foam and the shear test deck was placed on top. After 20 to 30 minutes
of curing, the grout was prepared and placed into the haunches through the pockets up to a level
of approximately 1 in. (25 mm) above the bottom of the deck to ensure the haunch was
completely filled. After the haunch grout achieved initial set (approximately 5 hours), the pocket
grout/concrete was added and the specimen’s surface was finished.
3.10 RESULTS AND ANALYSIS
3.10.1 Raw Experimental Data
The experimental data from the interface shear (push-off) tests are intended to reveal the efficacy
of the deck-haunch-beam system working as a composite system. The force-displacement
behavior due to increasing lateral load on the system is obtained for each of the connections.
A plot of the lateral force versus relative displacement also reveals the ductility of the connector.
Figure 3-12 shows plots of the raw experimental data for all tests conducted in addition to an
interpretive schematic to classify the performance of the connector based on its ductility.
Connectors experiencing ultimate displacements less than 0.2 in. (5.1 mm) can be considered
brittle with unsatisfactory ductility. Ultimate displacements in the range of 0.2 in. (5.1 mm) to
0.5 in. (13 mm) can be considered having satisfactory ductility, and connectors with
displacements greater than 0.5 in. (13 mm) can be considered as ductile with above-satisfactory
ductility. Figure 3-13 shows these ranges.
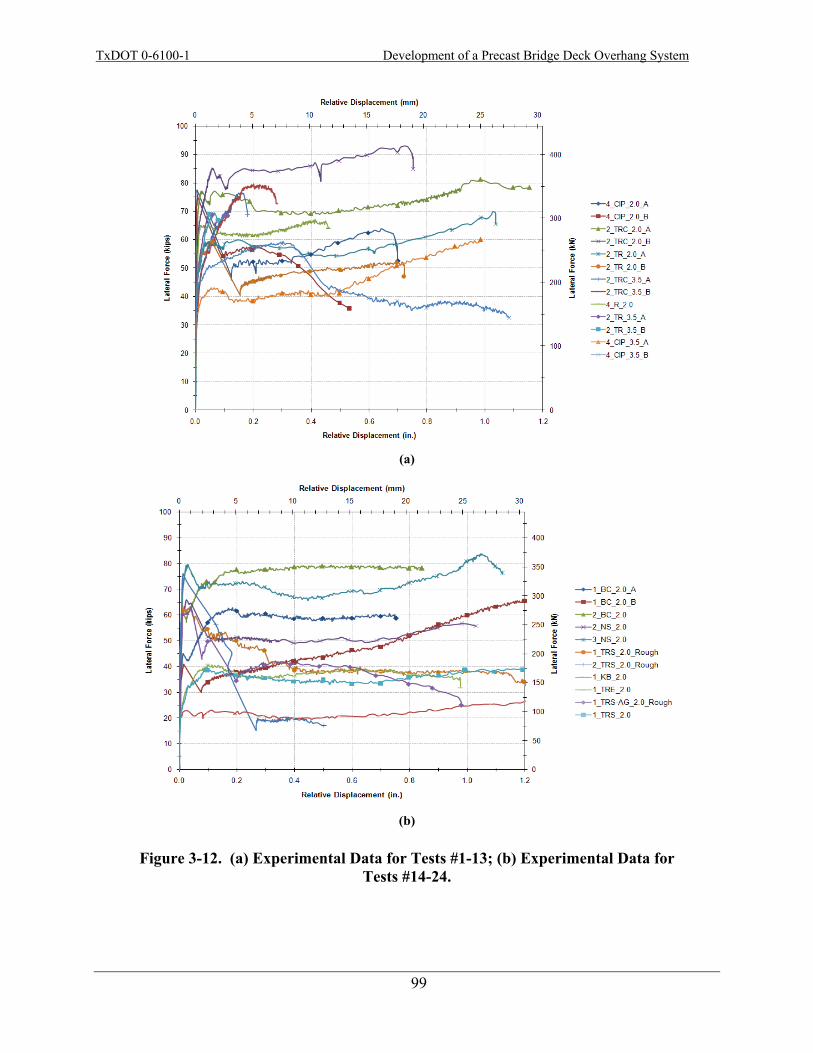
TxDOT 0-6100-1 Development of a Precast Bridge Deck Overhang System
99
(a)
(b)
Figure 3-12. (a) Experimental Data for Tests #1-13; (b) Experimental Data for Tests #14-24.
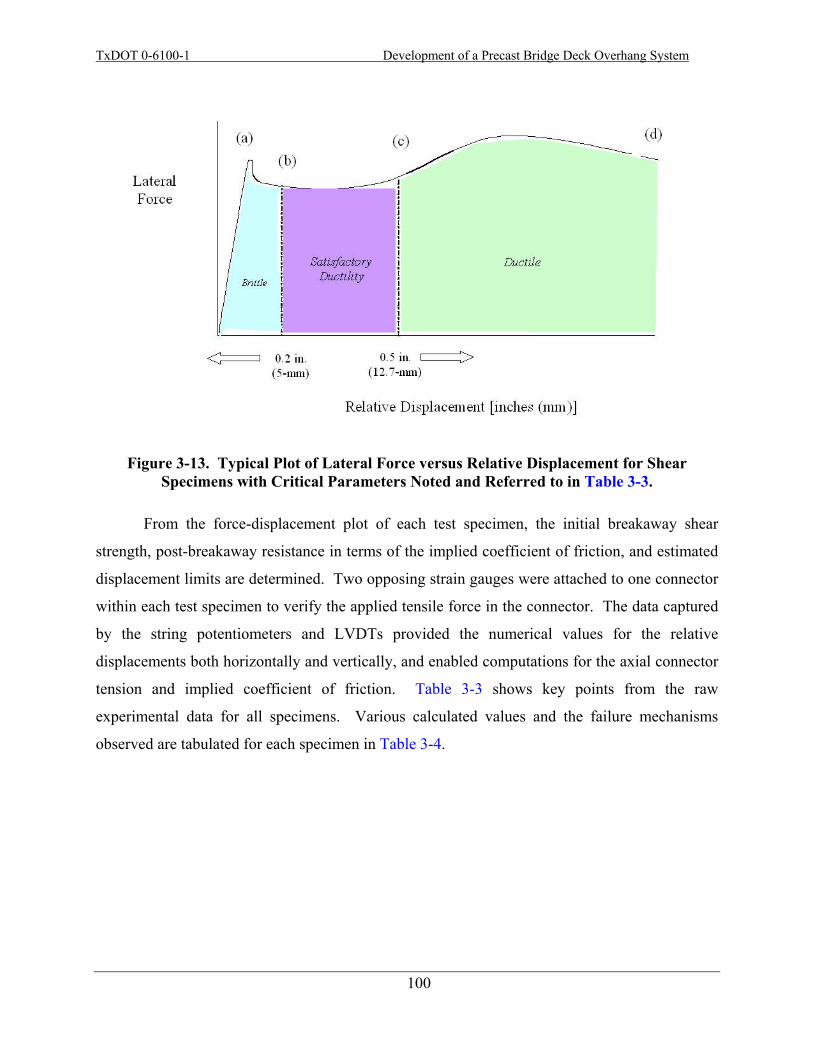
TxDOT 0-6100-1 Development of a Precast Bridge Deck Overhang System
100
Figure 3-13. Typical Plot of Lateral Force versus Relative Displacement for Shear Specimens with Critical Parameters Noted and Referred to in Table 3-3.
From the force-displacement plot of each test specimen, the initial breakaway shear
strength, post-breakaway resistance in terms of the implied coefficient of friction, and estimated
displacement limits are determined. Two opposing strain gauges were attached to one connector
within each test specimen to verify the applied tensile force in the connector. The data captured
by the string potentiometers and LVDTs provided the numerical values for the relative
displacements both horizontally and vertically, and enabled computations for the axial connector
tension and implied coefficient of friction. Table 3-3 shows key points from the raw
experimental data for all specimens. Various calculated values and the failure mechanisms
observed are tabulated for each specimen in Table 3-4.

TxDOT 0-6100-1 Development of a Precast Bridge Deck Overhang System
101
Table 3-3. Raw Experimental Data for All Shear Tests.
Test # Specimen ID
Initial peak displacement,
in. (mm) (a)
Initial peak force,
kips (kN) (a)
Force @ 0.2 in.
(5.1 mm),kips (kN)
(b)
Peak load (past
initial) [kips (kN)]
(c)
Ultimate displacement
[in. (mm)] (d)
Vertical tie-down force [kips (kN)]
@ Yield @ Ultimate
1 4_CIP_2.0_A 0.008 (0.203) 77 (342) 51 (227) 64 (285) 0.70 (17.8) 50 (222) 79 (351)
2 4_CIP_2.0_B 0.008 (0.203) 76 (338) 58 (2 58) 58 (258) 1.18 (30.0) 50 (222) 79 (351)
3 2_TRC_2.0_A 0.066 (1.67) 77 (342) 70 (311) 81 (360) 1.57 (39.9) 125 (556) 142 (632)
4 2_TRC_2.0_B 0.058 (1.47) 85 (378) 84 (374) 93 (414) 0.75 (19.1) 125 (556) 142 (632)
5 2_TR_2.0_A 0.130 (3.30) 59 (262) 58 (258) 70 (311) 1.04 (26.4) 125 (556) 142 (632)
6 2_TR_2.0_B 0.056 (1.42) 59 (262) 45 (200) 52 (231) 0.72 (18.3) 125 (556) 142 (632)
7 2_TRC_3.5_A 0.164 (4.16) 76 (338) 64 (285) 76 (338) 0.41 (10.4) 125 (556) 142 (632)
8 2_TRC_3.5_B 0.201 (5.11) 80 (356) 79 (351) 80 (356) 0.35 (8.89) 125 (556) 142 (632)
9 4_R_2.0 0.034 (0.864) 65 (289) 61 (271) 67 (298) 1.03 (26.2) 50 (222) 79 (351)
10 2_TR_3.5_A 0.048 (1.22) 69(307) NA 67 (298) 0.08 (2.03) 50 (222) 79 (351)
11 2_TR_3.5_B 0.067 (1.70) 69 (307) NA 69 (307) 0.11 (2.79) 125 (556) 142 (632)
12 4_CIP_3.5_A 0.055 (1.40) 43 (191) 39 (173) 61 (271) 1.37 (34.8) 50 (222) 79 (351)
13 4_CIP_3.5_B 0.014 (0.356) 45 (200) 57 (254) 58 (258) 1.16 (29.5) 50 (222) 79 (351)
14 1_BC_2.0_A 0.012 (0.305) 45 (200) 62 (276) 63 (280) 0.75 (19.1) 62 (276) 71 (316)
15 1_BC_2.0_B 0.016 (0.406) 41 (182) 35 (156) 66 (294) 1.42 (36.1) 62 (276) 71 (316)
16 2_BC_2.0 0.013 (0.330) 61 (271) 78 (347) 79 (351) 0.84 (21.3) 125 (556) 143 (636)
17 2_NS_2.0 0.025 (0.635) 66 (294) 51 (227) 66 (294) 1.03 (26.2) 60 (267) 66 (294)
18 3_NS_2.0 0.031 (0.787) 81 (360) 72 (320) 84 (374) 1.12 (28.5) 90 (400) 99 (440)
19 1_TRS_2.0_ Rough 0.037 (0.940) 63 (280) 50 (222) 64 (285) 1.25 (31.8) 62 (276) 71 (316)
20 2_TRS_2.0_ Rough 0.014 (0.356) 76 (338) 45 (200) 56 (249) 0.50 (12.7) 125 (556) 143 (636)
21 1_KB_2.0 0.083 (2.11) 21 (93) 22 (98) 27 (120) 1.25 (31.8) 45 (200) 57 (254)
22 1_TRE_2.0 0.031 (0.787) 33 (147) 37 (165) 41 (182) 0.98 (24.9) 62 (276) 71 (316)
23 1_TRS/AG_2.0_ Rough 0.011 (0.279) 60 (267) 35 (156) 63 (280) 0.98 (24.9) 62 (276) 71 (316)
24 1_TRS_2.0 0.026 (0.660) 31 (138) 36 (160) 39 (173) 1.19 (30.2) 62 (276) 71 (316) Note: NA = not acquired
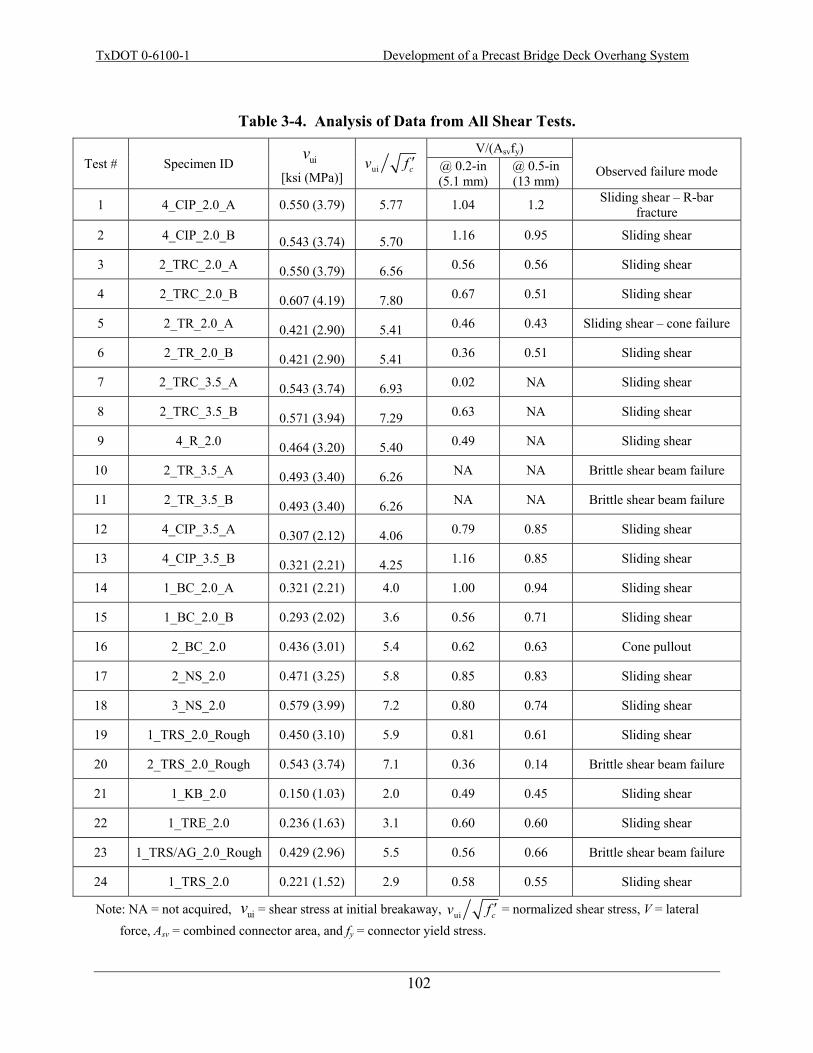
TxDOT 0-6100-1 Development of a Precast Bridge Deck Overhang System
102
Table 3-4. Analysis of Data from All Shear Tests.
Test # Specimen ID uiv [ksi (MPa)]
ui cv f ′
V/(Asvfy) Observed failure mode @ 0.2-in
(5.1 mm) @ 0.5-in (13 mm)
1 4_CIP_2.0_A 0.550 (3.79) 5.77 1.04 1.2 Sliding shear – R-bar fracture
2 4_CIP_2.0_B 0.543 (3.74) 5.70 1.16 0.95 Sliding shear
3 2_TRC_2.0_A 0.550 (3.79) 6.56 0.56 0.56 Sliding shear
4 2_TRC_2.0_B 0.607 (4.19) 7.80 0.67 0.51 Sliding shear
5 2_TR_2.0_A 0.421 (2.90) 5.41 0.46 0.43 Sliding shear – cone failure
6 2_TR_2.0_B 0.421 (2.90) 5.41 0.36 0.51 Sliding shear
7 2_TRC_3.5_A 0.543 (3.74) 6.93 0.02 NA Sliding shear
8 2_TRC_3.5_B 0.571 (3.94) 7.29 0.63 NA Sliding shear
9 4_R_2.0 0.464 (3.20) 5.40 0.49 NA Sliding shear
10 2_TR_3.5_A 0.493 (3.40) 6.26 NA NA Brittle shear beam failure
11 2_TR_3.5_B 0.493 (3.40) 6.26 NA NA Brittle shear beam failure
12 4_CIP_3.5_A 0.307 (2.12) 4.06 0.79 0.85 Sliding shear
13 4_CIP_3.5_B 0.321 (2.21) 4.25 1.16 0.85 Sliding shear
14 1_BC_2.0_A 0.321 (2.21) 4.0 1.00 0.94 Sliding shear
15 1_BC_2.0_B 0.293 (2.02) 3.6 0.56 0.71 Sliding shear
16 2_BC_2.0 0.436 (3.01) 5.4 0.62 0.63 Cone pullout
17 2_NS_2.0 0.471 (3.25) 5.8 0.85 0.83 Sliding shear
18 3_NS_2.0 0.579 (3.99) 7.2 0.80 0.74 Sliding shear
19 1_TRS_2.0_Rough 0.450 (3.10) 5.9 0.81 0.61 Sliding shear
20 2_TRS_2.0_Rough 0.543 (3.74) 7.1 0.36 0.14 Brittle shear beam failure
21 1_KB_2.0 0.150 (1.03) 2.0 0.49 0.45 Sliding shear
22 1_TRE_2.0 0.236 (1.63) 3.1 0.60 0.60 Sliding shear
23 1_TRS/AG_2.0_Rough 0.429 (2.96) 5.5 0.56 0.66 Brittle shear beam failure
24 1_TRS_2.0 0.221 (1.52) 2.9 0.58 0.55 Sliding shear
Note: NA = not acquired, uiv = shear stress at initial breakaway, ui cv f ′ = normalized shear stress, V = lateral force, Asv = combined connector area, and fy = connector yield stress.
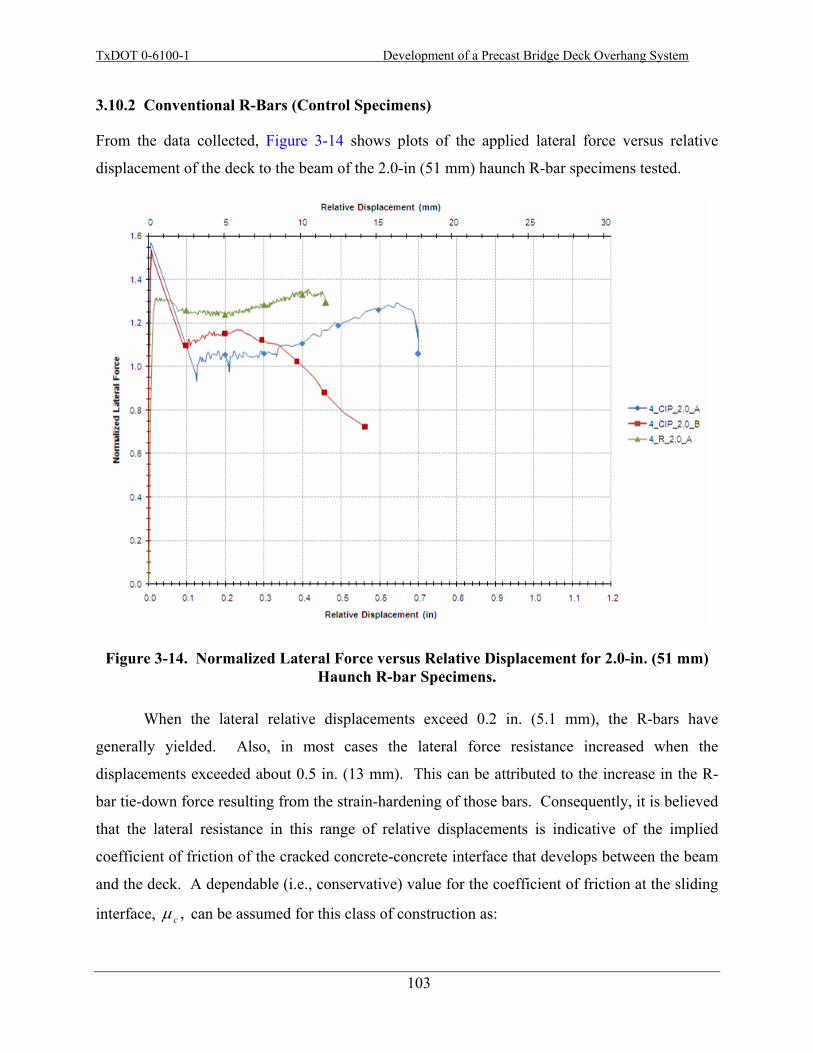
TxDOT 0-6100-1 Development of a Precast Bridge Deck Overhang System
103
3.10.2 Conventional R-Bars (Control Specimens)
From the data collected, Figure 3-14 shows plots of the applied lateral force versus relative
displacement of the deck to the beam of the 2.0-in (51 mm) haunch R-bar specimens tested.
Figure 3-14. Normalized Lateral Force versus Relative Displacement for 2.0-in. (51 mm) Haunch R-bar Specimens.
When the lateral relative displacements exceed 0.2 in. (5.1 mm), the R-bars have
generally yielded. Also, in most cases the lateral force resistance increased when the
displacements exceeded about 0.5 in. (13 mm). This can be attributed to the increase in the R-
bar tie-down force resulting from the strain-hardening of those bars. Consequently, it is believed
that the lateral resistance in this range of relative displacements is indicative of the implied
coefficient of friction of the cracked concrete-concrete interface that develops between the beam
and the deck. A dependable (i.e., conservative) value for the coefficient of friction at the sliding
interface, ,cμ can be assumed for this class of construction as:

TxDOT 0-6100-1 Development of a Precast Bridge Deck Overhang System
104
1=cμ (3.1)
Therefore, the interface shear, per unit length, provided by the R-bars is given by:
sfA
V yhshcin μ=
(3.2)
where =shA area of R-Bars (hoops) in one hoopset; =yhf yield stress of the R-bars/hoops; and
s = center-to-center spacing of the hoopsets. From the results presented in Figure 3-13, it is also
evident that for new or alternate shear systems a target (dependable) displacement limit should
be set at 0.5 in. (12 mm). For this class of precast concrete slab-on-girder bridge, this 0.5-in.
(12 mm) target deformation capability is considered sufficient, given that full composite deck-to-
girder action is to be expected. If alternative interface shear anchorage systems are to be
introduced with equivalence to the standard R-bar system, then applying Eqs. (3.1) and (3.2), the
number of shear connectors required to restrain one panel can be determined from:
pyfsfg
yhshc lfA
sfAn ⋅≥
μμ /
(3.3)
where =pl length of the precast deck panels, typically 8 ft (2.4 m); =sfA area of one shear
connector; =yff yield stress of the shear connector; and =gμ coefficient of friction of the infill
grout-to-panel haunch concrete interface. Note that a displacement capability greater than 0.5 in.
(13 mm) should also be attained.
3.10.3 Pre-Installed (Precast) Shear Connector Performance
Several specimens were tested to show the effects of connector type and number of connectors.
Although the initial breakaway behavior of the proposed system with threaded rod shear
connectors was similar to the conventional specimens with R-bars, the post-breakaway behavior
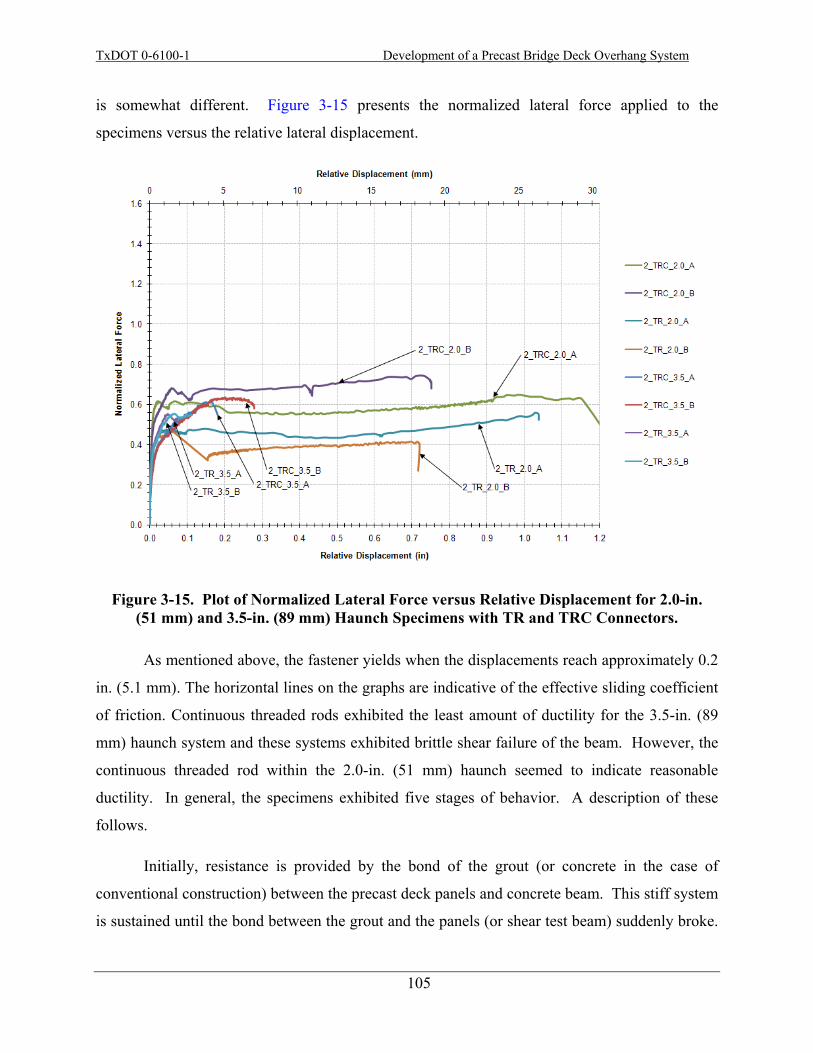
TxDOT 0-6100-1 Development of a Precast Bridge Deck Overhang System
105
is somewhat different. Figure 3-15 presents the normalized lateral force applied to the
specimens versus the relative lateral displacement.
Figure 3-15. Plot of Normalized Lateral Force versus Relative Displacement for 2.0-in. (51 mm) and 3.5-in. (89 mm) Haunch Specimens with TR and TRC Connectors.
As mentioned above, the fastener yields when the displacements reach approximately 0.2
in. (5.1 mm). The horizontal lines on the graphs are indicative of the effective sliding coefficient
of friction. Continuous threaded rods exhibited the least amount of ductility for the 3.5-in. (89
mm) haunch system and these systems exhibited brittle shear failure of the beam. However, the
continuous threaded rod within the 2.0-in. (51 mm) haunch seemed to indicate reasonable
ductility. In general, the specimens exhibited five stages of behavior. A description of these
follows.
Initially, resistance is provided by the bond of the grout (or concrete in the case of
conventional construction) between the precast deck panels and concrete beam. This stiff system
is sustained until the bond between the grout and the panels (or shear test beam) suddenly broke.
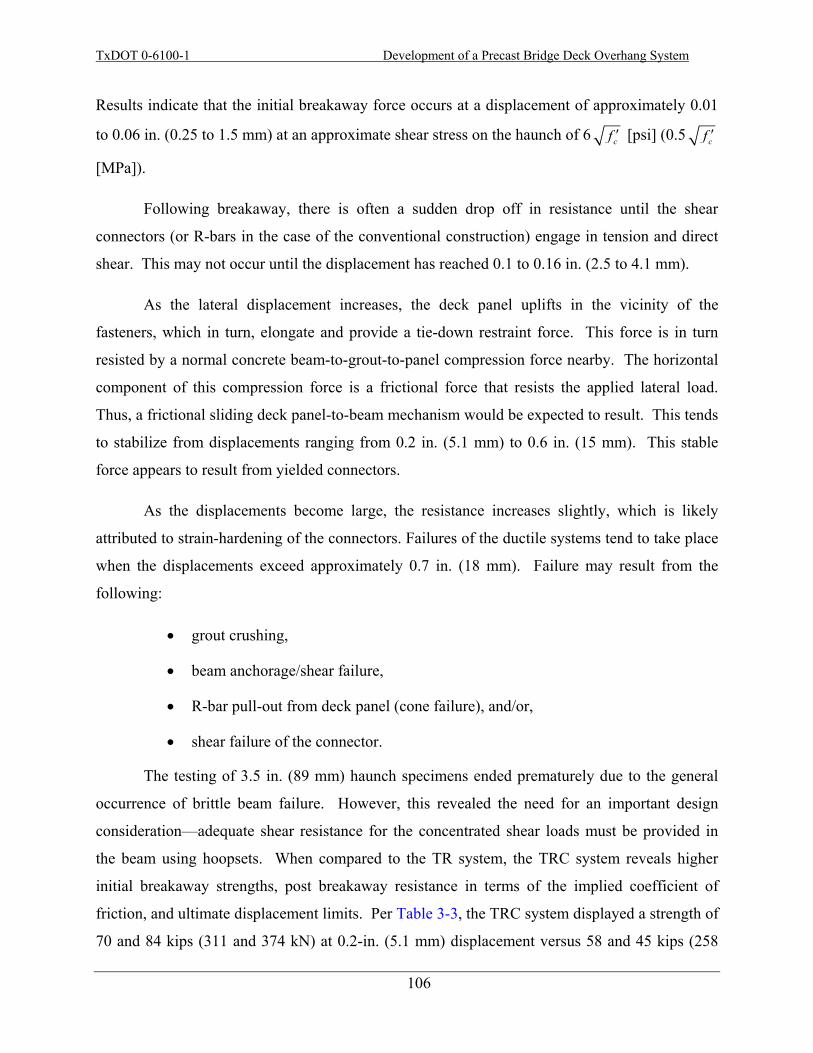
TxDOT 0-6100-1 Development of a Precast Bridge Deck Overhang System
106
Results indicate that the initial breakaway force occurs at a displacement of approximately 0.01
to 0.06 in. (0.25 to 1.5 mm) at an approximate shear stress on the haunch of 6 cf ′ [psi] (0.5 cf ′
[MPa]).
Following breakaway, there is often a sudden drop off in resistance until the shear
connectors (or R-bars in the case of the conventional construction) engage in tension and direct
shear. This may not occur until the displacement has reached 0.1 to 0.16 in. (2.5 to 4.1 mm).
As the lateral displacement increases, the deck panel uplifts in the vicinity of the
fasteners, which in turn, elongate and provide a tie-down restraint force. This force is in turn
resisted by a normal concrete beam-to-grout-to-panel compression force nearby. The horizontal
component of this compression force is a frictional force that resists the applied lateral load.
Thus, a frictional sliding deck panel-to-beam mechanism would be expected to result. This tends
to stabilize from displacements ranging from 0.2 in. (5.1 mm) to 0.6 in. (15 mm). This stable
force appears to result from yielded connectors.
As the displacements become large, the resistance increases slightly, which is likely
attributed to strain-hardening of the connectors. Failures of the ductile systems tend to take place
when the displacements exceed approximately 0.7 in. (18 mm). Failure may result from the
following:
• grout crushing,
• beam anchorage/shear failure,
• R-bar pull-out from deck panel (cone failure), and/or,
• shear failure of the connector.
The testing of 3.5 in. (89 mm) haunch specimens ended prematurely due to the general
occurrence of brittle beam failure. However, this revealed the need for an important design
consideration—adequate shear resistance for the concentrated shear loads must be provided in
the beam using hoopsets. When compared to the TR system, the TRC system reveals higher
initial breakaway strengths, post breakaway resistance in terms of the implied coefficient of
friction, and ultimate displacement limits. Per Table 3-3, the TRC system displayed a strength of
70 and 84 kips (311 and 374 kN) at 0.2-in. (5.1 mm) displacement versus 58 and 45 kips (258

TxDOT 0-6100-1 Development of a Precast Bridge Deck Overhang System
107
and 200 kN) for the TR system. As such, the TRC system seems to exhibit increased capacity
when compared with the TR system. Therefore, the TRC system will be used as a baseline for
comparison with the post-installed specimens and parametric studies. The responses of the pre-
installed (precast) shear connections tested in this phase are uniformly inferior to the R-bar
specimens, though not necessarily because of the connectors themselves. Rather, there are other
aspects of the connection that differ from the control specimen that significantly affect the
performance. These could include:
• different sliding friction performance as a result of different infill grout material between the two smooth concrete surfaces, and
• different displacement limits due to the high concentration of forces anchored in the beams.
Parametric studies were conducted to understand the effects of these issues. Specifically,
additional tests addressed in section 3.10.6.2, Effect of surface roughness, is the very same issue
identified in AASHTO LRFD C5.8.4.1, Interface Shear Transfer – Shear Friction, where
roughness can affect the shear-friction across a given plane.
3.10.4 Post-Installed Shear Connector Performance
Eight specimens were assembled using several types of post-installed connections. Such a
system would most likely be used in a situation where the pockets and cast shear connectors do
not align at the construction site. Below is a summary of the four types of post-installed
connections tested:
• B7 TRs installed in 0.16 w/p SikaGrout™ 212 (TRS) – This post-installed connection is made by coring a 2-in. (51 mm) diameter hole in the beam to a depth of 9 inches, cleaning the hole, filling it 2/3 full with the grout and inserting a TR with a nut. This system was used on the second full-scale bridge specimen and is used in four of the remaining six specimens (three singles and one double).
• HILTI Kwik-Bolt 3 (KB) – The KB is a mechanical fastener that uses an expanding collar to set the anchor in a drilled/cored hole using friction. A single 1-in. (25 mm) diameter KB was used as the shear connector in one of the specimens.
• B7 TR anchored in HILTI HY-150 Max epoxy (TRE) – HY-150 Max is a proprietary two-part epoxy made by HILTI that has reported “forgiving
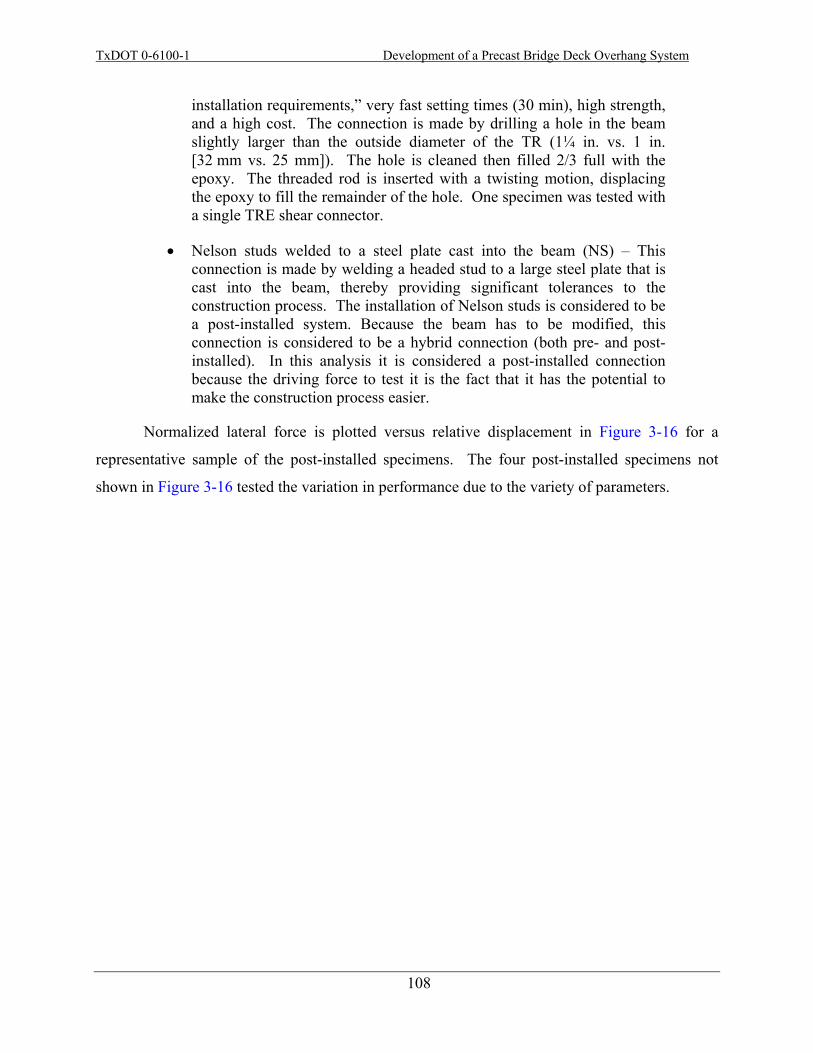
TxDOT 0-6100-1 Development of a Precast Bridge Deck Overhang System
108
installation requirements,” very fast setting times (30 min), high strength, and a high cost. The connection is made by drilling a hole in the beam slightly larger than the outside diameter of the TR (1¼ in. vs. 1 in. [32 mm vs. 25 mm]). The hole is cleaned then filled 2/3 full with the epoxy. The threaded rod is inserted with a twisting motion, displacing the epoxy to fill the remainder of the hole. One specimen was tested with a single TRE shear connector.
• Nelson studs welded to a steel plate cast into the beam (NS) – This connection is made by welding a headed stud to a large steel plate that is cast into the beam, thereby providing significant tolerances to the construction process. The installation of Nelson studs is considered to be a post-installed system. Because the beam has to be modified, this connection is considered to be a hybrid connection (both pre- and post-installed). In this analysis it is considered a post-installed connection because the driving force to test it is the fact that it has the potential to make the construction process easier.
Normalized lateral force is plotted versus relative displacement in Figure 3-16 for a
representative sample of the post-installed specimens. The four post-installed specimens not
shown in Figure 3-16 tested the variation in performance due to the variety of parameters.
TxDOT 0-6100-1 Development of a Precast Bridge Deck Overhang System
109
The 2_TRC_2.0_A plot is shown as a baseline for comparison. Figure 3-16. Plot of Normalized Lateral Force versus Relative Displacement for Each Type
of Post-Installed Specimen.
3.10.5 Comparison between Post-Installed and Pre-Installed Shear Connections
Each of the post-installed shear connection specimens exhibited the same five general stages of
behavior as observed in the pre-installed (precast) specimens. As seen in the normalized plots in
Figure 3-16, both the TRS and TRE systems performed comparably to the baseline pre-installed
(TRC) system in terms of both strength and ductility. The NS system appears to provide
appreciably higher strength than the baseline without sacrificing ductility. The KB system also
provides good ductility but the strength is noticeably less than the baseline.
Aside from performance, there are constructability concerns with several of the connector
types. There are concerns regarding the practicality of using the KB and TRE systems on a large
scale due to their proprietary systems and associated costs. The feasibility of a truly post-

TxDOT 0-6100-1 Development of a Precast Bridge Deck Overhang System
110
installed NS system has not been established, as both the top and bottom studs were welded to
the plates prior to casting in the shear beams for these tests. The potential primary logistical
issue is with the sizeable grounding clamp/magnet required for such a large amperage weld
conflicting with stud welding gun and the studs themselves in the relatively small pocket. Until
this issue is resolved, the NS system is not a viable option for construction with precast girders,
though it may have potential for application within a steel girder bridge.
3.10.6 Parametric Studies
Parametric studies were conducted with both the pre-installed (precast) and post-installed test
specimen sets to study the effects of varying parameters such as haunch height, surface
roughness, alternative grout, and grouping of the connectors on the performance of the
deck-haunch-beam system.
3.10.6.1 Effect of 2.0-in. (51 mm) versus 3.5-in. (89 mm) Haunch Tests conducted with the 2.0-in. (51 mm) haunch revealed adequate ductility, where the
specimens with threaded rods and couplers revealed the largest breakaway resistance, peak load,
and ultimate displacement, as shown in Figure 3-17. However, the results of varying the haunch
height are inconclusive due to the brittle beam failure that limited displacements to less than
0.2 in. (5.1 mm), as seen in Figure 3-18. Brittle shear failure in the beam could not be improved
in this phase because the beams used for the research were already cast with the same hoopset
design. Additional testing is necessary to verify the effect of the haunch height on the
deck-haunch-beam system. However, it is known that a larger overturning moment is inherently
induced, given a taller haunch.
TxDOT 0-6100-1 Development of a Precast Bridge Deck Overhang System
111
Figure 3-17. Plot of Normalized Lateral Force versus Relative Displacement for All 2.0-in. (51 mm) Haunch Pre-Installed (Precast) Specimens.
Figure 3-18. Plot of Normalized Lateral Force versus Relative Displacement for All 3.5-in. (89 mm) Haunch Pre-Installed (Precast) Specimens along with the 2_TRC_2.0_A as a
Baseline for Comparison.
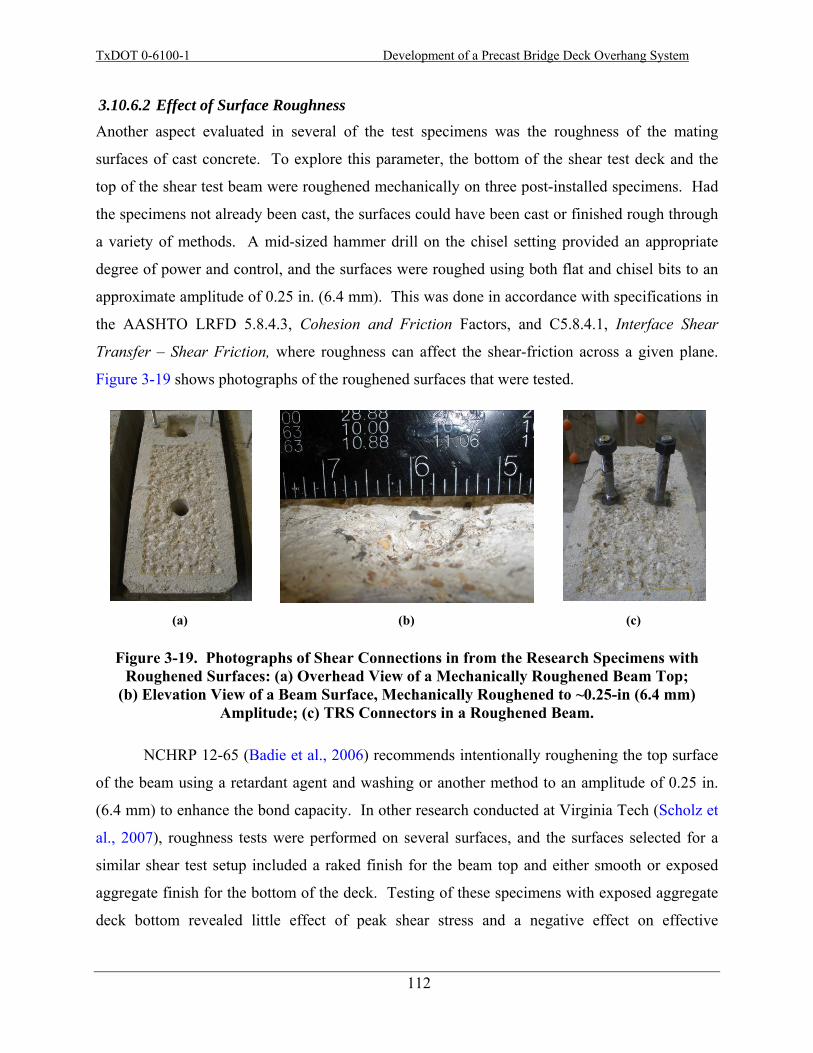
TxDOT 0-6100-1 Development of a Precast Bridge Deck Overhang System
112
3.10.6.2 Effect of Surface Roughness Another aspect evaluated in several of the test specimens was the roughness of the mating
surfaces of cast concrete. To explore this parameter, the bottom of the shear test deck and the
top of the shear test beam were roughened mechanically on three post-installed specimens. Had
the specimens not already been cast, the surfaces could have been cast or finished rough through
a variety of methods. A mid-sized hammer drill on the chisel setting provided an appropriate
degree of power and control, and the surfaces were roughed using both flat and chisel bits to an
approximate amplitude of 0.25 in. (6.4 mm). This was done in accordance with specifications in
the AASHTO LRFD 5.8.4.3, Cohesion and Friction Factors, and C5.8.4.1, Interface Shear
Transfer – Shear Friction, where roughness can affect the shear-friction across a given plane.
Figure 3-19 shows photographs of the roughened surfaces that were tested.
(a)
(b)
(c)
Figure 3-19. Photographs of Shear Connections in from the Research Specimens with Roughened Surfaces: (a) Overhead View of a Mechanically Roughened Beam Top;
(b) Elevation View of a Beam Surface, Mechanically Roughened to ~0.25-in (6.4 mm) Amplitude; (c) TRS Connectors in a Roughened Beam.
NCHRP 12-65 (Badie et al., 2006) recommends intentionally roughening the top surface
of the beam using a retardant agent and washing or another method to an amplitude of 0.25 in.
(6.4 mm) to enhance the bond capacity. In other research conducted at Virginia Tech (Scholz et
al., 2007), roughness tests were performed on several surfaces, and the surfaces selected for a
similar shear test setup included a raked finish for the beam top and either smooth or exposed
aggregate finish for the bottom of the deck. Testing of these specimens with exposed aggregate
deck bottom revealed little effect of peak shear stress and a negative effect on effective
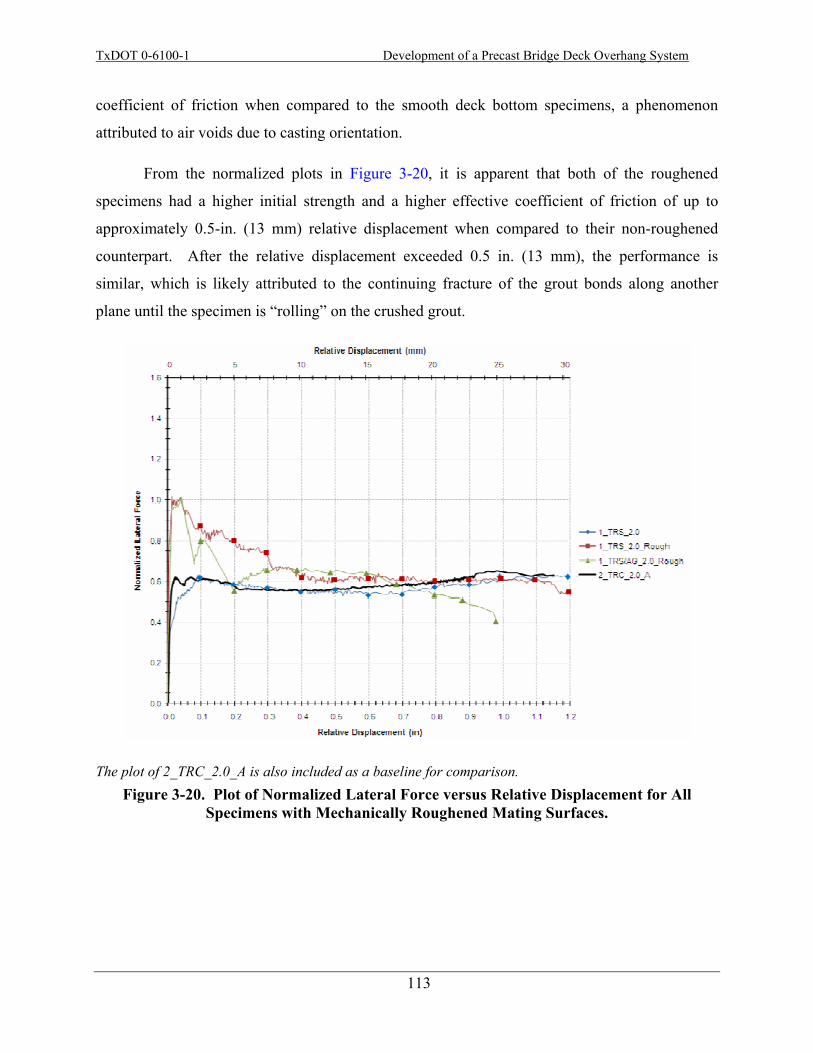
TxDOT 0-6100-1 Development of a Precast Bridge Deck Overhang System
113
coefficient of friction when compared to the smooth deck bottom specimens, a phenomenon
attributed to air voids due to casting orientation.
From the normalized plots in Figure 3-20, it is apparent that both of the roughened
specimens had a higher initial strength and a higher effective coefficient of friction of up to
approximately 0.5-in. (13 mm) relative displacement when compared to their non-roughened
counterpart. After the relative displacement exceeded 0.5 in. (13 mm), the performance is
similar, which is likely attributed to the continuing fracture of the grout bonds along another
plane until the specimen is “rolling” on the crushed grout.
The plot of 2_TRC_2.0_A is also included as a baseline for comparison. Figure 3-20. Plot of Normalized Lateral Force versus Relative Displacement for All
Specimens with Mechanically Roughened Mating Surfaces.
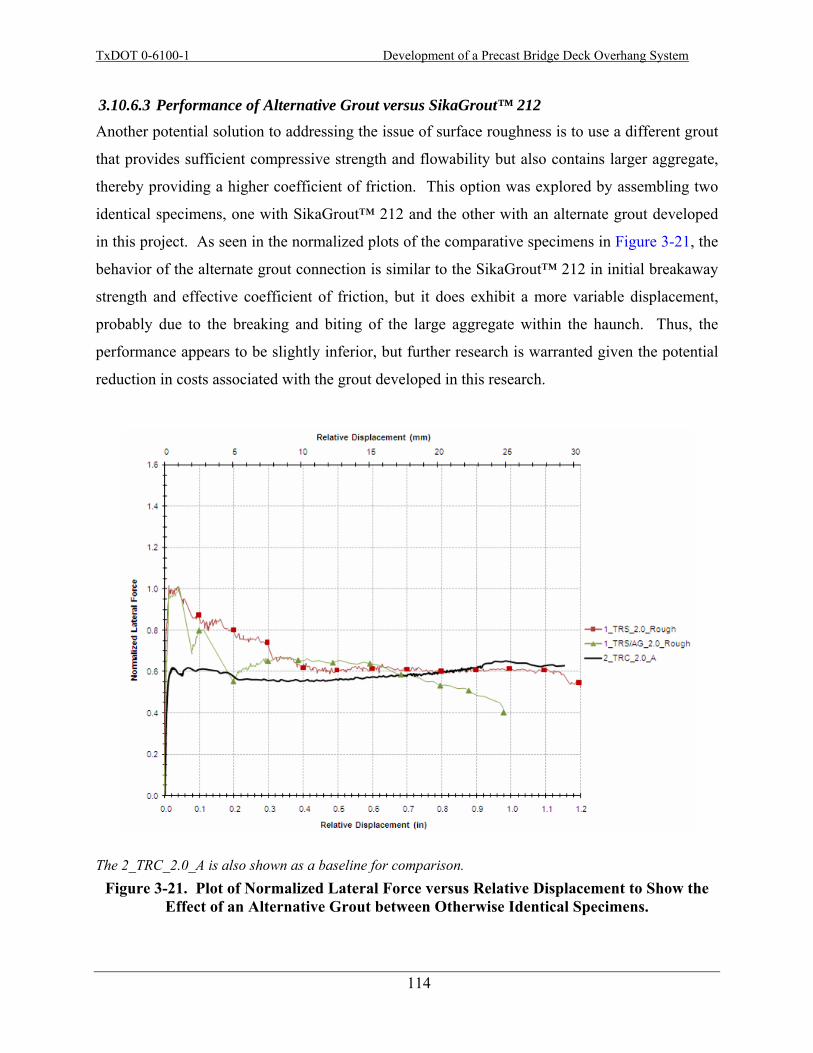
TxDOT 0-6100-1 Development of a Precast Bridge Deck Overhang System
114
3.10.6.3 Performance of Alternative Grout versus SikaGrout™ 212 Another potential solution to addressing the issue of surface roughness is to use a different grout
that provides sufficient compressive strength and flowability but also contains larger aggregate,
thereby providing a higher coefficient of friction. This option was explored by assembling two
identical specimens, one with SikaGrout™ 212 and the other with an alternate grout developed
in this project. As seen in the normalized plots of the comparative specimens in Figure 3-21, the
behavior of the alternate grout connection is similar to the SikaGrout™ 212 in initial breakaway
strength and effective coefficient of friction, but it does exhibit a more variable displacement,
probably due to the breaking and biting of the large aggregate within the haunch. Thus, the
performance appears to be slightly inferior, but further research is warranted given the potential
reduction in costs associated with the grout developed in this research.
The 2_TRC_2.0_A is also shown as a baseline for comparison. Figure 3-21. Plot of Normalized Lateral Force versus Relative Displacement to Show the
Effect of an Alternative Grout between Otherwise Identical Specimens.
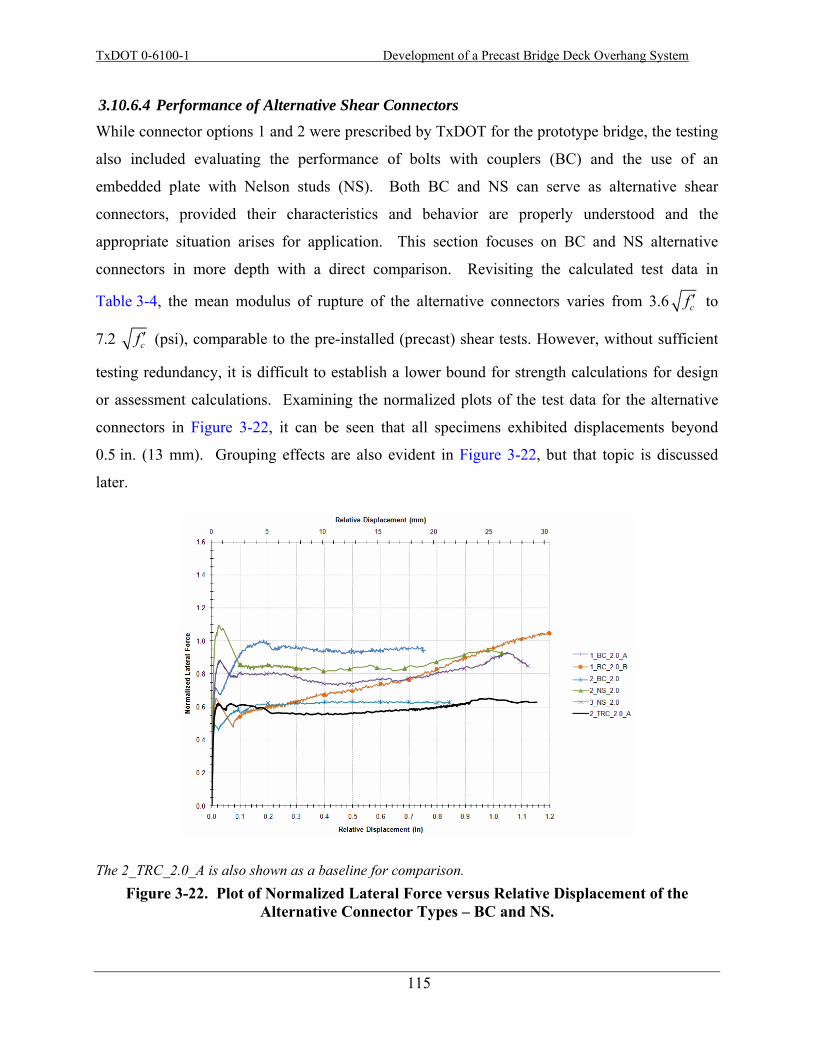
TxDOT 0-6100-1 Development of a Precast Bridge Deck Overhang System
115
3.10.6.4 Performance of Alternative Shear Connectors While connector options 1 and 2 were prescribed by TxDOT for the prototype bridge, the testing
also included evaluating the performance of bolts with couplers (BC) and the use of an
embedded plate with Nelson studs (NS). Both BC and NS can serve as alternative shear
connectors, provided their characteristics and behavior are properly understood and the
appropriate situation arises for application. This section focuses on BC and NS alternative
connectors in more depth with a direct comparison. Revisiting the calculated test data in
Table 3-4, the mean modulus of rupture of the alternative connectors varies from 3.6 cf ′ to
7.2 cf ′ (psi), comparable to the pre-installed (precast) shear tests. However, without sufficient
testing redundancy, it is difficult to establish a lower bound for strength calculations for design
or assessment calculations. Examining the normalized plots of the test data for the alternative
connectors in Figure 3-22, it can be seen that all specimens exhibited displacements beyond
0.5 in. (13 mm). Grouping effects are also evident in Figure 3-22, but that topic is discussed
later.
The 2_TRC_2.0_A is also shown as a baseline for comparison. Figure 3-22. Plot of Normalized Lateral Force versus Relative Displacement of the
Alternative Connector Types – BC and NS.

TxDOT 0-6100-1 Development of a Precast Bridge Deck Overhang System
116
A key reason for selecting the NS connection setup was to mimic previous research
performed at Virginia Polytechnic Institute and State University for the Virginia Transportation
Research Council (VTRC) (Scholz et al., 2007). This research dealt primarily with the grout
material to be used in a pocketed shear connection, but it also included shear tests of Nelson
studs installed much the same way the NS specimens were prepared for this report. The VTRC
Nelson stud specimens were assembled with 2, 3, and 4 studs per specimen. After normalizing
by total connection yield, the results of the VTRC specimens and the NS specimens from this
study can be compared. Table 3-5 shows the measured and calculated values from both reports,
and the normalized results are comparable.
Table 3-5. Key Data from NS Specimens Compared with the Same Data from Similar Specimens from Previous Research (Scholz et al., 2007).
Research organization Specimen ID
Total area of shear
connector, in2 (mm2)
Yield strength of
shear connector, ksi (MPa)
Peak shear load,
kips (kN)
Sustained shear load,kips (kN)
Normalized peak shear
load
Normalized sustained shear load
VTRC 18-2NS-FSHP-SM-A 0.88 (568) 49 (338) 44 (194) 28 (125) 1.02 0.65
VTRC 20-2NS-FSHP-SM-B 0.88 (568) 49 (338) 31 (136) 23 (102) 0.72 0.53
TTI 2_NS_2.0 1.20 (776) 50 (345) 66 (294) 51 (227) 1.10 0.85
VTRC 22-3NS-FSHP-SM-A 1.33 (858) 49 (338) 58 (258) 41 (182) 0.89 0.63
VTRC 23-3NS-FSHP-SM-B 1.33 (858) 49 (338) 55 (242) 48 (212) 0.84 0.74
TTI 3_NS_2.0 1.80 (1162) 50 (345) 81 (360) 67 (300) 0.90 0.74
VTRC 19-4NS-FSHP-SM-A 1.77 (1142) 49 (338) 72 (322) 52 (230) 0.83 0.60
VTRC 21-4NS-FSHP-SM-B 1.77 (1142) 49 (338) 71 (315) 63 (282) 0.82 0.73
3.10.6.5 Grouping Effects of Shear Connectors Another parameter studied in these shear tests was the grouping effects of BC, NS, and TRS
shear connections. Due to the limited number of shear specimens tested, the connection details
of each specimen were selected to contribute to a broad introductory analysis. Consequently,
this analysis does not thoroughly explore different numbers of connectors or configurations of
connectors within the pocket, and it has very little redundancy—the reader is cautioned in
making conclusions based on the paucity of data. However, results from these tests indicate that
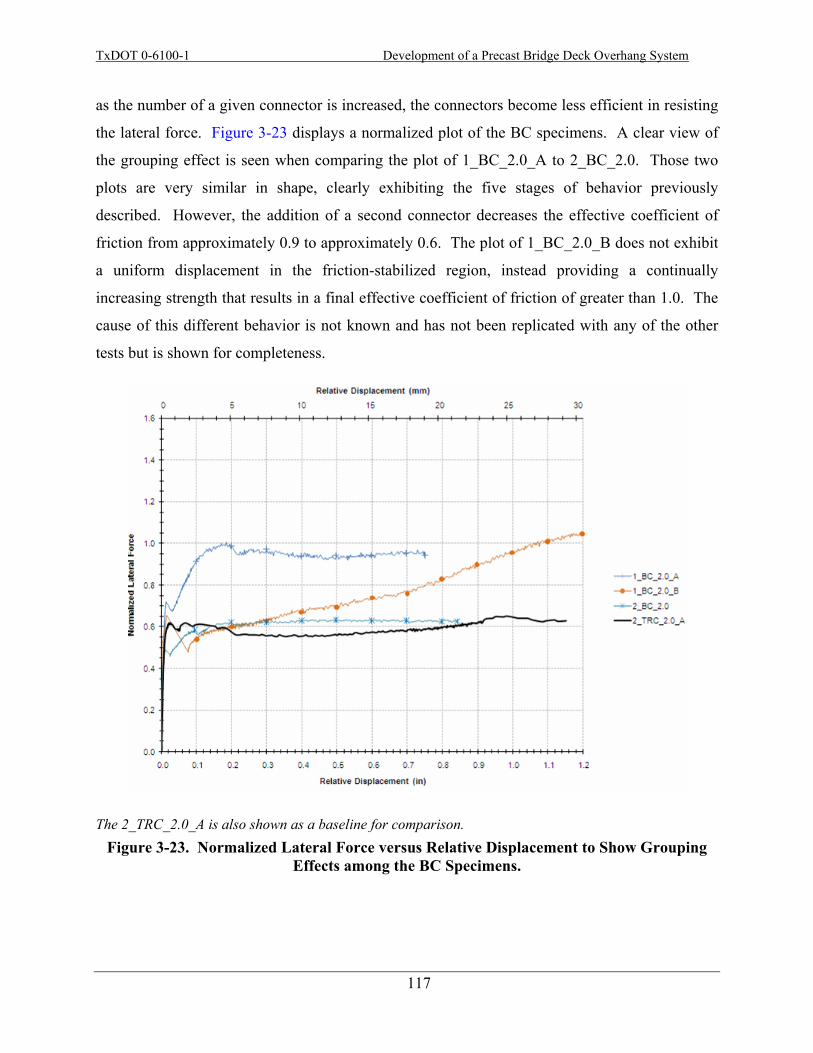
TxDOT 0-6100-1 Development of a Precast Bridge Deck Overhang System
117
as the number of a given connector is increased, the connectors become less efficient in resisting
the lateral force. Figure 3-23 displays a normalized plot of the BC specimens. A clear view of
the grouping effect is seen when comparing the plot of 1_BC_2.0_A to 2_BC_2.0. Those two
plots are very similar in shape, clearly exhibiting the five stages of behavior previously
described. However, the addition of a second connector decreases the effective coefficient of
friction from approximately 0.9 to approximately 0.6. The plot of 1_BC_2.0_B does not exhibit
a uniform displacement in the friction-stabilized region, instead providing a continually
increasing strength that results in a final effective coefficient of friction of greater than 1.0. The
cause of this different behavior is not known and has not been replicated with any of the other
tests but is shown for completeness.
The 2_TRC_2.0_A is also shown as a baseline for comparison. Figure 3-23. Normalized Lateral Force versus Relative Displacement to Show Grouping
Effects among the BC Specimens.
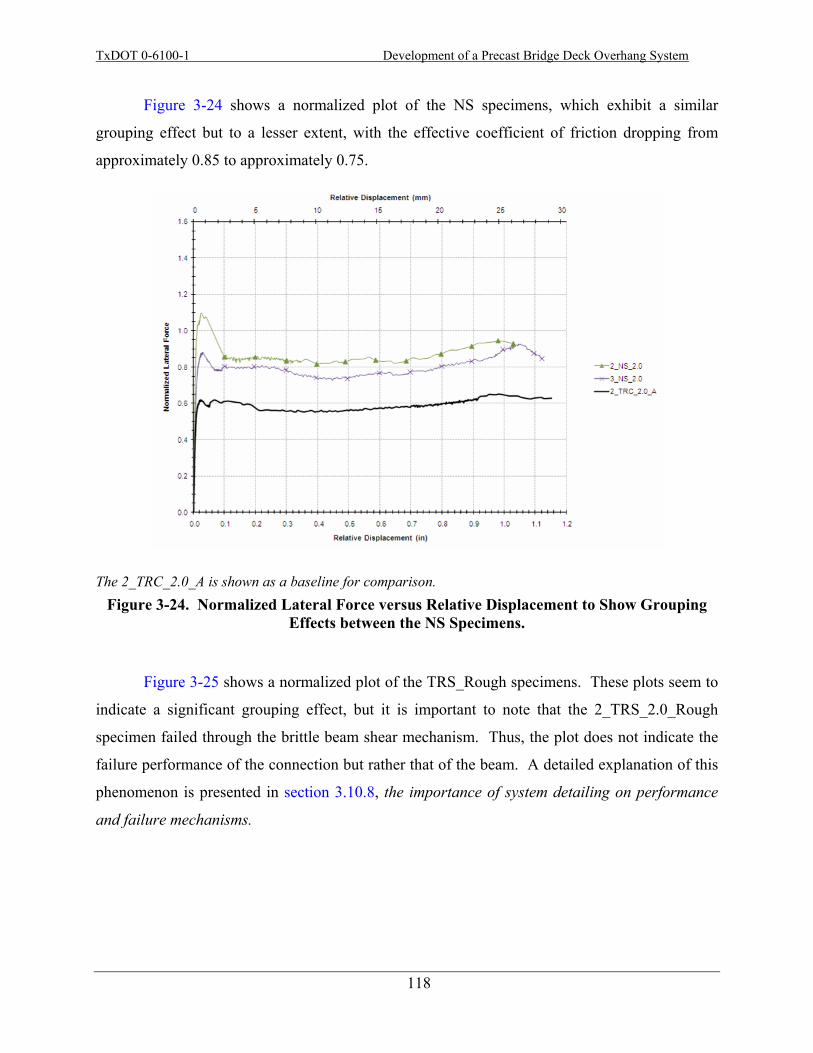
TxDOT 0-6100-1 Development of a Precast Bridge Deck Overhang System
118
Figure 3-24 shows a normalized plot of the NS specimens, which exhibit a similar
grouping effect but to a lesser extent, with the effective coefficient of friction dropping from
approximately 0.85 to approximately 0.75.
The 2_TRC_2.0_A is shown as a baseline for comparison. Figure 3-24. Normalized Lateral Force versus Relative Displacement to Show Grouping
Effects between the NS Specimens.
Figure 3-25 shows a normalized plot of the TRS_Rough specimens. These plots seem to
indicate a significant grouping effect, but it is important to note that the 2_TRS_2.0_Rough
specimen failed through the brittle beam shear mechanism. Thus, the plot does not indicate the
failure performance of the connection but rather that of the beam. A detailed explanation of this
phenomenon is presented in section 3.10.8, the importance of system detailing on performance
and failure mechanisms.
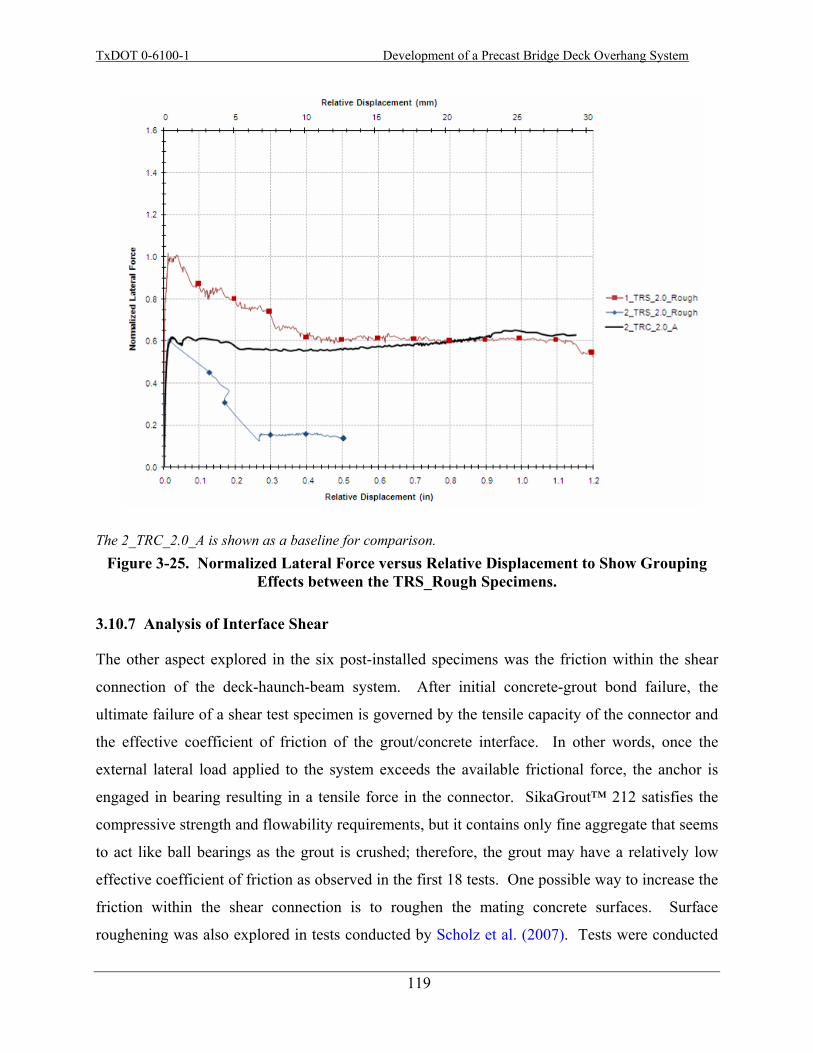
TxDOT 0-6100-1 Development of a Precast Bridge Deck Overhang System
119
The 2_TRC_2.0_A is shown as a baseline for comparison. Figure 3-25. Normalized Lateral Force versus Relative Displacement to Show Grouping
Effects between the TRS_Rough Specimens.
3.10.7 Analysis of Interface Shear
The other aspect explored in the six post-installed specimens was the friction within the shear
connection of the deck-haunch-beam system. After initial concrete-grout bond failure, the
ultimate failure of a shear test specimen is governed by the tensile capacity of the connector and
the effective coefficient of friction of the grout/concrete interface. In other words, once the
external lateral load applied to the system exceeds the available frictional force, the anchor is
engaged in bearing resulting in a tensile force in the connector. SikaGrout™ 212 satisfies the
compressive strength and flowability requirements, but it contains only fine aggregate that seems
to act like ball bearings as the grout is crushed; therefore, the grout may have a relatively low
effective coefficient of friction as observed in the first 18 tests. One possible way to increase the
friction within the shear connection is to roughen the mating concrete surfaces. Surface
roughening was also explored in tests conducted by Scholz et al. (2007). Tests were conducted
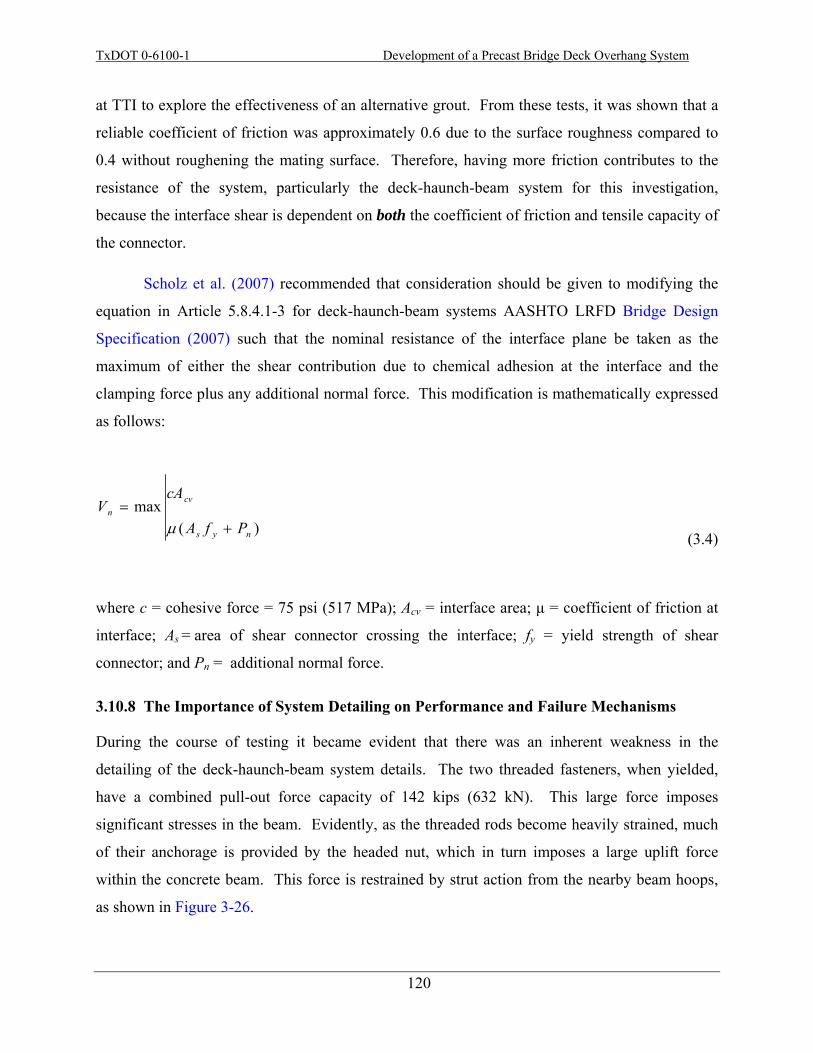
TxDOT 0-6100-1 Development of a Precast Bridge Deck Overhang System
120
at TTI to explore the effectiveness of an alternative grout. From these tests, it was shown that a
reliable coefficient of friction was approximately 0.6 due to the surface roughness compared to
0.4 without roughening the mating surface. Therefore, having more friction contributes to the
resistance of the system, particularly the deck-haunch-beam system for this investigation,
because the interface shear is dependent on both the coefficient of friction and tensile capacity of
the connector.
Scholz et al. (2007) recommended that consideration should be given to modifying the
equation in Article 5.8.4.1-3 for deck-haunch-beam systems AASHTO LRFD Bridge Design
Specification (2007) such that the nominal resistance of the interface plane be taken as the
maximum of either the shear contribution due to chemical adhesion at the interface and the
clamping force plus any additional normal force. This modification is mathematically expressed
as follows:
)(max
nys
cvn
PfA
cAV
+=
μ (3.4)
where c = cohesive force = 75 psi (517 MPa); Acv = interface area; μ = coefficient of friction at
interface; As = area of shear connector crossing the interface; fy = yield strength of shear
connector; and Pn = additional normal force.
3.10.8 The Importance of System Detailing on Performance and Failure Mechanisms
During the course of testing it became evident that there was an inherent weakness in the
detailing of the deck-haunch-beam system details. The two threaded fasteners, when yielded,
have a combined pull-out force capacity of 142 kips (632 kN). This large force imposes
significant stresses in the beam. Evidently, as the threaded rods become heavily strained, much
of their anchorage is provided by the headed nut, which in turn imposes a large uplift force
within the concrete beam. This force is restrained by strut action from the nearby beam hoops,
as shown in Figure 3-26.
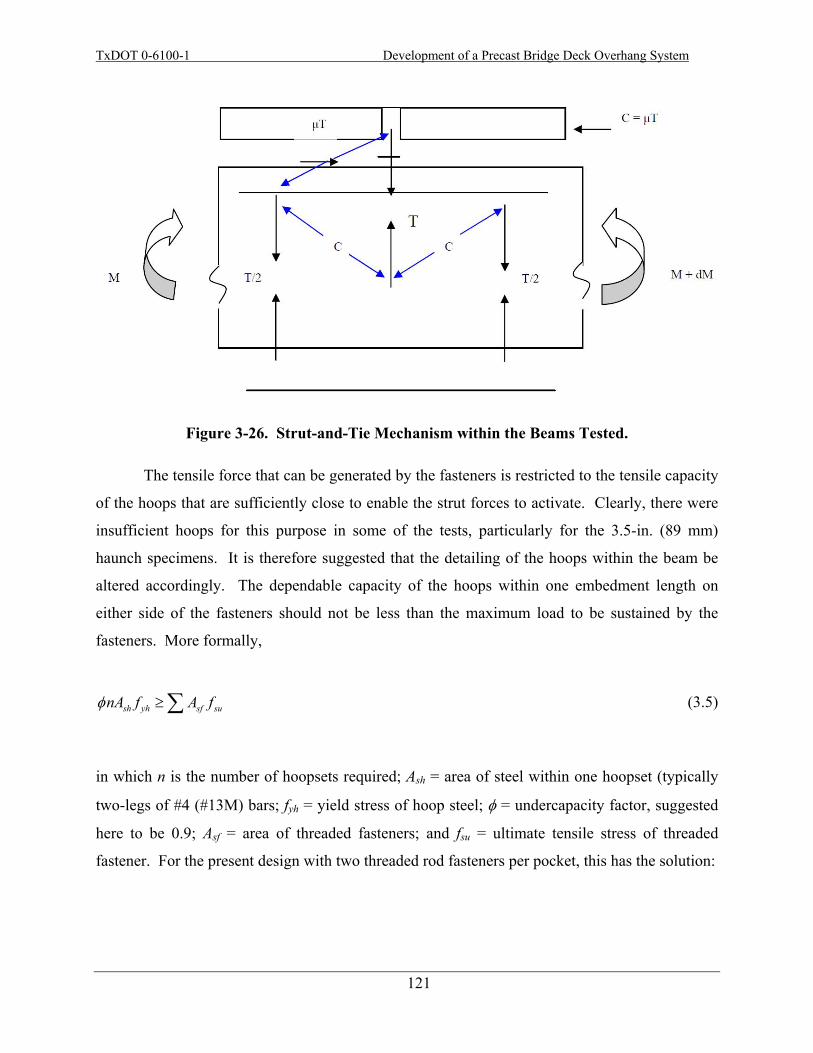
TxDOT 0-6100-1 Development of a Precast Bridge Deck Overhang System
121
Figure 3-26. Strut-and-Tie Mechanism within the Beams Tested.
The tensile force that can be generated by the fasteners is restricted to the tensile capacity
of the hoops that are sufficiently close to enable the strut forces to activate. Clearly, there were
insufficient hoops for this purpose in some of the tests, particularly for the 3.5-in. (89 mm)
haunch specimens. It is therefore suggested that the detailing of the hoops within the beam be
altered accordingly. The dependable capacity of the hoops within one embedment length on
either side of the fasteners should not be less than the maximum load to be sustained by the
fasteners. More formally,
sh yh sf sunA f A fφ ≥ ∑ (3.5)
in which n is the number of hoopsets required; Ash = area of steel within one hoopset (typically
two-legs of #4 (#13M) bars; fyh = yield stress of hoop steel; φ = undercapacity factor, suggested
here to be 0.9; Asf = area of threaded fasteners; and fsu = ultimate tensile stress of threaded
fastener. For the present design with two threaded rod fasteners per pocket, this has the solution:
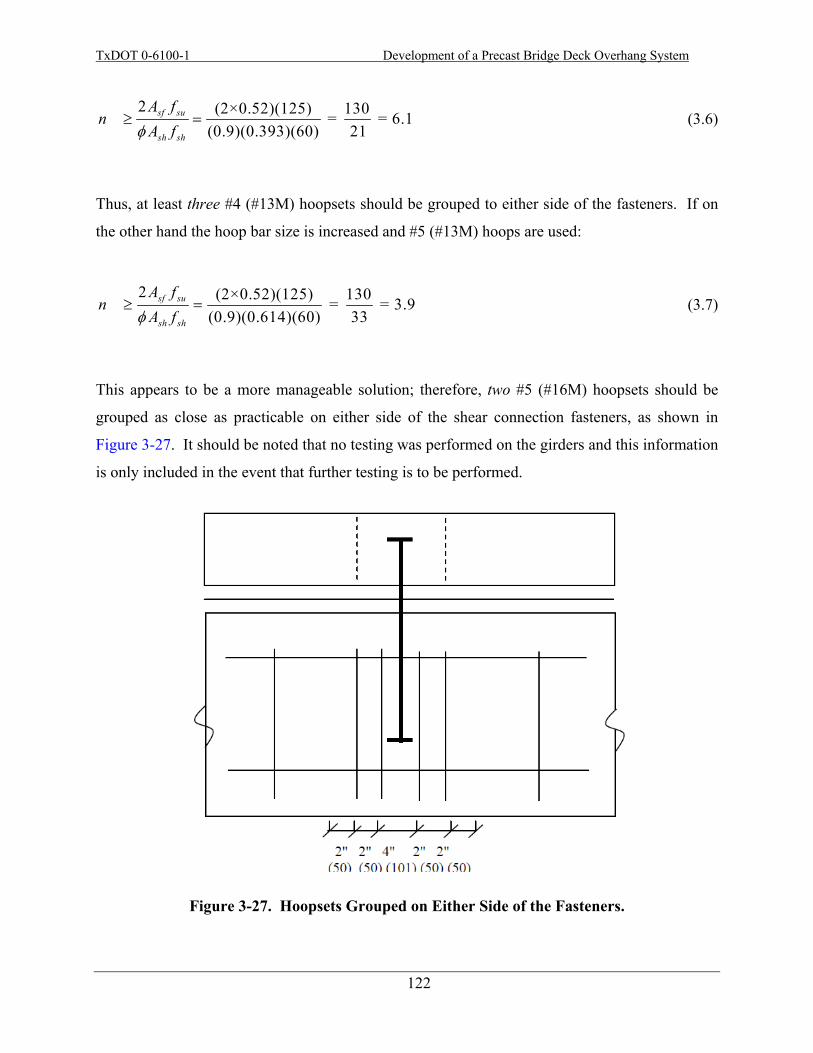
TxDOT 0-6100-1 Development of a Precast Bridge Deck Overhang System
122
2 (2×0.52)(125) 130 = = 6.1(0.9)(0.393)(60) 21
sf su
sh sh
A fn
A fφ≥ = (3.6)
Thus, at least three #4 (#13M) hoopsets should be grouped to either side of the fasteners. If on
the other hand the hoop bar size is increased and #5 (#13M) hoops are used:
2 (2×0.52)(125) 130 = = 3.9(0.9)(0.614)(60) 33
sf su
sh sh
A fn
A fφ≥ = (3.7)
This appears to be a more manageable solution; therefore, two #5 (#16M) hoopsets should be
grouped as close as practicable on either side of the shear connection fasteners, as shown in
Figure 3-27. It should be noted that no testing was performed on the girders and this information
is only included in the event that further testing is to be performed.
Figure 3-27. Hoopsets Grouped on Either Side of the Fasteners.
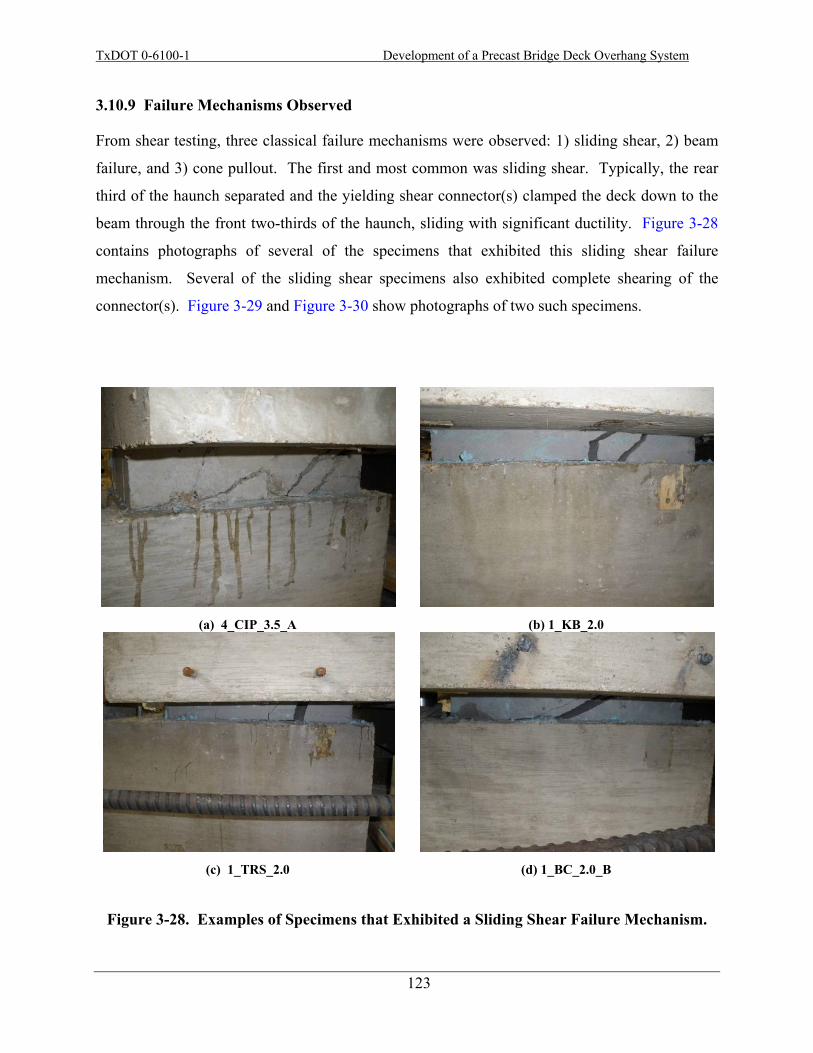
TxDOT 0-6100-1 Development of a Precast Bridge Deck Overhang System
123
3.10.9 Failure Mechanisms Observed
From shear testing, three classical failure mechanisms were observed: 1) sliding shear, 2) beam
failure, and 3) cone pullout. The first and most common was sliding shear. Typically, the rear
third of the haunch separated and the yielding shear connector(s) clamped the deck down to the
beam through the front two-thirds of the haunch, sliding with significant ductility. Figure 3-28
contains photographs of several of the specimens that exhibited this sliding shear failure
mechanism. Several of the sliding shear specimens also exhibited complete shearing of the
connector(s). Figure 3-29 and Figure 3-30 show photographs of two such specimens.
(a) 4_CIP_3.5_A (b) 1_KB_2.0
(c) 1_TRS_2.0
(d) 1_BC_2.0_B
Figure 3-28. Examples of Specimens that Exhibited a Sliding Shear Failure Mechanism.
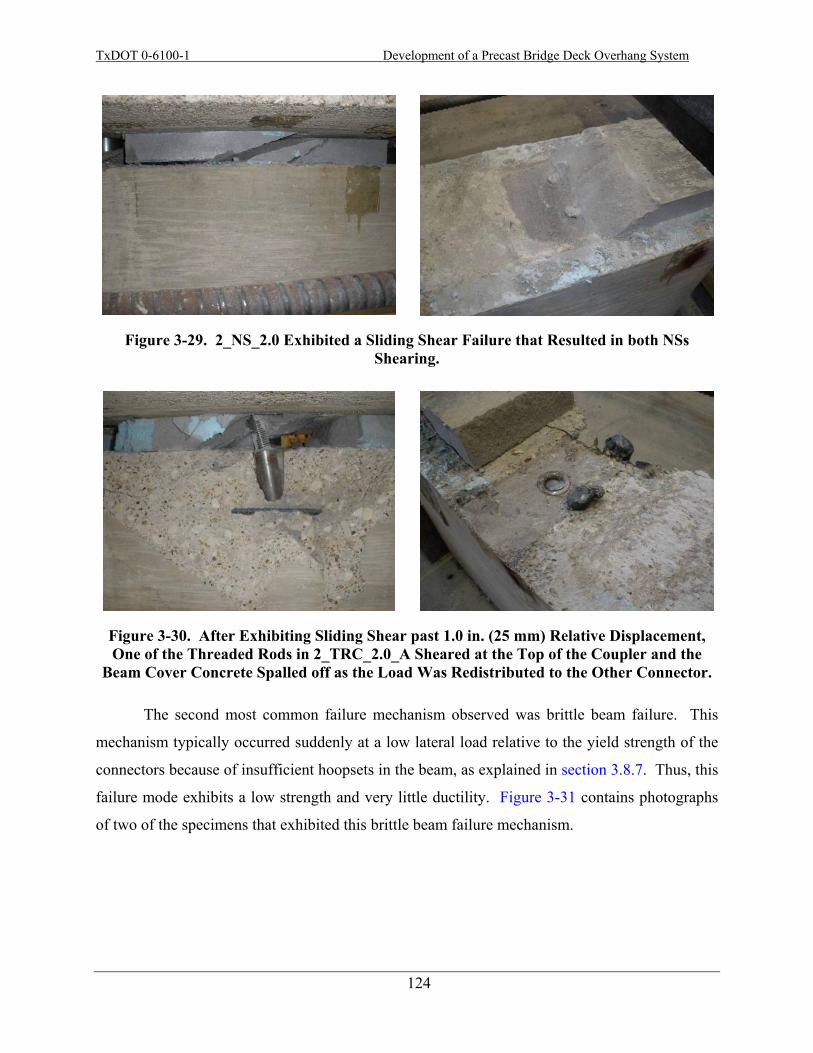
TxDOT 0-6100-1 Development of a Precast Bridge Deck Overhang System
124
Figure 3-29. 2_NS_2.0 Exhibited a Sliding Shear Failure that Resulted in both NSs Shearing.
Figure 3-30. After Exhibiting Sliding Shear past 1.0 in. (25 mm) Relative Displacement, One of the Threaded Rods in 2_TRC_2.0_A Sheared at the Top of the Coupler and the
Beam Cover Concrete Spalled off as the Load Was Redistributed to the Other Connector.
The second most common failure mechanism observed was brittle beam failure. This
mechanism typically occurred suddenly at a low lateral load relative to the yield strength of the
connectors because of insufficient hoopsets in the beam, as explained in section 3.8.7. Thus, this
failure mode exhibits a low strength and very little ductility. Figure 3-31 contains photographs
of two of the specimens that exhibited this brittle beam failure mechanism.

TxDOT 0-6100-1 Development of a Precast Bridge Deck Overhang System
125
(a) 2_TR_3.5_B
(b) 2_TRS_2.0_Rough
Figure 3-31. Photographs of Shear Test Specimens that Exhibited a Brittle Beam Failure.
Figure 3-32 shows the force-displacement plot comparing 2_TR_2.0_A (not intentionally
roughened), 2.0_TR_2.0_B (not intentionally roughened), and 2_TRS_2.0_Rough. Specimen
2_TRS_2.0_Rough exhibited a different failure mechanism. Figure 3-33 shows photographs of
the failure mechanisms revealed from 2_TR_2.0_B. Observing this performance supports the
need for adequate shear reinforcement in the beam to avoid this brittle beam failure. The final
failure mechanism observed was a cone pullout failure. This failure mechanism is similar to the
brittle beam failure mechanism but exhibits significantly higher strength and more ductility prior
to failure. Figure 3-34 shows several photographs from one of the specimens that exhibited a
cone pullout failure.
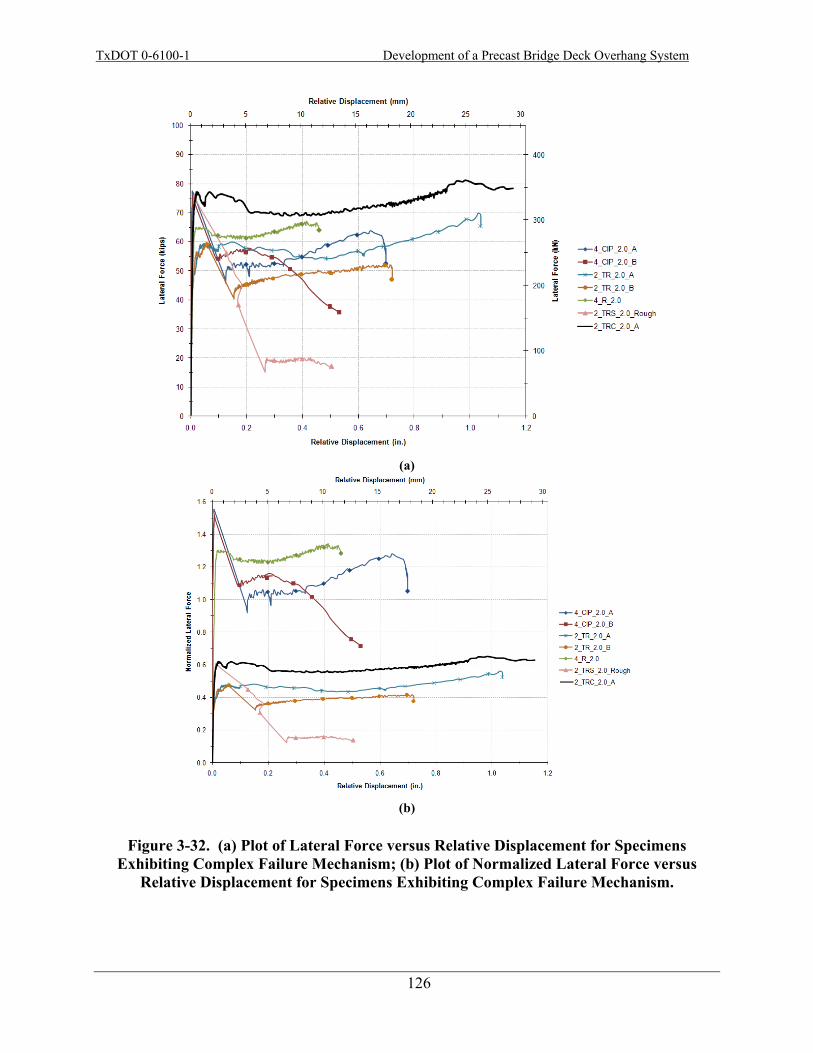
TxDOT 0-6100-1 Development of a Precast Bridge Deck Overhang System
126
(a)
(b)
Figure 3-32. (a) Plot of Lateral Force versus Relative Displacement for Specimens Exhibiting Complex Failure Mechanism; (b) Plot of Normalized Lateral Force versus
Relative Displacement for Specimens Exhibiting Complex Failure Mechanism.

TxDOT 0-6100-1 Development of a Precast Bridge Deck Overhang System
127
Figure 3-33. Photographs of 2_TR_2.0_B after Testing.
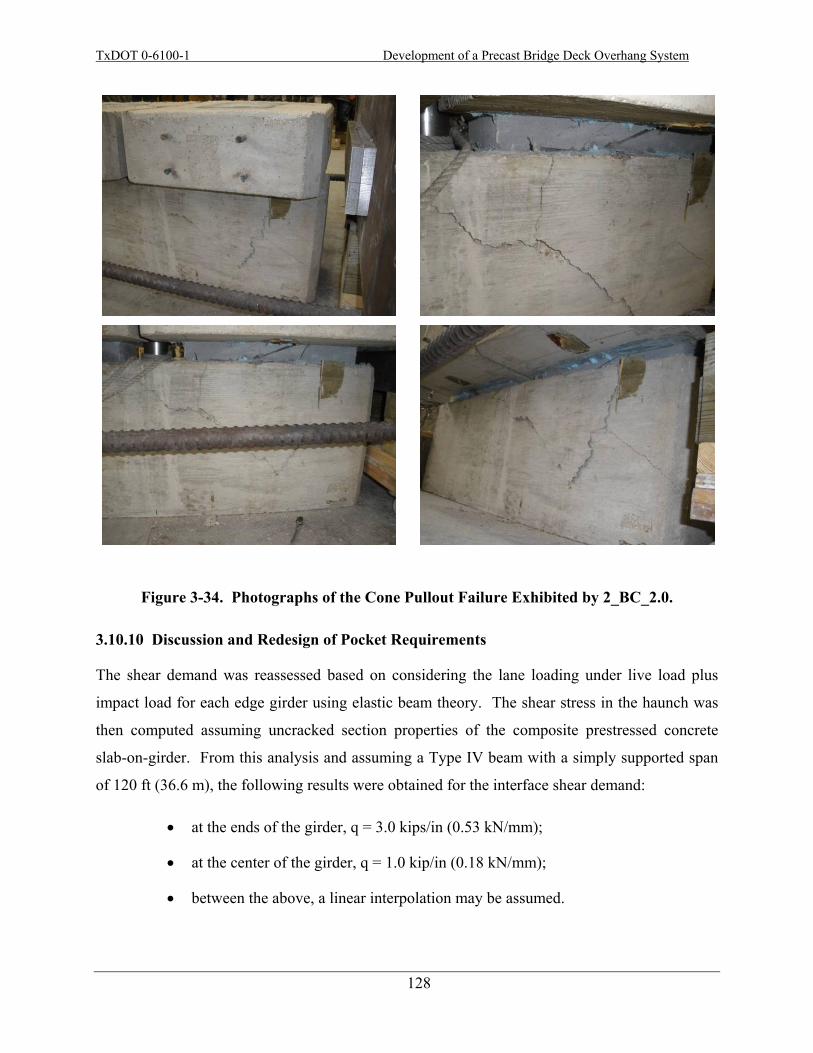
TxDOT 0-6100-1 Development of a Precast Bridge Deck Overhang System
128
Figure 3-34. Photographs of the Cone Pullout Failure Exhibited by 2_BC_2.0.
3.10.10 Discussion and Redesign of Pocket Requirements
The shear demand was reassessed based on considering the lane loading under live load plus
impact load for each edge girder using elastic beam theory. The shear stress in the haunch was
then computed assuming uncracked section properties of the composite prestressed concrete
slab-on-girder. From this analysis and assuming a Type IV beam with a simply supported span
of 120 ft (36.6 m), the following results were obtained for the interface shear demand:
• at the ends of the girder, q = 3.0 kips/in (0.53 kN/mm);
• at the center of the girder, q = 1.0 kip/in (0.18 kN/mm);
• between the above, a linear interpolation may be assumed.
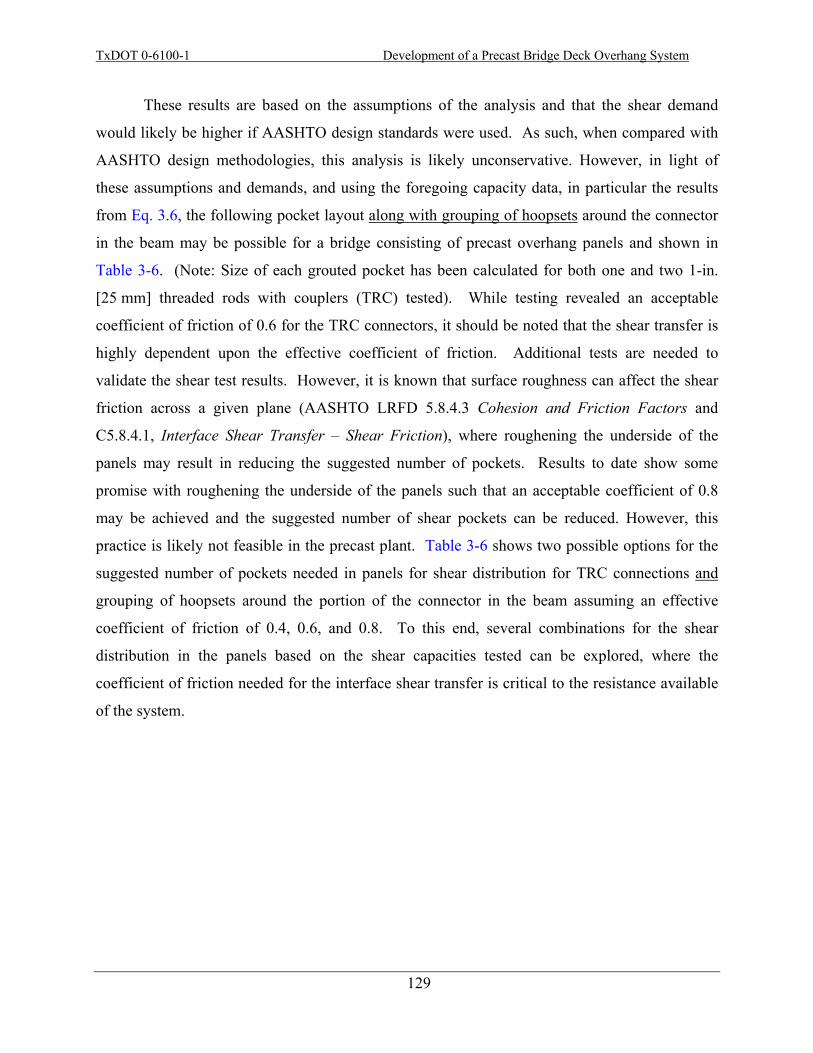
TxDOT 0-6100-1 Development of a Precast Bridge Deck Overhang System
129
These results are based on the assumptions of the analysis and that the shear demand
would likely be higher if AASHTO design standards were used. As such, when compared with
AASHTO design methodologies, this analysis is likely unconservative. However, in light of
these assumptions and demands, and using the foregoing capacity data, in particular the results
from Eq. 3.6, the following pocket layout along with grouping of hoopsets around the connector
in the beam may be possible for a bridge consisting of precast overhang panels and shown in
Table 3-6. (Note: Size of each grouted pocket has been calculated for both one and two 1-in.
[25 mm] threaded rods with couplers (TRC) tested). While testing revealed an acceptable
coefficient of friction of 0.6 for the TRC connectors, it should be noted that the shear transfer is
highly dependent upon the effective coefficient of friction. Additional tests are needed to
validate the shear test results. However, it is known that surface roughness can affect the shear
friction across a given plane (AASHTO LRFD 5.8.4.3 Cohesion and Friction Factors and
C5.8.4.1, Interface Shear Transfer – Shear Friction), where roughening the underside of the
panels may result in reducing the suggested number of pockets. Results to date show some
promise with roughening the underside of the panels such that an acceptable coefficient of 0.8
may be achieved and the suggested number of shear pockets can be reduced. However, this
practice is likely not feasible in the precast plant. Table 3-6 shows two possible options for the
suggested number of pockets needed in panels for shear distribution for TRC connections and
grouping of hoopsets around the portion of the connector in the beam assuming an effective
coefficient of friction of 0.4, 0.6, and 0.8. To this end, several combinations for the shear
distribution in the panels based on the shear capacities tested can be explored, where the
coefficient of friction needed for the interface shear transfer is critical to the resistance available
of the system.
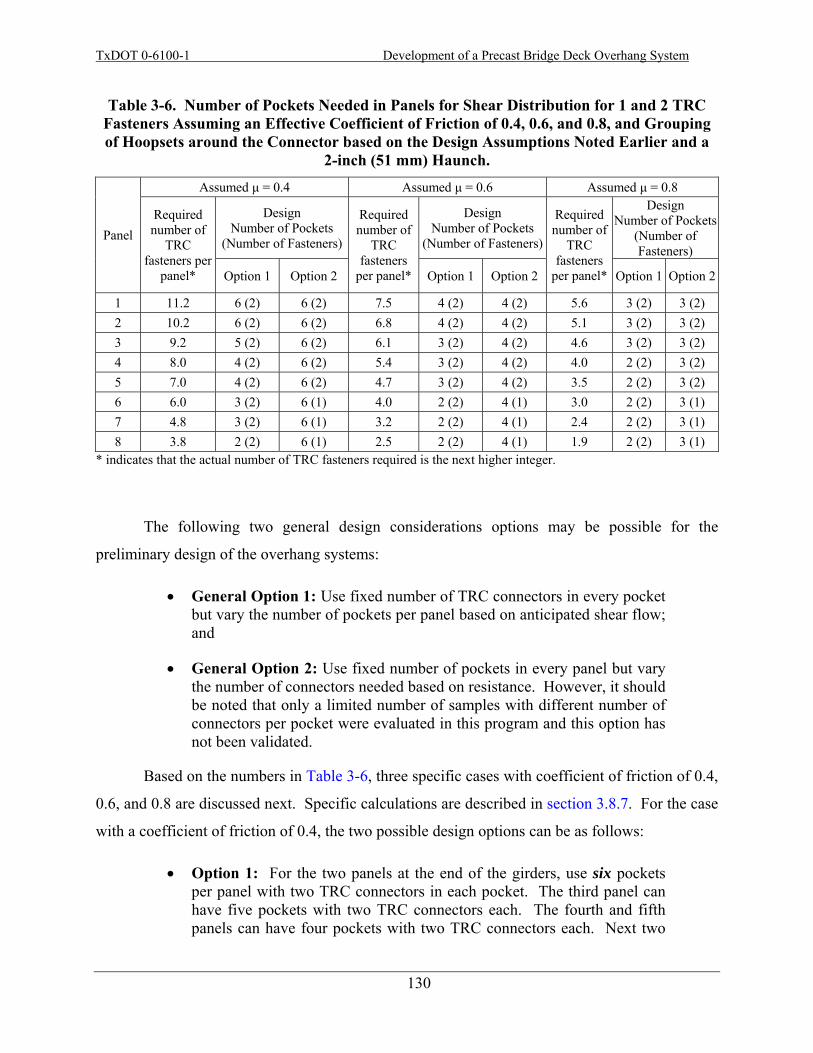
TxDOT 0-6100-1 Development of a Precast Bridge Deck Overhang System
130
Table 3-6. Number of Pockets Needed in Panels for Shear Distribution for 1 and 2 TRC Fasteners Assuming an Effective Coefficient of Friction of 0.4, 0.6, and 0.8, and Grouping of Hoopsets around the Connector based on the Design Assumptions Noted Earlier and a
2-inch (51 mm) Haunch.
Panel
Assumed μ = 0.4 Assumed μ = 0.6 Assumed μ = 0.8
Required number of
TRC fasteners per
panel*
Design Number of Pockets
(Number of Fasteners)
Required number of
TRC fasteners
per panel*
Design Number of Pockets
(Number of Fasteners)
Required number of
TRC fasteners
per panel*
Design Number of Pockets
(Number of Fasteners)
Option 1 Option 2 Option 1 Option 2 Option 1 Option 2
1 11.2 6 (2) 6 (2) 7.5 4 (2) 4 (2) 5.6 3 (2) 3 (2) 2 10.2 6 (2) 6 (2) 6.8 4 (2) 4 (2) 5.1 3 (2) 3 (2) 3 9.2 5 (2) 6 (2) 6.1 3 (2) 4 (2) 4.6 3 (2) 3 (2) 4 8.0 4 (2) 6 (2) 5.4 3 (2) 4 (2) 4.0 2 (2) 3 (2) 5 7.0 4 (2) 6 (2) 4.7 3 (2) 4 (2) 3.5 2 (2) 3 (2) 6 6.0 3 (2) 6 (1) 4.0 2 (2) 4 (1) 3.0 2 (2) 3 (1) 7 4.8 3 (2) 6 (1) 3.2 2 (2) 4 (1) 2.4 2 (2) 3 (1) 8 3.8 2 (2) 6 (1) 2.5 2 (2) 4 (1) 1.9 2 (2) 3 (1)
* indicates that the actual number of TRC fasteners required is the next higher integer.
The following two general design considerations options may be possible for the
preliminary design of the overhang systems:
• General Option 1: Use fixed number of TRC connectors in every pocket but vary the number of pockets per panel based on anticipated shear flow; and
• General Option 2: Use fixed number of pockets in every panel but vary the number of connectors needed based on resistance. However, it should be noted that only a limited number of samples with different number of connectors per pocket were evaluated in this program and this option has not been validated.
Based on the numbers in Table 3-6, three specific cases with coefficient of friction of 0.4,
0.6, and 0.8 are discussed next. Specific calculations are described in section 3.8.7. For the case
with a coefficient of friction of 0.4, the two possible design options can be as follows:
• Option 1: For the two panels at the end of the girders, use six pockets per panel with two TRC connectors in each pocket. The third panel can have five pockets with two TRC connectors each. The fourth and fifth panels can have four pockets with two TRC connectors each. Next two
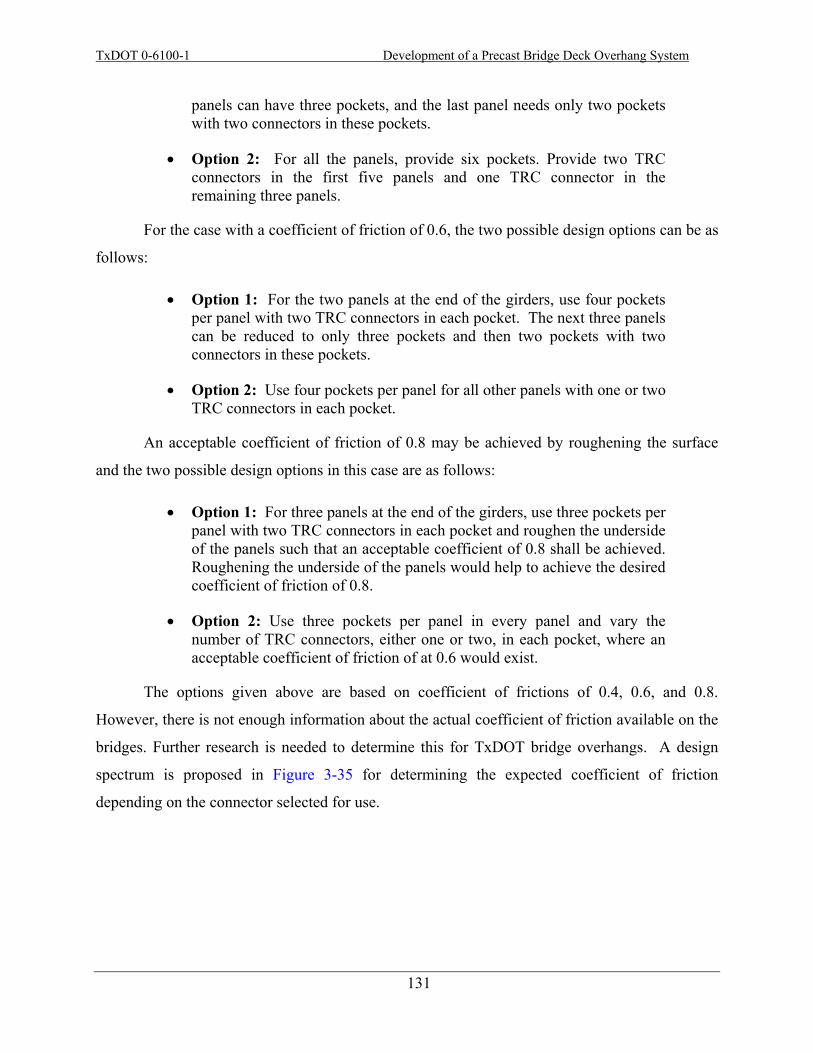
TxDOT 0-6100-1 Development of a Precast Bridge Deck Overhang System
131
panels can have three pockets, and the last panel needs only two pockets with two connectors in these pockets.
• Option 2: For all the panels, provide six pockets. Provide two TRC connectors in the first five panels and one TRC connector in the remaining three panels.
For the case with a coefficient of friction of 0.6, the two possible design options can be as
follows:
• Option 1: For the two panels at the end of the girders, use four pockets per panel with two TRC connectors in each pocket. The next three panels can be reduced to only three pockets and then two pockets with two connectors in these pockets.
• Option 2: Use four pockets per panel for all other panels with one or two TRC connectors in each pocket.
An acceptable coefficient of friction of 0.8 may be achieved by roughening the surface
and the two possible design options in this case are as follows:
• Option 1: For three panels at the end of the girders, use three pockets per panel with two TRC connectors in each pocket and roughen the underside of the panels such that an acceptable coefficient of 0.8 shall be achieved. Roughening the underside of the panels would help to achieve the desired coefficient of friction of 0.8.
• Option 2: Use three pockets per panel in every panel and vary the number of TRC connectors, either one or two, in each pocket, where an acceptable coefficient of friction of at 0.6 would exist.
The options given above are based on coefficient of frictions of 0.4, 0.6, and 0.8.
However, there is not enough information about the actual coefficient of friction available on the
bridges. Further research is needed to determine this for TxDOT bridge overhangs. A design
spectrum is proposed in Figure 3-35 for determining the expected coefficient of friction
depending on the connector selected for use.
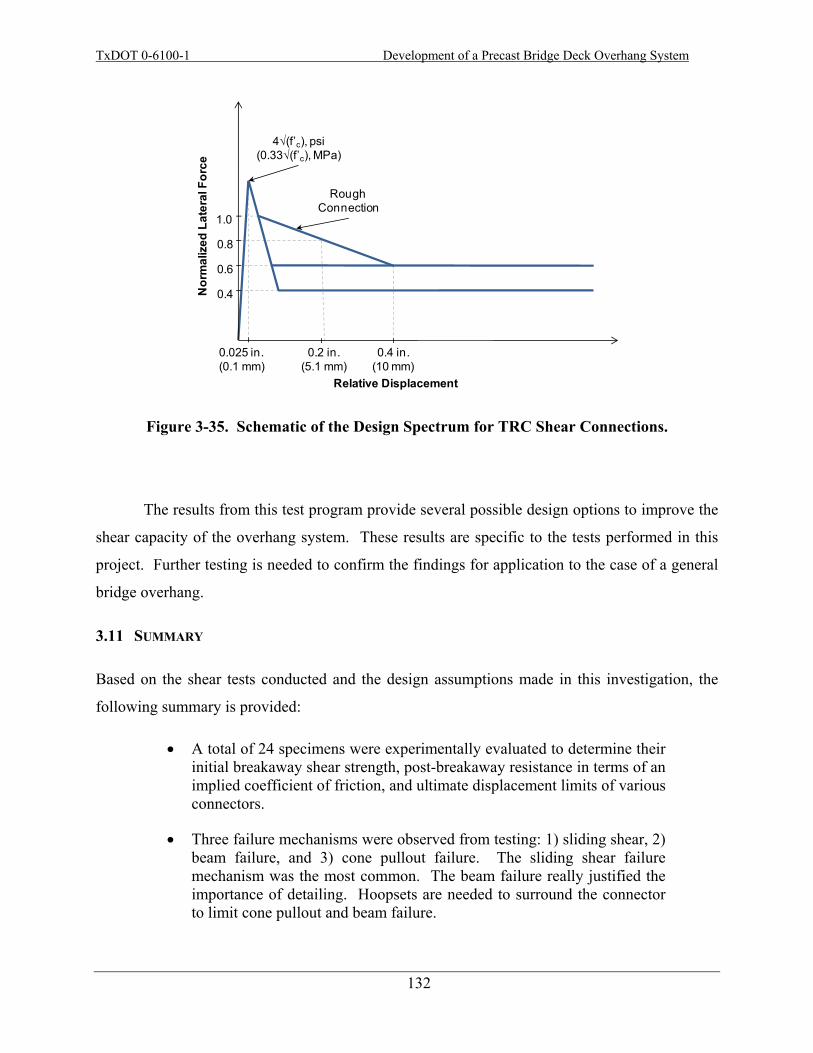
TxDOT 0-6100-1 Development of a Precast Bridge Deck Overhang System
132
Figure 3-35. Schematic of the Design Spectrum for TRC Shear Connections.
The results from this test program provide several possible design options to improve the
shear capacity of the overhang system. These results are specific to the tests performed in this
project. Further testing is needed to confirm the findings for application to the case of a general
bridge overhang.
3.11 SUMMARY
Based on the shear tests conducted and the design assumptions made in this investigation, the
following summary is provided:
• A total of 24 specimens were experimentally evaluated to determine their initial breakaway shear strength, post-breakaway resistance in terms of an implied coefficient of friction, and ultimate displacement limits of various connectors.
• Three failure mechanisms were observed from testing: 1) sliding shear, 2) beam failure, and 3) cone pullout failure. The sliding shear failure mechanism was the most common. The beam failure really justified the importance of detailing. Hoopsets are needed to surround the connector to limit cone pullout and beam failure.
Nor
mal
ized
Lat
eral
For
ce
0.8
0.6
0.4
0.025 in.(0.1 mm)
0.4 in.(10 mm)
4√(f’c), psi(0.33√(f’c), MPa)
Rough Connection
Relative Displacement
0.2 in.(5.1 mm)
1.0
TxDOT 0-6100-1 Development of a Precast Bridge Deck Overhang System
133
• Conventional R-bars were tested as control specimens to compare the performance of both pre-installed (precast) and post-installed shear connectors. Several connectors and conditions were investigated to provide alternatives to optimize the performance of the deck-haunch-beam system.
• The interface shear capacity of the existing R-bar system used in present practice is sound. From the test results, the inferred coefficient of friction at the cracked concrete-concrete interfaces that exist within the haunch of a prestressed concrete slab-on-girder bridge is likely at least 1.0.
• The best-performing shear connector (for these initial tests without intentionally roughened surfaces) that yielded an implied coefficient of friction of 0.6 was the threaded rod with the coupler (TRC). This specimen was used as the baseline model for comparing the performance of several other connection types and conditions explored. The TRC specimen provided a lower-bound peak load resistance of 70 kips (311 kN) and 64 kips (285 kN) for the 2.0-in (51 mm) and 3.5-in (89 mm) haunch heights, respectively, with adequate ductility.
• Initial experimental test results revealed a coefficient of sliding friction within the cracked grout-bed that exists between the precast concrete slab and concrete girder is 0.6. However, if the fasteners are too strong in tension, then a premature failure can occur resulting in pullout failure. This revealed the need to have the connector surrounded by hoopsets.
• Additional tests were conducted as parametric studies to explore the effects of a 2.0-in. (51 mm) and 3.5-in. (89 mm) haunch height, surface roughness, alternative grouts other than SikaGrout™ 212, alternative connectors, and grouping effects of connectors. Several lessons were learned.
• Due to inadequate beam detailing, the tests with a 3.5-in (89 mm) haunch revealed brittle beam failure. This raised an important issue of the necessity of hoopsets that need to surround the connector.
• The effect of surface roughness seems to be a critical parameter that significantly affected the shear resistance.
• An in-house grout was developed and exhibited comparable results to the SikaGrout™ 212.
• While not easily constructible for the deck-haunch-beam system, Nelson studs provided adequate shear resistance and ductility and are comparable to previous tests conducted by Scholz et al. (2007). Installing bolts with couplers instead of TRC connectors may also serve as a viable and efficient alternative.
TxDOT 0-6100-1 Development of a Precast Bridge Deck Overhang System
134
• When the number of connectors increase, the connectors become less efficient in resisting lateral force due to grouping effects.
• From the expected shear capacities of the connections and shear flow within the panels, several design possibilities exists. However, further testing is needed to validate these tests and design procedures.
• The results showed how roughening of mating surfaces increases the effective coefficient of friction, thereby increasing the shear resistance. Tests with roughened surfaces (approximate amplitude of 0.25-in. [6.4 mm]) exhibited an effective coefficient of friction of 0.8 compared to an effective coefficient of friction of 0.6 without intentional surface roughening. These friction factors are comparable to the friction factors revealed in the AASHTO LRFD Bridge Design Specifications (2007), 5.8.4.3 Cohesion and Friction Factor, where surface roughness of the shear plane is critical in affecting the interface shear transfer (AASHTO LRFD 5.8.4, Interface Shear Transfer - Shear Friction). An amplitude of 0.25-in (6.4 mm) for surface roughening was also used by AASHTO LRFD. However, it is unknown how fabricators will or can roughen the surfaces and care must be taken in increasing this coefficient of friction.
• The shear resistance may be enhanced by increasing the coefficient of friction via surface roughening as noted in the 2007 AASHTO LRFD 5.8.4. Adding a reasonable number of shear pockets can also help distribute the shear load more evenly. A preliminary design table and spectrum were provided for the determination of the number of pockets and TRC connectors needed to resist the shear flow based on the assumptions used in this analysis. However, care must be taken in using this information as these results are specific to these conditions and assumptions.
• Additional tests are needed to validate the results and investigate in more detail the effect of surface roughening. These tests are being performed and will be reported in Report 0-6100-3.
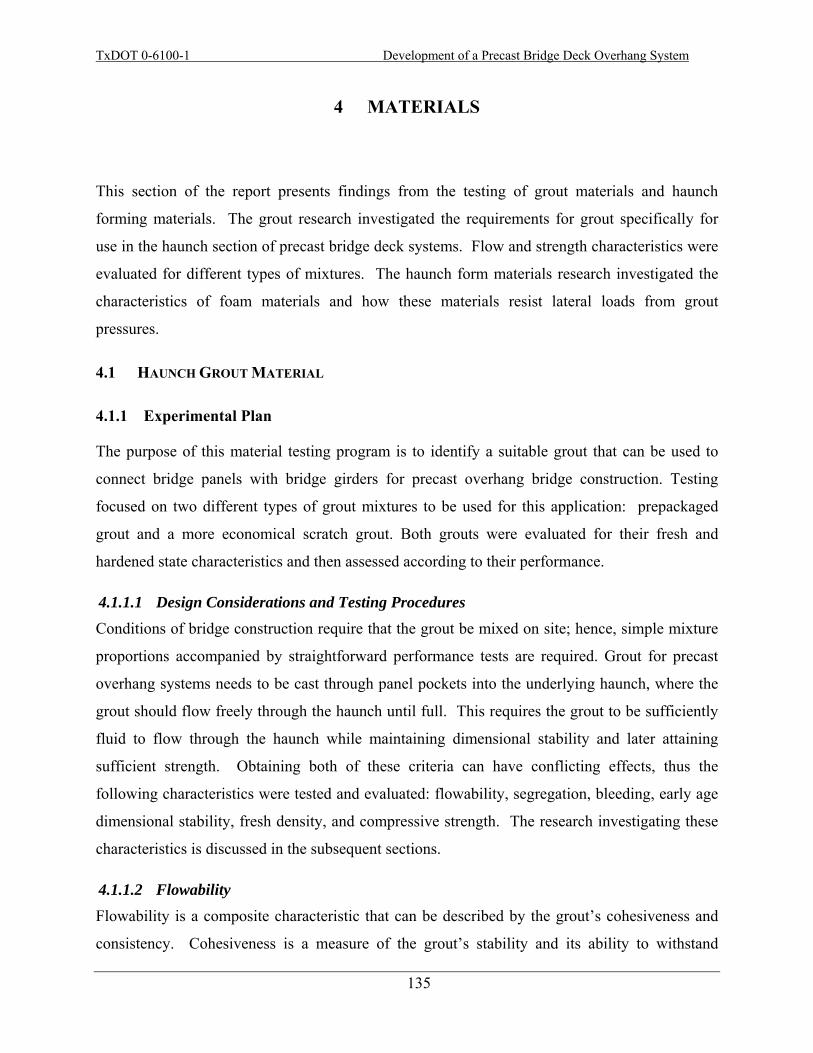
TxDOT 0-6100-1 Development of a Precast Bridge Deck Overhang System
135
4 MATERIALS
This section of the report presents findings from the testing of grout materials and haunch
forming materials. The grout research investigated the requirements for grout specifically for
use in the haunch section of precast bridge deck systems. Flow and strength characteristics were
evaluated for different types of mixtures. The haunch form materials research investigated the
characteristics of foam materials and how these materials resist lateral loads from grout
pressures.
4.1 HAUNCH GROUT MATERIAL
4.1.1 Experimental Plan
The purpose of this material testing program is to identify a suitable grout that can be used to
connect bridge panels with bridge girders for precast overhang bridge construction. Testing
focused on two different types of grout mixtures to be used for this application: prepackaged
grout and a more economical scratch grout. Both grouts were evaluated for their fresh and
hardened state characteristics and then assessed according to their performance.
4.1.1.1 Design Considerations and Testing Procedures Conditions of bridge construction require that the grout be mixed on site; hence, simple mixture
proportions accompanied by straightforward performance tests are required. Grout for precast
overhang systems needs to be cast through panel pockets into the underlying haunch, where the
grout should flow freely through the haunch until full. This requires the grout to be sufficiently
fluid to flow through the haunch while maintaining dimensional stability and later attaining
sufficient strength. Obtaining both of these criteria can have conflicting effects, thus the
following characteristics were tested and evaluated: flowability, segregation, bleeding, early age
dimensional stability, fresh density, and compressive strength. The research investigating these
characteristics is discussed in the subsequent sections.
4.1.1.2 Flowability Flowability is a composite characteristic that can be described by the grout’s cohesiveness and
consistency. Cohesiveness is a measure of the grout’s stability and its ability to withstand
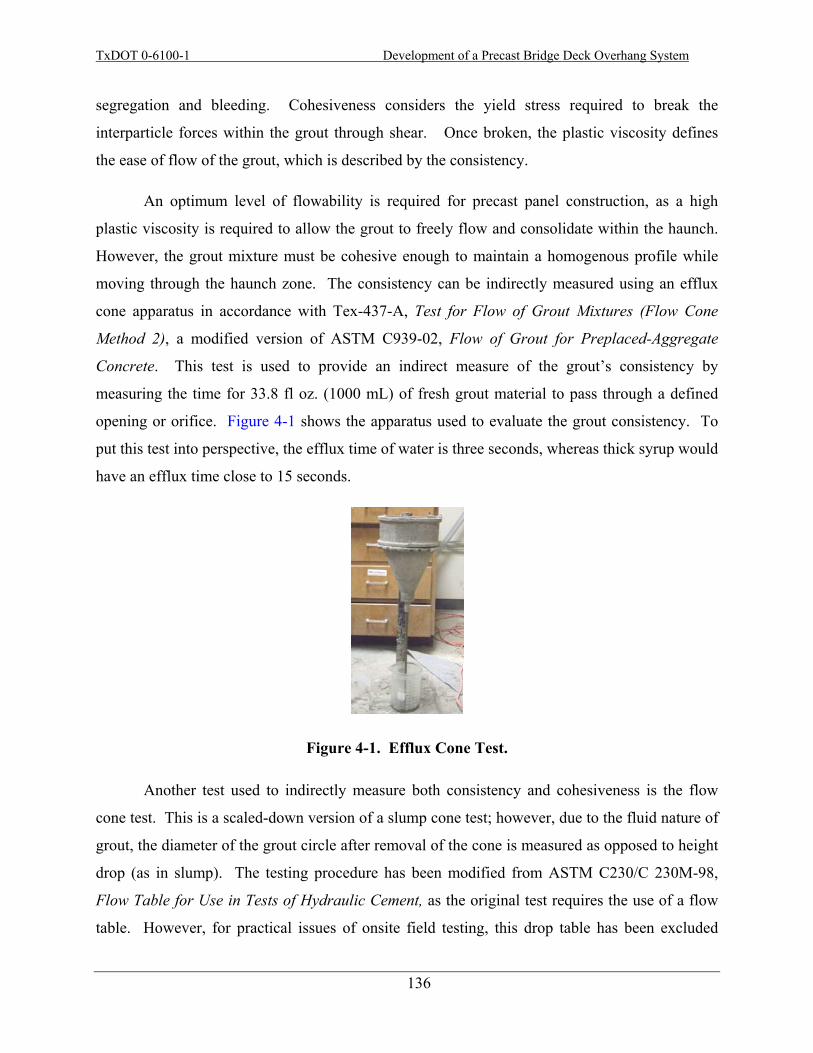
TxDOT 0-6100-1 Development of a Precast Bridge Deck Overhang System
136
segregation and bleeding. Cohesiveness considers the yield stress required to break the
interparticle forces within the grout through shear. Once broken, the plastic viscosity defines
the ease of flow of the grout, which is described by the consistency.
An optimum level of flowability is required for precast panel construction, as a high
plastic viscosity is required to allow the grout to freely flow and consolidate within the haunch.
However, the grout mixture must be cohesive enough to maintain a homogenous profile while
moving through the haunch zone. The consistency can be indirectly measured using an efflux
cone apparatus in accordance with Tex-437-A, Test for Flow of Grout Mixtures (Flow Cone
Method 2), a modified version of ASTM C939-02, Flow of Grout for Preplaced-Aggregate
Concrete. This test is used to provide an indirect measure of the grout’s consistency by
measuring the time for 33.8 fl oz. (1000 mL) of fresh grout material to pass through a defined
opening or orifice. Figure 4-1 shows the apparatus used to evaluate the grout consistency. To
put this test into perspective, the efflux time of water is three seconds, whereas thick syrup would
have an efflux time close to 15 seconds.
Figure 4-1. Efflux Cone Test.
Another test used to indirectly measure both consistency and cohesiveness is the flow
cone test. This is a scaled-down version of a slump cone test; however, due to the fluid nature of
grout, the diameter of the grout circle after removal of the cone is measured as opposed to height
drop (as in slump). The testing procedure has been modified from ASTM C230/C 230M-98,
Flow Table for Use in Tests of Hydraulic Cement, as the original test requires the use of a flow
table. However, for practical issues of onsite field testing, this drop table has been excluded
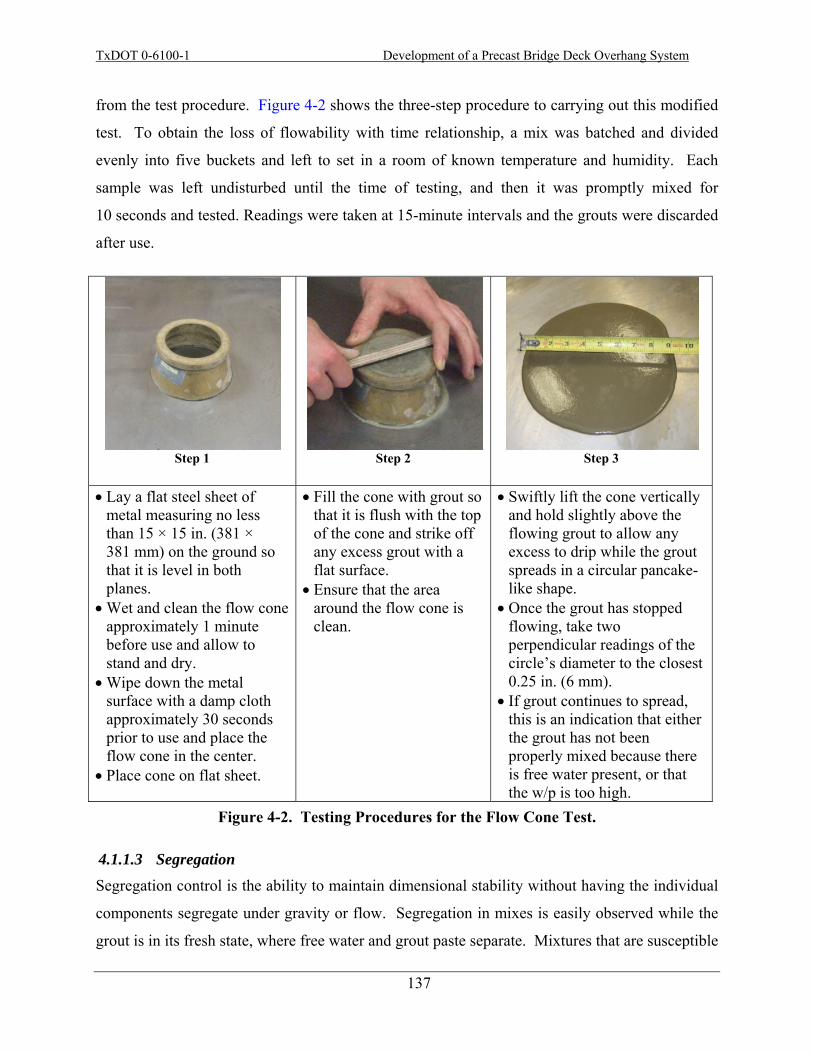
TxDOT 0-6100-1 Development of a Precast Bridge Deck Overhang System
137
from the test procedure. Figure 4-2 shows the three-step procedure to carrying out this modified
test. To obtain the loss of flowability with time relationship, a mix was batched and divided
evenly into five buckets and left to set in a room of known temperature and humidity. Each
sample was left undisturbed until the time of testing, and then it was promptly mixed for
10 seconds and tested. Readings were taken at 15-minute intervals and the grouts were discarded
after use.
Figure 4-2. Testing Procedures for the Flow Cone Test.
4.1.1.3 Segregation Segregation control is the ability to maintain dimensional stability without having the individual
components segregate under gravity or flow. Segregation in mixes is easily observed while the
grout is in its fresh state, where free water and grout paste separate. Mixtures that are susceptible
Step 1 Step 2 Step 3
• Lay a flat steel sheet of metal measuring no less than 15 × 15 in. (381 × 381 mm) on the ground so that it is level in both planes.
• Wet and clean the flow cone approximately 1 minute before use and allow to stand and dry.
• Wipe down the metal surface with a damp cloth approximately 30 seconds prior to use and place the flow cone in the center.
• Place cone on flat sheet.
• Fill the cone with grout so that it is flush with the top of the cone and strike off any excess grout with a flat surface.
• Ensure that the area around the flow cone is clean.
• Swiftly lift the cone vertically and hold slightly above the flowing grout to allow any excess to drip while the grout spreads in a circular pancake-like shape.
• Once the grout has stopped flowing, take two perpendicular readings of the circle’s diameter to the closest 0.25 in. (6 mm).
• If grout continues to spread, this is an indication that either the grout has not been properly mixed because there is free water present, or that the w/p is too high.
TxDOT 0-6100-1 Development of a Precast Bridge Deck Overhang System
138
to segregation will separate into two layers when performing a flow cone test; the sand and grout
will be deposited in the center of the circle while the free water will flow freely at the edge of the
grout circle, leaving a distinct lighter zone at the edge of the circle as shown in the examples of
Figure 4-3.
(a) Flow cone displaying good consistency (b) Flow cone showing signs of segregation
(c) Close up of segregated edge
(d) Example of a 0.5 in.(12.7 mm) VGSI
Figure 4-3. Examples of Good Flow Cone Tests and Tests that Show Clear Signs of Segregation.
The level of segregation can be measured by means of a Visual Grout Stability Index
(VGSI). This is simply an average measure of the thickness of the lighter zone left at the edge of
the grout. Although this measurement is not directly related to segregation, it gives a good
indication of how dimensionally stable the grout is. From experimentation, the following limits
were observed and created at the discretion of the technician, as presented in Table 4-1.
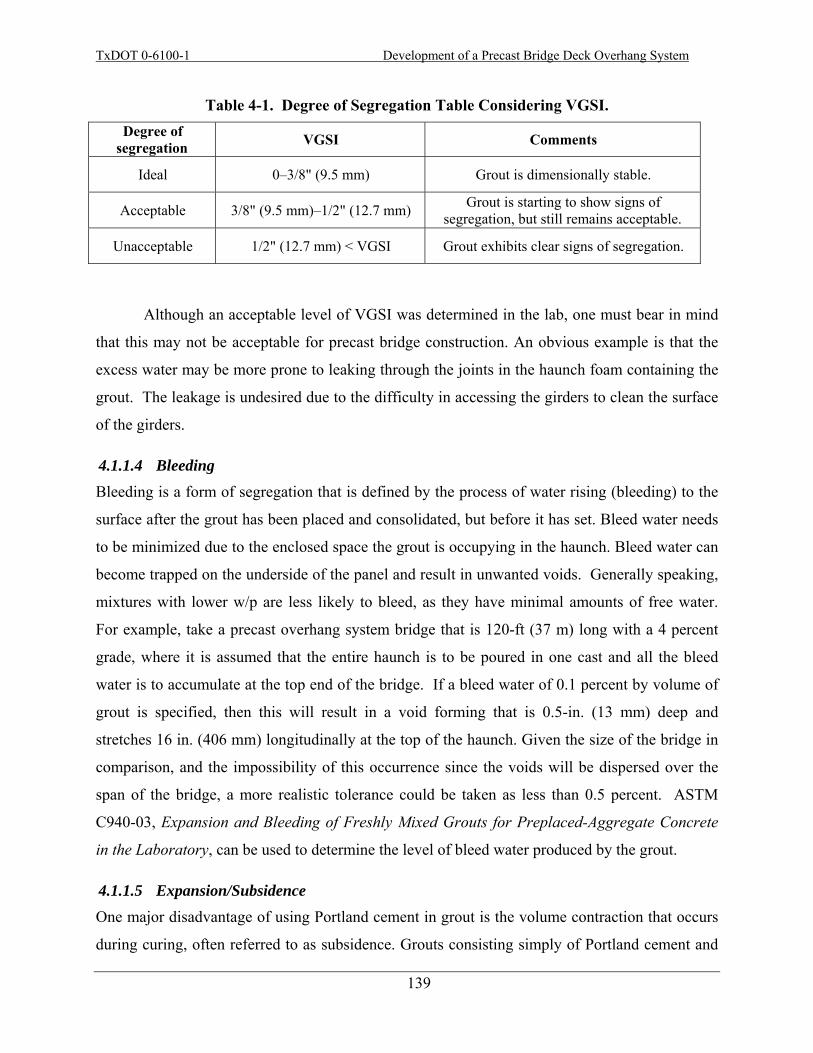
TxDOT 0-6100-1 Development of a Precast Bridge Deck Overhang System
139
Table 4-1. Degree of Segregation Table Considering VGSI. Degree of
segregation VGSI Comments
Ideal 0–3/8" (9.5 mm) Grout is dimensionally stable.
Acceptable 3/8" (9.5 mm)–1/2" (12.7 mm) Grout is starting to show signs of segregation, but still remains acceptable.
Unacceptable 1/2" (12.7 mm) < VGSI Grout exhibits clear signs of segregation.
Although an acceptable level of VGSI was determined in the lab, one must bear in mind
that this may not be acceptable for precast bridge construction. An obvious example is that the
excess water may be more prone to leaking through the joints in the haunch foam containing the
grout. The leakage is undesired due to the difficulty in accessing the girders to clean the surface
of the girders.
4.1.1.4 Bleeding Bleeding is a form of segregation that is defined by the process of water rising (bleeding) to the
surface after the grout has been placed and consolidated, but before it has set. Bleed water needs
to be minimized due to the enclosed space the grout is occupying in the haunch. Bleed water can
become trapped on the underside of the panel and result in unwanted voids. Generally speaking,
mixtures with lower w/p are less likely to bleed, as they have minimal amounts of free water.
For example, take a precast overhang system bridge that is 120-ft (37 m) long with a 4 percent
grade, where it is assumed that the entire haunch is to be poured in one cast and all the bleed
water is to accumulate at the top end of the bridge. If a bleed water of 0.1 percent by volume of
grout is specified, then this will result in a void forming that is 0.5-in. (13 mm) deep and
stretches 16 in. (406 mm) longitudinally at the top of the haunch. Given the size of the bridge in
comparison, and the impossibility of this occurrence since the voids will be dispersed over the
span of the bridge, a more realistic tolerance could be taken as less than 0.5 percent. ASTM
C940-03, Expansion and Bleeding of Freshly Mixed Grouts for Preplaced-Aggregate Concrete
in the Laboratory, can be used to determine the level of bleed water produced by the grout.
4.1.1.5 Expansion/Subsidence One major disadvantage of using Portland cement in grout is the volume contraction that occurs
during curing, often referred to as subsidence. Grouts consisting simply of Portland cement and
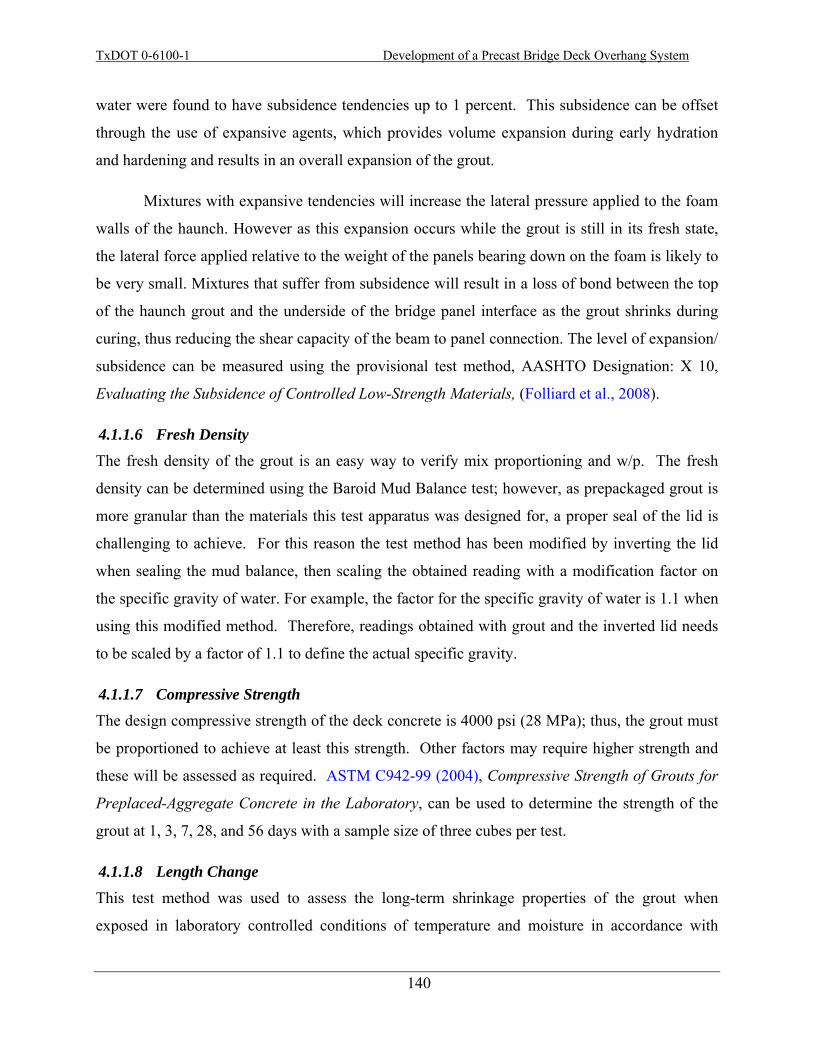
TxDOT 0-6100-1 Development of a Precast Bridge Deck Overhang System
140
water were found to have subsidence tendencies up to 1 percent. This subsidence can be offset
through the use of expansive agents, which provides volume expansion during early hydration
and hardening and results in an overall expansion of the grout.
Mixtures with expansive tendencies will increase the lateral pressure applied to the foam
walls of the haunch. However as this expansion occurs while the grout is still in its fresh state,
the lateral force applied relative to the weight of the panels bearing down on the foam is likely to
be very small. Mixtures that suffer from subsidence will result in a loss of bond between the top
of the haunch grout and the underside of the bridge panel interface as the grout shrinks during
curing, thus reducing the shear capacity of the beam to panel connection. The level of expansion/
subsidence can be measured using the provisional test method, AASHTO Designation: X 10,
Evaluating the Subsidence of Controlled Low-Strength Materials, (Folliard et al., 2008).
4.1.1.6 Fresh Density The fresh density of the grout is an easy way to verify mix proportioning and w/p. The fresh
density can be determined using the Baroid Mud Balance test; however, as prepackaged grout is
more granular than the materials this test apparatus was designed for, a proper seal of the lid is
challenging to achieve. For this reason the test method has been modified by inverting the lid
when sealing the mud balance, then scaling the obtained reading with a modification factor on
the specific gravity of water. For example, the factor for the specific gravity of water is 1.1 when
using this modified method. Therefore, readings obtained with grout and the inverted lid needs
to be scaled by a factor of 1.1 to define the actual specific gravity.
4.1.1.7 Compressive Strength The design compressive strength of the deck concrete is 4000 psi (28 MPa); thus, the grout must
be proportioned to achieve at least this strength. Other factors may require higher strength and
these will be assessed as required. ASTM C942-99 (2004), Compressive Strength of Grouts for
Preplaced-Aggregate Concrete in the Laboratory, can be used to determine the strength of the
grout at 1, 3, 7, 28, and 56 days with a sample size of three cubes per test.
4.1.1.8 Length Change This test method was used to assess the long-term shrinkage properties of the grout when
exposed in laboratory controlled conditions of temperature and moisture in accordance with

TxDOT 0-6100-1 Development of a Precast Bridge Deck Overhang System
141
ASTM C 157/C (1999) Length Change of Hardened Hydraulic-Cement Mortar and Concrete.
After the initial 28-day curing time in a lime-saturated water solution, the specimens were air
dried in a controlled drying room held at a constant temperature of 73°F ± 3°F (23°C ± 2°C).
4.1.2 Prepackaged Grout Testing
4.1.2.1 Mixing Variables This section considers the use of prepackaged grout for the use of precast overhang bridge
construction. To provide a more economical grout mix, a test matrix consisting of different water
to prepackaged grout powder ratios (herein referred to as w/p) and varying sand contents were
evaluated to identify an optimized mixture. Table 4-2 shows the experimental plan used in this
research, where the mixtures have been identified based on the following labeling system:
“w/p_sand content.”
Table 4-2. Test Matrix of Prepackaged Grout Mix Designs.
w/p Percent sand replacement of prepackaged grout
0 10 20 0.17 17_ 0 17_10 17_20
0.185 185_ 0 185_10 185_20 0.20 20_0 20_10 20_20 0.25 25_0 25_10 25_20
The research team evaluated literature for several grout types and from several
manufacturers. Based on this evaluation, ‘SikaGroutTM 212 High Performance grout’ was
selected for further evaluation in this program.

TxDOT 0-6100-1 Development of a Precast Bridge Deck Overhang System
142
4.1.2.2 Materials
4.1.2.2.1 SikaGroutTM 212 High Performance Grout
SikaGroutTM 212 is a non-shrink, cementitious grout that is recommended for structural
applications and is versatile for high flow applications. It contains a special blend of shrinkage-
reducing and plasticizing/water-reducing agents that compensate for shrinkage in both the plastic
and hardened states.
Based on the material recommendations a 500 rpm mechanical drill mixer was used with
a circular paddle mixer. The mixing procedure consisted of batching the materials to an
accuracy of 0.1 pound (0.045 kg). The grout powder was gradually added to the water in three
to four stages with short bursts of mixing between each stage to prevent balling of the grout.
Mixing continued for 5 minutes from the time of water addition, ensuring that the grout was well
mixed and homogenous.
4.1.2.2.2 Sand
Testing of the sand for absorption capacity and specific gravity was carried out in accordance
with ASTM C128–04a, Density, Relative Density (Specific Gravity), and Absorption of Fine
Aggregate. The determination of the fineness modulus and sieve analysis for the sand was
carried out in accordance with ASTM C136–05, Sieve Analysis of fine and Coarse Aggregates.
Table 4-3 shows the values obtained based on these tests.
Table 4-3. Characteristics of Sand.
Absorption Capacity Oven Dry Specific Gravity Saturated Surface Dry Specific Gravity Fineness Modulus
1.23 2.57 2.60 2.40
The sand gradation curve (Figure 4-4) was determined based on an average of three tests.
Results indicate that the particle sizes passing through the #30 sieve (0.6 mm) were slightly
higher than the grading limits for fine aggregates recommended by ASTM C 33-03, Concrete
Aggregates.
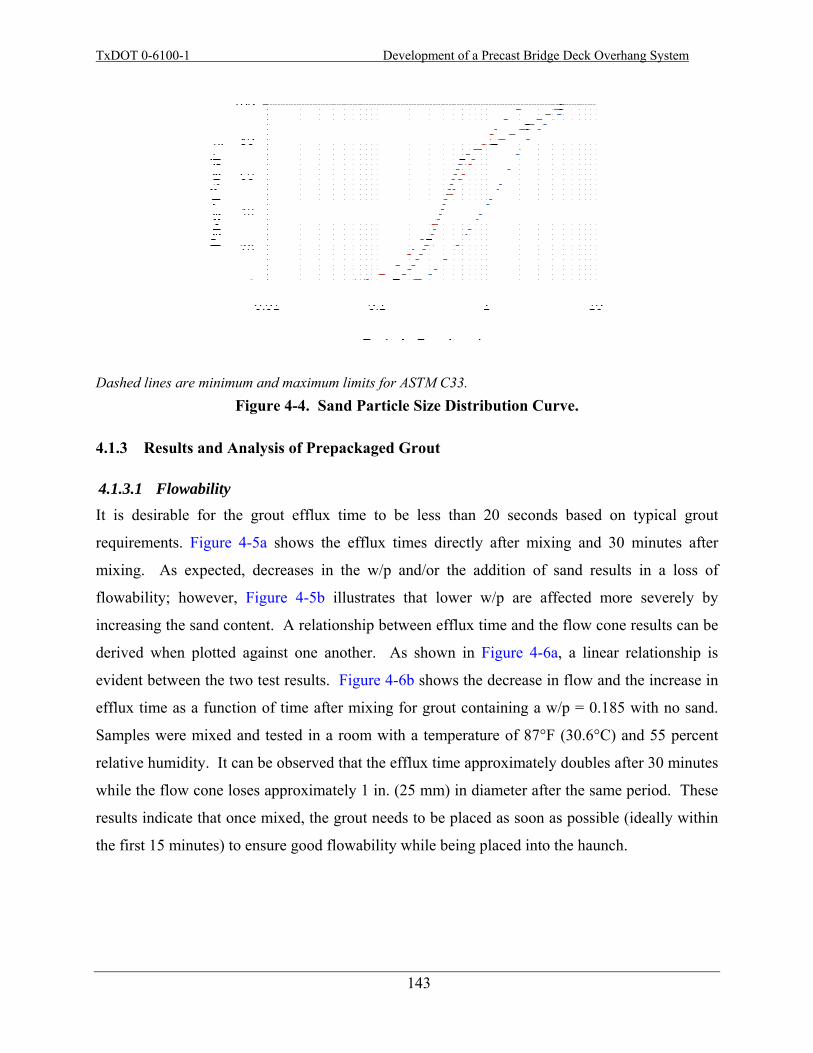
TxDOT 0-6100-1 Development of a Precast Bridge Deck Overhang System
143
Dashed lines are minimum and maximum limits for ASTM C33. Figure 4-4. Sand Particle Size Distribution Curve.
4.1.3 Results and Analysis of Prepackaged Grout
4.1.3.1 Flowability It is desirable for the grout efflux time to be less than 20 seconds based on typical grout
requirements. Figure 4-5a shows the efflux times directly after mixing and 30 minutes after
mixing. As expected, decreases in the w/p and/or the addition of sand results in a loss of
flowability; however, Figure 4-5b illustrates that lower w/p are affected more severely by
increasing the sand content. A relationship between efflux time and the flow cone results can be
derived when plotted against one another. As shown in Figure 4-6a, a linear relationship is
evident between the two test results. Figure 4-6b shows the decrease in flow and the increase in
efflux time as a function of time after mixing for grout containing a w/p = 0.185 with no sand.
Samples were mixed and tested in a room with a temperature of 87°F (30.6°C) and 55 percent
relative humidity. It can be observed that the efflux time approximately doubles after 30 minutes
while the flow cone loses approximately 1 in. (25 mm) in diameter after the same period. These
results indicate that once mixed, the grout needs to be placed as soon as possible (ideally within
the first 15 minutes) to ensure good flowability while being placed into the haunch.
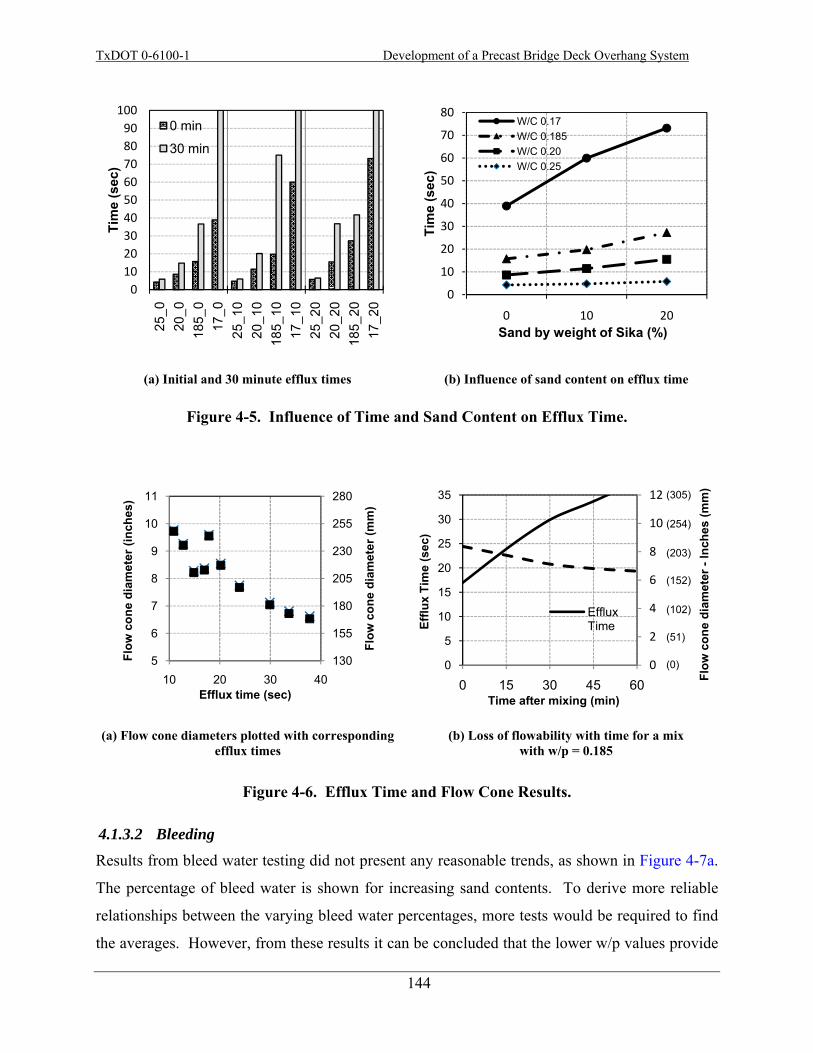
TxDOT 0-6100-1 Development of a Precast Bridge Deck Overhang System
144
(a) Initial and 30 minute efflux times (b) Influence of sand content on efflux time
Figure 4-5. Influence of Time and Sand Content on Efflux Time.
Figure 4-6. Efflux Time and Flow Cone Results.
4.1.3.2 Bleeding Results from bleed water testing did not present any reasonable trends, as shown in Figure 4-7a.
The percentage of bleed water is shown for increasing sand contents. To derive more reliable
relationships between the varying bleed water percentages, more tests would be required to find
the averages. However, from these results it can be concluded that the lower w/p values provide
0102030405060708090
100
25_0
20_0
185_
017
_025
_10
20_1
018
5_10
17_1
025
_20
20_2
018
5_20
17_2
0
Tim
e (s
ec)
0 min
30 min
0
10
20
30
40
50
60
70
80
0 10 20
Tim
e (s
ec)
Sand by weight of Sika (%)
W/C 0.17W/C 0.185W/C 0.20W/C 0.25
(a) Flow cone diameters plotted with corresponding efflux times
(b) Loss of flowability with time for a mix with w/p = 0.185
130
155
180
205
230
255
280
5
6
7
8
9
10
11
10 20 30 40
Flow
con
e di
amet
er (m
m)
Flow
con
e di
amet
er (i
nche
s)
Efflux time (sec)
0
2
4
6
8
10
12
0
5
10
15
20
25
30
35
0 15 30 45 60 Flow
con
e di
amet
er -
Inch
es (m
m)
Efflu
x Ti
me
(sec
)
Time after mixing (min)
Efflux Time
(305)
(254)
(203)
(152)
(102)
(51)
(0)
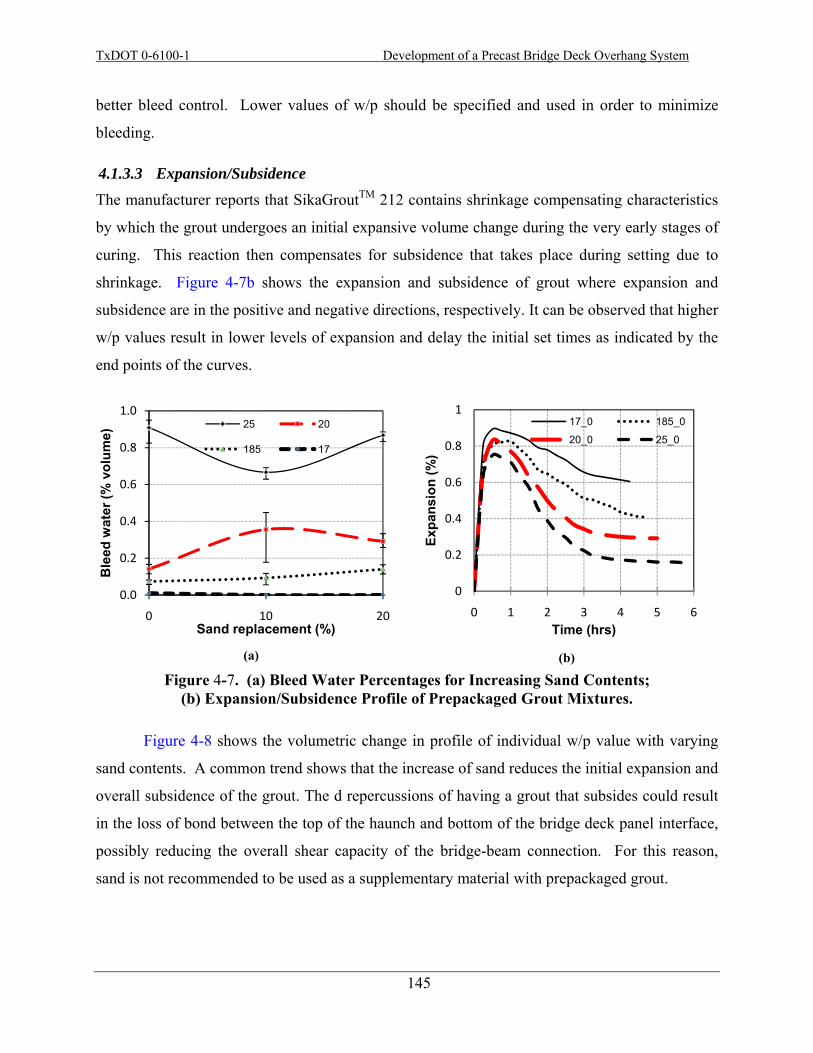
TxDOT 0-6100-1 Development of a Precast Bridge Deck Overhang System
145
better bleed control. Lower values of w/p should be specified and used in order to minimize
bleeding.
4.1.3.3 Expansion/Subsidence The manufacturer reports that SikaGroutTM 212 contains shrinkage compensating characteristics
by which the grout undergoes an initial expansive volume change during the very early stages of
curing. This reaction then compensates for subsidence that takes place during setting due to
shrinkage. Figure 4-7b shows the expansion and subsidence of grout where expansion and
subsidence are in the positive and negative directions, respectively. It can be observed that higher
w/p values result in lower levels of expansion and delay the initial set times as indicated by the
end points of the curves.
(a) (b) Figure 4-7. (a) Bleed Water Percentages for Increasing Sand Contents;
(b) Expansion/Subsidence Profile of Prepackaged Grout Mixtures.
Figure 4-8 shows the volumetric change in profile of individual w/p value with varying
sand contents. A common trend shows that the increase of sand reduces the initial expansion and
overall subsidence of the grout. The d repercussions of having a grout that subsides could result
in the loss of bond between the top of the haunch and bottom of the bridge deck panel interface,
possibly reducing the overall shear capacity of the bridge-beam connection. For this reason,
sand is not recommended to be used as a supplementary material with prepackaged grout.
0.0
0.2
0.4
0.6
0.8
1.0
0 10 20
Ble
ed w
ater
(% v
olum
e)
Sand replacement (%)
25 20
185 17
0
0.2
0.4
0.6
0.8
1
0 1 2 3 4 5 6
Expa
nsio
n (%
)
Time (hrs)
17_0 185_0
20_0 25_0

TxDOT 0-6100-1 Development of a Precast Bridge Deck Overhang System
146
4.1.3.4 Compressive Strength Figure 4-9 shows the strength results from this testing for each w/p with varying sand contents.
These results confirm that all the mixes below a w/p of 0.20 will obtain and exceed the required
4000 psi (28 MPa) compressive strength within the first seven days. This concludes that strength
is not one of the limiting factors for this design; however, it may be in the contractors’ best
interests to have a high early strength development so that once the grout is placed, there is not a
long period of curing time required before the bridge is serviceable for construction to continue.
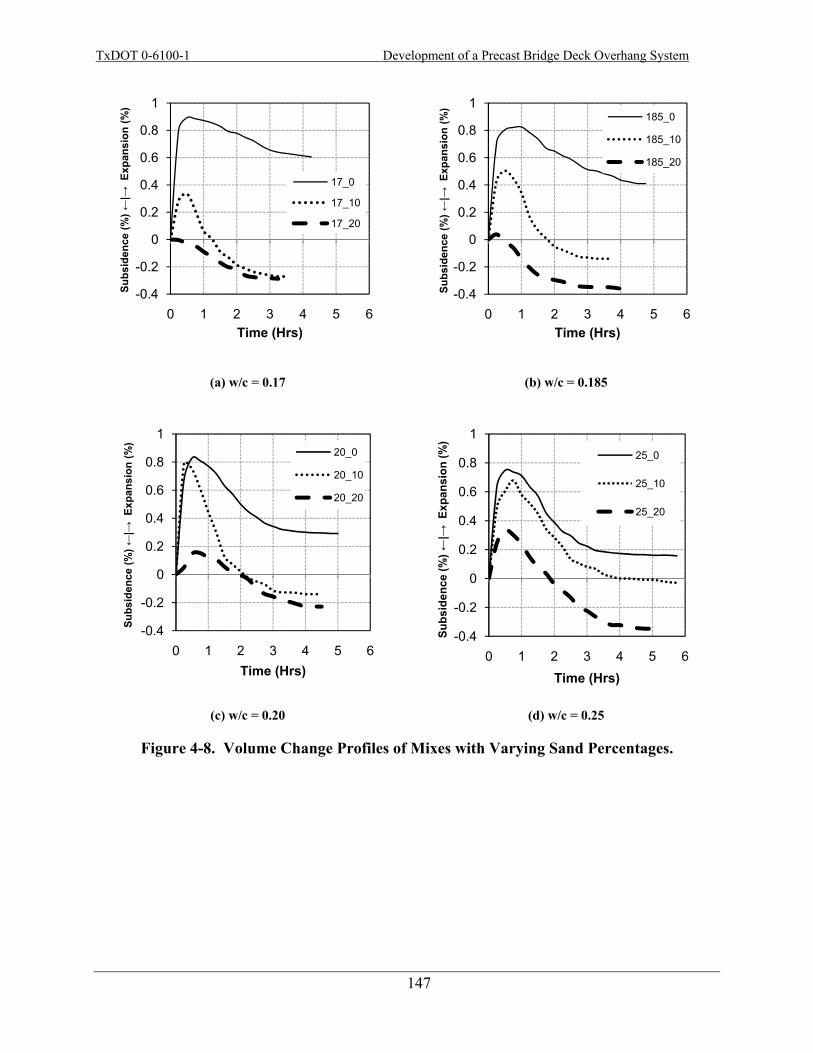
TxDOT 0-6100-1 Development of a Precast Bridge Deck Overhang System
147
(a) w/c = 0.17
(b) w/c = 0.185
(c) w/c = 0.20 (d) w/c = 0.25
Figure 4-8. Volume Change Profiles of Mixes with Varying Sand Percentages.
-0.4
-0.2
0
0.2
0.4
0.6
0.8
1
0 1 2 3 4 5 6
Subs
iden
ce (%
) ←|→
Exp
ansi
on (%
)
Time (Hrs)
17_0
17_10
17_20
-0.4
-0.2
0
0.2
0.4
0.6
0.8
1
0 1 2 3 4 5 6
Subs
iden
ce (%
) ←|→
Exp
ansi
on (%
)
Time (Hrs)
185_0
185_10
185_20
-0.4
-0.2
0
0.2
0.4
0.6
0.8
1
0 1 2 3 4 5 6
Subs
iden
ce (%
) ←|→
Exp
ansi
on (%
)
Time (Hrs)
20_0
20_10
20_20
-0.4
-0.2
0
0.2
0.4
0.6
0.8
1
0 1 2 3 4 5 6
Subs
iden
ce (%
) ←|→
Exp
ansi
on (%
)
Time (Hrs)
25_0
25_10
25_20
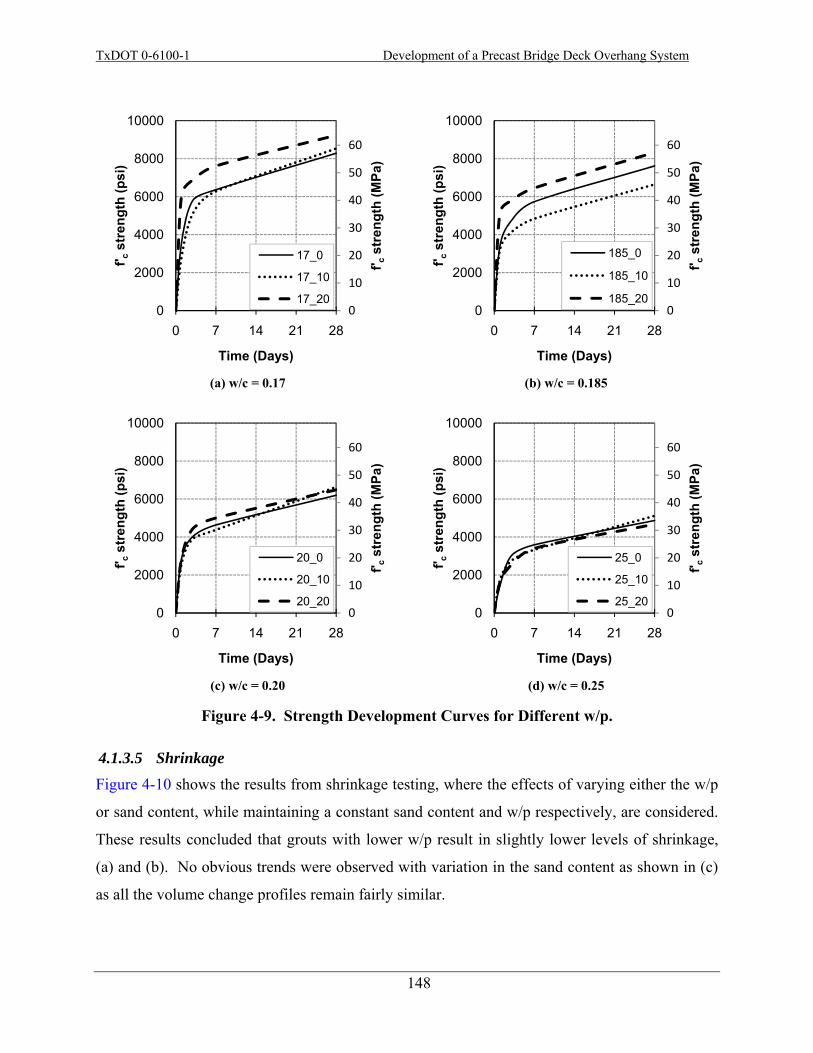
TxDOT 0-6100-1 Development of a Precast Bridge Deck Overhang System
148
(a) w/c = 0.17 (b) w/c = 0.185
(c) w/c = 0.20 (d) w/c = 0.25
Figure 4-9. Strength Development Curves for Different w/p.
4.1.3.5 Shrinkage Figure 4-10 shows the results from shrinkage testing, where the effects of varying either the w/p
or sand content, while maintaining a constant sand content and w/p respectively, are considered.
These results concluded that grouts with lower w/p result in slightly lower levels of shrinkage,
(a) and (b). No obvious trends were observed with variation in the sand content as shown in (c)
as all the volume change profiles remain fairly similar.
0
10
20
30
40
50
60
0
2000
4000
6000
8000
10000
0 7 14 21 28
f' cst
reng
th (M
Pa)
f' cst
reng
th (p
si)
Time (Days)
17_0
17_10
17_200
10
20
30
40
50
60
0
2000
4000
6000
8000
10000
0 7 14 21 28
f' cst
reng
th (M
Pa)
f' cst
reng
th (p
si)
Time (Days)
185_0
185_10
185_20
0
10
20
30
40
50
60
0
2000
4000
6000
8000
10000
0 7 14 21 28
f' cst
reng
th (M
Pa)
f' cst
reng
th (p
si)
Time (Days)
20_0
20_10
20_200
10
20
30
40
50
60
0
2000
4000
6000
8000
10000
0 7 14 21 28
f' cst
reng
th (M
Pa)
f' cst
reng
th (p
si)
Time (Days)
25_0
25_10
25_20
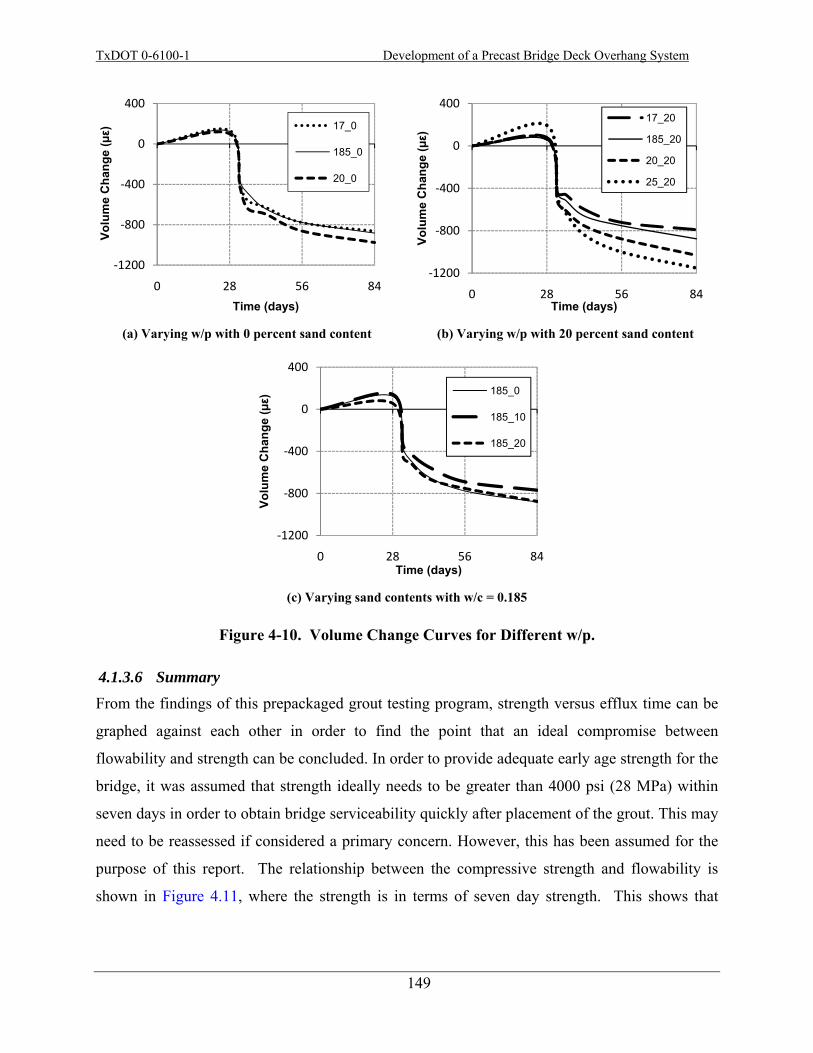
TxDOT 0-6100-1 Development of a Precast Bridge Deck Overhang System
149
(a) Varying w/p with 0 percent sand content (b) Varying w/p with 20 percent sand content
(c) Varying sand contents with w/c = 0.185
Figure 4-10. Volume Change Curves for Different w/p.
4.1.3.6 Summary From the findings of this prepackaged grout testing program, strength versus efflux time can be
graphed against each other in order to find the point that an ideal compromise between
flowability and strength can be concluded. In order to provide adequate early age strength for the
bridge, it was assumed that strength ideally needs to be greater than 4000 psi (28 MPa) within
seven days in order to obtain bridge serviceability quickly after placement of the grout. This may
need to be reassessed if considered a primary concern. However, this has been assumed for the
purpose of this report. The relationship between the compressive strength and flowability is
shown in Figure 4.11, where the strength is in terms of seven day strength. This shows that
‐1200
‐800
‐400
0
400
0 28 56 84
Volu
me
Cha
nge
(µε)
Time (days)
17_0
185_0
20_0
‐1200
‐800
‐400
0
400
0 28 56 84
Volu
me
Cha
nge
(µε)
Time (days)
17_20
185_20
20_20
25_20
‐1200
‐800
‐400
0
400
0 28 56 84
Volu
me
Cha
nge
(µε)
Time (days)
185_0
185_10
185_20
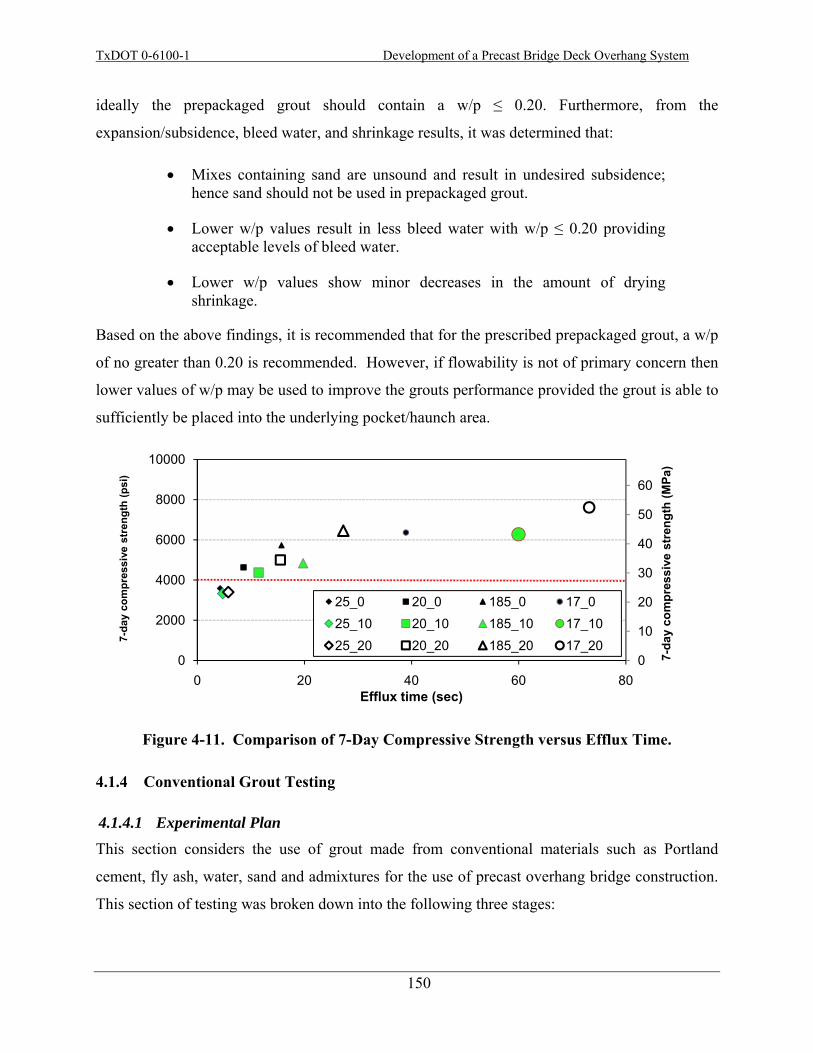
TxDOT 0-6100-1 Development of a Precast Bridge Deck Overhang System
150
ideally the prepackaged grout should contain a w/p ≤ 0.20. Furthermore, from the
expansion/subsidence, bleed water, and shrinkage results, it was determined that:
• Mixes containing sand are unsound and result in undesired subsidence; hence sand should not be used in prepackaged grout.
• Lower w/p values result in less bleed water with w/p ≤ 0.20 providing acceptable levels of bleed water.
• Lower w/p values show minor decreases in the amount of drying shrinkage.
Based on the above findings, it is recommended that for the prescribed prepackaged grout, a w/p
of no greater than 0.20 is recommended. However, if flowability is not of primary concern then
lower values of w/p may be used to improve the grouts performance provided the grout is able to
sufficiently be placed into the underlying pocket/haunch area.
Figure 4-11. Comparison of 7-Day Compressive Strength versus Efflux Time.
4.1.4 Conventional Grout Testing
4.1.4.1 Experimental Plan This section considers the use of grout made from conventional materials such as Portland
cement, fly ash, water, sand and admixtures for the use of precast overhang bridge construction.
This section of testing was broken down into the following three stages:
0
10
20
30
40
50
60
0
2000
4000
6000
8000
10000
0 20 40 60 807-
day
com
pres
sive
str
engt
h (M
Pa)
7-da
y co
mpr
essi
ve s
tren
gth
(psi
)
Efflux time (sec)
25_0 20_0 185_0 17_025_10 20_10 185_10 17_1025_20 20_20 185_20 17_20

TxDOT 0-6100-1 Development of a Precast Bridge Deck Overhang System
151
1. Preliminary studies were conducted to determine the best combination of the
materials in order to find a workable design mixture. This also focused on how the
use of admixtures could be used to enhance the grouts performance in areas that
initially failed to meet the required design criteria. These admixtures included grout
expanding aid and superplasticizer.
2. A control mixture was selected based on the findings of the preliminary study and
was tested in a ‘Grout Track’ (refer to section 4.1.7, Constructability and Proposed
Special Specifications) to evaluate the grouts performance in a model of the haunch
in a precast overhang bridge.
3. Following the confirmation of the grout track test, a full factorial design was
performed to assess the sensitivity of the grouts performance based on each of its
constituents. The testing consisted of varying each of the grouts parameters by plus
or minus a nominated percentage in order to evaluate how sensitive that particular
parameter is, thus defining which parameters have the greatest effect on the grouts
performance.
Each stage was done progressively and the findings are discussed in the subsequent sections.
4.1.4.2 Materials
4.1.4.2.1 Cement
The Portland Cement used throughout the duration of this report was a Type I/II cement
manufactured by Cemex, Inc. Table 4-4 and Table 4-5 show the chemical composition and
physical properties of the cement used.
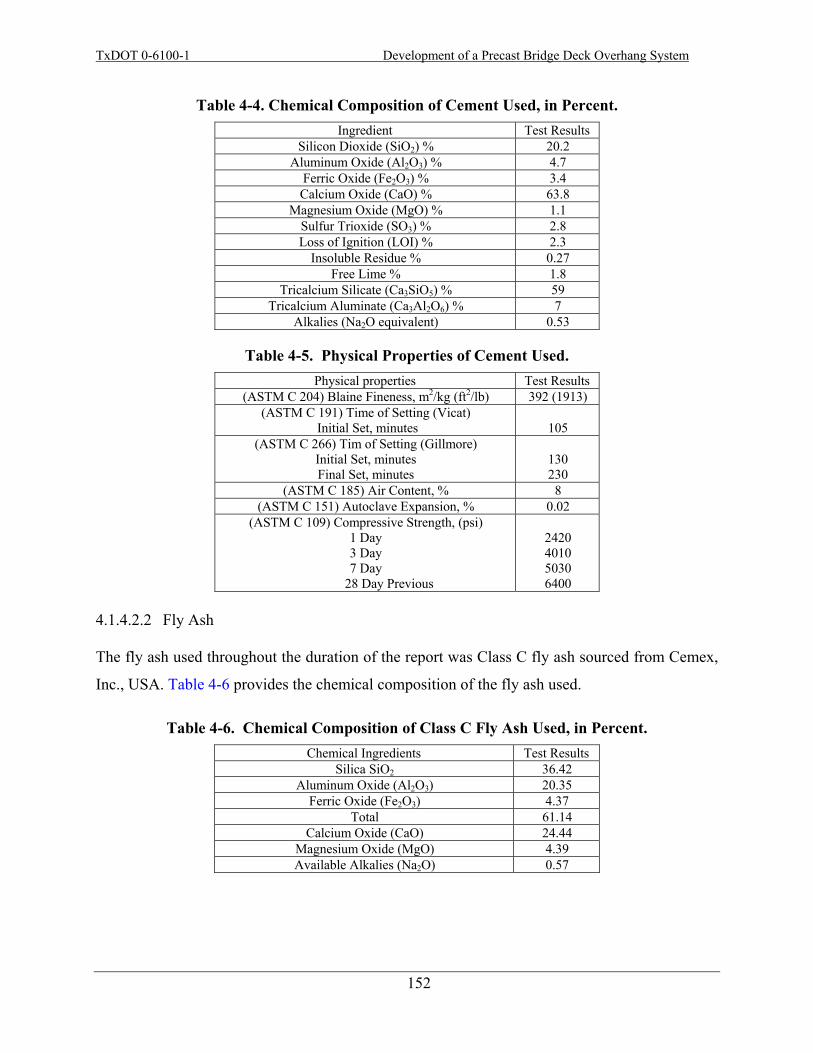
TxDOT 0-6100-1 Development of a Precast Bridge Deck Overhang System
152
Table 4-4. Chemical Composition of Cement Used, in Percent. Ingredient Test Results
Silicon Dioxide (SiO2) % 20.2 Aluminum Oxide (Al2O3) % 4.7
Ferric Oxide (Fe2O3) % 3.4 Calcium Oxide (CaO) % 63.8
Magnesium Oxide (MgO) % 1.1 Sulfur Trioxide (SO3) % 2.8 Loss of Ignition (LOI) % 2.3
Insoluble Residue % 0.27 Free Lime % 1.8
Tricalcium Silicate (Ca3SiO5) % 59 Tricalcium Aluminate (Ca3Al2O6) % 7
Alkalies (Na2O equivalent) 0.53
Table 4-5. Physical Properties of Cement Used. Physical properties Test Results
(ASTM C 204) Blaine Fineness, m2/kg (ft2/lb) 392 (1913) (ASTM C 191) Time of Setting (Vicat)
Initial Set, minutes
105 (ASTM C 266) Tim of Setting (Gillmore)
Initial Set, minutes Final Set, minutes
130 230
(ASTM C 185) Air Content, % 8 (ASTM C 151) Autoclave Expansion, % 0.02
(ASTM C 109) Compressive Strength, (psi) 1 Day 3 Day 7 Day
28 Day Previous
2420 4010 5030 6400
4.1.4.2.2 Fly Ash
The fly ash used throughout the duration of the report was Class C fly ash sourced from Cemex,
Inc., USA. Table 4-6 provides the chemical composition of the fly ash used.
Table 4-6. Chemical Composition of Class C Fly Ash Used, in Percent. Chemical Ingredients Test Results
Silica SiO2 36.42 Aluminum Oxide (Al2O3) 20.35
Ferric Oxide (Fe2O3) 4.37 Total 61.14
Calcium Oxide (CaO) 24.44 Magnesium Oxide (MgO) 4.39 Available Alkalies (Na2O) 0.57
TxDOT 0-6100-1 Development of a Precast Bridge Deck Overhang System
153
4.1.4.2.3 Sand
Refer to section 4.1.2.2.2 for the characteristics of the sand used for the testing discussed in this
section.
4.1.4.2.4 Grout Expanding Aid
Intraplast-N, manufactured by Sika Corporation, Inc., is a balanced blend of expanding,
fluidifying, and water-reducing agents for Portland cement grouts. It produces a slow, controlled
expansion prior to the grout hardening. It is dosed as a percentage by weight of cementitious
material with a recommended dosage of 1 percent.
4.1.4.2.5 Superplasticizer
Viscocrete 4100, made by Sika Corporation, USA, is a high range water-reducing and
superplasticizing admixture that utilizes Sika’s ‘ViscoCrete’ polycarboxylate polymer
technology. Sika ViscoCrete 4100 meets the requirements for ASTMC-494 Types A and F. It is
designed for high early strength applications and provides excellent plasticity, prolonged
workability, and extended slump life even if used during the summer months. It is recommended
for concrete and grout applications that are placed directly after being mixed.
4.1.5 Results and Analysis of Conventional Grout Testing
4.1.5.1 Preliminary Testing The first step of this section was to analyze the performance of grout with varying quantities of
the constituents: Portland cement, fly ash, sand and water. A quick assessment of these mixes
presented the following three areas of concern.
1) Initially the same mixing procedure as the prepackaged grout mixing was adopted
with a 500 rpm mechanical drill mixer. This however did not provide the mixing
intensity required to correctly mix the conventional grout, and resulted in a very thick
and stiff grout for a mixture with a 0.44 water-to-cement ratio (w/c). The mixing
speed was therefore increased to 1500 rpm while still maintaining the same batching
procedure and mixing time. This had a significant increase on the fresh and hardened
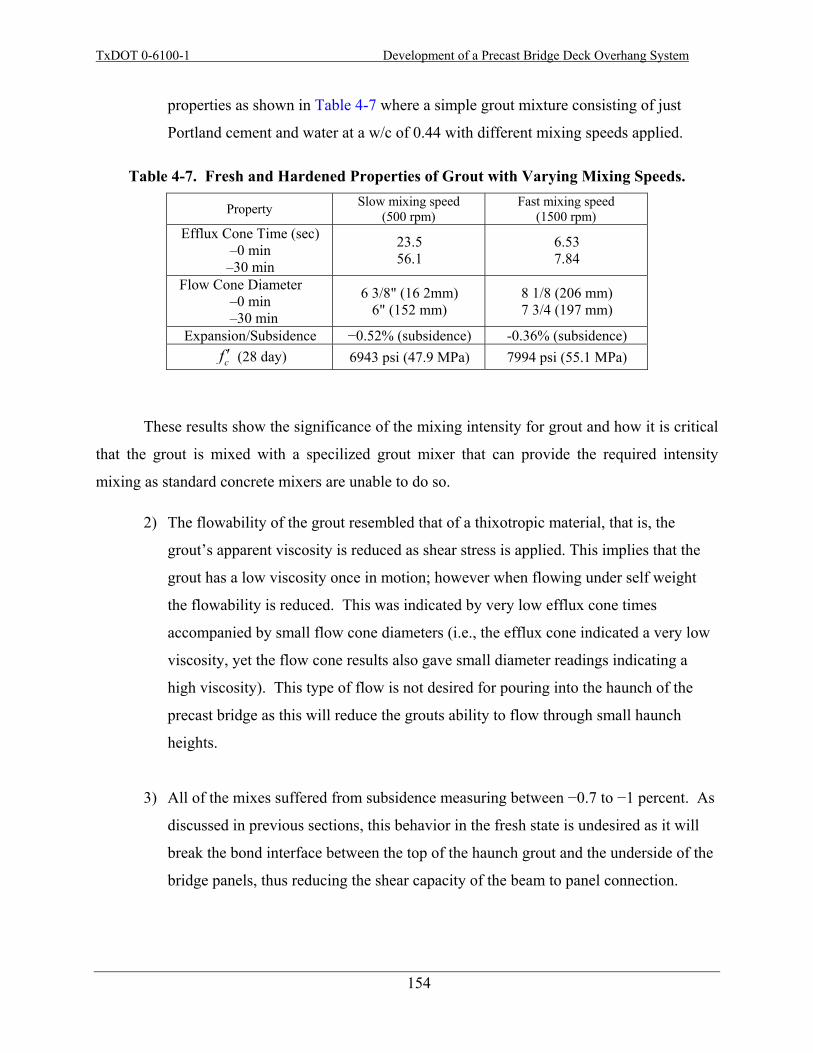
TxDOT 0-6100-1 Development of a Precast Bridge Deck Overhang System
154
properties as shown in Table 4-7 where a simple grout mixture consisting of just
Portland cement and water at a w/c of 0.44 with different mixing speeds applied.
Table 4-7. Fresh and Hardened Properties of Grout with Varying Mixing Speeds.
Property Slow mixing speed (500 rpm)
Fast mixing speed (1500 rpm)
Efflux Cone Time (sec) –0 min
–30 min
23.5 56.1
6.53 7.84
Flow Cone Diameter –0 min
–30 min
6 3/8" (16 2mm) 6" (152 mm)
8 1/8 (206 mm) 7 3/4 (197 mm)
Expansion/Subsidence −0.52% (subsidence) -0.36% (subsidence)
cf ′ (28 day) 6943 psi (47.9 MPa) 7994 psi (55.1 MPa)
These results show the significance of the mixing intensity for grout and how it is critical
that the grout is mixed with a specilized grout mixer that can provide the required intensity
mixing as standard concrete mixers are unable to do so.
2) The flowability of the grout resembled that of a thixotropic material, that is, the
grout’s apparent viscosity is reduced as shear stress is applied. This implies that the
grout has a low viscosity once in motion; however when flowing under self weight
the flowability is reduced. This was indicated by very low efflux cone times
accompanied by small flow cone diameters (i.e., the efflux cone indicated a very low
viscosity, yet the flow cone results also gave small diameter readings indicating a
high viscosity). This type of flow is not desired for pouring into the haunch of the
precast bridge as this will reduce the grouts ability to flow through small haunch
heights.
3) All of the mixes suffered from subsidence measuring between −0.7 to −1 percent. As
discussed in previous sections, this behavior in the fresh state is undesired as it will
break the bond interface between the top of the haunch grout and the underside of the
bridge panels, thus reducing the shear capacity of the beam to panel connection.
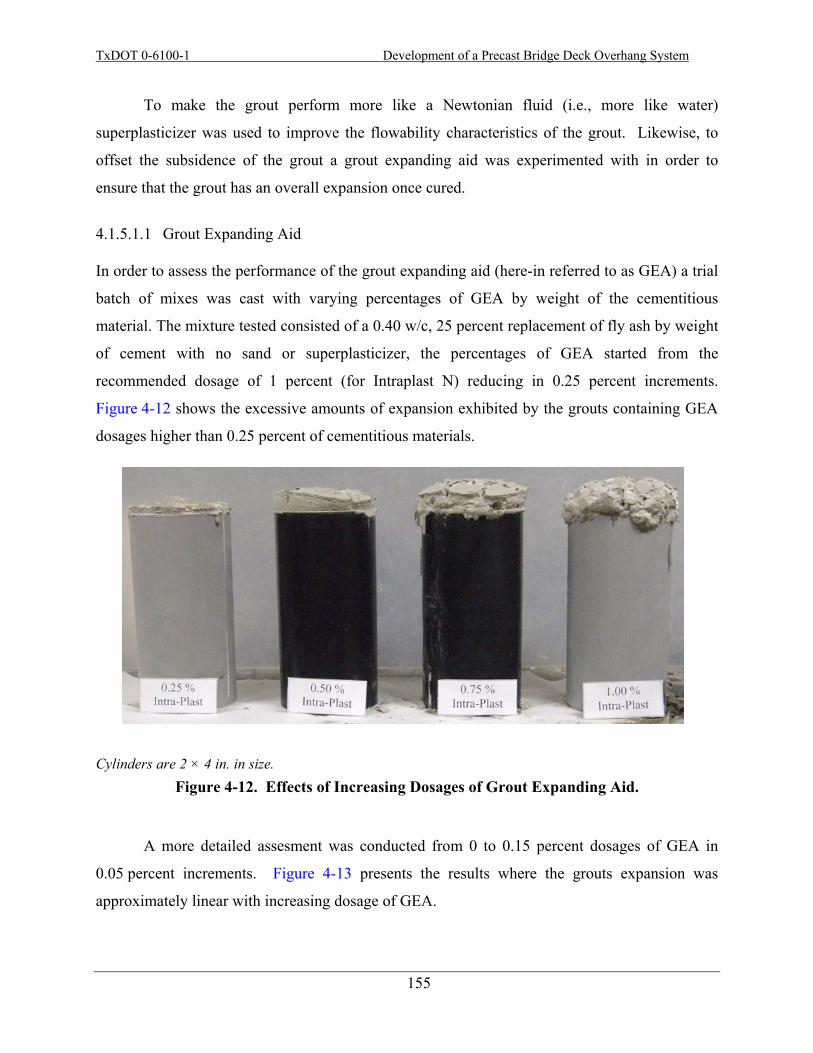
TxDOT 0-6100-1 Development of a Precast Bridge Deck Overhang System
155
To make the grout perform more like a Newtonian fluid (i.e., more like water)
superplasticizer was used to improve the flowability characteristics of the grout. Likewise, to
offset the subsidence of the grout a grout expanding aid was experimented with in order to
ensure that the grout has an overall expansion once cured.
4.1.5.1.1 Grout Expanding Aid
In order to assess the performance of the grout expanding aid (here-in referred to as GEA) a trial
batch of mixes was cast with varying percentages of GEA by weight of the cementitious
material. The mixture tested consisted of a 0.40 w/c, 25 percent replacement of fly ash by weight
of cement with no sand or superplasticizer, the percentages of GEA started from the
recommended dosage of 1 percent (for Intraplast N) reducing in 0.25 percent increments.
Figure 4-12 shows the excessive amounts of expansion exhibited by the grouts containing GEA
dosages higher than 0.25 percent of cementitious materials.
Cylinders are 2 × 4 in. in size. Figure 4-12. Effects of Increasing Dosages of Grout Expanding Aid.
A more detailed assesment was conducted from 0 to 0.15 percent dosages of GEA in
0.05 percent increments. Figure 4-13 presents the results where the grouts expansion was
approximately linear with increasing dosage of GEA.
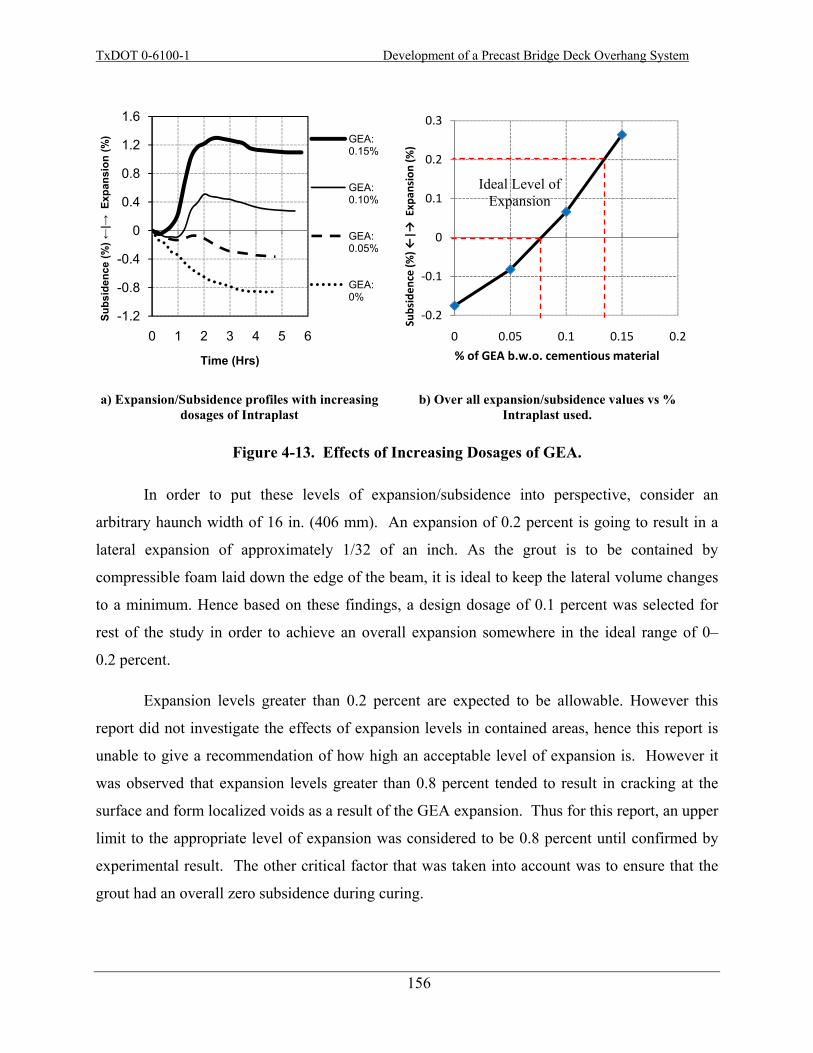
TxDOT 0-6100-1 Development of a Precast Bridge Deck Overhang System
156
Figure 4-13. Effects of Increasing Dosages of GEA.
In order to put these levels of expansion/subsidence into perspective, consider an
arbitrary haunch width of 16 in. (406 mm). An expansion of 0.2 percent is going to result in a
lateral expansion of approximately 1/32 of an inch. As the grout is to be contained by
compressible foam laid down the edge of the beam, it is ideal to keep the lateral volume changes
to a minimum. Hence based on these findings, a design dosage of 0.1 percent was selected for
rest of the study in order to achieve an overall expansion somewhere in the ideal range of 0–
0.2 percent.
Expansion levels greater than 0.2 percent are expected to be allowable. However this
report did not investigate the effects of expansion levels in contained areas, hence this report is
unable to give a recommendation of how high an acceptable level of expansion is. However it
was observed that expansion levels greater than 0.8 percent tended to result in cracking at the
surface and form localized voids as a result of the GEA expansion. Thus for this report, an upper
limit to the appropriate level of expansion was considered to be 0.8 percent until confirmed by
experimental result. The other critical factor that was taken into account was to ensure that the
grout had an overall zero subsidence during curing.
a) Expansion/Subsidence profiles with increasing dosages of Intraplast
b) Over all expansion/subsidence values vs % Intraplast used.
-1.2
-0.8
-0.4
0
0.4
0.8
1.2
1.6
0 1 2 3 4 5 6
Subs
iden
ce (%
) ←|→
Exp
ansi
on (%
)
Time (Hrs)
GEA: 0.15%
GEA: 0.10%
GEA: 0.05%
GEA: 0%
‐0.2
‐0.1
0
0.1
0.2
0.3
0 0.05 0.1 0.15 0.2
Subsiden
ce (%
) ←|→
Expan
sion
(%)
% of GEA b.w.o. cementious material
Ideal Level of Expansion

TxDOT 0-6100-1 Development of a Precast Bridge Deck Overhang System
157
4.1.5.1.2 Superplasticizer
Superplasticizer (SP) was dosed in fluid ounces per one hundred pounds of cementitious
material. Sika ViscoCrete 4100 high range water reducing admixture was used in this testing,
with recommended dosages for concrete of 3–8 fl oz per 100 lb of cementitious material (195–
520 ml per 100 kg). The grout used throughout this testing typically only required from 1.5–
3 fl oz per 100 lb of cementitious material (148–195 ml per 100 kg).
4.1.5.1.3 Development of Test Matrix
Due to the limited time frame that this testing was conducted, a full factorial experimental design
of varying each of the constituents was not feasible. Hence this stage of the testing considered a
variety of different mixes with more than one varying constituent (based on the technician’s
experience in order to narrow down the most suitable grout mixture to be used for the
construction of precast bridge design). Table 4-8 gives the varying parameters considered.
Table 4-8. Test Matrix of Prepackaged Grout Mix Designs. Parameter Quantity
w/c 0.35, 0.40, & 0.44 Fly Ash 0, 25, & 50% replacement b.w.o cement
Sand 0, 30. 50, & 135% replacement b.w.o cementitious material (approx 0, 13, 20, & 40% volume of total mixture volume respectively)
GEA 0.1% b.w.o cementitious material SP 1.5, 2.5, & 3.0 fl oz per 100 lb of cementitious material (98, 163, & 195 ml per 100 kg)
Appendix C gives a full matrix of the mixtures batched and tested with fresh and
hardened properties. The methodology of the preliminary testing process can be summarized
into the following order of findings:
• GEA worked most effectively when dosed at 0.1 percent b.w.o cementitious material (Note: b.w.o. = by weight of).
• Mixtures with a w/c of 0.44 resulted in a non-thixotropic grout that did not give suitable flowability for precast bridge design. When SP was added to fluidize the grout, the grout was highly susceptible to segregation, this indicating a lower w/c was required.
• Mixtures with a reduced w/c ratio of 0.35 combined with appropriate dosages of SP provided a good workable grout, but the strength was
TxDOT 0-6100-1 Development of a Precast Bridge Deck Overhang System
158
excessively high. Hence, such a low w/c was considered as an uneconomical use of grout. A w/c of 0.40 provided a good compromise.
• Increasing dosages of fly ash increased the flowability and dimensional stability of the grout, as well as providing a more economical grout. As commonly reported, fly ash can also attribute to increasing durability and corrosion resistance of concrete; however, as the short term strength development is compromised by higher dosages of fly ash, a dosage of 25 percent replacement b.w.o cement seemed a reasonable compromise.
• The highest dosage of sand possible was desirable as it acts as both a bulking material to provide a more economical grout as well as improving the dimensional stability. Increasing the dosage of sand was also thought to increase the coefficient of friction of the grout, thus improving the shear performance of the beam to panel connection. This theory was experimentally proven with one of the test specimens used in section 3. However, more testing is required to verify this result.
• Grouts with high sand contents could obtain the required flowability with appropriate dosages of SP, but the grout was more susceptible to stiffening up and losing its flowability with time. This would reduce the window of opportunity that the contractor has to place the grout; hence, it was decided that a sand content of 50 percent replacement b.w.o of cementitious material (approx 20 percent of the total volume) was an ideal compromise.
4.1.5.2 Control Mixture From the preliminary testing phase, a control mixture was selected based on its fresh and
hardened state properties as well as the areas of consideration discussed in the previous section.
The grout selected consisted of a w/c of 0.40, 25 percent fly ash replacement b.w.o cement,
50 percent sand replacement b.w.o cementitious material, 0.1 percent grout expanding aid b.w.o
cementitious material, and 2.5 fl oz of superplasticizer per 100 lb of cementitious material
(163 mm per 100 kg). This grout mixture was tested in a grout track designed and built to
replicate the haunch of a precast overhang bridge, (referred to in section 4.1.6). The haunch
height was set to the minimum critical height of 0.5-in. (13 mm), which represents the smallest
gap that the grout is required to pass through. The test demonstrated that the grout had sufficient
flowability to flow through the haunch under its self weight.
TxDOT 0-6100-1 Development of a Precast Bridge Deck Overhang System
159
4.1.5.3 Full Factorial Analysis of Grout Parameters The purpose of this section was not to define a mix that has to be used for construction of precast
overhang bridge decks; instead it is to outline the key parameters in the mixture that control the
performance of the grout. This will either provide the contractor with the information necessary
to establish their own grout design as they see fit or advise what the critical parameters of the
grout mixture are that will require the most quality control when batching the mixture on site.
Table 4-9 provides the measure that each parameter was varied based on the judgment of the
research team.
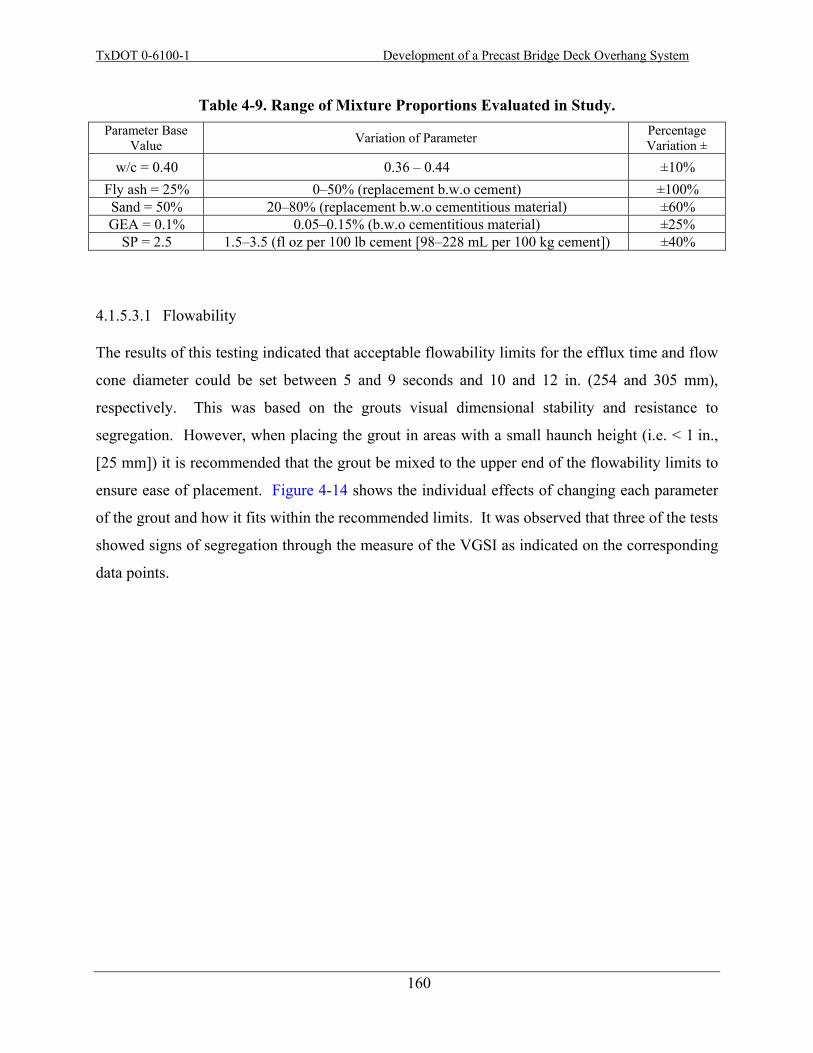
TxDOT 0-6100-1 Development of a Precast Bridge Deck Overhang System
160
Table 4-9. Range of Mixture Proportions Evaluated in Study. Parameter Base
Value Variation of Parameter Percentage Variation ±
w/c = 0.40 0.36 – 0.44 ±10% Fly ash = 25% 0–50% (replacement b.w.o cement) ±100% Sand = 50% 20–80% (replacement b.w.o cementitious material) ±60% GEA = 0.1% 0.05–0.15% (b.w.o cementitious material) ±25%
SP = 2.5 1.5–3.5 (fl oz per 100 lb cement [98–228 mL per 100 kg cement]) ±40%
4.1.5.3.1 Flowability
The results of this testing indicated that acceptable flowability limits for the efflux time and flow
cone diameter could be set between 5 and 9 seconds and 10 and 12 in. (254 and 305 mm),
respectively. This was based on the grouts visual dimensional stability and resistance to
segregation. However, when placing the grout in areas with a small haunch height (i.e. < 1 in.,
[25 mm]) it is recommended that the grout be mixed to the upper end of the flowability limits to
ensure ease of placement. Figure 4-14 shows the individual effects of changing each parameter
of the grout and how it fits within the recommended limits. It was observed that three of the tests
showed signs of segregation through the measure of the VGSI as indicated on the corresponding
data points.
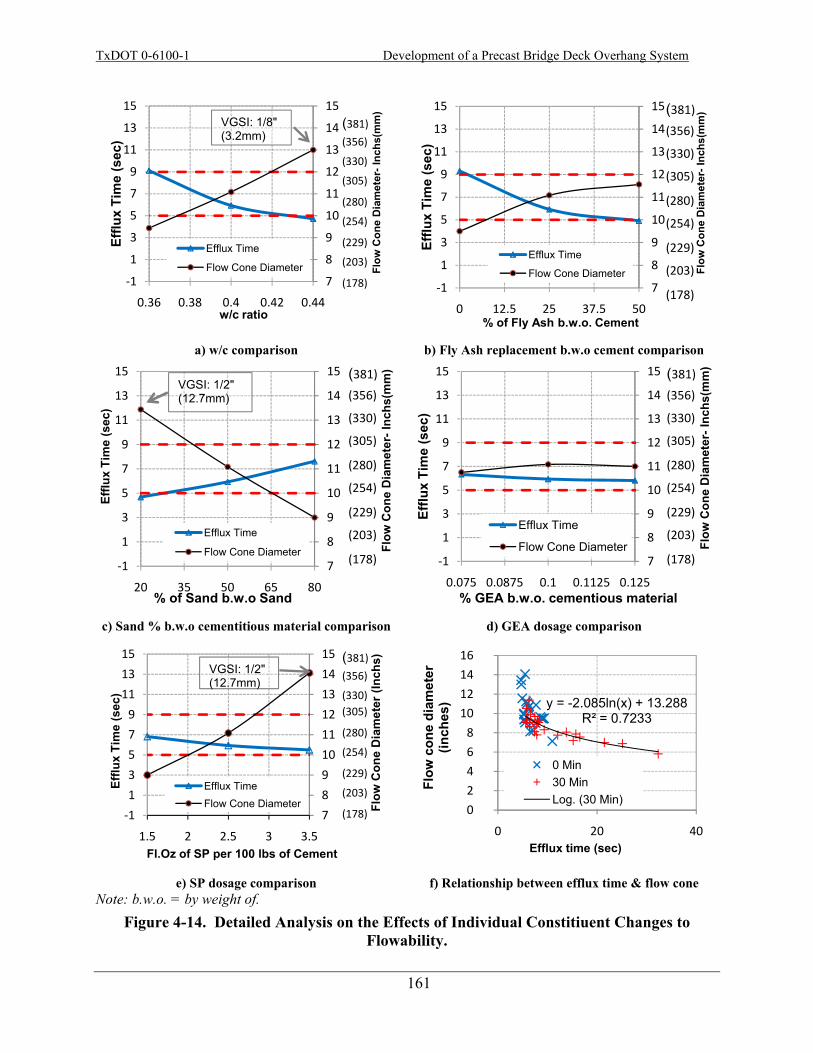
TxDOT 0-6100-1 Development of a Precast Bridge Deck Overhang System
161
a) w/c comparison b) Fly Ash replacement b.w.o cement comparison
c) Sand % b.w.o cementitious material comparison d) GEA dosage comparison
e) SP dosage comparison f) Relationship between efflux time & flow cone
Note: b.w.o. = by weight of. Figure 4-14. Detailed Analysis on the Effects of Individual Constitiuent Changes to
Flowability.
7
8
9
10
11
12
13
14
15
‐1
1
3
5
7
9
11
13
15
0.36 0.38 0.4 0.42 0.44
Flow
Con
e D
iam
eter
-Inc
hs(m
m)
Efflu
x Ti
me
(sec
)
w/c ratio
Efflux Time
Flow Cone Diameter
VGSI: 1/8"(3.2mm)
(381)(356)
(330)
(305)
(280)
(254)
(229)
(203)
(178) 7
8
9
10
11
12
13
14
15
‐1
1
3
5
7
9
11
13
15
0 12.5 25 37.5 50
Flow
Con
e D
iam
eter
-Inc
hs(m
m)
Efflu
x Ti
me
(sec
)
% of Fly Ash b.w.o. Cement
Efflux Time
Flow Cone Diameter
(381)(356)
(330)
(305)
(280)
(254)
(229)
(203)
(178)
7
8
9
10
11
12
13
14
15
‐1
1
3
5
7
9
11
13
15
20 35 50 65 80
Flow
Con
e D
iam
eter
-Inc
hs(m
m)
Efflu
x Ti
me
(sec
)
% of Sand b.w.o Sand
Efflux Time
Flow Cone Diameter
VGSI: 1/2" (12.7mm)
(381)(356)
(330)
(305)
(280)
(254)
(229)
(203)
(178) 7
8
9
10
11
12
13
14
15
‐1
1
3
5
7
9
11
13
15
0.075 0.0875 0.1 0.1125 0.125
Flow
Con
e D
iam
eter
-Inc
hs(m
m)
Efflu
x Ti
me
(sec
)
% GEA b.w.o. cementious material
Efflux Time
Flow Cone Diameter
(381)(356)
(330)
(305)
(280)
(254)
(229)
(203)
(178)
7
8
9
10
11
12
13
14
15
‐1
1
3
5
7
9
11
13
15
1.5 2 2.5 3 3.5
Flow
Con
e D
iam
eter
(Inc
hs)
Efflu
x Ti
me
(sec
)
Fl.Oz of SP per 100 lbs of Cement
Efflux TimeFlow Cone Diameter
VGSI: 1/2" (12.7mm)
(381)(356)
(330)(305)
(280)
(254)
(229)
(203)
(178)
y = -2.085ln(x) + 13.288R² = 0.7233
0
2
4
6
8
10
12
14
16
0 20 40
Flow
con
e di
amet
er
(inch
es)
Efflux time (sec)
0 Min30 MinLog. (30 Min)
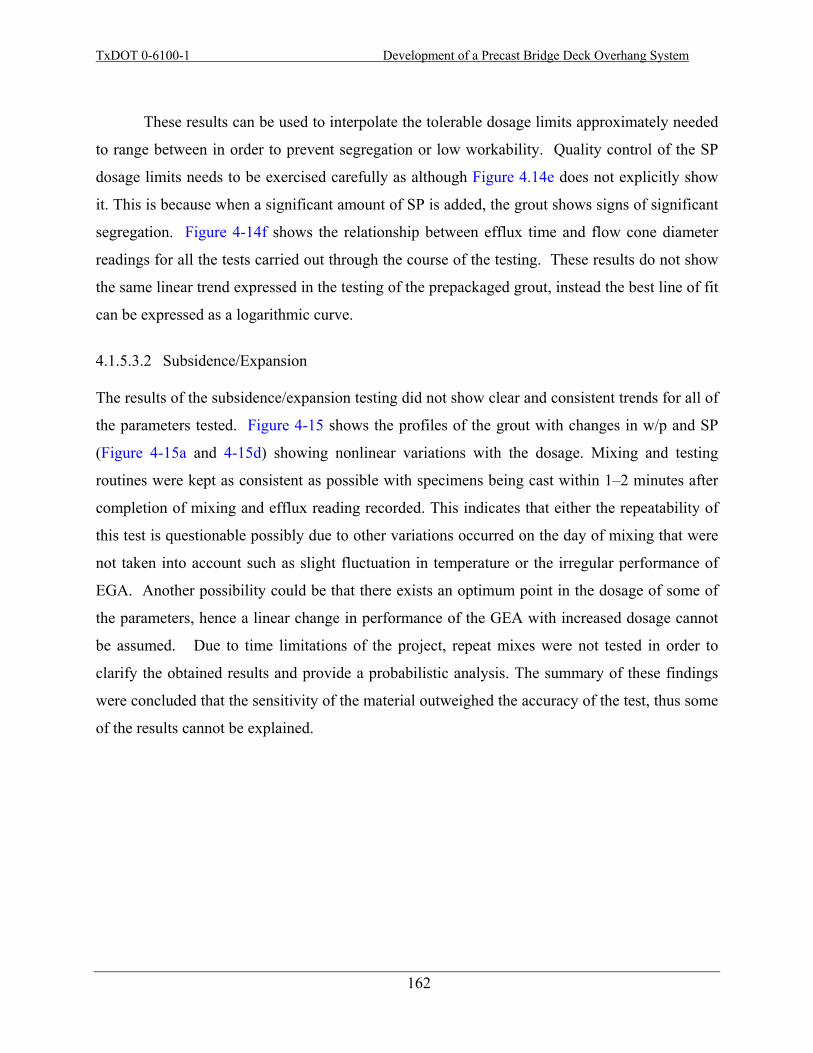
TxDOT 0-6100-1 Development of a Precast Bridge Deck Overhang System
162
These results can be used to interpolate the tolerable dosage limits approximately needed
to range between in order to prevent segregation or low workability. Quality control of the SP
dosage limits needs to be exercised carefully as although Figure 4.14e does not explicitly show
it. This is because when a significant amount of SP is added, the grout shows signs of significant
segregation. Figure 4-14f shows the relationship between efflux time and flow cone diameter
readings for all the tests carried out through the course of the testing. These results do not show
the same linear trend expressed in the testing of the prepackaged grout, instead the best line of fit
can be expressed as a logarithmic curve.
4.1.5.3.2 Subsidence/Expansion
The results of the subsidence/expansion testing did not show clear and consistent trends for all of
the parameters tested. Figure 4-15 shows the profiles of the grout with changes in w/p and SP
(Figure 4-15a and 4-15d) showing nonlinear variations with the dosage. Mixing and testing
routines were kept as consistent as possible with specimens being cast within 1–2 minutes after
completion of mixing and efflux reading recorded. This indicates that either the repeatability of
this test is questionable possibly due to other variations occurred on the day of mixing that were
not taken into account such as slight fluctuation in temperature or the irregular performance of
EGA. Another possibility could be that there exists an optimum point in the dosage of some of
the parameters, hence a linear change in performance of the GEA with increased dosage cannot
be assumed. Due to time limitations of the project, repeat mixes were not tested in order to
clarify the obtained results and provide a probabilistic analysis. The summary of these findings
were concluded that the sensitivity of the material outweighed the accuracy of the test, thus some
of the results cannot be explained.
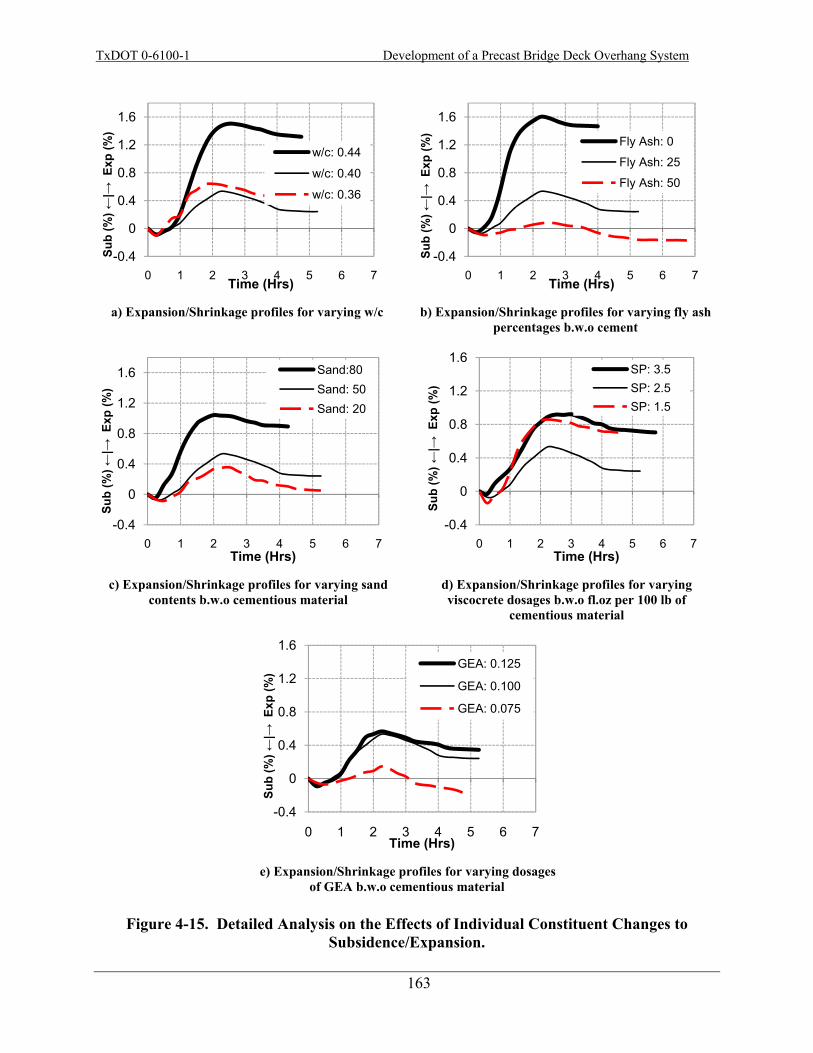
TxDOT 0-6100-1 Development of a Precast Bridge Deck Overhang System
163
a) Expansion/Shrinkage profiles for varying w/c b) Expansion/Shrinkage profiles for varying fly ash
percentages b.w.o cement
c) Expansion/Shrinkage profiles for varying sand
contents b.w.o cementious material d) Expansion/Shrinkage profiles for varying viscocrete dosages b.w.o fl.oz per 100 lb of
cementious material
e) Expansion/Shrinkage profiles for varying dosages
of GEA b.w.o cementious material
Figure 4-15. Detailed Analysis on the Effects of Individual Constituent Changes to Subsidence/Expansion.
-0.4
0
0.4
0.8
1.2
1.6
0 1 2 3 4 5 6 7
Sub
(%) ←
|→ E
xp (%
)
Time (Hrs)
w/c: 0.44
w/c: 0.40
w/c: 0.36
-0.4
0
0.4
0.8
1.2
1.6
0 1 2 3 4 5 6 7
Sub
(%) ←
|→ E
xp (%
)
Time (Hrs)
Fly Ash: 0
Fly Ash: 25
Fly Ash: 50
-0.4
0
0.4
0.8
1.2
1.6
0 1 2 3 4 5 6 7
Sub
(%) ←
|→ E
xp (%
)
Time (Hrs)
Sand:80Sand: 50Sand: 20
-0.4
0
0.4
0.8
1.2
1.6
0 1 2 3 4 5 6 7
Sub
(%) ←
|→ E
xp (%
)
Time (Hrs)
SP: 3.5SP: 2.5SP: 1.5
-0.4
0
0.4
0.8
1.2
1.6
0 1 2 3 4 5 6 7
Sub
(%) ←
|→ E
xp (%
)
Time (Hrs)
GEA: 0.125
GEA: 0.100
GEA: 0.075
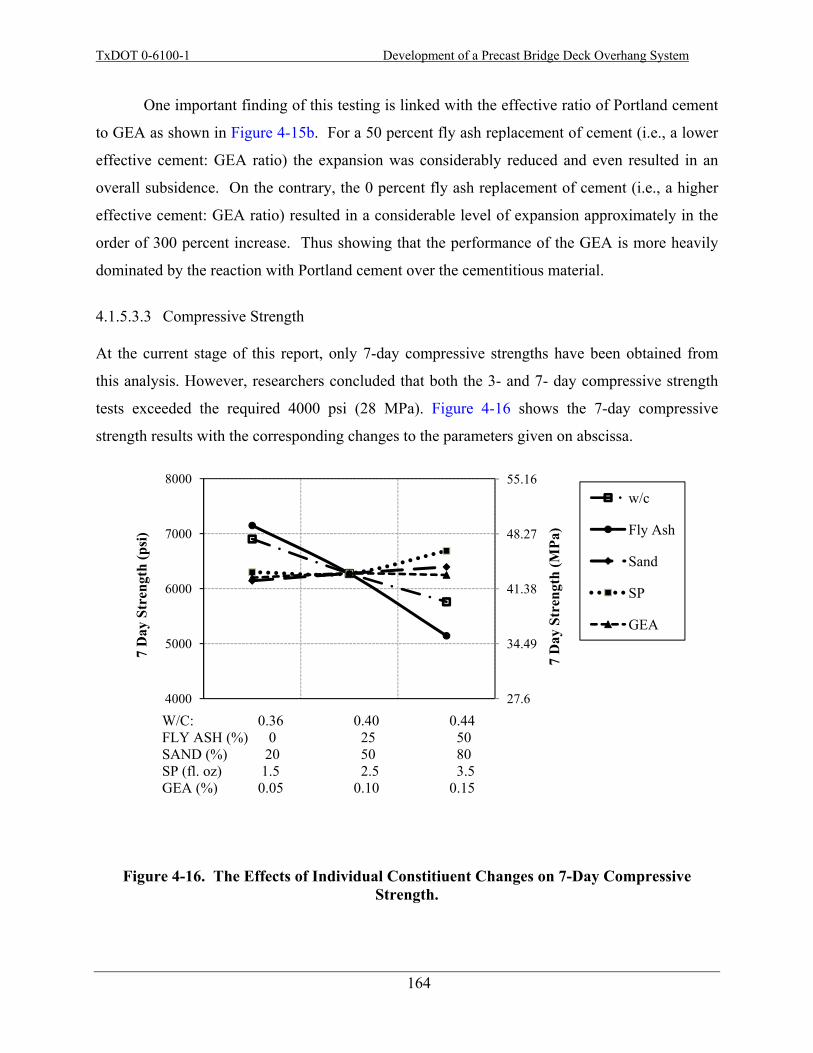
TxDOT 0-6100-1 Development of a Precast Bridge Deck Overhang System
164
One important finding of this testing is linked with the effective ratio of Portland cement
to GEA as shown in Figure 4-15b. For a 50 percent fly ash replacement of cement (i.e., a lower
effective cement: GEA ratio) the expansion was considerably reduced and even resulted in an
overall subsidence. On the contrary, the 0 percent fly ash replacement of cement (i.e., a higher
effective cement: GEA ratio) resulted in a considerable level of expansion approximately in the
order of 300 percent increase. Thus showing that the performance of the GEA is more heavily
dominated by the reaction with Portland cement over the cementitious material.
4.1.5.3.3 Compressive Strength
At the current stage of this report, only 7-day compressive strengths have been obtained from
this analysis. However, researchers concluded that both the 3- and 7- day compressive strength
tests exceeded the required 4000 psi (28 MPa). Figure 4-16 shows the 7-day compressive
strength results with the corresponding changes to the parameters given on abscissa.
Figure 4-16. The Effects of Individual Constitiuent Changes on 7-Day Compressive Strength.
27.6
34.49
41.38
48.27
55.16
4000
5000
6000
7000
8000
7 D
ay S
tren
gth
(MPa
)
7 D
ay S
tren
gth
(psi
)
w/c
Fly Ash
Sand
SP
GEA
W/C: 0.36 0.40 0.44FLY ASH (%) 0 25 50SAND (%) 20 50 80SP (fl. oz) 1.5 2.5 3.5GEA (%) 0.05 0.10 0.15

TxDOT 0-6100-1 Development of a Precast Bridge Deck Overhang System
165
4.1.5.3.4 Bleed Water
The level of bleed water for this analysis were all under 0.4 percent (with the exemption of the
parameters: w/p = 0.44 and SP = 3.5, which were 0.7 and 0.46 percent, respectively). Hence, the
results did not show any clear trend lines with the corresponding variation in parameters due to
the inaccuracy of this test with such low levels of bleed water. However, as discussed in section
4.1.1.4, an acceptable level of bleed water is below 0.5 percent. This grout mixture is within an
acceptable standard (except when w/p = 0.44 and SP = 3.5, which also fail in the flowability
criteria).
4.1.5.3.5 Shrinkage
Figure 4-17 shows the results from shrinkage testing, where clear trends can be observed for
variations in w/c, fly ash, and sand. Reductions in overall shrinkage can be obtained by either
reducing the w/c or fly ash content, or by increasing the sand content thus improving the
dimensional stability of the grout. Variations in the admixtures did not show any variations to
shrinkage in the grout.
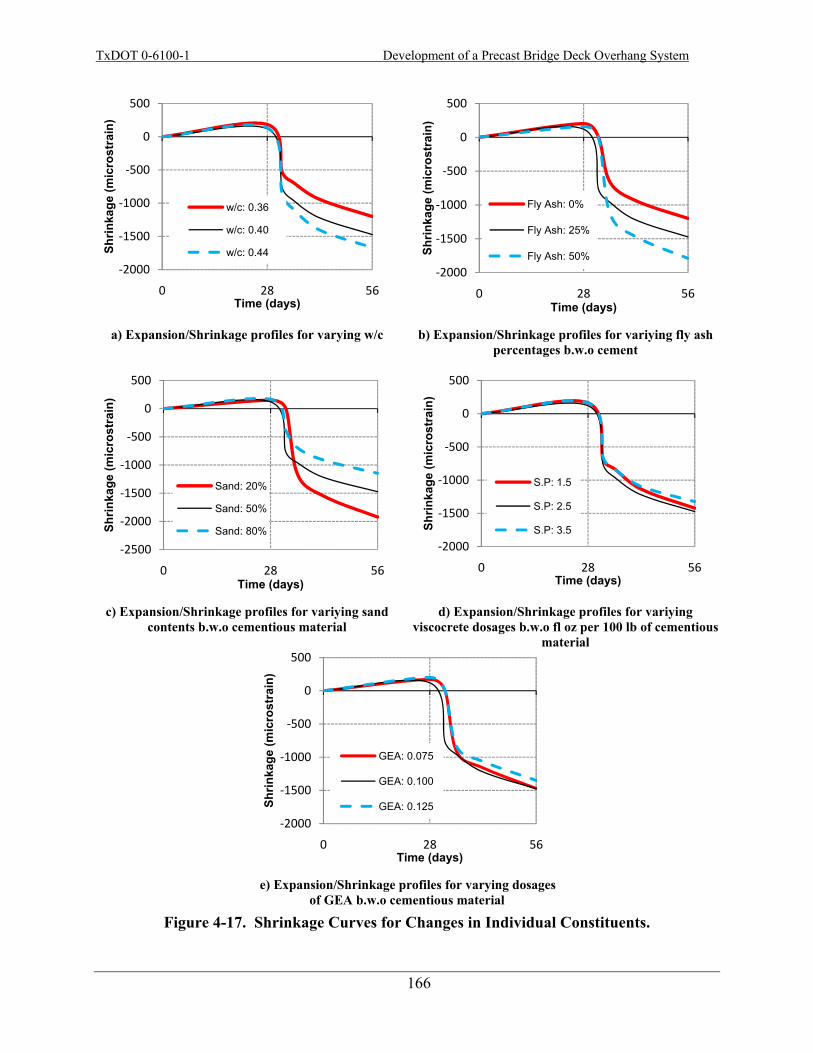
TxDOT 0-6100-1 Development of a Precast Bridge Deck Overhang System
166
a) Expansion/Shrinkage profiles for varying w/c b) Expansion/Shrinkage profiles for variying fly ash
percentages b.w.o cement
c) Expansion/Shrinkage profiles for variying sand
contents b.w.o cementious material d) Expansion/Shrinkage profiles for variying
viscocrete dosages b.w.o fl oz per 100 lb of cementious material
e) Expansion/Shrinkage profiles for varying dosages
of GEA b.w.o cementious material
Figure 4-17. Shrinkage Curves for Changes in Individual Constituents.
‐2000
‐1500
‐1000
‐500
0
500
0 28 56
Shrin
kage
(mic
rost
rain
)
Time (days)
w/c: 0.36
w/c: 0.40
w/c: 0.44
‐2000
‐1500
‐1000
‐500
0
500
0 28 56
Shrin
kage
(mic
rost
rain
)
Time (days)
Fly Ash: 0%
Fly Ash: 25%
Fly Ash: 50%
‐2500
‐2000
‐1500
‐1000
‐500
0
500
0 28 56
Shrin
kage
(mic
rost
rain
)
Time (days)
Sand: 20%
Sand: 50%
Sand: 80%‐2000
‐1500
‐1000
‐500
0
500
0 28 56
Shrin
kage
(mic
rost
rain
)
Time (days)
S.P: 1.5
S.P: 2.5
S.P: 3.5
‐2000
‐1500
‐1000
‐500
0
500
0 28 56
Shrin
kage
(mic
rost
rain
)
Time (days)
GEA: 0.075
GEA: 0.100
GEA: 0.125
TxDOT 0-6100-1 Development of a Precast Bridge Deck Overhang System
167
4.1.5.3.6 Sensitivity Analysis
In order to determine the sensitivity of each of the parameters tested in this analysis, the percent
change in the results from the control was plotted against the percent change in parameter from
the control for each of the test procedures. Figure 4-18 provides these results where the
parameter with the highest sensitivity can be accessed from the line that has the steepest slope,
indicating the highest change per percent variation of the parameter. Figure 4-18 shows that the
most sensitive parameter for the efflux time of the conventional grout is the w/p. When the w/p
was increased by approximately 10 percent, the efflux time decreased by approximately 25
percent and when the w/p was decreased by approximately 10 percent the efflux time increased
by approximately 50 percent. The sensitivity of the fresh properties is more critical than the
hardened properties, with the expansion/subsidence properties being the most sensitive to
change. The sensitivity of the expansion/subsidence is somewhat questionable due to variability
in the results. However, provided that the grout exhibits an overall expansive tendency (that is
not excessively large according to the discretion of the engineer), to ensure no loss of bond
strength between the haunch grout and bottom of the bridge deck panels, it should be adequate
for this design application. All of the tests in the analysis showed overall expansive tendencies
with the exception of the increased dosage of fly ash and the decreased dosage of GEA.
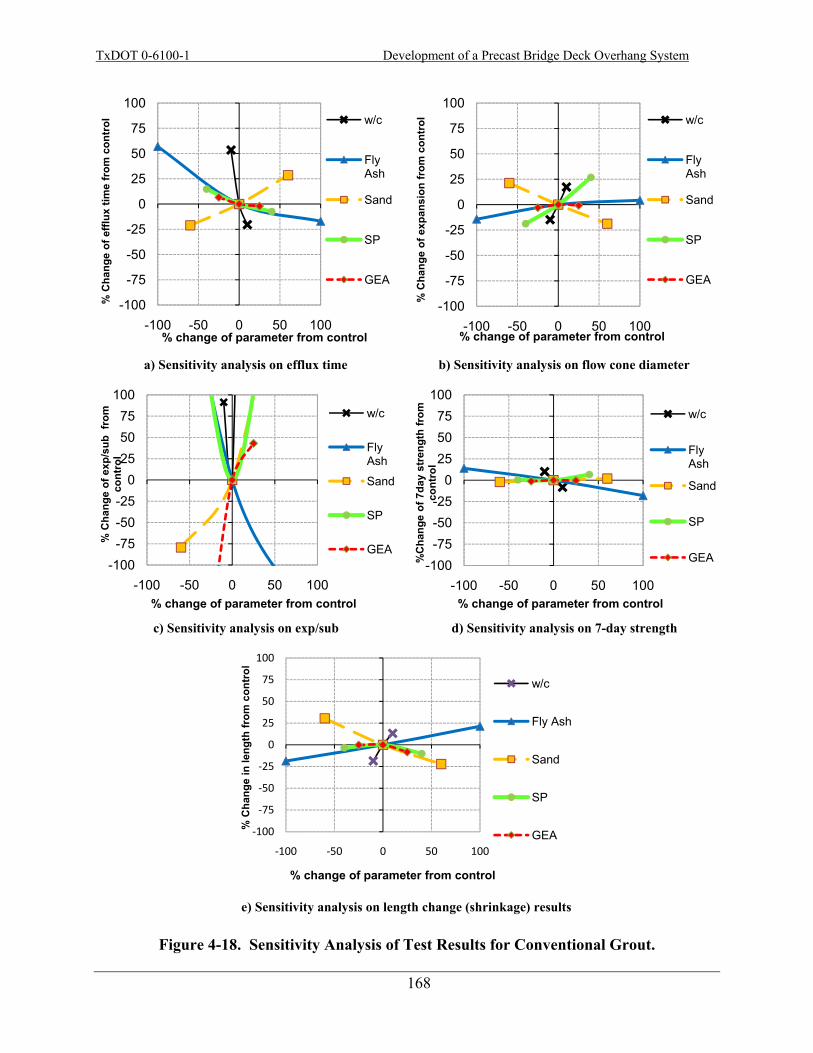
TxDOT 0-6100-1 Development of a Precast Bridge Deck Overhang System
168
a) Sensitivity analysis on efflux time b) Sensitivity analysis on flow cone diameter
c) Sensitivity analysis on exp/sub d) Sensitivity analysis on 7-day strength
e) Sensitivity analysis on length change (shrinkage) results
Figure 4-18. Sensitivity Analysis of Test Results for Conventional Grout.
-100
-75
-50
-25
0
25
50
75
100
-100 -50 0 50 100
% C
hang
e of
effl
ux ti
me
from
con
trol
% change of parameter from control
w/c
Fly Ash
Sand
SP
GEA
-100
-75
-50
-25
0
25
50
75
100
-100 -50 0 50 100
% C
hang
e of
exp
ansi
on fr
om c
ontr
ol
% change of parameter from control
w/c
Fly Ash
Sand
SP
GEA
-100-75-50-25
0255075
100
-100 -50 0 50 100
% C
hang
e of
exp
/sub
fro
m
cont
rol
% change of parameter from control
w/c
Fly Ash
Sand
SP
GEA-100
-75-50-25
0255075
100
-100 -50 0 50 100
%C
hang
e of
7da
y st
reng
th fr
om
cont
rol
% change of parameter from control
w/c
Fly Ash
Sand
SP
GEA
‐100
‐75
‐50
‐25
0
25
50
75
100
‐100 ‐50 0 50 100
% C
hang
e in
leng
th fr
om c
ontr
ol
% change of parameter from control
w/c
Fly Ash
Sand
SP
GEA
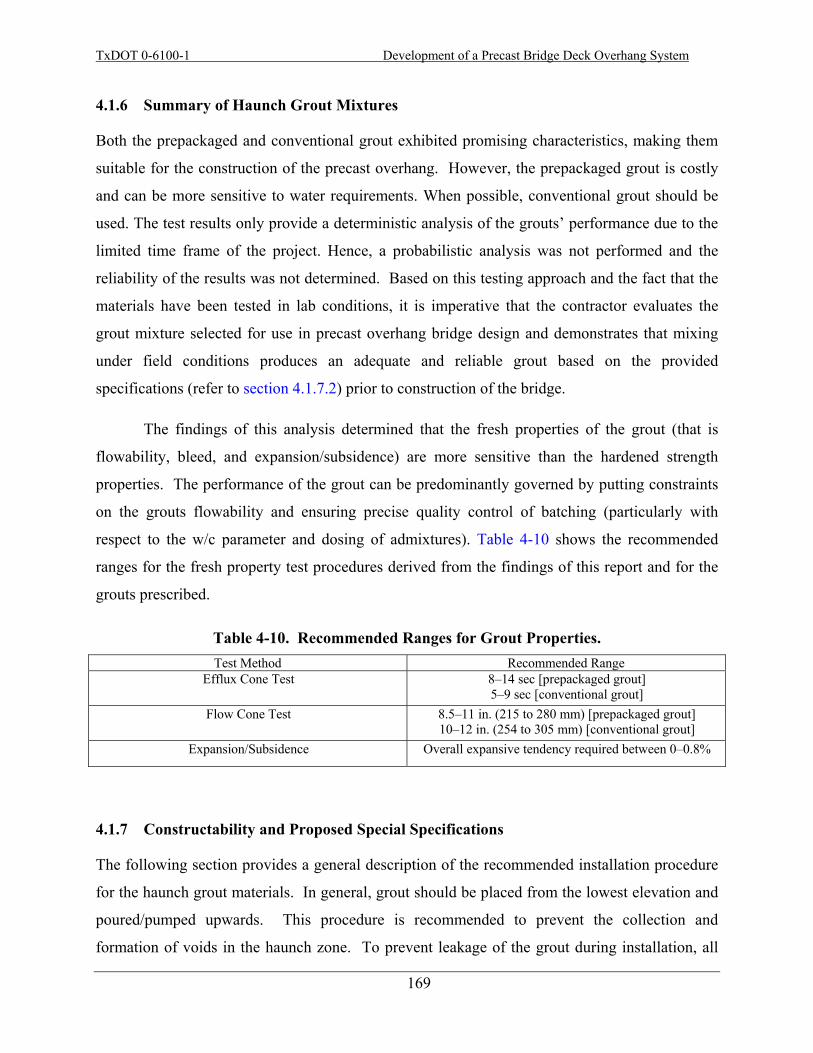
TxDOT 0-6100-1 Development of a Precast Bridge Deck Overhang System
169
4.1.6 Summary of Haunch Grout Mixtures
Both the prepackaged and conventional grout exhibited promising characteristics, making them
suitable for the construction of the precast overhang. However, the prepackaged grout is costly
and can be more sensitive to water requirements. When possible, conventional grout should be
used. The test results only provide a deterministic analysis of the grouts’ performance due to the
limited time frame of the project. Hence, a probabilistic analysis was not performed and the
reliability of the results was not determined. Based on this testing approach and the fact that the
materials have been tested in lab conditions, it is imperative that the contractor evaluates the
grout mixture selected for use in precast overhang bridge design and demonstrates that mixing
under field conditions produces an adequate and reliable grout based on the provided
specifications (refer to section 4.1.7.2) prior to construction of the bridge.
The findings of this analysis determined that the fresh properties of the grout (that is
flowability, bleed, and expansion/subsidence) are more sensitive than the hardened strength
properties. The performance of the grout can be predominantly governed by putting constraints
on the grouts flowability and ensuring precise quality control of batching (particularly with
respect to the w/c parameter and dosing of admixtures). Table 4-10 shows the recommended
ranges for the fresh property test procedures derived from the findings of this report and for the
grouts prescribed.
Table 4-10. Recommended Ranges for Grout Properties. Test Method Recommended Range
Efflux Cone Test 8–14 sec [prepackaged grout] 5–9 sec [conventional grout]
Flow Cone Test 8.5–11 in. (215 to 280 mm) [prepackaged grout] 10–12 in. (254 to 305 mm) [conventional grout]
Expansion/Subsidence Overall expansive tendency required between 0–0.8%
4.1.7 Constructability and Proposed Special Specifications
The following section provides a general description of the recommended installation procedure
for the haunch grout materials. In general, grout should be placed from the lowest elevation and
poured/pumped upwards. This procedure is recommended to prevent the collection and
formation of voids in the haunch zone. To prevent leakage of the grout during installation, all

TxDOT 0-6100-1 Development of a Precast Bridge Deck Overhang System
170
haunch form materials shall be well connected or adhered to the girders and the bottom of the
panels using glue, silicon, or any other methods as seen fit.
4.1.7.1 Construction Sequence for Haunch of the Partial Full-Depth Precast Overhang System
Grouting of the haunch involves a 5-step approach using appropriate grout and tested in
accordance with Special Specification XXXX (“XXXX” indicates that this is not yet an
approved TxDOT specification); Structural Grout for Haunch. Table 4-11 provides a general
procedure for placing grout. Table 4-12 provides a general procedure for constructing the
laboratory model.
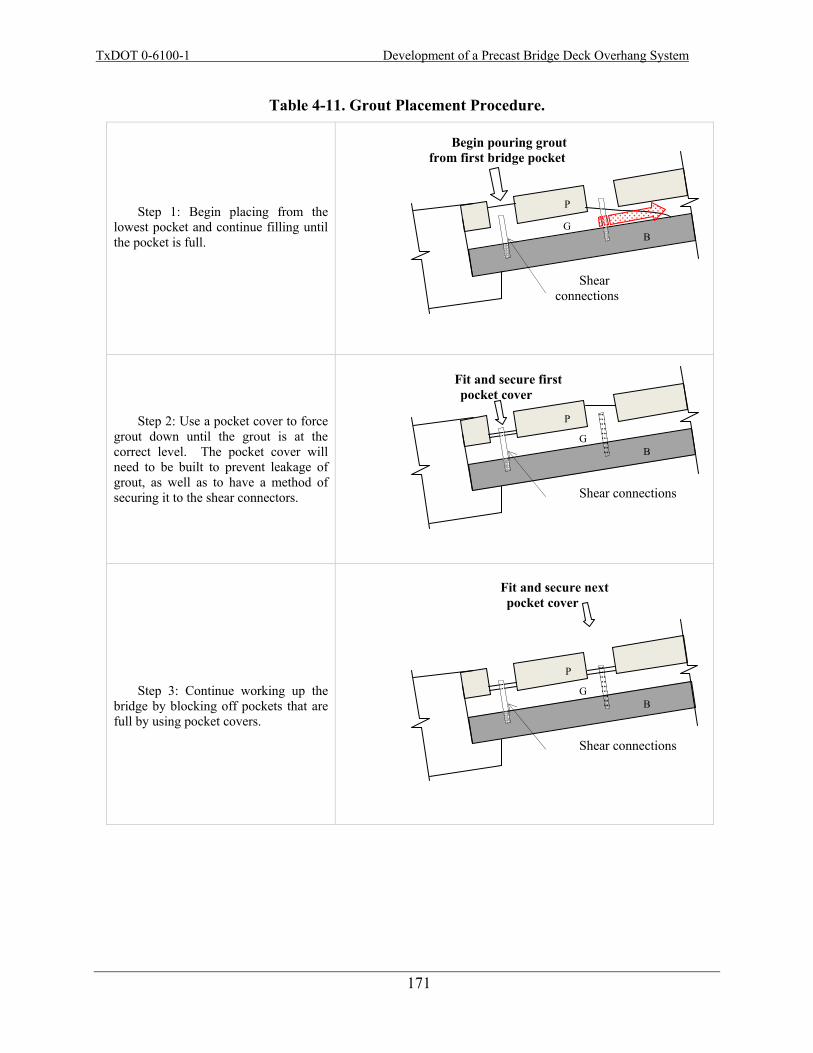
TxDOT 0-6100-1 Development of a Precast Bridge Deck Overhang System
171
Table 4-11. Grout Placement Procedure.
Step 1: Begin placing from the lowest pocket and continue filling until the pocket is full.
Step 2: Use a pocket cover to force grout down until the grout is at the correct level. The pocket cover will need to be built to prevent leakage of grout, as well as to have a method of securing it to the shear connectors.
Step 3: Continue working up the bridge by blocking off pockets that are full by using pocket covers.
P
BG
Shear connections
P
BG
Shear connections
Fit and secure first pocket cover
P
BG
Begin pouring grout from first bridge pocket
Shear connections
Fit and secure next pocket cover
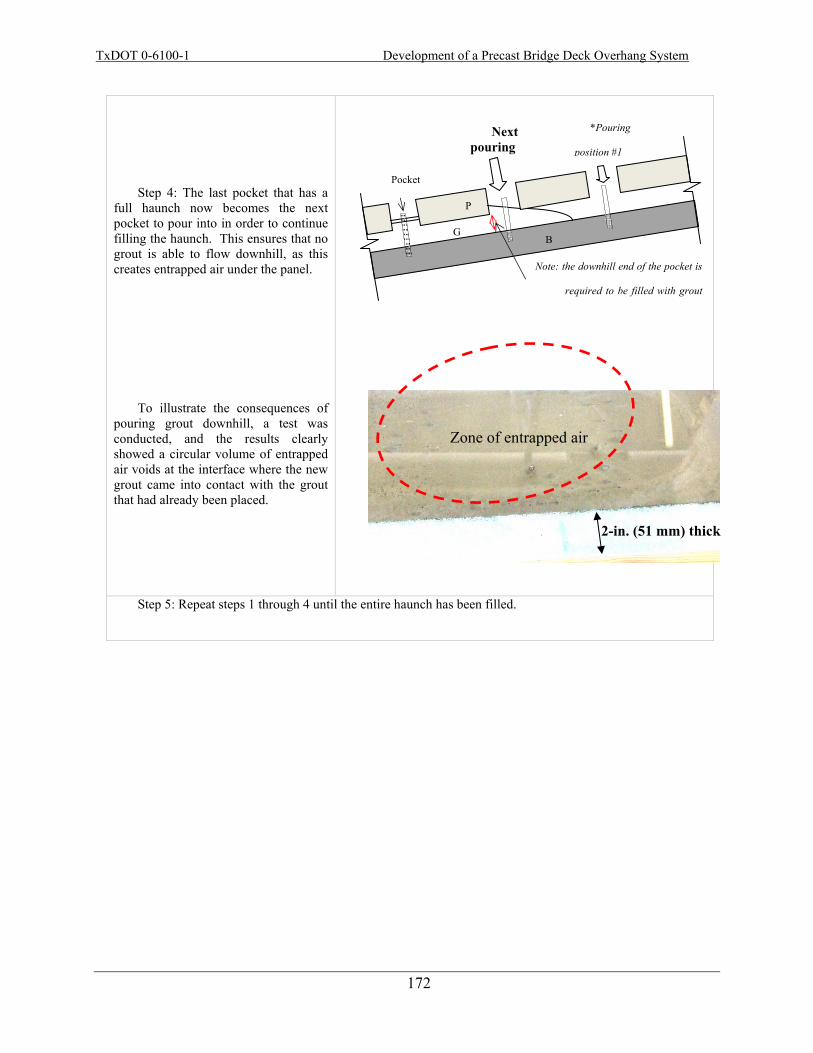
TxDOT 0-6100-1 Development of a Precast Bridge Deck Overhang System
172
Step 4: The last pocket that has a full haunch now becomes the next pocket to pour into in order to continue filling the haunch. This ensures that no grout is able to flow downhill, as this creates entrapped air under the panel.
To illustrate the consequences of pouring grout downhill, a test was conducted, and the results clearly showed a circular volume of entrapped air voids at the interface where the new grout came into contact with the grout that had already been placed.
Step 5: Repeat steps 1 through 4 until the entire haunch has been filled.
P
BG
Next pouring
k
*Pouring
position #1
Note: the downhill end of the pocket is
required to be filled with grout
Zone of entrapped air
2-in. (51 mm) thick
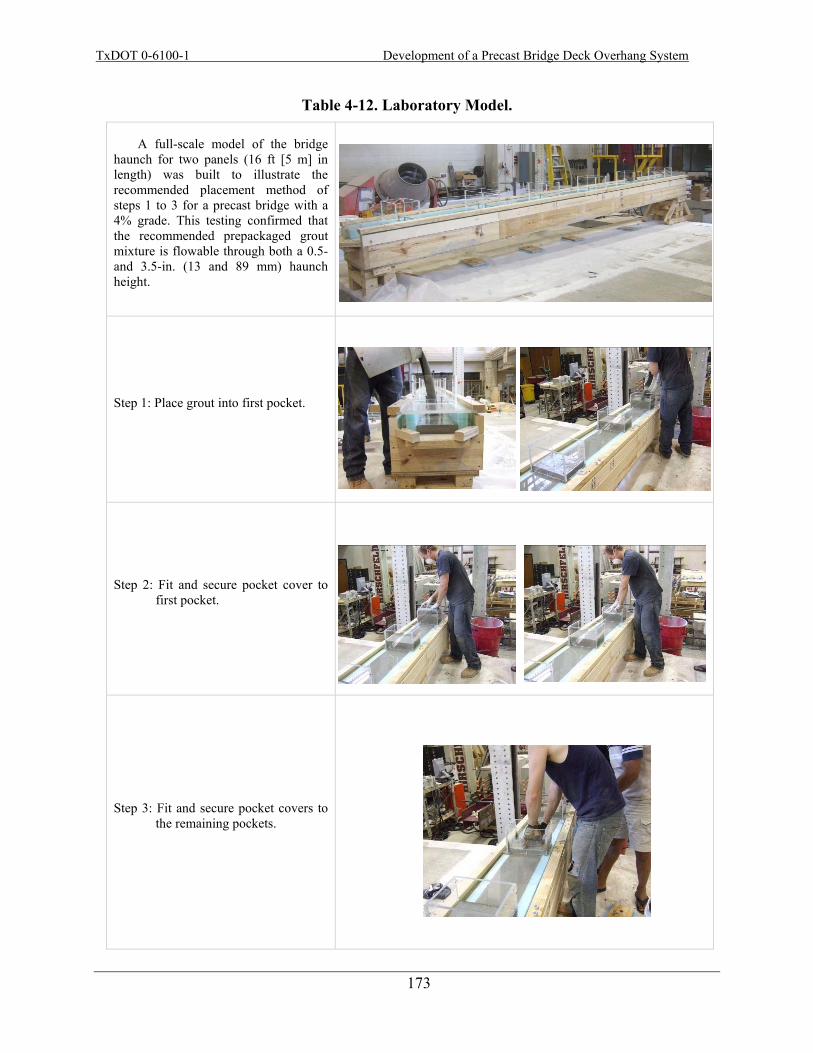
TxDOT 0-6100-1 Development of a Precast Bridge Deck Overhang System
173
Table 4-12. Laboratory Model.
A full-scale model of the bridge haunch for two panels (16 ft [5 m] in length) was built to illustrate the recommended placement method of steps 1 to 3 for a precast bridge with a 4% grade. This testing confirmed that the recommended prepackaged grout mixture is flowable through both a 0.5- and 3.5-in. (13 and 89 mm) haunch height.
Step 1: Place grout into first pocket.
Step 2: Fit and secure pocket cover to first pocket.
Step 3: Fit and secure pocket covers to the remaining pockets.
TxDOT 0-6100-1 Development of a Precast Bridge Deck Overhang System
174
4.1.7.2 Special Specification Appendix D is a recommended special specification for the haunch grout for precast overhang
systems. As previously discussed, the findings of this report have been evaluated in the
controlled laboratory conditions, therefore, it is imperative that the contractor evaluates the grout
mixture selected for use in precast overhang bridge design and demonstrates that mixing under
field conditions produces an adequate and reliable grout meeting the specifications and
guidelines.
4.1.8 Summary of Grout Testing
The purpose of this material testing program was to identify a grout that can be used in the
haunch zone between bridge panels with bridge girders for precast overhang bridge construction
based on the fresh and hardened state characteristics of the grout. SikaGroutTM 212 and a
conventional grout were evaluated for this testing producing a set of guidelines for the ranges of
material properties that have been recommended for the use in precast overhang bridge deck
construction. A proposed special provision for the grout material on precast panel projects has
been provided.
TxDOT 0-6100-1 Development of a Precast Bridge Deck Overhang System
175
4.2 HAUNCH FORM MATERIALS
The haunch, the space between the beam and the bridge deck, plays an important role in the
construction of bridges. This area may need to be adjusted significantly in the field to ensure
that the correct roadway profile and bridge deck thickness is provided. Determining the height
of the haunch can become especially challenging when prestressed concrete beams are used, as
the camber can be quite variable between beams of the same design (Kelly et al., 1987).
There has been several precast bridge deck systems developed in the last 10 years and
implemented by various State Highway Agencies (SHAs) that have demonstrated that a precast
bridge deck system needs to have the ability to be adjustable to meet construction and grading
tolerances. However, previously developed systems have largely ignored the importance of the
haunch and often require workers to go back under the bridge once the geometry is established to
manually complete the forming of the haunch (Badie et al., 2006; Sullivan, 2007). While these
approaches appear to have been satisfactory for past projects, the performance of precast deck
systems can be improved if a forming system is used that provides the strength needed to resist
the lateral pressure from the fluid cementitious material filling the haunch, allows for an easy
adjustment of the system, and does not require workers under the bridge deck for either
installation or removal.
During an early meeting with TxDOT personnel, the research team proposed
investigating low-density packing foam for this application instead of a spring loaded form
system. The suggestion was approved and four different foams and three different adhesives
were investigated for their ability to resist lateral pressure, direct tension, and a combination of
tension and lateral pressure. These tests were designed to best simulate the performance of the
glue and adhesives in different phases of the construction.
4.2.1 Experimental Plan
In the following tests, different combinations of foams and adhesives were investigated at
different ages. In all of the tests, the initial specimen preparation was performed in the following
manner:

TxDOT 0-6100-1 Development of a Precast Bridge Deck Overhang System
176
1. Adhesive is applied to thoroughly cover the concrete beam (dimensions 18 × 3 × 3 in. [457 × 76 × 76 mm]).
2. A foam plank (dimensions 10.5 × 3 × 1.5 in. [267 × 76 × 38 mm]) is then placed on the glue-covered surface of the beam.
3. The top surface of the foam is then thoroughly covered with the adhesive.
4. The formed surface of the concrete beam is then placed on top of the foam.
5. The glue is then allowed to gain strength while being supported with a jig under gravity loads.
In this testing program, it was important to ensure that a surface that would be similar to
the surface used in the actual structure was used on the concrete blocks. For this reason the foam
was glued to a trowel-finished concrete that represented the top surface of the precast beam and
to a formed surface of a beam that represents the bottom of the precast panel. Brief discussions
on the pure lateral pressure, pure tension, and tension-lateral pressure tests are provided in the
following sections.
4.2.1.1 Pure Lateral Pressure Test This test examines the pure lateral pressure capacity of a foam and adhesive combination by
using an inflated air bag to simulate the lateral pressure from a fluid grout or concrete. In this
test the air bag is monitored with a pressure gauge, and adjustments in pressure are made with a
regulatory valve. The specimens are supported on their side on a wooden table, and the concrete
blocks are fixed to the table using pipe clamps. The air bag is then placed between the foam and
the table. Figure 4-19 shows the test setup. Care must be taken to ensure that the air bag applies
uniform pressure on the foam. Deflection gages were used to measure the deflection at the edge
and center of the specimen.

TxDOT 0-6100-1 Development of a Precast Bridge Deck Overhang System
177
Figure 4-19. Experimental Setup for the Lateral Pressure Test.
The specimens were measured at regular intervals starting at 1.5 psi (10 kPa) and
increasing by 1 psi (7 kPa) until a maximum pressure of 6.5 psi (45 kPa) was reached. At each
pressure interval the loading is paused for 1 minute to allow the deflection of the system to
stabilize. The value of 6.5 psi (45 kPa) was chosen because it was the capacity of the air bag
equipment used in the testing and is also a reasonable upper bound on the amount of pressure
that one might see from a gravity placement of concrete or grout. This would roughly
correspond to 6.5 ft (2 m) of concrete head. Figure 4-20 shows an example of a failed specimen.
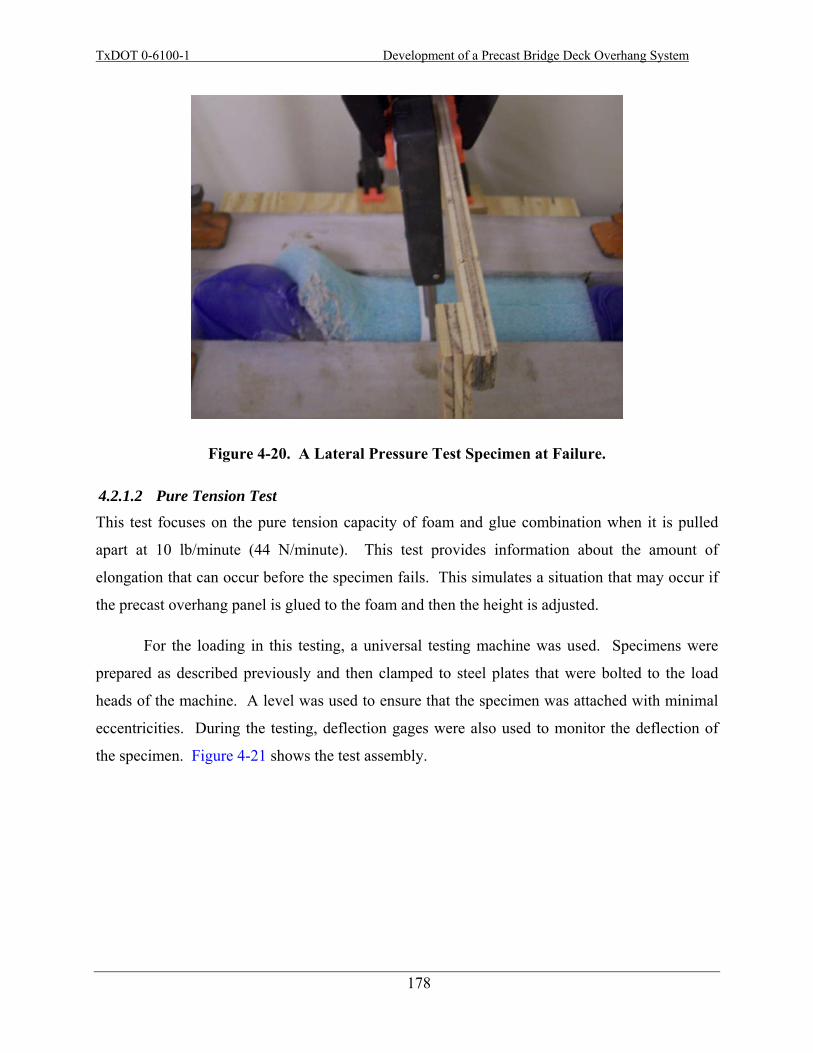
TxDOT 0-6100-1 Development of a Precast Bridge Deck Overhang System
178
Figure 4-20. A Lateral Pressure Test Specimen at Failure.
4.2.1.2 Pure Tension Test This test focuses on the pure tension capacity of foam and glue combination when it is pulled
apart at 10 lb/minute (44 N/minute). This test provides information about the amount of
elongation that can occur before the specimen fails. This simulates a situation that may occur if
the precast overhang panel is glued to the foam and then the height is adjusted.
For the loading in this testing, a universal testing machine was used. Specimens were
prepared as described previously and then clamped to steel plates that were bolted to the load
heads of the machine. A level was used to ensure that the specimen was attached with minimal
eccentricities. During the testing, deflection gages were also used to monitor the deflection of
the specimen. Figure 4-21 shows the test assembly.

TxDOT 0-6100-1 Development of a Precast Bridge Deck Overhang System
179
Figure 4-21. Experimental Setup for the Tension Test.
Tension was applied to the specimen at a rate of 10 lb/min (44 N/min). The specimen
was loaded until a tear, wide enough for grout to pass through, was observed in the specimen.
Failure was defined when grout was observed passing through the tear in the haunch foam. The
load was then stopped, and the deflection readings on the gages were recorded.
4.2.1.3 Tension-Lateral Pressure Test This test evaluated the lateral pressure capacity of the foam and adhesive combination after the
specimen was elongated by 0.25 in. (6 mm). This combination of elongation on the foam and
then subsequent lateral pressure can occur if a panel is first glued to the foam, the height is then
adjusted, and then a subsequent lateral load is placed on the foam. The value of 0.25 in. (6 mm)
was chosen from the tension results described in the previous section.
First, the specimen was prepared and placed on the wooden table as described previously.
Next, small screw jacks were used to elongate the specimen by 0.25 in. (6 mm). The specimen
was then clamped to the wooden table and a lateral pressure was applied with an air bag system.
Gauges were then used to measure the deflection of the specimen from the lateral pressure. The
specimens were measured at regular intervals starting at 1.5 psi (10 kPa) and increasing by 1 psi
(7 kPa) until 6.5 psi (45 kPa) was reached. At each pressure interval, the loading was paused for
1 minute to allow the deflection of the system to stabilize.

TxDOT 0-6100-1 Development of a Precast Bridge Deck Overhang System
180
4.2.2 Materials
For this testing a large number of foam materials were investigated. However, after discussions
with representatives in the foam industry, it was decided to narrow the investigation to either
polyethylene or cross-link foams. These foams were chosen for their economy, availability,
durability, and water tightness. Table 4-13 provides a summary of the foam properties included
in the study. Foams 1 through 3 are polyethylene foams, and foam 4 is a cross- link material.
Typically, as a foam’s density increases so does the modulus and tearing resistance.
Table 4-13. Summary of the Foam Properties Reported by the Manufacturer.
Property Foam Number Test Method 1 2 3 4 Density, pcf (N/mm3) 1 (48) 1.2 (57) 1.7 (81) 2.0 (96) ASTM D-3575 Suffix W
Force required to give a specified deflection, psi
(kPa): 25% 50%
3 (21) 6 (41)
5 (34) 10 (69)
5.5 (38) 12.5 (86)
5 (34) 14 (96)
ASTM D-3575 Suffix D
Percent increase in the sustained loads at:
2 hours 24 hours
30 24
30 24
34 20
Not tested Not
tested
ASTM D-3575 Suffix B
Percent increase in deflection at 1 psi (7 kPa) 12% 5% 3% Not
tested ASTM D-3575 Suffix BB
Tensile strength per unit area, psi (kPa) 20 (138) 38 (262) 26 (179) 54.5
(376) ASTM D412
Elongation, % 75 75 59 237 ASTM D412
Adhesives that were compatible with both the concrete and foam were obtained. There
were three main types of adhesives investigated. These included (A) synthetic elastomer liquid,
(B) two part epoxy, and (C) aerosol adhesive. In the remainder of the report each adhesive will
be referred to by its corresponding letter. Results for adhesive A and B are included in this
document. The testing for adhesive C will be included in the final report, but it was realized
through preliminary testing that this adhesive did not perform as well as the other two and is
more expensive.
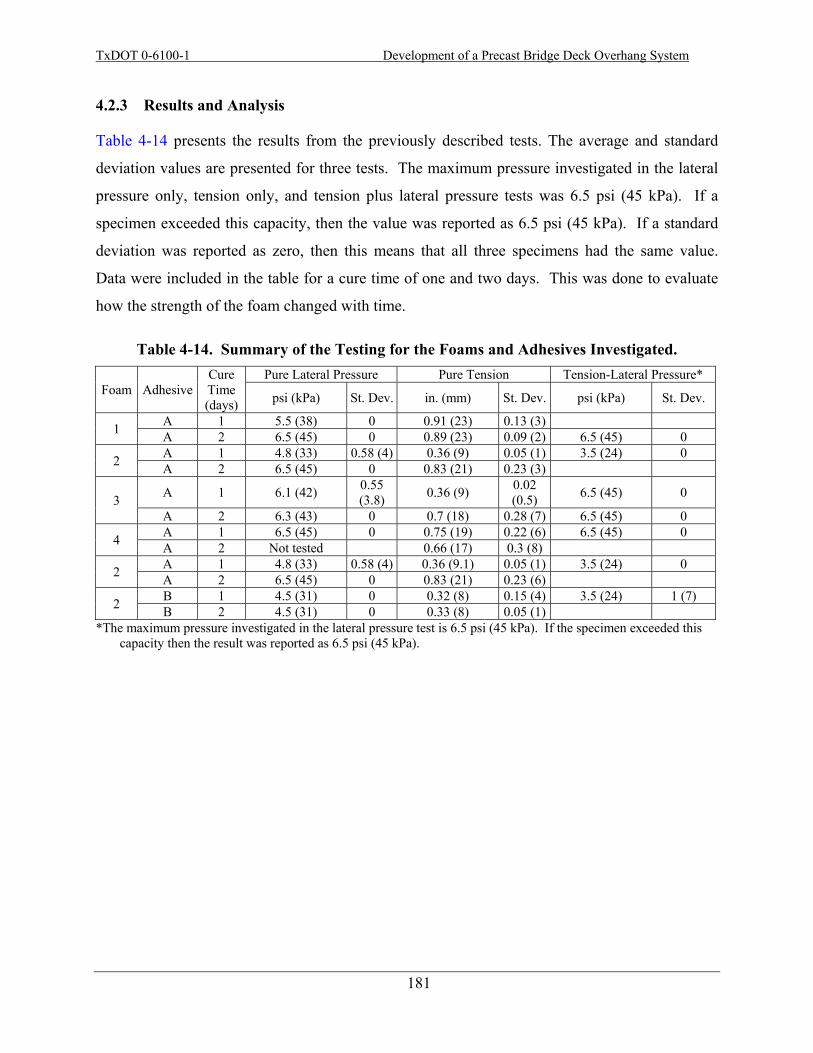
TxDOT 0-6100-1 Development of a Precast Bridge Deck Overhang System
181
4.2.3 Results and Analysis
Table 4-14 presents the results from the previously described tests. The average and standard
deviation values are presented for three tests. The maximum pressure investigated in the lateral
pressure only, tension only, and tension plus lateral pressure tests was 6.5 psi (45 kPa). If a
specimen exceeded this capacity, then the value was reported as 6.5 psi (45 kPa). If a standard
deviation was reported as zero, then this means that all three specimens had the same value.
Data were included in the table for a cure time of one and two days. This was done to evaluate
how the strength of the foam changed with time.
Table 4-14. Summary of the Testing for the Foams and Adhesives Investigated.
Foam Adhesive Cure Time (days)
Pure Lateral Pressure Pure Tension Tension-Lateral Pressure*
psi (kPa) St. Dev. in. (mm) St. Dev. psi (kPa) St. Dev.
1 A 1 5.5 (38) 0 0.91 (23) 0.13 (3) A 2 6.5 (45) 0 0.89 (23) 0.09 (2) 6.5 (45) 0
2 A 1 4.8 (33) 0.58 (4) 0.36 (9) 0.05 (1) 3.5 (24) 0 A 2 6.5 (45) 0 0.83 (21) 0.23 (3)
3 A 1 6.1 (42) 0.55 (3.8) 0.36 (9) 0.02
(0.5) 6.5 (45) 0
A 2 6.3 (43) 0 0.7 (18) 0.28 (7) 6.5 (45) 0
4 A 1 6.5 (45) 0 0.75 (19) 0.22 (6) 6.5 (45) 0 A 2 Not tested 0.66 (17) 0.3 (8)
2 A 1 4.8 (33) 0.58 (4) 0.36 (9.1) 0.05 (1) 3.5 (24) 0 A 2 6.5 (45) 0 0.83 (21) 0.23 (6)
2 B 1 4.5 (31) 0 0.32 (8) 0.15 (4) 3.5 (24) 1 (7) B 2 4.5 (31) 0 0.33 (8) 0.05 (1)
*The maximum pressure investigated in the lateral pressure test is 6.5 psi (45 kPa). If the specimen exceeded this capacity then the result was reported as 6.5 psi (45 kPa).
TxDOT 0-6100-1 Development of a Precast Bridge Deck Overhang System
182
4.2.4 Discussions
Not all combinations of foam and adhesive were investigated for this testing. From preliminary
testing, adhesive A appeared to be the most practical due to constructability and economy. For
these reasons each of the foams were evaluated with this adhesive. In order to make a
comparison between adhesives, foam 2 was investigated with both adhesives A and B to
investigate the impact on the physical properties of the specimen. Adhesive B had very similar
properties after the first day of curing to adhesive A; however, after the second day of curing
adhesive A showed improved performance in the lateral pressure only and tension only tests.
From Table 4-14, the minimum lateral pressure resistance for the foams was 4.5 psi
(31 kPa) after one day of curing for all of the adhesives investigated. This would mean that the
system could roughly resist 4.5 ft (1.4 m) of head pressure from a concrete or grout pour
(assuming that the unit weight of the concrete or grout was 144 pcf [2307 kg/cubic meter]).
While this number is likely sufficient, in all cases where adhesive A was used the lateral pressure
was at or exceeded 6.5 psi (45 kPa) (equivalent to 6.5 ft [2 m] of concrete/grout head pressure).
This implies that adhesive A will be satisfactory for this application.
One parameter that is not quantified in the data in Table 4-14 but is implied in Table 4-13
is the compressive stiffness of the foam. This parameter is important for the use of these foams,
as the foam needs to deflect under the weight of the precast overhang panels as needed. Foam 1
has the lowest compressive stiffness of the foams tested, so it would provide the most flexibility
during construction.
Another parameter that is not considered in the data presented is the aesthetics of the
foam, as it will be left in place in a visible location at the edge of the bridge. The foam
manufacturer creates foam in a distinctive color so that the properties are represented by the
color of the foam. The typical color for foam 1 is a gray that is similar to concrete.
For these reasons it is recommended to use a combination of foam 1 and adhesive A for
future projects implementing the precast overhang system. A brief summary of the
recommended construction methods are as follows:

TxDOT 0-6100-1 Development of a Precast Bridge Deck Overhang System
183
1. The surface of the precast beam where the foam is to be placed should be thoroughly cleaned and then covered in adhesive.
2. The foam should be cut to height that is approximately 1 in. (25 mm) higher than the desired haunch.
3. The foam should then be placed on the adhesive and held in place.
4. Before the precast overhang panel is placed, the top of the foam should be thoroughly covered in adhesive.
5. The grade bolts in the precast panels should be adjusted to provide a haunch depth that closely matches with that required for the bridge deck.
6. The panel should be placed and then allowed to cure for a day before adjusting. After the glue has cured, the height of the panel can still be lowered but should not be raised more than 0.25 in. (6 mm).
4.2.5 Summary for Haunch Form Materials
When foam 1 and adhesive A are used in combination, the forming system used can be left in
place, will provide sufficient lateral strength against gravity-fed concrete or grout placements,
and does not provide an aesthetic issue in the final bridge. By implementing this system it
minimizes the work needed under a bridge deck with precast overhang panel construction and
possibly other precast bridge construction. This leads to an improvement in not only the
constructability and economy, but also the safety of the precast overhang or any other precast
bridge deck system that requires an adjustable haunch.
TxDOT 0-6100-1 Development of a Precast Bridge Deck Overhang System
184
5 CONCLUSIONS AND RECOMMENDATIONS
5.1 CONCLUSIONS
The research performed in this project evaluated the overhang and shear capacity of a precast,
prestressed full-depth bridge overhang system for possible use in bridges in Texas. Research
was also conducted to evaluate grout materials and haunch-forming materials for the bridge
overhang construction. The conclusions drawn from this research are as follows:
• The concept of using conventional precast, prestressed panels to construct an overhang was verified. Current TxDOT bridge capacities have sufficient reserve strength over the required AASHTO loads. The full-depth precast panels also showed sufficient strength in both interior bays and overhangs.
• The stiffness of the full-depth precast, prestressed panels was comparable to the conventional CIP deck. Overhang failure loads were made critical by loading at the edge of the panel and seam joint. It is evident that the introduction of the seam decreases the overall strength, when only the bottom longitudinal steel is discontinuous. Nevertheless, some positive (and negative) moment strength is still available due to the CIP panel-to-panel joint that has a single layer of link bars. Although this is weaker than the full-depth overhang, overall reduction of load carrying capacity is only in the order of 14 percent. It should be noted that the overhang systems evaluated in this research did not contain barriers.
• A sufficient factor of safety was provided against the design wheel load of 16 kips (71 kN) for all the 3-ft (0.9 m) overhang specimens tested on this project.
• The interface shear capacity of the existing R-bar system used in present practice seems to be sound. From the tests the inferred coefficient of interface friction between cracked concrete-concrete interfaces that exist within the haunch of a prestressed concrete slab-on-girder bridge is at least 1.0.
• The apparent coefficient of sliding friction in the cracked grout-bed that exists between the precast concrete slab and concrete girder, based on the present test data, has a dependable coefficient of friction of 0.4. This result is lower than expected and is believed to be attributed to the
TxDOT 0-6100-1 Development of a Precast Bridge Deck Overhang System
185
relatively smooth shear interface between the soffit of the precast panels and the grout in the haunch.
• Based on two threaded-rods per pocket, as tested, the interface shear system to connect the precast concrete slabs to the concrete girders via a grout bed, as proposed by TxDOT engineers in collaboration with the research team, does not have sufficient shear capacity as expected by the initial design.
• An alternative approach for assessing the shear capacity of the connection systems can reduce the amount of pockets as identified in 0-6100-2, Development of a Precast Bridge Deck Overhang System for the Rock Creek Bridge. However, further testing is required.
• The relatively low resistance provided by the interface shear using the haunch can be improved by using more pockets and fasteners than originally planned.
• The shear resistance may be enhanced by increasing the coefficient of friction via surface roughening as noted in the 2007 AASHTO LRFD 5.8.4. Adding a reasonable number of shear pockets can also help distribute the shear load more evenly.
• Additional tests are needed to validate the results and investigate in more detail the effect of surface roughening. These tests are being performed and will be reported in report 0-6100-3.
• Several grouts were shown to exhibits adequate strength and adequate flow characteristics to fill the haunch.
• A combination of a flexible polyethylene foam and an adhesive can be used to produce an adjustable haunch form that is able to resist the lateral pressure from the gravity-fed concrete and/or grout used to construct the precast overhang system.
• In the present research four overhangs were tested. Two overhangs were based on a proposed new, full-depth, precast system, where the two panels were manufactured in a precast plant with a two-stage pour. Performance of these two overhang specimens was compared with a specimen that had standard CIP construction. The other two overhangs were cast in place.
TxDOT 0-6100-1 Development of a Precast Bridge Deck Overhang System
186
5.2 RECOMMENDATIONS
Based on these findings, the following recommendations are made:
• SikaGroutTM 212 and other grouts identified herein may be used for the haunch.
• Class S deck concrete may be used to fill the shear pockets.
• Use low density gray Polyethylene 1.0# density from Pregis and 3M Scotch Grip 4693 adhesive tape for the haunch forms.
• The panels initially designed for the project require modification. A recommendation on the number of pockets required was provided in Table 3-6 and these values are dependent on the value of the effective coefficient of friction, μ.
• The capacity of the precast, prestressed overhang system tested exhibits sufficient capacity to safely carry AASHTO loads.
• The overhang system has significant potential to increase economy and safety of bridge construction in Texas. Additional research is being performed in Phase 3. The research team makes the following additional recommendations:
Surface roughness. Concrete codes typically recommend roughening of interfaces to improve the coefficient of friction for sliding interface shear. For example, if the surface is intentionally roughened, providing an amplitude of more than 0.2 in. (5.1 mm), a coefficient of friction of 1.4 can be assumed, by design. Lesser values are recommended for smoother surfaces, such as 1.0 and 0.7 for a roughness amplitude of greater than 0.08 in. (2 mm) and laitance-free non-roughened surfaces, respectively. Several tests need to be conducted to explore the optimal trade-off between constructability and surface roughness.
Optimization of the pocket details. At this time it is recommended that TxDOT continue to use additional pockets, but instead of using expensive threaded fasteners, use conventional extended R-bars into the pocket zone. More details will be provided in 0-6100-3. Only two, or at most three, #5 R-bars may be necessary for the most adverse cases. Several tests need to be conducted to investigate the efficacy of R-bars in multiple pockets. If seven pockets per panel are used, then there is little need for expensive and relatively difficult to place grout in the pockets. Instead, conventional concrete with 6-in. (152 mm) slump and a maximum aggregate size of 0.375 in.
TxDOT 0-6100-1 Development of a Precast Bridge Deck Overhang System
187
(10 mm) may be sufficient for the pockets (not the haunch). This class of concrete is commonly used for filling concrete block masonry. It is likely that such a material will have rougher cracked interface surfaces, possibly leading to a higher coefficient of sliding friction.
Grouping effects of connectors. The summary of these results included tests for only 2 connectors within a pocket; however, it is known that there can be grouping effects, especially when having more connectors in a pocket. While this would increase the shear resistance capacity, additional shear reinforcement provided by R-bars may also be needed.
Effect of haunch height. Longer beams with sufficient capacity provided by hoops are needed to test additional specimens to assess the effect of a variable haunch height such that beam failure does not prematurely occur as a result of distressing the beam. The results provided in Table 3-6 were based on data for a 2-in. (51 mm) haunch. More data can be obtained to make more conclusive remarks on the effect of the haunch height on the deck-haunch-beam system.
TxDOT 0-6100-1 Development of a Precast Bridge Deck Overhang System
188
REFERENCES
AASHTO (2007), American Association of State Highway and Transportation Officials Load
and Resistance Factor Design – Bridge Design Specifications (AASHTO LRFD).
Badie, S., Tadros, M., and Girgis, A. (2006), “Full-Depth, Precast-Concrete Bridge Deck Panel
Systems,” NCHRP Report 12-65, National Cooperative Highway Research program,
Transportation research Board, Washington D.C.
Folliard, K. J., Du, L, Trejo, D., Halmen, C., Sabol, S., and Leshchinsky, D., (2008),
“Development of a Recommended Practice for Use of Controlled Low-Strength Material in
Highway Construction,” NCHRP Report 597, Transportation research Board, Washington
D.C.
Graddy, J.C., Kim, J., Whitt, J.H., Burns, N.H., and Klingner, R.E., (2002), “Punching-shear
behaviour of bridge decks under fatigue loading,” ACI Structural Journal, 90 (3).
Hornbeck R. W. (1982), Numerical Methods, Prentice Hall, pp. 320.
Kelly, D.J., Bradberry, T.E., and Breen, J.E. (1987), “Time Dependent Deflections of
Pretensioned Beams.” Research Report CTR 381-1, Center for Transportation Research –
The University of Texas at Austin.
Scholz, D.P. Wallenfelsz J. A., Lijeron C., and Roberts-Wollmann C.L. (2007),
“Recommendations for the Connection Between Full-Depth Precast Bridge Deck Panel
Systems and Precast I-Beams.” Report No. VTRC 07-CR17, Virginia Transportation
Research Council, Charlottesville, VA.
Sullivan, S. (2007), “Construction and Behavior of Precast Bridge Deck Panel Systems,”
Dissertation, Virginia Polytechnic Institute and State University, Blacksburg, VA.
Tex-437-A, Test for Flow of Grout Mixtures (Flow Cone Method).
TxDOT (2004), Item 440 – Reinforcing Steel, TxDOT Standard specifications for construction
and maintenance of highways, streets, and bridges, Texas Department of Transportation,
Austin, Texas.
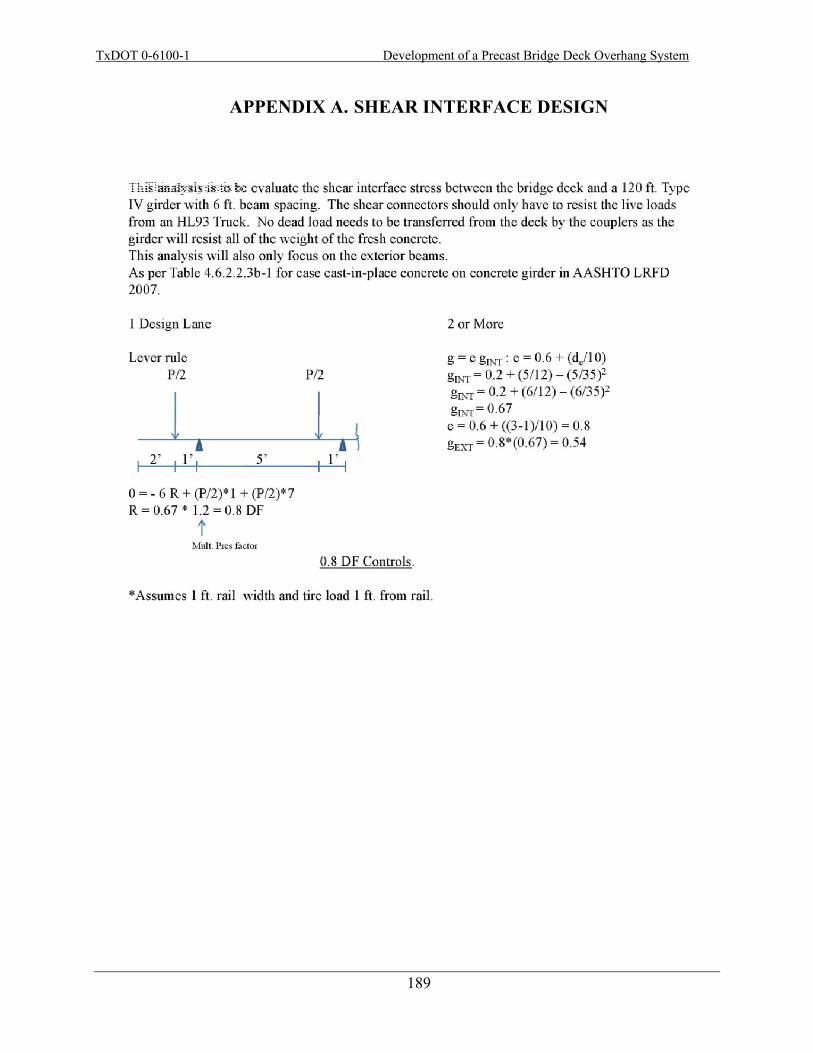
TxDOT 0-6100-1 Development of a Precast Bridge Deck Overhang System
189
APPENDIX A. SHEAR INTERFACE DESIGN
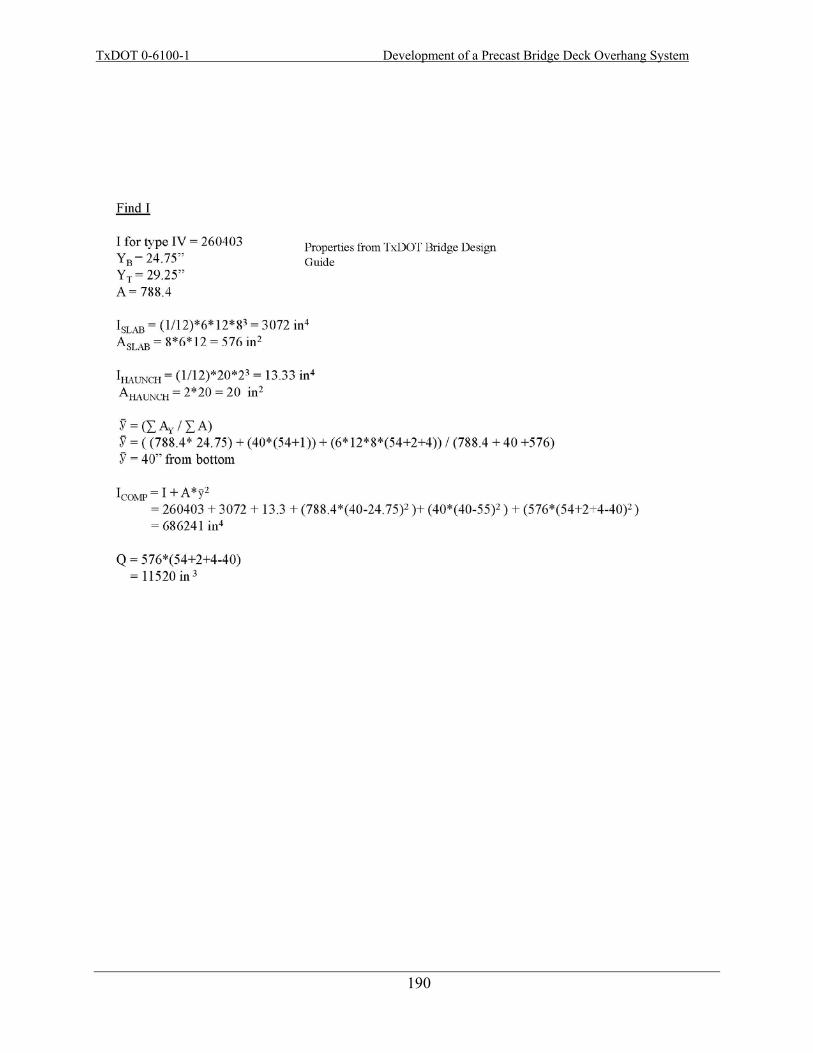
TxDOT 0-6100-1 Development of a Precast Bridge Deck Overhang System
190
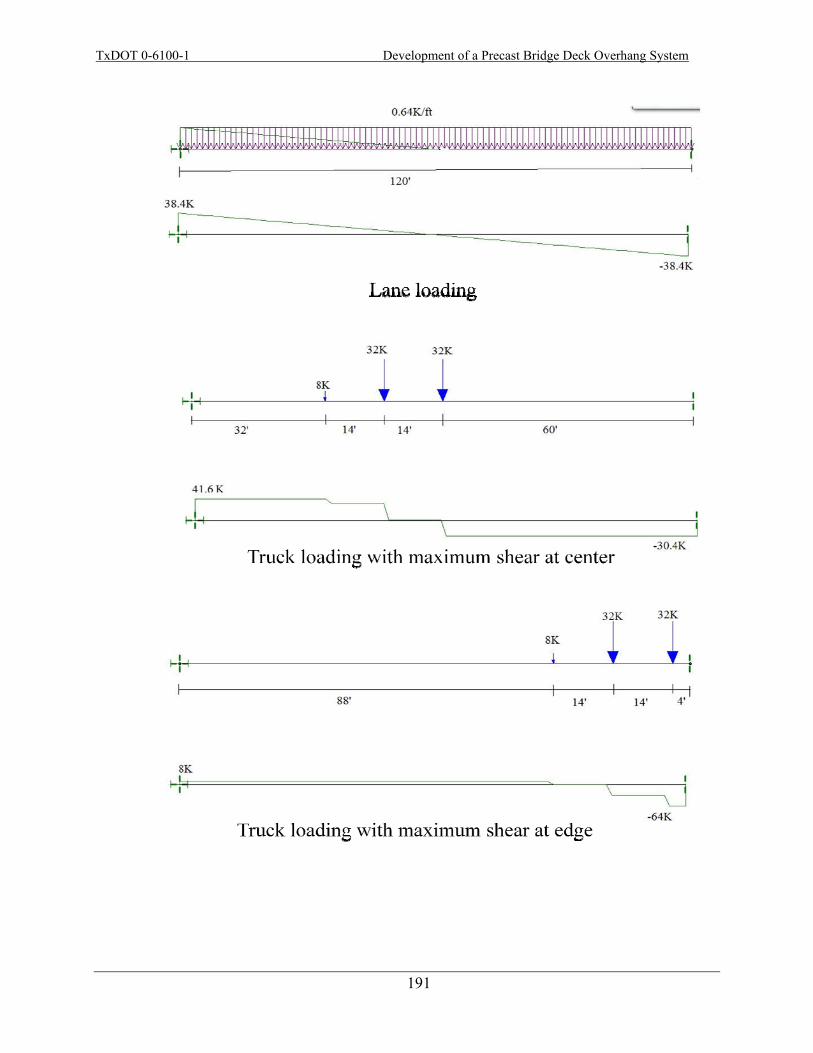
TxDOT 0-6100-1 Development of a Precast Bridge Deck Overhang System
191
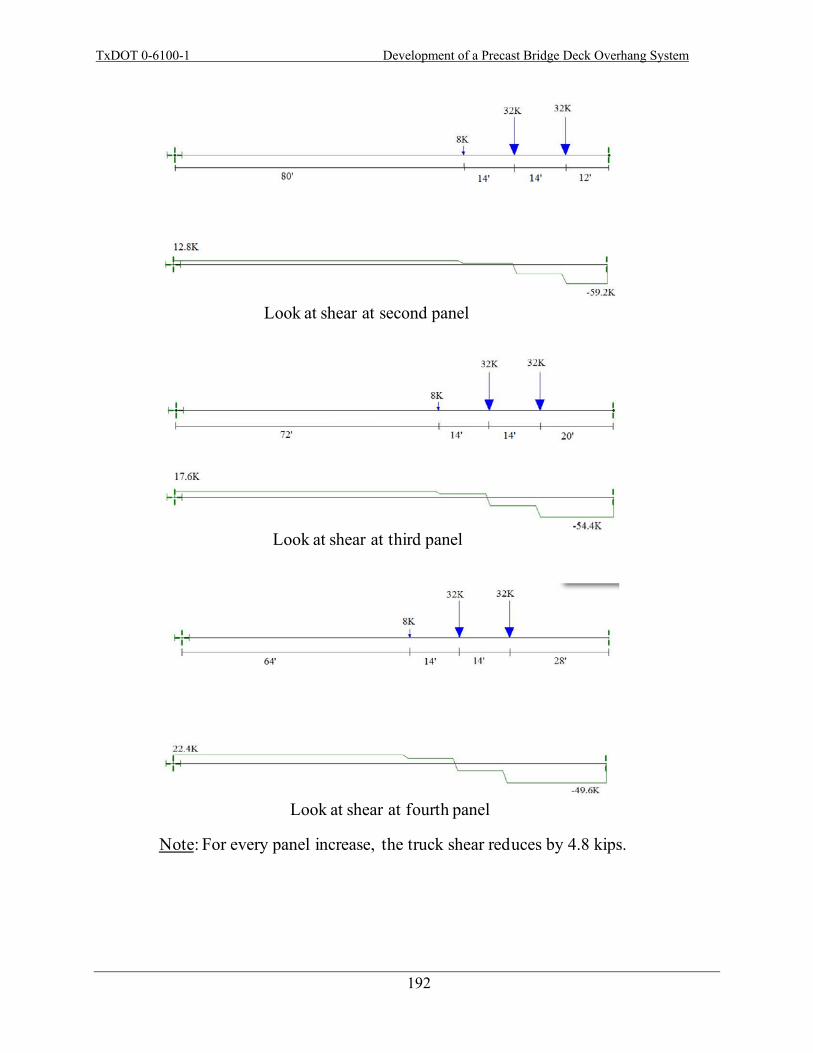
TxDOT 0-6100-1 Development of a Precast Bridge Deck Overhang System
192
Look at shear at third panel
Look at shear at second panel
Look at shear at fourth panel
Note: For every panel increase, the truck shear reduces by 4.8 kips.
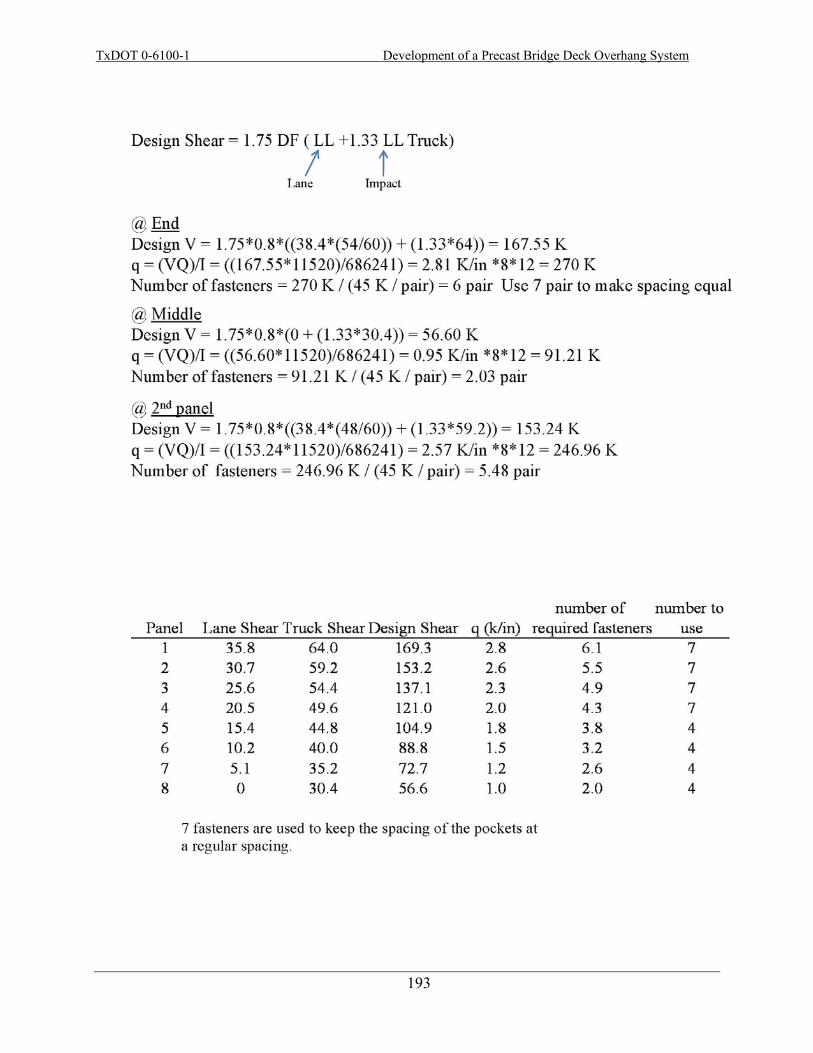
TxDOT 0-6100-1 Development of a Precast Bridge Deck Overhang System
193

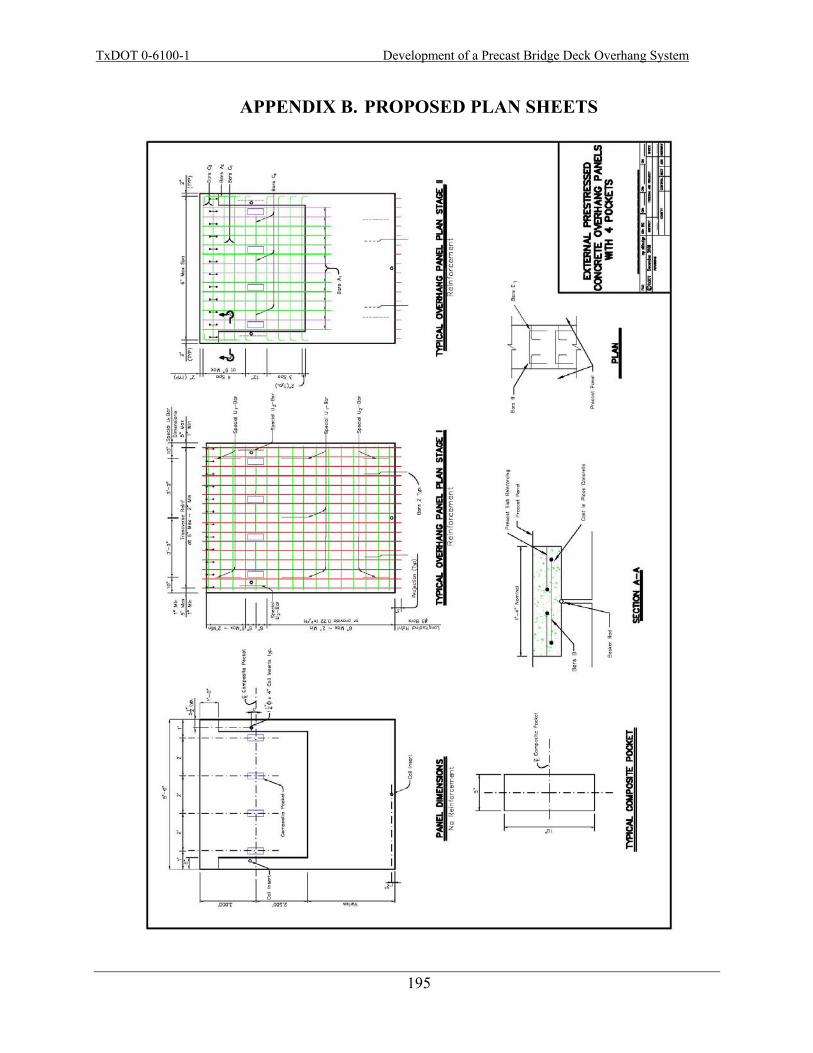
TxDOT 0-6100-1 Development of a Precast Bridge Deck Overhang System
195
APPENDIX B. PROPOSED PLAN SHEETS
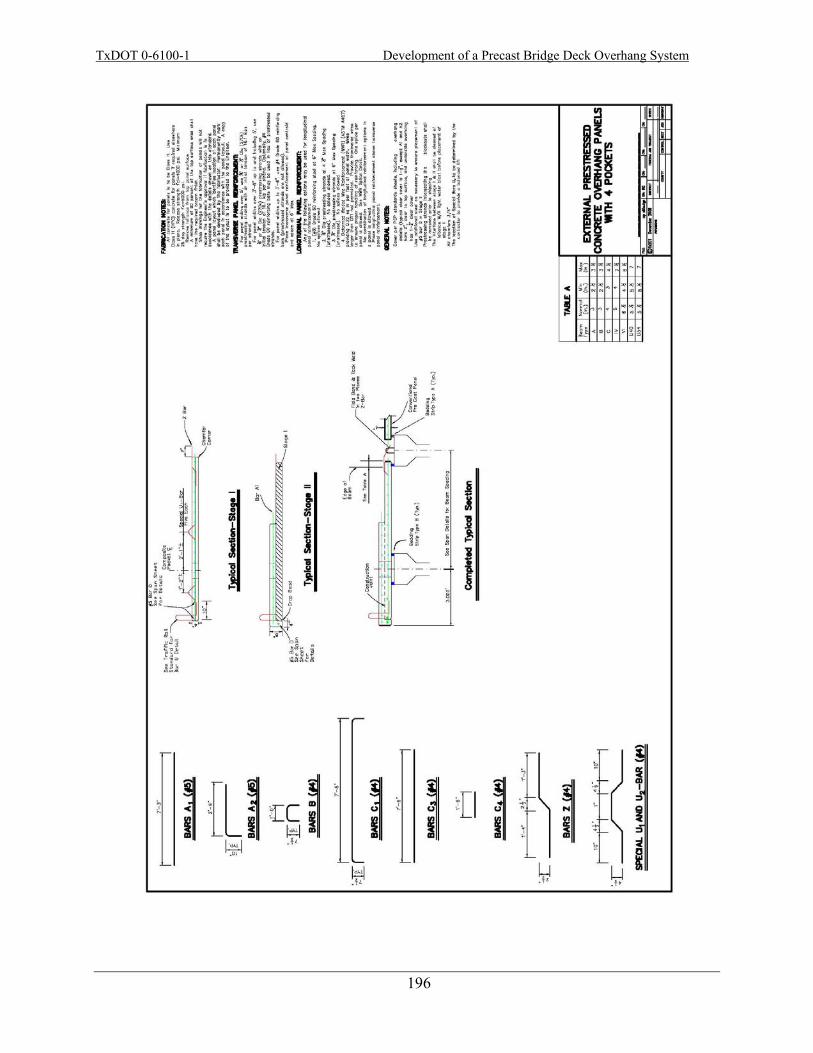
TxDOT 0-6100-1 Development of a Precast Bridge Deck Overhang System
196
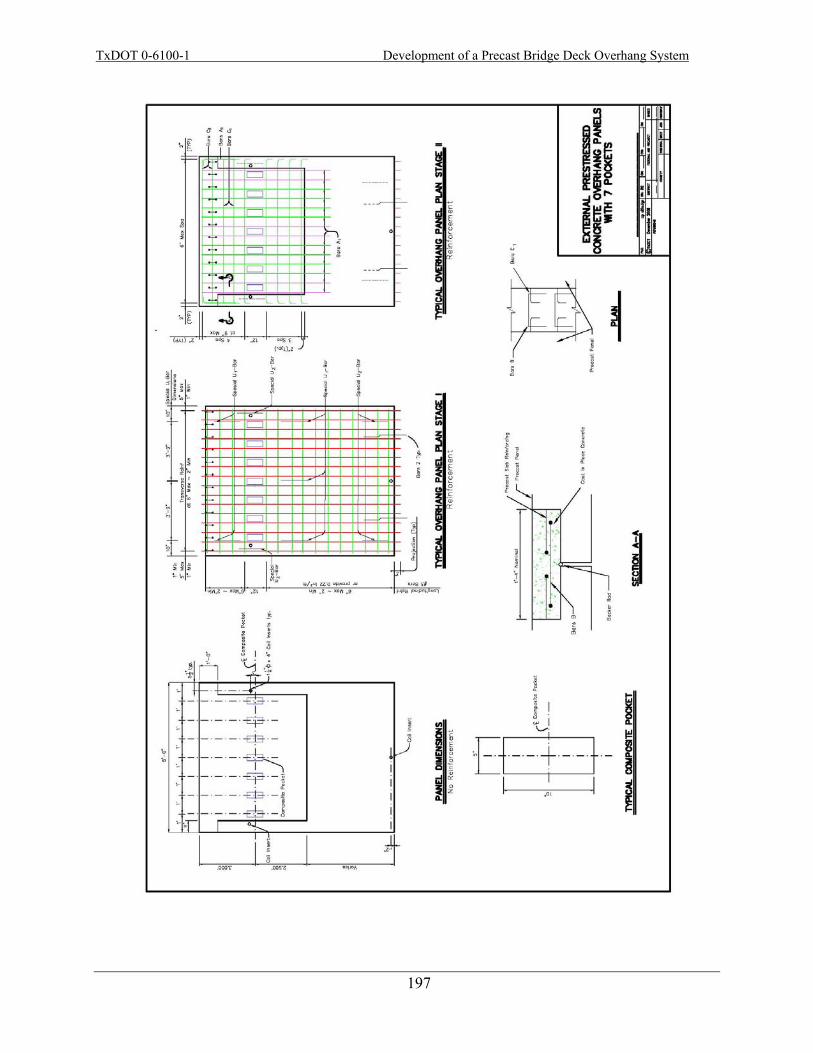
TxDOT 0-6100-1 Development of a Precast Bridge Deck Overhang System
197

TxDOT 0-6100-1 Development of a Precast Bridge Deck Overhang System
198
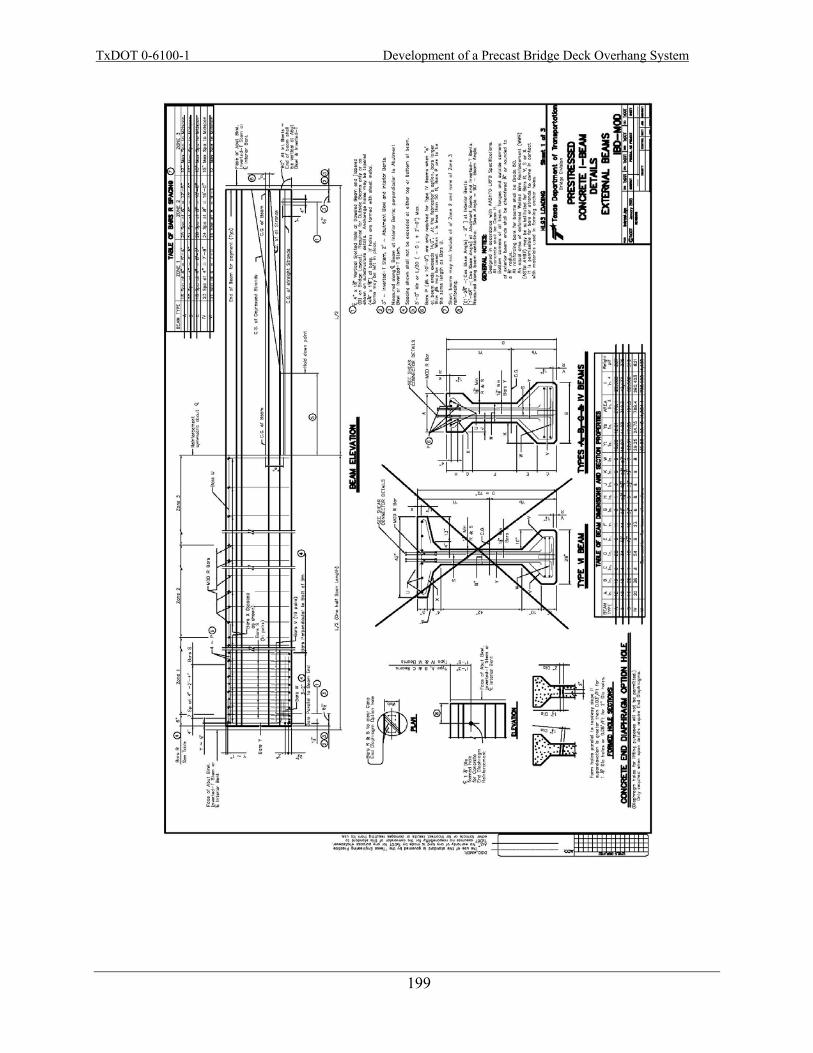
TxDOT 0-6100-1 Development of a Precast Bridge Deck Overhang System
199

TxDOT 0-6100-1 Development of a Precast Bridge Deck Overhang System
200
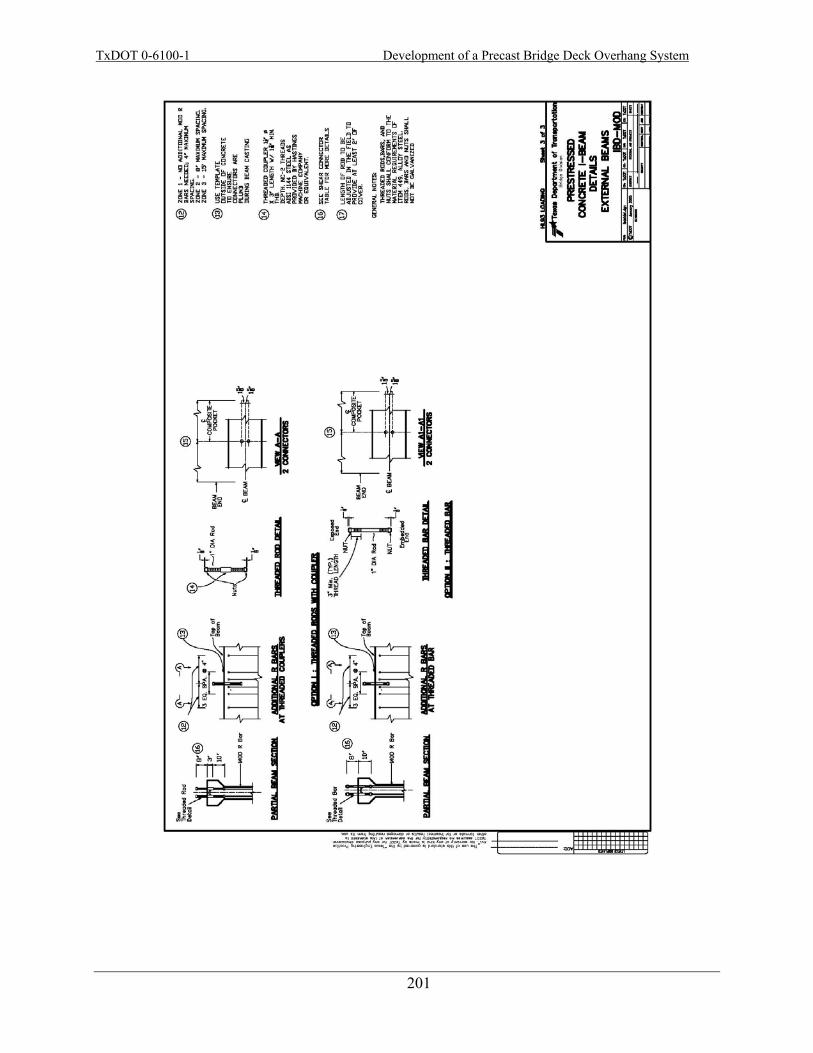
TxDOT 0-6100-1 Development of a Precast Bridge Deck Overhang System
201

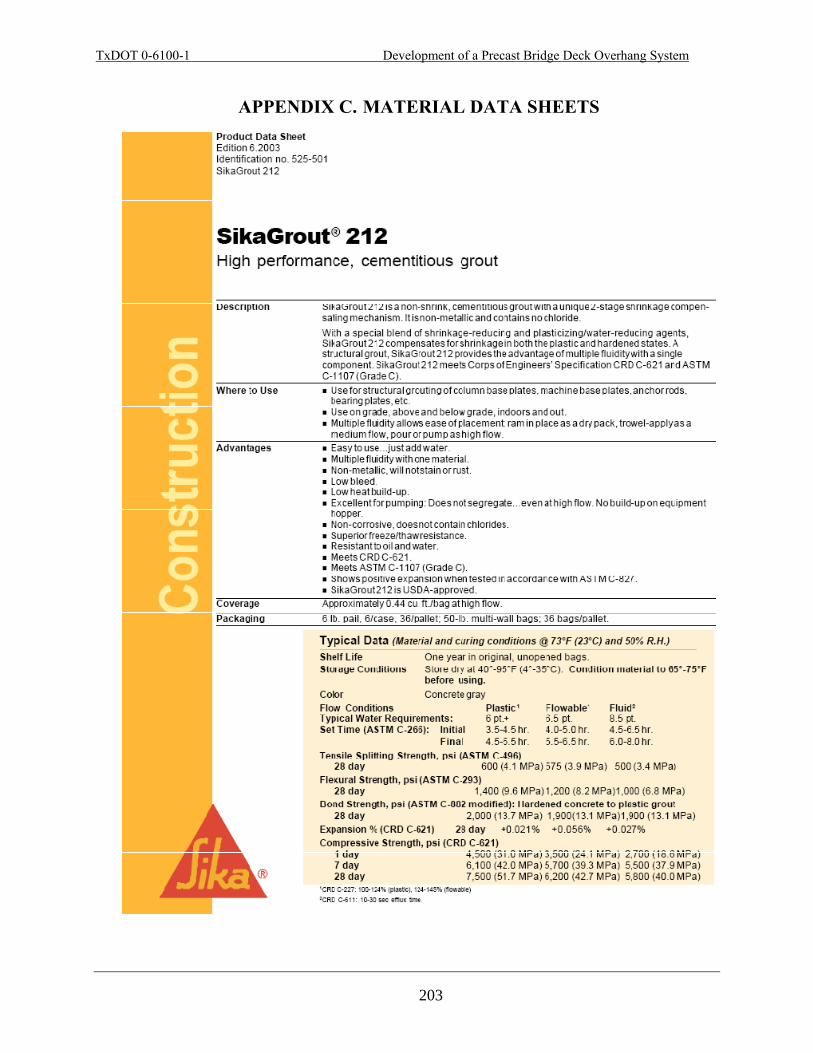
TxDOT 0-6100-1 Development of a Precast Bridge Deck Overhang System
202
APPENDIX C. MATERIAL DATA SHEETS
203
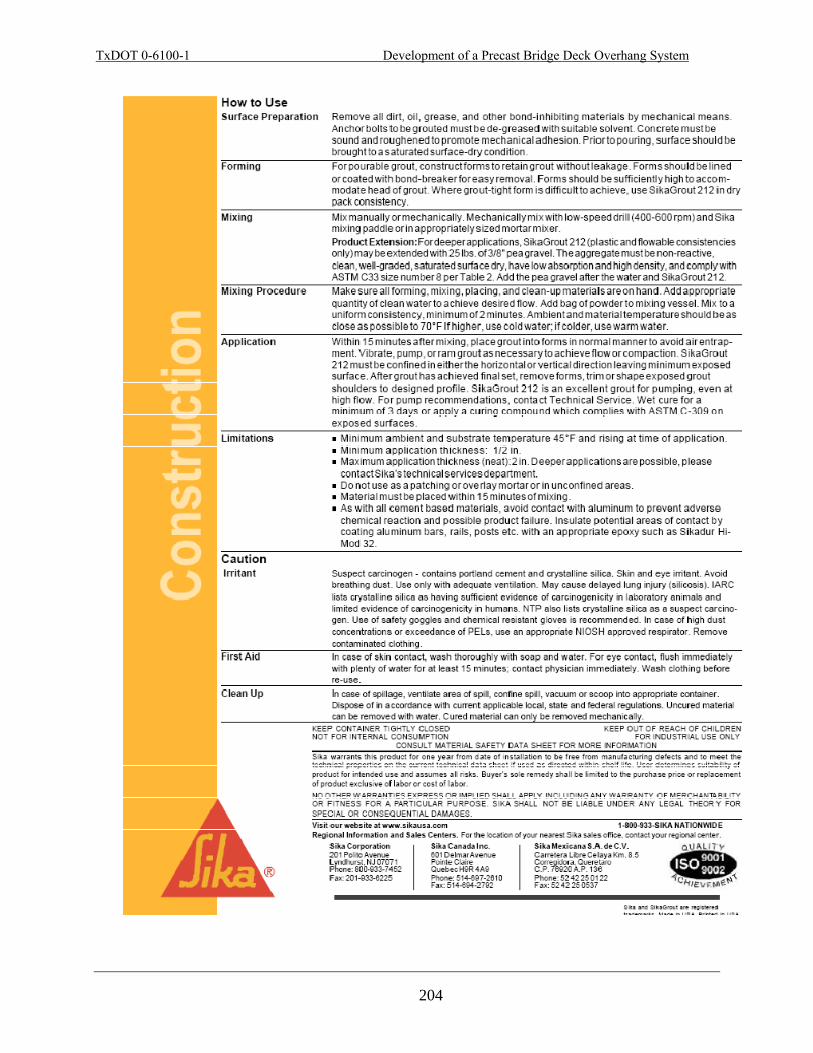
TxDOT 0-6100-1 Development of a Precast Bridge Deck Overhang System
203
204
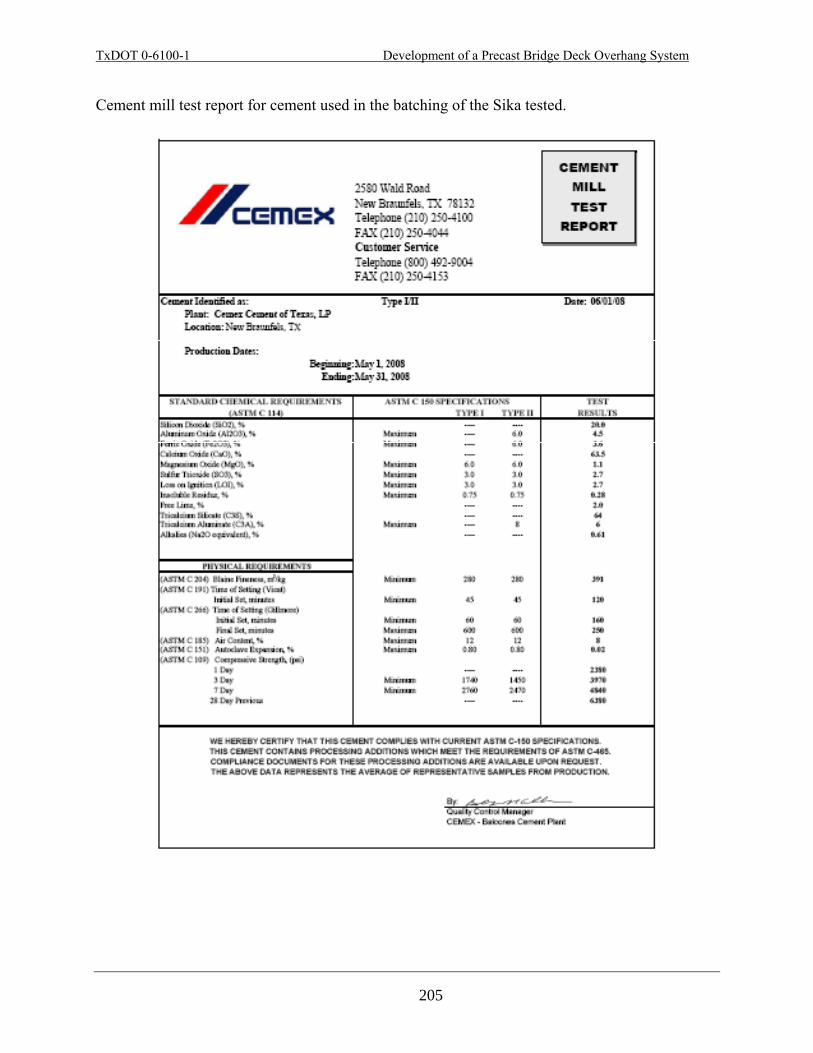
TxDOT 0-6100-1 Development of a Precast Bridge Deck Overhang System
204
Cement mill test report for cement used in the batching of the Sika tested.
205

206
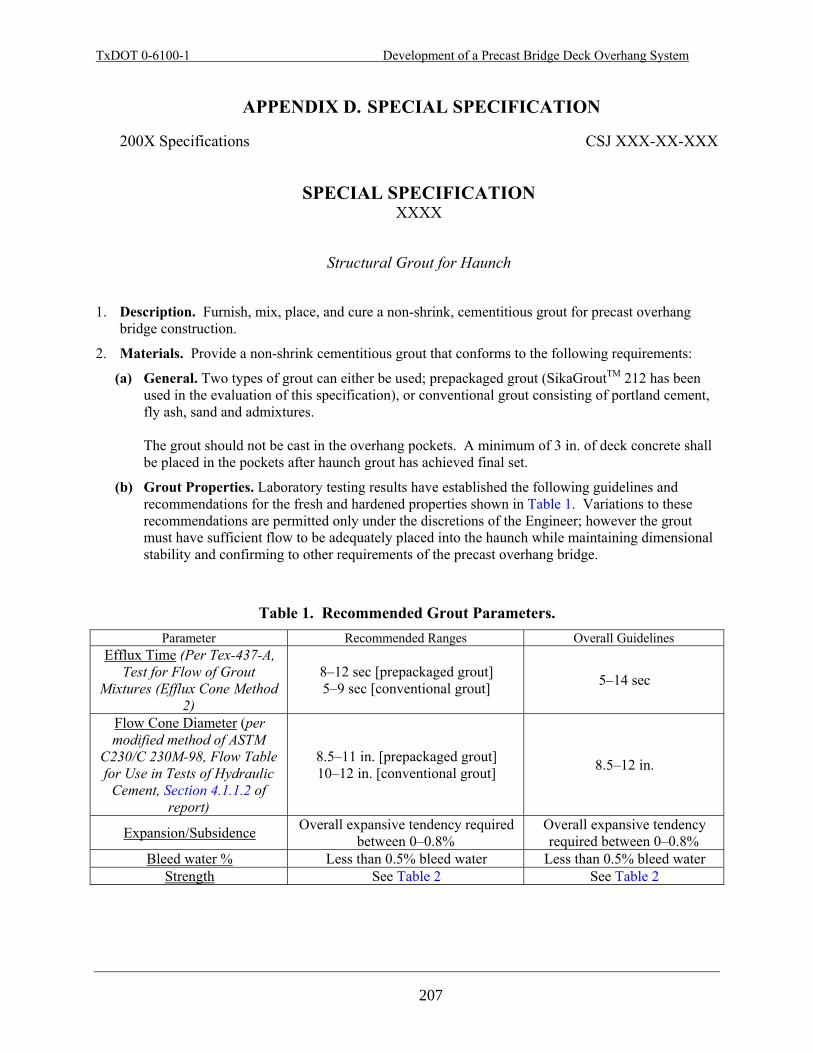
TxDOT 0-6100-1 Development of a Precast Bridge Deck Overhang System
205
APPENDIX D. SPECIAL SPECIFICATION
200X Specifications CSJ XXX-XX-XXX
SPECIAL SPECIFICATION XXXX
Structural Grout for Haunch
1. Description. Furnish, mix, place, and cure a non-shrink, cementitious grout for precast overhang bridge construction.
2. Materials. Provide a non-shrink cementitious grout that conforms to the following requirements:
(a) General. Two types of grout can either be used; prepackaged grout (SikaGroutTM 212 has been used in the evaluation of this specification), or conventional grout consisting of portland cement, fly ash, sand and admixtures. The grout should not be cast in the overhang pockets. A minimum of 3 in. of deck concrete shall be placed in the pockets after haunch grout has achieved final set.
(b) Grout Properties. Laboratory testing results have established the following guidelines and recommendations for the fresh and hardened properties shown in Table 1. Variations to these recommendations are permitted only under the discretions of the Engineer; however the grout must have sufficient flow to be adequately placed into the haunch while maintaining dimensional stability and confirming to other requirements of the precast overhang bridge.
Table 1. Recommended Grout Parameters. Parameter Recommended Ranges Overall Guidelines
Efflux Time (Per Tex-437-A, Test for Flow of Grout
Mixtures (Efflux Cone Method 2)
8–12 sec [prepackaged grout] 5–9 sec [conventional grout] 5–14 sec
Flow Cone Diameter (per modified method of ASTM
C230/C 230M-98, Flow Table for Use in Tests of Hydraulic
Cement, Section 4.1.1.2 of report)
8.5–11 in. [prepackaged grout] 10–12 in. [conventional grout] 8.5–12 in.
Expansion/Subsidence Overall expansive tendency required between 0–0.8%
Overall expansive tendency required between 0–0.8%
Bleed water % Less than 0.5% bleed water Less than 0.5% bleed water Strength See Table 2 See Table 2
207
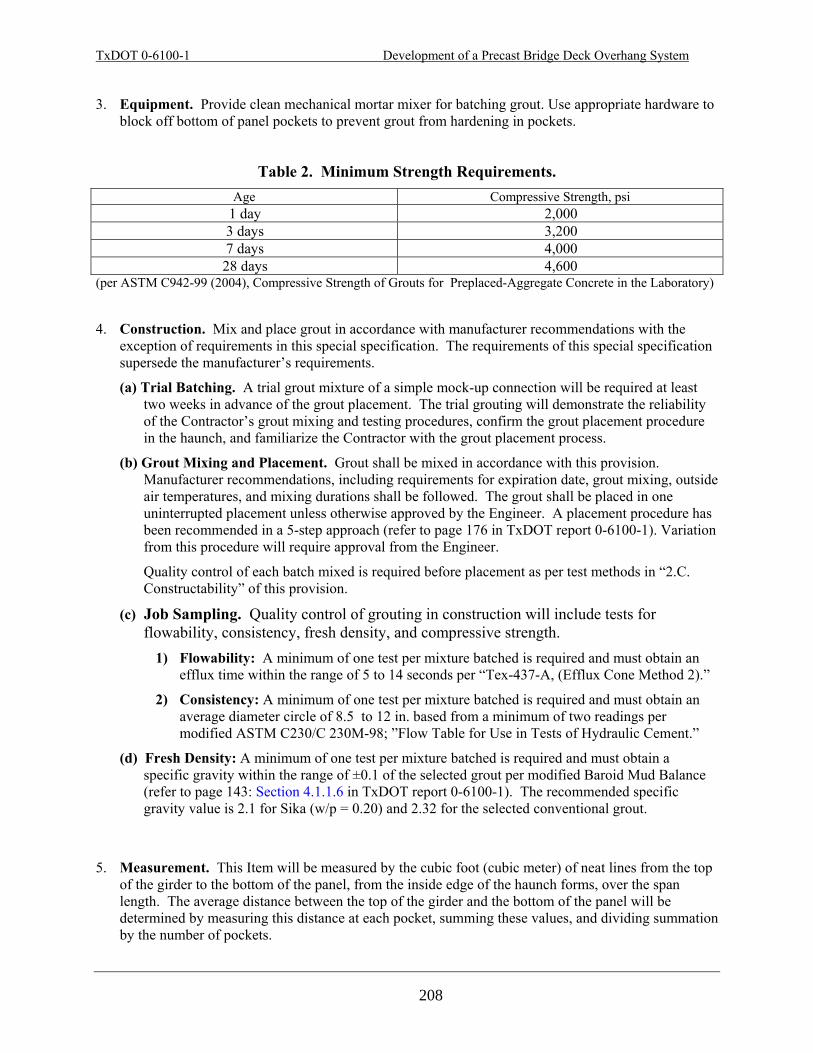
TxDOT 0-6100-1 Development of a Precast Bridge Deck Overhang System
206
3. Equipment. Provide clean mechanical mortar mixer for batching grout. Use appropriate hardware to block off bottom of panel pockets to prevent grout from hardening in pockets.
Table 2. Minimum Strength Requirements. Age Compressive Strength, psi
1 day 2,000 3 days 3,200 7 days 4,000 28 days 4,600
(per ASTM C942-99 (2004), Compressive Strength of Grouts for Preplaced-Aggregate Concrete in the Laboratory)
4. Construction. Mix and place grout in accordance with manufacturer recommendations with the exception of requirements in this special specification. The requirements of this special specification supersede the manufacturer’s requirements.
(a) Trial Batching. A trial grout mixture of a simple mock-up connection will be required at least two weeks in advance of the grout placement. The trial grouting will demonstrate the reliability of the Contractor’s grout mixing and testing procedures, confirm the grout placement procedure in the haunch, and familiarize the Contractor with the grout placement process.
(b) Grout Mixing and Placement. Grout shall be mixed in accordance with this provision. Manufacturer recommendations, including requirements for expiration date, grout mixing, outside air temperatures, and mixing durations shall be followed. The grout shall be placed in one uninterrupted placement unless otherwise approved by the Engineer. A placement procedure has been recommended in a 5-step approach (refer to page 176 in TxDOT report 0-6100-1). Variation from this procedure will require approval from the Engineer. Quality control of each batch mixed is required before placement as per test methods in “2.C. Constructability” of this provision.
(c) Job Sampling. Quality control of grouting in construction will include tests for flowability, consistency, fresh density, and compressive strength.
1) Flowability: A minimum of one test per mixture batched is required and must obtain an efflux time within the range of 5 to 14 seconds per “Tex-437-A, (Efflux Cone Method 2).”
2) Consistency: A minimum of one test per mixture batched is required and must obtain an average diameter circle of 8.5 to 12 in. based from a minimum of two readings per modified ASTM C230/C 230M-98; ”Flow Table for Use in Tests of Hydraulic Cement.”
(d) Fresh Density: A minimum of one test per mixture batched is required and must obtain a specific gravity within the range of ±0.1 of the selected grout per modified Baroid Mud Balance (refer to page 143: Section 4.1.1.6 in TxDOT report 0-6100-1). The recommended specific gravity value is 2.1 for Sika (w/p = 0.20) and 2.32 for the selected conventional grout.
5. Measurement. This Item will be measured by the cubic foot (cubic meter) of neat lines from the top
of the girder to the bottom of the panel, from the inside edge of the haunch forms, over the span length. The average distance between the top of the girder and the bottom of the panel will be determined by measuring this distance at each pocket, summing these values, and dividing summation by the number of pockets.
208

TxDOT 0-6100-1 Development of a Precast Bridge Deck Overhang System
207
6. Payment. The work performed and materials furnished in accordance with this Item and measured as provided under “Measurement” will be paid for at the unit price bid for “Structural Grout for Haunch.” This price is full compensation for furnishing and placing grout and for all labor, tools, equipment and incidentals necessary to complete the work. The preparation of trial batches described will not be paid for directly and shall be considered subsidiary to this bid item.
209

210