development of an industrial ecology model for the athi
TRANSCRIPT

i
DEVELOPMENT OF AN INDUSTRIAL ECOLOGY MODEL FOR THE ATHI RIVER
SPECIAL ECONOMIC ZONE: POLICY IMPLICATIONS FOR GREEN GROWTH IN
KENYA
Kelvin Khisa
(Z81/82221/2011)
A PhD thesis submitted in partial fulfillment of the requirements for the award of the
degree of Doctor of Philosophy (Environmental Policy) of the University of Nairobi.
Center for Advanced Studies in Environmental Law and Policy (CASELAP)
November, 2016
ii
DECLARATION
I declare that this PhD thesis is my original work and sources of information other than my own
have been duly acknowledged.
Signature……………………………………………….Date………………………………………
This Thesis has been submitted with our approval as University Supervisors:
Prof. Nicholas Otienoh Oguge
Signature…………………………………………….Date………………………………………
Dr. Stephen Obiero Anyango
Signature……………………………………………….Date………………………………………

iii
DEDICATION To all my three children Celine, Michelle, and Paul for their unfailing and constant encouragement
that I have to become a PhD holder and set a shining example for them. To all those who believe
that climate change is real and the challenge it poses to mankind will shape his production and
consumption behavior for a long time to come.

iv
ACKNOWLEDGEMENTS
A PhD study on this emerging and promising concept could not have been possible without the
invaluable input of a good number of people.
My sincerest gratitude goes to my supervisors Prof. Nicholas Otienoh Oguge and Dr. Stephen
Obiero Anyango who made this thesis write up possible. Through their resolute support,
experience, advice and guidance, they provided a reliable road map for my progress. By acting as
reliable sign posts, they helped me to transform my writing weaknesses into remarkable pillars of
strength.
I am proud to be associated with industrial symbiosis as one of the key tools for advancing the
country’s green growth agenda. My genuine appreciation goes to the management of the Export
Processing Zones Authority (EPZA) for having facilitated my research work at the economic zone.
Their constant presence during my fieldwork ensured that the zone companies were cooperative
and could not treat me with any level of suspicion.
Thanks to the Production Managers of the zone companies for taking time off their busy schedules
to fill our research questionnaires and take us around their respective production lines and
warehouses.
I also wish to sincerely thank the Kenya Industrial Research and Development Institute (KIRDI)
management for having granted me a study leave and the National Council for Science,
Technology and Innovation (NACOSTI) for funding my research work.

v
Special thanks to members of my family for their support, empathy and patience throughout this
challenging knowledge seeking journey.

vi
ABSTRACT
Kenya Vision 2030 currently guides the country’s development agenda. It recognizes
industrialization as one of the key pillars of economic growth and wealth creation. As a result,
there has been a marked increase in the development of special economic zones (SEZs) across the
country. Through inter-company exchange of wastes and by-products, SEZs can reduce negative
environmental impacts that emanate from industrial consumption of raw materials, energy and
water, hence decoupling accelerated growth from environmental degradation. There is need to
transform the country’s SEZs into low-carbon, resource efficient, climate resilient, and socially
inclusive units that are competitive in attracting green foreign direct investments (FDI). The
overall objective of the study was to assess the efficacy of Industrial Ecology (IE) model in
enhancing the environmental governance of the Athi River SEZ. The study characterized
production clusters of the SEZ; analyzed material flows; assessed environmental performance; and
using the IE approach, proposed a governance model for the zone. A mixed methods approach was
used with both qualitative and quantitative data being generated from primary and secondary
sources. Primary data was obtained through Key informant interviews of factories and zone
management personnel; factory production volume baseline analysis; inspection of the factory’s
procedures and practices; and identification of waste and by-products. Resource Flow Analysis
was used to quantify material and energy flows in different clusters. Secondary data was obtained
through the review of utility records and production reports. The study revealed an unregulated
evolution of industrial symbiosis (IS) at the zone in four clusters. These comprised use of (i) 240
tons/year of seed cake by-product as raw material for animal feed manufacturing leading to 80%
secondary transport energy savings and 86,427 kg CO2e/year of reduced emissions; (ii) 108
tons/year of tarpaulin waste as raw material for making plastic water tanks leading to the creation
of five on-site plastic reprocessing green jobs; (iii) 255 tons/year of textile fabric off cuts for
making sofa sets and on-site steam generation leading to the creation of fifteen green jobs and 9%
avoided emissions (1,142 kg CO2e) and (iv) 204 tons/year of chipboard saw dust waste used as
steam boiler fuel replacing fuel oil with 11% avoided emissions (4,448 kg CO2e). Inter-company
use of wastes and by-products as raw material inputs reduced the raw material transport costs by
over 80% resulting in a lower carbon footprint. Waste reuse diverted the potential solid wastes
from the landfill, created new products and jobs, hence contributing to the country’s green growth
agenda. However, most of the zone’s material flows were largely linear due to lack of policy and
weak infrastructure for waste recovery and reuse. There was no evidence of genuine partnerships
with communities; no strategic co-locating of industries that exchange wastes; no functional
infrastructure for IE promotion; no IE enabling policies/incentives; and limited commitment to a
resource efficient zone. A governance model was developed that (i) creates a multi-stakeholder
Green Cell within the Zone Authority with the sole mandate of promoting resource use efficiency
through Cleaner Production and IS; and (ii) seeks to strengthen partnerships between industry,
government and academic institutions in eco-innovation. The findings of this study forms the basis
of the country’s switch from the inefficient linear production approach to an integrated and
resource efficient circular economy.

vii
TABLE OF CONTENTS
DECLARATION .......................................................................................................................... ii
DEDICATION ............................................................................................................................. iii
ACKNOWLEDGEMENTS ........................................................................................................... iv
ABSTRACT ................................................................................................................................ vi
TABLE OF CONTENTS ............................................................................................................. vii
ACRONYMS .............................................................................................................................. xi
CHAPTER ONE: INTRODUCTION .............................................................................................. 1
1.1 Background ....................................................................................................................... 1
1.2 Statement of the Research Problem ...................................................................................... 6
1.3 Research Questions ............................................................................................................ 9
1.4 Research Objectives ..........................................................................................................10
1.5 Justification of the Study....................................................................................................11
1.6 Thesis Structure ................................................................................................................13
CHAPTER TWO: LITREATURE REVIEW ..................................................................................14
2.1 Introduction .....................................................................................................................14
2.2 Overview of Industrial Ecology ..........................................................................................14
2.3 Policy Framework for Kenya’s Industrialization ...................................................................18
2.3.1 Kenya Constitution 2010 ............................................................................................18
2.3.2 Kenya Vision 2030 ....................................................................................................18
2.3.3 National Industrialization Policy Framework for Kenya 2012 - 2030 ................................20
2.3.4 Kenya Industrial Sector Strategic Plan 2013 – 2017 .......................................................22
2.3.5 Kenya Industrial Transformation Program 2015 ............................................................23
2.3.6 National Climate Change Action Plan 2013 - 2017 ........................................................25
2.3.7 Kenya’s Intended Nationally Determined Contributions (INDC) .....................................26
2.3.8 Green Economy in the Kenyan Context ........................................................................27
2.3.9 Challenges of Promoting Green Growth in Kenya ..........................................................29
2.3.9 Legal Framework .......................................................................................................32
2.4 Promotion of RECP and IS at the Athi River SEZ .................................................................33
2.5 Emerging Industrial Ecology Models of the World ................................................................47
2.6 Types of Special Economic Zones (SEZs) ............................................................................54
2.7 Framework for Low-Carbon Green Zones ............................................................................58
2.8 Low-Carbon Green Special Economic Zones .......................................................................60
2.9 Spectrum of Environmentally Sustainable Zones ..................................................................61
2.10 Enabling Policy and Institutional Framework for a LCZ ........................................................63
2.11 Institutional Framework for a Low-Carbon Zone ..................................................................64

viii
2.12 Important Considerations in SEZ Development and Implementation .......................................66
2.13 Resource Efficiency and Cleaner Production (RECP) ............................................................70
2.13 Theoretical Framework ......................................................................................................71
2.14 Conceptual Framework ......................................................................................................75
CHAPTER THREE: STUDY AREA AND METHODS ...................................................................79
3.1 Study Area .......................................................................................................................79
3.2 Methods...........................................................................................................................79
3.2.1 Types and Sources of Data ..........................................................................................80
3.2.2 Development of Study Tools and Piloting .....................................................................81
3.2.3 Field Work and Literature Review ...............................................................................81
3.2.4 Identification of Clusters .............................................................................................82
3.2.5 Sampling Size ...........................................................................................................83
3.2.6 Material Flows ..........................................................................................................83
3.2.7 Benchmarking of Industrial Ecology Principles .............................................................84
3.2.8 Data Analysis and Presentation ....................................................................................85
CHAPTER FOUR: RESULTS AND DISCUSSIONS ......................................................................86
4.1 Determination of the Industrial Clusters of Athi River SEZ ....................................................87
4.2 Material Flow Patterns and Symbiotic Relationships ................................................................95
4.2.1 The Agro-Processing Cluster - Oil Extraction ................................................................98
4.2.2 Agro-processing Cluster - Instant Foods Processing ..................................................... 104
4.2.3 Agro-Processing Cluster - Artemisinin Extraction ........................................................ 106
4.2.4 Garment Cluster ....................................................................................................... 109
4.2.5 The Plastics Cluster - Tarpaulin Manufacturer ............................................................. 114
4.2.6 The Plastic PET Recycling Company ......................................................................... 116
4.2.7 Darts Board Manufacturing Cluster.............................................................................. 117
4.3 Assessment of the Application of Industrial Ecology Principles ................................................. 119
4.3.1 Challenges of engaging Industrial Symbiosis (IS) at the Athi River SEZ ......................... 125
4.3.2 Key Players in SEZ Promotion ...................................................................................... 132
4.4 The Management Model of the Athi River SEZ .................................................................. 134
4.5 Policy Implication of RECP and IS Promotion on Kenya’s Green Growth Agenda ................. 149
CHAPTER FIVE: SUMMARY OF KEY FINDINGS, CONCLUSIONS AND RECOMMENDATIONS
............................................................................................................................................... 153
5.1 Summary of Key Findings ............................................................................................... 153
5.2 Conclusions ................................................................................................................... 154
5.3 Recommendations ........................................................................................................... 155
5.4 Future Directions of Research in the Area .......................................................................... 158
REFERENCES .......................................................................................................................... 160

ix
LIST OF FIGURES
Figure 1: Linear Production System …………………………….……………………..………...45
Figure 2: Circular Economy ……………………………………………….…………….............46
Figure 3: Map of Planned Industrial Parks/ Special Economic Zones …………………….……..57
Figure 4: Institutional Framework to Support LCZ Development.........………………..………..65
Figure 5: Conceptual Framework………………………………………………………………...76
Figure 6: Seven Year Trending…………………………………………………………….……..98
Figure 7: Reduced Emissions due to Fuel Switch……………………………..….………….…104
Figure 8: Reduced Emissions due to Fuel Switch………………………………………..…..…108
Figure 9: Reduced Emissions due to Fuel Switch……………………………….………………110
Figure 10: Seven Year Trending of Production and Waste..........................................................114
Figure 11: Industrial Ecology Model for the Athi River SEZ......................................................148
x
LIST OF TABLES
Table 1: Summary of Relevant Legislative Framework for SEZs……………………………….32
Table2:Taxonomy of Zone types………………………………….………...……..……………55
Table 3: Indian Green SEZ Guidelines…………………………………………….….…………68
Table 4: Industrial Clusters of Athi River SEZ………………………………………………….88
Table 5: Clusters for In-depth Investigation…………………………………….……………….89
Table 6: Material Flow Balance for Oil Extration Company………………………….…….....100
Table 7: Material Balance for Instant Foods Processing………………………….……………105
Table 8: Artemisinin Extraction Material Balance……………………………….…………….107
Table 9: Garment Cluster Material Balance…………………………………..……….….……109
Table 10: Tarpulins Material Balance…………………..…………………………….………..115
Table11: Darts Manufacturing Material Balance………………………………….….……..…118
Table 12: Assessment of the Baseline Level of IE at the Economic Zone…………..……....…120
Table 13: Application of IE Principles to the Zone……………………………….……………129
Table 14: Stakeholder Primary Responsibilities in a SEZ program…………………….…...…133

xi
ACRONYMS ACE Answers to the Carbon Economy
CE Circular Economy
CP Cleaner Production
CSR Corporate Social Responsibility
EC European Commission
EEA European Environment Agency
EICs Eco-Industrial Clusters
EIP Eco-Industrial Park
EMS Environmental Management System
EPZ Export Processing Zone
EPZA Export Processing Zones Authority
EZ Economic Zone
GESIP Green Economy Strategy and Implementation Plan for Kenya
GEC Green Economy Coalition
GHG Greenhouse Gases
GIZ Germany Technical Corporation
GOK Government of Kenya
IE Industrial Ecology
IGBC Indian Green Building Council
IS Industrial Symbiosis
KIRDI Kenya Industrial Research and Development Institute
KNCPC Kenya National Cleaner Production Center
KPI Key Performance Indicators
LAPSSET Lamu Port South Sudan Ethiopia Transport Corridor
LCA Life Cycle Assessment
LCZ Low Carbon Zone
LCZG Low Carbon Zone Guidelines
LE Linear Economy
MEPS Mandatory Energy Performance Standard
MoIED Ministry of Industry and Enterprise Development
NCCAP National Climate Change Action Plan
NCCRS National Climate Change Response Strategy
NEMA National Environment Management Authority
NGO Non-Governmental Organization
NISP National Industrial Symbiosis Program
OECD Organization for Economic Corporation and Development
PPP Public Private Partnerships
PSDS Private Sector Development Strategy
RECP Resource Efficiency and Cleaner Production
RFA Resource Flow Analysis
3Rs Reduce, Reuse, and Recycle
SCU Science Communication Unit
SD Sustainable Development
SEZ Special Economic Zone
SGR Standard Gauge Railway

xii
SMC Sustainable Materials Cycle
SMM Sustainable Materials Management
SUDS Sustainable Urban Drainage System
UNEP United Nations Environment Program
WEF World Economic Forum

1
CHAPTER ONE: INTRODUCTION
1.1 Background
Industrial Ecology is an emerging field in environmental science that seeks to develop an
ecological model of industrial systems that operate within the Earth’s carrying capacity
(Mirovitskaya & Ascher, 2001; Ashton, 2008; UNEP, 2011; Anbumozhi et al. 2013). Such an
industrial system under this approach should be seen as a web of interconnected production units,
linked by the flow of materials and energy determined by physical and ecological principles
(Benyus, 1997; Chertow, 2006; Bermejo, 2014). The proven stability of ecosystems relies on their
interaction and interdependence while industrial systems emphasize independence and
competition (World Economic Forum, 2014). What is needed is a system of running industry in a
manner that enables materials and energy to be retained within it, and also ensure that production
systems are fully integrated with natural ecosystems and functional material cycles (UNEP, 2011;
World Bank, 2014). Applied industrial ecology involves the evolution of industrial systems from
linear systems, where resources are consumed and damaging wastes dissipated into the
environment to a more closed loop system similar to what happens in ecological systems (Bermejo,
2014). In a linear process, materials and energy enter one part of the system and then leave either
as products or by-products/wastes (Ashton, 2008; Mirata and Emtairah, 2005). Unless the supply
of materials and energy is infinite and the carrying capacity of the natural systems can assimilate
the wastes and emissions, the linear production system is unsustainable (UNEP, 2011). In most of
our national industrial manufacturing systems, some wastes are recycled or reused within the
system while others leave it (World Bank, 2014). In a more evolved and integrated industrial
ecosystem, there is a dynamic equilibrium with ecological systems, where energy and wastes are
constantly recycled and reused in closed loops by other processes within the system (Mirovitskaya
and Ascher, 2001; Ashton, 2008; UNEP, 2011; & Anbumozhi et al. 2013). The principles of waste

2
and by-product exchange should be applied at different spatial levels: within and between
companies, within special economic zones, and at regional or national levels (Mirovitskaya and
Ascher, 2001; Chertow and Lombardi, 2005).
As the need for proactive environmental management becomes clear, the search for innovative
approaches to pollution prevention is moving beyond individual firms to incorporate networks and
strategic alliances (Chertow, 2004; Ashton, 2008; and UNEP, 2011). Just as there is ecological
succession in natural ecosystems, industrial establishments also evolve through technological
upgrading (Kibert et al. 2002, Chertow, 2008). The concept of industrial ecology provides firms
with new frameworks for working together to solve environmental problems (Lowe, 1997;
Mirovitskaya & Ascher, 2001; UNEP, 2011). Industrial ecology models industries like living
organisms where the by-product of every metabolic process is food for another organism
(Mirovitskaya & Ascher, 2001; Ashton, 2008; UNEP, 2011). Industrial ecology makes it easier
for industries located in close physical proximity to design facilities that can help them exchange
energy and materials to their mutual environmental and economic benefit (Graedel and Allenby,
1995; Lowe, 1997; Lombardi and Laybourn, 2012; Bermejo, 2014). Doing this not only lowers
pressure on the use of virgin materials but also diverts waste from the land fill with accompanying
environmental benefits.
Special Economic Zones (SEZs) that offer duty-free importing and streamlined custom procedures
do play an important role in advancing industrial development, attracting foreign direct
investments (FDIs), creating jobs, strengthening export capabilities and serving as experimental
subjects for the testing, refinement and application of emerging and promising tools of
environmental management (World Bank, 2014). They do concentrate industries in fenced

3
geographical locations (Farole, 2011). Zone based companies therefore share infrastructure in form
of roads, railway, waste management as well as effluent treatment (World Bank, 1992; 2008). The
close proximity of zone based industries and the diversity of actors creates an enabling
environment for industrial ecology as it becomes easier to match exchanges of materials and
energy (Lowe, 1997; Bermejo, 2014). As we continue to gather evidence that climate change is
real, environmental advocates have started pressurizing governments, private sector developers,
and managers of SEZs to start incorporating elements of sustainability in their master plans by
seeking innovative ways of incorporating from the very beginning resource use efficiency, cleaner
production and industrial symbiosis (UNEP, 2011; World Bank, 2014). The Kalundborg
experience affirms that this sustainability challenge can be overcome by embracing industrial
ecology (Jacobsen, 2006; Huber, 2012).
The Kenyan Government has in place a draft SEZ policy and the SEZ Act that both do not
incorporate the desired sustainability elements of industrial ecology and green growth. The
country’s special economic zone (SEZ) Act No. 16 of 2015 was assented to on September 11, 2015
and came into force on December 15, 2015. Unfortunately, both the draft SEZ policy and Act do
not prioritize the need to develop low carbon, green and resource efficient SEZs. This is against
the global trend that is being advocated for by UNEP and the World Bank Group that seeks to
promote environmentally friendly eco-industrial economic zones that are powered by resource use
efficiency, cleaner production and industrial symbiosis (UNEP, 2011; World Bank, 2014).
Although Kenya’s industrialization policy mentions cleaner production as an approach to waste
minimization at source, it is silent on how to deal with the inevitable residual waste that is the
target of industrial ecology. As is expected, the Green Growth agenda that came into being in 2012
(Rio + 20) as an innovative approach to achieving sustainable development goals (SDGs) is not

4
directly mentioned in Government policy documents that were published earlier than 2012. This
category includes the Kenyan Constitution, industrialization policy, and Kenya Vision 2030.
Interestingly, due to limited stakeholder consultations, even the Government publications that were
published after 2012 such as the amended EMCA, 2015, the SEZ Act of 2015, and the draft SEZ
regulations still have no mention of the green growth agenda.
Recent developments in the global economy are pushing firms to develop new strategies of
competition and new processes for managing their environmental impacts (Massard et al. 2014).
These trends include (i) a growing awareness of the relationships between economic and
environmental sustainability; (ii) a better understanding of the business opportunities – both
potential cost reductions and higher profits – in adopting quality environmental management
practices; (iii) a growing realization in government and the private sector that regulatory controls,
while necessary, are not sufficient to achieve pollution prevention; and (iv) growing international
pressures on corporations to adopt voluntary standards for environmental management that go well
beyond regulatory compliance as a precondition for participation in global trade and investment
(Mirovitskaya & Ascher, 2001; GIZ, 2015b). The management of SEZs should develop zone use
regulations that seek to promote low-carbon, resource efficient and social inclusive
industrialization processes (GIZ, 2015b).
The Constitution of Kenya (2010) provides ground for the formulation of adaptation and mitigation
legislation, policies and strategies by guaranteeing the right to a clean and healthy environment
under the Bill of Rights. Every person has the right to a clean and healthy environment (Articles
42, 69 and 70), which is a fundamental freedom under the Bill of Rights. This right cannot be fully
provided for unless action is taken to address environmental pollution, which can be supported

5
through a low carbon climate resilient development pathway. The Constitution recognizes a clean
and healthy environment as a basic human right and provides for sustainable exploitation,
utilization, management and conservation of the environment and its natural resources1. Vision
2030, the national development blue print encapsulates flagship programs and projects with
aspects of adaptation and mitigation. It aims to achieve an annual growth of 10 percent per annum
and transform Kenya into “a globally competitive and prosperous country with a high quality of
life by 2030”2. In an effort to promote green growth, the Kenyan Government has developed a
green economy strategy that will support its development efforts towards addressing key
challenges of poverty, unemployment, inequality, environmental degradation, climate change and
variability3, infrastructural gaps and food security. The policy framework for green economy in
Kenya is spelled out in the constitution of Kenya 2010, Kenya Vision 2030, Green Economy
Strategy and Implementation Plan (GESIP), National Climate Change Response Strategy
(NCCRS)4, National Climate Change Action Plan (NCCAP)5, the draft Environmental Policy, the
draft Kenyan Climate Change Policy of 2014 and the Climate Change Act, Number 11 of 2016.
The Athi River SEZ was not planned for waste and by-product exchange among companies. Its
master plan did not incorporate elements of sustainability. In other words, there was no deliberate
effort of zoning the park in such a way that those companies that can exchange wastes and by-
products are located in close proximity. However, due to the prevailing market forces, there is
emerging exchange of wastes and by-products among companies, a development that should be
1 GOK, 2010. The New Constitution of Kenya, Printed by the Government Printers on 27 August 2010. 2 GOK, 2008. Kenya Vision 2030, Printed by the Ministry of Planning and National Development 3 GOK, 2015. Green Economy Strategy and Implementation Plan (GESIP) for Kenya. 4 GOK, 2010. National Climate Change Response Strategy (NCCRS), Ministry of Environment, Water, and Natural Resources 5 GOK, 2013. National Climate Change Action Plan (NCCAP) for 2013-2017, Ministry of Environment, Water, and Natural Resources

6
investigated to guide future zone planning and management. In order for the zone to be classified
as low carbon and green, it should deliberately start embracing resource use efficiency through
cleaner production and industrial symbiosis. This sequential approach to materials management is
not currently being fully embraced by the tenant companies of the zone. This study sought to
establish the environmental limitations of the current linear development model of the Athi River
SEZ. It investigated how industrial ecology could be engaged to transform this wasteful linear
model into a greener and sustainable closed loop supply chain. Specifically, the study sought to
determine the potential industrial clusters of the Athi River special economic zone (SEZ); establish
their material flow patterns and symbiotic relationships among the zone clusters; apply the
principles of industrial ecology in mitigating the environmental challenges of the zone and
development of a governance model that can help transform the current SEZ into a low-carbon
and resource efficient green zone.
1.2 Statement of the Research Problem
Kenya’s current industrial development model is largely linear. It is based on the wasteful linear
development economic model of extracting raw materials, converting them into consumable
products and discarding the resultant wastes into the landfill. This traditional linear development
model is characterized by linear flows of matter, where raw material inputs are mined, value added
into desired products, made use of, and discarded with a trail of waste at every stage of the supply
chain (Bermejo, 2014). Such an approach to economic development can only be sustainable in a
situation where the country is endowed with endless resources for its increasing demand. This is
certainly not the case. As a result of this realization, there is a strong international consensus that
over-reliance on wasteful linear economic development models is no longer sustainable. A much
more promising economic development model is one that seeks to promote a circular economy

7
that is powered by enhanced resource use efficiency, the adoption of the 3R philosophy of
reducing, reusing, and recycling wastes, before engaging industrial symbiosis to deal with the
inevitable residual waste. Doing this will help divert waste streams from the landfill and also
reduce pressure on the use of virgin raw materials. Given the great danger posed by a changing
climate regime, promoting resource use efficiency, diverting wastes from the landfill, and re-
circulating materials again and again in closed loop manufacturing value addition cycles will
definitely reduce the amount of climate damaging greenhouse gasses (GHG). The climate change
and environmental shortcomings associated with un-regulated economic zones can easily over ride
their proven socio-economic advantages if environmentally friendly interventions such as
industrial symbiosis are not incorporated.
This research project sought to assess what needs to be done at the Athi River SEZ so that the zone
can be enabled to abandon the wasteful and environmentally polluting linear economic
development model and instead embrace the much more promising circular economy. Switching
to a zero waste circular economy as it has sustainably happened in natural ecosystems not only
advances prudent and sustainable use of scarce resources but also opens a window for industrial
spin-offs that generate green jobs. Successful adoption of a circular economy using industrial
symbiosis at the Athi River SEZ will require enhanced institutional capacity in green growth
promotion, demonstrated awareness that investing in industrial symbiosis makes good economic
and environmental sense, and a functional infrastructure for waste recovery and recycling that are
all being addressed by this research project. In an industrial ecosystem, production is organized in
such a synergistic manner that mimics natural systems so that waste from one company becomes
a resource for another company (UNEP, 2011; UNIDO, 2015)

8
Kenya Vision 2030 currently guides the country’s development agenda (GOK, 2013). The vision
recognizes industrialization as one of the key pillars of economic growth and wealth creation
(GOK, 2013; 2015). As a result, there has been a marked proliferation of un-regulated special
economic zones (SEZs) across the country. Kenya currently boasts of 57-gazetted public and
private SEZs and this number is rapidly increasing (Export Processing Zones Program Annual
Performance Report, 2013). Plans are underway to establish a total of 10 industrial parks/ special
economic zones (SEZs) along the country’s major infrastructure corridors6. SEZs do concentrate
industrial plants in a designated geographical area with increased levels of pollution in form of
climate changing emissions and solid wastes (World Bank, 2014). There is need therefore for
cluster wise planning and zonation of the economic zone, a practice that is yet to be embraced by
the Zone Authority. This has resulted in inefficient use of raw materials, energy and water with
significant generation of wastes and emissions. Stockpiles of solid wastes are visible within the
economic zone.
The initial zone master plan was not designed with the ideals of sustainability in mind. This means
that there was no deliberate attempt to zone and cluster together industrial plants that could
exchange wastes and by-products. Therefore zone resident companies are not in a position of fully
benefiting from economic and environmental savings that could result from embracing resource
use efficiency at company level and industrial symbiosis comprising of closed material, energy
and/or water cycles within the clusters of co-located industries (UNIDO, 2015). Without this
deliberate move, the Athi River SEZ will not be in a position of attracting green foreign direct
investments (FDIs) (GIZ, 2015a). Absence of a clear industrial policy that prioritizes Industrial
6 GOK, 2015. Kenya’s Industrial Transformation Program, Ministry of Industry, Investment and Trade.

9
Ecology is to blame for the country’s over reliance on this wasteful linear development economic
model. This study targets policy makers, industrialists, managers of SEZs/ IPs, consultants, and
researchers with the message that investing in a circular economy that seeks to divert wastes from
the landfill makes good business and environmental sense.
1.3 Research Questions
The main research question was to find out how the environmental limitations of the linear
development model at the Athi River SEZ could be improved by embracing Industrial Ecology
that seeks to transform this wasteful linear model into a greener and sustainable closed loop supply
chain.
The sub-questions were:
1. Which industrial clusters have evolved at the Athi River special economic zone (SEZ)?
2. What material flow patterns and symbiotic relationships exist in the identified clusters?
3. How can the principles of industrial ecology be applied in helping to mitigate the
environmental challenges of the zone?
4. What governance model can help transform the zone’s wasteful linear economic model
into a circular economy?

10
1.4 Research Objectives
The general objective of this study was to assess the efficacy of Industrial Ecology as an
environmental governance model for transforming the wasteful Athi River SEZ’s linear
development model into a green and sustainable closed loop supply chain. Specific objectives
were:
1. To determine the evolution of industrial clusters at the Athi River SEZ;
2. To establish the material flow patterns and symbiotic relationships within the clusters;
3. To assess the application of industrial ecology principles in mitigating the environmental
challenges of the zone;
4. To propose a governance model that can help to transform the zone’s wasteful linear
economic development model into a circular economy.
11
1.5 Justification of the Study
Promising smart economies of the future are those that are continuously striving to minimize the
production of waste and reusing wastes as resources in other production lines (EC, 2014). This
reduces the pressure on the country’s finite virgin resources and also diverts waste from the landfill
(UNEP, 2015). At the moment, the country’s linear industrial system is driven by inputs of virgin
materials with waste continually being generated and disposed of outside the production systems.
This is unsustainable and a circular economic development model is preferred. Nowhere can this
be done with ease than in a special economic zone (SEZ) where industries are located in close
proximity with shared infrastructure. Moving towards a zero waste society not only makes
environmental sense but is also increasingly becoming a factor of improved competitiveness.
Kenya as a country needs to move away from the traditional linear development model that is
characterized by linear flows of matter, where raw materials are mined, value added into a wide
range of products that are utilized by consumers and discarded with a trail of waste at each unit
operation of the value addition chain to an efficient closed loop supply chain (Mirovitskaya and
Ascher, 2001; Ashton, 2008). It’s hoped that Kenya’s resource constraints and environmental
pressures will accelerate its transformation from a linear extraction-use-throw-away model of
economic growth into a closed loop supply chain as has been ably demonstrated in Asia and Europe
(EC Decision, 2014). These noble intentions are already spelled out in the country’s National
Climate Change Action Plan (NCCAP) and its Green Economy Strategy and implementation Plan
(GESIP), but not in the SEZ Act, draft SEZ policy and SEZ regulations.
In order to achieve this, the country’s SEZs should seek to organize and sequence their industrial
production lines in a manner that mimics the circular flow of matter in natural ecosystems so that
waste from one production line becomes feed stock for another production line (Wolf et al. 2012).
12
Deliberate construction of green eco-industrial parks as is happening in South Korea and China is
promising as it presents an enabling environment for improved resource use efficiency, enhanced
eco-innovation, and a workable industrial symbiosis. There is however, growing awareness by
governments, businesses and society in most developing countries that continuous discarding,
burying and incineration of waste is no longer sustainable (Roberts, 2004). This is informed by the
fact that the natural resources that provide the energy and materials for production are finite and
are becoming scarce and more expensive to access. Despite a significant increase in waste
materials recovery in Kenya, the end of life cycle for most of the country’s products is
unfortunately still the land fill. Industrial symbiosis provides a simple but cost-effective solution
to resource use efficiency and waste minimization in an Economic Zone (EZ) through an exchange
of energy, waste and material resources between firms, so that the waste or excess material of one
enterprise becomes a raw material input for another enterprise (World Bank, 2014). This allows
significant optimization and savings of energy and resources and vastly cuts down on the resource
losses and environmental impact of the zone as a whole (World Bank, 2014). There is need for the
development of infrastructural mechanisms for diverting waste from the landfill. Kenya is making
advances in trying to address the country’s ever increasing waste problems. The economic zone
should put in place effective waste management regulations that seek to reduce the volume of
wastes at source and encourage recovery and recycling of the inevitable wastes.

13
1.6 Thesis Structure
This thesis is divided into five chapters. Chapter One presents the background and states the
statement of the research problem. The Chapter states the research questions, research objectives,
and presents the justification of the study.
Chapter Two introduces the concept of Industrial Ecology and reviewed the evolution of Kenya’s
industrial policy framework starting from the National Industrialization Policy of 1996; Kenya
Vision 2030; the National Industrialization Policy Framework for 2012-2013; the Kenya Industrial
Sector Strategic Plan 2013- 2017; the Kenya Industrial Transformation Program for 2015; the
Amended Environmental Management and Coordination Act (EMCA, 2015), the National Climate
Change Action Plan 2013-2017; Kenya’s Intended Nationally Determined Contributions (INDC);
and best practice policy reviews for the European Union, China, Japan, South Korea, South Africa
and the lessons that Kenya can learn from their past experiences.
Chapter three describes in detail the study area; data collection methods and instruments; data
needs, types and sources; the sampling procedure as well as the methodological approach of the
research.
Chapter four presents the study’s results and their discussion in terms of the zone’s inputs and
outputs as well as the evolving industrial symbiosis networks. It also proposes a governance model
based on expanded triple helix collaboration for green growth.
Chapter five details the conclusions and recommendations of the study.

14
CHAPTER TWO: LITREATURE REVIEW
2.1 Introduction
This chapter outlines the Industrial Ecology (IE) concept and explains its evolution over time. This
review focused on past research, underlying theories and proven implementation outcomes. It
reviewed policy interventions for IE application in the European Union, China, Japan, South Korea
and South Africa and concluded that the best approach for Kenya will be one that adopts resource
use efficiency and waste minimization at tenant company level first before engaging Industrial
symbiosis to deal with the inevitable residual waste. Evidence from the ground revealed no
systematic evidence of zone tenant companies engaging themselves in resource efficient cleaner
production (RECP), the 3Rs of seeking to reduce, reuse and recycle wastes and adoption of
industrial symbiosis (IS) to deal with the inevitable residual waste. A speedy adoption of RECP,
the 3Rs and IS will require Government funded demonstrations. The review drew lessons from the
Indian Government that has already developed green rating systems and standards that advocate
for energy efficiency, water use efficiency, waste minimization and management as well as the
application of renewable energy solutions in form of solar, wind and biomass. It was observed that
the greening of SEZs helped boost the country’s ability to attract green Foreign Direct Investments
(FDIs).
2.2 Overview of Industrial Ecology
The forward thinking of Frosch and Gallopoulos way back in 1989 gave birth to the first definition
of Industrial Ecology whose relevance seems to be increasing as a result of dwindling natural
resources as well as the dangers being posed by a changing climate regime. Through a seminal
paper, Frosch and Gallopoulous recommended that…
The traditional model of industrial activity … should be transformed into a more integrated
model: an industrial ecosystem. In such a system, the consumption of energy and materials

15
is optimized, waste generation minimized, and the effluents of one process ….. serves as a
raw material for the other….. (Cliff &Druckman, 2016)
Industrial Ecology operates on the premise that the design of sustainable industrial systems should
as much as possible copy from the cyclic flows of materials in natural ecosystems (Graedel et al.
1995). There is emerging international consensus that the way we are using our resources is
unsustainable and interventions such as industrial ecology should be encouraged so that wastes are
diverted from the landfill and reused again and again so as to reduce pressure on the country’s use
of virgin materials. This is what is popularly referred to as a “Circular Economy). Unfortunately,
company manufacturing operations within the Athi River SEZ are largely linear in the sense that
raw materials are extracted from the environment, value added into final products that are
consumed with resultant wastes destined for the landfill. This can only be sustainable if the
country’s resources are infinite which is not the case. Therefore there is need to think of innovative
ways of conserving our finite resources. Adoption of RECP will help reduce waste generation at
source before engaging industrial symbiosis (IS) to deal with the inevitable residual waste with the
aim of seeking to divert it from the landfill.
Subscribing to a circular economy powered by resource efficient cleaner production (RECP) and
industrial symbiosis will improve resource security of the economic zone, reduce associated
environmental impacts associated with waste disposal, and offer new opportunities for economic
growth and wealth creation. However, accelerated adoption of industrial symbiosis in Kenya is
likely to be hampered by factors such as inadequate awareness of the economic and environmental
benefits of embracing industrial ecology especially by Kenyan policy makers, insufficient and
inaccurate production data that cannot be relied upon to make informed decisions, over reliance

16
on out dated policies that do not prioritize industrial ecology and resource use efficiency in general,
absence of operational demonstrations to serve as convincing learning points, limited research in
the emerging area of industrial ecology, and non-defined Government role in promoting the IS
culture (Clift & Druckman, 2016). It has been demonstrated in Europe and Asia that a speedy
adoption of industrial ecology requires an incentive scheme. The incentive will enable the
participating companies to close their material and energy loops as opposed to letting wastes and
by-products be disposed of in a landfill.
The Kalundborg symbiosis developed slowly on its own over the last 40 years without an form of
design (Ehrenfeld & Gertler, 1997). This industrial symbiosis never received public subsidies and
each linkage between firms was negotiated as an independent business deal (Ehrenfeld and Gertler,
1997). In other words, the Kalundborg symbiosis has always been driven by market forces and the
actual physical linkages and their economic viability were the subject of bilateral talks between
industrial actors without external prompting (Jacobsen & Anderberg, 2004). These factors must
be explicitly stated when using the Kalundborg as a standard model for the establishment of eco-
industrial development (Ehrenfeld and Gertler, 1997). Without the knowledge gained from the
Kalundborg case, it is doubtful that the recycling networks across the world have been identified
or developed (Starlander, 2003). In fact, it is hardly imaginable that eco-industrial development
would have flourished so strongly in the last 30 years without the identification, intensive study
and well documented material and monetary savings surrounding the spontaneous innovation at
Kalundborg (Jacobsen, 2006).

17
There two main reasons responsible for explaining the past and continuing success of the
Kalundborg industrial symbiosis are; that the industrial partnerships are commercially viable, and,
the networked partners are located in close proximity to each other, which easily facilitates any
form of material or energy exchange (Jacobsen & Anderberg, 2004).
The approaches to promoting a circular economy have to be designed to fit the local context. Some
of the key concepts related to this approach are:
Cleaner Production: The continuous application of an integrated preventive environmental
strategy to processes, goods, and services to increase overall efficiency, and reduce risks to humans
and the environment. Cleaner Production can be applied to the processes used in any industry, to
goods themselves, and to various services provided in society (UNEP, 2011);
Circular economy: is one that is restorative and regenerative by design, and which aims to keep
products, components and materials at their highest utility and value at all times, distinguishing
between technical and biological cycles. In practical terms Circular economy promotes re-using,
repairing, refurbishing and recycling of existing materials and products, as well as better eco-
design of products that will allow their durability, repairability, recyclability and waste prevention.
Circular economy is becoming one of the key strategies in the EU supporting its resource
efficiency and competitiveness goals. The circular economy was adopted by the Chinese
Government in 2001 as its official economic development model (UNEP, 2011).
Industrial ecology: Industrial ecology is a science focusing on the shifting of traditional waste-
producing industrial processes to closed-loop systems, where wastes become inputs for new
processes. Industrial ecology searches more effective use of internal resources, or clustering with
other industrial processes. It studies the redesign of manufacturing processes and business

18
relationships to use less energy, reject less waste, and substitute non-polluting inputs instead of
using more traditional chemical processes (UNEP, 2011).
The key gaps that will hamper an accelerated uptake of industrial ecology (IE) by Kenyan SEZs
will include weak waste recovery and recycling infrastructure; a non-supportive policy and
regulatory framework; limited awareness about the economic and environmental benefits of
investing in industrial ecology.
2.3 Policy Framework for Kenya’s Industrialization
2.3.1 Kenya Constitution 2010
The Constitution of Kenya (2010) which provides ground for the formulation of adaptation and
mitigation legislation, policies and strategies by guaranteeing the right to a clean and healthy
environment under the Bill of Rights (GOK, 2013). A clean and healthy environment (Articles 42,
69 and 70) is a fundamental right under the Bill of Rights (GOK, 2013). This right cannot be fully
provided for unless action is taken to address environmental pollution, which can be supported
through a low carbon climate resilient development trajectory (GOK, 2010).
2.3.2 Kenya Vision 2030
It is a twenty four year long-term development blue print for Kenya that is implemented through
five year development plans. The vision is inspired by the principles of sustainable development
that prioritize the decoupling of economic growth from environmental degradation. The vision
advocates for reasonable and equitable access to the benefits presented by a clean and safe
environment prioritizing sustainable exploitation of natural resources, proactive management of
pollution and waste, improving capacity for climate change adaptation, and strengthening
institutional capacity for environmental governance7. The Kenya Vision 2030 aims at achieving
7 Ministry of Environment and Natural Resources – Kenya, 2015. Nationally Appropriate Mitigation Action on a Circular Economy Solid Waste Management Approach for Urban Areas in Kenya.

19
an annual growth of 10 percent per annum and transforming Kenya into “a globally competitive
and prosperous country with a high quality of life by 2030 (Kenya Vision 2030).
Under this vision, the Government is implementing a number of policies and initiatives that include
increased investment in renewable energy, promotion of resource use efficiency and sustainable
consumption and production of scarce natural resources and prudent waste management in
anticipation of a newly industrializing status and middle income capability that is capable of
providing high quality of life to all citizens within a secure and healthy environment.
Manufacturing is one of the key sectors within the economic pillar of the Vision 2030 that is
expected to generate 10 per cent economic growth per annum8. This plan aims to develop and
promote Micro, Small and Medium Industries (MSMIs) earmarked as critical in propelling
industrialization process and recognizes the establishment of Industrial parks (IPs) and Special
Economic Zones (SEZs) as flagship projects to support industrial growth. Development of master
plans and structural designs are in progress for SME industrial parks in Nairobi, Nakuru,
Mombasa, Eldoret and Kisumu while135 and 20 acres of land were identified in Eldoret and Taita
Taveta respectively (GOK, 2013). This will enhance productivity, attract foreign and local
investments, create jobs, generate wealth, tackle extreme poverty and integrate environmental
sustainability into the country’s socio-economic development. The main activity under this Vision
was the construction and equipping of Constituency Industrial Development Centres (CIDCs) in
all the 210 constituencies to provide worksites, stations, and tools for the youth to pursue gainful
employment. A total of 188 constituencies out of the 210 identified land for the construction of
CIDCs. The Ministry of Industrialization and Enterprise Development completed construction of
8 Kenya Vision 2030

20
139 Constituency Industrial Development Centres in various constituencies while construction
works for the remaining 49 centres are at various stages of implementation (MTP II). Out of these,
47 CIDCs have been identified for upgrading into industrial parks in each of the counties (MTP
II).
2.3.3 National Industrialization Policy Framework for Kenya 2012 - 2030
In order to realize the desired Vision 2030 GDP growth rate of 10 percent per annum, and to
enhance Foreign Direct Investments (FDIs), a number of flagship projects and other programs
were identified in every sector to be implemented over the Vision period. During the 1st medium
term plan (MTP), the flagship projects under the manufacturing sub-sector included the following:
Development of SME Parks, development of Special Economic Zones (SEZs), Industrial Parks,
Industrial and Manufacturing clusters, inputs cost reduction, value addition and market access
development, financial services deepening and development of livestock Disease Free Zones for
production of premium quality beef and other livestock products. Progress in this area has been
slow but promising. During this 1st MTP (2008-2012), at least five (5) Small and Medium-
Enterprise (SME) Industrial parks were to be developed in key urban centres in Nairobi, Nakuru,
Mombasa, Eldoret and Kisumu. To align the implementation of Vision 2030 and the Kenya
Constitution 2010, the approach has been reviewed to develop the SME Parks in the 47 counties.
Land has been identified and acquired for 2 SME parks in Taveta and Eldoret .
Currently 135 and 20 acres of land was identified in Eldoret and Taita Taveta respectively (MTP
II). Development of master plans, structural designs and feasibility studies for Eldoret and Taveta
SME Parks was initiated Other outstanding activities include feasibility studies, development of
Master plans and Architectural Designs initiated. Governance and Management structures of the
SME Parks will be put in place through the PPP approach. Funds mobilization for both horizontal

21
and vertical development of the parks will be initiated. Special Economic Zones (SEZs) are
designated geographical areas with liberal economic laws, and developed infrastructure. They play
an important role in catalyzing economic and social development and increasing competitiveness.
During the plan period, three (3) SEZs were planned to be implemented in Mombasa, Lamu and
Kisumu. Land was identified in Dongo Kundu and Lamu. The SEZ concept paper was approved
by Cabinet and plans for the development of the Master Plan are underway.
Further a SEZ policy and bill have been developed and approved by cabinet and a Sessional paper
on the same has been prepared in readiness for tabling in parliament. During the first MTP, two
(2) industrial parks were to be developed in Mombasa and Kisumu within the Special Economic
Zones (SEZ). In Mombasa and Kisumu, 3000 and 1000 acres of land were identified respectively
for development of industrial parks. Master plans and basic infrastructure for the industrial parks
will be developed within the second MTP. Resources to support development of the parks will be
mobilized through a Public, Private sector Partnership (PPP) approach. Furthermore during the
implementation period, land for development of a third industrial and technology park was
identified at Jomo Kenyatta University of Agriculture and Technology (JKUAT) in Juja. The
university allocated 32 acres of land for development of the park and a Memorandum of
Understanding (MoU) has been signed between the Ministry and the University. The development
of master plans and structural designs for the park are in progress. During the second MTP,
resources will be mobilized to develop basic infrastructure and a project management structure
will be put in place. Though well intentioned and in line with the aspirations of Kenya Vision
2030, the implementation process has been rather slow largely due to lack of funds and the ideals

22
of green growth have not been given the attention that they deserve in the already developed master
plans.
2.3.4 Kenya Industrial Sector Strategic Plan 2013 – 2017
The mission of the country’s National Industrialization policy is to enhance a sustained growth of
the industrial sector, by at least 15 per cent per annum by 2017, by creating an enabling
environment for a robust, diversified, fair competition field, cost and time conscious, and
innovative industrial sector; that offers targeted incentive packages in priority sectors; and desires
to have a country wide dispersal of industrial activities leading to regional economic
empowerment. The specific goals to be achieved in the short term (5 years) are: (i) strengthening
local production capacity to increase domestically-manufactured goods by focusing on improving
the sectors productivity and value addition by 20 per cent; (ii) raising the share of Kenyan products
in the regional market from 7 to 15 per cent; (iii) developing niche products through which Kenya
can achieve a global competitive advantage; (iv) increase the share of Foreign Direct Investment
in the industrial sector by 10 per cent; (v) increase by 25 per cent the share of locally produced
industrial components and spare parts; (vi) developing at least 2 Special Economic Zones and 5
SME Industrial Parks; (vii) creation of an Industrial Development Fund with a minimum of Kshs.
10 billion for long term financing; (viii) increase by 20 per cent the share of manufacturing in total
MSME Output; (ix) increase the local content of locally manufactured goods for export to at least
60 per cent; and (x) increase the share of industries located outside major urban centres (Nairobi,
Mombasa, Kisumu, Nakuru, Eldoret) to 50 per cent. Majority of these specific goals can be
achieved through the construction of well managed SEZs/IPs.

23
The policy recognizes the need for the Government to plan, demarcate, zone and acquire land for
industrial development in every county. Additionally, the policy seeks to develop a framework for
commercializing of research findings; formulate mechanism to facilitate collaboration with the
private sector in research, technology and development; strengthen capacity for technology
certification and adoption; establish a funding mechanism for Research and Development to
facilitate innovation, acquisition of strategic and relevant technology for industrial development;
and establish an industrial information database. The concepts of green growth as interpreted from
the point of view of being low-carbon, resource efficient, and climate resilient are not captured in
the plan to mainstream green growth ideals in the establishment of Special Economic Zones and
Industrial Parks to support the promising circular economy.
2.3.5 Kenya Industrial Transformation Program 2015
This is a strategic document to guide industrial development in Kenya towards transforming the
country into an industrial hub in the region and beyond. In order to achieve this goal, the program
recognizes the need to overcome challenges such as infrastructure and land availability, skills and
capabilities in priority sectors, quality of inputs, cost of operation, access to markets and investor
friendly policies. The strategy acknowledges creation of green industry as a priority to drive a low-
carbon green economy. This will provide the much needed niche while marketing domestic
products overseas where consumers are increasingly emphasizing on environmentally
manufactured products. However, the strategy lacks adequate SCP considerations and integration
into its five pillars thereby requiring the need to subject the program to a Strategic Environmental
Assessment to identify and strengthen strategic greener implementation pathways.

24
Though the program prioritizes sub-sectors such as special economic zones and industrial parks
along the country’s major infrastructure corridors, the concept of a circular economy through Eco-
industrial parks, Industrial symbiosis; Resource Efficiency and leaner Production (RECP), Eco-
innovation, Eco-labels in line with the SCP paradigm were not considered. The 10 YFP framework
on Programs on Sustainable Consumption and Production (10 YFP) was adopted at RIO+20. The
program recommends that industrial transformation should be underpinned on Sustainable
Consumption and Production practices such as resource efficiency and cleaner production, eco-
industrial parks, industrial symbiosis, extended producer responsibility, EMSs and Eco-labels.
Though the country has continuously developed progressive and enabling policies for
industrialization, its ability to fully implement them has been wanting. The end result is that the
good policy intentions that are ably put on paper are not translated into implementable actions on
the ground. Kenya Vision 2030 is currently guiding the country’s development agenda (GOK,
2013). This vision recognizes industrialization as one of the key pillars of economic growth and
wealth creation (GOK, 2013; 2015). As a result, there has been a marked increase in the
proliferation of manufacturing value added special economic zones (SEZs) across the country.
Kenya currently boasts of 50 gazetted public and private SEZs and this number is rapidly
increasing (Export Processing Zones Program Annual Performance Report, 2013).
Plans are underway to establish a total of 10 more industrial parks/ special economic zones (SEZs)
along the country’s major infrastructure corridors9. The planned industrial parks are Mombasa
Industrial Park (Dongo Kundu), Miritini Garment Industrial Park, Voi Industrial Park, Sultan
Hamud Industrial Park, Athi River special economic Zone (SEZ), Naivasha Industrial Park,
9 GOK, 2015. Kenya’s Industrial Transformation Program, Ministry of Industry, Investment and Trade.

25
Nakuru Industrial Park, and Kisumu industrial park along the SGR and Lamu Industrial Park and
Baringo-Silali Industrial Park on the Lamu Port South Sudan Ethiopia Transport (LAPSSET)
corridor as shown in the map below. The culture of industrialization through special economic
zones (SEZs) and industrial parks (IPs) is gathering momentum in Kenya. Increasingly, the
Kenyan private sector is recognizing that SEZs/ IPs do provide an enabling environment for
manufacturing through well managed solid, liquid, transport, energy and waste management
infrastructure that is non-existent in the rest of the country. Because SEZs/ IPs concentrate
industries in delimited areas, their strict adherence to the ideals of resource use efficiency and
cleaner production (RECP) and industrial symbiosis (IS) will enable them lower their carbon
footprints and remain competitive.
2.3.6 National Climate Change Action Plan 2013 - 2017
Kenya has an elaborate five year climate change action plan that runs from 2013 to 2017. Its main
aim is to help minimize waste related greenhouse gas emissions and fundamentally improve on
the country’s approach to waste management. It was developed in 2013 to help implement the
mitigation and adaptation provisions of the country’s 2010 National Climate Change Response
Strategy (NCCRS). The Action Plan recognizes waste management for green job creation,
advocates for improved collection and recovery of wastes as well as use of waste for energy
generation. Fuel switch from the use of fossils to the use of biomass based energy sources
whenever feasible is recommended for economic and environmental reasons.

26
2.3.7 Kenya’s Intended Nationally Determined Contributions (INDC)
As part of its UNFCCC obligations, Kenya has committed herself to abating its greenhouse gas
(GHG) emissions by up to 30% by 2030 relative to the business as usual (BAU) scenario of 143
MtCO2eq. The country affirms that this will be subject to continued internal support in form of
financing, investments, technology development and transfer support, as well as the accompanying
capacity building support. In order to realize this goal, Kenya will continue implementing its
climate change action plan for 2013 – 2017, and subsequent action plans. The implementation plan
will include the promotion and implementation of enhanced energy and resource use efficiency
across different sectors of the economy; adoption of environmentally friendly and clean energy
technologies for purposes of reducing over-reliance on fuel wood; adoption of low-emission and
efficient urban transport systems and a switch to sustainable waste management systems. The
emission reduction levels registered in this study through fuel switch from the use of furnace oil
to the use of biomass is one business model that can help the country realize its 30% reduction
levels by 2030.
Industrial Symbiosis contributes directly to the achievement of sustainable development goal
(SDG) 8 on promoting sustained, inclusive and sustainable economic growth, full and productive
employment and decent work for all; goal 9 on building resilient infrastructure, promoting
inclusive and sustainable industrialization and fostering innovation; goal 12 on ensuring
sustainable consumption and production patterns; goal 13 on taking urgent action to combat
climate change and its impacts; and goal 17 on strengthening the means of implementation and
revitalization of the global partnership for sustainable development (Lombardi, 2015). Resource
use efficiency and cleaner production (RECP), adoption of the 3R philosophy of reducing, reusing
and recycling and industrial symbiosis investigated in this study will enable the country promote

27
energy efficiency, water use efficiency, minimize waste at source, adopt renewable energy
solutions, and adoption of a circular economy through industrial symbiosis will go a long way in
enabling the country meet its emission targets by 2030.
In order to facilitate the widespread adoption of RECP and IS within Kenyan SEZs, there will be
need to make provision for monitoring, reporting, and review mechanisms. The Zone Authority
will need to install and operate a zone wide information management system that will (i) support
inter-enterprise communications (ii) provide a centralized data acquisition and analysis system to
monitor energy, GHG, and water flow data; and (iii) inform enterprises on local and national
developments related to energy and environmental management (UNEP, 2014). Of fundamental
importance is the need for zone based enterprises to embrace energy efficient technologies,
processes and practices (World Bank, 2014). The Zone Authority with the assistance of the “Green
Cell” should be organizing workshops, training and learning sessions to help enterprises conduct
energy audits and adopt best practices in energy efficiency (UNEP, 2014).
2.3.8 Green Economy in the Kenyan Context
There is growing recognition that transitioning to an ‘inclusive green economy for Kenya’ can
provide the means to address some of the systemic problems of the current economic system, and
can generate more inclusive and sustainable growth by increasing the economic and social returns
from investing in environmental improvement and low-carbon, climate-resilient development
trajectories (JPA, 2012; GOK, 2013; Hu, 2014). UNEP defines a green economy as one that results
in improved human well-being and social equity, while significantly reducing environmental risks
and ecological scarcities (UNEP, 2011). For the SEZ’s, this transition means supporting resource-
efficient, low-carbon and climate-resilient growth; creating and sustaining decent green jobs, and

28
expanding other economic opportunities that benefit the poor, including the informal economy;
stimulating innovation and adopting green technologies that can benefit the poor; and diversifying
and enhancing the resilience of the regional economies (JPA, 2012). Further, the social pillar
means improving the health and well-being, especially among the poor; Promoting equity,
including gender equality; building social capital and enhancing the resilience of local
communities, especially among the poor; while the environmental pillar advocates for increased
productivity and efficiency of natural resource use, reduced pollution and impact of natural
hazards, improved management of environmental risks, and making investments in restoring and
sustaining ecosystem health and resilience (JPA, 2012). All these tenets are well explained in the
country’s draft Green Economy Strategy Implementation Plan (GESIP). The governance pillar
entails empowering citizens/ employees through access to information and justice and participation
in decision making, particularly among marginalized groups, improving transparency and
accountability in the public and private sectors and insisting on better regulation of markets
(UNEP, 2011).
In the Kenyan context, Green Economy is seen as a smart way of delivering an equitable society
that resides in a sustainable environment (GOK, 2015). The definitions of Green Economy by four
international organizations OECD, UNDP, UNEP and the World Bank are broadly characterized
by three objectives: improving resource-use efficiency (a green economy is one that is efficient in
its use of energy, water and other material inputs); ensures ecosystem resilience (protects the
natural environment, its ecosystems’ structures and flows of ecosystem services); and enhances
social equity (it promotes human well-being and fair burden sharing across societies) (NCCAP,
2013; EEA, 2014; GOK, 2015). The concept of Green Economy does not replace that of

29
sustainable development, but can instead be understood as an innovative way to achieving
sustainable development (UNEP, 2011). Low-carbon green growth is a development pathway that
decouples economic growth from carbon emissions, pollution and resource use, and promotes
development through the creation of new and environmentally friendly products, industries and
business models that seek to improve people’s quality of life (ADB, 2012; NCCAP, 2013). The
United Nations Industrial Development Organization (UNIDO) defines green industry as: “the
potential for industries to decouple economic growth and revenues from excessive and increased
resource use and pollution (UNIDO, 2011; UNEP 2011). This vision foresees a world where the
industrial sector minimizes waste in every form, utilizes renewable resources as input materials
and fuel, and takes every possible precaution to avoid harming workers, communities, climate or
the environment (UNIDO, 2011; UNIDO 2015). Green industries will be creative and innovative,
constantly developing new ways of improving their economic, environmental and social
performance (UNIDO, 2011; UNIDO 2015This involves both the greening of existing products
and the creation of green industries that deliver environmental goods and services (UNEP, 2011;
UNIDO 2015).
2.3.9 Challenges of Promoting Green Growth in Kenya
Although there is unanimous national support for a green economy, Kenya as a country has to
overcome key challenges that might derail its grand match to the green economy status (GOK,
2015). The first challenge is attributed to the country’s inability to enforce its sustainability
enabling laws and regulations. The weak enforcement fate that has characterised the
implementation of the amended Environmental Management and Coordination Act (EMCA, 2015)
and its subsequent regulations is likely to be the same fate that will face will characterise the
implementation of the climate change act, its implementation regulations as well as the already

30
published green economy strategy and implementation plan (GESIP) (GOK, 2015). Secondly, the
country does not boast of any existing standards for green technologies, green manufactured goods
and environmentally benign services. Progress is underway as evidenced by the Government’s
efforts to set minimum energy efficiency standards for certain appliances across the country (GOK,
2015). Use of voluntary rating schemes for SEZs has proved to be successful in promoting good
manufacturing behavior in India and China (GIZ, 2015a; 2015b). The country has a weak
technology transfer infrastructure that will tend to complicate its ability to bring into its economy
environmentally sound technologies (ESTs) (UNEP, 2015). Companies operating within the SEZs
will therefore experience difficulties in transferring ESTs into their domain as well as acquiring
techno-managerial capability to transfer, adopt, and adapt these technologies to the Kenyan setting
(GOK, 2015). Successful adoption environmental standards not only benefits the environment but
also boosts the country’s ability to trade with the international community. Eco-labels should be
embraced as a way of enabling consumers make easy informed choices as regards their
consumption habits.
Third, the current economic policy framework for Kenya needs to account for the intrinsic value
of its natural capital and support sustainable development (GOK, 2015). Like most countries,
Kenyan prices and policy regimes do not fully account for the external costs associated with
technologies, products and practices that are not environmentally friendly (GOK, 2015). This also
tends to diminish any emerging demand for greener alternatives (GOK, 2015). There is potential
though to use fiscal policy instruments to correct this, such as environmental taxes, subsidies,
pollution charges, public expenditure on green infrastructure, green public procurement, feed in
tariffs and grants (GOK, 2014). Kenya already has a feed-in tariff intended to promote green

31
energy but it excludes some resources such as wave, tidal and ocean thermal energy conversion
(GOK, 2013). These tariffs help to level the playing field with fossil fuel energy sources (GOK,
2015). Fourth, additional funding will be needed to effect a transition to a green economy due to
its high up front capital costs, particularly in areas like energy where up-front costs for clean
technologies can be prohibitively high (GOK, 2015) although they enjoy attractive payback
periods. These funds will need to originate from both the private and the public sector (GOK,
2014). At the international level, Kenya may be underutilizing international donor funds available
for low-carbon development (GOK, 2015). At the domestic level, enhancing its ability to mobilize
domestic funds for investment in new renewable technologies will require addressing current
disincentives (GOK, 2015).
Fifth, there is insufficient knowledge regarding the costs and performance characteristics of
available green technologies (UNIDO, 2015). There is also entrenched policy, market and financial
barriers that prevent the transition from fossil fuel-based technology to greener alternatives (GOK,
2015). Efforts to increase awareness of energy efficiency and renewable energy technologies can
improve knowledge of best practices, promote the concept of a green economy and provide needed
education and outreach (GOK, 2015). Kenya needs to emulate the successful Chinese experience
in promoting a circular economy. The Circular Economy (CE) Promotion Law passed in China in
2008 is a working example of a Resource Efficiency and Cleaner Production (RECP) policy in
action. A CE puts emphasis on the most efficient use of resources and promotes reducing, reusing
and recycling (UNEP, 2015). It supports resource efficiency by integrating cleaner production and
industrial ecology in a broader system that includes industrial firms, networks or chains of firms
and eco-industrial parks (UNEP, 2015). The CE initiative targets resource efficiency at three

32
levels: at the firm level, the Manager must seek much higher efficiency through cleaner production
(primarily reducing, reusing and recycling); reuse and recycle resources in industrial parks and
clustered or chained industries so that resources will circulate fully in the local production system;
and integrating different production and consumption systems in a region so that resources
circulate among industries and urban systems (UNEP, 2015).
2.3.9 Legal Framework
Table: 1 Summary of Relevant Legal Framework for SEZs
Table 1 below shows a summary of how the relevant legal provisions apply to SEZs.
Act Sections of the Act Relevant to the
Study
Sections of the Regulations relevant
to the study
Amended EMCA,
2015
-The Act requires that new industrial
parks be subjected to a Strategic
Environmental Assessment (SEA)
study
-Licenses all waste management
practitioners in the country
- Guidelines on how to handle,
store, transport, and treat for
disposal a wide range of waste
streams
- Regulations prioritize waste
minimization (reducing, reusing,
recycling and recovering wastes);
cleaner production technologies,
techniques and practices;
- Source segregation of wastes that
is key for promoting industrial
symbiosis at the economic zone
level.
- These same regulations provide
an opportunity for private sector
investment in waste management
that will be key in helping to
establish spin off companies for the
creation of decent green jobs.
SEZ Act 2015 The Act does not address any
elements relevant to green growth
and the need for low-carbon,
resource efficient, and socially
inclusive development trajectories
The draft regulations do not give
priority to the country’s green
growth agenda
Climate Change
Act, 2016
Act calls for adoption of a green
growth development trajectory that
is low carbon, resource efficient and
The Act Regulations are yet to be
drafted

33
socially inclusive in terms of
creation of decent green jobs
2.4 Promotion of RECP and IS at the Athi River SEZ
The Kenyan Athi River SEZ was planned, designed, built and run with little concern for its impact
on the environment and that explains why there has been a marked accumulation of wastes and
by-products within its zone boundaries over time. The economic zone operates a wide range of
industrial establishments that leads to a cumulative effect of the environmental impacts of
individual companies within the zone with each company attempting to fix its challenges single
handedly. This should not be the case. The proximity of companies within the economic zone
should be exploited economically by exploring ways and means of enabling these companies to
exchange wastes and by-products through industrial symbiosis. By working together, the
community of businesses within the economic zone will achieve a collective benefit that will be
greater than the sum of individual benefits each company would realize by only optimizing and
making efficient its individual performance (Lowe, 2001).
The environmental dimension of the economic zone has been overlooked for a long time. A
cooperative, collaborative and inclusive approach in addressing specific enterprises’
environmental challenges will not only reduce the impacts of the enterprises but also contribute to
the overall reduction of the zone’s environmental impacts through exploitation of synergies
between companies. This approach is much more cost effective when compared to industrial
enterprise engagement. The green growth agenda of the economic zone must be played by both
the zone and its tenant companies. This is due to the fact that, there are some environmental issues
that are not important at company level while they are extremely important when the overall
activities of the economic zone are considered. Examples in this regard will include water or

34
energy consumption, and greenhouse gas (GHG) emissions. This requires the Zone Authority to
work closely with its tenant companies in developing for example GHG inventories and other
collective green growth objectives. There is therefore need for a mechanism that allows both tenant
companies and the Zone Authority to speak the same environmental language and similarly work
towards the mutually reinforcing goals of the economic zone. Unfortunately, there is no inbuilt
enabling infrastructure that is designed to fully tap into these potential synergies on a wide scale.
With proper planning, Kenyan economic zones can provide unrivalled leadership in environmental
performance due to the existence of shared infrastructure. UNEP points out that environmental
impacts associated with economic zones can be easily divided into two types: impacts that occur
as a legacy from when the industrial park was planned and impacts that arise from the day-to-day
operations of the industrial park (UNEP, 2015). It is easier and cost effective to improve on the
day-to-day operations of industrial parks.
The Athi River SEZ does not have a controlled landfill. There is therefore no incentive for tenant
companies to seek innovative ways of diverting wastes from the landfill. As a result, there has
been a marked accumulation of solid wastes in the zone over the years. This can rapidly change if
the zone’s waste streams can be integrated back into the value addition cycle. The Athi River SEZ
has the requisite threshold number of companies to permit cooperative and collaborative
approaches to synergies such as waste and by-product exchange. It should be the cardinal duty of
the Zone Authority to encourage this. Lack of this intervention means that materials within the
economic zone are continuously flowing from the economy into the environment with disastrous
impacts. In order for the economic zone to fully embrace the ideals of sustainability, it has to drift
away from over reliance on end-of-pipe approaches and instead embrace pollution prevention at

35
source. The end-of-pipe is a reactive approach that creates a problem and then seeks a solution to
it. There is urgent need for a more proactive approach that seeks to avoid the problem of waste
generation in the first place. The tenant companies of the economic zone are at different levels of
environmental stewardship. There are a few front runners that are already embracing IS while a
great majority of the zone enterprises are yet to embrace IS, leave alone resource use efficiency
and cleaner production. Ideally, the economic zone enterprises should be actively engaged in on-
site activities that seek to minimize waste generation at source through avoided leakages, spillages
and over flows. These waste streams are the pollutants that lower the quality of the surrounding
environment. The economic zone should strive to make the maximum use of its by-products as a
way of reducing the need for virgin materials; close material loops through recycling; de-
materialize its products and economic activities by reducing the mass of material required for
production; and de-carbonization of its energy supply by progressively shifting to greater energy
efficiency and sources of energy that are richer in hydrogen and poorer in carbon (UNEP, 2015).
By strictly analyzing material and energy flows, it is possible to identify waste and by-product
synergies that can be actualized.
The Zone Authority should work towards establishing a zone wide environmental policy that
should give a sense of direction as to the zone should minimize its waste at source and exchange
the residual wastes through synergies. Some of the key issues that the zone wide environmental
policy should address include: (i) the zone’s vision with regard to environmental sustainability,
(ii) the zone’s willingness to adhere to the principles of continual improvement and pollution
prevention, (iii) a willingness to comply with the threshold requirements of environmental laws,
standards and regulations, and (iv) the desire to maintain an open and interactive communication

36
with all key stakeholders and interested parties (UNEP, 2015). At the moment, there is no such
zone wide policy at the Athi River SEZ. It should be clearly understood that good environmental
practices will benefit both the tenant companies and the economic zone as well. An environmental
program powered by resource use efficiency and cleaner production (RECP) and industrial
symbiosis (IS) will enable tenant companies to locate wastage and inefficiencies in their operations
and have them fixed at process level. Subscription to good environmental practices enhances the
image of the economic zone and by extension that of the tenant companies. Doing this will make
the economic zone more attractive to prospective investors and the value of setting base within the
economic zone increases.
According to UNEP, the fact that the economic zone demonstrates reasonable and responsible care
by giving priority to prevention over remediation, helps to improve relations with Government and
the surrounding communities (UNEP, 2015). The economic zone together with its tenant
companies should be perceived to be willing to go beyond mere compliance with environmental
regulations. The best way of assuring this is to promote the use of cluster based voluntary codes
of practice that are promoted by business associations within the sector-wise clusters of the
economic zone. Such voluntary codes of practice should be anchored on the principles of RECP,
the 3Rs (reduce, reuse, recycle), and industrial symbiosis (IS). Voluntary green rating schemes can
also be promoted as a way of encouraging tenant companies to meet and even exceed the set
environmental standards. The Zone Authority can help to develop common training programs for
the economic zone tenant companies. The aim of such training programs will be to improve the
general awareness of all staff on RECP, the 3Rs, and IS; create specialized green skills needed to
promote the Zone’s green growth agenda; and promotion of general techno-managerial skills. The

37
Zone Authority should constantly monitor the environmental parameters of the economic zone in
form of ambient environmental quality; emissions to water and air; solid waste generation, storage
of goods and wastes on-site; accidental spillages, and procedures for emergency preparedness and
response.
Data derived from this monitoring program exercise should be stored in a data base. This data
should be routinely analyzed and trended so as to inform good decision making. It will therefore
be the duty of the Zone Authority to aggressively promote RECP, the 3Rs, and IS within the zone’s
tenant companies. Investing in RECP has an assured pay back for the tenant companies. Good
knowledge of material flows within the production lines is a mandatory requirement for process
optimization and industrial symbiosis. The Zone Authority should accurately map out material and
energy flows of all companies operating within the zone. Data accruing from this mapping exercise
should be entered into a data base managed by the Zone Authority through an established
information clearing house. When wastes and by-products are produced within the economic zone,
this information should be relayed to a zone wide information platform that should ideally connect
all the tenant companies of the zone. With the help of a waste exchange clearing house, it can be
possible to match those who generate wastes with those who need those wastes as feed stock raw
material input. This matching of the “haves” and “wants” will facilitate negotiated payments for
wastes and by-products that could otherwise have been landfilled. A data base of generated wastes
and by-products will help develop synergies for waste and by-product exchange through industrial
symbiosis opportunity workshops. UNIDO states that there are three elements that affect the stable
operation of an industrial symbiosis system: (i) communal facilities that support the development
of enterprises within the economic zone, such as an information centre, a technological centre, an

38
environmental centre, good road network, a solid waste disposal and recovery site and an energy
centre; (ii) relational networks of industrial symbiosis; and (iii) a supportive service which contains
the factors that will affect and regulate enterprises within parks in terms of policy, the regulatory
regime, park administrators, laws and financing priorities (UNIDO, 2016).
Introduction of industrial symbiosis (IS) at the Athi River SEZ should follow a step wise approach.
The initial step should be an exploration of potential networks, to be followed with a feasibility
study before final commercialization of the IS with the active participation of the private sector
(UNIDO, 2016). Potential IS networks should be identified using a bottom up approach. This will
entail company in-put/ output data collection for purposes of exploring the existence of new
synergy networks. This production data from companies will be reviewed with the sole aim of
determining possible waste and by-product exchanges. Tenant companies with potential for waste
and by-product exchange will be encouraged by the Zone Authority to participate in the IS network
through waste exchange opportunity network seminars and business meetings. For IS to become a
cultural practice within the economic zone, there is need for continuous collection of on-site
information from zone tenant companies through various forums so that synergy building becomes
a continuous exercise that is constantly being refined and improved upon.
The Zone Authority with the help of the Government should then proceed and fund the feasibility
studies of the most promising IS synergy networks. Best feasibility results will be derived from
team effort with contributions from multi-disciplinary teams. Promising IS proposals should then
be developed further into bankable business models with stakeholder input. These proposals
should be piloted first within the economic zone so as to be able to establish the best approaches

39
of full scale roll out. The piloting exercise should be strictly monitored so that meaningful feedback
is derived to inform future implementation road map. Ideally, the business model should be co-
authored with stakeholders as a way of trying to cement their buy-in. Commercialization of the
technically and financially feasible business models will have to overcome a wide range of barriers
that will include financial, technical and attitudinal. There is need for detailed negotiations that
seek to protect the interests of all players, those who generate wastes and those who receive the
wastes for use. In fact trust is the foundation of any successful synergy building network. The
financial barrier will be overcome by seeking to tap into the emerging green funds at national,
bilateral and international levels. Technical barriers will largely be attributed to lack of cleaner and
environmentally sound technologies that can be transferred into the country if there is an enabling
technology transfer infrastructure and policy that assures value for the investments. Attitudinal
barriers will be overcome through training and retraining, awareness raising and organization of
study tours to places where IS has worked successfully to demonstrate its environmental and
economic benefits.
Firms that will enter this IS network should know that they can compete and cooperate at the same
time within the expansive network. There must be a constant flow of waste and by-products in a
reliable manner. This underscores the need for up to date waste recovery and recycling
infrastructure. When these waste materials are produced constantly and reliably, the transaction
costs will generally come down. It will be important for this synergy seeking approach to build on
those networks that have developed organically or spontaneously on their own due to the
prevailing forces of supply and demand. This underscores the fact that for IS to succeed, it must
make good business sense and should also be used to create additional efficiencies in terms of

40
lowering the operational cost of doing business. A successful IS network entails a multi connected
waste recovery system; a robust training program on waste and by-product exchange as well as
the related synergy building; an infrastructure for waste and by-product recovery and re use; a
system for managing the network and its players; a community liaison and outreach office for
managing joint projects with the surrounding community; and a vibrant triple helix collaboration
for eco-innovation (World Bank, 2014). The main aim is to create a system of recovering and
trading by-products and wastes among zone companies. The noble intention is to divert wastes
from the landfill, lower production costs, generate extra revenue from the waste streams, create
more decent green jobs, reduce pollution levels, lower disposal costs, and reduce pressure on the
use of virgin raw materials (Kechichian & Jeong, 2016).
This in essence seeks to connect individual firms into industrial ecosystems by closing loops
through waste and by-product reuse and recycling; maximizing efficiency of materials and energy
use; minimizing waste generation at source; and defining all wastes as potential products and
seeking markets for them (UNIDO, 2016). It is important to determine which waste streams are
already being re-used and recycled on-site and which ones need to be further recovered and
diverted from the landfill. The resources that no company is currently using within the economic
zone should be identified and appropriate technologies and business models developed to put these
resources back to economic use through manufacturing value addition. This will extend the value
of the recovered wastes along the production supply chain. There is need for proper planning and
analysis if the art of waste and by-product exchange networks has to be expanded within the
economic zone. According to UNIDO, this should entail characterizing energy, water, and material
flows so as to highlight and map existing and promising exchanges of by-products; providing

41
training, tools, and support for the development process, data gathering and analysis; gathering
further data on resource flows of companies that have committed to the by-product exchange;
identifying companies which could process selected materials, provide collection services for
specific by-products, or otherwise support the operation of the by-product exchange; identifying
for fixing potential barriers in regulations, business practices, and environmental management; and
developing a strategic plan for expanding from a by-product exchange to a full scale eco-industrial
network (UNIDO, 2016).
The four clusters at the Athi River SEZ have just self-organized as a result of the prevailing market
forces of supply and demand. A comprehensive materials flow investigative study is required for
the economic zone so that an up to date inventory of wastes and materials is developed. It will also
be important to establish waste and by-product exchanges that are spontaneously on-going and
those that are currently being discarded into the economic zone but could be otherwise be
exchanged and the burden this business as usual practice is having on common infrastructure in
form of landfills and centralized effluent treatment plants. The goal should be to help establish
innovative new businesses that turn waste and by-product streams into feed stocks inputs for other
companies. Sustainable waste and by-product exchange should only come after the participating
companies have already adopted other environmental management strategies like waste reduction
at source, pollution prevention and energy efficiency. It is critically important to assure the synergy
participating companies that their trade secrets will not be revealed to third parties. This
underscores the need to code the data as a way of preventing unauthorized disclosures.

42
On-site investigations revealed that at times, there is need for pre-processing of discarded wastes
before they are made ready for use by other production lines. The off cuts from plastic tarpaulins
manufacture will need to be palletized before being used for plastic water tanks and chairs. This
initiative can best be promoted through incubation. Adoption of an incubation framework to fill
this gap within the economic zone will enable it not only create more green jobs but also fulfill the
wider goal of embracing a closed loop system, that relies on optimized reuse and recycling of
wastes and by-products. Once company managers are made aware of the opportunities to cut costs
and possibly gain new income through exchange of by-products, they may start negotiating with
potential trading partners without need for any encouragement (UNIDO, 2016). However, lessons
learnt from Europe and Asia justify the need for waste exchange opportunity seminars, a privately
owned by-product exchange website, and newsletters may be required to open up a more active
network of interactive exchanges. There is also need to construct within the economic zone
infrastructure in form of conveyor systems and bulk storage facilities to facilitate a smooth
exchange. The developed world has developed software to help facilitate waste and by-product
exchange synergies. By matching residual by-products from zone businesses with a generic data
base, the software can be used to determine potential synergies. This software is yet to be tested at
the Athi River SEZ. The ultimate goal is to close the energy and material flow cycles, engage multi
stage energy cascading and waste minimization at source, enable waste and by-product exchange
through industrial symbiosis for improved productivity, resource use efficiency and
competitiveness. At the Athi River SEZ, most tenant companies operate as silos with no formalized
communication among them. The economic zone also lacks a platform through which economic
zone tenant companies can meet and deliberate on issues of mutual interest such as resource use
efficiency, cleaner production and waste and by-products exchange through industrial symbiosis.

43
Kenya’s efforts of promoting green growth is at its infancy. As such, there is no policy that
currently prioritizes the promotion of industrial symbiosis in the country. For policy makers,
industrial symbiosis presents an opportunity to value add on waste streams for improved
profitability while at the same time expanding the waste and by-product exchange networks
beyond the boundaries of the firm to incorporate external clusters (OECD, 2010).
Industrial ecosystems also tend to evolve over time. According to Graedel and Allenby 1995, Type
I industrial ecosystems are the typical industrial processes of today, linear systems with little or no
recovery of materials from the waste stream. Type II are emerging industrial ecosystems that
include reuse and recycling in their processes but also require significant primary material inputs
for their functioning. Closed loop Type III industrial ecosystems with full materials recovery do
not exist in Kenya at the moment, partly because of a lack of appropriate technologies and partly
because of limited awareness of such possibilities. According to Chertow, 2007, a planned EIP
model entails a conscious effort of identifying potential companies from different industrial sectors
and locating them together so that they can exchange wastes and by-products as well as share
common utility infrastructure (Chertow, 2007; Nardin, 2012). A self-organizing EIP model is one
where an intricate industrial ecosystem spontaneously emerges from decisions of the private sector
actors that are motivated by a strong desire to cut down on operational costs, increase the
company’s revenue base, and expand the businesses’ product range (Chertow, 2007; Meneghetti
and Nardin, 2012). This spontaneous evolution is what is already happening at the Athi River
Special Economic Zone (SEZ). However, the Zone’s accelerated uptake of industrial symbiosis
will be determined by the quality of waste recovery and recycling infrastructure as well as the
existence of an enabling and supportive policy framework.

44
In an ideal system, both renewable and non-renewable materials would be utilized in a closed loop
to minimize the input of virgin resources (Kibert et al. 2002). The Athi River SEZ does not have
any functional management information system (MIS) to help accelerate Zone Company
networking. Zone wide meetings on matters of mutual interest such as waste management were
not common. There should be a management information system (MIS) to facilitate information
and knowledge transfer between and among network partners. This justifies the need for a waste
matching software that will enable companies to know who can use their wastes and by-products
and from whom can they get wastes and by-products for use as raw material inputs. The success
of an industrial symbiosis network relies on active participation of its members and their
commitment to continual improvement.
Traditional EPZs are exclusively export oriented; depend heavily on fiscal incentives; have limited
linkages with the local market; focus on labor intensive industries with little value addition; focus
on production and assembly and have primarily foreign investors (EPZ Program Annual
Performance Report, 2013). On the other hand, SEZs are a broad concept that includes Free Trade
Zones, informational Technology (IT) Parks, Free Ports, Foreign Trade Zones and allow for sales
both in the local and foreign markets (Farole, 2011). The Governance structure of the country’s
SEZs is too centralized to be effective in delivering effective technical advisory support to all its
gazetted zones across the country. According to Benyus, 1997, engineers and environmentalists
can learn from Nature’s design parameters as it runs only on sunlight; uses only the energy it needs;
fits its form to function; recycles everything; rewards co-operations; banks on diversity; demands
local expertise; curbs excesses from within; and taps into the power of limits. The cardinal

45
requirements for industrial symbiosis are collaboration and the synergistic possibilities offered by
geographic proximity” (Chertow, 2000). In a typical industrial symbiosis network, there are
normally three types of symbiotic transactions that manifest, (i) utilizing waste derived from the
activities of another plant as a raw material input; (ii) sharing common utility infrastructure; and
(iii) partnering on issues of mutual interest such as emergency preparedness and response; training
and capacity building, and promotion of integrated sustainability planning of economic zones
(Chertow et al., 2008).
A linear production system is illustrated in the Figure 1 below.
80% Products
Natural Resources 20% Waste
Figure 1: Linear Production System
Unit Operation
A
1°

46
A transition to a circular economy is illustrated in Figure 2 below.
20% Waste
80% Products
20% Waste
80% Natural Resources
20% Waste
80% Products
80% Natural Resources
20% Waste
Source: International Synergies Limited, 2013: National Industrial Symbiosis Program (NISP) of
the UK
Figure 2: Circular Economy
The Kenyan Government ascended to its Special Economic Zone (SEZ) Act No. 16 of 2015 on
September 11, 2015. This Act came into force on December 15, 2015. Although the SEZ Act
together with the draft SEZ policy do not put priority on the need to transform our current SEZs
into those that emit less emissions, utilize resources much more efficiently and make them more
Unit Operation B 2°
Unit Operation C
3°

47
resistant to the vagaries of a changing climate regime, this research project seeks to establish how
this transition can be fruitfully realized. The ultimate goal is to help build a roadmap that can
enable the country’s current SEZs transform into green zones through the adoption of resource use
efficiency, cleaner production and industrial symbiosis (UNIDO, 2015).
2.5 Emerging Industrial Ecology Models of the World
Europe’s development is promoted by a resource efficiency initiative that is anchored within a
roadmap for a resource efficient Europe. The flagship initiative compels member states to
prioritize resource efficiency gains through industrial symbiosis (Laybourn and Lombardi, 2012).
Kenya is yet to develop its own industrial symbiosis flagship initiative based on a solid roadmap.
The continent’s keen interest in promoting industrial symbiosis is informed by the remarkable
success of the UK’s National Industrial Symbiosis Program (NISP) (Laybourn and Lombardi,
2012). Likewise, Kenya with the help of the East African Community (EAC) should set up
demonstrations that aim to show that investing in industrial symbiosis enhances the productivity
and competitiveness of participating companies. Europe’s 2020 Agenda prioritizes development
trajectories that are smart, sustainable, and socially inclusive (SCU, 2013). Adoption of a circular
economy will make European economies competitive, inclusive in terms of green job creation and
offer a high standard of living with a comparatively much lower carbon footprint (EC, 2011).
Within the framework of the country’s GESIP, Kenya should develop a green vision for its
sustainable development agenda powered by resource use efficiency and industrial symbiosis.
The ultimate aim is to treat waste as a resource and be constantly be looking for innovative ways
of minimizing its generation at source and engaging in waste recovery and reuse for the inevitable
waste streams that cannot be minimized at source (EC, 2011). Recycling in all its forms diverts

48
waste from the land fill and contributes to more efficient use of resources (EEA, 2011). The
ultimate goal is to decouple economic growth from increased resource use, support innovative
ways of advancing development that is associated with lower greenhouse gas emissions, expand
the use of renewable energy solutions, modernize the transport sector by making it efficient and
effective, and promote energy efficiency in both manufacturing and service sectors of the economy
(EC, 2011; OECD, 2012; SCU, 2013).
Just as is happening in Europe, Kenya’s virgin resource availability constraints and accompanying
environmental pressures should accelerate the country’s transformation from a linear extraction-
use-and-throw-away economic model of production and consumption to a closed loop supply
chain (EC Decision, 2014). The country’s ultimate goal should also be to create a smart economy
that seeks to minimize the production of waste and reuses wastes as a resource in other production
lines (EC Decision, 2014). This is happening at a time when the marketing proposition of SEZs
has shifted from a mere provision of shared infrastructure to one that is driven by the need to make
SEZs generate less greenhouse gas emissions, make optimal and efficient use of resources, and
implement climate resilient innovative actions (World Bank, 2014).
Through a combination of cheap labor and the construction of well managed special economic
zones (SEZs)/ industrial parks (IPs), China became the industrial park of the world
(UNDP&IPRCC, 2015). Although this rapid industrialization process created jobs and helped lift
millions of people above the poverty line, it came at a huge environmental cost that is proving to
be difficult and expensive to restore. The Chinese Government responded to this development
environmental challenge by adopting the circular economy approach powered by resource efficient
cleaner production, the 3Rs of reducing, reusing and recycling waste as well as waste and by-

49
product exchange through industrial symbiosis. The adoption of SEZs/ IPs for industrialization is
gathering momentum in Kenya and it will be important that Kenya learns from the Chinese
experience so that it adopts a proactive approach rather than a reactive one.
To tackle this problem, policy makers in China have chosen to embrace the circular economy (CE)
as their official policy for promoting sustainable development (Geng et al. 2012). Consequently,
the country has enacted enabling national laws and regulations to facilitate the successful
implementation of its circular economy and also initiated circular economy demonstration projects
that aim to demonstrate the economic and environmental benefits of a circular economy (SCU,
2013). Kenya should similarly develop appropriate laws, regulations, and incentives that can help
facilitate a speedy implementation of its emerging circular economy. Demonstrations will be key
in securing investor buy-in. As of 2006, the country had established 16 national pilot EIPs. The
country also embraces the concept of industrial clusters that seek to promote resource efficiency,
environmental performance and economic competitiveness (Lei, 2006). Since the early part of this
century, China has been a global leader in the development of national eco-industrial park (EIP)
networks. This great achievement includes the establishment of 15 national demonstration projects
and an additional 45 trials that actively involve hundreds of researchers and professionals operating
in the green growth development space for purposes of promoting eco-innovation (Shi et al. 2012).
In order to generate credible information on the status of circular economy (CE) implementation,
China became the first country in the world to publish nationally focused CE indicators (Geng et
al. 2012).
Likewise, Kenya should develop indicators that will help it monitor accurately the progress it
makes in promoting its green growth agenda. These indicators have so far attracted interest from

50
both developed and developing countries that are seeking to promote and regulate sustainable
development measures within their green growth and circular economy endeavors (SCU, 2013).
The country’s current indicator system is voluntary and its promotion is hinged on individual
company benefit of subscribing to the ideals of a circular economy (Geng et al. 2012). The Circular
Economy Promotion Law passed in China in 2008 is a classic example of resource efficient and
cleaner production (RECP) policy in action (UNEP, 2015). It puts emphasis on the most efficient
use of resources and promotes reduction, reuse and recycling (UNEP, 2015). Kenya should
similarly develop enabling laws for its emerging circular economy.
The Japanese eco-towns project seeks to achieve a low carbon and zero-emissions society as a way
of domesticating the ideals of sustainable production and consumption (UNEP, 2011; SCU, 2013).
The project advocates for a zero-emissions approach to industrial development in which
participating companies and industries were required to keep the amounts of wastes associated
with their operations to the greatest practical minimum, and establish systems for recovering and
recycling wastes, in partnership with other industries thereby setting up a sound materials recycling
society (SCU, 2013). Kenya should also adopt the eco-towns initiative as a way of trying to tackle
its worsening urban waste management problems. Establishment of a link between the SEZ and
the surrounding urban centres will help create a win-win framework as regards waste recovery for
recycling.
The model prioritizes interventions at national, local government, business, and citizenry levels
through improved governance, education and awareness, as well as technology development and
demonstration (UNEP, 2011). Strict enforcement of these laws in Japan have not only promoted
waste diversion from the landfill but also led to the mushrooming of 3R based value addition spin

51
off companies. The Kenyan laws and regulations are not comprehensive enough to fully address
the emerging challenges of dealing with a waste stream whose composition keeps on changing. It
can be observed that Japan’s ability to understand fully how materials flow in its economy has
been central to its ability to advance the ideals of a sound materials cycle society (SCU, 2011). On
the contrary, Kenya does not have a thorough understanding of material flows within its economy.
Mapping and inventorization of materials within SEZs will help develop a data base that could be
relied upon while building synergies for waste and by-product exchange. This is an exercise that
can be promoted by the zone authority. The Asian Development Bank (ADB) Green City’s
publication lists important eco-towns features as being (i) legislation that encourages a material-
recycling society, (ii) cooperation between national and local governments in bringing clusters of
industry to the site, (iii) product research and development, (iv) large and rapidly expanding eco-
business market, both domestically and internationally, (v) a heavy focus on environmental
technologies and innovative solutions in addressing environmental challenges, and (vi) a focus on
energy conservation, material development, and integrated waste management10. Kenya will need
to adopt these features if it has to successfully embrace its own eco-towns initiative.
South Korea has a national plan for eco-industrial Park (EIP) development (Kim, 2006). This
national plan is being jointly implemented by the Korean National Cleaner Production Center with
the assistance of Ministry of Commerce, Industries and Resources (Kim, 2006). Similarly, a
national EIP promotion plan for Kenya should be developed and jointly promoted by the Ministry
of Industry, Investment, and cooperatives in collaboration with the Kenya Industrial Research and
10 ADB, 2012. Green Cities

52
Development Institute (KIRDI) and its host the Kenya National Cleaner Production Center
(KNCPC). The South Korean plan was rolled out through demonstration projects, that sought to
convert all conventional industrial parks into EIPs; use of the triple helix collaboration to promote
eco-innovation; development of accurate baseline information on raw material inputs and outputs;
and dissemination of best practice lessons derived from pilot studies (KIM, 2006). This enabled
them to develop their home grown EIP with the aim of maximizing material and energy re-use
within the park and seeking to achieve a zero-emissions EIP (Kim, 2006). The Kenyan Ministry
of Industry should similarly seek to convert its existing SEZs/ IPs into EIPs starting with research
based pilots before upscaling to cover the entire country.
Professor Kim of Pusan University proposed to establish a Centre in the industrial park (IP) to be
analyzing energy, by-product, and water flow networks through a process diagram and
management technique, with the goal of making the Pusan industrial park an eco-industrial park,
and eventually convert it into a symbiocity (Kim, 2006). Similarly, Kenya should establish a one-
stop-shop at KIRDI to serve as a Knowledge Repository and Advisory Service Facility to guide
the country’s SEZs and IPs enterprises in their green growth transition and also promote eco-
innovation based on demand driven research. In order to realize a “low-carbon, zero-waste
society”, the South Korean Government developed a comprehensive waste management strategy
that emphasized the switching to a material recycling social structure, the realization of waste
upcycling, the creation of a unified waste processing infrastructure, and the promotion of a
resource circulation industry and technological development (PCGG, 2014). Kenya is yet to
develop landfill management rules that are designed to encourage waste exchange for recycling so
that useful materials are diverted from the landfill.

53
In South Africa, industrial symbiosis is at its infancy but with very promising prospects. The
Western Cape Industrial Symbiosis Program (WISP) follows the methodological approach
developed, tested and perfected by the International Synergies Limited (ISL) of the United
Kingdom (WCG, 2013; Laybourn & Morrissey, 2009). The Kenyan Government through its
Ministry of Industry, Trade and Cooperatives should similarly follow suit and initiate a nation-
wide industrial symbiosis program for the country, starting with the piloting phase that will help
inform the actual roll out and upscaling. The initiative is one of the leading green economy
initiatives of the Western Cape Government (WCP) that is fully funded by the South African
Department of Economic Development and Tourism (SADED, 2011). The WCG is motivated by
a strong desire of seeking to become the greatest green economy hub not only in South Africa but
also across the whole African continent (SADED, 2011; WCG, 2013). All these noble intentions
are contained in the Province’s Green Economy Strategic Framework and Implementation plan of
2013. The implementation roll out of Kenya’s Green Economy Strategy and Implementation Plan
(GESIP) of 2015 should adopt the same national approach and be supported jointly by the Kenyan
Ministries of Environment and Trade. Promoting green growth in Kenya will have to start from
scratch due to the country’s inadequate infrastructure for waste recovery and recycling. This
scenario will be compounded further by the limited awareness and appreciation of the Kenyan
population about the importance of living in a clean and safe environment that happens to be also
their constitutional right (Kenya Constitution, 2010). In the Kenyan context, the Green Economy
is proudly seen as a sustainable approach to the delivery of an equitable society that caters for the
needs and aspirations of everyone including the marginalized groups (GOK, 2015). It makes a lot
of sense for Kenya to also aggressively work towards diverting useful materials from the landfill
through waste exchange and recycling. The wisdom is that industrial establishments that engage

54
in industrial symbiosis should first embrace resource use efficiency through cleaner production so
that the inevitable residual waste that remains is what is subjected to industrial symbiosis (UNEP,
2015). The United National Environment Program (UNEP) defines a Green Economy as one that
is low-carbon, resource efficient and socially inclusive in terms of the creation of green collar jobs
(UNEP, 2011; World Bank, 2014).
Ideally, SEZs/ IPs do provide a fertile ground for new innovations/ demonstrations that can
successfully be carried out in partnership with knowledge institutions for enhanced economic
prosperity, social inclusion and improved environmental stewardship (World Bank, 2014). In these
circumstances, SEZs/ IPs are important in providing a conducive environment for experimenting
and testing how eco-innovation can promote the country’s sustainable development agenda
(UNEP, 2011). SEZs/ IPs should be able to develop sustainable development action plans that can
enable them to lower their overall carbon footprint through improved energy efficiency, water use
efficiency and harvesting, waste minimization and management as well as the adoption of
renewable energy solutions (World Bank, 2014; UNIDO, 2015). The planning, design and
construction of SEZs/ IPs should be guided by green master plans that have incorporated all the
relevant elements of sustainability (UNEP, 2011). Some of the notable and promising interventions
for GHG reduction include the upgrading of the economic zone’s energy efficiency, adhering to
building codes that support the design and construction of green buildings, and the construction of
infrastructure for waste recovery and recycling (UNEP, 2011).
2.6 Types of Special Economic Zones (SEZs)
SEZs/ IPs are defined as geographically delimited areas that are centrally administered by a single
authority (in the Kenyan case the EPZA) and offers duty-free importing and streamlined custom

55
procedures to businesses that physically locate and operate within the economic zone (Akinci &
Crittle, 2008; World Bank, 2008). The World Bank identifies 6 categories of special economic
zones (SEZs) that cover different geographical configurations and functions as shown in Table 2
(World Bank 1992; World Bank, 2008).
Table 2: Taxonomy of Zone Types (World Bank, 2008)
Type of Zone Physical Configuration Description
Free trade zone
(FTZ) /
commercial free
zones
Size normally less than 50
hectares (Size < 50 Hectares)
Fenced-in units, duty-free areas, offering
warehousing, storage, and distribution
facilities infrastructure for trade,
transshipment, and re-export operations.
Traditional
Export
Processing Zones
Size < 100 Hectares; total area
is designated as an EPZ
Industrial estates aimed primarily at
foreign markets. Hybrid EPZs are
typically sub-divided into a general zone
open to all industries and a separate EPZ
area reserved for export-oriented, EPZ-
registered enterprises.
Enterprise Zones Size < 50 Hectares Intended to revitalize distressed urban or
rural areas through the provision of tax
incentives and financial grants.
Free Ports Size >100 km2 Typically encompass much larger areas.
They accommodate all types of
activities, including tourism and retail
sales, permit on-site residence, and
provide a broader set of incentives and
benefits.
Single factory
EPZ
Designation for individual
enterprises
Provide incentives to individual
enterprises regardless of location;
factories do not have to locate within a
designated zone to receive incentives and
privileges.
Specialized
Zones
Size < 100 Hectares Include science/technology parks,
petrochemical zones, logistics parks,
airport-based zones, etc.
The Kenyan Government is working hard to create an enabling environment to accelerate
industrial development through the establishment of industrial parks/ special economic zones

56
along its major infrastructural corridors11 (Figure 3). As shown on the map, the Kenyan
Government plans to set up eight industrial parks along the Standard Gauge Railway (SGR) and
two along the Lamu Port/ South Sudan/ Ethiopia Transport Corridor Program (LAPSSET). The
aim is to build a network of competitive industrial parks/ zones with sector appropriate incentives
and supporting infrastructure12. Creation of green industry within the planned industrial parks is
not only a key priority of the Government but also the right thing to do. The Ministry of Industry,
Investment and Trade seeks to drive a sustainable industrial development process that emits less
emissions, utilizes resources much more efficiently and is socially inclusive through the creation
of decent green jobs12.
11 Government of Kenya (GOK), 2015. Kenya’s Industrial Transformation Framework, Ministry of Industry, Investment and Trade.

57
Figure 3: Potential Industrial Parks/ Special Economic Zones (SEZs)

58
2.7 Framework for Low-Carbon Green Zones
The framework for low-carbon green zones comprises of five core components that entail the
setting of GHG mitigation targets, provision of sustainable infrastructure, promotion of climate
friendly investments, development of low-carbon policy incentives and regulations, as well as
making arrangements to tap into the opportunities presented by carbon finance (World Bank, 2011;
UNIDO, 2015). The World Bank recommends that all the economic activities of tenant companies
of the economic zone have to be governed by concrete mitigation action plans (World Bank, 2011).
Green strategies should be developed by the Zone Authority to guide tenant companies in
establishing realistic low-carbon goals and committing themselves to set GHG reduction targets
(World Bank, 2011). The starting point will be to develop a GHG emission baseline for the zone
using known GHG accounting rules and inventory development systems, that will make it possible
for the management to monitor progress and also establish which sector generates which amount
of emissions so as to be in a position of setting up realistic improvement targets for each of the
functional sectors operating within the economic zone (World Bank, 2011; UNEP, 2011). Some
of the opportunities for GHG emissions mitigation within an economic zone setting will include
making investments in the use of renewable energy, aggressively promoting energy efficiency and
conservation, adoption of green building codes, embracing sustainable and rapid transportation
system, promoting water reuse, recycling, and harvesting (World Bank, 2011). Although material,
waste and water recycling can be promoted at individual company level, its widespread adoption
across the entire economic zone is recommended as it maximizes overall benefits (World Bank,
2011).

59
Economic zones in Kenya are licensed and regulated by the Export Processing Zones Authority
(EPZA). The Kenyan EPZA as is currently constituted does not have the capacity to promote green
growth activities among all the tenant companies of the program country wide. In order to
strengthen the zone authority’s capability to promote green growth investments, this research
project recommends the establishment of a “Green Growth Advisory Centre” to be hosted at
KIRDI and work closely with the EPZA’s “Green Cell” in advancing the country’s green growth
agenda. Within this “Green Growth Advisory Centre” support, tenant companies, local
universities, and research institutes will collaborate with the sole purpose of developing,
transferring, and deploying clean technologies and technical advisory through a functional public-
private-partnership (PPP) model (World Bank, 2011; UNIDO, 2015).
Such a Green Growth Advisory Centre will become a centre of excellence for promoting
innovation, knowledge and techno-managerial skills sharing and training for local companies and
consulting institutions in emerging tools of environmental management (World Bank, 2011;
UNEP, 2011). According to the World Bank, sustainable infrastructure for a SEZ/ IPs means
planning, designing, and building the entire economic zone using systems that are energy efficient,
resource conserving, and low emission generation methods that provide ample opportunities to
reduce the zone’s overall carbon footprint (World Bank, 2011). Incorporation of energy saving
measures within buildings at the design and planning stage inform of using natural ventilation and
efficient lighting will sustainably reduce emissions (World Bank, 2011; UNIDO, 2015).

60
2.8 Low-Carbon Green Special Economic Zones
The climate change agenda has emerged as the greatest development challenge of our time
signaling the need for countries not to continue with their business-as-usual development activities
that are characterized with high consumption of fossil fuels and instead embrace a green growth
development pathway that will help reduce the negative impacts (World Bank, 2011; UNEP,
2011). To developing countries such as Kenya, development and climate change are two inter-
twined challenges that the country cannot afford to sacrifice (World Bank, 2011). The challenge
is that these developing countries have to work hard and push 1.4 billion people out of poverty by
building green factories, low-emission plants, climate proof roads, green buildings, and
environmentally friendly transport systems using technologies that are currently not in their
possession (World Bank, 2011). This underscores the need for the strengthening of the country’s
technology transfer infrastructure. Kenya as a country should work hard to promote sustainability,
significantly reduce its carbon footprint while aspiring to develop and create the much needed job
openings (World Bank, 2011).
This new development trajectory should be designed with the sole purpose of seeking to decouple
the country’s economic growth from further increases in GHG emissions and massive
consumption of resources in a typical “making more from less scenario” (World Bank, 2011;
UNEP, 2011). By leveraging on clean and environmentally friendly technologies, this
development pathway will create green jobs and generally improve livelihoods (World Bank,
2011). The shift to a low-carbon, green economy should be carefully executed so as not to sacrifice
the country’s economic growth and competitiveness (World Bank, 2011; UNEP, 2011). Due to the
realization that SEZs/ IPs concentrate pollution, Governments, developers, planners, and
regulators around the world are increasingly demanding that SEZs/ IPs are made to promote

61
environmental sustainability by innovatively seeking to improve energy and material use
efficiencies and recoveries (World Bank, 2011). Asian economic giants China and India have
already developed functional policies and guidelines for the green design and construction of green
SEZs/ IPs while South Korea has gone ahead to focus on the systematic development of eco-
industrial parks (EIPs) (World Bank, 2011). This simplifies matters for Kenya that simply needs
to domesticate the already developed Asian policies and guidelines to fit its own local
circumstances. It is worth noting that the more than 3,000 SEZs across the world present one of
the best opportunities for tackling climate change by seeking to reduce GHG emissions in a
systematic and easily verifiable manner (World Bank, 2011; UNIDO, 2015).
2.9 Spectrum of Environmentally Sustainable Zones
Due to increased stakeholder environmental awareness and the need to promote environmental
sustainability within SEZs/ IPs as a way of helping to mitigate the climate change challenges, there
has been mounting pressure on SEZs/ IPs to design and construct environmentally friendly SEZs/
IPs across the country (World Bank, 2011; UNEP, 2011). Shared vision action plans should be put
in place in form of a road map to ensure that the SEZs/ IPs are enabled to graduate from just being
pollution control zones to eco-industrial parks (EIPs) and then eventually being low-carbon and
green SEZs/ IPs (World Bank, 2014). The pollution control zone level is the most basic of them
all and focuses largely on the implementation of effective measures for pollution control and
environmental compliance in form of a centralized waste water treatment system, air pollution
control, toxic and hazardous waste collection and disposal, and environmental training programs
for zone managers, company operators, and administrators (World Bank, 2014). This is the
operational level where the Athi River SEZ is. The pollution control approach is largely reactive
in the sense that it responds to already generated waste that makes it expensive and unsustainable

62
in the long-run. A more pro-active approach is recommended so that attempts are made to
minimize waste generation at source before dealing with the inevitable residual waste stream
whose composition, volume, and characteristics will have been drastically altered hence making it
easy and cost-effective to handle and manage (UNIDO, 2011).
The next level is that of eco-industrial parks that goes beyond simple environmental management
to minimize waste generation at source through RECP for the sole purpose of reducing the overall
negative impact of the entire zone’s pollution levels on the surroundings, before integrating the
3Rs and waste and by-product exchange (World Bank, 2014). Ideally eco-industrial parks are
expected to recover, reuse, and recycle wastes and resources within individual companies and also
within the wider cluster networks for the sole purpose of ensuring continuous re-circulation of
wastes and by-products (World Bank, 2011; UNEP, 2011). The establishment of synergies
networks between and among participating tenant companies on a mutual benefit basis is the
cornerstone of a successful industrial symbiosis engagement exercise (World Bank, 2011; UNEP,
2011).
Low-carbon and green SEZs/ IPs are the most comprehensive and sophisticated in terms of
embracing the key elements of environmental sustainability (World Bank, 2011; GEC, 2012;
ADB, 2012). In general terms, low-carbon, green SEZs are defined as those that are designed,
developed, and operated in a low-carbon, green and sustainable fashion while seeking to reduce
the zone’s overall carbon footprint as a way of helping to mitigate against the challenges posed by
a changing climate regime (World Bank, 2011; ADB, 2012).

63
2.10 Enabling Policy and Institutional Framework for a LCZ
The government should introduce a mix of policy instruments that include fiscal incentives and
mandates that provide the signals for change (World Bank, 2014; UNIDO, 2015). At the same
time, the government should develop good practice guidelines for zone enterprises and establish
or strengthen institutions to promote and facilitate the implementation of projects and monitor
results (World Bank, 2014; UNIDO, 2015). The goal for government policy making should be to
develop a comprehensive policy framework that is conducive to low-carbon investment (Falcke,
1999; World Bank, 2014). This overall policy framework should include regulations that facilitate
the admission, treatment, settlement, and support for foreign investment in low-carbon areas, as
well as sector-specific low-carbon related regulations that benefit industries both inside and
outside the zones (World Bank, 2014; UNIDO, 2015). Successful development of LCZs requires
strong market drivers for low-carbon products, services and technologies in the industrial sector
(World Bank, 2014; UNIDO, 2015). Policy instruments such as feed-in tariffs, renewable portfolio
standards, blending mandates, mandatory energy performance standards (MEPS), and green public
procurement guidelines can be used to build new business opportunities and create markets for
low-carbon products and technologies (UNEP, 2011; World Bank, 2014).
Government policy should also encourage the sharing of technology and best practices between
the foreign investment entities and the domestic firms to maximize the value of foreign Direct
Investment (FDI) in low-carbon development (UNEP, 2011; World Bank, 2014). LCZs can also
serve as testing grounds for new policy interventions to promote low-carbon development or
improve the general investment climate (World Bank, 2014). Low-carbon policies should be
evidence-based and have clear and measurable objectives (World Bank, 2014).

64
2.11 Institutional Framework for a Low-Carbon Zone
The drive towards a low-carbon green zone has to be championed by either an institution or a
respected business player (World Bank, 2014). The Country’s EPZA does not have capacity to
champion for the adoption of low-carbon green zones. Similarly there are no respected Kenyan
business players in this space yet. Generally, an institutional champion is required for purposes of
helping to coordinate multiple stakeholders while also lobbying for the adoption of enabling
policies (EC, 2011; World Bank, 2014). Ideally, within a low-carbon green SEZ, a dedicated
department in charge of low-carbon and green growth initiatives needs to be established within the
SEZ Authority (World Bank, 2011).
The World Bank popularly refers to such a department as a “Green Cell” (World Bank, 2011). Its
main goal will be to help in the development of low-carbon master plans, lead its implementation
process, and coordinate between and among different ministries and departments since climate
change issues are cross-cutting (EC, 2011; World Bank, 2011). An individual champion comes in
handy when it comes to securing top management commitment buy-in that is essential for
successful adoption of low-carbon green growth. This presents a governance and enforcement
challenge that needs to be addressed through comprehensive institutional strengthening,
development, and reform (World Bank, 2014). Figure 4 below represents an ideal institutional
framework for supporting low-carbon zone development.

65
Figure 4: Institutional Framework to Support LCZ Development
Source: World Bank, 2014
Successful development of LCZs will depend on the presence of a strong institutional ecosystem
that not only includes the enterprises, zone developers, government departments, and ministerial
departments, but also the business service providers, engineers, environmentalists, consultants,
operations and maintenance professionals, equipment suppliers, financiers, academic institutes,
research institutes and vocational training centers (ADB, 2012; World Bank,2014). One way that
the zone authority can designate dedicated resources for overseeing low-carbon development is by
setting up a specialized body or “green cell” within itself to champion low-carbon initiatives
(World Bank, 2014). The green cell, made up of technological experts, engineers and consultants,
will be charged with establishing the zone’s strategy for low-carbon transformation, including
major actions and initiatives (World Bank, 2014; UNEP, 2015). A green cell formalized in
legislation may strengthen its mandate to affect changes in the zone and lend credence to the
coordination, governance and communication structures necessary to promote LCZs (World Bank,
2014). The green cell provides a platform for collaboration among zone enterprises and donors,

66
equipment suppliers, NGOs, and civil society (World Bank, 2014). It can evolve to become a one
stop service center that will coordinate with external and internal agencies to drive implementation
of low-carbon activities in the zone and help to ensure continuous national dialogue and
coordination on low-carbon growth (World Bank, 2014).
2.12 Important Considerations in SEZ Development and Implementation
Upgrading and retrofitting of special economic zones/ industrial parks is achieved through the
incorporation of resource efficiency aspects, integration of environmental monitoring and
management structures for ecologically friendly production and promotion of gender sensitive
infrastructural designs (GIZ, 2015b). India established a Green Building Council (GBC) in 2001
for purposes of establishing SEZs/ IPs that strive to reduce their environmental impacts (GIZ,
2015b). The green factory building rating system is a voluntary and consensus based system based
on materials and technologies that are currently available in India (GIZ, 2015a). The system seeks
to promote energy efficiency, water use efficiency, creation of healthy and more productive work
places, and help establish environmentally friendly factories (GIZ, 2015a). Kenya should also
develop such a voluntary green rating scheme to serve zone tenant companies that want to go green
on a voluntary basis.
The rating system is based on the awarding of credit points based on prescribed requirements and
general performance (GIZ, 2015b). The scheme is designed to address national priorities and also
improve the quality of life for Indian factory employees (GIZ, 2015b). It is designed to cater for
new and existing factory buildings (GIZ, 2015b). Before filing an application for certification, it
is mandatory that existing factory buildings first addresses issues such as soil erosion control,
making changes the design to accommodate the requirements of disabled people, adoption of low-
67
flow water fixtures, starting harvesting rainwater harvesting, embracing minimum fresh air
ventilation requirements, assuring comfortable working conditions, and using eco-friendly
housekeeping materials (GIZ, 2015b).
This Indian rating system is valid for 3 years (GIZ, 2015b). Upon the expiry of the 3 year period,
certified projects are re-assessed, validated and renewed based on the prevailing latest version of
the rating scheme (GIZ, 2015b). The guidelines spelled out under each credit are capable of
enabling the design and construction of green factory buildings of all sizes and types (GIZ, 2015b).
The Indian Green SEZ guidelines were developed by the Indian Green Building Council and the
Ministry of Commerce and Industry. These green SEZ guidelines are voluntary and consensus
based (GIZ, 2015b). The guidelines’ main objective is to facilitate the establishment of energy
efficient, water efficient, healthy working environments, comfortable work places, and
environmentally friendly SEZs/ IPs (GIZ, 2015b). Table 3 below summarizes the sustainability
elements of the Indian Green SEZ rating system.

68
Table 3: Indian Green SEZ Guidelines
Criterion Basis
Site Preservation and Restoration
Soil Erosion Soil erosion control measures should adhere to the best
management practices prioritized by the Kenyan National
Building Code; and
Reuse top soil for landscaping
Nurseries Developers will be required to set up their own tree
nurseries for plantation of seedlings
Reduce site disturbance
Landscape open areas Landscape open areas to an extent of at least 50% of the
zone area
Reduce impact on microclimate Install at least 50% of the roof area with green roof or high
reflective materials
Site Planning and Design
Tobacco smoke control Smoking should be prohibited in all common/ public areas
Basic amenities Provide at least ten amenities within the zone; Provide
optical fiber communications (OFC) for efficient internet
connectivity to the industrial units
Vicinity to public transport Provide access to public transportation such as public bus
station or railway station, within a radius distance of 1 km
of any access point to the zone
Bicycle Lanes Provide bicycle lanes (in all primary and secondary
streets) to encourage occupants to commute by bicycles to
and from the work place
Footpaths and pathways Provide exclusive foot paths in primary streets for
comfortable pedestrian street access; and Provide pedestrian
pathways across various blocks in the zone
Eco-friendly transportation Provide internal transportation facilities in the zone to cater
to at least 10% of the permanent occupants through low
emission vehicles; and Provide alternate fuel stations
Parking facilities Provide parking facilities to meet but not exceed the local
parking regulations; and allocate at least 10% of the parking
capacity for carpool vehicles
Design for differently abled Design for easy access to all the common spaces
Green buildings within the SEZ Design individual buildings within the SEZ in accordance
with the appropriate rating system
Water use Efficiency
Rainwater harvesting, 25% Provide rainwater harvesting or a storage system to capture
at least 25%
Waste water treatment, 100% Provide an on-site waste water treatment system to treat
100% of waste water generated for on-site re-use
Lawn design Limit the use of lawn to an extent of 20 %( minimum) of
the landscaped area

69
Drought tolerant species Design landscape with plant species which consume less
water
Efficient irrigation systems Provide highly efficient irrigation systems
Rain water filtration
Treated waste water reuse Reduce at least 50% of water requirement by using treated
waste water for landscaping
Energy Efficiency
Energy efficiency Optimize energy use efficiency of the building and systems
to reduce environmental impacts associated with excessive
energy use
Onsite renewable energy Install renewable energy systems to generate power through
solar, wind, biomass/ biogas, or any other forms of
renewable energy for at least 5% of the annual consumption
Energy monitoring system Develop and implement, a measurement & verification
(M&V) plan to monitor building performance
Avoid the use of HCFC based refrigerants and ozone
depleting substances which negatively impact the
environment
Materials and Resources
Segregation of waste Develop a waste management plan and identify methods to
Segregate, recover and dispose of the waste efficiently
Waste reduction – during
construction
Avoid at least 50% of the waste generated during
construction from being sent to landfills and incinerators
Organic waste management Install on-site treatment plant to treat at least 50% of
organic waste generated in the zone
Materials with recycled content Select materials having recycled content such that the total
recycled content constitutes at least 10% of the material
Local Materials Ensure at least 50% of the building materials (by cost; civil
and interior materials only) are sourced locally within a
radius of 500km
Innovation and Design Process
Innovation and Design Process Provide design teams and projects the opportunity to be
awarded points for innovative performance in Green
Building categories
Source: Indian Green Building Council and the Ministry of Commerce and Industry

70
2.13 Resource Efficiency and Cleaner Production (RECP)
Resource Efficient Cleaner Production (RECP) relies on cleaner production in accelerating the
application of preventive environmental strategies at company level with a focus on processes,
products and services (UNEP, 2015). The term Cleaner Production (CP) was defined by UNEP in
1990 as: ‘the continuous application of an integrated environmental strategy to processes, products
and services to increase efficiency and reduce risks to humans and the environment’ (UNEP,
1990). CP as a tool addresses problems at source, using a product lifecycle approach that also
considers best environmental practices and techniques that go beyond manufacturing to include
the service sector (UNIDO, 2015; UNEP, 2015).
Over the years, as the economic and environmental crises intensified, UNEP and UNIDO
responded by introducing resource efficiency alongside cleaner production (RECP) for purposes
of advancing production efficiency, environmental management and human capacity development
(UNIDO, 2015; UNEP, 2015). This strategy integrates the strengthened lifecycle perspective that
looks at the point of extraction all along the supply chain to the point of final disposal, including
the critical issue of resource scarcity (UNEP, 2015). Resource efficiency achieves environmental
management through the minimization of waste and pollution at source (UNEP, 2015). Production
efficiency makes economic and business sense as it foregoes the use of unnecessary materials and
reduces energy and material use in producing goods and services (UNEP, 2015). Humans
automatically benefit from the efficient and cleaner processes as this effort promotes judicious use
of global resources (UNEP, 2015). Kenya National Cleaner Production Center (KNCPC)
spearheads the promotion of RECP activities in Kenya with the support of like-minded institutions
like KIRDI and Universities as well as private sector business associations who together are

71
constantly lobbying policy makers and other stakeholders at the national level to promote a more
resource efficient and green economy (UNIDO, 2015; UNEP, 2015).
2.13 Theoretical Framework
The theoretical basis for this study was arrived at after reviewing the ecological transition theory,
the life cycle thinking, the shared value approach, and the industrial ecology mechanism. The
ecological transition theory advocates for living within our ecological limits12. Applied to the SEZ/
IP set up, this means that all operational zones/ industrial parks should strive to operate within
their boundary limits as defined by the perimeter fence that runs around them. In other words, the
theory calls for their self-reliance in their capability to deal with all the negative effects associated
with zone operations such as solid waste management, effluent treatment and disposal as well as
management of gaseous emissions. The theory calls for societal transformation into a a more
ecologically sound model that is characterized with system level and incremental changes (UNEP,
2011; CIRAIG, 2015). Life cycle thinking aims at going beyond the traditional focus on the
production site and manufacturing processes to include environmental, social, and economic
impacts of manufactured products over their entire life cycle13.
In the context of a SEZ/ IP this means that the country’s economic zones will be held responsible
for the negative impacts posed by their products throughout their entire life cycle (CIRAIG, 2015).
This requirement should help the country’s SEZ/ IP to seek for innovative partnerships that target
the collection of wastes associated with zone companies for reuse and recycling in partnership with
the surrounding communities. This leads us to the shared value theory advanced by Porter and
12 CIRAG, 2015. Circular Economy. A Practical Literature Review of Concepts, International Reference Centre for the Life Cycle of Products, Processes, and Services. 13 Life Cycle Initiative (LCI), 2013.

72
Kramer that advances the belief that, “what is good for society is good for business”. According
to the two, shared value is a management strategy focused on companies creating measurable
business value by identifying and addressing social problems that intersect with their businesses
(Porter and Kramer, 2011). Therefore, in order for a SEZ/ IP to be granted a license to operate, it
has to address itself to the social challenges of the surrounding communities. Community
engagement is the way to go as regards the need to secure a permanent license to operate. The
Industrial Ecology approach that is the focus of this study advocates for companies to work
together as one organism (CIRAIG, 2015). The theory seeks to reduce the environmental stress
caused by industry whilst encouraging innovation, resource use efficiency and sustained growth
(Chertow, 2000). In this theory, industries are seen as man-made ecosystems that operate in a
similar way as natural ecosystems, where waste or by-products of one process is used as an input
for another process (UNEP, 2011). Looking at the operational requirements of all the theories
described above, it was easy to see that a sustainable materials theory kind of integrates all their
environmental sustainability requirements.
The theoretical basis of this study is the sustainable materials management (SMM) theory that
originated at the Earth Summit in1992. This theory was used to determine how the Athi River SEZ
could preserve its natural capital through the adoption of the most appropriate science and
engineering skills know-how, the development and actualization of business models and
management practices that seek to divert wastes from the landfill and reduce pressure on the use
of virgin raw materials while also helping to lower the zone’s carbon foot print as was successfully
demonstrated in the US (US EPA, 2009). The Sustainable Materials Management theory advocates
for a total shift from waste management to materials management in total support of the ideals of
73
sustainable management (OECD, 2012). By modelling industrial production systems in a zone as
a system of material flows similar to what happens in natural ecosystems, it was possible to see
how waste from one production line could be used as raw material for the other (OECD, 2012).
The theory seeks (i) the most productive use of raw materials; (ii) to broadly focus on positive and
negative impacts and policies relating to all supply chain stages of a material or product that
includes upstream considerations of using less material, using environmental friendly materials,
or making products more durable as well as downstream solutions such as material recovery, reuse
and recycling; (iii) concerns itself with input and output materials to and from the environment in
relation to the zone’s operations of advancing efficient use of materials, energy and water for the
sole purpose of promoting sustainability within the economic zone (EEA, 2011; UNEP, 2015b).
This mode of thinking helped to justify the need for more accurate mapping of the zone’s material
flows and their associate impacts; the need for increased resource productivity and resource use
efficiency; the need to reduce the zone’s material throughput; the need to increase on-site recovery,
reuse and recycling of zone materials as a way of preserving its natural capital and the need to
advance process technologies that seek to eliminate wastes and toxins while preserving the zone’s
long-term health through research driven eco-innovation (OECD, 2011a; EC, 2011; EEA, 2011;
UNEP, 2015b). This calls on SEZs to start embracing proactive approaches such as resource use
efficiency, cleaner production and industrial symbiosis. Integration of these contemporary tools
ensures that process wastes are minimized at source through cleaner production while the
inevitable residual waste is handled through industrial symbiosis that advocates for waste and by-
product exchange between and among production lines. According to the OECD, sustainable
materials management (SMM) is defined as “…an approach to promote sustainable materials use,
integrating actions targeted at reducing negative environmental impacts and preserving natural
74
capital throughout the life-cycle of materials, taking into account economic efficiency and social
equity ”(OECD, 2011a; OECD, 2012).
In this context, it is crucial for SEZs to advance policies that prioritize sustainable materials
management that build on the 4R philosophy of reducing, reusing, recovering, and recycling
wastes and by-products (OECD, 2011b). The theory seeks to maximize positive impacts to the
environment while minimizing negative ones with the sole purpose of promoting human health
and well-being (OECD, 2012). Through management styles that prioritize safety and sustainability
at each stage of the supply chain, efforts should be made to ensure that zone operational risks are
not shifted from one section of the supply chain to the other (OECD, 2012). The ultimate goal was
to ensure that the zone’s economic and social out comes were optimized while natural capital was
preserved and materials sustainability properly managed. This approach calls for intense
cooperation between waste exchange actors across the entire supply chain (life cycle) so that all
the key actors are made aware of the impacts of their actions on the environment. This will
ultimately help to boost the zone’s prospects for industrial symbiosis. The adopted theoretical basis
guided the study in putting more emphasis on innovative environmental approaches such as
detoxification, dematerialization and design for value recovery (OECD, 2012).
In this theoretical context, dematerialization means doing more with less and underscores the need
for more efficient use of raw materials (resource use efficiency) without decreasing the quality of
the service being rendered (OECD, 2011a). The theory recommends further the engagement of all
zone stakeholders to take active, ethically correct responsibility for achieved sustainability out
comes. Implementation of SMM supportive policies and practices at SEZ level is a promising
strategy for helping to decouple the zone’s economic growth from natural resource consumption

75
and pollution (OECD, 2011c). Therefore SMM constitutes an important component of any green
growth strategy for the SEZs. SMM policies will also indirectly reduce demand pressures on
natural resources and contribute to better resource security (OECD, 2011c; OECD, 2012). Natural
resources and healthy ecosystems are essential to all life and provide the natural capital on which
humans depend (OECD, 2012). In other words, materials management therefore casts a far broader
net than waste and chemicals management has traditionally done (US EPA, 2009) and was used
in the theoretical design of this study. The basis of SMM is to ensure that the consumption of
resources and their associated wastes do not exceed the carrying capacity of the planet hence
justifying the need to decouple economic growth from massive resource use (OECD, 2012).
2.14 Conceptual Framework
The conceptual framework below shows the linear production system as the business as usual
scenario; and the proposed intervention that seeks to lead to a circular economic development
model (Figure 5). It also shows how industrial ecology can be used to divert waste destined for the
landfill and have it used as feed stock for another production line. Doing this will reduce pressure
on the use of virgin raw materials and also lower the economic zone’s carbon footprint since wastes
from one production line will be channeled to the other through an industrial symbiosis network.
Additionally, the diversion of wastes from the landfill also prevents the generation of methane that
has a higher global warming potential than carbon dioxide. In established industrial systems,
individual companies continuously exploit synergies in the supply chains of energy, material,
water and services in order to enhance economic performance while reducing environmental
impacts (Roberts, 2004). In this economic development model, waste products of one company
serves as a raw material for the other (ACE, 2014).

76
Linear System (Business as usual)
By-product
Circular System (after intervention)
Policy Intervention
Source: Modified from the UK National Industrial Symbiosis Program (NISP) of 2009.
Raw Materials + Water
Energy (Electricity + Wood)
Labor
Energy Losses
By-products
Eco-Industrial Park (EIP) characterized by reduced wastes and emissions for green growth
Institutional and Policy Framework
Institutional and Policy Framework
Industrial Ecology
Figure 5: (i) Conceptual Framework
Environmental Degradation
Carbon Dioxide
Independent Variables
Dependent Variables

77
This conceptual framework puts priority on diverting wastes from the landfill. It underscores the
need for zone companies to switch from a wasteful linear economy into a resource efficient circular
economy where companies are constantly promoting waste and by-product exchange. Doing this
will enable our existing SEZs to adopt a green growth development pathway. The intervention
only targets wastes and cascaded energy with implications on emissions. The conceptual
framework shows the switch from a wasteful linear development model at the Athi River SEZ to
a closed loop circular economy that diverts waste from the landfill14. In this context, circularity
implies a break with the linear, “take, make, dispose” model that characterizes consumer behavior
in society today, relying on large quantities of easily accessible cheap resources and energy15.
Circularity, or circular economy, is an industrial development economic model that has restorative
intentions, aims to be powered by renewable energy, minimizes, traces, and potentially eliminates
the use of toxic and hazardous chemicals, increases competitiveness while reducing operational
costs and waste generation through the design for the environment approach (DfE)16.
Expressed simply, the linear production model as Figure 5 (ii).
Raw Materials
Energy
14 Modified from the UK’s National Industrial Symbiosis Program: The Pathway to a low-Carbon Sustainable Economy by Peter Laybourn and Maggie Morrissen – International Synergies, 2009 15 Kechichian, E. & Jeong, M. H. 2016. Mainstreaming Eco-Industrial Parks: Conclusions from the Eco-Industrial Park 2015 event in Seoul, South Korea. 16 McKinsey and MacArthur (McKinsey Global Institute and Ellen MacArthur Foundation). 2013. Towards the Circular Economy. Vol. 2.
Industry A
Desired Project A
Wastes A
By-product A
Landfill

78
Illustration of the circular economy as Figure 5 (iii)
Raw Materials
Energy
Raw Materials
Energy
Industry A 1 Desired Product A1
Waste A1
By-Product A1
Industry A 2 Desired Product A2
Waste A2
By-product A2

79
CHAPTER THREE: STUDY AREA AND METHODS
3.1 Study Area
The Athi River SEZ is the oldest and biggest in Kenya having been established on 23 November
1990 by the EPZ Act Cap 517 of the Laws of Kenya. It is the most advanced in terms of road, air,
rail and telecommunications infrastructure. It is a public SEZ that commands over 50% of the EPZ
business in the country. The zone that has a perimeter fence possesses a diverse range of industrial
establishments with requisite information essential for the realization of my intended study
objectives. The Athi River SEZ covers a total gazette land area of 634ha (Athi River LR No.
18474), out of which 182ha (30%) has already been developed with an additional 454ha (70%)
equivalent to 235 plots of approximate area of 2ha each awaiting to be developed in the future
(EPZ Program Annual Performance Report, 2013). There is therefore enough room for the
restructuring and transformation of the zone into an eco-industrial park (EIP). These findings will
not only be applicable to the Athi River SEZ but also to all others around the country.
3.2 Methods
This research was undertaken at the Athi River SEZ with a view to establishing what needs to be
done so as to transform the zone into a low-carbon and resource efficient industrial production
system as a way of improving its environmental stewardship. A mixed methods approach was
used. The following sequential steps were used to address the four study research questions:
(i) Determination of the evolving clusters of the Athi River special economic zone (SEZ);
(ii) Scientific analysis of the material flow patterns and how they lead to symbiotic
relationships within the identified clusters;
(iii)A baseline assessment of the application of the principles of industrial ecology to the
mitigation of the environmental challenges of the zone; and

80
(iv) Aiding the development of a governance model that strengthens the capability of the Zone
Authority in technically assisting and guiding the transformation of the zone into a low-
emission economic zone that is resource efficient and socially inclusive. An assessment of
the development and status of green growth policy issues was undertaken.
In order to assure validity and credibility, different sources of information were used including
interviews, direct observations, at the sites, websites, annual performance reports, statistical
abstracts, economic surveys, etc.
3.2.1 Types and Sources of Data
The approach entailed the collection of both qualitative and quantitative data sets. Primary data
was obtained through questionnaire interviews, zone and process inspections, analysis of utility
bills and company records. Secondary data was derived from statistical abstracts, official
government industrial survey reports, sessional papers, private sector development strategies
(PSDSs), Kenya Vision 2030 blueprint, development plans, zone master plans, operational process
manuals, Acts of Parliament, and environmental audit/ impact assessment reports. The focus of
this research was to establish the quantities of solid and liquid wastes generated by zone companies
and how much of this is exchanged through industrial symbiosis and diverted from the landfill.
The approach involved the use of key informant interviews and check lists. During the planning
phase of the research, background information about the zone was collected, research objectives
and general goal of the research explained to the zone management and modalities of engaging
zone companies agreed upon. Background information about the site was obtained from the zone’s
environmental policy, financial policies relating to the environment, relevant rules and regulations
governing the zone, and annual environmental audit reports. Additional zone information specifics
included the general zone lay out, site history, land area, on-going manufacturing activities, shared

81
waste management infrastructure, organizational structure as well as its internal environmental
policies, procedures and guidelines.
3.2.2 Development of Study Tools and Piloting
A comprehensive questionnaire covering all aspects of resource use optimization, cleaner
production, and industrial symbiosis and targeting a wide range of stakeholders was developed. A
zone visit during normal operation hours was arranged with an intention of meeting with the officer
in charge of the zone to explain and justify the purpose of the study, assess the extent to which the
gathered baseline information was accurate and up to date, make a follow up on the list of
preliminary best practice waste management practices, identify and request for additional zone
information and arrange for visits to selected zone enterprises. The feedback from this initial site
visit was used to finalize the research questionnaire, designed to contain an evaluation criteria for
purposes of assessing compliance with relevant legislative and regulatory standards, conformance
to internal environmental policies, procedures and guidelines, status of current environmental
stewardship, and staff awareness of the economic zone’s internal environmental policies,
procedures, techniques and guidelines. The questions also sought to establish whether the
companies received by-products or waste products from other companies that are then used as
inputs for their production processes or whether their by-products and wastes were used by other
companies.
3.2.3 Field Work and Literature Review
Field work sought to establish how the tenant companies of the zone managed their wastes as
regards the existence of waste generation data bases, their interpretation of the threats to health
and the environment posed by waste accumulation within the economic zone, whether the
economic zone had functional waste management policies, by-laws and rules, establish already

82
attempted strategies within the economic zone for reducing, reusing, recovering and recycling
wastes, whether the economic zone already derives energy from waste, presence of adequate waste
recovery infrastructure, waste accounting systems and mechanisms, level of tenant company
compliance to set waste management policies, by-laws and rules as well as general adequate of the
infrastructure for waste management within the economic zone. The key research issues relating
to water, soil, and air pollution and management within the economic zone included the existence
of zone based policies, by-laws, rules, and standards for the control of zone water, soil, and air
pollution, adherence to a set water, soil, and air quality criteria, roof top and storm water rain
harvesting, recovery of sludge from the effluent stream, existence of programs/ strategies for
reducing water usage and pollution and adequacy of infrastructure for managing and controlling
water pollution. Staff interviews were undertaken with selected tenant companies of the zone to
obtain information on current and past operational practices, deviations from statutory and zone
requirements, and awareness of best practice approaches. This was followed with an intensive
literature review on the efficacy of industrial ecology as a tool for promoting sustainable industrial
development and what legal, policy, technological and institutional frameworks are required for
its survival. Additional interviews were held with relevant key informants drawn from
Development Agencies, Government Ministries, State Corporations, Academia, Research
Institutes, County Leaders and Business Associations on the potential for industrial ecology as a
tool for greening Kenya’s SEZ and what needs to be done to accelerate its uptake.
3.2.4 Identification of Clusters
In order to ascertain the total number of clusters at the Athi River SEZ, an up to date inventory of
all the operational companies in the zone was developed. The firms were then classified on a
sector-wise basis and on the basis of integration of activities and collaboration of members for
mutual benefit and investigated for waste and by-product exchange. The concept of clustering

83
referred to in this thesis means local concentrations of horizontally or vertically linked companies
which specialize in related lines of business together with supporting organizations (Porter, 1990).
Four clusters out of the zone’s total were selected for detailed investigation. This involved
assigning numbers to each of the identified clusters. These numbers were written on small papers,
folded and haphazardly mixed in a container before being picked. The identified clusters were
benchmarked against a World Business Council for Sustainable Development (WBCSD) standard
guidelines on assessment of the Industrial Symbiosis (IS) potential with a view to identifying gaps
that need to be addressed if the clusters are to be sustainably grown while fully embracing resource
efficiency and industrial symbiosis. In this thesis, a cluster is defined as a territory comprising of
a high concentration of small and medium scale enterprises with highly specialized production,
generally greatly interdependent in their production cycles and strongly integrated with the local
socio-economic environment (Porter, 1990; Klimova et al. 2016).
3.2.5 Sampling Size
The sampling size was 11 based on the sector wise clusters developed for all the 22 companies
that were operating within the economic zone. Out of the 11 clusters, 4 were randomly selected
for detailed investigation. The selected 4 clusters had a total of 11 operational companied whose
symbiotic relationships were investigated.
3.2.6 Material Flows
Process inspection of the selected clusters was undertaken with a view to understanding their
material and energy flows and potential synergies within and outside the cluster were inspected.
An understanding of the material flows in the clusters was to enable the classification of by-product
and waste lines within and outside the cluster; map the value chain of materials and by-products,
group users of identical resources together, analyze possibilities for raw material cascading and
waste/by-product exchange; assess possibilities for physical infrastructure sharing; evaluate

84
sustainability of waste sources; explore options for on-site waste reuse and recycling; and
determine the potential for the creation of a network for raw material, energy and waste exchange
within the participating clusters. Waste and by-product streams in the selected cluster firms were
quantified and analyzed further for possibilities of linking them with other businesses that use
similar materials. Resource Flow Analysis (RFA) was used to track and quantify energy and
material flows through the respective cluster companies. This was undertaken on a weekly basis
for a period of two weeks so as to gather adequate data for the annual projection. Literature search
based on Life-Cycle Materials Management and Efficiency inspired by Cleaner Production,
Industrial Ecology, and Industrial Symbiosis was undertaken. According to UNEP, (2015),
Material Flow Analysis (MFA) is the reliable accounting framework that has emerged to aid the
calculation of these material flows. The approach makes it possible to accurately quantify resource
material flows, the total amounts extracted, the total amounts used, and the total amounts extracted
but not used within the value addition chain.
3.2.7 Benchmarking of Industrial Ecology Principles
In order to establish the extent to which the zone operations have incorporated the principles of
industrial ecology in mitigating its environmental challenges, the zone’s operations were
benchmarked against the seven principles of industrial ecology. This was executed through
individual interviews, focus group meetings, and zone/ site inspections. The Governance Model
of the zone was assessed on the basis of its ability to network and create synergies for waste and
by-product exchange, engage academia in eco-innovation promotion and general commitment to
the ideals of a green economy.

85
3.2.8 Data Analysis and Presentation
In order to demonstrate the efficacy of industrial ecology as an effective tool for helping to convert
the wasteful linear economic development model at the Athi River SEZ into a sustainable and
resource efficient circular economic development model, material flow analysis and tracking was
undertaken among the evolving symbiotic relationships of the four identified clusters for detailed
investigation. The aim was to track, measure, and quantify wastes and by-product material flows
within the emerging symbiotic relationships weekly for a period of two months and then use the
established waste and by-product generation averages to project annual symbiotic exchanges. In
the agro-processing cluster, it was demonstrated that the reuse of the residual seed cake for animal
feeds manufacture led to energy savings in production, reduced transportation costs, and avoided
emissions. For the garment cluster, the recovery of the garment offcuts for use as boiler fuel and
in sofa set manufacture led to avoided climate damaging emissions and creation of 15 decent green
jobs. The reuse of tarpaulin plastic off cuts for the manufacture of plastic water tanks and chairs
after on-site reprocessing led to the creation of 5 decent green jobs. The established waste and by-
product generation trends were presented using bar graphs while percentages were used to
represent avoided emissions and cost savings. The established waste and by-product generation
trends were presented using bar graphs.

86
CHAPTER FOUR: RESULTS AND DISCUSSIONS
This chapter presents results and discusses the findings of the study. The results reveal a
spontaneously emerging cluster network within the economic zone that is largely driven by the
prevailing forces of supply and demand; an existing intercompany material flow system that is
being hampered by a weak waste recovery and recycling infrastructure; a limited application of
the principles of industrial ecology in mitigating the environmental challenges of the economic
zone; and a weak governance structure that is incapable of enabling the economic zone to become
low-carbon, resource efficient and climate resilient. For the economic zone to fully adopt low-
carbon and resource efficient status, its tenant companies must unanimously shift their production
lines from linear to closed loop systems where wastes from one production line become inputs for
the other. Doing this will reduce pressure on the use of virgin materials and also lower the carbon
footprint of the economic zone by diverting vast amounts of waste from the landfill.
In other words, there should be no such a thing as waste within the economic zone – since one
industry’s waste or by-product should become the raw material for the another production line.
This is the foundation of Industrial Ecology that seeks to enable industry mimic the cyclic
operations of natural ecosystems. The economic zone had 22 operational firms that were grouped
into 11 clusters. Four clusters out of the identified 11 were randomly picked for detailed
investigation to determine the material flow patterns. The industrial practices of the four clusters
were benchmarked against the seven principles of industrial ecology and improvement measures
proposed. A governance model capable of transforming the SEZ into a low-carbon and resource
efficient zone was proposed. This governance model justifies the need to strengthen the triple helix
and community collaboration for improved eco-innovation and adoption of environmentally sound
technologies (ESTs) by the zone for improved competitiveness.

87
4.1 Determination of the Industrial Clusters of Athi River SEZ
This study found that the cluster zonation approach was not part of the initial master plan that
created the Athi River SEZ since the master plan was developed in the 1980s long before the
cluster concept took root globally (Porter, 1990). This means that adoption of the cluster initiative
for increased competitiveness of the economic zone has to be treated as a new development project.
As a result, the tenant company’s readiness to engage in active pooling of sustainability knowledge
and know-how was low. It was therefore difficult to establish mutual trust between companies that
have for a long time operated independently from each other and are now being persuaded to
cooperate and compete at the same time. Participating companies must be assured that their trade
secrets will not be misused. A cluster champion will be to help develop joint internal and external
communication networks that will aid the coordination of zone wide cluster activities.
The study also found that the zone clusters had evolved spontaneously due to the prevailing market
forces of supply and demand. The 22 industrial plants operating within the zone were classified
into 11 clusters on a sector wise basis. The composition of the firms in each of the clusters keeps
on changing as some firms opt to leave the zone at the expiry of the 10 year tax holiday. The eleven
identified clusters were agro-processing, pharmaceuticals, cement, electricals, garments,
beverages/ spirits, organic fertilizer manufacturing, plastics, food processing, clean stoves
assembly and darts board manufacturing (Table 4).

88
Table 4: Industrial Clusters of the Athi River SEZ
Cluster Number of
firms
Production Type
1. Agro-Processing 3
Oil Extraction;
Manufacture of ready to eat Unimix food ration;
Artemisinin plant extraction
2. Pharmaceuticals 1 Pharmaceutical products processing
3. Cement 1 Cement Manufacturing
4. Electricals 3 Electrical Fittings and Assembly
5. Garments 5 Garments Manufacture
6. Beverages/ Spirit 1 Beverages/ Spirit manufacture
7. Organic Fertilizer
Manufacturing
1 Manufacture of organic fertilizer from human
waste
8. Plastics 2 Plastic Tarpaulins manufacture and PET bottle
re-processing
9. Food Processing 3 Food processing
10. Clean Stoves
Assembly
1 Energy Efficient clean biomass stoves
manufacture and assembly
11. Darts and Darts
Board
1 Darts and Darts Board Manufacture and
Assembly
Total - 11 Total - 22
Out of these elven identified clusters, four clusters namely agro-processing, garments, plastics and
darts/darts board manufacturing were selected for in-depth investigation as regards what they were
exchanging with respect to the management of their wastes and by-products. Four clusters were
then randomly selected for detailed investigation. The selected four clusters comprised of a total
of 11 firms. Their accompanying waste/by-product types are as shown below (Table 5).

89
Table 5: Clusters for In-depth investigation
Cluster Number of
Enterprises
Production Type Waste/ by-product
stream
Agro-processing 3 Oil Extraction; manufacture
of ready to eat “Unimix” food
ration; Artemisia botanical
products extraction
Seed cake, waste
grains, boiler ash,
spent leaf and wax
Garment 5 Garments Manufacture. Textile off cuts
Plastic 2 Plastic Tarpaulins
manufacture and PET bottle
re-processing
Plastic waste, Returned
used PET Bottles
Darts/ Darts Board
Manufacture
1 Darts and Darts Board
Manufacture and Assembly
Chip board saw dust,
sisal waste, steel wire
off cuts
The study findings established that the embryonic clusters that have evolved spontaneously on
their own due to the prevailing market forces of supply and demand might not grow into maturity
due to lack of an enabling policy and regulatory environment. This is backed up by a response
from the Special Economic Zone (SEZ) Environmental Manager Mr. Mathew Were (pers. Comm.)
who stated:
….This economic zone is not planned for Industrial Ecology, however, aspects of waste
and by-product exchange among companies have evolved on their own due to the
prevailing market forces of supply and demand. This spontaneous development of
Industrial Ecology is pushing us to re-think our future expansion plans with a view to
incorporating this important aspect…...
This finding concurs with similar findings on the spontaneous evolution of industrial clusters in
Asia and Europe (Chertow & Ehrenfeld, 2012; Ghali et al. 2014; Anbumozhi et al. 2013; and
Mossard et al. 2014). Their mode of evolution is similar to how other clusters similarly evolved in
the EU, China, Japan, South Korea and South Africa as was pointed out by Chertow & Ehrenfeld,
2012; Ghali et al. 2014; Anbumozhi et al. 2013; and Mossard et al. 2014. These countries
recognized the organic evolution of their clusters and then created enabling conditions for their
further growth and expansion. The Kenyan Government needs to similarly do more in terms of

90
creating an enabling legal, institutional and regulatory framework if it has to harness fully the
power of clusters and clustering as an economic and regional development tool for its special
economic zones (SEZs) (World Bank, 2009).
The study established that there were no voluntary SEZ green rating schemes that could encourage
zone based companies to meet and even exceed the set environmental standards. The culture of
voluntarism where zone based companies subscribe to a voluntary code of practice that advances
resource use efficiency and waste exchange creates an incentive scheme that makes private sector
players meet and even exceed the set environmental standards at the persuasion of nobody except
the economic interest. Such a green rating system will encourage companies resident in the
economic zone to not only meet their environmental standards but voluntarily exceed them for the
sake of the competitiveness of their businesses. This model has been applied successfully in India
((GIZ, 2015a; 2015b).
The study found out that there was no evidence of triple helix collaboration between Universities/
Research Institutes-Industry-Government within the SEZ that creates an innovation ecosystem that
is key in promoting eco-innovation through research, development and demonstration (RD&D).
An in-depth examination of the economic zone activities revealed no evidence of the triple helix
collaboration. As a result, the Kenyan economic zone companies cannot therefore benefit fully
from research driven eco-innovation for their increased productivity and competitiveness as was
pointed out by Zeng in 2006. A functional triple helix collaboration will augment internal research
and development capabilities of zone based companies. The triple helix collaboration creates a
functional innovation ecosystem in which the operational needs of zone companies constitute the

91
research agenda of participating academia. These Athi River SEZ findings conform to Porter’s
and Zeng’s observations that clusters do add economic, social and environmental value to the
development of the economy by creating groups of networked businesses in specific sectors while
improving their business capabilities through tailored research support (Porter, 1990; Zeng, 2006).
The private sector alone cannot drive research as their core business is to make profits. Academia
through Universities and Research Institutes should partner with the private sector within the
economic zones so that their research programs are demand driven and targeted at solving the
operational challenges of the private sector. Such meaningful partnerships will help raise the much
needed research funds that are essential for break through research. Through pilot level
demonstrations, academia and research institutes can show the private sector that investing in
energy efficiency, water use efficiency, and waste minimization and management makes good
environmental and economic sense. Although the Government has committed to be allocating 2%
of its GDP to the National Research Fund (NRF) established by the Science Technology and
Innovation (STI) Act of 2013, there has been little progress towards the fulfilment of this goal.
The study established that the economic zone’s infrastructure for waste and by-product recovery
and exchange was inadequate. The spontaneous evolution of waste and by-product exchange
among the tenant companies of the zone is likely to be affected by the absence of non-enabling
infrastructure at the Athi River SEZ. Consequently, progress towards the zone’s full uptake of
RECP, 3Rs, and IS will be slowed down due to its weak waste recovery and recycling
infrastructure. The exchange of wastes and by-products among the clusters not only lowers
pressure on the use of virgin materials but also diverts waste from the land fill with demonstrated
benefits (UNIDO, 2011). A lot more can be realized if the economic zone invested in state-of-the-

92
art waste recovery and recycling infrastructure. These findings are similar to those of (Costa
&Ferraro, 2010) in which they observed that this noble practice spontaneously manifests itself
through the use of waste streams and by-products as alternatives to the use of virgin raw materials.
The findings are also consistent with Chertow’s observations that synergies are generally driven
by economic advantages offered by prevailing market conditions with companies acting for their
own benefit instead of responding to Government intervention (Lowe, 2001; Chertow, 2007)
The study also found out that there were no Government sponsored cluster based waste and by-
product exchange demonstrations that seek to show that investments in waste and by-product
exchange makes good environmental and business sense while helping to convert conventional
economic zones into low-carbon zones that are attractive in terms of green foreign direct
investments (FDIs). The literature review revealed that the UK, China, Japan, and South Korea
managed to advance the culture of eco-industrial parks (EIPs) using state funded demonstrations.
Once it is successfully demonstrated that embracing RECP, the 3Rs and IS makes good business
and environmental sense, up take by the private sector becomes automatic. The Kenyan
Government should set aside funds that can be used to set up pilot demonstrations that seek to
show that investing in the transition to a low-carbon and resource efficient future makes good
business and environmental sense. It should be the duty of the Kenyan Government through the
Zone Authority to technically assist tenant companies to embrace low-carbon, resource efficient
and socially inclusive development trajectories.
The study found out that enterprises resident in the economic zone were not embracing resource
use efficiency and cleaner production (RECP) ahead of embracing industrial symbiosis for low-
carbon growth as a result of limited awareness and lack of technical know-how. Due to limited

93
zone company awareness and insufficient R&D support for eco-innovation at Athi River, the zone
based enterprises were not actively embracing resource use efficiency and cleaner production in
their operations for continual improvement. Such an initiative can only be spearheaded by either
an industry focused research institute, a university with programs that address the needs of industry
or a national Cleaner Production Center such as the Kenya National Cleaner Production Center
(KNCPC). It is a demonstrated fact that waste minimization at source before engaging in waste
and by-product exchange through industrial symbiosis advances a sustainable use of scarce global
resources. As a result, the Kenyan cluster initiative is different from that of Europe, Asia and South
Africa in the sense that its development lacks a structured evolutionary roadmap that is spelled out
in a clear and enabling policy framework (Ketels et al. 2005; World Bank, 2006).
The study found out that there was no inter-firm communication platforms for the economic zone
clusters to facilitate the exchange of lessons and best practices. The zone had no inter-firm
communication platform that could be engaged in facilitating the matching of material and energy
needs of zone based companies as was pointed out by (Lowe, 1997; Saikku, 2006; & Bermejo,
2014). There was also no anchor tenant within the zone to aggressively advocate for the adoption
of industrial symbiosis by the tenant companies of the zone as was justified by Anbumozhi et al.
2013. According to Chertow, 2008, mutual trust among participating cluster firms is of paramount
importance in promoting industrial symbiosis. The culture of secrecy that is prevalent within the
management ranks of the zone based companies is likely to frustrate this noble waste and by-
product exchange scheme. According to (Wolman, 2014), and reinforced by (UNIDO, 2015), the
geographic proximity facilitates the spread of information, and the exchange of information
through face-to-face communications.

94
The zone authority needs to develop a clear vision of its intentions in promoting industrial
symbiosis on a cluster wise basis and championed by a motivated leader. These findings are largely
consistent with the World Bank, 2014, recommendation that the success of industrial ecology at
the cluster level depends on the ability of the industrial symbiosis champion to keep on finding
new waste and by-product exchange networks, enhancing dialogue between and among cluster
based companies, deliberately facilitating material and energy exchanges, and aggressively
recruiting new industrial symbiosis players. The ultimate goal of the inter-firm communication is
to help link up those with wastes and those who need the wastes for reuse and recycling.
Additionally, waste exchange opportunity workshops can be organized so as to facilitate waste
exchange negotiations and also help cement the requisite levels of trust among the players, and
The study found out that there was no cluster development road map for Kenyan SEZs embedded
in a development policy framework except for past studies and capacity building sessions. For
quick results, Kenya can learn from the successful European and Asian cluster development
models in proactively developing its homegrown cluster enabling, policies, institutions, strategies
and cluster growth development roadmaps. Successful adoption of the cluster initiative also needs
demonstrations. Such demonstrations should be deliberately designed to show that clusters are key
instruments for enhanced partnerships between different players of the same value chain; must be
private sector driven in order to succeed; and should always consist of a well-balanced
combination of companies, research institutes and academia.

95
4.2 Material Flow Patterns and Symbiotic Relationships
Material flow investigations at the Athi River SEZ yielded the following findings:
The study found out that companies resident in the zone do react to already generated wastes as
opposed to being proactive and preventing its generation at source. Instead of zone companies
reacting to already generated waste through the end-of-pipe approaches, they should instead look
for innovative and cost-effective ways of minimizing waste at source. This approach prioritizes
the minimization of waste at source through avoided spillages, leakages, and overflows so that the
resultant waste streams are in leaner amounts and changed characteristics that are easier to handle
and manage. The reactive approach to already generated waste is currently putting pressure on the
carrying capacity of the zone’s waste management infrastructure. Preventing waste generation at
source will not only relieve pressure on the zone’s overstretched waste management infrastructure
but also assure prudent use of the country’s scare resources. The Production Managers of the
cluster companies seemed to operate with the view that it is alright to generate waste since the
generated waste is exchanged for use as a raw material by other companies within the cluster. This
mindset goes against the global goal of seeking to promote sustainable consumption and
production of goods and services while acknowledging that global resources are finite and
inefficient use of virgin materials poses a big threat to our changing climate regime (UNEP, 2014).
The study also found out that there was no deliberate attempt to minimize waste generation at
source through resource use efficiency and cleaner production (RECP). Due limited awareness and
inadequate technical know-how, the Athi River SEZ companies had not fully subscribed to
embracing source reduction of waste through resource efficient cleaner production (RECP). In
order to promote this culture within the economic zone, the Zone Authority should partner with
the Kenya National Cleaner Production Center (KNCPC) and jointly mount RECP awareness

96
raising sessions, information dissemination, training and capacity building sessions, setting up of
in-plant demonstrations, technical advisory, and engaging in policy dialogue and analysis.
The study found out that zone based companies suffered from a weak input/ output measurement
culture with poor and inaccurate record keeping, a development that frustrates the development of
key performance indicators (KPIs) for continual improvement. A good input/ output measurement
culture that is backed up with accurate record keeping is essential for the development of key
performance indicators (KPI) that drive the continual improvement efforts participating companies
through benchmarking. Investigations at the Athi River SEZ revealed that tenant companies do
not embrace a good measurement culture and therefore do not keep accurate production records.
Even for those that kept production records, they never analyzed and trended them to inform
decision making. Environmental performance indicators based on accurate measurements will
allow companies to quantify their resource productivity and pollution intensities at any point in
time and to trace the results of RECP over a given period of time (UNIDO, 2016). Accordingly,
indicators help to translate complex data into relevant knowledge that can be used to initiate, focus
and sustain RECP promotion activities. These indicators are useful for realistic target-setting and
routine reporting (UNEP, 2015). Indicators are important in raising production awareness and
understanding; in making informed decisions, and in measuring progress towards established goals
(OECD, 2009). This scenario is worsened by the fact that there is no metering and sub-metering
of company material input/ output flows leading to the zone company’s inability to account for all
their inputs and outputs

97
The study found out that investing in resource use efficiency, cleaner production and industrial
symbiosis makes good business and environmental sense in terms of avoiding emissions, cutting
down on operational costs, creating green jobs, and diverting wastes from the landfill. It was
established that adoption of waste and by-product exchange helped to divert wastes from the
landfill, created 20 decent green jobs in the plastic and textile manufacturing clusters of the
economic zone, lowered operational costs by eliminating the need for long haulage transport, and
avoided emissions through fuel switch investments.
The study found out that there was no evidence of material flow analysis being done by the tenant
companies of the zone including those already engaged in industrial symbiosis. Material flow
analysis will help the economic zone to develop an up to date data base of what goes into each
tenant company’s production process, what goes out in terms of products and wastes, and what is
done to the wastes and their being dumped into the environment is what causes pollution. The
material flows at the Athi River SEZ are largely linear. This linear approach is wasteful in the
sense that the extracted raw materials after being value added and used will eventually have to be
landfilled as opposed to being recycled again and again. This means that materials are removed
from circulation and dumped. Unlike a circular economy, our current mode of production and
consumption at the Athi River SEZ is overwhelmingly based on the linear principle. Resources17
are extracted, processed, used, and ultimately for the most part discarded as waste (Wilts, 2016).
Such a linear economic model can only function if endless resources are available to satisfy
increasing human demand (UNEP, 2015). A strictly linear economy will inevitably be
unsustainable in the long run. The objective of the circular economy is to preserve the value of
17 Wilts, H. 2016. Germany on the Road to a Circular Economy? A Publication of the Friedrich Ebert Stiftung Foundation of Germany;
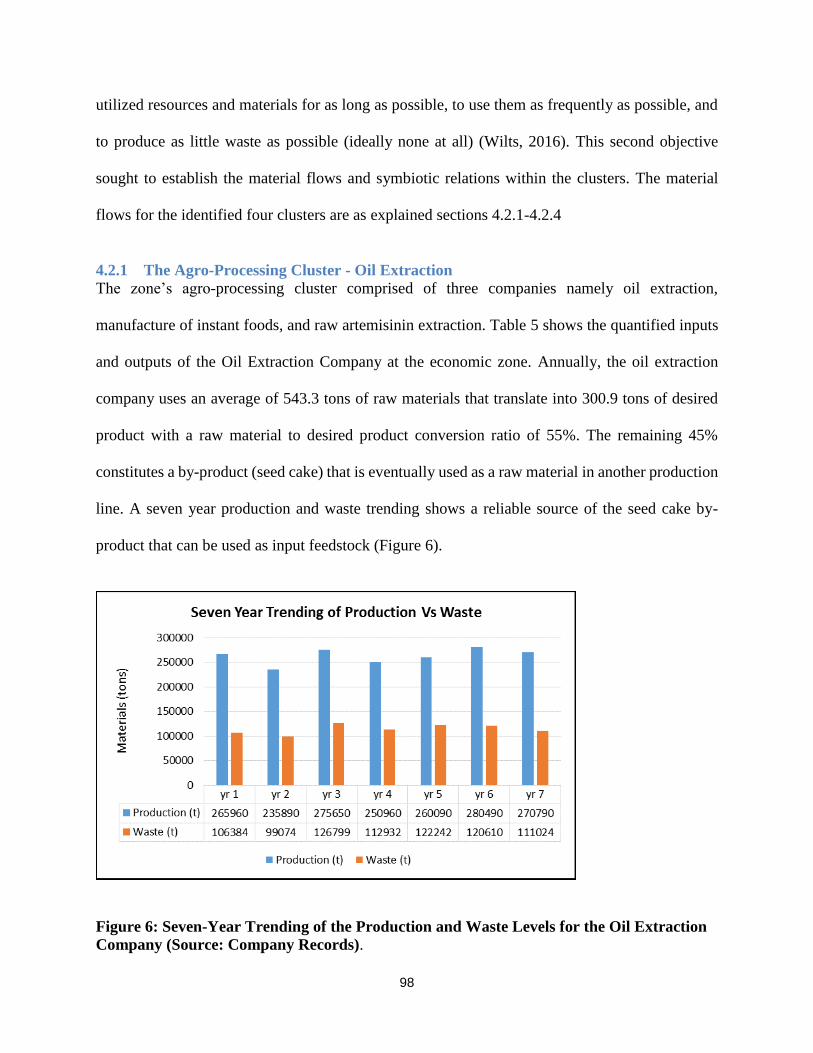
98
utilized resources and materials for as long as possible, to use them as frequently as possible, and
to produce as little waste as possible (ideally none at all) (Wilts, 2016). This second objective
sought to establish the material flows and symbiotic relations within the clusters. The material
flows for the identified four clusters are as explained sections 4.2.1-4.2.4
4.2.1 The Agro-Processing Cluster - Oil Extraction
The zone’s agro-processing cluster comprised of three companies namely oil extraction,
manufacture of instant foods, and raw artemisinin extraction. Table 5 shows the quantified inputs
and outputs of the Oil Extraction Company at the economic zone. Annually, the oil extraction
company uses an average of 543.3 tons of raw materials that translate into 300.9 tons of desired
product with a raw material to desired product conversion ratio of 55%. The remaining 45%
constitutes a by-product (seed cake) that is eventually used as a raw material in another production
line. A seven year production and waste trending shows a reliable source of the seed cake by-
product that can be used as input feedstock (Figure 6).
Figure 6: Seven-Year Trending of the Production and Waste Levels for the Oil Extraction
Company (Source: Company Records).

99
Figure 6 above shows the trending of production and associated wastes for the oil extraction
company over a seven year period. The trending reveals a raw material to desired product
conversion rate of 55%. This means that 55% of the raw material inputs converts into the desired
product with the rest 45% being classified as a by-product or a non-product output (NPO). Non
utilization of the NPO in another production process as feed stock will demonstrate wasteful use
of the country’s finite resources with associated environmental and social consequences. At a cost
of KES 20 per kilogram, the primary edible oil processing company earns USD 48,000/ year from
the sale of its 240.4 tons/year seed cake by-product to the Animal Feeds Manufacturing Company.
Absence of this waste exchange network will have meant that the by-product is handled as an
added transport and disposal cost to the primary producer. Disposal of 240.4 tons/year of organic
waste into the landfill will not only be a significant loss of useful material but also a significant
source of methane that has a higher global warming potential than that of carbon dioxide.
Manufacturing value addition of this by-product will create more jobs and alleviate poverty
amongst the Kenyan population.
Table 6: Material Flow Balance for the Oil Extraction Company (Source: Company
Records)
An oil extraction company is one of the companies that is successfully engaged in industrial
symbiosis. It is doing this by ensuring that its by-product stream that accounts for 45% of its raw
material input is not land filled but is instead used as a raw material by an animal feeds
manufacturing company. Doing this creates an additional revenue stream for the company and also
assures prudent use of the country's scarce resources.

100
Oil Extraction Process
Type of Raw Material In put quantity
(tons/year)
Inputs
Macadamia Kernels 200
Sesame Seeds 200
Moringa Seeds 91.3
Rosehip seeds 26
Pomegranate 26
Furnace Oil 2
Total Inputs 543.3
Raw material to product
conversion
55%
Desired Oil Products
Macadamia 126
Sesame 100
Moringa 43.7
Rosehip 15.6
Pomegranate 15.6
Total 300.9
Composite Seed Cake By-
product
Macadamia 74
Sesame 100
Moringa 45.6
Rosehip 10.4
Pomegranate 10.4
Total 240.4
The oil extraction company extracts oils from a wide range of seeds and nuts that include
macadamia, sesame, “moringa”, rosehip and pomegranate mostly drawn from central and coastal
regions of the country. The to and fro transport radius is approximately 200 km and 1000 km
respectively for central and the coastal regions. The seed cake is the by-product that remains after
the oil has been extracted by the primary firm. A secondary Animal Feeds manufacturing company
uses this by-product as a raw material for the manufacture of its animal feeds leading to an 80%
saving on long haul transport costs of virgin raw material (David Njeru, pers. Comm.) Engaging
in this waste exchange entirely diverts 300.9 tons/year of seed cake waste from being landfilled.

101
Landfilling of such waste quantities would have led to serious environmental and social problems
such as increasing the organic loading of the zone’s storm water systems (Export Processing Zones
Program Annual Performance Report, 2013).
Given that the Animal Feeds Manufacturer sources for his virgin raw materials from both central
and the distant coastal region, availability of a nearby cost-effective seed cake alternative will for
economic reasons make the manufacturer abandon the distant coastal region and instead focus on
the locally available resource. This will not only cut the company’s transportation costs but will
also lead to avoided emissions and reduced raw material costs. The abandoned coastal farmers will
lack market for their produce and eventually abandon the agricultural practice. This will lead to
increased poverty as their regular income will have been lost. The resultant raw material
transportation radius will therefore reduce from an average of 1000 km to that of 200 km leading
to a lower diesel fuel transportation cost with accompanying emission reduction benefits shown
below:
Transportation radius reduces from an average of 1,000 km to 200 km per round trip using a 20
ton capacity Isuzu Diesel Truck. Therefore the avoided distance is (1000 less 200) km which is
800 km. Using the Kenya Automobile Association (AA) consumption rate of 1.5 litres of diesel
per kilometer for a 20 ton lorry, and holding everything else constant (driving style, age of the
truck, frequency of servicing, over loading, etc.), then the amount of avoided diesel use is 1,200
litres per round trip. This is equivalent to 3,201 kg CO2 e of avoided emissions per round trip given
that the emission factor for diesel is 2.6676 kg CO2 e/ litre (UK Carbon Trust, 2011). The avoided
diesel 1,200 litres will lead to a transport cost saving of USD 840 per round trip (1 litre of diesel
costs KES 70; 1 USD = KES 100). Given that the annual raw material of the oil extraction plant
is 543.3 tons, this translates into a total of 27 round trips in a year using a 20 ton lorry. Therefore

102
the total annual savings will be USD 22,680. The total avoided annual emissions will be 86,427
kg CO2 e. The only green jobs established by this development will be those related to the
transportation of the seed cake from the oil extraction company to the animal feeds manufacturer.
The coastal farmers lost market for their 543.3 tons per year equivalent to an annual income loss
of USD 434,640 (cost of 1 kg of assorted seeds put at KES 80; 1 USD = 100 KES).
Pre-processing of macadamia seeds at the Edible oil Factory generates macadamia kernel waste
up to the tune of 200 tons/year. Use of this pre-processed seed cake as feed stock for the Animal
Feed Manufacturing Company leads to a 20% electrical energy saving (equivalent to 30,250
kWh/year) as the seed cake is already pre-processed (David Njeru, pers. Comm.) This is equivalent
to annual avoided emissions of 10,052 kg CO2 e (Kenya’s Grid Emission Factor is 0.3323 kg
CO2e/ kWh). The findings are consistent with UNIDO, 2015 conclusion that, localization of firms
allows them to enjoy inputs in greater variety and at lower cost. As a result, reduced transportation
and distribution costs will give input suppliers a competitive edge to locate within the same region
as their customers (UNIDO, 2015). This reinforces the attractiveness of firms locating within the
economic zone.
Ten Percent18 of this macadamia kernel waste (equivalent to approximately 20 tons/year) is used
by the oil extraction company to generate 3 tons/day of on-site process steam that displaces the
company’s use of 1.5 tons of fuel oil. This makes a monetary saving of USD 1,500 per year that
is significant in resource use efficiency and cleaner production (RECP) terms. The associated
respective carbon emissions reduction are as calculated below:
(i) 1.5 ton of Fuel Oil19 generates (1.5 x 3,228) = 4,842 kg CO2 e
18 Source: Oil Extraction Production Manager Estimate 19 Carbon Trust Emission Factor per ton of Fuel Oil

103
(ii) 20 ton of Biomass Energy20 generates (20 x 183.9) = 3,678 kg CO2e
This leads to a CO2 e reduction of (4,842 – 3,678) = 604 kg CO2e (equivalent to 12% reduction)
as a result of the fuel switch from the use of Fuel to the use of Biomass Energy (Figure 6).
Excess macadamia shells (180 tons/year equivalent to 90%) are sold out to other companies
within the economic zone as boiler fuel for steam generation
The results show that fuel substitution, in this case switching from the use of fuel oil to the use of
biomass leads to a 12% reduced emissions (Figure 7). These findings are in tandem with (OECD,
2012) research conclusions that there is urgent need to accelerate the transition to a truly equitable,
sustainable, post-fossil free carbon society. According to OECD, there is need to develop bio-
based economies that are characterized by both reduced dependence on fossil fuels and reduced
emissions. These OECD conclusions are also similar to the Kenya’s low carbon development
objectives that seek to reduce energy consumption, pollution, and the emissions of greenhouse
gases (GHGs) (NCCAP, 2013). As a result of the need to promote sustainable consumption and
production, (UNEP, 2015) is currently calling upon Governments to use energy and products
efficiently, alongside the management of end-of-life products and materials through re-
manufacturing, recycling, or recovery and reuse with the ultimate goal of realizing sustainable
levels of GHG emissions.
20 Carbon Trust Emission Factor per ton of Wood Pellets

104
Figure 7: Reduced Emissions due to Fuel Switch
Some of the policy developments in the EU can help the Kenyan SEZ develop its own sustainable
waste management response. The findings are consistent with (UNEP, 2011) key principles of
sustainable consumption and production promotion that advocate for the decoupling of economic
growth from further environmental degradation. The diverted wastes for use as feedstock for
another company could otherwise have been landfilled if industrial symbiosis was not currently in
practice. Industrial Symbiosis that focuses on waste and by-product exchange between two
companies is a subset of industrial ecology and is the initial starting for the wider industrial ecology
network (Ghali et al. 2014).
4.2.2 Agro-processing Cluster - Instant Foods Processing
Instant Foods Processing is a Unimix food processing company. Its main raw materials are 75%
maize, 15% Soya and 5% Vitamins, 2% Oil and 1% Sugar (Source: Company Records). The
company’s milling and blending process (powered by electrical energy) is associated with
approximately 5% waste that is sold to an Animal Feeds Manufacturing Company (Table 7).
0
1000
2000
3000
4000
5000
6000
Fuel Oil Biomass
kg C
O2
eEliminated Emissions Due to Switch
- 12%

105
Table 7: Material Balance for Instant Foods Processing (Source: Company Records)
Instant Foods Processing
Type of Raw Material Quantity
(tons/year)
Inputs
Maize 19,200
Soya 4,800
Sorghum 3,800
Millet 2,400
Total 30,200
Desired Product
Maize 18,238
Soya 4,558
Sorghum 3,605
Millet 2,278
Total 28,679
Composite Wastes
Maize 960
Soya 240
Sorghum 190
Millet 120
Total 1,510
Table 7 shows overall raw material to desired product conversion rate of 95%. The raw material
to desired product conversion rates are 94.99%; 94.96%; 94.87%; and 94.92% respectively for
Maize, Soya, Sorghum, and Millet (Source: Company Records). The remaining 5% constitutes a
by-product termed food waste. This by-product that averages 1,510 tons /year is sold at KES 5 per
Kg to an animal feed manufacturing plant. This fetches the Instant Foods Processing Company
(primary manufacturing) USD 75,500 from what could otherwise be discarded as waste. This
waste is therefore diverted from the landfill. Due to the fact that the waste from the instant foods
company is semi-processed, the Animal Feeds Manufacturing Company records an estimated 20%
saving21 on its electrical energy consumption equivalent to USD 5,950/ year. The 20% savings on
21 Estimates from the Animal Feeds Production Manager
106
electrical energy (1,980,000 kWh/yr) is equivalent to 396,000 kWh/yr. This translates to an
emission reduction of 132 tCO2/year (Kenya’s Grid Emission Factor of 0.3323 kgCO2/kWh).
Thus the exchange of materials between industries not only saves the environment from possible
waste pollution but also plays a role in strengthening the company’s bottom line i.e. the
environment wins and the bottom line also wins, illustrating that environment and economy can
work together in a win-win arrangement – which is what industrial ecology is all about.
The study findings justifies UNEP’s push for sustainable consumption and production practices
(UNEP, 2015) sustainable consumption and production (SCP) principles that advocate for (i) the
need for economic zones to address not only environmental concerns but also key economic and
social challenges of their operations; (ii) the decoupling of the zone’s economic growth from
further environmental degradation through improved resource use efficiency and diversion of
wastes from the landfill; (iii) the improvement of quality of life and well-being - alleviating poverty
and promoting sustainable lifestyles as well as green job creation; (iv) the application of life cycle
thinking to minimize impacts at all stages of the production value chain and consumption process
(looking at waste as a useful resource); and (v) the active involvement of stakeholders at all levels
of government, the private sector, academia and civil society organizations.
4.2.3 Agro-Processing Cluster - Artemisinin Extraction
The Artemisinin Extraction Botanical Extracts is involved in the extraction of pure Artemisinin (a
key ingredient in the manufacture of an anti-malarial drug) from the “Artemisia annua” plant using
hexane and ethanol for extraction and purification respectively. The company’s extraction
efficiency is estimated at between 0.8 and 1%, meaning that it generates 198 tons/ year of organic

107
waste mostly in form of spent leaf and wax out of a raw material input of 200 tons/year. Hexane
and Ethanol are both used as solvents that are wholly recycled (Table 8).
Table 8: Artemisinin Extraction Material Balance (Source: Company Records)
Artemisinin Extraction
Type of Raw Material (Quantity (tons) /year)
Inputs
Artemisia 200 t/yr
Hexane Solvent 25,000 litres/yr
Ethanol Solvent 8.000 litres/yr
Fuel Oil 27,600 l/yr
Wood 280 tons/yr
Desired Product
Artemisia 2
Hexane Closed loop recycling
Wastes
Artemisinin Waste 198
Boiler Ash23 12
Up to 32,000 m3 of water is used for machine cooling with a significant amount being lost through
evaporation. The 196 tons/ year22 spent leaf and wax is re-used to supplement wood as steam boiler
fuel for the generation of 20 tons/ day of process steam hence eliminating the use of 12 tons/year
of fuel oil out of the company’s annual fuel oil consumption total of 26 tons/year. This translates
into an annual monetary saving of USD 15,200 besides saving the environment from significant
quantities of 2, 324 kg CO2e carbon equivalents.
The associated respective carbon emissions reduction are as indicated in the equations (i) and
(ii):
(i) 12 ton of Fuel Oil23 generates (12 x 3, 228) = 38,736 kg CO2 e
(ii) 198 ton of Biomass24 generates (198 x 183.9) = 36,412 kg CO2 e
22 Botanical Products Production Manager Estimates 23 Carbon Trust Emission Factor per ton of Fuel Oil 24 Carbon Trust Emission Factor per ton of Wood Pellets

108
This leads to a CO2 e reduction of (i) – (ii); (38,736 – 36,412) = 2,324 kg CO2e (equivalent to
6% reduction) as a result of the fuel switch (Figure 8).
Figure 8: Reduced Emissions due to the Fuel Switch
These findings reinforce (UNIDO, 2015) green industry recommendations that with natural
resources declining in both quantity and quality, time has come for companies to start practicing
resource recovery. In this case, spent leaf and wax is used as boiler fuel to replace furnace oil.
According to (UNIDO, 2015), the materials, water and energy regarded as unproductive and
useless by one company can be turned into a business opportunity by another operating nearby.
These findings are congruent with (UNIDO, 2015) conclusions that an economic zone such as the
Athi River one can become environmentally and economically sound if RECP application is done
at the individual enterprise level; collective RECP application practiced at the zone-wide level;
and Industrial symbiosis strategically adopted after RECP to deal with inevitable residual waste.

109
4.2.4 Garment Cluster
The Garment cluster comprises of 5 companies operating a cyclic resource economy. The cluster
collectively generates an average of 255 tons/year of fabric textile off cuts from a combined raw
material consumption of 9,000 tons/year. The management of fabric off cuts could be troublesome
had it not been for the on-going waste recovery and re-use programs. The making of garments has
a waste generation rate of approximately 3% (Source: Company Records). Twenty Five percent25
of this generated waste off cuts (equivalent to 64 tons/year) are used as steam boiler fuel while the
rest 75% (equivalent to 191 tons/year) is sorted out on the basis of size at a temporary waste
transfer station within the zone for use in the manufacture of sofa sets and cleaning mobs (Table
9).
Table 9: Garment Cluster Material and Emissions Balance
Garment Cluster
Type of Raw Material Quantity (tons/year)
Inputs
Textile Fabric 9,000
Fuel Oil 4 (replaced by fabric
off cuts)
Desired Product
Finished Garment 8,500
Composite Waste
Composite Waste 255
The recycling of 64 tons/year fabric off cuts do generate for the cluster 9 tons of steam/ day. This
fuel switch substitutes the cluster’s reliance on 4 tons of fuel oil in a year with textile fabric off
cuts. The discrepancy in the quantification of inputs versus out puts can be attributed to the
accuracy of the record keeping process. Given that over 25% of the garment off cut waste
(equivalent to 64 tons/year) is cotton based, and is used as boiler fuel to generate 9% less
25 Source: Garment Cluster Production Manager

110
greenhouse gas (GHG) emissions as compared to the use of fuel oil as demonstrated by the
calculation below.
4 ton of Fuel Oil26 generates (4 x 3.228) = 12,912 kg CO2 e
64 ton of Biomass27 generates (64 x 183.9) = 11,770 kg CO2 e
This leads to a CO2 e reduction of 1,142 kg CO2e (12,912 – 11,770) (equivalent to 9% reduction)
as a result of the fuel switch (Figure 9). Substituting the use of 4 tons/year of fuel oil with
garment fabric off cuts will lead to an estimated annual monetary saving of USD 4,000.
Figure 9: Reduced Emissions due to Fuel Switch
The company’s use of spent leaf and wax as a source of fuel raises the environmental legitimacy
of the company operations. This innovative finding is similar to Michael Porter’s (2011),
conclusion that despite growing corporate citizenship activities, the legitimacy of businesses have
crossly fallen28. According to him, businesses are currently seen to be prospering at the expense
26 Carbon Trust Emission Factor per ton of Fuel Oil 27 Carbon Trust Emission Factor per ton of Wood Pellets 28 “Creating Shared Value” (Harvard Business Review, Jan 2011)
11000
11200
11400
11600
11800
12000
12200
12400
12600
12800
13000
Fuel Oil Biomass
kg C
O2
e
Eliminated Emissions Due to Switch
- 9%

111
of society. Creation of Shared Value (CSV) can help reverse this social perception (Porter, 2011).
To achieve this, Porter says, there is need for corporate policies and practices that seek to enhance
competitiveness of companies while simultaneously advancing social and economic conditions in
the communities in which they sell and operate. On this front, the economic zone supplies fresh
water to the surrounding communities and also allows the Athi River residents to use its sewerage
system. The Athi River residents feel the zone should do more for them in terms of helping them
to recover and recycle different waste streams that are otherwise littering their environment.
However, the Economic Zone - Community relationship has created an innovative “win-win”
working relationship between zone garment factories and informal waste recyclers who reside in
the surrounding community. These informal waste recyclers have agreed to be cleaning garment
factories for free so that they can easily access the garment textile off cuts for their subsequent
resource recovery and re-use. The win for the zone garment factories is that they no longer need
to spend money on general factory clean up and waste management in general (leading to estimated
savings of up to USD 6,000 per year). The win for the informal garment waste recyclers is that
they get the garment textile off cut wastes for free, have them graded and sold out to sofa set and
cleaning mob manufacturers. An estimated 15 tons/month of fabric textile waste off cuts are
recovered for reuse. The fabric off cuts retail at KES 6 per kg, generating a monthly income of
USD 900. By doing this, significant amounts of waste otherwise destined for the landfill are
diverted for economic use with enormous environmental and socio-economic benefits. This
relationship has created a total of 15 direct “green jobs” and also improves the living standards of
the surrounding community (improved incomes) who apart from hosting the zone employees also
serve as customers and suppliers of the same zone. However these green jobs are not decent due
to the limited level of investments in the zone’s waste recovery and recycling infrastructure. Proper

112
investments in waste recovery and recycling infrastructure will help convert these green jobs into
decent jobs as defined by UNEP below. Green jobs serve the noble function of reducing the
environmental impact of enterprises and economic sectors, ultimately to levels that are
sustainable29. Green jobs do help to cut on the consumption of energy, raw materials, and water
through high-efficiency strategies, to decarbonize the economy and reduce GHG emissions, to
minimize or avoid altogether all forms of wastes and pollution, to protect and restore ecosystems
and biodiversity19. According to UNEP, decent work involves the creation of opportunities for
work that is productive and delivers a fair income, enjoys security in the work place, has adequate
social protection for families, offers better prospects for personal development and social
integration, permits freedom for people to express their concerns, organize and participate in the
decisions that affect their lives and equality of opportunity and treatment for both genders.
The results on the garment cluster demonstrate that cyclic waste management can create jobs and
improve industry-community relations. All over the world industry-community relations are
strained when industries use community territories as waste dumping sites. In this case, waste has
created a symbiotic industry-community relationship that protects the environment, creates jobs,
and a source of livelihood. The creation of 15 jobs at the economic zone’s garment cluster
reinforces (UNEP, 2015) argument that investments in green growth will lead to social inclusion
and therefore developing countries should commit to working towards changing the way goods
and services are produced and consumed so that human development, and the satisfaction of
human needs, is decoupled from further environmental degradation. This is a classic green growth
social inclusion exercise where waste from the garment cluster is used by the surrounding
29 UNEP, 2010. ABC of SCP – Clarifying concepts on SCP
113
community members as a resource for green job creation and improvement of quality of life and
well-being. Apart from promoting a sustainable lifestyle, the practice also alleviates poverty.
The findings also reinforce (UNIDO, 2015) position that firms are facing growing pressure to
become “green” or more environmentally friendly. As a result, these garment cluster firms have
had to review their production processes and procedures so that they can use textile fabric off cuts
as boiler fuel and also allow the informal waste recyclers to recover and add value to their waste
stream and prevent it from being landfilled. That is why UNEP and the EU are currently supporting
industry, emerging green eco-entrepreneurs, and policy makers through policy development, that
supports the setting up of RECP and IS demonstration projects and other networking activities
through the Switch Africa Green project being implemented by the Kenya National Cleaner
Production Centre (KNCPC). However, lack of a solid waste recovery and recycling infrastructure
(in terms of collection, transport, and disposal systems) at the zone hampers the zone’s full
exploitation of the garment cluster’s waste recovery and recycling scheme (WBCSD, 2002). The
findings also reinforce the country’s goal of adopting a green development pathway that is spelled
out in its Green Economy Strategy and Implementation Plan (GESIP). Figure 10 shows the
trending of production and associated wastes for the Garment Cluster over a seven year period.

114
Figure 10: Seven Year Trending of Garment Production Vs Waste Generation
The trending reveals a raw material to desired product conversion rate of 97%. This means that
97% of the raw material garment inputs converts into the desired final product with the rest 3%
being classified as a by-product or a non-product output (NPO). Non utilization of the NPO in
another production process for energy cascading and manufacture of sofa sets and cleaning mobs
will demonstrate wasteful use of the company’s limited resources with associated environmental
and social consequences. Luckily, the textile waste off cuts are used both as boiler fuel and as
feedstock for the manufacture of sofa sets and cleaning mobs.
4.2.5 The Plastics Cluster - Tarpaulin Manufacturer
The plastics cluster comprises of two companies. One of the plastic cluster companies
manufactures plastic tarpaulins from polyethylene and the other collects used PET bottles from the
surrounding community for recycling. The tarpaulin manufacturing company consumes an
average of 7,200 tons/year of polyethylene that results into the generation of 108 tons/year of non-
biodegradable plastic waste. This waste volume is currently being recovered for re-use in the
manufacture of plastic water tanks, chairs and jerry cans by a secondary company. Absence of this

115
plastic waste recovery mechanism would have meant that the company landfills into the
environment 108 tons/year of non-biodegradable plastic waste with serious environmental and
social impacts (Table 10).
Table 10: Tarpaulins Material Balance
Tarpaulin Manufacturing
Type of Raw Material Quantity (tons/year)
Inputs
Polyethylene 7,200
Desired Product
Desired Product 7,000
Generated Wastes
Generate Waste 108
This company’s plastic off cuts constitute waste that is re-processed on-site into plastic pellets for
sale to the secondary manufacturers of plastic water tanks, chairs and plastic containers (jerry
cans). This on-site re-processing of plastic off cuts into pellets has created 5 direct “green jobs”
with a total income of USD 1,000 per month. This practice diverts 108 tons/ year of non-
biodegradable plastic waste that could otherwise end up at a land fill or at the incinerator. The non-
degradable nature of plastics will have ensured that they visibly accumulate at the land fill for a
long time. A part from plastics being litter nuisances in the environment, they also do collect water
and at times act as mosquito breeding grounds that are responsible for the spread of Malaria that
affects the labor productivity of zone employees. Plastic waste recovery and reuse relieves pressure
on use of virgin raw materials and also eliminates the environmental risk of having to dispose of
non-biodegradable plastic waste into the surrounding environment.
The findings on the plastics cluster are similar to the OECD, 2009 conclusions that plastics
manufacturing units across are shifting towards better environmental performance through seeking
to reduce their material flows. According to the OECD, a more integrated approach to sustainable

116
manufacturing, will enable companies to increase their reuse and re-manufacturing potential. As a
result, the OECD concludes that the need for virgin materials can be drastically reduced through
the adoption of closed-loop production approaches that seek to maximize the recycling of materials
that already exist in the production system. The results also demonstrate how closed-loop
production distinguishes itself by “closing” the materials resources cycle. This implies that all
components that exist in the system are either reused, remanufactured, or recycled in some way.
However, recovery, reuse, recycling, and remanufacturing cannot be said to fully address all the
environmental concerns.
Good and desirable as they may look, their end processes will put some form of waste into the
environment. This is to say that, although industrial ecology can lead to a cyclic industrial
economy, further research work is required if it has to be fully equated to nature. These findings
on the plastic cluster also conform to UNEP, 2015 observations that a remarkable shift from
traditional linear and wasteful production methods to a circular and more efficient perspective in
which products and processes are designed with “reincarnation” in mind is desired. These findings
further conform to MacDonough and Braungart, 2002 conclusions that the need for virgin
materials is eliminated or drastically reduced, when waste is fully recycled back into the system.
4.2.6 The Plastic PET Recycling Company
The business operations of the plastic PET recycling company involves the collection of plastic
PET bottles from around the zone for on-site re-processing and eventual export to China. The
company collects an average of 360 tons per year of plastic PET bottles, shreds and pelletizes them
before packing them for export to China. The idea of collecting plastic PET bottles from the
surroundings is good for the environment. If left uncollected, plastic wastes are capable of blocking

117
drainage systems resulting in unnecessary floods that could affect human settlements as well as
infrastructure. This will directly or indirectly affect the operations of the zone. Unfortunately,
transportation of the shredded plastic waste over a long distance to China might not make good
environmental sense due to the associated generation of greenhouse gases (GHG) emissions during
their long haul transportation.
The findings on plastic PET recycling are similar to OECD, 2011 research conclusions that
observed that, by tapping into the large resource potential that exists in current waste stream, the
need for virgin materials and waste disposal could be significantly reduced. This conclusion is
anchored on OECD, 2011 life cycle thinking that goes beyond cleaner production to put emphasis
on the need for companies to look beyond conventional organizational boundaries when
considering the environmental impacts of their activities and associated products. This life cycle
thinking will entail taking into account the environmental impacts and responsibilities that arise
from the extraction of materials through to the design of products and production processes to the
eventual consumption disposal of final products. This study did not address environmental
challenges beyond the industrial clusters.
4.2.7 Darts Board Manufacturing Cluster
The main material inputs for manufacture of darts and darts boards included chip board, sisal, steel
wires and glue. Its main waste streams were chipboard saw dust, sisal waste and off cut steel wires
(Table 11). The primary manufacture of darts/ darts board in the zone generates 40 tons/year of
sisal waste that was being used for manufacture of sofa sets. Waste steel wires are sold out for
recycling while sisal waste is used in the sofa set industry. Though sisal waste is biodegradable,
any initiative that diverts it from the landfill is commendable. These findings on darts/ darts boards
cluster demonstrate a typical case for eco-innovation and is similar to Leiponen, 2005 observations

118
on the modalities of organizational change for eco-innovation. Leiponen, 2005 notes that the
organizational change triggered by eco-innovation increases the technical capability of the
company and drives its productivity as was demonstrated at the darts/ darts boards zone of the Athi
River SEZ. The identified sisal waste recycling initiative at the economic zone reinforces UNIDO,
2015 observations that the resulting learning, knowledge stock and creative processes leads to
enhanced technical capacity in waste recycling, a stronger and supportive skills base, and increased
employee engagement and involvement that is interwoven with key business performance
indicators of increased productivity and profitability.
Table 11: Darts Manufacturing Material Balance
Darts Board Manufacture
Type of Raw Material Quantity (tons/year)
Inputs
Chip Board 980
Sisal 936
Steel Wire 144
Total 2,060
Desired Product
Desired Product 1,710
Composite Wastes
Chip Board 204
Sisal 40
Steel Wire 7
The 204 tons/ year30 of chip board saw dust waste was used as steam boiler fuel in place of Fuel
Oil for the generation of 20 tons/ day of the company’s process steam. This eliminates the
company’s use of 13 tons/ year of fuel oil equivalent to a monetary saving of USD 15,050/year.
The associated respective emissions reduction levels are as calculated below:
30 Darts Board Production Manager Estimates

119
13 ton of Fuel Oil31 generates (13 x 3,228) = 41,964 kg CO2 e
204 ton of Biomass32 generates (204 x 183.9) = 37,516 kg CO2 e
This leads to a CO2 e reduction of (41,964 – 37,516) = 4,448 kg CO2e (equivalent to 11%
reduction) as a result of the fuel switch.
4.3 Assessment of the Application of Industrial Ecology Principles
This objective 3 sought to assess the application of industrial ecology (IE) principles in mitigating
the environmental challenges of the zone. The baseline assessment of the application of IE
principles at the Zone revealed an emerging but promising trend that if well nurtured can yield
positive development results. Economic, social, technical, information-related, policy related and
absence of key drivers for IE were listed as some of the challenges frustrating an accelerated uptake
of IE principles. The Zone’s application of IE principles in mitigating its environmental impacts
is currently at its infancy and concerted efforts from the zone authority, zone based companies and
the Government are required if this practice is to be widely adopted within the Zone. Use of an
eco-forum and CEO seminars where zone based companies can dialogue on matters of mutual
interest has successfully worked in Europe and Asia in securing top level commitment in
promoting IE principles (UNEP, 2015). There was also limited engagement of Government in
helping to create an enabling environment for the application of IE principles within the economic
zone.
The benchmarking of the four cluster operations of the economic zone against international best
practice as regards the application of Industrial Ecology (IE) principles in the key operation areas
of management (corporate policy, management involvement, management vision, and
31 Carbon Trust Emission Factor per ton of Fuel Oil 32 Carbon Trust Emission Factor per ton of Wood Pellets

120
environmental management); operations (plant operations, plant management, process operations,
employee motivation, innovation, transparency, supplier relations, risk management, external
partnerships and communications); and environmental aspects (environmental health and safety,
material utilization, and habitat management) revealed an outcome that is at the basic level 1 (Table
12). A lot needs to be done so as to enable the economic zone to graduate from red to green as
explained below. Progress from Red through Yellow to Green in the matrix (Annex 2) implies
adoption of a more comprehensive strategy that completely addresses the role of IE principles in
all dimensions of the zone’s sustainable development (SD) activities (WBCSD, 2002). This will
include zone management practices, operational activities as well as key environmental aspects of
waste and by-product exchange.
Table 12: Benchmarking Outcome of Baseline Performance of IE at the Economic Zone
Categories
and Elements
Rank Reason Recommended Policy Actions
Corporate
policy
Level 1 Zone company
policy is one of
compliance
with business
regulations
- The clusters should strive to develop proactive
corporate policies that seek to meet and exceed
compliance requirements
- Company policy should extend beyond
compliance with zone business regulations to
address potential liability issues.
- Systems should be put in place to monitor,
update, communicate, and implement policies.
- Company policies should be made proactive
and include environmental, economic, and
social aspects in all business decisions, e.g.
public policy, community relations, and social
development components.
Management
Involvement
Level 1 Management
approach is
reactive to all
business threats
- The management response to business threats
should be proactive and committed to the art of
continual improvement
- Management approach should anticipate and
address clear business threats – e.g. anticipates
future environmental permits.
- Management should be actively involved in
updating of environment health and safety

121
(EH&S) policy and introducing continuous
performance improvement systems.
Management
Vision
Level 1 The vision is
limited to
maintaining
compliance
with the
provisions of
the economic
zone’s
corporate
policy.
- Zone company management visions should go
beyond the zone’s corporate policy and involve
voluntary initiatives
-The vision should show a willingness to
introduce longer-term, voluntary initiatives. In
addition, at the Corporate level, Public Affairs
management should be perceived to be critical
to long-term business sustainability.
- Highly aligned at Corporate and Plant level
(e.g. Corporate policies should be fully
embraced at Plant level and short-term
Financial criteria are not as stringent).
Environmental
Management
Level 1 Environmental
assessment and
actions limited
to meeting
regulatory and
compliance
requirements
-Zone companies should embrace an EMS that
also incorporates community expectations
- Environmental activities should focus on
meeting specific environmental goals identified
via the implementation of a formal
Environmental Management
System (EMS)
- Neighboring communities and industrial
facilities should play an important role in
influencing environmental goals as part of an
overall Environmental Management System.
Plant
Operations
Level 1 Plant
environmental
initiatives are
control
oriented and
lack
management
support
- Zone companies should fully embrace
resource use efficiency, cleaner production and
industrial symbiosis.
- Operational initiatives should
promote eco-efficient
production, RECP, IS and general resource
conservation
-Plant management should be cognizant of
the triple bottom line and
incorporate aspects of
sustainability in operational
decisions
Plant
Management
Level 1 Management
only supports
discretionary
environmental
initiatives that
don't require
capital
investments
- Zone based companies should set up divisions
for resource use efficiency, cleaner production
and industrial symbiosis
- Management should support investments in
discretionary environmental investments and
comprehensive evaluation strategy is in place
- Independent division with
dedicated staff for evaluating
opportunities for waste recycling,

122
alternative fuels and raw materials
(AFR), and developing and implementing IE
relationships.
Process
Operations
Level 1 Operations staff
unwilling to
explore
waste
minimization or
pollution
prevention
(P2) activities
- Zone companies should be persuaded to invest
in cleaner production and industrial symbiosis
through training and demonstrations.
- Operations staff should value pollution
prevention and AFR efforts and should be
willing to explore such opportunities.
- As part of the R&D process,
Operations staff should actively participates in
exploring and implementing AFR substitution
opportunities.
Employee
Motivation
Level 1 No incentives to
explore new
opportunities in
increasing
profitability
– maintains
status quo.
- Zone based companies should use incentives
to promote and sustain employee interest in
cleaner production and industrial symbiosis
- Staff award programs for ideas that could lead
to increased productivity and/or process
efficiencies e.g. energy, material and water
conservation
- Compensation packages for managerial staff
directly linked with increased productivity
profits, or other performance measures through
AFR or other IE programs.
Innovation Level 1 No R&D
investments
For
environmental
Technology
upgrading.
- Zone based companies should invest in
funding R&D for accelerated uptake of cleaner
production and industrial symbiosis.
- R&D funding earmarked for innovations in
environmental technology initiatives leading to
economic benefits (e.g. using recycled material,
new and/or improved product and/or process
design)
- Opportunity assessments actively
pursued for innovative options in
AFR and/or other IE opportunities.
Transparency Level 1 Company
operations are
insulated and do
not promote
external
communications
- Zone companies should aggressively establish
networks for accelerated adoption of cleaner
production and industrial symbiosis.
- Company willing to discuss
Its environmental management initiatives
externally to identify cost-effective material
substitution or fuel replacement
- Company proactively establishes networks to
explore opportunities for waste exchange, AFR
and other IE opportunities on a zone-wide
basis.

123
Supplier/
Receiver
Relationships
Level 1 Company
purchases
conventional
fuels and raw
materials
through typical
cost-bid
process.
-Zone companies should promote long-term
relationships with suppliers that are sustainable
(green supply chain management).
- Company should have ad hoc relationships
with suppliers and receivers (companies
receiving waste and process by-products). No
long term or collaborative sourcing
arrangements.
-Company should have formalized, long-term
relationships with receivers (companies
receiving waste and by-products) and suppliers
and considers collaborating to optimize both the
supplier operations and the transport logistics.
Risk
Management
Level 1 Limited to
regulatory
requirement for
process
operations
- Risk analysis for handling, transportation, and
storage of AFR should be performed.
- Risk considerations broadly consider the full
range of negative and positive values of
establishing and maintaining an industrial
ecosystem.
External
Partnerships
Level 1 Very limited
external
partnerships
- Company should perceive its AFR, waste
recycling, and material substitution initiative
with outsiders as an economic incentive.
- Company uses its AFR and other material
substitution initiatives for strategic benefits by
establishing goodwill and strong relationships
with the regulatory agencies and local
community members.
Environmental,
Health and
Safety (EH&S)
Level 1 EH&S activities
focus is only on
compliance
with regulatory
and permit
requirements.
- EH&S principles should extend beyond
meeting regulatory compliance requirements -
proactive approach in risk management,
identifying waste minimization, waste
recycling, P2 opportunities
- EH&S activities include evaluations of the
EH&S implications of logistics management,
suppliers, contractors, and other external
organizations associated with company’s
operations.
Material
Utilization
Level 1 Material
utilization and
material energy
flow evaluation
only within the
plant boundary.
- Life Cycle Assessment
(LCA) approach should be used for a system
level material utilization and material energy
flow evaluations
- In addition to system level LCAs, material
utilization and energy flow evaluations, the
company considers a broader set of parameters
such as resource management issues and
stakeholder concerns.

124
Habitat
Management
Level 1 Resource
extraction and
other habitat
areas are
managed within
regulations
Habitat management and conservation of
biodiversity should be evaluated but considered
only within the span of control of the company.
Habitat enhancement or substitution should be a
key component of decisions on fuels and raw
materials and waste product utilization both
within the company and in partner organizations.
Interventions such as training, setting up of demonstrations and development of enabling policies
are required if the zone clusters benchmarked in (Table 11) can be enabled to migrate from the
mostly baseline Red status (level 1) to the desired green status (level 3) via the intermediary Yellow
status (Level 2) (WBCSD, 2002). The benchmarking results (Table 11) are largely consistent with
WBCSD’s past conclusions that many global companies are constantly re-examining their
business operations and relationships in a fundamentally new way. Such sustainable businesses
keep constantly seeking to integrate their pursuit of profitable growth with the assurance of proper
environmental protection and improved quality of life now and in the future (WBCSD, 2002). The
application of the seven industrial ecology (IE) principles at the zone is being hampered by
challenges that can be broadly classified as being economic, social, technical, information-related,
policy-related, as well as total absence of enabling drivers for IE uptake (Lowe, 2001; Roberts,
2004). Responses from zone based companies that engaged in waste and by-product exchange
pointed out hindrances and lack of key drivers to the adoption of industrial ecology principles.
These findings were found to be similar to those enumerated by Baumgarten & Nilsson, 2014 and
reinforced by Johnsen et al. 2015 (Table 12). Fixing of these challenges and the creation of an
enabling policy environment will help increase the productivity and competitiveness of the
economic zone (Baumgarten & Nilsson, 2014).
125
4.3.1 Challenges of engaging Industrial Symbiosis (IS) at the Athi River SEZ
Interviews with the zone based companies already practicing industrial symbiosis (IS) revealed a
wide range of economic, social and technical challenges of embracing the concept within the
economic zone. Many of the companies complained of a lack of zone wide policies and enabling
strategies for IS promotion. Given that the zone companies have a long history of operating singly
and not in partnerships, it will not be easy for them to master the art of collaboration within a
network setting. The zone authority had no means of rallying the tenant companies around a given
IS vision as the complex had no such vision in place. There were reported challenges with the long
distances separating the companies that were exchanging wastes and by-products as well as lack
of a one-stop-shop for offering advisory on RECP, 3Rs, IS and general green growth advisory.
The social challenges that were reported were either individual or organizational and included
mind set inertia that resists change, zone employees feeling reluctant to go out of their way to
embrace IS; lack of trust among the waste exchanging players, the IS players not seeing the sense
of collaborating while competing at the same time for the common good of the entire network, a
strong focus on the core mandate of the zone companies that does not prioritize sustainability, and
smaller companies not being keen on seeking IS projects in partnership with big companies. Other
companies expressed fears about the profitability of such IS partnerships, lack of access to long-
term and sustainable financing, and generally high investment costs in operationalizing waste and
by-product exchanges. Between zone companies, there was weak cross sectoral cooperation. Lack
of an up-to-date data base on raw material consumption, the accompanying products and generated
wastes and by-products frustrates interest in the economic viability of waste and by-product
exchange. It is generally difficult to tell if investments in industrial symbiosis will make good
business sense as there is no baseline data to justify this.

126
Most tenant companies recommended access to public grants that can enable them make green
investments for enhanced competitiveness. They operated with the belief that “going green” will
enable them access new markets that are stringent on environmental matters. The companies also
recommended stronger partnerships with research institutes and academia for purposes of
promoting innovations through R&D. The zone tenant companies recommended the recruitment
of a well-respected industrialist from within the zone and has already practiced IS and is convinced
that it makes good business and environmental sense to act as an IS champion in promoting the
concept among the zone peers. They felt that such an approach is much more convincing and
attractive to the private sector. The zone’s waste and by-product recovery and recycling
infrastructure needs upgrading. Such an upgrade will help improve on the coverage of waste and
by-product exchange through IS. An aggressive and interactive synergy building sessions should
be promoted by the Zone Authority among the tenant ranks. An overarching strategy for the
development of a circular economy driven by IS should be developed with the active participation
of all the zone companies.
There should be strict enforcement of Zone regulations in a manner that encourages on-site reuse
and recycling of wastes and by-products. Charging land fill disposal fee on the basis of weight will
encourage companies to minimize waste generation at source. The consumer should be enabled to
make an easy and informed sustainability choice through eco-labelling. This should be anchored
within a broader green procurement framework for the economic zone promoted by the
Government that is the greatest buyer of goods and services. The tenant companies were in dire
need of training on emerging contemporary tools of environmental management such as RECP,
the 3Rs, and IS. This will raise the zone’s awareness on the need to develop waste and by-product
synergies using industrial symbiosis (IS). The zone’s industries are eager to see the evolution of

127
new industries that are actively involved in waste and by-product recovery, reuse and recycling.
Above all, trust was taken as the cornerstone of successful synergy building for improved industrial
symbiosis.
The findings demonstrated that tenant companies of the economic zone were just beginning to
embrace the principles of Industrial Ecology (IE). This is largely being driven by the prevailing
market forces of supply and demand. These findings are consistent with Ehrenfeld and Gertler,
1997; Saikku, 2006, who concluded that companies that embrace Industrial Ecology are those that
deliberately attempt to (i) connect waste and by-product streams into closed loop ecosystems; (ii)
continuously seek to balance their raw material consumption, waste generation and resultant
emissions with the carrying capacities of the surrounding environment; (iii) retrofit industrial
processes to make them energy and resource use efficient; and (iv) are in constant consultation
with the surrounding communities while designing their social responsibility programs.
These developments are just beginning to take shape at the economic zone. Just as was pointed out
by Chertow, 2008, the adoption of closed loop production systems at the economic zone can only
be through material recovery, reuse and recycling, optimization of the efficient use of materials
and energy, embracing of cleaner production to minimize waste generation at source, and adoption
of industrial symbiosis to handle inevitable residual waste. Both UNEP, 2011; and UNIDO, 2015;
recommended that the successful adoption of IE principles requires awareness raising, training and
setting up of demonstration projects. These findings are consistent with Lowe, 2001 and Roberts,
2004, who separately concluded that the application of IE principles should target to improve the
total environmental quality of the zone while satisfying its economic and social needs in a win-
win situation. This is in line with (Mirovitskaya & Ascher, 2001) definition of total quality

128
environmental management (TQEM) as a business strategy that seeks to incorporate
environmental protection and energy efficiency in all aspects of business operations and at all
levels of a company, based on the assumption that both environmental quality and product quality
are directly linked to long-term economic zone’s profits.
(Mirovitskaya & Ascher, 2001) observed further that achieving total quality environmental
management (TQEM) requires zone companies to integrate certain basic principles into their
overall business strategy. These principles include (i) adoption of an environmental policy that
seeks to eliminate pollution based on life-cycle assessment of the firm’s operations and
communicating the policy throughout the company and to corporate stakeholders; (ii) objectively
assessing the effectiveness of environmental programs; (iii) comparing the company’s
environmental performance to that of leading firms in the industry through benchmarking and best-
practice assessments; (iv) promulgating a company view that environmental performance is the
responsibility of all employees; (v) analysis of the impact of environmental issues on the future
demand for products and the competitive economies of the industry; (vi) encouraging frequent
discussion of environmental issues and activities at board meetings; (vii) developing and applying
a formal system for monitoring proposed regulatory changes and for complying with changing
regulations; (viii) routinely conducting environmental due diligence on potential acquisitions; (ix)
developing budgets for environmental expenditure so that the firm does not incur surprise expenses
that materially affect profitability; and (x) identifying and quantifying environmental liabilities
from past operations and developing plans for minimizing them. The zone authority is not yet
engaged fully in promoting this structured approach to environmental stewardship. An in-depth
assessment of how the Zone operations conform to the seven principles of IE as laid down by
(Lowe, 2001) and reinforced by (Roberts, 2004) revealed the outcomes shown (Table 13).

129
Table 13: Conformance of the Zone Operations to the Principles of Industrial Ecology
IE Principles Status of the Athi
River SEZ
Conformance to the
Principles
Proposed Improvement
Promotion of opportunities for
establishing real and genuine
partnerships and engagement
schemes with communities and
Government in developing a
more responsive attitude to
promoting sustainable industrial
development practices
No evidence of such
an opportunity at the
zone
The creation of the triple helix
collaboration that brings together
industry, Government, communities
and academia will help strengthen
engagement partnerships through
eco-innovation. The capacity of the
Zone Authority should be
strengthened through the creation of
a “Green Cell” within it.
Locating industries strategically
to optimize the capture and
concentration of by-products,
waste material flows and energy
surplus for use by other
industries in close proximity
Company location in
the zone not
informed by
industrial symbiosis
The development of green economic
zone master plans will guide the
zone planning and facilitate easy
incorporation of resource use
efficiency and cleaner production
(RECP) before adopting industrial
ecology. The Zone Authority with
the assistance of triple helix
stakeholders and communities
should develop a green zone master
plan that prioritizes the setting up of
industrial clusters that have
infrastructure for by-product, waste
and energy exchanges
Co-locating or zoning industries
that will benefit economically
from trade or exchange of
wastes, by-products and energy
Companies that can
exchange wastes and
by-products are not
co-located. Even
with this, and due to
the prevailing
market forces,
distant companies
are exchanging
wastes and by-
products.
The zone companies need an inter-
firm communication platform for
sharing information on which wastes
are available and who needs them.
Clusters that comprise of companies
that can exchange wastes and by-
products should ideally be co-
located.
Providing a catalyst to help
create synergies and an
environment for fostering
technological advancement in
Cleaner Production, resource
use efficiency, waste
No evidence of such
synergies at the zone
Eco-innovation is only promoted
through demand driven R&D that is
spearheaded by academia and jointly
funded by Government and the
private sector. The Zone Authority
as well as the proposed “Green Cell”
130
management and sustainable
industrial development
should strengthen their working
relationships with the Kenya
National Cleaner Production Center
(KNCPC), Kenya Industrial
Research and Development Institute
(KIRDI) and academia for purposes
of advancing Cleaner Production
and transfer of environmentally
friendly technologies.
Providing appropriate “smart
infrastructure”, to ensure the
growth of eco-industries that
support sustainable industry
practices to maintain high levels
of innovation as the basis for
increased productivity and
competitiveness.
No such “smart
infrastructure” exists
at the zone
“Smart Infrastructure” should
provide for waste and by-product
storage, transportation, exchange,
segregation, and recovery, reuse,
and recycling before final disposal.
The Zone Authority should establish
this “smart infrastructure” with
active participation of academia and
research institutes to promote eco-
innovation for increased
competitiveness.
Supporting industry promotion
policies and incentives to
encourage innovation,
collaboration and
commercialization of new and
improved product developments
using materials, water and
energy surplus to production
There is no such
enabling policy
framework for the
economic zone
The Zone Authority should work
with the Government and other
stakeholders to develop a cluster
promotion policy that has incentives
for industry collaboration and
commercialization of green products
Demonstrating commitment to
the benefit of industries that
have strong, sustainable
industrial development projects
and programs
There was no
evidence of such a
policy commitment
The Zone Authority should establish
an award scheme for zone
companies that excel in
sustainability issues based on a clear
benchmarking criteria for continual
improvement
The zone’s incorporation of industrial ecology principles in its mitigation of its environmental
impacts is at its infancy. In order to fully embrace these IE principles, Roberts, 2004; Desrochers,
2004 recommend a systematic, comprehensive, and integrated review of all the components of the
economic zone and its interaction with the biosphere; the complex patterns of material flows into
and out of the economic zone, as opposed to focusing on single flows; and acknowledging the
importance of technological dynamics in driving the long-term evolution of a sustainable industrial

131
ecosystem. Because the adoption of industrial ecology principles is at its infancy at the economic
zone, its successful evolution should be informed by best practice experiences that have worked
in Europe and Asia. According to (Koenig, 2009) an eco-forum will act as a regular meeting venue
for zone based companies. Such meetings are normally held to share information on development
issues relevant to the entire economic zone. According to (UNIDO, 2015), it will also serve as the
dissemination point for information on best practices in management and eco-efficiency, for
regular updates on applicable laws and regulations, and to link stakeholders up. To establish an
eco-forum in an economic zone with little or no common activities between companies and the
zone authority, (Koenig, 2009) recommends the use of the six step approach:
Step 1. Getting to know the zone companies;
Step 2. Creating a platform for dialogue;
Step 3. Developing partnerships;
Step 4. Developing a forum for Champions;
Step 5. Initiating cluster activities;
Step 6. Sharing the results.
According to Koenig, 2009 this eco-forum should act as an opportunity for open dialogue among
zone members. Senior Executive seminars on sustainable business targeting non-technical and
non-environmental senior management drawn from finance, planning, procurement, sales,
marketing, and production are recommended (UNIDO, 2015). Targeting key-decision makers’
within companies, these one-day seminars bring to life the business potential of sustainability,
encompassing innovative approaches to product design, process improvement, management and
the adoption of new business models (UNEP, 2011). According to (Shi et al. 2012), these seminars
cover key topics such as strategy, productivity, management and marketing. (UNIDO, 2015)

132
recommends the creation of sustainable business networks among zone CEOs. The CEOs have the
chance to network for business purposes, while also paying attention to a variety of real success
stories illustrating different aspects of sustainable business development (UNEP, 2011).
4.3.2 Key Players in SEZ Promotion
The key players within a SEZ are the Government, the Regulator, the developer, and operator
whose primary responsibilities are as stated based on the EPZA’s records (Table 14). Constant
consultations among these key players is essential for promoting the ideals of sustainability within
the economic zone.

133
Table 14: Stakeholder Primary Responsibilities in a SEZ program
Stakeholder Primary Responsibilities
Government a) Involved in executing strategic plans for SEZs;
b) Helps in selecting appropriate economic zone site(s) and
packaging/ zoning land parcels; develops and publishes land use
guidelines in consultation with stakeholders;
c) Conducts initial feasibility studies;
d) Selects developer(s) and enters into zone development
agreements with them;
e) Develops offsite infrastructure (offsite infrastructure is the
responsibility of the host government);
f) Supports training/ capacity building/ workforce development and
provision of social services;
g) General regulation and administration of the SEZ program;
Regulator Designates SEZs: Designates public and private land as special economic
zone (SEZ) and their agents as SEZs developers/operators;
Facilitates government services: Facilitates licensing, permitting, and
regulatory services within the SEZs, particularly relating to land use,
business licensing, environmental permitting, building permitting, labor
regulation (including foreign work permits), site inspections; which may
also include business registration, utility regulation, and dispute
resolution; The regulator may set fees commensurate with the cost of
service delivery in the areas concerned;
Monitoring compliance: Monitors compliance with the SEZs legal
framework, including SEZ policies, regulations, standards, and other
requirements, and enforces compliance through appropriate penalties
independently from other public agencies.
Developer Land use planning: Creates a final land-use master plan and prepares the
land accordingly (grading, leveling, and other preconstruction activities;
Provision of infrastructure: Internal road networks, drainage and
sewerage, and conduits and infrastructure for zone utilities.
Operator Facility leasing: Manages lease and rental agreements with investors and
assumes responsibility for the main services of the zone (e.g.,
maintenance, security, waste management);
Utilities provision: Ensure provision of onsite utilities (electricity, gas,
water, telecommunications) through own provision or via domestic
providers;
Provision of other value added services: May include a wide range of
services, such as business and training centers, medical and child care
services, transport, and recruiting;
Marketing: Experienced private developers often have a network of
multinational clients across a range of industries to which they can market
new SEZ opportunities.
Source: Farole, 2011

134
4.4 The Management Model of the Athi River SEZ
There is currently no gazetted regulation that limits the type of business activities by economic
zones. The Ministry of Industry, Investments and Trade together with the Zone Authority with the
support of other interested stakeholders have developed a draft SEZ regulation that is awaiting
gazettement33. These draft SEZ regulations creates new institutions that will help strengthen the
environmental governance of the country’s zones if their responsibilities are reviewed to inject in
the ideals of green growth. According to the draft SEZ regulations, the zone authority has the
power to consolidate, combine, and replace all approvals and associated procedures required by
other relevant Government entities, including all regulations, licenses, permits, certification and
similar approvals, as necessary to reduce the overall number or complexity of such documents. As
much as this contributes to the desired ease of doing business, the consolidation of all
environmental licenses, permits, and certification requirements into a single SEZ Environmental
Permit, leads to enforcement conflicts in the sense that, when there is a pollution problem in the
zone, the blame is squarely directed to NEMA without recognizing that NEMA can only enforce
the law through the Zone Authority that in this case is the lead agency. It is therefore the duty of
the Zone Authority to rally resident companies to meet and even exceed the set environmental
standards. As currently constituted, the Zone Authority does not have this capacity.
The draft SEZ Regulation permits the secondment of personnel with appropriate skills and
experience from Government entities to the Zone Authority to assist it in performing its functions
through a signed MOU. This arrangement can be exploited to facilitate and strengthen the triple
helix collaboration among research institutes, universities, industry and Government for purposes
of promoting eco-innovation research for green growth. In order to strengthen the Zone
33 Draft SEZ Regulations published by the Ministry of Industry, Investments and Trade and the Export Processing Zone Authority (EPZA) and other stakeholders

135
Authority’s capability in advancing low-emission, resource use optimization and socially inclusive
development pathways, the creation of a “Green Cell” to strengthen its green growth capability is
proposed. As already stated, the “Green Cell” will be responsible for organizing awareness raising
and capacity building sessions on resource efficient cleaner production (RECP) and Industrial
Symbiosis (IS) practices; introducing focused RECP and IS improvement programs; partnering
with donor agencies to help zone companies conduct detailed energy, water, and material audits;
developing new standards, protocols, and guidelines as necessary to improve energy, RECP, IS
and resource performance; providing the necessary technical assistance, knowledge, and
information support to industries for reviewing their RECP and IS improvement plans; facilitating
access to finance for RECP and IS by partnering with banks/ national/ bilateral/ international green
funds; and identifying potential options for IS and inter-company collaboration (World Bank,
2014).
The draft SEZ regulations provides for a one stop shop (OSS). The OSS provides for the delivery
of business advisory services based on appropriate research and SEZ user demand for services.
Demand driven services within the SEZ include assistance with start-ups, operation, and closing
of economic activities within the SEZs; technical assistance programs for new and young
entrepreneurs; business training, general assistance and counselling; feasibility studies and market
research; capitalization and grant assistance; information on production, marketing, operational
plans, finance, export opportunities, recruitment and training; and financial support for domestic
small businesses. One of the topics that should be covered under training should be on low-carbon,
resource efficient cleaner production (RECP) as well as industrial symbiosis for increased
productivity and competitiveness (UNEP, 2014). The training content should cover GHG
inventorying and improvement target setting, good housekeeping, input material change, better

136
process control, equipment modification, technology change, on-site reuse and recycling, making
of useful by-products and product modification (UNIDO, 2014). The inevitable residual waste
after RECP will be subjected to industrial symbiosis exchange. Opportunities for financial support
for zone based companies to cut costs and remain competitive can be obtained from the Kenya
Climate Change Fund, bilateral green funds as well as international sources such as from the
UNFCCC’s Green Climate Fund (GCF).
The Zone Authority is mandated with draft SEZ regulations to ensure that all master plans and
zoning plans do not conflict with existing land use controls for the areas surrounding the SEZs or
related development objectives of the neighboring county. It is the Zone Authority’s mandate to
issue orders providing procedures and criteria for approving or rejecting land use master plans and
zoning ordinances developed by SEZ developers or operators. The Zone Authority in coordination
with NEMA, shall implement rules and procedures for assessing responsibility for handling and
investigating non-compliance, for taking action to mitigate the impacts, and for initiating and
completing corrective and preventive action. The Zone Authority shall then issue orders to
responsible parties implementing all recommended and necessary corrective and preventive
actions. The Zone Authority shall be responsible for enforcing compliance with the corrective and
preventive action orders by ensuring that all actions are undertaken within deadlines specified in
the orders. There is no gazetted regulation that limits type of business activities by industrial parks
in Kenya. What is in place is a draft SEZ regulation that introduces new institutions such as the
SEZ Advisory Committee, SEZ Association and Business Development Services (BDS) support
that will help strengthen the economic zone governance capabilities. However, these draft SEZ
regulations are weak on the promotion of environmental stewardship and do not address the
country’s need to promote green growth by prioritizing low-emission, resource use optimization

137
and socially inclusive and climate resilient development pathways. There is in-sufficient post park
management system support that targets resident industries in their collective efforts of continual
improvement. The South Korean Government has demonstrated that well managed industrial parks
do provide support services to tenant companies that individual companies cannot secure
independently in a cost effective manner in form of well-done roads, electricity and water, as well
as environmental installations such as waste water treatment and disposal plants that are
collectively built and provided for by the public sector in advance to enable tenant companies
lower their overall investment costs (KIET, 2016). Though the same approach is mirrored in
Kenya, field inspections revealed that there is a mismatch between the level of industrialization
within the zones and the accompanying support infrastructure.
There is need for a well-structured approach to the establishment of SEZs/ IPs in the country. Such
an approach will involve developed guidelines on selection of locations, establishment of industrial
complex development plans, approval of industrial complex development plan, compensation, and
creation of industrial complexes (KIET, 2016). Although the country has developed draft SEZ
regulations, they are not comprehensive enough to offer guidance on low-carbon, resource
efficient and climate resilient development pathways. There are no particular incentives for
companies that want to fully embrace green growth by adopting RECP and IS. As a result, a “Green
Cell” is proposed to augment the Zone Authority’s capability in green growth advisory support.
The draft SEZ regulations do not talk about the need to undertake a strategic environmental
assessment (SEA) that is increasingly becoming popular with planned industrial parks/ SEZs as
per the provisions of section 57A of the Environmental Management and Coordination
(Amendment) Act 2015 that states …. All policies, plans, and programs determined by NEMA as
likely to have significant effects on the environment … shall be subject to a strategic environmental
138
assessment (SEA). SEA comprises of analytical and participatory approaches that aim to integrate
environmental consideration into policies, plans, and programs and evaluate the interlinkages, with
economic and social considerations34. According to NEMA, the SEA process extends the aims and
principles of an EIA upstream in the decision making process, beyond the project level, when
major alternatives are still possible (UNEP, 2002).
Benchmarking of South Korea’s industrial parks with those of Kenya reveals important differences
that can inform Kenya’s industrialization policy. Kenya’s industrial development complexes tend
to be small in size, dispersed around the country and located around logistical urban centers. In
order to promote knowledge intensive industries using high quality work force, larger sized
industrial complexes are preferred and should be developed around metro areas where labor
sourcing is easy35. Apart from providing an enabling physical infrastructure such as transportation,
power, and a reliable water supply, the industrial park should also provide pertinent innovation
infrastructure that revolves around a strengthened University/ Research Institute – Industry –
Government collaboration that will permit industry easy access to Universities, laboratories and
specialized research institutes. The Kenyan SEZ development “land use plan” exclusively allow
uses of the sites only for factories and warehouses. This restriction should be lifted to allow uses
of the sites for residential, commercial as well as multi-cultural facilities (KIET, 2016). The
country’s industrial location policy in SEZs/ IPs should be cluster based while also embracing
other urban development rules for green growth. A techno-park model of industrial development
is recommended for Kenya. It is a concept of planned industrial development that includes
34 NEMA – National Guidelines for SEA in Kenya 35 Korea Institute for Industrial Economy and Trade – KIET, 2016. Knowledge sharing program with Kenya through Senior Policy Dialogues

139
technology, R&D and space in which universities, research institutes and enterprises gather and
closely collaborate with one another (World Bank, 2014).
The country’s draft SEZ Regulations do provide for the establishment of an advisory committee
for each of the country’s SEZs. Its membership is drawn from the relevant county and local
authorities; SEZ developers, SEZ operators, SEZ enterprises and representatives from an
established SEZ resident associations from adjacent communities. This Advisory Committee will
be the best forum in which issues of RECP and IS can be discussed in a manner that justifies the
business sense of embracing it. In other words, it should be the responsibility of this advisory
committee to champion for the uptake of RECP and IS whose successful implementation will help
create green jobs that will benefit the surrounding communities. Unfortunately, this is not one of
the listed functions of this advisory committee. According to the draft rules, these advisory
committees will perform the following rules and responsibilities: advising on the development of
the SEZs; organization of fairs and market days for local job seekers; supplier-buyer match-
making, and other mechanisms for fostering linkages with the surrounding economy and culture;
locating sources of assistance for development of the SEZs; coordinating the connection of the
SEZ to infrastructure networks in the adjacent areas; disseminating information to the public
regarding the SEZ program in general, as well as regarding the specific SEZ in their locality;
promoting investments in the SEZ; contributing to proper security and policing in the SEZ;
devising and promoting activities linked to the SEZ for the benefit of the local population,
including as regards the production and supply of raw materials, miscellaneous products and
services, and food stuffs for SEZ users; assessing and reporting on any difficulties in the operation
of the SEZ in their locality; and advising on the resolution of implementing stated problems.

140
Learning from the experiences of the EU and South Africa, one of the key recommendations that
this advisory committee can make to the Kenyan SEZs is the need for them to embrace RECP and
IS clubs in helping to disseminate best practices as regards RECP and IS methods, approaches,
and techniques36. A RECP and IS club is a regional community made up of industrial companies
who are willing to independently study best practices and techniques of RECP and IS, apply them
in companies, reduce production costs and negative environmental impacts resulting from their
activities and increase their profits (SCU, 2013; WCG, 2013). The EU’s RECP and IS experiences
demonstrate that club members benefit through having complete access to information concerning
the world’s best practices, innovative techniques, best managerial approaches; improving the
qualification and competence of the company’s staff; reducing the environmental impact produced
by the company; reducing the company’s operating costs by increasing its productivity and
efficiency; promoting the goods and services of the company (through activities organized by the
RECP Clubs, media and communication with the Clubs’ members)21; sharing practical experience,
ideas and possibilities with other like-minded people and professionals; getting a chance to become
a part of progressive-thinking, innovative community, creating your own success story (SCU,
2013; WCG, 2013).
The RECP and IS club member companies will benefit from professional assistance from the team
of national experts on how to implement RECP and IS approaches; methodological guidelines and
manuals; sharing experiences with other members of the clubs and the program experts; and an
opportunity to take part in a series of module-based seminars on topics such as environmental
profiting of the company; energy efficiency; industrial symbiosis; water consumption and
withdrawal, materials use and waste generation; chemical substances and emissions; and making
36 Primer – Resource Efficient and Cleaner Program in Belarus - 2015

141
action plans for RECP and IS implementation21. The SEZ advisory committee should embrace this
approach while seeking to accelerate the adoption of RECP and IS in Kenyan SEZs. In order for
this SEZ Advisory committee to promote IS successfully, China presents very relevant and
workable solutions. According to the Chinese experience, the sequential steps of establishing an
IS network according to the Chinese experience that is borrowed from the UK is to firstly recruit
new business members; secondly, facilitate exchange of information between businesses through
quick win workshops; thirdly, undertake resource mapping to record resources and facilitate
potential matches/ synergies; fourthly, develop an on-line tool for symbiosis management detailing
information on resources and contact details; fifthly, facilitating synergies through negotiations
and technical advice; and sixthly, summarizing output and verifying inputs (Lei, 2006; Geng et al.
2012).
This SEZ Advisory committee should champion for the assessment of low-carbon resource
availability, for example the potential for generating and/or sourcing renewable power in the
economic zones; incorporation of low-carbon considerations into industry and technology
selection for enterprises and utilities within the SEZs – performing global benchmarking studies
for the same; establishment of infrastructure and logistics to maximize the potential for industrial
symbiosis opportunities; incorporation of GHG, energy, water, and waste management reporting
within the overall framework for performance reporting; and selection of skilled employees with
experience in operating sustainable industrial processes (World Bank, 2014). The guiding
principles should be articulated for both Zone Authorities and enterprises. In addition, planning of
new processes should be based on global best practices (UNEP, 2014). The proposed SEZ
Association in the draft SEZ regulations should ideally spread the message that economic zones
that attract green foreign direct investments (FDIs) are those that are low-emission, resource

142
efficient and socially inclusive by virtue of their ability to create decent green jobs (UNEP, 2014).
The proposed SEZ Association within the SEZ Regulations will be established as a non-profit
organization consisting of SEZ developers, operators, sub-developers and sub-operators,
specialized service providers, and SEZ enterprises. The Association will be directed by a General
Assembly of members and managed by a 15 member board of Directors elected for two year terms,
including a President, Executive Vice President, Secretary, Treasurer, and Directors representing
specific investment sectors. As stated in the draft SEZ regulations, the mission of the SEZ
Association shall be to promote its members development and competitiveness in the international
market place.
The goals of the Association will be to represent and defend the interests of the SEZ program and
to promote an enabling climate for its development and to position Kenya’s SEZs as the country’s
economic growth engine and to contribute to making the country an ideal destination for foreign
investment as well as the production of world class goods and services. By virtue of its strong
governance structure, the proposed SEZ Association with the help of the SEZ Advisory Committee
should lobby to bring on board the political leadership of the country, along with relevant
Ministries, to formulate a unified vision for low-carbon industrial development and translate this
vision into a national policy for economic zone design and development (World Bank, 2014). To
accomplish these goal, this SEZ Association shall participate in various business, trade,
investment, industry, management, economic, and vocational training organizations and bodies;
and conclude institutional arrangements with bodies that enhance SEZs’ vocational training, labor
relations climate, social responsibility, and Government policy; raise knowledge about and
promote investments in its member SEZs; and secure benefits for its members from various parties.
In order to realize this noble and ambitious goal, the SEZ Association must lobby Government to

143
review the draft SEZ Regulations and include in them the provisions for the country’s green growth
agenda that is currently the bedrock for accelerated green FDIs. The Association should lobby
Government for the establishment of incentives that will make it attractive for the current economic
zones to become low-carbon zones (LCZs).
There was no deliberate attempt by the Kenyan zone authority to create an enabling policy
environment for the growth of its embryonic clusters as was successfully done in the EU, China,
Japan, South Korea and South Africa through the creation of cluster based technology service
centers, supporting the development of export networks, promoting the use of incubators, investing
in cluster-based R&D, creating policies that support and encourage clusters rather than prevent
and discourage them from emerging, encouraging cluster collaboration and cooperation in formal
networks, creating and supporting communication channels, re-organizing service delivery
structures and information delivery services, creating entrepreneurial support and learning
networks, using clusters as a context for learning, promoting the development of cluster skill
centers, stimulating innovation and entrepreneurship, creating enabling financial vehicles,
allocating resources and investments, and promoting competitive funding programs (Ghali et al.
2014; MELE, 2013). Embracing the actions explained below will help Kenya nurture successfully
its embryonic clusters the way it was done in Asia and Europe (World Bank, 2009). A total of 20
waste recovery and material recycling jobs have been created at the economic zone as a result of
innovative interventions in waste recovery and recycling.
The conceptual framework of this model is premised on the fact that the Zone Authority alone
cannot be able to fully drive the green growth agenda of the economic zones. It there calls for
development of partnerships that seek to strengthen the Zone Authority’s capacity to drive the

144
green growth agenda. As stated in the model this is achieved through the strengthening of the triple
helix collaboration between Academia/Research Institute-Industry-Government collaboration.
The key role of knowledge institutions is to undertake demand driven research that will help the
economic zone adopt best practices of waste and by-product exchange. The “Green Cell” whose
main purpose will be to help strengthen this triple helix collaboration will also seek to work with
parent ministries as a way of seeking to influence policy development from a green growth
perspective. The “Green Cell” will also work with financial institutions with a view to encouraging
them to develop low interest loans for green growth through their sustainable financing initiatives.
A cluster wise approach is adopted as a way of improving the spatial planning of the economic
zone to facilitate easier waste and by-product exchange. The ultimate goal is to divert wastes from
the landfill and instead use them as raw material inputs for another production line through
industrial symbiosis. The aim of waste management within a green economic zone is to combine
different production processes, industries and enterprises together through resource sharing, by-
product exchange and waste symbiosis, with a view to realizing a closed loop flow of materials.
The proposed governance model of the Athi River SEZ is based on a strengthened triple helix
collaboration framework. The study proposes the creation of a “Green Cell” that will be housed at
the Zone Authority with the sole purpose of strengthening the Zone Authority’s capacity in
promoting green growth through resource use efficiency, cleaner production, industrial symbiosis
as well as working to minimize the generation of climate changing GHGs. The “Green Cell” will
among other activities promote the Zone’s green growth agenda and climate resilient development
pathway on a cluster-wise basis. This is realized through a continuous search for waste and by-
product exchange synergies among all the economic zone’s clusters. In order to strengthen its
R&D capabilities the “Green Cell” will partner with knowledge institutions in form of

145
Universities, Research Institutes, and specialized centers of excellence (Figure 11). This
strengthened University/ Research Institute-Industry-Government collaboration will create an
innovation ecosystem that will drive the Zone’s green growth agenda. It will be the sole
responsibility of the “Green Cell” to not only promote RECP among the zone clusters but also
accelerate the uptake of IS trough: (i) building of IS networks; (ii) facilitation of exchange of
information between businesses; (iii) mapping of zone wide resources; (iv) facilitating of potential
matches/ synergies; (v) creation of an online symbiosis management tool; (vi) facilitation of
company negotiations and provision of technical advice; and (vii) verification of outputs (Shi,
2010). Feedback from the implementation of RECP and IS will inform policy development at the
country’s Ministry of Industrialization. Financial institutions will also be engaged so that they can
help operationalize the emerging sustainable financial initiatives.
For a special economic zone (SEZ) to operate in a green way, it has to establish and make
functional an enabling waste and by-product exchange infrastructure. Such infrastructure will
broadly comprise of enabling support institutions, a functional and interactive industrial symbiosis
network, and a supportive governance structure. An environmental service center, a technology
service center, and an information center all operating under the umbrella of a “Green Cell” will
constitute key institutions that will be entrusted with the Zone’s green growth. The “Green Cell”
will also benefit from the triple helix collaboration with Research Institutes and Universities. As
zone industries consume raw materials, water and energy, they will generate a wide range of wastes
and by-products. Some of these wastes and by-products will be recycled on-site with a residual
fraction being forwarded to the waste exchange center. This waste exchange center will operate
on the strength of an information platform and data base that helps to build synergies between
waste generators and those who need the waste for use as their raw material feedstock. A

146
technological infrastructure is required to smoothly facilitate these waste recovery efforts. The
exchange of wastes and by-products through an information platform and data base will help divert
useful materials from being landfilled. This will not only lower pressure on the use of virgin
materials but also reduce the negative environmental impacts of landfilling. Governments, Zone
Administrators, the market environment, enabling laws and financing mechanisms should jointly
work together to promote industrial symbiosis.
The Athi River SEZ does not have a management model that is capable of driving it towards a
low-emission, resource efficient, and climate resilient development pathway. Such a model should
ideally comprise of a set of management objectives, an accompanying management content, an
enabling implementation environment, and a monitoring and evaluation framework37. The study
proposes the creation of a “Green Cell” to be based at the Zone Authority for the sole purpose of
promoting resource efficient and cleaner production (RECP) and Industrial Symbiosis (IS) among
the identified clusters of the zone. The management objectives of the Green Cell will target
efficient utilization of the zone waste as a resource so as to demonstrate it’s economic,
environmental, social, and public health benefits. The Green Cell’s management content will
address issues of comprehensive management of generated zone waste through source reduction
at enterprise and zone-wide levels; how recycling can be optimized through proper waste
collection and categorization; how useful wastes and by-products can be re-generated from the
common waste pool through useful material recovery, on-site material and energy conversion, and
adoption of environmentally sound technologies for managing emissions from landfills and
incinerators. All these noble actions can only work successfully in an enabling environment of
37 UNIDO, 2013. China Center for South-South Industrial Cooperation – Guidelines for Green Industrial Parks

147
supportive laws and regulations, functional management systems, adequate technological support,
and an up to date information exchange platform that are non-existent at the zone at the moment20.
An independent waste exchange clearing house should be established at the zone to facilitate
companies that embrace industrial symbiosis through matchmaking and synergy building;

148
Investment facilitation and infrastructure support Resolution of trade/ business queries/ disputes
Performance monitoring Performance Reporting
Resource efficiency, CP, IS Resource efficiency, CP, IS
Performance Management Performance Reporting
Cleaner technology business
+ Capacity Development
Key
Existing information flow
Proposed information flow
Figure 11: Industrial Ecology Model for the Athi River SEZ
Special Economic Zone Authority
Zone Enterprise Clusters Identified training and education needs
Identified benefits of collaboration Learning to commercialize eco-innovation findings
Agro Processing
Garment Plastics Darts Board
Green Cell for Resource Efficiency, Cleaner Production, Industrial Symbiosis and Low-carbon
Activities Knowledge Institutions Tenant zone industry training and eco-innovation promotion, Determine benefits of collaboration, market driven applied research on resource efficiency, cleaner production and industrial symbiosis
Joint Working Group Generate joint Green Growth mission statement
Establish criteria for membership and funding Identify common green growth goals
Establish a consensus based decision making process
Green and Competitive Clusters
Cleaner Technology Service Providers / Consultants
Ministry of Industrialization and Enterprise Development
Financial Institutions
Resource efficiency CP + IS Policy

149
4.5 Policy Implication of RECP and IS Promotion on Kenya’s Green Growth Agenda
This study sought to investigate the possibilities for waste and by-product exchange among the
resident companies of the Athi River SEZ. The investigations established that though not planned,
the art of waste and by-product exchange was on-going among the zone’s four clusters, namely
agro-processing, plastics, garments, and darts board manufacturing. These are the initial stages of
an emerging and promising circular economy whose successful development will depend on how
well the Government develops enabling policies and strategies. There is strong international
consensus that linear economic models can only function if endless resources are available to
satisfy endless and increasing demand. The objective of a circular economy is to preserve the value
of utilized resources and materials for as long as possible, to use them as frequently as possible,
and to produce as little waste as possible (ideally none at all) (Wilts, 2016). On-site reuse and
recycling of wastes and by-products will divert them from the landfill and fundamentally reduce
pressure on the country’s use of virgin resources. This will help create new and innovative products
from wastes, reduce the environmental impacts associated with landfilling and also create green
jobs. This will contribute strongly to the country’s green growth agenda that is spelled out in the
draft Green Economy and Strategy Implementation Plan (GESIP). The country’s green growth
agenda puts priority on development pathways that are low-emission, resource efficient and
socially inclusive in terms of creating innovative green jobs.
It prioritizes a shift from the traditional linear development model that is characterized by linear
flows of matter, where raw materials are extracted, processed into products, consumed, and
discarded with a trail of waste at each stage of the supply chain to the adoption of a circular
economy driven by RECP, the 3Rs and IS. However, absence of an enabling policy framework for
RECP and Industrial Symbiosis is frustrating the accelerated uptake of this emerging and

150
promising green industrial revolution. In order to fully actualize waste and by-product exchange
within the SEZ, there is need for infrastructure that will facilitate waste recovery for recycling.
There is also need to make the monitoring, reporting, and review mechanisms work more
efficiently and the Zone Authority will need to implement and operate a zone-wide information
system that will (i) support inter-enterprise communications; (ii) provide a centralized data
acquisition and analysis system to monitor energy, GHGs, and waste flows; (iii) inform enterprises
on latest developments in the areas of waste reduction, reuse, recovery and recycling. Some of
these innovative initiatives should be driven by the Government through a supportive incentive
scheme. Closer interactions between academia, industry, and Government will help promote the
development of jointly funded and demand driven research programs in the areas of resource use
efficiency, cleaner production and industrial symbiosis that will yield environmentally sound
technologies for waste recovery and recycling. The ultimate approach is to ensure that priority is
granted to waste reduction through resource use efficiency and cleaner production (RECP) before
engaging industrial symbiosis (IS) to deal with the inevitable residual waste.
Adoption of the green growth agenda will require a new skill set that is developed through training
and re-training in RECP and IS. Unfortunately, the Zone Authority as is currently constituted does
not have capacity in promoting the Zone’s green growth Agenda. That is why the study is
recommending the creation of the “Green Cell” to be working hand in hand with the Zone
Authority and other lead agencies in promoting low-carbon, resource efficient and climate resilient
development pathways. According to the World Bank, the chief objectives of such a “Green Cell”
are to: (i) drive the transition of current and upcoming EPZs to LCZs, by conducting regular and
focused capacity-building programs on the environmental and energy performance of enterprises;
(ii) support EPZ enterprises in implementing energy efficiency projects and other low-carbon

151
projects by acting as the first point of contact (FPOC) and the single point of contact (SPOC) for
all low-carbon development-related queries and activities within EPZ; (iii) formulate and
implement EPZ-level rules, guidelines, and governance mechanisms on GHG emission mitigation,
energy efficiency, RECP, IS, and waste and water management (These policies will be aligned
with national acts, laws, regulations and other development priorities; and (iv) facilitate and assist
the Zone Authority in inter-departmental and inter-ministerial coordination and communications,
to ensure that respective government agencies are informed and their policies are taken into
consideration, and to encourage these agencies to provide necessary inputs and feedback.
Adoption of resource use efficiency, cleaner production, and industrial symbiosis will enable
Kenyan industrial establishments meet and even exceed their climate change duty obligations of
demonstrating continual reduction of GHG emissions. An economic zone that embraces RECP
and IS will clearly be contributing to the country’s projected wish to attain a low-emission and
climate resilient development pathway as is stipulated in its 2015 Intended Nationally Determined
Contributions (INDC)38. By embracing project activities such as enhancement of economic zone
energy and resource use efficiency; adoption of clean energy technologies to reduce over-reliance
on wood fuels and adoption of sustainable waste management systems will help the country realize
its goal of abating its GHG emissions by 30% by 2030 relative to the BAU scenario of 143
MtCO2eq. The four green growth mainstreaming mechanisms that Kenya should embrace includes
public environmental expenditure review (PEER), strengthening of the strategic environmental
assessments (SEAs) for upcoming industrial parks, establishment of a council for Sustainable
Development and adoption of green accounting principles (Bennet & James, 1997). According to
38 Ministry of Environment and Natural Resources, Kenya’s Intended Nationally Determined Contribution (INDC), 23 July 2015

152
the OECD, the eight green growth policy instruments relevant for Kenya include certification of
sustainable products and trade; embracing of subsidy reforms; adoption of payments for ecosystem
services (PES); adoption of an environmental fiscal reform; creation of green energy investment
frameworks and incentives; embracing of inclusive green social enterprise; adopting sustainable
green public procurement; and embracing green innovation (ADB, 2012; OECD, 2012).
In order for Kenya to embrace and fully benefit from its green growth agenda, it has to invest in
green technological innovation and development (UNIDO, 2011). As a result, the Kenyan
Government has to invest in: (i) the strategic expansion of its green technologies (ii) establishment
of an efficient green technology development system; (iii) facilitation of the transfer and
commercial industrialization of green technologies; (iv) expansion of infrastructure for the
development of green technology and industry; (v) promotion of international cooperation for
green technology, research and development and transfer; and (vi) development of green
technology and industry as the country’s new growth engine (GGGI, 2015a). Kenya’s Science,
Technology and Innovation (STI) Act of 2013 proposes the establishment of the National Research
Fund that will be equivalent to 2% of the country’s GDP on annual basis39.
39 The Science, Technology and Innovation Act, 2013, No. 28 of 2013 - Date of Assent: 14th January, 2013
153
CHAPTER FIVE: SUMMARY OF KEY FINDINGS, CONCLUSIONS AND
RECOMMENDATIONS
5.1 Summary of Key Findings
Though not pre-planned, the clusters at the Athi River SEZ have started taking shape naturally due
to the prevailing market forces of supply and demand. Proper planning of the economic zone
guided by the development of green economic zone master plans will have helped to locate
companies that exchange wastes and by-products in close proximity for ease of material exchange.
A more sustainable approach dictates that companies should first embrace resource efficient
cleaner production (RECP) before engaging in waste and by-product exchange as a way trying to
prevent the temptation seeking to generate more waste for exchange. However, due to limited
awareness, the zone based companies were not yet embracing (RECP) practices and techniques.
Waste and by-product exchange through industrial symbiosis was just starting to take shape at the
economic zone. Industrial symbiosis should focus on managing the inevitable residual waste after
engaging (RECP). The ultimate goal is to use industrial symbiosis as a tool for diverting wastes
from the landfill. Doing this will not only lower the pressure on the use of virgin materials but also
eliminate the environmental problems associated with landfilling. However, its progress will likely
be slowed down by the economic zone’s weak infrastructure for waste recovery and recycling. On-
going waste and by-product exchange within the economic zone has led to the creation of 20 decent
green jobs, avoided GHG emissions, and lowered costs of production. Through awareness raising,
information dissemination, training and setting up of demonstration projects, zone based
companies can be enabled to fully embrace the principles of industrial symbiosis that is already
spontaneously evolving within the ranks of the zone clusters. The institutional capacity of EPZA
needs to be strengthened so that the Zone Authority can be able to promote low emission, resource
efficient and socially inclusive development pathways.

154
5.2 Conclusions
The identified clusters at the economic zone were not pre-planned but instead evolved on their
own due to the prevailing market forces of supply and demand. Although clusters do provide a
powerful framework in which companies organize, work together with the Government and
academia in promoting their growth interests, their meaningful growth can only be assured if there
is an enabling policy, legal and institutional framework. Proper initial planning of the zone will
have ensured that those cluster companies that exchange wastes and by-products were located in
close proximity to each for purposes of easing the exchange.
Waste and by-product exchange through industrial symbiosis was at its infancy at the economic
zone. Detailed investigation of the material flows in the selected clusters revealed that some cluster
companies were already exchanging wastes and by-products. However, the industrial symbiosis’s
much anticipated progress is likely to be slowed down by the zone’s weak infrastructure for waste
recovery and recycling. Though at infancy, waste and by-product exchange has already helped to
create green jobs, lowered GHG emissions, and lowered costs of production. There was no
metering and sub-metering of material flows through the production lines. This has dampened the
full exploitation of the benefits of industrial symbiosis by the economic zone.
The tenant companies of the zone were just beginning to embrace the principles of industrial
ecology by deliberately attempting to connect waste and by-product streams into closed loop
supply chains. By seeking ways to “close-the-loop” on material cycles, IE extends the useful life
time of material resources and reduces the impact of their acquisition on the environment
(WBCSD, 2002). On a prioritized basis, the zone companies should fully embraces the principles
of resource use efficiency and cleaner production before engaging industrial symbiosis in

155
mitigating its environmental challenges. This will entail awareness raising, training and setting up
of demonstrations by the proposed “Green Cell”.
It was established that the EPZA as is currently constituted does not have the human and techno-
managerial capacity to promote low-carbon, resource efficient and climate resilient growth
pathways for companies that reside within the zone. The global trend has shifted to increasing
economic zone competitiveness through improved resource use efficiency, cleaner production, and
industrial symbiosis. This new development paradigm is meant to decouple economic growth of
zones from further increases in greenhouse gas (GHG) emissions and harmful waste generation
(UNEP, 2011; World Bank, 2014). Speedy adoption of Industrial Ecology in Kenya will depend
on the country’s ability to set up demonstrations that show that embracing the concept makes good
business and environmental sense as has been successfully done in Europe and Asia. There will
also be need for incentives to help accelerate the rate of adoption.
5.3 Recommendations
Policy Recommendations
1. The economic zone’s industrial clusters were spontaneously evolving. For them to mature
and serve the intended purpose of tenant company cooperation towards the common and
shared vision of embracing waste and by-product exchange through industrial symbiosis;
strengthening of business networking and best practice exchange; engaging team effort in
solving waste related environmental challenges, and linking and aligning the different
stakeholder interests from the a triple helix perspective, there will be need for the
establishment of an industrial cluster promotion policy framework for our special economic
zones (SEZs)/ industrial parks (IPs). The industrialization process of our SEZs/ IPs should
therefore be cluster based and that this requirement should be incorporated early during the

156
development of SEZ/ IP master plans. A cluster approach to industrialization will enable
the country’s SEZs/ IPs strengthen their consensus building capabilities on key issues of
mutual interest such as industrial symbiosis; enhance company-to-company interaction;
and strengthen the University/ Research Institute – Industry- Government collaboration in
promoting eco-innovation for the much needed green growth.
2. The material flow patterns within the within the Athi River SEZ were largely linear in the
sense that raw materials are mined, value added to produce products that are consumed
with a trail of waste at each stage of this supply chain. This waste certainly finds itself to
the landfill. There is therefore need to create an enabling policy and institutional framework
that will work towards converting the economic zone’s current wasteful linear production
economic model into a circular economy that seeks to divert wastes from the landfill.
Embracing such a circular economy will help reduce pressure on the use of virgin raw
materials and also avoid the negative environmental impacts of landfilling wastes. This is
why this research is recommending the creation of a “Green Cell” to be housed at the
Export Processing Zones Authority (EPZA) and work closely with KIRDI’s Green Growth
Advisory Centre (GGAC) in advancing the economic zone’s green growth agenda based
on a circular economy approach. There will also be need to strengthen the zone’s waste
recovery and recycling infrastructure so that zone companies are enabled to exchange
wastes and by-products. Doing this will help create decent green jobs and also conserve
the environment. There will be need for an on-line data base of wastes and by-product
generation within the economic zone for purposes of seeking to establish industrial
symbiosis synergies.

157
3. The application of industrial ecology principles for mitigation the environmental
challenges of the Athi River SEZ were rather low and in most cases non-existent. As a
result, zone based Production Managers were reacting to already generated waste (end-of-
pipe approach) as opposed to being pro-active and preventing its generation at source.
There is therefore need for awareness raising, information dissemination, training and
capacity building, and setting up of convincing demonstrations on contemporary tools of
environmental management such as resource efficient cleaner production (RECP), the 3Rs,
and waste and by-product exchange through industrial symbiosis as a way of seeking to
obtain top management buy-in.
4. The Export Processing Zones Authority (EPZA) as is currently constituted did not have
the technical and human resource capacity to promote the green growth agenda for all the
companies that operate within its licensed economic zones across the country. These
shortcomings can be strengthened through triple helix collaborative framework between
Universities, Industries, and Government that creates an innovation ecosystem powered by
Research, Development and Demonstration (RD&D).
5. The SEZ Act of 2015, the draft SEZ policy, and the draft SEZ regulations were all
inadequate in as far as the incorporation of the elements of sustainability in the
management and governance of SEZs. All the three documents did not address the need
for Kenyan SEZs to go green and by doing so be in a position of attracting green foreign
direct (FDI) investments. Therefore the country’s special economic zone (SEZ) Act, draft
SEZ policy, and draft SEZ Regulations, should be reviewed to insert priorities on Resource
use Efficiency, Cleaner Production, the 3Rs of reducing, reusing and recycling wastes, and
Industrial Symbiosis as the most preferred low-carbon, resource efficient, and socially

158
inclusive development pathway that will enable the country’s SEZs to realize increased
productivity and competitiveness.
6. The country should develop inclusive green growth development strategies, action plans,
and implementation plans for all its SEZs that puts priority on resource use efficiency and
cleaner production (RECP), and industrial symbiosis as a way of advancing the green
growth agenda through the 3R philosophy of reducing, reusing and recycling.
5.4 Future Directions of Research in the Area
Developed and developing countries alike have committed themselves to promoting green
growth. According to the International Institute for Environment and Development (IIED),
green growth needs to become a human agenda if it is to mobilize the energies, creativity
and assets of the majority of people. In other words, green growth can and should engage
people where they are – in small businesses, on farms and in informal economies – and not
just in the major formal sectors . The green growth agenda should address the pressing
problems which hold people back from better use of environmental and other assets –
notably poverty and inequality. In the context of this research, the following future
directions for research as recommended: Determination of incentives that will help
accelerate the adoption of resource efficient cleaner production, the 3Rs, and industrial
symbiosis by both the service and manufacturing sectors of the special economic zones
(SEZs); The Role of RECP, the 3Rs, and IS in promoting the green growth agenda of
countries through the Paris Agreement especially as envisioned by the Global 2030 agenda;
Determination of how industrial symbiosis (IS) contributes to the realization of the
country’s sustainable development goals (SDGs); Development of tools/ software for
resource mapping and facilitation of potential resource matches/ synergies for purposes of

159
facilitating industrial symbiosis networks within the existing and planned SEZs/IPs;
Operationalization of incentives necessary for strengthening University-Industry-
Government (UIG) collaboration in promoting eco-innovation research for green growth;
How to innovatively promote the governance of the country’s cross-cutting green growth
agenda in an environment where Government Ministries and Departments hardly talk and
engage each other, but instead adopt a “silo” approach to development promotion; and How
best to overcome the barriers of social inclusion in green growth and promotion of pro-
poor inclusive green growth (IGG) development trajectories. Barriers to the inclusive
greening of Kenya’s economy have hindered progress towards sustainability. The issue
being that many Government policies do not adequately address and align government
interests with those of the poorest of the poor, and while high formal environmental
standards have been put in place, they are not reaching out to the poor – leading to serious
environmental mismanagement.

160
REFERENCES
Akinci, G., & Crittle, J. 2008. Special economic zones: Performance, lessons learned, and
plications for zone development. Washington DC: The World Bank;
Amirahmadi, H., & Wu, W. 1995. Export processing zones in Asia. Asian Survey, 828-849;
Anbumozhi, V., Thangavelu, S.M., & Visnathan, C. 2013. Eco-Industrial Clusters: A Prototype
Training Manual: Asian Development Bank Institute, Japan;
Answers to the Carbon Economy (ACE), 2014. Low Carbon Business Park Manual: A Guide for
Developing and Managing Energy Efficient and Low Carbon Businesses and Business
Parks, European Union;
Asian Development Bank (ADB). 2012. Policies and Practices for Low-Carbon Green Growth
in Asia: ADB-ADBI Study on Climate Change and Green Asia;
Asian Development Bank (ADB), 2012. Green Growth, Resources and Resilience-
Environmental Sustainability in Asia and the Pacific, Manila;
Ashton, W. 2008. Understanding the Organization of Industrial Ecosystems: A Social Network
Approach. Journal of Industrial Ecology 12(1): 34-51;
Ashton, W. S. 2009. The Structure, Function, and Evolution of a Regional Industrial Ecosystem.
Journal of Cleaner Production, 13(2): 55-75;
Bennett, M & James, P. 1997. Environment-Related Management Accounting: Current Practice
and Future Trends, 17 Spring Greener Management International, 32 – 51;
Benyus, J. 1997. Biomimicry, Innovation Inspired by Nature, Quill Publishing, P.7;
Bermejo, R. 2014. Handbook for a Sustainable Economy: Springer Science and Business Media
Dordrecht;
Bontje, M., & Musterd, S. 2009. Creative Industries, Creative Class and Competitiveness:
Expert opinions critically appraised. Geoforum, 40(5), 843-852;
Bowen, Alex. 2012. “Green” Growth: What does it mean?” Environmental Scientist 21.4: 7-11;
Brunner, P.H., & Rechberger, H. 2005. A Practical Handbook of Material Flow Analysis, Lewis
Publishers, London;
Chertow, M. 2006. Industrial Symbiosis Activity in North America: Report on the Third
International Industrial Symbiosis Research Symposium, Birmingham, England, Report
Number 12, August 5 – 6, 2006;
Chertow, M. R. 2008. ‘Uncovering’ Industrial Symbiosis. Journal of Industrial Ecology, 11(1):
11–30;
Chertow, M. R., & Ehrenfeld, J. 2012. Organizing Self-Organizing Systems: Toward a Theory of
Industrial Symbiosis. Journal of Industrial Ecology, 16(1), 13–27;
Chertow, M., & Lombardi, R. 2005. Quantifying economic and environmental benefits of co-
located firms. Environmental Science and Technology. 39 (17): 6535 – 6541;
Chertow, M.C. 2007. Uncovering Industrial Symbiosis. Journal of Industrial Ecology. 11(1): 11-
30;
Chertow, M.R. 2000. Industrial Symbiosis: Literature and Taxonomy. Annual Review of Energy
and the Environment 25: 313 – 337;
Chertow, M.R. 2004. “Industrial Symbiosis.” Encyclopedia of Energy. Ed. C.J. Cleveland. New
York: Elsevier, 2004, p. 407-415;

161
Chertow, M.R., Ashton, W.S., & Espinosa, J.C. 2008. Industrial Symbiosis in Puerto Rico:
Environmentally Related Agglomeration Economies. Regional Studies; 42 (10): 1299 –
1312;
Cliff, R., &Druckman, A. (Ed). 2016. Taking Stock of Industrial Ecology;
Costa, I., & Ferrao, P. 2010. A Case Study of Industrial Symbiosis Development using a Middle
– Out Approach. Journal of Cleaner Production 18 (2010): 984 – 992;
Cote, R.P., & Cohen-Rosenthal, E. 1998. Designing Eco-Industrial Parks: A Synthesis of some
Experiences. Journal of Cleaner Production. 6, pp. 181 – 188;
Cote, R., & Hall, J. 1995. Industrial Parks as Ecosystems. Journal of Cleaner Production
15 (3): 41-46;
Economist, 2015. Special Economic Zones: Not so Special. The Economist, March 4;
ECORYS, 2011. Sustainable Industry: Going for Growth and Resource Efficiency. Report for
Directorate General- Enterprise and Industry: Rotterdam: ECORYS;
Ehrenfeld, J., & Gertler, N. 1997. Industrial ecology in practice: the Evolution of
Interdependence at Kalundborg. Journal of Industrial Ecology 1 (1): 67 – 79;
Erkman, S. 2001. Industrial Ecology: A New Perspective on the Future of Industrial Systems.
Swiss Medical Weekly 131, pp. 531 – 538;
European Commission (EC), 2010. Preparatory Study for the Review of the Thematic Strategy
on the Sustainable Use of Natural Resources Annexes;
European Commission (EC), 2011. Roadmap to a Resource Efficient Europe. COM (2011) 571
Final;
European Commission Decision C. 2014. 4995 of 22 July 2014: Horizon 2020 – Work Program
2014 – 2015: Climate Action, Environment, Resource Efficiency and Raw Materials;
European Environment Agency (EEA), 2011. EEA Report No5/2011 Resource efficiency in
Europe: Policies and approaches in 31 EEA member and cooperating countries.
Copenhagen: EEA;
European Environment Agency (EEA), 2014. Resource-efficient Green Economy and EU
Policies, EEA Report, No. 2/2014;
European Environment Agency (EEA), 2012. Environmental Indicator Report 2012 Ecosystem
Resilience and Resource Efficiency: In A Green Economy in Europe. Copenhagen: EEA;
Export Processing Zones Program Annual Performance Report, 2013 by the Export Processing
Zones Authority (EPZA);
Falcke, C. O. 1999. Industrial Parks Principles and Practice. Journal of Economic Cooperation
Among Islamic Countries, 20 (1), 1-10;
Farole, T. 2011. Special Economic Zones in Africa: Comparing Performance and Learning from
Global Experiences, World Bank;
Fischer-Kowalski, M. S. 2011. Decoupling natural resource use and environmental impacts
from economic growth, A Report of the Working Group on Decoupling to the
International Resource Panel. Nairobi: UNEP;
Fischer, K & Schot, J. 1993. Environmental Strategies for Industry: International Perspectives
on Research Needs and Policy Implications, Island Press, Washington, D.C;
Geng Y., Haight M., & Zhu Q. 2007: Empirical Analysis of Eco-Industrial Development in
China. Sustainable Development 15, 121–133;

162
Geng Y., Zhang P., Côté R.P., & Fujita T. 2008: Assessment of the National Eco-Industrial Park
Standard for Promoting Industrial Symbiosis in China. Journal of Industrial Ecology 13,
15–26;
Geng, Y. & Cote, R. P. (2002). Scavengers and Decomposers in an Eco-Industrial Park,
International Journal of Sustainable Development & World Ecology 9(4): 8 – 47;
Geng, Y., & Doberstein, B. 2008. Developing the Circular Economy in China: Challenges and
Opportunities for Achieving “Leapfrog Development”. International Journal of
Sustainable Development and World Ecology. 15 (3), pp. 1-9;
Geng, Y., Fu, J., Sarkis, J., & Xue, B. 2012. Towards a National Circular Economy Indicator
System in China: An Evaluation and Critical Analysis. Journal of Cleaner Production.23:
216-224;
Global Green Growth Institute (GGGI), 2016. Pro-poor, Inclusive Green Growth: Experience and
New Agenda, Seoul – Soth Korea;
Global Green Growth Institute (GGGI), 2015. Korea’s Green Growth Experience: Process,
Outcomes and Lessons Learned, GGGI, Seoul – South Korea;
GGGI (Global Green Growth Institute), 2011. Green Growth in Motion: Sharing Korea’s
Experience;
Ghali, M.R., Frayret, M., & Robert, M. 2014. Green Social Networking Framework for Industrial
Ecology Applications. Interuniversity Research Center on Enterprise Networks, Logistics
and Transportation, Montreal - Canada;
GIZ, (2015a). Planning of New Industrial Parks and Investment Zones, Indo-Germany
Partnership on Sustainable Industrial Development;
GIZ, (2015b). Planning and Design of ALEAP Green Industrial Park (A-GRIP), Nandigama:
The Indo-Germany Environment Partnership (IGEP);
Global Green Growth Institute (GGGI), 2015a. Korea’s Green Growth Experience: Process,
Outcomes, and Lessons Learned, GGGI, Seoul, South Korea;
GOK, 2010. National Climate Change Response Strategy (NCCRS), Ministry of Environment,
Water and Natural Resources;
GOK, 2010. The New Constitution of Kenya; Printed by the Government Printers on 27th
August, 2010;
GOK, 2012. Draft Special Economic Zone (SEZ) Policy, Ministry of Trade;
GOK, 2013. National Climate Change Action Plan (NCCAP) 2013 – 2017; Ministry of
Environment, Water and Natural Resources;
GOK, 2014. Draft National Climate Change Framework Policy, Ministry of Environment, Water
and Natural Resources;
GOK, 2015. National Green Economy Strategy and Implementation Plan (GESIP) for Kenya;
Graedel, T., Allenby, B., Telephone, A., & Company, T. 1995. Industrial Ecology, Prentice Hall,
Upper Saddle River, NJ, USA, 29 – 49;
Green Economy Coalition (GEC), 2012. Principles for a Green, Fair, and Inclusive Economy,
May 3, 2012;
GTZ, 2007. Cluster Management, a Practical Guide;
Hardin, Tibbs. 1993.: Industrial Ecology: An Environmental Agenda for Industry. Global

163
Business Network, USA;
Hongchun, Z. 2006. Circular Economy in China and Recommendations for its Promotion.
Ecological Economy (2006) 2: 102 – 114;
Hu, A. 2014. China: Innovative Green Development. Springer-Verlag-Berlin-Heidelberg, 2014;
Huber, J. 2012. Industrial Symbiosis and Ecology – Inspiration for Sustainable Industrial
Systems: Energy Delta Institute (EDI) Quarterly Publication, Vol 4, No. 3, October
2012, the Netherlands;
Jacobsen, N.B. 2006. Industrial Symbiosis in Kalundborg, Denmark: A Quantitative Assessment
of Economic and Environmental Aspects. Journal of Industrial Ecology, 10(1-2), 239 –
255;
Jacobsen, N.B., & Anderberg, S. 2004. Understanding the Evolution of Industrial Symbiotic
Networks: the case of Kalundborg. In: Van den Bergh, I. (Ed.). Economics of Industrial
Ecology. MIT Press, Cambridge;
Joint Agency Paper (JPA), 2012. Building an Inclusive Green Economy for All: Opportunities
and Challenges for overcoming Poverty and Inequality;
Kalmykova, Y., Rosando, L., and Patrico, J. 2016. Resource Consumption drivers and pathways
to reduction: economy, policy, and lifestyle impact on material flows at the national and
urban scale. Journal of Cleaner Production 132 (2016): 70 – 80;
Ketels, C., & Solvell, O. 2005. EU Clusters in the EU-10 New Member Countries. Europe
Innova Cluster Mapping Report;
Kibert, C.J., Sendzimir, J., & Guy, G. B. 2002. Construction Ecology: Nature as the Basis for
Green Buildings, Span Press, London, UK;
Kim, C. 2006. Industrial Symbiosis Activity in South Korea: Report on the Third International
Industrial Symbiosis Research Symposium, Birmingham, England, Report Number 12,
August 5 – 6, 2006;
Kisch, T., Ryden, E., & Lindhqvist, T. 1996. Evaluation of the UNIDO&UNEP National Cleaner
Production Center Program, International Institute for Industrial Environmental
Economics;
Klimova, N., Kozyrev, O., & Babllin, E. 2016. Innovation in Clusters, Understanding Universities,
Special Economic Zones, and Modelling, Springer, Switzerland;
Koenig, A. W. 2009. Eco-Industrial Park Development, A Guide for North America,
Laybourn, P., & Lombardi, D.R., 2012. Industrial symbiosis in European policy. J. Ind. Ecol. 16
(1): 11–12;
Laybourn, P., & Morrissey, M. 2009. UK National Industrial Symbiosis Program: The Pathway
to a Low-Carbon Sustainable Economy, International Synergies Limited, UK;
Lei, S. 2006. Industrial Symbiosis Activity in China: Report on the Third International Industrial
Symbiosis Research Symposium, Birmingham, England, Report Number 12, August 5 – 6,
2006;
Leiponen, A. 2005. Skills and Innovation. International Journal of Industrial Organization, Vol.
23, Issues 5-6, pp. 303-323;
Lombardi, R. 2015. Global View, Scaling up Industrial Symbiosis to meet Global Agendas, A
Paper Presented at a Workshop on Industrial Symbiosis at Birmingham City Council
House, UK and organized by the G7 Alliance for Resource Efficiency;

164
Lombardi, R., & Laybourn, P. 2012. Redefining Industrial Symbiosis. Journal of Industrial
Ecology, 16(1), pp. 28 – 37;
Lowe, E.A. 1997. Creating by-product resource exchanges: strategies for eco-industrial parks.
Journal of Cleaner Production 5 (1-2): pp. 57 – 65;
Maes, T., Eetvelde, G.V., Ras, E.D., Block, C., Pisman, A., and Verhofstede, B.,
Vandendriessche, F., and Vandevelde, L. 2011. Energy Management on Industrial Parks
in Flanders, Renewable and Sustainable Energy Reviews 15 (2011) 1988 -2005;
McDonough, W. & Braungart, W., 2002. Cradle to Cradle, Remaking the way we make things,
North Point Press, New York;
Meneghetti, A., & Nardin, G. 2012. Enabling Industrial Symbiosis by a Facilities Management
Optimization Approach. Journal of Cleaner Production 35 (2012): 263-273;
Ministry of Economy, Labor and Entrepreneurship of Croatia (MELE), 2013. Guidelines for
Cluster Development: A Handbook for Practitioners, Government of the Republic of
Croatia;
Mirata, M. 2004. Experiences from early stages of a national industrial symbiosis program in
the UK: determinants and coordination challenges. Journal of Cleaner Production, 12 (8-
10), pp. 967 – 983;
Mirata, M., & Emtairah, T. 2005. Industrial symbiosis networks and their contribution to
environmental innovation: the case of the Landskrona industrial symbiosis program.
Journal of Cleaner Production 13 (10-11): pp. 993-1002;
Mirovitskaya, N., & Ascher, W. 2001. Guide to Sustainable Development and Environmental
Policy, Duke University Press, London;
MKE (Ministry of Knowledge Economy), 2008. Green Industrial Development Strategy of Korea;
Mossard, G., Jacquat, O., & Zurcher, D. 2014. International Survey on Eco-Innovation Parks.
Learning from experiences on the Spatial dimensions of eco-innovation. Federal office for
the Environment and the ERA-NET ECO-INNOVERA, Bern. Environmental Studies no.
1402: 310pp;
New Growth Power Vision and Development Strategy (NGPV&DS), 2009. New Growth Power
Vision and Development Strategy, Accessed September 30, 2015;
OECD, 2009. Eco-Innovation in Industry, Enabling Green Growth, OECD Innovation Strategy,
Paris;
OECD (2011c), Policy Principles for Sustainable Materials Management, Paris;
OECD, 2010. Eco-Innovation in Industry: Enabling Green Growth, 2010, OECD Publishing;
OECD, 2011. Toward Green Growth, Paris - France;
OECD, 2011b. Towards Green Growth: Monitoring Progress, OECD, Paris - France;
OECD, 2011a. Policy Instruments for Sustainable Materials Management, Paris –France;
OECD, 2011b. Setting and Using Targets for Sustainable Materials Management-Opportunities
and Challenges, Paris;
OECD, 2012. Green Growth and Developing Countries: A Summary for Policy Makers, OECD,
Paris;
OECD, 2012. Sustainable Materials Management, Green Growth Policy Brief, Paris - France;
OECD, 2012. Green Growth and Developing Countries: A Summary for Policy Makers, June
2012, Paris -France;

165
OECD, 2013. “Nanotechnology for Green Innovation”, OECD Science, Technology and Industry
Policy Papers, No. 5, OECD Publishing, Paris - France;
Park, Jun-Mo, Hyeong-Woo Kim, and Hung-Suck Park, 2014b. “Assessment of Strategy and
Achievements of Eco Industrial Park (EIP) Initiative in Korea.” J. Kor. Soc. Environ. Eng
36 (12): 803~812;
Paquin, R. 2012. Industrial Symbiosis: Creating Economic and Environmental Value through
inter-firm Collaboration: Energy Delta Institute (EDI) Quarterly Publication, Vol 4, No,
3, October 2012, the Netherlands;
Paquin, R. L. and Howard-Grenville, J. 2012. The Evolution of Facilitated Industrial Symbiosis.
Journal of Industrial Ecology 16(1): 83-93;
PCGG (Presidential Committee for Green Growth), 2014. “Presidential Committee for Green
Growth.” Website of Presidential Committee for Green Growth, Accessed May 25, 2015;
PCGG (Presidential Committee for Green Growth), 2011. “Performance Evaluation of Green
Finance Promotion and Recommendation for Future Improvements.” Presidential
Committee for Green Growth, Seoul – South Korea;
Porter, M. E. 1990. The Competitive Advantage of Nations. London, Macmillan;
Roberts, B. H. 2004. The Application of Industrial Ecology Principles and Planning Guidelines
for the Development of Eco-Industrial Parks: An Australian Case Study. Journal of
Cleaner Production 12(8-10): 997-1010;
Saikku L. 2006: Eco-Industrial Parks: A Background Report for the Eco-Industrial Park Project
at Rantasalmi, Publications of regional council of Etelä-Savo;
Schmitz, H, 1999. ‘Collective Efficiency and Increasing Returns.’ In Cambridge Journal of
Economics 23 (4): 465–483;
Science Communication Unit (SCU) - University of the West of England, Bristol, 2012. Science
for Environment Policy In-depth Report: Resource Efficiency Indicators Report produced
for the European Commission DG Environment, February 2013;
Shi, H., Chertow, M., & Song, Y. 2010. Developing Country Experience with Industrial Parks:
A Case Study of the Tianjin Economic-Technological Development Area in China.
Journal of Cleaner Production. 18(3): pp. 191-199;
South African Department of Economic Development (SADED), 2011. South African Green
Economy Accord;
Starlander, J.E. 2003. Industrial Symbiosis: A Closer Look on Organizational Factors. A study
based on the Industrial Symbiosis project in Landskrona, Sweden;
UNEP, 2002. Changing Production Patterns: Learning from the Experience of the National
Cleaner Production Centers, UNEP;
UNEP, 2011. Towards a Green Economy: Pathways to Sustainable Development and Poverty
Eradication – A Synthesis for Policy Makers. www.unep.org/greeneconomy;
UNEP, 2011. Towards a Green Economy: Pathways to Sustainable Development and Poverty
Eradication;
UNEP, 2015. Building Inclusive Green Economies in Africa: Experience and Lessons Learned
2010 – 2015;
UNEP, 2015. Sustainable Consumption and Production: A Handbook for Policy Makers: Global
Edition;

166
UNEP, 2015b. Sustainable Consumption and Production: A Handbook for Policy Makers,
Global Edition;
United Nations Environment Program (UNEP), 2012. Global Outlook on Sustainable
Consumption and Production Policies: Taking action together: Nairobi Kenya;
UNIDO, 2008. Independent Evaluation of UNIDO&UNEP Cleaner Production Program, United
Nations Industrial Development Organization (UNIDO);
UNIDO&UNEP, 2010. Good Organization, Management and Governance Practices: A Primer
for Providers of Services in Resource Efficient and Cleaner Production, UNIDO and
UNEP, 2010;
UNIDO, 2011. Green Industry: Policies for Supporting Green Industry, Vienna – Austria;
UNIDO (United Nations Industrial Development Organization). 2011. “Green Industry: A key
pillar of a Green Economy.” Policy Brief prepared for the Ministerial Meeting on Energy
and Green Industry Vienna, June 21-22;
UNIDO, 2015. Economic Zones in the ASEAN: Industrial Parks, Special Economic Zones, Eco-
Industrial Parks, Innovation Districts as Strategies for Industrial Competitiveness,
UNIDO Country Office in Vietnam, August 2015;
US EPA, 2009. Sustainable Materials Management, the Road Ahead;
Van Berkel, R., 2010. Evaluation of the Global Implementation of the UNIDO&UNEP National
Cleaner Production Center Program. Journal of Clean Technology and Environmental
Policy (3) 161 – 175, 2010;
Weizsacker, E. V., Hargroves, C., Smith, M. H., Desha, C., & Stasinopoulos, P. 2009. Factor 5
Transforming the Global Economy through 80% Improvements in Resource Productivity.
Sterling, VA: Earthscan;
Wolman, H. 2014. Economic Competitiveness, Clusters, and Cluster-Based Development. Urban
Competitiveness and Innovation, 229;
World Bank, 2016. World Development Indicators, Highlights featuring the Sustainable
Development Goals (SDGs), Washington, D.C;
World Bank, 2011. Chinese Investments in Special Economic Zones in Africa, Challenges and
Lessons Learned;
World Bank, 2008. Special Economic Zones: Performance, Lessons Learned, and Implications
for Zone Development, Washington D.C;
World Bank, 2011. Special Economic Zones: Progress, Emerging Challenges, and Future
Directions;
World Bank, 2011. The Little Green Data Book;
World Bank, 2014. Low-Carbon Zones: A Practitioner’s Handbook, Washington, D.C, May
2014;
World Bank, 2009. “Clusters for Competitiveness: A Practical Guide and Policy Implications for
Developing Cluster Initiatives.” International Trade Department, PREM Network, Report,
World Bank, Washington, DC;
World Business Council for Sustainable Development (WBCSD), 2002. Industrial Ecology in
the Cement Industry, Toward a Sustainable Cement Industry, WBCSD Business of
Innovation;
World Economic Forum, 2014. Towards the Circular Economy: Accelerating the Scale-up

167
across Global Supply Chains. Geneva, Switzerland, 2014;
Western Cape Government (WCG), 2013. Green is Smart: Western Cape Green Economy
Strategy Framework;
Western Cape Economic Development Partnership (WEDP), 2012. One Cape 2040: Vision to
Action, the Western Cape Agenda for Joint Action on Economic Development;
Wu, F. 2012: China’s Eco-cities. Geoforum 43, 169–171;
Zeng, D.Z. 2006. Africa: Knowledge, Technology and Cluster-Based Growth, World Bank
Institute Development Study;
Zhang L., Yuan Z., Bi J., Zhang B. & Liu B. 2010: Eco-Industrial Parks: National Pilot
Practices in China. Journal of Cleaner Production 18, 504–509;
Zhang, K.-M. & Wen, Z.-G. (2008). Review and challenges of policies of environmental
protection and sustainable development in China. Journal of Environmental Management
88(4): 1249-1261;
Zhang, L., Yuan, Z., Bi, J., Zhang, B., & Liu, B. 2010. Eco-industrial parks: national pilot
practices in china, Journal of Cleaner Production 18(5): 504-509; Regional Industrial
Ecology in the Region of Sjaelland, Denmark. Masters Thesis of the Institute of
Management, Technical University of Denmark;
Zhang, L., Yuan, Z., Bi, J., Zhang, B., & Liu, B. 2010. Eco-Industrial Parks: National Pilot
Practices in China. Journal of Cleaner Production 18(5): 504-509;

168
Annex 1: PhD RESEARCH QUESTIONNAIRE 2014
CENTER FOR ADVANCED STUDIES IN ENVIRONMENTAL LAW AND POLICY
(CASELAP)
GENERAL INFORMATION
1. How big is the EPZA/ SEZ land area?
………………………………………………………………………………………………………………
2. When was the SEZ established?
………………………………………………………………………………………………………………
3. Total Number of employees at the EPZA?
……………………………………………………………………………………………………………..
4. Total Number of Companies in the zone
……………………………………………………………………………………………………………..
5. What is the Governance structure of the EPZA?
…………………………………………………………………………………………………………………
……………………………………………………………………………………………………………
6. Which national laws are administered by the zone?
…………………………………………………………………………………………………………………
……………………………………………………………………………………………………………
7. How has the EPZA concept evolved in the country over the decades?
…………………………………………………………………………………………………………………
……………………………………………………………………………………………………………
8. Which percentage of the park is already developed? Does the EPZA have a development
master plan?
…………………………………………………………………………………………………………………
……………………………………………………………………………………………………………
9. Outline your facilitatory roles at the EPZA. What rules does the EPZA enforce?
…………………………………………………………………………………………………………………
……………………………………………………………………………………………………………
Regulations applicable to the Zone as a whole
For which of the following items does the estate have responsibility by law? Kindly tick

169
Yes No
Environmental Impact Assessment
Environmental Audits
Meeting emission/discharge standards
Occupational health and safety
Undertaking waste disposal
Other (specify)
Regulations Applicable to tenant companies
What regulations exist in the following areas?
Zone by-law National regulation
Environmental Impact Assessment
Site or operational permit
Emissions/ discharges
Waste treatment and disposal
Occupational safety
Chemical storage
Fire protection
Building standards
Landscaping
Other
(please give details on separate sheet)
10. What type of infrastructure already exists in the zone?
…………………………………………………………………………………………………………………
……………………………………………………………………………………………………………
11. Are there green building codes, energy efficiency standards for different sectors or climate
change impact assessment procedures currently being enforced by the EPZA?
…………………………………………………………………………………………………………………
……………………………………………………………………………………………………………
12. From your knowledge, which companies are currently reusing and recycling resources at the
EPZA? Do they already have networks for exchanging waste from one company to the other?
…………………………………………………………………………………………………………………
……………………………………………………………………………………………………………
13. Do you promote climate friendly investments? If so how
…………………………………………………………………………………………………………………
…………………………………………………………………………………………………………………
…………………………………………………………………………………………………………

170
14. What are the environmental challenges of managing the EPZA industrial park?
……………………………………………………………………………………………………………
15. Is there a functional waste reuse and recycling system at the EPZA?
…………………………………………………………………………………………………………………
………………………………………………………………………………………………………….....
16. Type of Land Use Percentage of Area
a. Free Port ……………….
b. Free Trade Zone ……………….
c. Science and Technology Park ……………….
d. Incubators ……………….
e. ICT Park ……………….
f. Regional HQs ……………….
g. Tourist and Recreational Zone ……………….
h. EPZs ……………….
i. Industrial Park ……………….
j. Landscaped green areas ……………….
k. Undeveloped areas ………………
17. In what way have research institutes and/or academia been of help to the EPZA? Please tick
Yes No
Environmental training and education
Environmental Audits
Environmental Impact Assessments
Technology Assessments
Environmental monitoring
R&D on pollution options
Other (specify)
…………………………………………………………………………………………………………………
……………………………………………………………………………………………………………
18. Nature of Industries in the SEZ
Type of Industry Number of
Plants
Number of
Employees
Production
Volume (tons)
Petrochemical processing
Iron and steel processing
Non-ferrous metal industries
Chemical manufacturing
Energy generation
Construction industry
Transportation sector

171
Communication technology
Food processing
Drinks manufacture
Textile manufacturing
Leather processing
Electronic manufacturing
Pharmaceutical production
Plastics formulation/processing
Paint manufacture
Ceramics/glass manufacture
Pulp and paper production
Packaging manufacture
Metal plating
Other (specify)
…………………………………………………………………………………………………………………
……………………………………………………………………………………………………………
Service industries on site
Number of Plants Number of employees Production volume
Incineration
Transport
Warehousing
Chemical storage
Recycling
Waste
treatment/disposal
Laboratories
Information
technology
Consultancy
Banking, finance,
insurance
…………………………………………………………………………………………………………………
……………………………………………………………………………………………………………
19. List your quantified amounts of all your inputs, products, wastes and by-products as tons per
year (tons/yr) for the last three years
Quantified
inputs(tons/yr
)
Quantified
products(tons/yr
)
Quantified
wastes(tons/yr
)
Quantified by-
products(tons/yr
)

172
Petrochemical
processing
Iron and steel
processing
Non-ferrous metal
industries
Chemical
manufacturing
Energy generation
Construction industry
Transportation sector
Communication
technology
Food processing
Drinks manufacture
Textile manufacturing
Leather processing
Electronic
manufacturing
Pharmaceutical
production
Plastics
formulation/processin
g
Paint manufacture
Ceramics/glass
manufacture
Pulp and paper
production
Packaging
manufacture
Metal plating
Other (specify)
…………………………………………………………………………………………………………………
……………………………………………………………………………………………………………
Service industries on site
Quantified
inputs(tons/yr)
Quantified
products(tons/yr)
Quantified
wastes(tons/yr)
Quantified by-
products(tons/yr)
Incineration
Transport
Warehousing
Chemical storage

173
Recycling
Waste
treatment/disposal
Laboratories
Information
technology
Consultancy
Banking, finance,
insurance
…………………………………………………………………………………………………………………
……………………………………………………………………………………………………………
20. How familiar are you with the concept of eco-industrial parks (EIP)?
…………………………………………………………………………………………………………………
……………………………………………………………………………………………………………
21. What do you think will be the challenges you will face as regards embracing EIP
management?
…………………………………………………………………………………………………………………
…………………………………………………………………………………………………………………
…………………………………………………………………………………………………………
22. Do you have any training or education programs for your own staff or park businesses on
making them more resource efficient and ecologically friendly?
…………………………………………………………………………………………………………………
……………………………………………………………………………………………………………
23. How does the EPZA currently link and network with businesses within the park?
…………………………………………………………………………………………………………………
……………………………………………………………………………………………………………
24. What are the drivers for collaborative relationships within the zone?
…………………………………………………………………………………………………………………
……………………………………………………………………………………………………………
25. What parameters influence the zone’s collaboration and partnerships?
…………………………………………………………………………………………………………………
……………………………………………………………………………………………………………
26. How well do you think economic and ecological concerns are integrated into the EPZA policy
to enable its park businesses to minimize ecological impacts of buildings, optimize energy
efficiency, reduce ozone depletion as well as generation of climate changing emissions,
maximize efficient use of resources, maximize water use efficiency and integrate ecological
principals in social and economic development policy while facilitating and promoting greener
industrial development.

174
…………………………………………………………………………………………………………………
……………………………………………………………………………………………………………
27. What kind of role would you like EPZA to have in the promotion of EIPs?
…………………………………………………………………………………………………………………
……………………………………………………………………………………………………………
28. Who provides or is responsible for the following services, tools, or actions within the Park.
Kindly tick
Indust
ria
l es
tate
auth
ori
ty
Oper
ati
o
nal
unit
s
Gove
rnm
ent
auth
ori
ty
Pri
vate
sect
or
Oth
er
Energy
Centralized energy supply
Individual energy supply
Supply and recovery of waste heat (cogeneration)
Energy from waste facility (incinerator)
Energy from renewable resources facility
Water / Waste
Solid waste disposal including collection, storage
and treatment
Composting of biological waste including collection,
storage and treatment
Sewage disposal including, collection, storage and
treatment
Industrial liquid waste disposal including collection,
storage and treatment
Hazardous waste disposal including collection,
storage and treatment
Waste exchange clearing house
Waste transfer station
Multi-material resource recovery
Transport
Traffic and transport management plan
Management
Environmental monitoring
Effluent monitoring
Environmental auditing
Environmental impact assessment
Environmental technology assessment
ISO 14001 certification
Resource efficiency training and education
Environmental operations and information centre

175
Emergency preparedness and response capability
Register of legislation
Self-regulation and operational standards
Green building codes
Finance and insurance services
Miscellaneous
Restoring natural features of the site
Landscaping and gardening
Analytical and laboratory services
Protection and security system
Specific Industry Information
29. Name and address of the industry?
………………………………………………………………………………………………………………
30. Year Operations started
………………………………………………………………………………………………………………
31. What category of the industry are you?
………………………………………………………………………………………………………………
32. Number of employees?
……………………………………………………………………………………………………………….
33. What is the industry’s main product (s)?
……………………………………………………………………………………………………………….
34. What are your annual production volumes?
………………………………………………………………………………………………………………
35. What are the main raw materials – including water and energy (quantity and price)?
………………………………………………………………………………………………………………
a. Water use m3/yr
……………………………………………………………………………………………………………….
b. Electricity use kWh/yr
……………………………………………………………………………………………………………….
c. Material use tons/yr
36. What are your products (quantity and price)?
a. Products tons/yr
………………………………………………………………………………………………………………
37. What are your by-products (quantity and estimated cost)
………………………………………………………………………………………………………………
38. Which types of waste characterize your operations?
a. Dust and dirt
………………………………………………………………………………………………………………
b. Trimmings and off cuts
………………………………………………………………………………………………………………
c. Liquid effluents
………………………………………………………………………………………………………………
d. Steam losses
………………………………………………………………………………………………………………

176
e. Compressed air losses
………………………………………………………………………………………………………………
f. Unused raw materials
………………………………………………………………………………………………………………
g. Reworks
………………………………………………………………………………………………………………
h. Damaged stock
……………………………………………………………………………………………………………….
i. Damaged products
………………………………………………………………………………………………………………
j. Inspection rejects
…………………………………………………………………………………………………………….....
k. Obsolete stock
……………………………………………………………………………………………………………….
l. Unnecessary packaging
……………………………………………………………………………………………………………….
m. Others
……………………………………………………………………………………………………………….
39. What are your waste streams (quantity of solids, liquids/effluents)?
a. Solid wastes generated tons/yr
…………………………………………………………………………………………………………….....
b. Waste water generated m3/yr
……………………………………………………………………………………………………………….
c. Yearly cost of solid waste management
……………………………………………………………………………………………………………….
d. Yearly cost of wastewater treatment
……………………………………………………………………………………………………………….
40. Do you have waste water with high energy content, e.g. heat, organic material or other? If
yes, please specify
………………………………………………………………………………………………………………
41. How do you dispose the waste? (sale/ open dumping/exchange/incineration)
………………………………………………………………………………………………………………
42. Do you generate any of these wastes? If yes, what are your annual production volumes:
a. Metal
……………………………………………………………………………………………………………….
b. Glass
……………………………………………………………………………………………………………….
c. Paper
……………………………………………………………………………………………………………….
d. Plastic
……………………………………………………………………………………………………………….
e. Wood
……………………………………………………………………………………………………………….

177
f. Textile cuttings
……………………………………………………………………………………………………………….
g. Organic
……………………………………………………………………………………………………………….
h. Tyre/rubber
……………………………………………………………………………………………………………….
i. Ash
……………………………………………………………………………………………………………….
j. Oil
……………………………………………………………………………………………………………….
k. Special wastes
……………………………………………………………………………………………………………….
l. Other
……………………………………………………………………………………………………………….
43. Please state some examples of actual initiatives that have been initiated within recent years in
order to reduce the environmental impacts of: solid waste and by-products; emissions to air;
emissions to aquatic recipient/waste water; and energy in-efficient processes
………………………………………………………………………………………………………………
44. Is there a possibility for recycling/ reusing the waste?
a. If not, why?
………………………………………………………………………………………………………………
b. If so, is it being done?
i. At what price do you sale the waste?
………………………………………………………………………………………………………………
ii. Who buys your waste?
………………………………………………………………………………………………………………
iii. How is it used?
………………………………………………………………………………………………………………
45. Do you receive by- or waste products from other companies that are then used as input to
your production? If yes, please specify
………………………………………………………………………………………………………………
46. Could any of your raw materials possibly be replaced with a by- or waste product? If yes,
please specify
………………………………………………………………………………………………………………
47. Which parameters are of importance to whether or not a by-product can be used as an input
to your production? See list below for inspiration
i. The content of heavy metals and other polluting substances
ii. Geographical and seasonal limitations
iii. Problems related to hygiene
iv. Regulation and fees
v. Problems of odour or aesthetics
vi. The environmental policy of your company

178
vii. Tradition
viii. Safe / stable and reliable delivery
ix. Technical limitations
………………………………………………………………………………………………………………
48. Are there any factors that might influence the applicability of these fractions?
………………………………………………………………………………………………………………
49. Do chemicals make up a large part of your production / maintenance / other? If yes, please
specify
………………………………………………………………………………………………………………
50. Would it be possible to replace these with other similar substances?
Used chemical
…………………………………………………
Could be replaced by
……………………………………………………
Used chemical
………………………………………………….
Could be replaced by
………………………………………………………
Used chemical
………………………………………………..
Could be replaced by
………………………………………………………
Used chemical
………………………………………………….
Could be replaced by
…………………………………………………….
51. Were any permissions/ license required to start this business? If so, from which departments?
………………………………………………………………………………………………………………Did
those departments support you in any way (financial support, market support, tax benefits,
training, sample analysis etc.)?
………………………………………………………………………………………………………………
52. Do you belong to any association of industries?
………………………………………………………………………………………………………………
a. If so, what are the main activities of the association?
………………………………………………………………………………………………………………
b. Are they helping to solve any problems faced by industries?
………………………………………………………………………………………………………………
53. What do you see as the main motivators for developers and businesses to improve on their
ecological performance?
………………………………………………………………………………………………………………
54. Do you think the EPZA provides you sufficient education on new rules, regulations and
strategies for developers that are economically and ecologically sound?
………………………………………………………………………………………………………………
55. What kind of role would you like the EPZA to have in the promotion of greener industrial
development for the SEZ?
………………………………………………………………………………………………………………
56. Is your company involved in any CSR activities? If so, what are they?
………………………………………………………………………………………………………………

179
57. What in our view has the Government done to improve the competitiveness of industries like
yours? Do you have any specific suggestion to be made to the Government?
………………………………………………………………………………………………………………
Stakeholders
Questions to Academia, Government Ministries, Development Partners, State Corporations,
Research Institutes, County Leaders, Business Associations, EPZA, etc
58. What do you think of the concept of eco-industrial parks?
……………………………………………………………………………………………………………….
59. Do you think business and industry would improve their ecological performance ‘because it
is the right thing to do’ regardless of environmental regulations?
………………………………………………………………………………………………………………
60. Do you see permitting and zoning for industrial development as an issue for improving the
environmental performance of industry? If yes, in what ways?
………………………………………………………………………………………………………………
61. Are there any areas you can think of where transferring greater control to county
governments would facilitate eco-industrial park development?
………………………………………………………………………………………………………………
62. Do you think national governments/ county governments should develop market based
incentives to encourage adoption of eco-industrial approaches?
………………………………………………………………………………………………………………
63. What kind of role would you like to see county governments have in eco-industrial park
development? For planners specifically
………………………………………………………………………………………………………………
64. What would be some elements of an ideal planning process for eco-industrial parks?
………………………………………………………………………………………………………………
65. What kind of policy or regulatory innovations might motivate business to improve ecological
performance and facilitate EIP development?
………………………………………………………………………………………………………………
66. What do you think will change public attitudes and behavior as regards consumption of
recycled products?
………………………………………………………………………………………………………………
67. Is there any agency you can think of that could champion EIPs at the national/county level
………………………………………………………………………………………………………………
68. What are the success factors for a fully-fledged SEZ in terms of land, supporting
infrastructure and administration?
………………………………………………………………………………………………………………
69. How can the current SEZs be reformed to embrace Industrial Ecology and by-product
exchange?
………………………………………………………………………………………………………………
70. How can knowledge and skills sharing be improved among the players of the SEZ?
………………………………………………………………………………………………………………
71. How can the SEZ’s technology transfer infrastructure be strengthened?
……………………………………………………………………………………………………………….
72. How can one improve on the techno-managerial skills of the SEZ players?

180
………………………………………………………………………………………………………………
73. How can the legal, institutional and regulatory framework of SEZs be improved?
………………………………………………………………………………………………………………
74. Which incentives are required for a smooth operation of a SEZ?
………………………………………………………………………………………………………………
75. What pertinent issues should be addressed in a SEZ’s strategic framework?
………………………………………………………………………………………………………………
76. What policies enable accelerated proliferation of low carbon green SEZs?
………………………………………………………………………………………………………………
77. Which institutional framework is ideal for the efficient functioning of SEZs?
………………………………………………………………………………………………………………
78. How can innovation be fostered within the SEZ?
………………………………………………………………………………………………………………
79. How can forward and backward linkages be established and strengthened with a SEZ
setting?
………………………………………………………………………………………………………………
80. What are the key problems currently facing SEZs?
………………………………………………………………………………………………………………
81. What needs to be done so as to enable SEZ players deal with each other with mutual trust
and respect?
………………………………………………………………………………………………………………
82. In your view, what are the disadvantages of embracing Industrial Ecology?
………………………………………………………………………………………………………………
83. How can we create low-carbon SEZs?
………………………………………………………………………………………………………………
Question to the surrounding Community
85. How does the existence of the EPZA next to you affect you?
………………………………………………………………………………………………………………
END

181
Annex 2: Guidelines on the Assessment of the IE potential
Categories
and Elements
Status Level 1
(Red)
Status Level 2
(Yellow)
Status Level 3
(Green)
Corporate
Policy
Company policy is
one of compliance
with business
regulations.
Company policy
extends beyond
compliance with
business regulations
to address potential
liability issues.
Systems are in place
to monitor, update,
communicate, and
implement policies.
Company policies are proactive
and include environmental,
economic, and social aspects in
all business decisions, e.g. public
policy, community relations, and
social development components.
Management
Involvement
Management
approach is
reactive to all
business threats.
Management
approach anticipates
and addresses
Clear business
threats – e.g.
Anticipates future
environmental
permits.
Management is actively involved
in updating of environment
health and safety (EH&S) policy
and introducing continuous
performance improvement
systems.
Management
Vision
The vision is
limited to
maintaining
compliance with
the provisions of
the economic
zone’s corporate
policy.
The vision shows a
willingness to
introduce longer-
term, voluntary
initiatives. In
addition, at the
Corporate level,
Public Affairs
management
perceived to be
critical to long-term
business
sustainability.
Highly aligned at Corporate and
Plant level (e.g. Corporate
policies are fully embraced at
Plant level and short-term
Financial criteria are not as
stringent).
Environment
al
Management
Environmental
assessment and
actions limited to
meeting regulatory
and compliance
requirements
Environmental
activities focus on
meeting specific
environmental goals
identified via the
implementation of a
formal
Environmental
Management
System (EMS).
Neighboring communities and
industrial facilities play an
important role in influencing
environmental goals as part of an
overall Environmental
Management System.

182
Plant
Operations
Plant
environmental
initiatives are
control
oriented and lack
management
support
Operational
initiatives
promote eco-
efficient
production and
resource
conservation
Plant management is cognizant
of
the triple bottom line and
incorporates aspects of
sustainability in operational
decisions
Plant
Management
Management only
supports
discretionary
environmental
initiatives that
don't require
capital
investments.
Management
supports investments
in discretionary
environmental
investments and
comprehensive
evaluation strategy
is in place.
Independent division with
dedicated staff for evaluating
opportunities for waste
recycling,
alternative fuels and raw
materials
(AFR), and developing and
implementing IE relationships.
Process
Operations
Operations staff
unwilling to
explore
waste
minimization or
pollution
prevention
(P2) activities
Operations staff
value pollution
prevention and AFR
efforts and are
willing to explore
such opportunities.
As part of the R&D process,
Operations staff actively
participates in exploring and
implementing AFR substitution
opportunities.
Employee
Motivation
No incentives to
explore new
opportunities in
increasing
profitability
– maintains status
quo.
Staff award
programs for ideas
that could lead to
increased
productivity and/or
process efficiencies
e.g. energy and
water conservation.
Compensation packages for
managerial staff directly linked
with increased productivity
profits, or other performance
measures through AFR or other
IE programs.
Innovation No R&D
investments
For environmental
Technology
upgrading.
R&D funding
earmarked for
innovations in
environmental
technology
initiatives leading to
economic benefits
(e.g. using recycled
material, new and/or
improved product
and/or process
design).
Opportunity assessments
actively
pursued for innovative options in
AFR and/or other IE
opportunities.
Transparency Company
operations are
insulated and do
Company willing to
discuss
Company proactively establishes
networks to explore
opportunities for waste

183
not promote
external
communications.
Its environmental
management
initiatives externally
to identify cost-
effective material
substitution or fuel
replacement.
exchange, AFR and other IE
opportunities on a zone-wide
basis.
Supplier /
Receiver
Relationships
Company
purchases
conventional fuels
and raw materials
through typical
cost-bid process.
Company has ad hoc
relationships with
suppliers and
receivers (companies
receiving waste and
process by-
products). No long
term or collaborative
sourcing
arrangements.
Company has formalized, long-
term relationships with receivers
(companies receiving waste and
by-products) and suppliers and
considers collaborating to
optimize both the supplier
operations and the transport
logistics.
Risk
Management
Limited to
regulatory
requirement for
process operations.
Risk analysis for
handling,
transportation, and
storage of AFR
performed.
Risk considerations broadly
consider the full range of
negative and positive values of
establishing and maintaining an
industrial ecosystem.
External
Partnerships
Not applicable in
this category.
Company perceives
its AFR, waste
recycling, and
material substitution
initiative as an
economic incentive.
Company uses its AFR and other
material substitution initiatives
for strategic benefits by
establishing goodwill and strong
relationships with the regulatory
agencies and local community
members.
External
Communicati
on
Company does not
communicate its
AFR and other
waste recycling
and material
substitution
programs to
external
stakeholders.
Company in a
reactive mode and
provides information
to the external
stakeholders only
when requested or
challenged for its
actions.
Company has a proactive
external stakeholder
communication program in place
to communicate company
policies and initiatives on AFR
substitution.
Environment
al, Health &
Safety
(EH&S)
activities
EH&S activities
focus is only on
compliance with
regulatory and
permit
requirements.
EH&S principles
extend beyond
meeting regulatory
compliance
requirements -
proactive approach
in risk management,
identifying waste
EH&S activities include
evaluations of the EH&S
implications of logistics
management, suppliers,
contractors, and other external
organizations associated with
company’s operations.

184
minimization, waste
recycling, P2
opportunities.
Material
Utilization
Material utilization
and material
energy flow
evaluation only
within the plant
boundary.
Life Cycle
Assessment
(LCA) approach
used for a system
level material
utilization and
material energy flow
evaluations
In addition to system level
LCAs, material utilization and
energy flow evaluations, the
company considers a broader set
of parameters such as resource
management issues and
stakeholder concerns.
Habitat
Management
Resource
extraction and
other habitat areas
are managed
within regulations.
Habitat management
and conservation of
biodiversity are
evaluated but
considered only
within the span of
control of the
company.
Habitat enhancement or
substitution is a key component
of decisions on fuels and raw
materials and waste product
utilization both within the
company and in partner
organizations.
Source: Modified from WBCSD, 2002. Guidelines on the Assessment of the IE potential.