development of apparent viscosity est for … · procedure for hot-poured crack sealants, final...
TRANSCRIPT
DEVELOPMENT OF APPARENT VISCOSITY
TEST FOR HOT-POURED CRACK SEALANTS
Prepared By
Imad L. Al-Qadi Eli H. Fini
University of Illinois at Urbana-Champaign
Jean-François Masson National Research Council of Canada
Amara Loulizi
Re'seau National Universitaire, Tunisia
Kevin K. McGhee Virginia Transportation Research Council
Mostafa A. Elseifi
Louisiana State University
Research Report ICT-08-027
Illinois Center for Transportation
November 2008
CIVIL ENGINEERING STUDIES Illinois Center for Transportation Series No. 08-027
UILU-ENG-2008-2015 ISSN: 0197-9191

Technical Report Documentation Page
1. Report No.
ICT-08-027
2. Government Accession No. 3. Recipient's Catalog No.
4. Title and Subtitle
DEVELOPMENT OF APPARENT VISCOSITY TEST FOR HOT-POURED CRACK SEALANTS
5. Report Date
November 2008 6. Performing Organization Code
8. Performing Organization Report N o. 7. Author(s)
Imad L. Al-Qadi, Eli H. Fini, Jean-François Masson, Amara Loulizi, Mostafa A. Elseifi, Kevin K. McGhee
ICT-08-027 UILU-ENG-2008-2015
9. Performing Organization Name and Address
University of Illinois at Urbana Champaign Department of Civil and Environmental Engineering 205 N. Mathews Ave, MC-250 Urbana, Illinois 61081
10. Work Unit ( TRAIS)
11. Contract or Grant No.
VTRC Project # 67775 TPF-5(045) 13. Type of Report and Period Covered
Technical Report
12. Sponsoring Agency Name and Address
Federal Highway Administration 400 North 8th Street, Room 750 Richmond, VA 23219-4825
Virginia DOT – Lead State 1401 E. Broad St Richmond, VA 23219
14. Sponsoring Agency Code
15. Supplementary Notes
16. Abstract
Current crack sealant specifications focuses on utilizing simple empirical tests such as penetration, resilience, flow, and bonding to cement concrete briquettes (ASTM D3405) to measure the ability of the material to resist cohesive and adhesion failures. There is, however, no indication of the pertinence of these standard tests to predict the success of field installation and sealant performance. In an effort to bridge the gap between sealant fundamental properties and field performance, performance-based guidelines for selection of hot-poured crack sealants are currently being developed. This report focuses on the development of the apparent viscosity test method. This test uses a modified version of the Brookfield rotational viscometer. Based on the results of this study, the measured apparent viscosity of hot-poured crack sealant using SC4-27 spindle at 60rpm (20.4s-1) at the recommended installation temperature was determined to be reasonably representative of sealant viscosity at shear rates resembling field application. To ensure measurement consistency and stability, a 20min melting time and a 30-s waiting time prior to data collection are recommended. To establish precision and bias for the test, a round robin testing was conducted among seven laboratories. Average coefficient of variation within and between laboratories was found to be 2% and 6%, respectively. Using the data from the round robin testing, and based on ASTM precision and bias standard (ASTM practices C802 and C670), maximum permissible differences within a laboratory and between laboratories were found to be 4.6% and 16.9%. Considering the high polymer or crumb rubber content in crack sealants and sealant temperature sensitivity, the repeatability and reproducibility of the developed test is within an acceptable range. These values are comparable to those of asphalt binder: 3.5% and 14.5% based on ASTM D4402-02 and 3.5% and 12.1% based on AASHTO 2006 T316.
17. Key Words
18. Distribution Statement
No restrictions. This document is available to the public through the National Technical Information Service, Springfield, Virginia 22161.
19. Security Classif. (of this report)
Unclassified
20. Security Classif. (of this page)
Unclassified
21. No. of Pages
42
22. Price
Form DOT F 1700.7 (8-72) Reproduction of completed page authorized
ii
ACKNOWLEDGEMENT The research on the Development of Performance-Based Guidelines for the Selection of
Bituminous–Based Hot-Poured Pavement Crack Sealants is sponsored by the Federal Highway Administration “pooled-fund study TPF5 (045)” and the US-Canadian Crack Sealant Consortium. The contribution of the participating states, industry, and provinces is acknowledged. This report is part of a series of reports that resulted from this study. Four reports were published by the Illinois Center for Transportation:
Al-Qadi, I.L., E.H. Fini, H.D. Figueroa, J.-F Masson, and K.K. McGhee, Adhesion Testing Procedure for Hot-Poured Crack Sealants, Final Report, No. ICT-08-026, Illinois Center for Transportation, Rantoul, IL, Dec 2008, 103 p.
Al-Qadi, I.L., E.H. Fini, J.-F Masson, A. Loulizi, K.K. McGhee, M.A. Elseifi, Development of Apparent Viscosity Test for Hot-Poured Crack Sealants, Final Report, No. ICT-08-027, Illinois Center for Transportation, Rantoul, IL, Dec 2008, 41 p.
Al-Qadi, I.L., S.-H. Yang, J.-F. Masson, and K.K. McGhee, Characterization of Low Temperature Mechanical Properties of Crack Sealants Utilizing Direct Tension Test, Final Report, No. ICT-08-028, Illinois Center for Transportation, Rantoul, IL, Dec 2008, 70 p.
Al-Qadi, I.L., S.-H. Yang, M.A. Elseifi, S. Dessouky, A. Loulizi, J.-F. Masson, and K.K. McGhee, Characterization of Low Temperature Creep Properties of Crack Sealants Using Bending Beam Rheometry, Final Report, No. ICT-08-029, Illinois Center for Transportation, Rantoul, IL, Dec 2008, 81 p.
Two internal reports on aging and sealant characterization were published by the National Research Council of Canada and a summary can be found in the following papers):
Collins, P., Veitch, M., Masson, J-F., Al-Qadi, I. L., Deformation and Tracking of
Bituminous Sealants in Summer Temperatures: Pseudo-field Behaviour, International Journal of Pavement Engineering, Vol. 9, No. 1, 2008, pp. 1-8.
Masson, J-F., Woods, J. R., Collins, P., Al-Qadi, I. L., Accelerated Aging of Bituminous
Sealants: Small-kettle Aging, International Journal of Pavement Engineering, Vol. 9, No. 5, 2008, pp. 365-371.
In addition, an executive summary report of the study was published by the Virginia Transportation Research Council (the leading state of the study):
Al-Qadi, I. L. J-F. Masson, S-H. Yang, E. Fini, and K. K. McGhee, Development of
Performance-Based Guidelines for Selection of Bituminous-Based Hot-Poured Pavement Crack Sealant: An Executive Summary Report, Final Report, No. VTRC 09-CR7, Virginia Department of Transportation, Charlottesville, VA, 2008, 40 p.

iii
DISCLAIMER
The project that is the subject of this report was completed under contract with the Virginia Transportation Research Council, which served as lead-state coordinator and project monitor for the partner states of Connecticut, Georgia, Maine, Michigan, Minnesota, New Hampshire, New York, Rhode Island, Texas, and Virginia. The contents of this report reflect the views of the authors, who are responsible for the facts and the accuracy of the data presented herein. The contents do not necessarily reflect the official views or policies of the Virginia Transportation Research Council, the partnering states, the Illinois Center for Transportation, the Illinois Department of Transportation, the Federal Highway Administration, or the remaining members of the Crack Sealant Consortium. This report does not constitute a standard, specification, or regulation. Any inclusion of manufacturer names, trade names, or trademarks is for identification purposes only and is not to be considered an endorsement.

iv
EXECUTIVE SUMMARY
Current crack sealant specifications focuses on utilizing simple empirical tests such as penetration, resilience, flow, and bonding to cement concrete briquettes (ASTM D3405) to measure the ability of the material to resist cohesive and adhesion failures. There is, however, no indication of the pertinence of these standard tests to predict the success of field installation and sealant performance. In an effort to bridge the gap between sealant fundamental properties and field performance, performance-based guidelines for selection of hot-poured crack sealants are currently being developed. This report focuses on the development of the apparent viscosity test method. This test uses a modified version of the Brookfield rotational viscometer. Based on the results of this study, the measured apparent viscosity of hot-poured crack sealant using SC4-27 spindle at 60rpm (20.4s-1) at the recommended installation temperature was determined to be reasonably representative of sealant viscosity at shear rates resembling field application. To ensure measurement consistency and stability, a 20min melting time and a 30-s waiting time prior to data collection are recommended. To establish precision and bias for the test, a round robin testing was conducted among seven laboratories. Average coefficient of variation within and between laboratories was found to be 2% and 6%, respectively. Using the data from the round robin testing, and based on ASTM precision and bias standard (ASTM practices C802 and C670), maximum permissible differences within a laboratory and between laboratories were found to be 4.6% and 16.9%. Considering the high polymer or crumb rubber content in crack sealants and sealant temperature sensitivity, the repeatability and reproducibility of the developed test is within an acceptable range. These values are comparable to those of asphalt binder: 3.5% and 14.5% based on ASTM D4402-02 and 3.5% and 12.1% based on AASHTO 2006 T316.
v
TABLE OF CONTENTS
INTRODUCTION .......................................................................................................................... 1
PURPOSE AND SCOPE .............................................................................................................. 3
BACKGROUND ............................................................................................................................ 3
METHODS .................................................................................................................................... 5
EXPERIMENTAL PROGRAM .......................................................................................................... 6 Sample Preparation .............................................................................................................. 7 Viscometer Model Selection .................................................................................................. 7 Spindle Size Selection .......................................................................................................... 9 Waiting Time before Viscosity Measurements ...................................................................... 9 Effect of Spindle Speed ....................................................................................................... 10 Effect of Speed Reversal .................................................................................................... 11 Effects of Temperature Fluctuation during Installation ........................................................ 12
TEST VARIATIONS ..................................................................................................................... 14 Variation within Laboratories ............................................................................................... 15 Variation between Laboratories .......................................................................................... 16
PRECISION STATEMENT FOR SINGLE OPERATOR ....................................................................... 22 PRECISION STATEMENT FOR MULTI-LABORATORY ...................................................................... 23
RESULTS AND CONCLUSION ................................................................................................. 23
RECOMMENDATION ................................................................................................................. 24
REFERENCES ........................................................................................................................... 24
APPENDIX A ............................................................................................................................ A-1
APPENDIX B ............................................................................................................................ B-1
STATISTICAL ANALYSIS ........................................................................................................... B-1
1
FINAL CONTRACT REPORT
DEVELOPMENT OF APPARENT VISCOSITY TEST FOR HOT-POURED CRACK SEALANTS
Imad L. Al-Qadi
Founder Professor of Engineering Illinois Center for Transportation, Director University of Illinois at Urbana-Champaign
Jean-François Masson
Senior Research Officer Institute for Research in Construction National Research Council of Canada
INTRODUCTION
The performance of a pavement depends on the effectiveness and timeliness of maintenance efforts. Deferred maintenance increases the severity of distress and leads to a more rapid pavement deterioration. An effective maintenance program helps maintaining riding quality, delays deterioration, and corrects pavement deficiencies. It has been reported that a dollar spent during the early stage of pavement deterioration saves as much as four to five dollars in the subsequent stages of deterioration (Stevens, 1985).
Pavement maintenance includes preventive and corrective activities. Preventive maintenance protects a pavement against a specific distress and thus decreases the rate of deterioration. In contrast, corrective maintenance activities are performed to address specific pavement failure or area of distress. For effective preventive maintenance, regular pavement treatment is needed. Moreover, regular pavement treatment offers agencies cost savings over repairing pavements that have been allowed to deteriorate.
Crack sealing is a preventive maintenance activity that is widely recognized to be cost-effective if the product is properly selected and installed (Lavin, 2003). This maintenance activity reduces water infiltration into the pavements and therefore, delays pavement deterioration caused by the weakening of subgrade and aggregate layers, loss of subgrade support, and stripping of hot-mix asphalt (HMA) layers. For a material to provide acceptable performance as a hot-poured bituminous crack sealant, it must resist adhesion and cohesion failures as well as degradation in the range of service temperature.
Since the 1950’s, hot-poured crack sealant specifications have been based on physical property tests that are easy to perform (Lynch and Janssen, 1997). The specifications, ASTM D5329 and AASHTO M173, focus on utilizing simple empirical tests such as cone penetration and softening point to measure the ability of sealants to resist cohesive and adhesive failures. Although the viscoelastic behavior of crack sealants is more complex than that described by these simple empirical tests, these consistency tests have served well over the years for specifying crack sealants and to ensure the consistency of sealant properties (Zanzotto, 1996).
As a result of increasing traffic, axle loadings, and tire pressures in recent years, as well as premature failure of hot-poured crack sealants, new highly-modified crack sealants have been introduced. The new crack sealants are highly modified asphalt binders with polymer
2
content as high as 18%, recycled rubber content as high as 50%, and oils with a concentration between 3 and 13% (Masson et al., 2002). These sealants have quite complex behavior compared to traditional sealant materials. They have a relatively lower strength than conventional sealants but are extremely flexible under loadings. This allows them to stretch considerably without failure (Ketcham, 1995).
Assessment of the current specifications of these new classes of crack sealants revealed that current consistency tests do not adequately describe the linear viscoelastic properties which are needed to predict sealants field performance. The linear viscoelastic properties relate physical and chemical properties to performance. While some sealants provided acceptable field performance, they failed to meet the requirements of the current specifications. This concern of poor prediction of sealant performance using the current specifications has been widely reported in the literature (Lynch, 1997; Smith and Romine, 1993; Masson et al., 2002; Al-Qadi et al., 2005). In order to predict the field performance of sealants, tests that are able to measure rheological characteristics of the sealant are needed. Such tests allow researchers to develop a performance-based specification for crack sealant.
Acknowledging the deficiencies of the current specification, more than 26 State and Provincial departments of transportation, manufacturers, cities, and research agencies in North America have partnered in a pool-fund study to develop performance-based guidelines for the selection of bituminous hot-poured crack sealants. One of the project’s goals is to make use of the well-established methods and equipment originally developed during the five-year Strategic Highway Research Program (SHRP) as part of the Performance Grade (PG) system for asphalt binders. Because the equipment recommended by SHRP for binder classification are already owned by various pavement and State agencies, efforts were made to make use of these equipment and consider any needed modifications.
A most important factor to be considered in a new performance-based specification is the proper field installation of sealants. Although poor preparation and cleaning of routed cracks is a major contributor to early failure, crack sealant installation also directly affects its adhesive, bulk, and aging properties; especially during its short-term service life. For optimum performance, a sealant should penetrate into HMA, fill the voids in crack wall, and follow the surface irregularities (Masson, and Lacasse, 2000). Adequate initial bonding to crack walls is critical to long-term sealant performance. Concurrently, a sealant should not experience high flow at high temperature under pressure from tires after being in service. Therefore, laboratory-measured parameters indicative of the expected success of the installation need to be specified and adopted.
Although it is acknowledged that crack sealant viscosity can have a significant impact on sealant performance (Chehovits and Manning, 1984; Masson and Lacasse, 2000), efforts to quantify the effect of viscosity during sealant application have been limited. Viscosity has long been used in the quality control parameter of asphalt binder and to determine mixing and compaction temperatures for HMA. Despite being easy to measure, viscosity is a most sensitive rheological property. It is influenced by parameters such as aging, molecular weight and distribution, and temperature. Therefore, it may be used effectively to characterize factors such as processability and material consistency. In addition to quality control, viscosity can be used to regulate and monitor installation, and to quantify the impacts of undesirable effects such as overheating.
3
PURPOSE AND SCOPE
Sealant fluidity at application temperature is a key factor affecting sealant field performance. To ensure desirable performance, sealant should meet specified thresholds. These limits should be established to ensure adequate pumping during installation, easily flowing inside the crack, and effective wetting of the crack sides to develop a strong bond. To fulfill these requirements a standard test able to measure a fundamental property of the sealant is needed. The test needs to be practical, repeatable and reproducible. This test would help researchers predict sealant field performance accurately. Therefore, the objectives of this research are the followings:
• To develop a laboratory procedure to measure the apparent viscosity of hot-poured bituminous crack sealants at conditions representative of field installation. • To determine the statistical variation and reproducibility of the proposed procedure.
First section of this report presents the detailed procedure of the viscosity test, the
equipment, and laboratory test procedure. Second section is devoted to statistical analysis of the data and establishing the precision and bias for the test. The test procedure in AASHTO format is provided as attachment to this report.
BACKGROUND
Viscosity is a fundamental rheological property defined as the resistance of fluid to flow. It can affect both installation procedure and sealant’s bond strength. In general, two rheological behaviors are encountered when dealing with viscosity measurements: Newtonian and non-Newtonian. A Newtonian fluid has a viscosity that is independent of shear rate. On the other hand, a non-Newtonian fluid is defined as a material in which the ratio between shear stress and shear strain rate is not constant. For non-Newtonian fluids, the measured viscosity is called the “apparent viscosity” and is only accurate when experimental parameters are set and adhered to. Non-Newtonian flow may be regarded as a fluid in which the molecules’ size, alignment, shape, and cohesiveness change with the amount of force applied.
In general, two major types of non-Newtonian flow behaviors may be encountered, characterized by the way a fluid responds to change in shear rate. Pseudoplastic (shear thinning) fluid is characterized by a decrease in viscosity with the increase in shear rate. In contrast, dilatant (shear thickening) fluid is characterized by an increase in viscosity with the increase in shear rate. Another common Non-Newtonian rheological behavior that may be observed with hot-poured crack sealant material containing heavy filler is the Bingham plastic behavior. In this case, the fluid behaves as a solid (no flow) unless a stress greater than the yield stress is applied. Once the yield value is exceeded, fluid may display a Newtonian, pseudoplastic, or dilatant flow behavior.
The viscosity of asphalt binder and its resistance to loading increase with the addition of rubber (Zaman et al., 1995). In general, its viscosity usually decreases as shear rate increases. At low shear rates, it exhibits shear-thickening behavior, while at high shear rates, shear thinning behavior is usually observed. The degree of shear thinning or thickening behavior decreases as the amount of rubber content increases (Zaman et al., 1995). However, the extent of shear thinning at any given shear rate is dependent on the shear history and the duration of shear stress application (Masson et al., 2002).
4
The effect of temperature on viscosity is equally important. Masson and Lacasse (2000) and Masson et al. (2002) observed that viscosity decreases as temperature increases. In more general terms, viscosity of Newtonian liquids decreases as the free volume in the liquid increases. Free volume is related to the difference between the current temperature and the glassy temperature (Tg) of the fluid; therefore the factors that govern Tg also affect viscosity. Hence, structural parameters such as chain rigidity and molecular weight affect measured viscosity (Wicks et al., 1994; Zaman et al., 1995). It should be noted that the influence of molecular weight on Tg levels off at high molecular weight, while the influence of molecular weight on viscosity does not (Wicks et al., 1994).
Sealant viscosity during application is thought to have a significant impact on its performance. However, the effect of viscosity on sealant performance has yet to be quantified. Hence, laboratory conditions should simulate sealant installation conditions as closely as possible. Studies to date on sealants have been qualitative and empirical in nature. For instance, Chehovits and Manning (1984), reported that a viscosity less than 7Pa.s at application temperature led to sealant self-leveling, easy pumping, and adequate penetration in cracks less than 9.5mm wide. Masson and Lacasse (2000) also reported that the filling of microvoids significantly depends on the sealant viscosity, emphasizing that a low viscosity sealant may wet and fill microvoids effectively, whereas sealants with high viscosities may not be as effective. More recently, Masson et al. (2000) showed that low sealant viscosity during installation was beneficial to performance. They indicated that sealants with viscosity less than 10Pa.s were self-leveling and could be easily installed, and those with viscosity greater than 30Pa.s were undesirable because it led to difficulties in pouring (Masson and Lacasse, 2000; Masson et al., 2002).
Zanzotto (1996) measured the viscosity of various hot-poured crack sealants with known field performance at a temperature of 190°C. He reported that the poorest observed field performance was associated with the crack sealants having very low or very high viscosity. Therefore, an upper and lower limit should be defined to ensure sealant flows properly and produce good bond with the crack walls. Sealant at pouring temperature should not show very low viscosity to cause the sealant to flow out of the crack, and not very high to clog the crack opening before filling it completely. In general, Zanzotto (1996) recommended that the maximum permissible viscosity should be set at 3Pa.s. Table 1 presents the suggested viscosity thresholds based on the results of a few studies. As can be noticed, discrepancies exist among the recommended thresholds.
Table 1. Suggested Viscosity Thresholds Authors Temperature
(ºC) Viscosity Limits (Pa.s)
Lower Upper Chehovits and Manning (1984) Application ---- 7.0
Zanzotto^ (1996) 190.0 ---- 3.0 Masson et al. (2000, 2002) Application ---- 10.0
^Acknowledged the importance of a lower limit to prevent flow of the sealant out of the crack.
A critical issue in this research was to determine the shear rate imposed on the material during application. In the field, an application wand with an inner diameter ranging from 19.05 to 25.4mm is commonly used. A nozzle with an inner diameter of 12.7mm is then connected to the wand to allow for higher precision during sealant application. The sealant application-rate, which depends on the depth of the crack, ranges from 63cm3/s for shallow cracks to 378.5 cm3/s for deep cracks. Assuming a steady flow and no slippage at the wall, it can be shown that the shear rate for a Newtonian fluid can be calculated as follows (Schweyer et al., 1987):

5
(1) where,
= shear rate (s-1); Q = volumetric rate (cm3/s); and R = inner radius of the pipe (cm).
Using Equation (1), the shear rate imposed on the material during installation was calculated (Table 2) and the corresponding spindle speed, using spindle SC4-27, was determined as follows:
(2) where, K = spindle constant (so called shear rate constant, for instance for SC4-27SRC it is 0.34); = shear rate at the surface of spindle (s-1); and = velocity of the spindle (rpm).
The results presented in Table 2 are for two pipe diameters with and without an end-nozzle. As shown in the table, a spindle speed ranging from 115 to 5536rpm should be used to simulate the shearing of the sealant as it enters the crack during installation. However, a significant reduction in the shear rate may occur as the sealant exits the applicator wand due to the sharp temperature drop, as well as the high friction with the crack walls. It has been reported that a drop of more than 50ºC could occur as the sealant enters the crack (Collins et al., 2006). In addition, an important factor that may affect the selection of the spindle speed is the stability of the measurements at the selected speed along with their repeatability. Although the SuperPaveTM currently adopted Brookfield Thermosel system is not a high-shear rheometer (the maximum allowable spindle speed is 250rpm), extensive testing proven it to be sufficient for sealant testing.
Table 2. Shear Rate (a) and Corresponding Spindle Speed (b) for Various Application Rates
and Pipe Diameters
METHODS
In order to develop a standard test which meets the aforementioned requirements, and minimize the cost of possessing the testing equipment, the research group selected the Brookfield rotational viscometer. The Brookfield viscometer have proven to be extremely reliable with regard to the accuracy and reproducibility of results, in addition, it is currently being used to
6
measure the viscosity of asphalt binder (ASTM D4402-87) and already available in most of Department of Transportation (DOT) laboratories. Therefore, the test method was developed through modifying this devise to work for both asphalt binder and crack sealant.
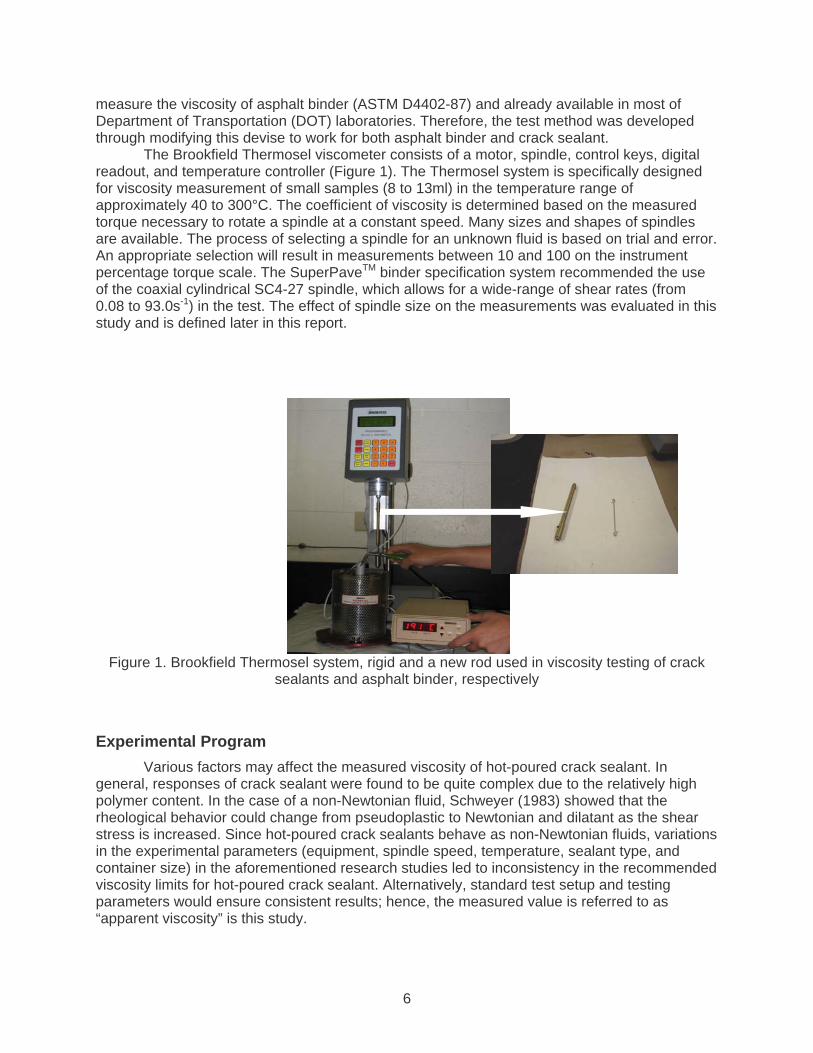
The Brookfield Thermosel viscometer consists of a motor, spindle, control keys, digital readout, and temperature controller (Figure 1). The Thermosel system is specifically designed for viscosity measurement of small samples (8 to 13ml) in the temperature range of approximately 40 to 300°C. The coefficient of viscosity is determined based on the measured torque necessary to rotate a spindle at a constant speed. Many sizes and shapes of spindles are available. The process of selecting a spindle for an unknown fluid is based on trial and error. An appropriate selection will result in measurements between 10 and 100 on the instrument percentage torque scale. The SuperPaveTM binder specification system recommended the use of the coaxial cylindrical SC4-27 spindle, which allows for a wide-range of shear rates (from 0.08 to 93.0s-1) in the test. The effect of spindle size on the measurements was evaluated in this study and is defined later in this report.
Figure 1. Brookfield Thermosel system, rigid and a new rod used in viscosity testing of crack
sealants and asphalt binder, respectively
Experimental Program Various factors may affect the measured viscosity of hot-poured crack sealant. In
general, responses of crack sealant were found to be quite complex due to the relatively high polymer content. In the case of a non-Newtonian fluid, Schweyer (1983) showed that the rheological behavior could change from pseudoplastic to Newtonian and dilatant as the shear stress is increased. Since hot-poured crack sealants behave as non-Newtonian fluids, variations in the experimental parameters (equipment, spindle speed, temperature, sealant type, and container size) in the aforementioned research studies led to inconsistency in the recommended viscosity limits for hot-poured crack sealant. Alternatively, standard test setup and testing parameters would ensure consistent results; hence, the measured value is referred to as “apparent viscosity” is this study.
7
Sample Preparation The first step to optimize the equipment is to identify crack sealant sample preparation
procedure. Homogenized sealant prepared in accordance with ASTM D5167 (Practice for Melting of Hot-Applied Joint and Crack Sealant and Filler for Evaluation) was adopted. Such a procedure usually results in a homogenized beam with a cross-sectional area no greater than 25x25mm. Initially the AASHTO TP48-96 procedure was followed to prepare test samples. Sealant was heated to the manufacturer recommended installation temperature and 10.5±0.1g was poured into the standard 19.05-mm-diameter container. The coefficient of variation in this method appeared to be very high. This may be due to the various sizes of the filler (and/or rubber) material between the tested replicates.
The sample preparation procedure was modified. The sample was obtained from the homogenized beam by cutting small vertical pieces. These vertical pieces were then cut into cubes with a cross-sectional area less than 5x5mm. The sealant cubes should be small enough to be inserted into the Thermosel sample container without adhering to the edge of the container. This process was repeated until a sample weight of 10.5±0.1g was obtained. No sealant is lost to the sides of the container during sample preparation when this procedure is followed. The tested sample weight would, therefore, remain constant. It is note worthy that sample weight was selected so that the liquid sealant covers the effective length of spindle in all cases. A sample chamber was then placed into the Thermosel at the desired testing temperature, which was the installation temperature recommended by the manufacturer.
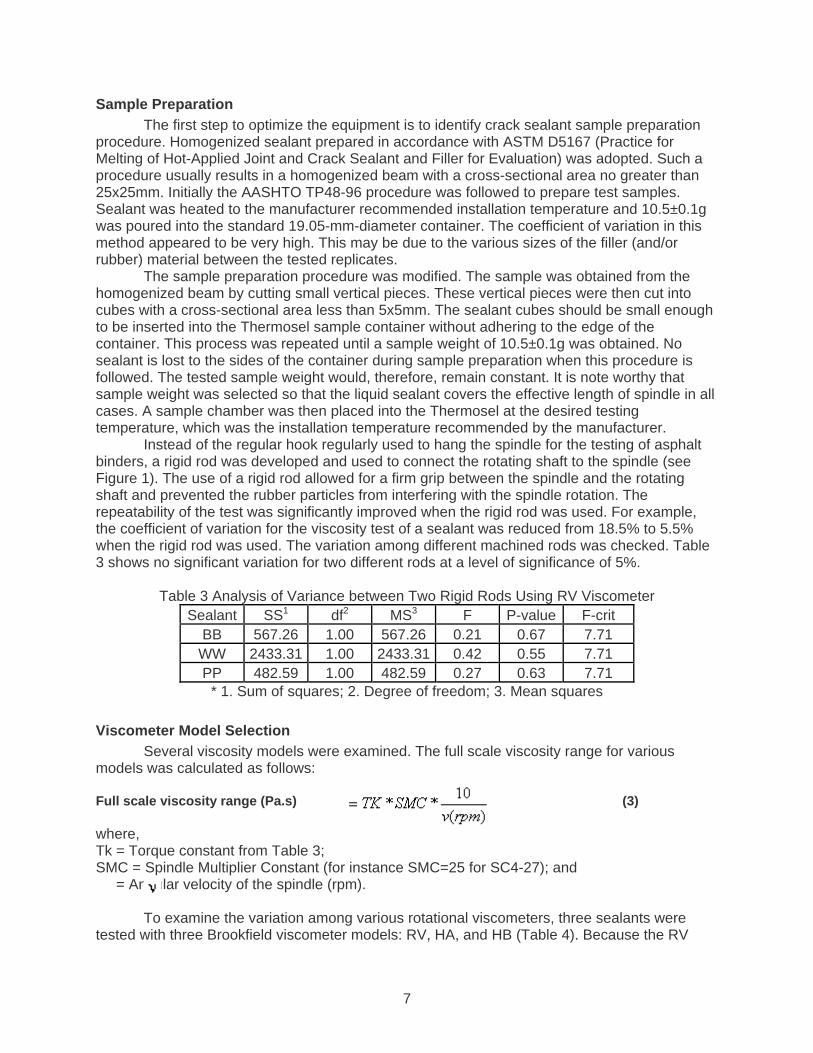
Instead of the regular hook regularly used to hang the spindle for the testing of asphalt binders, a rigid rod was developed and used to connect the rotating shaft to the spindle (see Figure 1). The use of a rigid rod allowed for a firm grip between the spindle and the rotating shaft and prevented the rubber particles from interfering with the spindle rotation. The repeatability of the test was significantly improved when the rigid rod was used. For example, the coefficient of variation for the viscosity test of a sealant was reduced from 18.5% to 5.5% when the rigid rod was used. The variation among different machined rods was checked. Table 3 shows no significant variation for two different rods at a level of significance of 5%.
Table 3 Analysis of Variance between Two Rigid Rods Using RV Viscometer
Sealant SS1 df2 MS3 F P-value F-crit BB 567.26 1.00 567.26 0.21 0.67 7.71
WW 2433.31 1.00 2433.31 0.42 0.55 7.71 PP 482.59 1.00 482.59 0.27 0.63 7.71
* 1. Sum of squares; 2. Degree of freedom; 3. Mean squares
Viscometer Model Selection Several viscosity models were examined. The full scale viscosity range for various
models was calculated as follows: Full scale viscosity range (Pa.s) (3) where, Tk = Torque constant from Table 3; SMC = Spindle Multiplier Constant (for instance SMC=25 for SC4-27); and = Angular velocity of the spindle (rpm).
To examine the variation among various rotational viscometers, three sealants were tested with three Brookfield viscometer models: RV, HA, and HB (Table 4). Because the RV
8
viscometer is recommended for measuring asphalt cement viscosity, the two other viscometers were compared to this model. A paired data set was determined by means of the paired t-test. A t-test was conducted for each pair of three sets. Each two sets of the paired data are assumed to be no different from each other; that is, their means are the same (H0, the null hypothesis). This hypothesis was checked to determine whether, for a given confidence level, it could be rejected. If there was sufficient evidence to disprove the hypothesis, it was rejected; otherwise, it was accepted. As indicated in Tables 5a and 5b, clear differences exist between HA and RV, and also between HB and RV. HA viscometer was used during the test development only because of its relatively high upper limit.
Table 4. Full Scale Viscosity Range for Different Viscometer Model
TK Max. viscosity
(Pa.s) Min. Viscosity
(Pa.s) Precision
(1% of full scale) RV DVIII 1.00 4.17 0.42 0.04 HA DVIII 2.00 8.33 0.83 0.08
2XHA DVIII 4.00 16.67 1.67 0.17 2.5XHA DVIII 5.00 20.83 2.08 0.21
HB DVIII 8.00 33.33 3.33 0.33 2HB DVIII 16.00 66.67 6.67 0.67
5XHB DVIII 40.00 166.67 16.67 1.67
For the range of measurements, the RV, which has a range of 0.42 to 4.2Pa.s, is recommended because it has greater precision compared to other viscometer models. In addition, RV model allows comparing measurements from various laboratories because of its availability as recommended SuperPaveTM equipment. Variations between two RV models were also checked following the same approach. Table 5c presents the analysis of variance between two RV viscometers. The results show no statistical evidence that the measured viscosity was different at a level of significance of 5% (ASTM C802). Therefore, the RV viscometer was selected for the rest of the experiments.
Table 5-a. Analysis of Variance between HB and RV Viscometers Sealant SS df MS F P-value F crit
BB 0.04 1.00 0.04 30.26 0.006 7.71 PP 0.15 1.00 0.15 12.36 0.026 7.71 WW 0.29 1.00 0.29 44.79 0.03 7.71
Table 5-b. Analysis of Variance between HA and RV Viscometers
Sealant SS df MS F P-value F crit BB 0.47 1.00 0.47 185.25 0.000 7.71 PP 0.16 1.00 0.16 14.80 0.018 7.71 WW 0.69 1.00 0.69 177.05 0.00 7.71
Table 5-c. Analysis of Variance between Two RV Viscometers
Sealant SS df MS F P-value F crit BB .010 1.00 0.010 7.267 054 7.71 PP .004 1.00 0.004 0.937 0.388 7.71 WW .001 1.00 0.001 0.494 0.521 7.71
9
Spindle Size Selection The shear rate is affected by the spindle size, Rb, chamber size, Rc and angular velocity
of spindle w, as expressed by Equation (4) (Brookfield Engineering Manual, 2000):
(4) where, γ& = Shear rate (s-1); Rc = Radius of container (cm); Rb = Radius of spindle (cm); x = Radius at which shear rate is being calculated; and w= Spindle angular velocity of spindle (rad/s)
If the spindle radius is decreased while all other parameters are kept constant, the shear strain would increase; and therefore, the viscosity would decrease. Three sealants were selected for testing utilizing two spindles (SC4-29 at 7.6-mm-diameter and SC4-27 at 11.76-mm-diameter): The expected softest and the stiffest sealants along with a medium-stiffness sealant. These sealants were labeled BB, QQ, and NN, respectively. The installation temperature recommended by the manufacturer was used as testing temperature (193°C for sealants BB and QQ, and 185°C for sealant NN). The sealants were tested inside a 19.05-mm-diameter container. Each sealant was tested in four replicates. A comparison of the resulting measured apparent viscosities is presented in Table 6.
For the three sealants, the average coefficient of variation (COV) for the SC4-29-spindle was 4%, while the average COV for the SC4-27-spindle was 3%. In general, results for the SC4-27 spindle were more repeatable. Hence, the SC4-27-spindle was adopted in this study. As previously mentioned, the SuperPaveTM binder specification system also selected the SC4-27 spindle.
Table 6. Sealant Apparent Viscosities Using Two Spindle Sizes
Sealant Temperature (ºc)
Average (Pa.s) Average (Pa.s) COV (%) COV (%) #29 Spindle #27 Spindle #29 Spindle #27 Spindle
BB 193 1.075 1.752 5.30 3.60 NN 185 4.877 6.102 3.76 1.73 QQ 193 4.975 5.108 2.97 3.90
Waiting Time before Viscosity Measurements
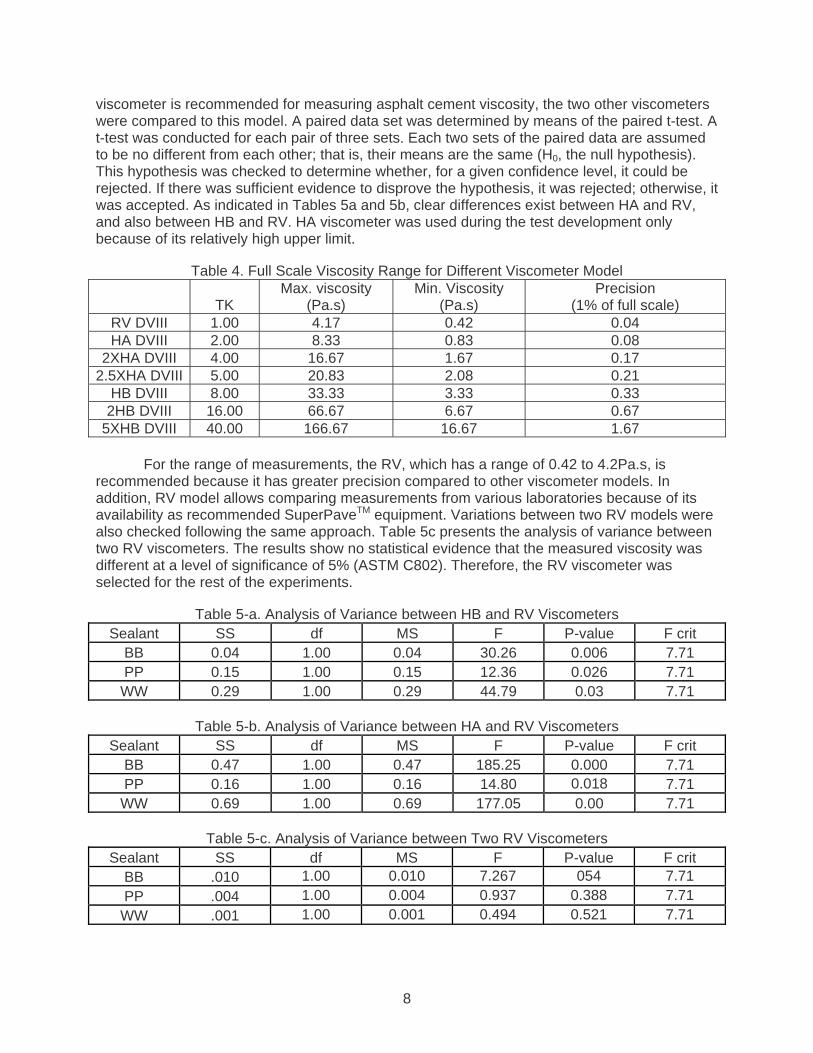
Due to the initial acceleration of the spindle, the Brookfield viscometer may provide inaccurate viscosity readings during the first few seconds of the test. The time required to reach constant viscosity readings depends on the equipment, the spindle type, size and speed, and the sealant viscosity. On the other hand, although a stable viscosity is desired, the elapsed time during installation is usually very short. To address both of these two factors, and to ensure repeatable measurements while simulating field pumping, sealants BB, QQ, and NN were evaluated.
Figure 2 shows viscosity results after different waiting times; the results are the average of four replicates. A 95% confidence interval was also built around the average of each sealant viscosity. As shown in the figure, it appeared that the viscosity for all tested sealants stabilized after 5 to 10s of spindle rotation. If a long waiting time is specified to stabilize the viscosity, the measured viscosity would not be representative of field installation. In contrast, if a short waiting
10
time is specified, the viscosity may not be repeatable; especially for sealants containing heavy rubber. To balance these two effects, a 30s waiting time was suggested.
The selected waiting time is clearly shorter than the 120s specified by the SuperPaveTM binder specification system. The difference in the waiting time is due to two major factors. First, the mixing and pumping operation in HMA is a lengthy process and requires a much longer waiting time to simulate field conditions. For ease of operation and specification purposes, the waiting time in SuperPaveTM was not selected to simulate field conditions, but was only controlled by the repeatability of the measurements. Second, as presented in the following sections, the recommended spindle speed during testing of a hot-poured sealant is much faster than that for a binder (60 vs. 20rpm). This results in a faster stabilization of the measurements.
0
1
2
3
4
5
6
7
8
0 30 60 90 120 150 180 210Time (s)
Visc
osity
(Pa.
s)
Sealant NNSealant QQSealant BB
Figure 2. Elapsed time requirement prior to recording data
Effect of Spindle Speed
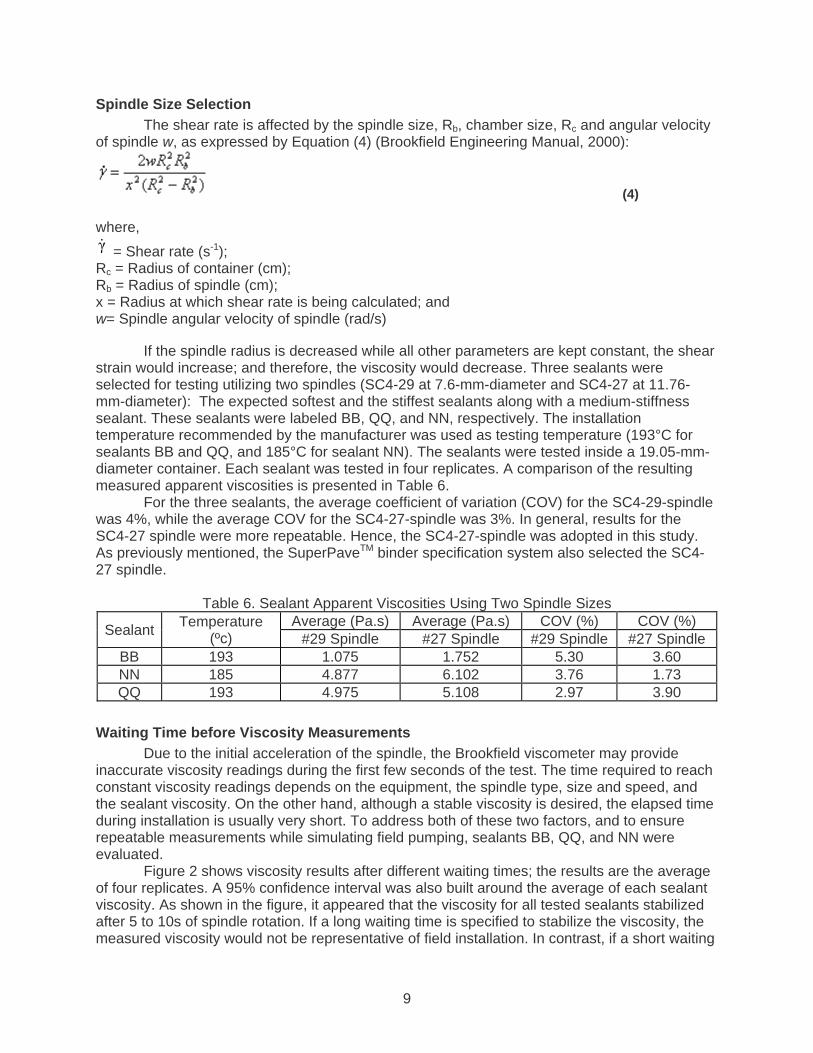
To determine the rheological behavior of hot-poured sealant, viscosity measurements were conducted at different spindle speeds. The test was conducted using increments of 5rpm for spindle speeds ranging from 2 to 122rpm; conducting frequency sweeps took more than 4h per test. Based on the average of four replicates, the variation of viscosity with the spindle speed is shown in Figures 3(a and b) for sealants BB, NN, and QQ. Testing results suggest that the measured viscosity experience two distinct regions of rheological behavior (Regions I and II).
In Figure 3a, the viscosity of the tested crack sealants initially decreased with the increase in shear rate to a certain value (shear thinning – Region I). The measured viscosity then stabilized (Newtonian flow – Region II). Sealants QQ, NN, and BB seemed to stabilize at apparent viscosity of approximately 4.0, 4.5, and 1.2Pa.s, respectively. The apparent viscosity of sealant BB appears to be independent of the shear rate.
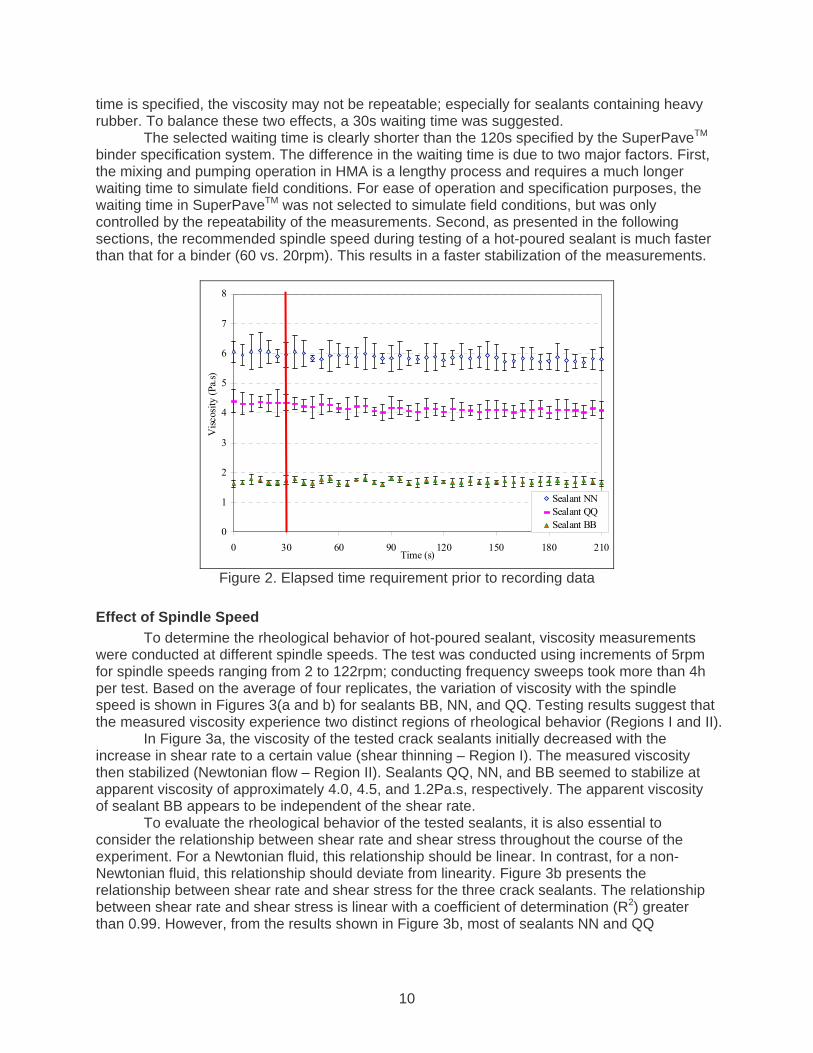
To evaluate the rheological behavior of the tested sealants, it is also essential to consider the relationship between shear rate and shear stress throughout the course of the experiment. For a Newtonian fluid, this relationship should be linear. In contrast, for a non-Newtonian fluid, this relationship should deviate from linearity. Figure 3b presents the relationship between shear rate and shear stress for the three crack sealants. The relationship between shear rate and shear stress is linear with a coefficient of determination (R2) greater than 0.99. However, from the results shown in Figure 3b, most of sealants NN and QQ
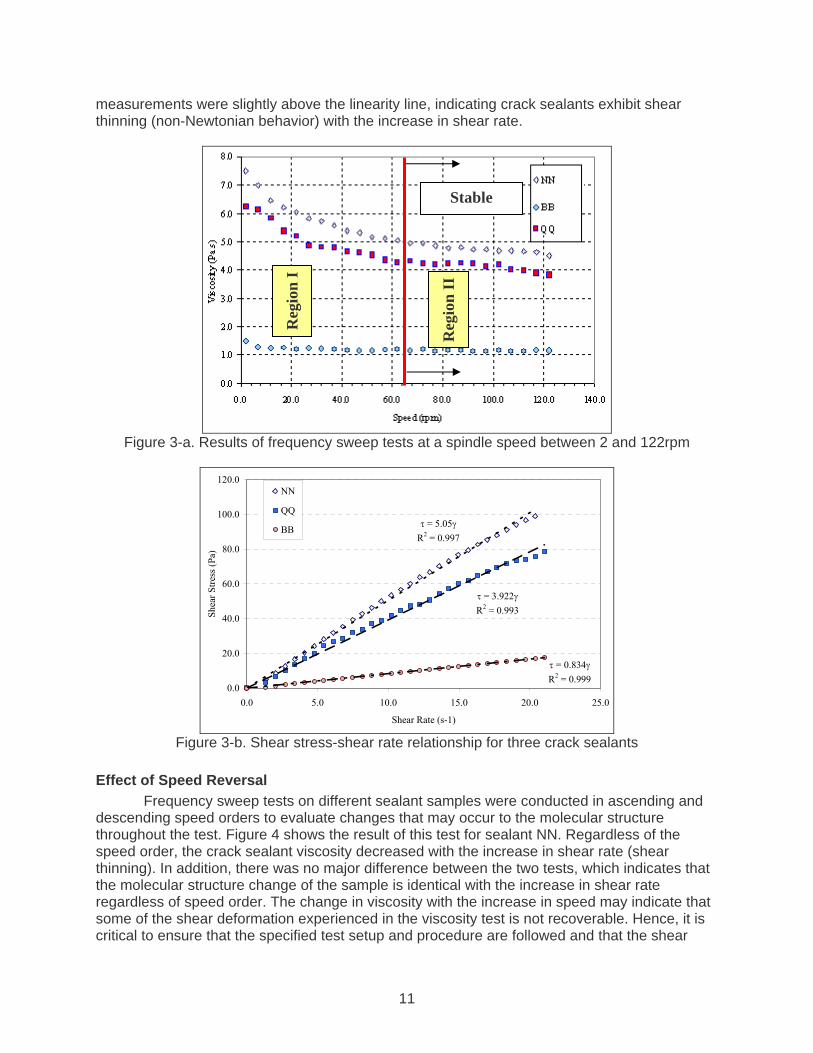
11
measurements were slightly above the linearity line, indicating crack sealants exhibit shear thinning (non-Newtonian behavior) with the increase in shear rate.
Figure 3-a. Results of frequency sweep tests at a spindle speed between 2 and 122rpm
τ = 3.922γR2 = 0.993
τ = 5.05γR2 = 0.997
τ = 0.834γR2 = 0.999
0.0
20.0
40.0
60.0
80.0
100.0
120.0
0.0 5.0 10.0 15.0 20.0 25.0
Shear Rate (s-1)
Shea
r Stre
ss (P
a)
NN
BB
Figure 3-b. Shear stress-shear rate relationship for three crack sealants
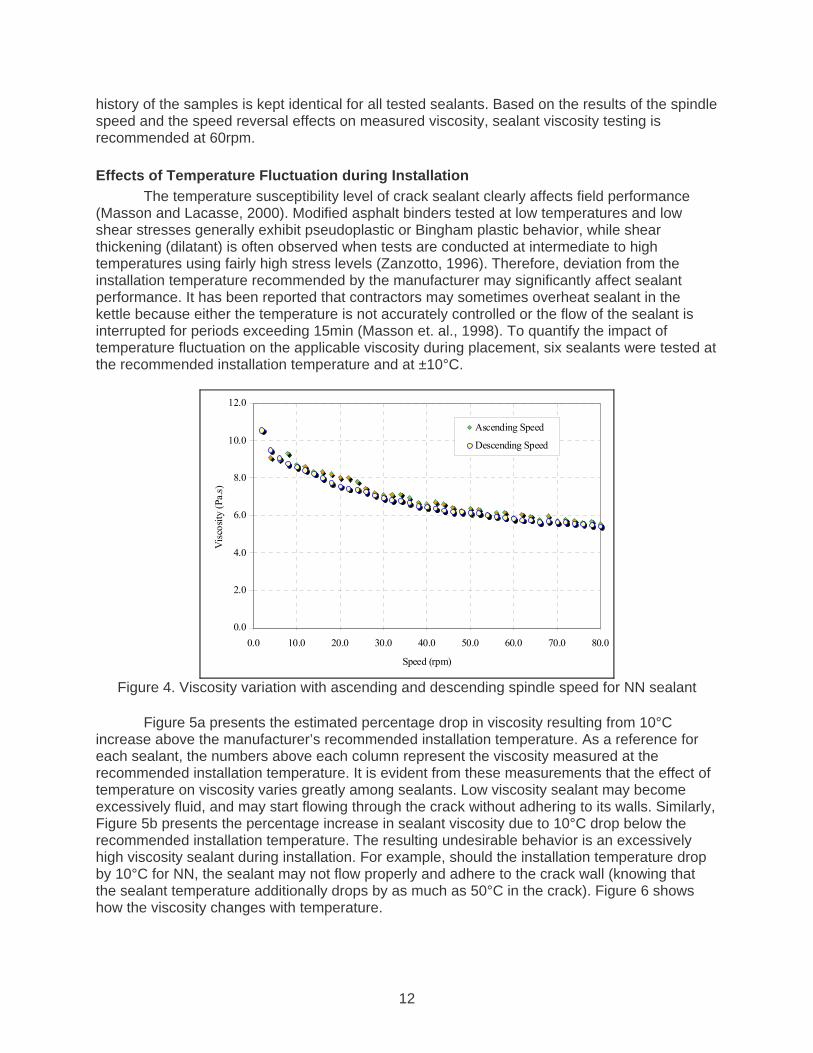
Effect of Speed Reversal
Frequency sweep tests on different sealant samples were conducted in ascending and descending speed orders to evaluate changes that may occur to the molecular structure throughout the test. Figure 4 shows the result of this test for sealant NN. Regardless of the speed order, the crack sealant viscosity decreased with the increase in shear rate (shear thinning). In addition, there was no major difference between the two tests, which indicates that the molecular structure change of the sample is identical with the increase in shear rate regardless of speed order. The change in viscosity with the increase in speed may indicate that some of the shear deformation experienced in the viscosity test is not recoverable. Hence, it is critical to ensure that the specified test setup and procedure are followed and that the shear
Stable
Reg
ion
I
Reg
ion
II
12
history of the samples is kept identical for all tested sealants. Based on the results of the spindle speed and the speed reversal effects on measured viscosity, sealant viscosity testing is recommended at 60rpm. Effects of Temperature Fluctuation during Installation
The temperature susceptibility level of crack sealant clearly affects field performance (Masson and Lacasse, 2000). Modified asphalt binders tested at low temperatures and low shear stresses generally exhibit pseudoplastic or Bingham plastic behavior, while shear thickening (dilatant) is often observed when tests are conducted at intermediate to high temperatures using fairly high stress levels (Zanzotto, 1996). Therefore, deviation from the installation temperature recommended by the manufacturer may significantly affect sealant performance. It has been reported that contractors may sometimes overheat sealant in the kettle because either the temperature is not accurately controlled or the flow of the sealant is interrupted for periods exceeding 15min (Masson et. al., 1998). To quantify the impact of temperature fluctuation on the applicable viscosity during placement, six sealants were tested at the recommended installation temperature and at ±10°C.
0.0
2.0
4.0
6.0
8.0
10.0
12.0
0.0 10.0 20.0 30.0 40.0 50.0 60.0 70.0 80.0
Speed (rpm)
Vis
cosit
y (P
a.s)
Ascending Speed
Descending Speed
Figure 4. Viscosity variation with ascending and descending spindle speed for NN sealant
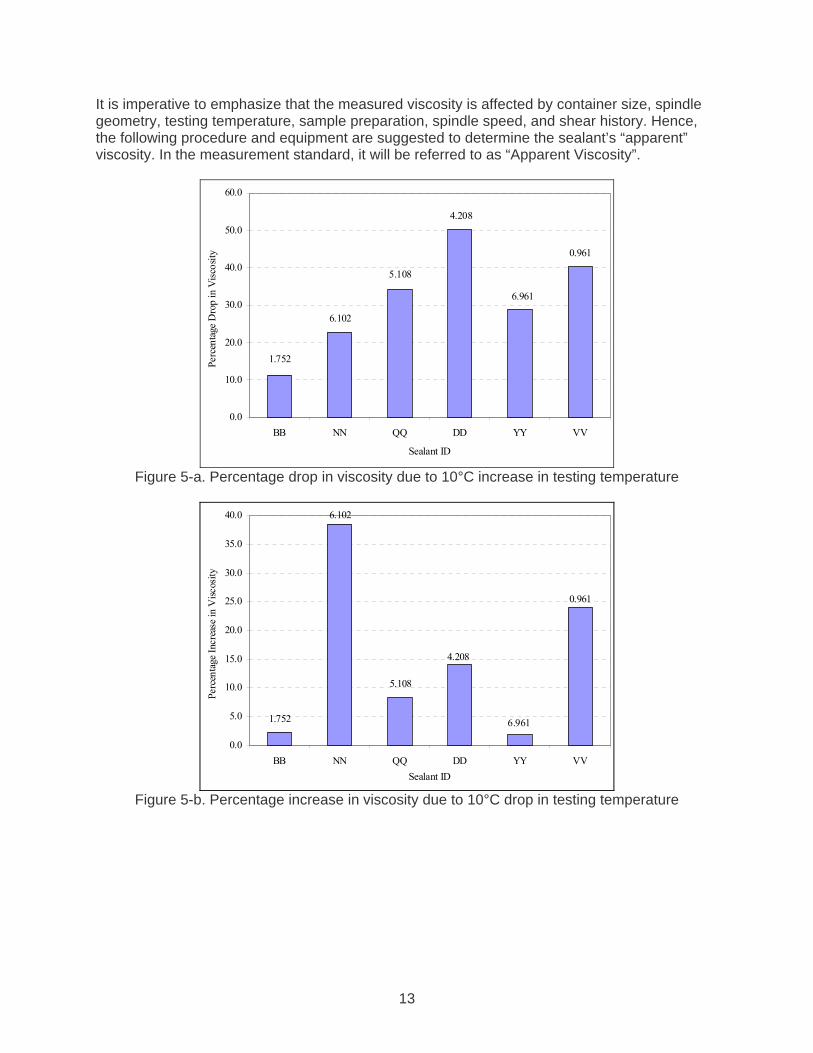
Figure 5a presents the estimated percentage drop in viscosity resulting from 10°C
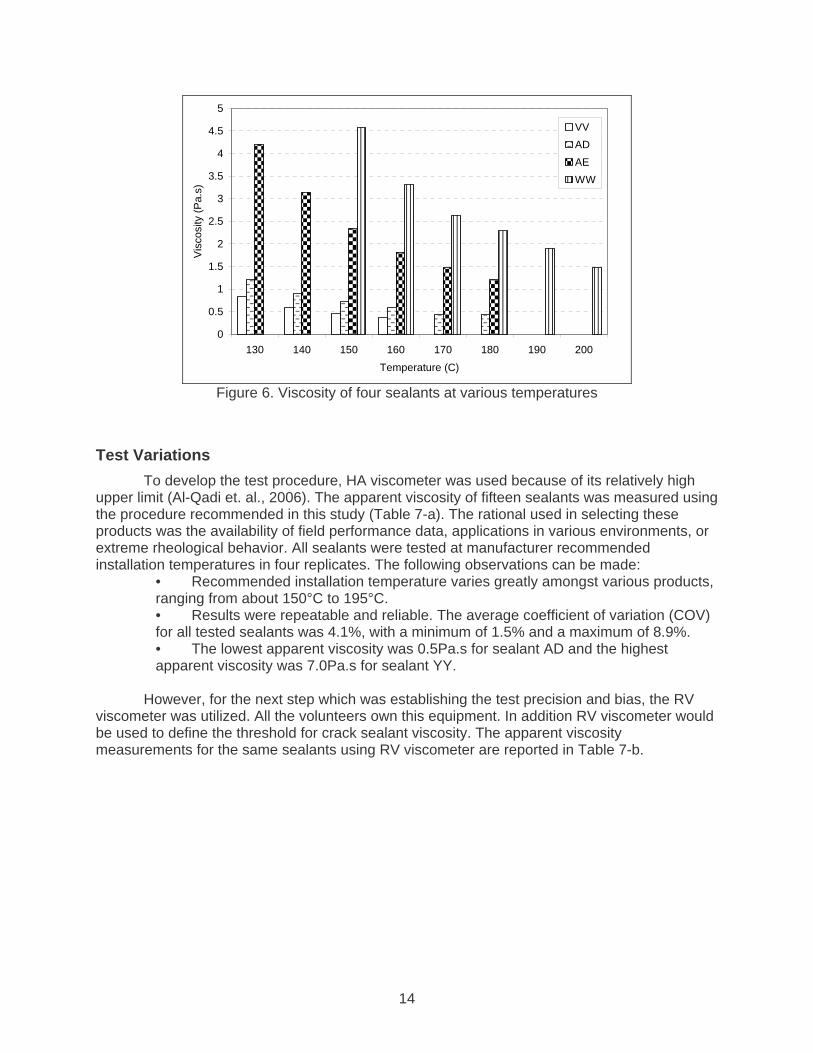
increase above the manufacturer’s recommended installation temperature. As a reference for each sealant, the numbers above each column represent the viscosity measured at the recommended installation temperature. It is evident from these measurements that the effect of temperature on viscosity varies greatly among sealants. Low viscosity sealant may become excessively fluid, and may start flowing through the crack without adhering to its walls. Similarly, Figure 5b presents the percentage increase in sealant viscosity due to 10°C drop below the recommended installation temperature. The resulting undesirable behavior is an excessively high viscosity sealant during installation. For example, should the installation temperature drop by 10°C for NN, the sealant may not flow properly and adhere to the crack wall (knowing that the sealant temperature additionally drops by as much as 50°C in the crack). Figure 6 shows how the viscosity changes with temperature.
13
It is imperative to emphasize that the measured viscosity is affected by container size, spindle geometry, testing temperature, sample preparation, spindle speed, and shear history. Hence, the following procedure and equipment are suggested to determine the sealant’s “apparent” viscosity. In the measurement standard, it will be referred to as “Apparent Viscosity”.
0.0
10.0
20.0
30.0
40.0
50.0
60.0
BB NN QQ DD YY VV
Sealant ID
Perc
enta
ge D
rop
in V
isco
sity
1.752
6.102
5.108
4.208
6.961
0.961
Figure 5-a. Percentage drop in viscosity due to 10°C increase in testing temperature
0.0
5.0
10.0
15.0
20.0
25.0
30.0
35.0
40.0
BB NN QQ DD YY VVSealant ID
Perc
enta
ge In
crea
se in
Visc
osity
1.752
6.102
5.108
4.208
6.961
0.961
Figure 5-b. Percentage increase in viscosity due to 10°C drop in testing temperature
14
0
0.5
1
1.5
2
2.5
3
3.5
4
4.5
5
130 140 150 160 170 180 190 200
Temperature (C)
Vis
cosi
ty (P
a.s)
VVADAEWW
Figure 6. Viscosity of four sealants at various temperatures
Test Variations To develop the test procedure, HA viscometer was used because of its relatively high
upper limit (Al-Qadi et. al., 2006). The apparent viscosity of fifteen sealants was measured using the procedure recommended in this study (Table 7-a). The rational used in selecting these products was the availability of field performance data, applications in various environments, or extreme rheological behavior. All sealants were tested at manufacturer recommended installation temperatures in four replicates. The following observations can be made:
• Recommended installation temperature varies greatly amongst various products, ranging from about 150°C to 195°C. • Results were repeatable and reliable. The average coefficient of variation (COV) for all tested sealants was 4.1%, with a minimum of 1.5% and a maximum of 8.9%. • The lowest apparent viscosity was 0.5Pa.s for sealant AD and the highest apparent viscosity was 7.0Pa.s for sealant YY.
However, for the next step which was establishing the test precision and bias, the RV
viscometer was utilized. All the volunteers own this equipment. In addition RV viscometer would be used to define the threshold for crack sealant viscosity. The apparent viscosity measurements for the same sealants using RV viscometer are reported in Table 7-b.
15
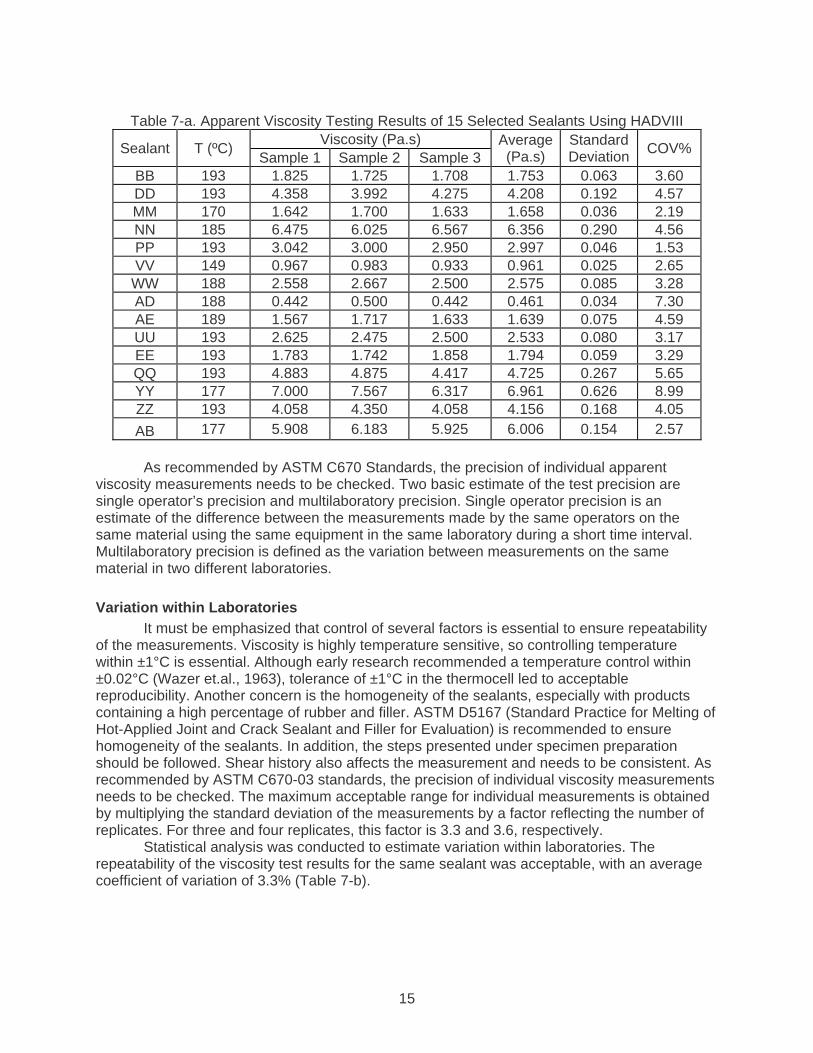
Table 7-a. Apparent Viscosity Testing Results of 15 Selected Sealants Using HADVIII
Sealant T (ºC) Viscosity (Pa.s) Average (Pa.s)
Standard Deviation COV% Sample 1 Sample 2 Sample 3
BB 193 1.825 1.725 1.708 1.753 0.063 3.60 DD 193 4.358 3.992 4.275 4.208 0.192 4.57 MM 170 1.642 1.700 1.633 1.658 0.036 2.19 NN 185 6.475 6.025 6.567 6.356 0.290 4.56 PP 193 3.042 3.000 2.950 2.997 0.046 1.53 VV 149 0.967 0.983 0.933 0.961 0.025 2.65
WW 188 2.558 2.667 2.500 2.575 0.085 3.28 AD 188 0.442 0.500 0.442 0.461 0.034 7.30 AE 189 1.567 1.717 1.633 1.639 0.075 4.59 UU 193 2.625 2.475 2.500 2.533 0.080 3.17 EE 193 1.783 1.742 1.858 1.794 0.059 3.29 QQ 193 4.883 4.875 4.417 4.725 0.267 5.65 YY 177 7.000 7.567 6.317 6.961 0.626 8.99 ZZ 193 4.058 4.350 4.058 4.156 0.168 4.05 AB 177 5.908 6.183 5.925 6.006 0.154 2.57
As recommended by ASTM C670 Standards, the precision of individual apparent
viscosity measurements needs to be checked. Two basic estimate of the test precision are single operator’s precision and multilaboratory precision. Single operator precision is an estimate of the difference between the measurements made by the same operators on the same material using the same equipment in the same laboratory during a short time interval. Multilaboratory precision is defined as the variation between measurements on the same material in two different laboratories.
Variation within Laboratories
It must be emphasized that control of several factors is essential to ensure repeatability of the measurements. Viscosity is highly temperature sensitive, so controlling temperature within ±1°C is essential. Although early research recommended a temperature control within ±0.02°C (Wazer et.al., 1963), tolerance of ±1°C in the thermocell led to acceptable reproducibility. Another concern is the homogeneity of the sealants, especially with products containing a high percentage of rubber and filler. ASTM D5167 (Standard Practice for Melting of Hot-Applied Joint and Crack Sealant and Filler for Evaluation) is recommended to ensure homogeneity of the sealants. In addition, the steps presented under specimen preparation should be followed. Shear history also affects the measurement and needs to be consistent. As recommended by ASTM C670-03 standards, the precision of individual viscosity measurements needs to be checked. The maximum acceptable range for individual measurements is obtained by multiplying the standard deviation of the measurements by a factor reflecting the number of replicates. For three and four replicates, this factor is 3.3 and 3.6, respectively.
Statistical analysis was conducted to estimate variation within laboratories. The repeatability of the viscosity test results for the same sealant was acceptable, with an average coefficient of variation of 3.3% (Table 7-b).
16
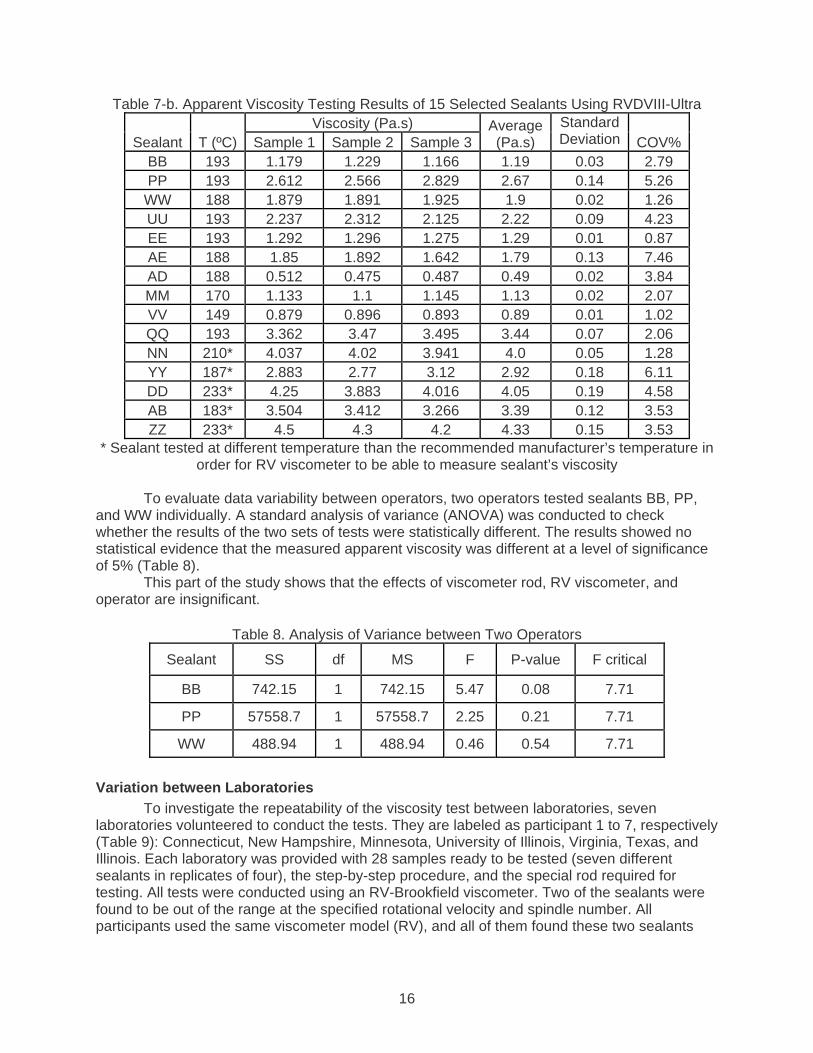
Table 7-b. Apparent Viscosity Testing Results of 15 Selected Sealants Using RVDVIII-Ultra
Sealant T (ºC) Viscosity (Pa.s) Average
(Pa.s) Standard Deviation COV%Sample 1 Sample 2 Sample 3
BB 193 1.179 1.229 1.166 1.19 0.03 2.79 PP 193 2.612 2.566 2.829 2.67 0.14 5.26 WW 188 1.879 1.891 1.925 1.9 0.02 1.26 UU 193 2.237 2.312 2.125 2.22 0.09 4.23 EE 193 1.292 1.296 1.275 1.29 0.01 0.87 AE 188 1.85 1.892 1.642 1.79 0.13 7.46 AD 188 0.512 0.475 0.487 0.49 0.02 3.84 MM 170 1.133 1.1 1.145 1.13 0.02 2.07 VV 149 0.879 0.896 0.893 0.89 0.01 1.02 QQ 193 3.362 3.47 3.495 3.44 0.07 2.06 NN 210* 4.037 4.02 3.941 4.0 0.05 1.28 YY 187* 2.883 2.77 3.12 2.92 0.18 6.11 DD 233* 4.25 3.883 4.016 4.05 0.19 4.58 AB 183* 3.504 3.412 3.266 3.39 0.12 3.53 ZZ 233* 4.5 4.3 4.2 4.33 0.15 3.53
* Sealant tested at different temperature than the recommended manufacturer’s temperature in order for RV viscometer to be able to measure sealant’s viscosity
To evaluate data variability between operators, two operators tested sealants BB, PP,
and WW individually. A standard analysis of variance (ANOVA) was conducted to check whether the results of the two sets of tests were statistically different. The results showed no statistical evidence that the measured apparent viscosity was different at a level of significance of 5% (Table 8).
This part of the study shows that the effects of viscometer rod, RV viscometer, and operator are insignificant.
Table 8. Analysis of Variance between Two Operators
Sealant SS df MS F P-value F critical
BB 742.15 1 742.15 5.47 0.08 7.71
PP 57558.7 1 57558.7 2.25 0.21 7.71
WW 488.94 1 488.94 0.46 0.54 7.71
Variation between Laboratories To investigate the repeatability of the viscosity test between laboratories, seven
laboratories volunteered to conduct the tests. They are labeled as participant 1 to 7, respectively (Table 9): Connecticut, New Hampshire, Minnesota, University of Illinois, Virginia, Texas, and Illinois. Each laboratory was provided with 28 samples ready to be tested (seven different sealants in replicates of four), the step-by-step procedure, and the special rod required for testing. All tests were conducted using an RV-Brookfield viscometer. Two of the sealants were found to be out of the range at the specified rotational velocity and spindle number. All participants used the same viscometer model (RV), and all of them found these two sealants
17
above the acceptable limit of the viscometer. The data related to these two sealants were not included in the analysis.
It was recommended that operators conducting the test should be experienced with viscosity measurements. The sample was prepared following the aforementioned sample preparation procedure from a homogenized bar prepared in accordance with ASTM D5167-03. The test specimens were prepared by the sponsor laboratory (University of Illinois at Urbana-Champaign) and placed in viscosity test aluminum chambers. The tubes were specially wrapped to maintain low temperature during shipping. Tested specimens, four replicates of each sealant, were randomly selected when sent to the laboratories. Although the desirable total replicate number is 30 as recommended by ASTM D5167-03, 28 specimens were deemed sufficient given that seven laboratories participated in the process.
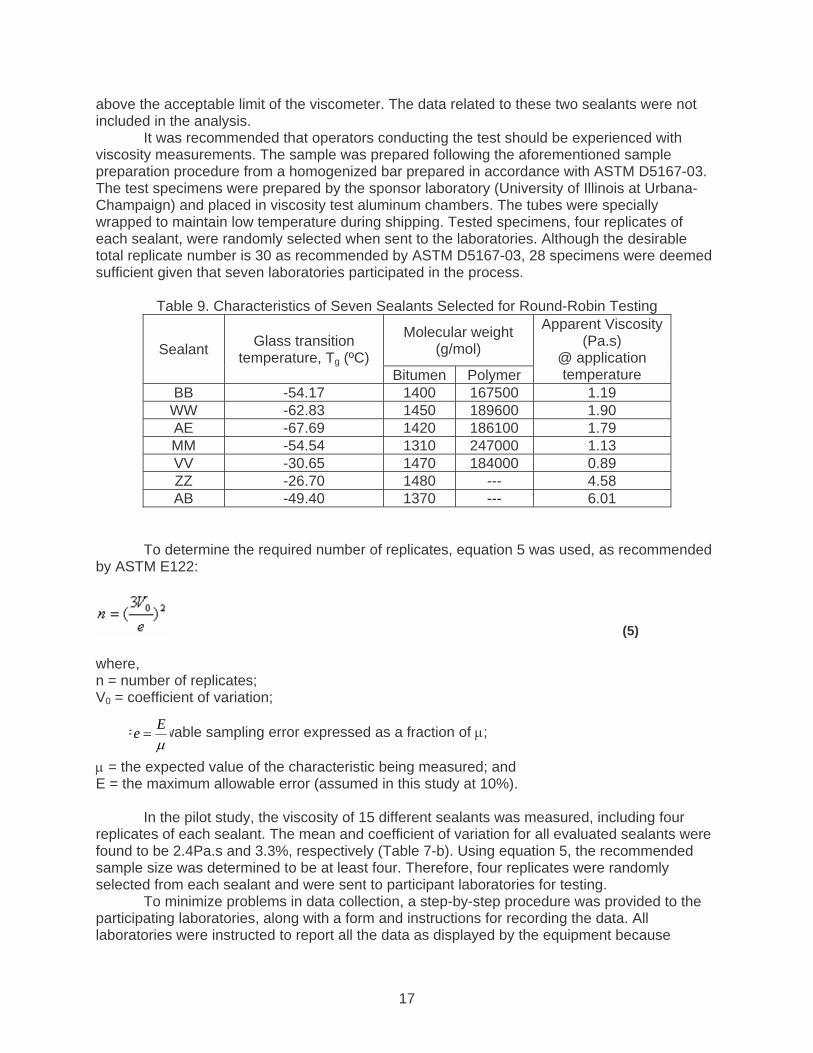
Table 9. Characteristics of Seven Sealants Selected for Round-Robin Testing
Sealant Glass transition temperature, Tg (ºC)
Molecular weight (g/mol)
Apparent Viscosity (Pa.s)
@ application temperature Bitumen Polymer
BB -54.17 1400 167500 1.19 WW -62.83 1450 189600 1.90 AE -67.69 1420 186100 1.79 MM -54.54 1310 247000 1.13 VV -30.65 1470 184000 0.89 ZZ -26.70 1480 --- 4.58 AB -49.40 1370 --- 6.01
To determine the required number of replicates, equation 5 was used, as recommended by ASTM E122:
(5) where, n = number of replicates; V0 = coefficient of variation; = allowable sampling error expressed as a fraction of μ; μ = the expected value of the characteristic being measured; and E = the maximum allowable error (assumed in this study at 10%).
In the pilot study, the viscosity of 15 different sealants was measured, including four replicates of each sealant. The mean and coefficient of variation for all evaluated sealants were found to be 2.4Pa.s and 3.3%, respectively (Table 7-b). Using equation 5, the recommended sample size was determined to be at least four. Therefore, four replicates were randomly selected from each sealant and were sent to participant laboratories for testing.
To minimize problems in data collection, a step-by-step procedure was provided to the participating laboratories, along with a form and instructions for recording the data. All laboratories were instructed to report all the data as displayed by the equipment because
μEe =

18
decisions about rounding measured values, selecting the “best” ones, or reporting the average of several results may conceal some actual variation from the data analyst. The laboratories were asked to report all results and include notes and comments on each test, especially those that were suspect. No data were discarded unless some physical reason showed that they were faulty. The practice of discarding outlier data that show high difference from the others or using purely statistical criteria may result in neglecting some physical problems which may need to be addressed.
The F-test appeared to be an appropriate statistical method for multiple comparisons (seven groups). Analysis of variances and multiple data comparison were conducted for the seven groups. Analysis-of-variance procedures require the following assumptions:
• Each group is an independent random sample from a normal population. • In the population, the variances of the groups are equal.
Hypotheses
The null hypothesis is that all groups have the same means in the population at a 0.05 significance level. The statistical test for this null hypothesis is based on the F ratio. A significant F-value indicates that the population means are not all equal. For this part, no data screening was done, and all four replicates were used in the analysis. As indicated in Table 10, the significant values for all sealants are below 0.05, which means F is significant and the null hypothesis is rejected. Therefore, there is at least one group that is different from the rest. As shown in Table 10, laboratory tests yielded statistically different results for sealant BB. The same procedure was repeated for sealants WW, AE, MM, and VV and indicated that at least one laboratory differed from the rest.
Multiple comparisons were then conducted to determine which means are significantly different from the others. Tukey’s HSD (honestly significant difference) procedure allows for a comparison of the possible pairs of means. For example, if there are six groups, 720 possible paired comparisons (comparisons between individual means) can be performed. Table 11 shows the homogeneous subset for sealant MM, using Tukey’s HSD test. Laboratories that show no significant difference between their means are identified under homogeneous subsets (Table 11). Following the same procedure for the other sealants, at least five laboratories showed the same mean value for each sealant at a significance level of 5%.
Table 10. Analysis of Variance among Seven Different Laboratories Sealant SS df MS F Sig.
BB 0.117 6 0.019 3.231 0.021 WW 0.144 6 0.024 4.251 0.006 AE 0.118 6 0.020 23.362 0.000 MM 0.125 6 0.021 5.831 0.001 VV 0.030 6 0.005 5.763 0.001

19
Table 11. Homogeneous Subsets for Sealant MM, Using Tukey HSD Test
Lab ID N Subset for alpha 1 2
7 4 1.035 --- 2 4 1.117 1.117 3 4 1.140 1.140 4 4 1.162 1.162 1 4 --- 1.190 5 4 --- 1.230 6 4 --- 1.247
Sig. 0.081 0.072 * Subsets 1 and 2 include the viscosity values from 4 and 6 laboratories, respectively
Precision Statement
To obtain estimates of variation between laboratories and within a laboratory, the recommended ASTM E122-00 procedure was followed. In this approach, the pooled laboratory variance (sL
2) and the laboratory component of variance, , are calculated as follows (selecting best three out of four replicates):
(6)
(7)
(8)
(9)
where xi = data from each replicate; n = replicates; = participant laboratories; = average of the three replicates; = Variance of the three replicates;
= Sum of seven averages for the laboratories divided by p; = average of within laboratory variance; = Variance of laboratory averages; and = Laboratory component of variance
In accordance with the viscosity determination procedure, the viscosity is calculated from the best three out of four replicates for all seven laboratories. Table 12 presents the results of this analysis for sealant MM. Columns three and four are within laboratory averages and variances for sealant MM, respectively. Using within-laboratory averages and variances for the seven laboratories, four quantities were calculated for each sealant: the overall average, pooled
20
within-laboratory variance, between-laboratory components of variance, and variance of laboratory averages. The last three rows of Table 12 show these values for sealant MM.
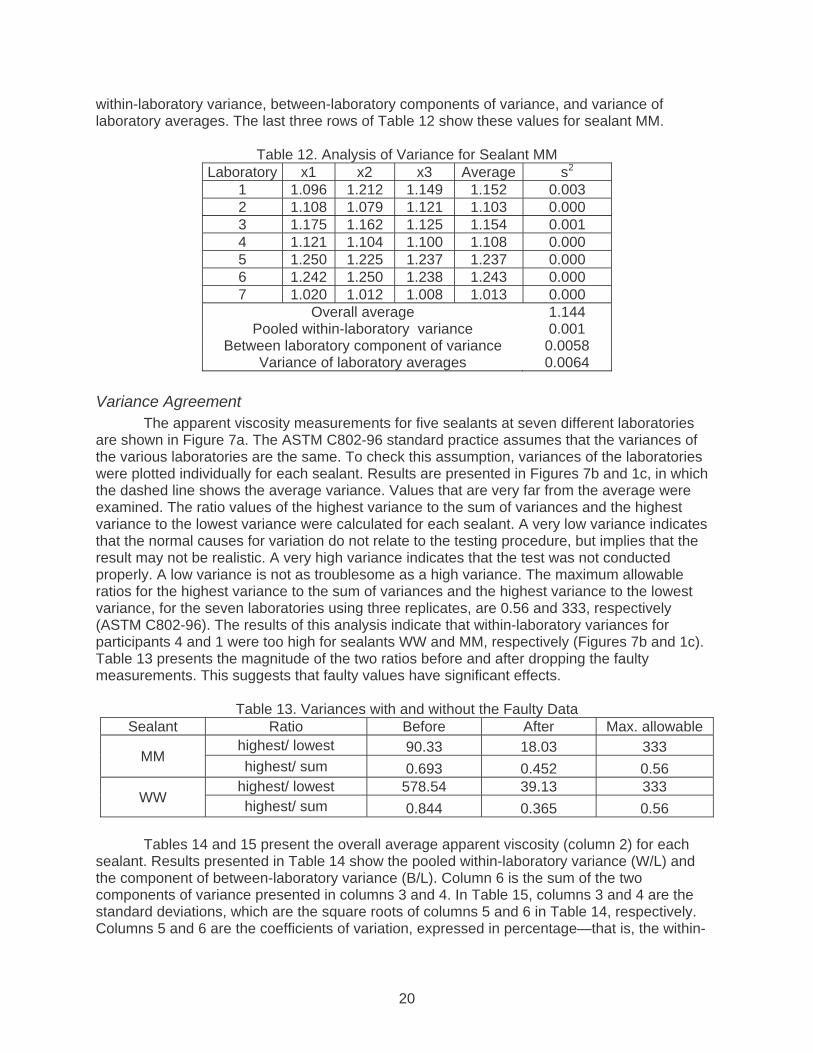
Table 12. Analysis of Variance for Sealant MM
Laboratory x1 x2 x3 Average s2 1 1.096 1.212 1.149 1.152 0.003 2 1.108 1.079 1.121 1.103 0.000 3 1.175 1.162 1.125 1.154 0.001 4 1.121 1.104 1.100 1.108 0.000 5 1.250 1.225 1.237 1.237 0.000 6 1.242 1.250 1.238 1.243 0.000 7 1.020 1.012 1.008 1.013 0.000
Overall average 1.144 Pooled within-laboratory variance 0.001
Between laboratory component of variance 0.0058 Variance of laboratory averages 0.0064
Variance Agreement
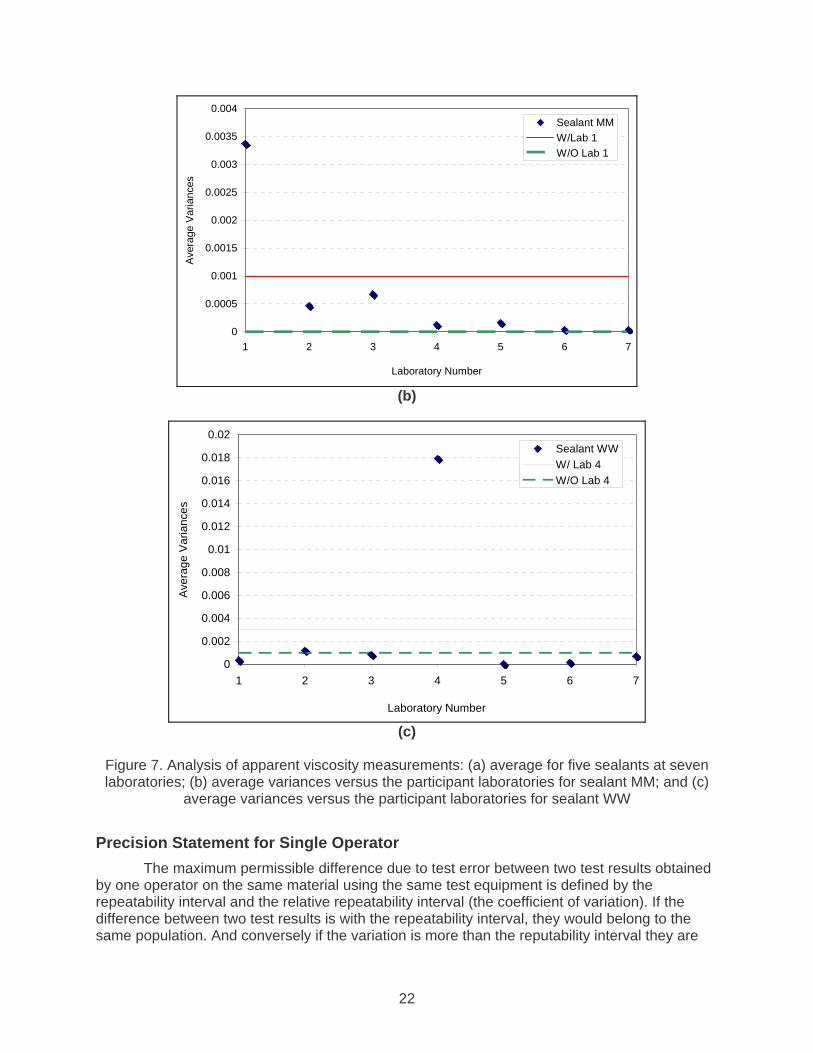
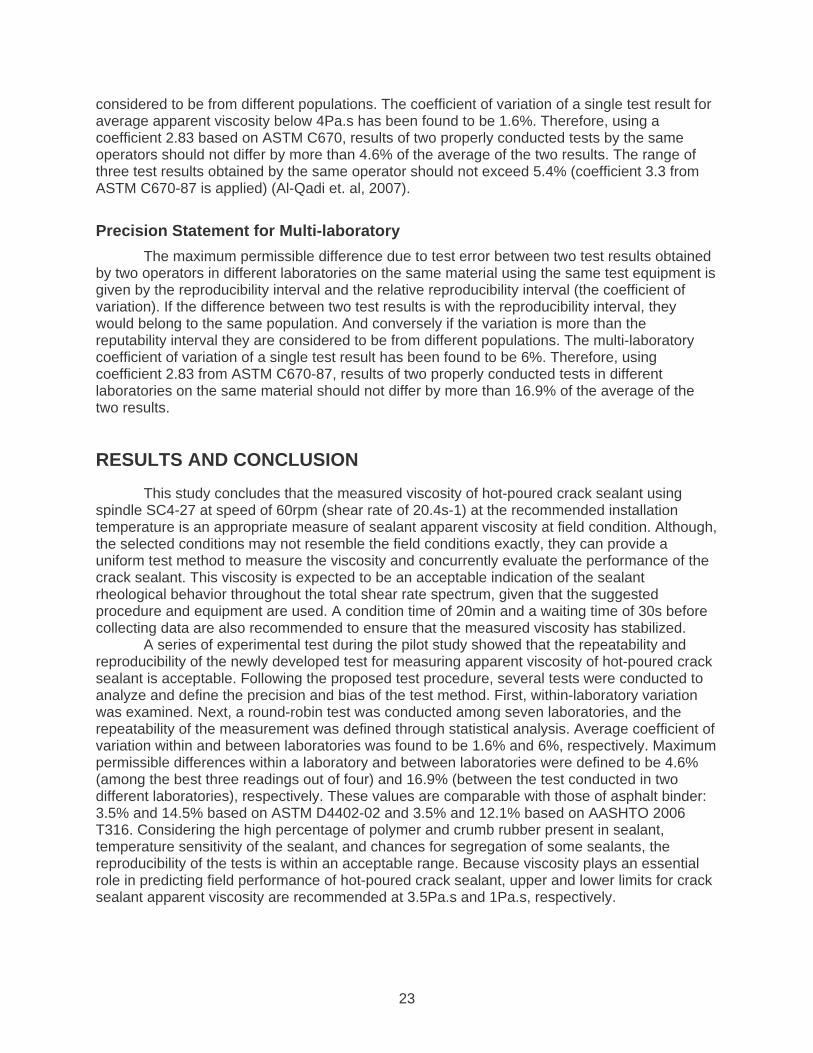
The apparent viscosity measurements for five sealants at seven different laboratories are shown in Figure 7a. The ASTM C802-96 standard practice assumes that the variances of the various laboratories are the same. To check this assumption, variances of the laboratories were plotted individually for each sealant. Results are presented in Figures 7b and 1c, in which the dashed line shows the average variance. Values that are very far from the average were examined. The ratio values of the highest variance to the sum of variances and the highest variance to the lowest variance were calculated for each sealant. A very low variance indicates that the normal causes for variation do not relate to the testing procedure, but implies that the result may not be realistic. A very high variance indicates that the test was not conducted properly. A low variance is not as troublesome as a high variance. The maximum allowable ratios for the highest variance to the sum of variances and the highest variance to the lowest variance, for the seven laboratories using three replicates, are 0.56 and 333, respectively (ASTM C802-96). The results of this analysis indicate that within-laboratory variances for participants 4 and 1 were too high for sealants WW and MM, respectively (Figures 7b and 1c). Table 13 presents the magnitude of the two ratios before and after dropping the faulty measurements. This suggests that faulty values have significant effects.
Table 13. Variances with and without the Faulty Data
Sealant Ratio Before After Max. allowable
MM highest/ lowest 90.33 18.03 333 highest/ sum 0.693 0.452 0.56
WW highest/ lowest 578.54 39.13 333 highest/ sum 0.844 0.365 0.56
Tables 14 and 15 present the overall average apparent viscosity (column 2) for each
sealant. Results presented in Table 14 show the pooled within-laboratory variance (W/L) and the component of between-laboratory variance (B/L). Column 6 is the sum of the two components of variance presented in columns 3 and 4. In Table 15, columns 3 and 4 are the standard deviations, which are the square roots of columns 5 and 6 in Table 14, respectively. Columns 5 and 6 are the coefficients of variation, expressed in percentage—that is, the within-

21
laboratory or between-laboratory standard deviations, respectively, divided by the corresponding average and multiplied by 100.
The average coefficient of variation of within laboratory analysis was 1.6%. Thus, the coefficient of variation was well within the acceptable limit. In the case of variation between laboratories, the average coefficient of variation was 6%. The variation of the results for the multi-laboratory tests was thus within the acceptable limit. These data were used to define the precision of the test and define the acceptable range of variation in test results both within and between laboratories (ASTM C802).
Table 14. Sealant Average Apparent Viscosities, Components of Variance, and Variance
Sealant Average Components of Variance Variance W/L B/L W/L B/L
VV 0.739 0.000 0.002 0.000 0.002 MM 1.143 0.000 0.008 0.000 0.008 BB 0.001 0.001 0.005 0.001 0.006 AE 1.321 0.000 0.005 0.000 0.005
WW 1.651 0.001 0.004 0.001 0.005
Table 15 Sealant Average Apparent Viscosities, Standard Deviation, and Coefficient of Variation
Material Average Standard Deviation Coef. of Variation W/L B/L W/L% B/L%
VV 0.745 0.016 0.044 2.106 5.856 MM 1.160 0.016 0.089 1.358 7.669 BB 1.168 0.029 0.077 2.514 6.562 AE 1.328 0.010 0.074 0.740 5.558
WW 1.671 0.024 0.071 1.408 4.243 Average 0.019 0.071 1.625 5.977
0.0
0.2
0.4
0.6
0.8
1.0
1.2
1.4
1.6
1.8
2.0
1 2 3 4 5
Sealant
Ave
rage
Vis
cosi
ty (P
a.s)
Lab 1Lab 2Lab 3Lab 4Lab 5Lab 6Lab 7
VV MM BB AE WW
(a)
22
0
0.0005
0.001
0.0015
0.002
0.0025
0.003
0.0035
0.004
1 2 3 4 5 6 7
Laboratory Number
Ave
rage
Var
ianc
es
Sealant MMW/Lab 1W/O Lab 1
(b)
0
0.002
0.004
0.006
0.008
0.01
0.012
0.014
0.016
0.018
0.02
1 2 3 4 5 6 7
Laboratory Number
Ave
rage
Var
ianc
es
Sealant WWW/ Lab 4W/O Lab 4
(c)
Figure 7. Analysis of apparent viscosity measurements: (a) average for five sealants at seven laboratories; (b) average variances versus the participant laboratories for sealant MM; and (c)
average variances versus the participant laboratories for sealant WW
Precision Statement for Single Operator The maximum permissible difference due to test error between two test results obtained
by one operator on the same material using the same test equipment is defined by the repeatability interval and the relative repeatability interval (the coefficient of variation). If the difference between two test results is with the repeatability interval, they would belong to the same population. And conversely if the variation is more than the reputability interval they are
23
considered to be from different populations. The coefficient of variation of a single test result for average apparent viscosity below 4Pa.s has been found to be 1.6%. Therefore, using a coefficient 2.83 based on ASTM C670, results of two properly conducted tests by the same operators should not differ by more than 4.6% of the average of the two results. The range of three test results obtained by the same operator should not exceed 5.4% (coefficient 3.3 from ASTM C670-87 is applied) (Al-Qadi et. al, 2007).
Precision Statement for Multi-laboratory The maximum permissible difference due to test error between two test results obtained
by two operators in different laboratories on the same material using the same test equipment is given by the reproducibility interval and the relative reproducibility interval (the coefficient of variation). If the difference between two test results is with the reproducibility interval, they would belong to the same population. And conversely if the variation is more than the reputability interval they are considered to be from different populations. The multi-laboratory coefficient of variation of a single test result has been found to be 6%. Therefore, using coefficient 2.83 from ASTM C670-87, results of two properly conducted tests in different laboratories on the same material should not differ by more than 16.9% of the average of the two results.
RESULTS AND CONCLUSION
This study concludes that the measured viscosity of hot-poured crack sealant using spindle SC4-27 at speed of 60rpm (shear rate of 20.4s-1) at the recommended installation temperature is an appropriate measure of sealant apparent viscosity at field condition. Although, the selected conditions may not resemble the field conditions exactly, they can provide a uniform test method to measure the viscosity and concurrently evaluate the performance of the crack sealant. This viscosity is expected to be an acceptable indication of the sealant rheological behavior throughout the total shear rate spectrum, given that the suggested procedure and equipment are used. A condition time of 20min and a waiting time of 30s before collecting data are also recommended to ensure that the measured viscosity has stabilized.
A series of experimental test during the pilot study showed that the repeatability and reproducibility of the newly developed test for measuring apparent viscosity of hot-poured crack sealant is acceptable. Following the proposed test procedure, several tests were conducted to analyze and define the precision and bias of the test method. First, within-laboratory variation was examined. Next, a round-robin test was conducted among seven laboratories, and the repeatability of the measurement was defined through statistical analysis. Average coefficient of variation within and between laboratories was found to be 1.6% and 6%, respectively. Maximum permissible differences within a laboratory and between laboratories were defined to be 4.6% (among the best three readings out of four) and 16.9% (between the test conducted in two different laboratories), respectively. These values are comparable with those of asphalt binder: 3.5% and 14.5% based on ASTM D4402-02 and 3.5% and 12.1% based on AASHTO 2006 T316. Considering the high percentage of polymer and crumb rubber present in sealant, temperature sensitivity of the sealant, and chances for segregation of some sealants, the reproducibility of the tests is within an acceptable range. Because viscosity plays an essential role in predicting field performance of hot-poured crack sealant, upper and lower limits for crack sealant apparent viscosity are recommended at 3.5Pa.s and 1Pa.s, respectively.

24
RECOMMENDATION
A new method to measure the hot-poured crack sealant apparent viscosity is presented. It is recommended that the test procedure, utilizing the modified RV viscometer, be implemented as part of the newly developed Performance-Based Guidelines for the Selection of Hot-Poured Crack Sealants. The study recommends that the apparent viscosity of hot-poured crack sealant at recommended installation temperature be in the range of 1-3.5Pa.s
REFERENCES
Al-Qadi, I. L., Fini, E., Elseifi, M., Masson, J-F., And McGhee, K. Development of a Viscosity Specification for Hot-Poured Bituminous Sealants, Journal of Testing and Evaluation, ASTM, 2007, pp. 395–403. Al-Qadi, I. L., Fini, E., Masson, J-F., and Elseifi, M. Procedure for Viscosity Determination of Hot-Poured Bituminous Sealants, Transportation Research Record: Journal of the Transportation Research Record, TRR No. 1958, National Research Council, Washington, D.C., 2006, pp. 74–81. Al-Qadi, I. L., Loulizi, A., Aref, S., Masson, J -F., and McGhee, K. Modification of Bending Beam Rheometer Specimen for Low-Temperature Evaluation of Bituminous Crack Sealants, the 84th Transportation Research Board Annual meeting, Washington, D.C., 2005. Chehovits, J., and Manning, M. Materials and Methods for Sealing Cracks in Asphalt Concrete Pavements, Transportation Research Record: Journal of the Transportation Research Record, TRR No. 990, National Research Council, Washington, D.C., 1984, pp. 21–30. Collins, P., Masson, J-F., and Al-Qadi, I. L. Cooling Rates in Hot-Poured Bituminous Sealants, Transportation Research Record: Journal of the Transportation Research Record, TRR No. 1958, National Research Council, Washington, D.C., 2006, pp. 71–73. Ketcham, S. A. Sealants and Cold Regions Pavement Seals – A Review, CRREL Report 95-11, US Army Corps of Engineers, 1995. Lavin, P. Asphalt Pavements – A Practical Guide to Design, Production and Maintenance for Engineers and Architects, 1st Ed., Spon Press, NY, 2003. Lynch, L. N., and Janssen, D. J. Sealant Specifications: Past, Present and Future, In Proceedings of the Pavement Crack and Joint Sealants for Rigid and Flexible Pavements Conference, Vicksburg, USA, May 21-22, 1997. Masson, J-F., Collins, P., Margeson, J. Analysis of Bituminous Crack Sealants by Physicochemical Methods: Relationship to Field Performance, Transportation Research
25
Record: Journal of the Transportation Research Record, TRR No.1795, National Research Council, Washington, D.C., 2002, pp. 33–39. Masson, J-F., and Lacasse, M. A. A Review of Adhesion Mechanisms at the Crack Sealant Asphalt Concrete Interface, In proceedings of the 3rd International Symposium on Durability of Building and Construction Sealants, A. Wolf, Ed., RILEM, Paris, 2000, pp. 259–274. Masson, J-F., Lauzier, C., Collins, P., Légaré, P-P. Crack Sealant Performance in Cold Urban Conditions, Canadian Journal of Civil Engineering, 26, 1999, pp. 395–401. Masson, J-F., Lauzier, C., Collins, P., and Lacasse, M. A. Sealant Degradation during Crack Sealing of Pavements, Journal of Materials in Civil Engineering, Vol. 10, No. 4, 1998, pp. 250–255. Schweyer, H. E., Bryon, R. B., and Potts, C. F. New Approach for Studying Rheology Properties of Asphalts, ASTM Special Technical Publication, Houston, TX, 1983, pp. 3–4. Schweyer, H. E., Tia, M., and Ruth, B. E. Basic Rheology and Rheological Concepts Established by H.E. Schweyer, ASTM Special Technical Publication 941, 1987, pp. 118–145. Smith, K. L., and Romine, A. R. Innovative Materials Development and Testing, Treatment of Cracks in Asphalt Concrete-Surfaced Pavements, Vol. 3, SHRP-H-354, 1993. Stevens, L. B. Road Surface Management for Local Governments – Resource Notebook, Federal Highway Administration, Report No. DOT-I-85-37, 1985. Wazer, J. R. M., Lyons, J. W., Kim, K. Y., and Colwell, R. E. Viscosity and Flow Measurements, John Wiley & Sons, Inc. 1963. Wicks, Z. W., Jones, F. N., and Pappas, S. P. Applications, Properties and Performance, In Organic Coating: Science and technology, Vol.2, Chapter XIX, pp. 1–28, John Wiley & Sons, Inc. 1994. Zanzotto, L. Laboratory Testing of Crack Sealant Materials for Flexible Pavements, Transportation Association of Canada, Ottawa, Canada, 1996. Zaman, A. A., Fricke, A. L., Beatty, C. L. Rheological Properties of Rubber-Modified Asphalt, Journal of Transportation Engineering, Vol. 121, No. 6, 1995, pp. 461–467. ASTM, Standard Practice for Calculating Sample Size to Estimate, With Specified Precision, the Average for a Characteristic of a Lot or Process, Annual Book of ASTM Standards, Volume 14.02, ASTM, West Conshohocken, PA, 2000.

26
ASTM Standard on Precision and Bias for Various Applications, Fifth Edition, 1997, PA 19428-2959. Brookfield Engineering, More Solutions to Sticky Problems – A Guide to Getting More from Brookfield Viscometer, 2000.

A-1
APPENDIX A
Test Method for Apparent Viscosity of Hot-poured Crack Sealant Using Brookfield Rotational Viscometer RV Series Instrument Sealant Consortium Designation: SC-2
1. SCOPE 1.1. This test method outlines the procedure for measuring the viscosity of hot-poured bituminous crack sealant at elevated temperature from 150ºC to 200ºC using a Rotational Viscometer. 1.2. The rotational viscometer is a rotating spindle-type viscometer that meets the requirements of the AASHTO T 316, Standard Viscosity Determination of Asphalt Binder. This test method can be used for general specification and is especially convenient for use in a field laboratory or a plant site. 1.3. This standard may involve hazardous material, operations, and equipment. This standard does not purport to address all of the safety problems associated with its use. It is the responsibility of the user of this standard to establish appropriate safety and health practices and determine the application of regulatory limitations prior to use. 2. REFERENCED DOCUMENTS 2.1. AASHTO Standards: • T316, AASHTO T316, Viscosity Determination of Asphalt Binder Using Rotational Viscometer. 2.2. ASTM Standards: • D5167-03, Standard Practice for Melting Hot-Applied Joint and Crack Sealant and Filler for Evaluation. • D4402-06, Standard Test Method for Viscosity Determination of Asphalt at Elevated Temperature Using a Rotational Viscometer. • E220-07, Test Method for Calibration of Thermocouples by Comparison Techniques. • E1, Specification for ASTM Thermometers • E145-94(2006), Standard Specification for Gravity-Convection and Forced-Ventilation Ovens. • C670, Practice for preparing Precision and Bias Statements for Test Methods for Construction Materials. 2.3. Sealant Consortium (SC) Standards: • SC-1, Guidelines for Graded Bituminous Sealants. • SC-2, Test Method for Measuring Apparent Viscosity of Hot-poured Crack Sealant Using Brookfield Rotational Viscometer RV Series Instrument • SC-3, Method for the Accelerated Aging of Bituminous Sealants. • SC-4, Method to Measure Low Temperature Sealant Flexural Creep Stiffness at Low Temperature by Bending Beam Rheometer. • SC-5, Method to Evaluate Sealant Extensibility at Low Temperature by Direct Tension Test. • SC-6, Adhesion Test Method to Predict the Adhesion of Bituminous Sealants.
A-2
3. TERMINOLOGY 3.1. Hot-poured crack sealants are hot-poured modified asphaltic materials used in pavement cracks and joints. 3.2. Apparent viscosity is the ratio of shear stress to shear rate for a liquid. This parameter is a measure of the resistance to flow of the liquid. The SI unit of viscosity is the Pascal second (Pa.s). 4. SUMMARY OF METHOD 4.1. Crack sealant material is homogenized according to ASTM D5167-03, cut into pieces not larger than 5mm (the largest dimension), and placed into standard containers. Apparent viscosity is measured utilizing the Brookfield viscometer using Spindle #SC4-27; the spindle is attached to the rigid hook attachment and rotates at the speed of 60 rpm. The test is conducted at the manufacturer’s recommended installation temperature. 5. SIGNIFICANCE AND USE 5.1. This test is intended for bituminous sealants applied to roadway joints and cracks. 5.2. This procedure is designed to simulate the viscosity of crack sealants while pouring in the cracks. 5.3. Sealants must be homogenized (ASTM D5167-03) before measuring the apparent viscosity by this method. 6. APPARATUS 6.1. Brook field rotational viscometer RV Series Instrument 6.2. Brookfield Thermosel, maintaining a temperature ranging from 170°C to 193°C ± 1°C. 6.3. Laboratory oven – any laboratory standard oven capable of producing and maintaining a temperature ranging from 170°C to 193°C ± 1°C. 6.4. Rigid hook attachment especially designed as an attachment in Brookfield viscometer to measure hot-poured crack sealant viscosity. 6.5. Disposal aluminum containers or standard Brookfield containers. 6.6. The rotational viscometer contains sensors that monitors the applied torque and automatically displays the calculated apparent viscosity. The keypad on the instrument is used to enter the spindle number, zero the signal, and run the test at a selected speed. Torque and viscosity can be recorded manually, or an interface can be used to send the signal from the instrument to a personal computer. Optional software is also available that can be used to program preselected thermal profiles. This software is not needed for the specification test. However, the Thermosel must be used to control the temperature and thereby obtain acceptable reproducibility. 7. HAZARDS 7.1. Standard laboratory caution should be used in handling hot sealant in accordance to ASTM D5167-03, and when using the Brookfield Thermosel. Required safety procedures should be followed when chemical agents are used.
A-3
8. PREPARATION OF APPARATUS 8.1. The rotational viscometer must be leveled to function properly. A bubble-type level is normally located on top of the viscometer and is adjusted by using leveling screws located on the base. Preparing the device, leveling and aligning of the viscometer on the stand, and setting the temperature of the Thermosel are explained in the operation instructions provided by the manufacturer. The detailed steps for testing are specified in the AASHTO Standard Test Method T316-06. 9. CALIBRATION AND STANDARDIZATION 9.1. Temperatures of the ovens should be calibrated in accordance with each user’s quality assurance program. 9.2. Thermometer (temperature detector) should be calibrated every six months to ensure precision of +/-1°C. 9.3. The accuracy of the viscometer should be checked annually using a certified reference fluid of known viscosity following the procedure recommended by manufacturer. 10. PREPARATION OF SAMPLES AND TEST SPECIMENS All apparent viscosity measurements must be performed on homogenized sealant. Sealant homogenization is conducted in accordance with the procedure presented in ASTM D5167-03, Melting of Hot-Applied Joint and Crack Sealant and Filler for Evaluation. 10.1. Once homogenized, hot sealant should be cooled down to room temperature and stored for 24hr before usage. It is recommended that a can or plastic-lined box be used. The container must be of sufficient size so that the sealant depth is no greater than 100 mm to allow for rapid cooling. 10.2. 10.5g of the homogenized sealant should be cut into small pieces not larger than 5mm and placed in aluminum chambers. Disposable chambers able be installed in the Thermosel shall be used. . 10.3. Preheat Thermosel to test temperature, and unless otherwise noted, use temperature recommended by the producer. 10.4. Place aluminum chamber including sealant in Thermosel. 10.5. Turn on the viscometer and zero it. 10.6. Allow 5 minutes for sealant to melt. 10.7. Assemble spindle # SC4-27 and attach to a rigid rod, see Note 1. Note 1—The current hook which is used for asphalt cement may not be applied to asphalt binder that contains rubber fillers, which would affect the spindle’s rotation. Figures 1 through 3 illustrate the spindle and the rigid rod. 10.8. Allow 20min to stabilize the temperature; adjust stirring speed of the spindle to 60rpm. 10.9. Start testing and record the data right after 30sec of stirring. After the data is recorded, stop the test and clean the spindle and remove the aluminum chamber.
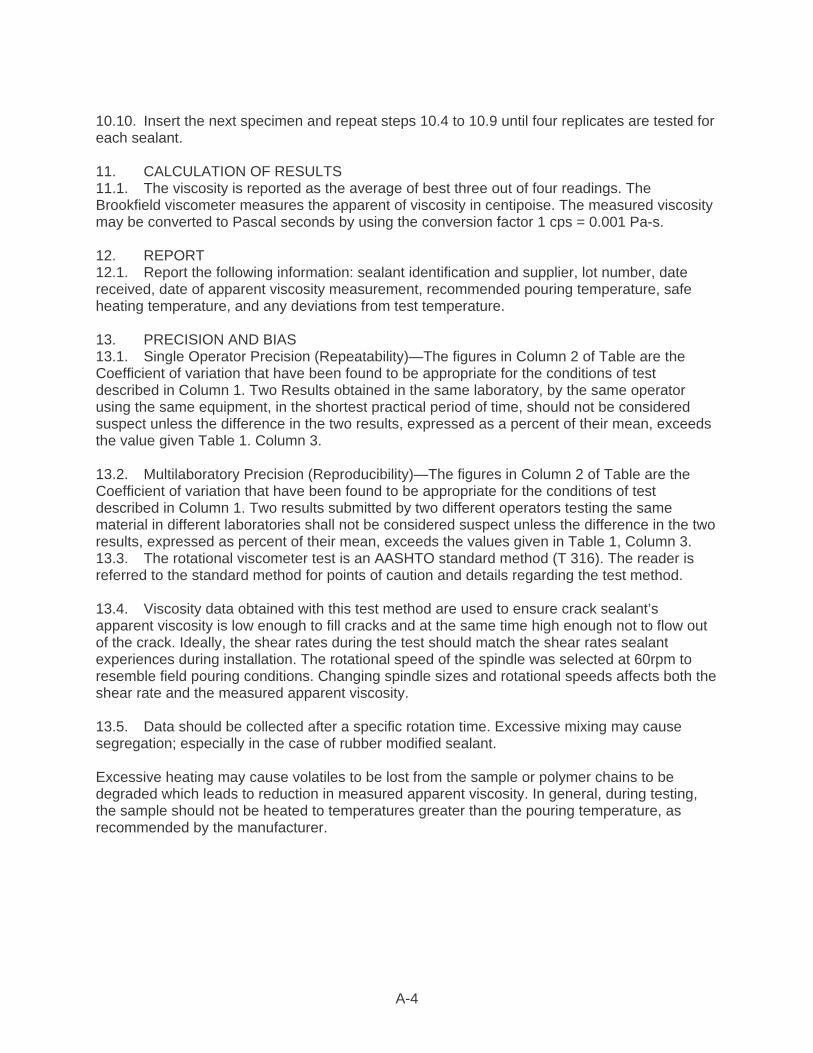
A-4
10.10. Insert the next specimen and repeat steps 10.4 to 10.9 until four replicates are tested for each sealant. 11. CALCULATION OF RESULTS 11.1. The viscosity is reported as the average of best three out of four readings. The Brookfield viscometer measures the apparent of viscosity in centipoise. The measured viscosity may be converted to Pascal seconds by using the conversion factor 1 cps = 0.001 Pa-s. 12. REPORT 12.1. Report the following information: sealant identification and supplier, lot number, date received, date of apparent viscosity measurement, recommended pouring temperature, safe heating temperature, and any deviations from test temperature. 13. PRECISION AND BIAS 13.1. Single Operator Precision (Repeatability)—The figures in Column 2 of Table are the Coefficient of variation that have been found to be appropriate for the conditions of test described in Column 1. Two Results obtained in the same laboratory, by the same operator using the same equipment, in the shortest practical period of time, should not be considered suspect unless the difference in the two results, expressed as a percent of their mean, exceeds the value given Table 1. Column 3. 13.2. Multilaboratory Precision (Reproducibility)—The figures in Column 2 of Table are the Coefficient of variation that have been found to be appropriate for the conditions of test described in Column 1. Two results submitted by two different operators testing the same material in different laboratories shall not be considered suspect unless the difference in the two results, expressed as percent of their mean, exceeds the values given in Table 1, Column 3. 13.3. The rotational viscometer test is an AASHTO standard method (T 316). The reader is referred to the standard method for points of caution and details regarding the test method. 13.4. Viscosity data obtained with this test method are used to ensure crack sealant’s apparent viscosity is low enough to fill cracks and at the same time high enough not to flow out of the crack. Ideally, the shear rates during the test should match the shear rates sealant experiences during installation. The rotational speed of the spindle was selected at 60rpm to resemble field pouring conditions. Changing spindle sizes and rotational speeds affects both the shear rate and the measured apparent viscosity. 13.5. Data should be collected after a specific rotation time. Excessive mixing may cause segregation; especially in the case of rubber modified sealant. Excessive heating may cause volatiles to be lost from the sample or polymer chains to be degraded which leads to reduction in measured apparent viscosity. In general, during testing, the sample should not be heated to temperatures greater than the pouring temperature, as recommended by the manufacturer.

A-5
Table A1—Precision Estimates
Condition
Coefficient of Variation
Acceptable Range of Three Test
Results
(1s%)a (d2s%)a Single-Operator Precision:
Average Viscosity (Pa.s) 1.62 5.4 Multilaboratory Precision
Average Viscosity (Pa.s) 5.9 16.9 Note 2—The precision estimates given in Table 2 are based on the analysis of test results from seven sealant with a wide range of rheological properties. The data analyzed includes results from seven laboratories who conducted each test in four replicates. Note 3—As an example, two tests conducted on the same material yield viscosity results of 3.12, 3.05, 3.15Pa.s, respectively. The average of these three measurements is 3.11 Pa.s. The acceptable range of results is then 5.4 percent of 3.11 or 0.17 Pa.s. As the greatest difference between each two, 0.1 is less than 0.17, the results are within the acceptable range. 14. KEYWORDS 14.1. Hot-poured bituminous sealant; fillers; joint; crack; apparent viscosity rotational viscometer.
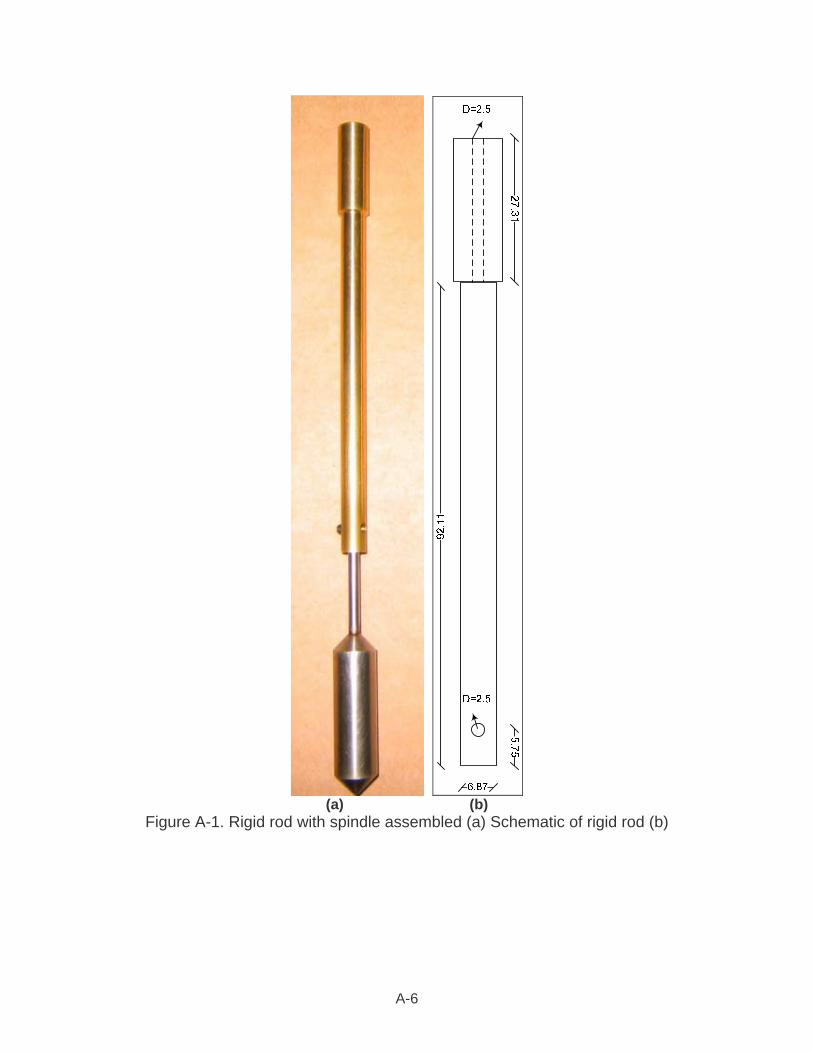
A-6
(a) (b)
Figure A-1. Rigid rod with spindle assembled (a) Schematic of rigid rod (b)
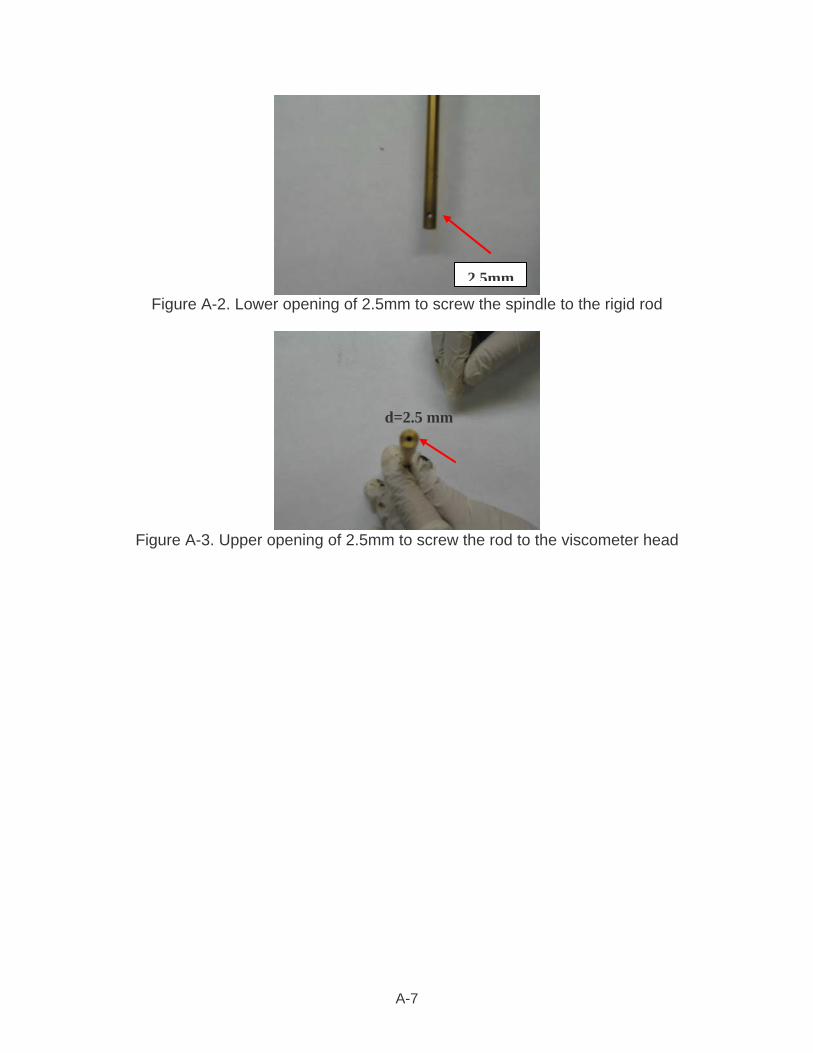
A-7
Figure A-2. Lower opening of 2.5mm to screw the spindle to the rigid rod
Figure A-3. Upper opening of 2.5mm to screw the rod to the viscometer head
d=2.5 mm
2.5mm
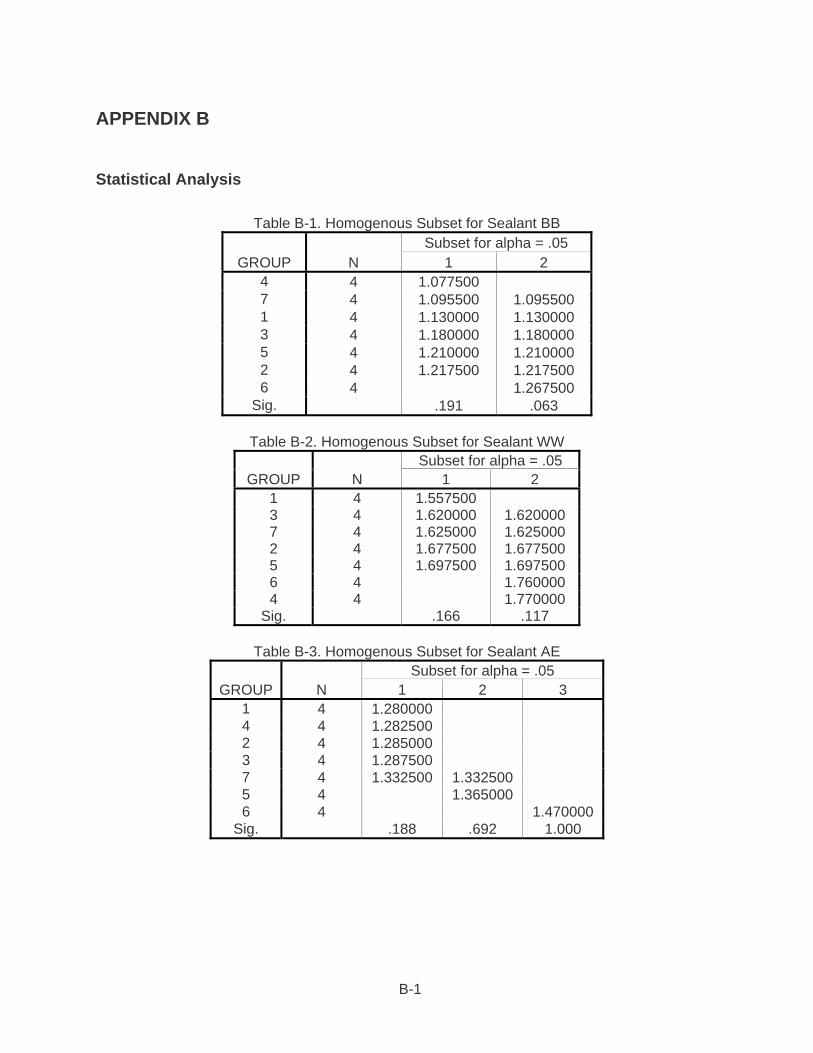
B-1
APPENDIX B
Statistical Analysis
Table B-1. Homogenous Subset for Sealant BB
GROUP N Subset for alpha = .05
1 2 4 4 1.077500 7 4 1.095500 1.095500 1 4 1.130000 1.130000 3 4 1.180000 1.180000 5 4 1.210000 1.210000 2 4 1.217500 1.217500 6 4 1.267500
Sig. .191 .063
Table B-2. Homogenous Subset for Sealant WW
GROUP N Subset for alpha = .05
1 2 1 4 1.557500 3 4 1.620000 1.620000 7 4 1.625000 1.625000 2 4 1.677500 1.677500 5 4 1.697500 1.697500 6 4 1.760000 4 4 1.770000
Sig. .166 .117
Table B-3. Homogenous Subset for Sealant AE
GROUP N Subset for alpha = .05
1 2 3 1 4 1.280000 4 4 1.282500 2 4 1.285000 3 4 1.287500 7 4 1.332500 1.332500 5 4 1.365000 6 4 1.470000
Sig. .188 .692 1.000
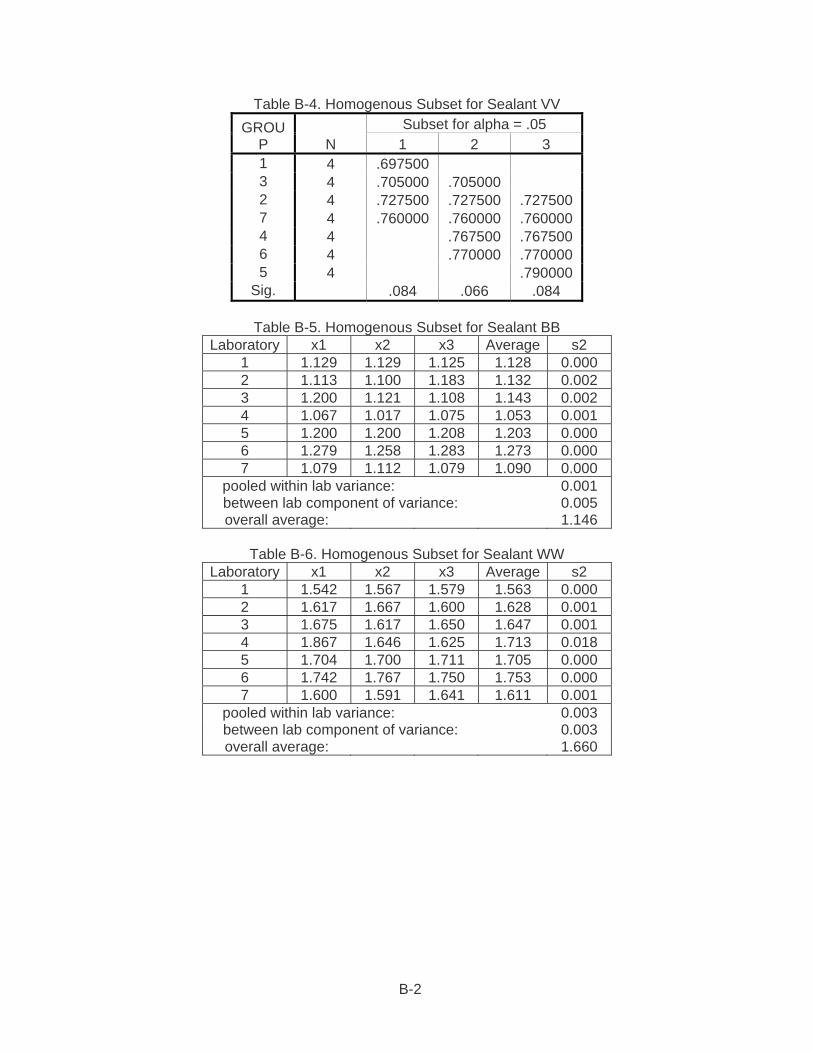
B-2
Table B-4. Homogenous Subset for Sealant VV GROU
P N Subset for alpha = .05
1 2 3 1 4 .697500 3 4 .705000 .705000 2 4 .727500 .727500 .727500 7 4 .760000 .760000 .760000 4 4 .767500 .767500 6 4 .770000 .770000 5 4 .790000
Sig. .084 .066 .084
Table B-5. Homogenous Subset for Sealant BB Laboratory x1 x2 x3 Average s2
1 1.129 1.129 1.125 1.128 0.000 2 1.113 1.100 1.183 1.132 0.002 3 1.200 1.121 1.108 1.143 0.002 4 1.067 1.017 1.075 1.053 0.001 5 1.200 1.200 1.208 1.203 0.000 6 1.279 1.258 1.283 1.273 0.000 7 1.079 1.112 1.079 1.090 0.000
pooled within lab variance: 0.001 between lab component of variance: 0.005 overall average: 1.146
Table B-6. Homogenous Subset for Sealant WW
Laboratory x1 x2 x3 Average s2 1 1.542 1.567 1.579 1.563 0.000 2 1.617 1.667 1.600 1.628 0.001 3 1.675 1.617 1.650 1.647 0.001 4 1.867 1.646 1.625 1.713 0.018 5 1.704 1.700 1.711 1.705 0.000 6 1.742 1.767 1.750 1.753 0.000 7 1.600 1.591 1.641 1.611 0.001
pooled within lab variance: 0.003 between lab component of variance: 0.003 overall average: 1.660
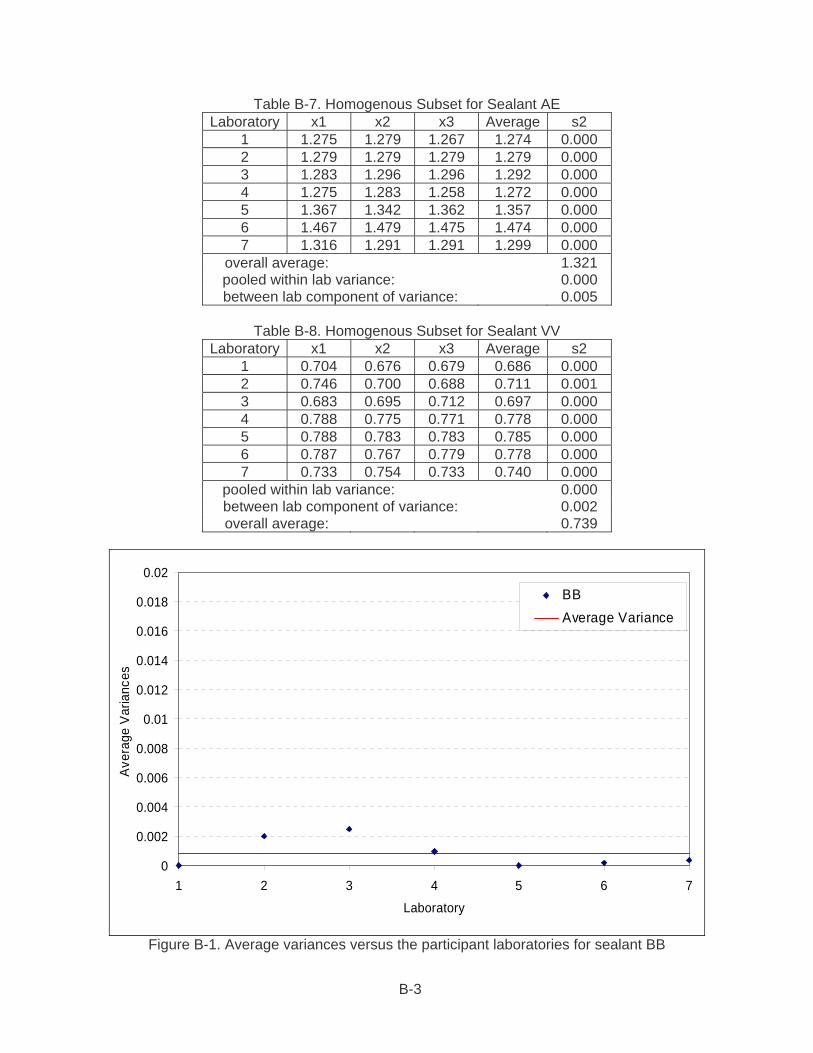
B-3
Table B-7. Homogenous Subset for Sealant AE Laboratory x1 x2 x3 Average s2
1 1.275 1.279 1.267 1.274 0.000 2 1.279 1.279 1.279 1.279 0.000 3 1.283 1.296 1.296 1.292 0.000 4 1.275 1.283 1.258 1.272 0.000 5 1.367 1.342 1.362 1.357 0.000 6 1.467 1.479 1.475 1.474 0.000 7 1.316 1.291 1.291 1.299 0.000
overall average: 1.321 pooled within lab variance: 0.000 between lab component of variance: 0.005
Table B-8. Homogenous Subset for Sealant VV
Laboratory x1 x2 x3 Average s2 1 0.704 0.676 0.679 0.686 0.000 2 0.746 0.700 0.688 0.711 0.001 3 0.683 0.695 0.712 0.697 0.000 4 0.788 0.775 0.771 0.778 0.000 5 0.788 0.783 0.783 0.785 0.000 6 0.787 0.767 0.779 0.778 0.000 7 0.733 0.754 0.733 0.740 0.000
pooled within lab variance: 0.000 between lab component of variance: 0.002 overall average: 0.739
0
0.002
0.004
0.006
0.008
0.01
0.012
0.014
0.016
0.018
0.02
1 2 3 4 5 6 7
Laboratory
Aver
age
Varia
nces
BBAverage Variance
Figure B-1. Average variances versus the participant laboratories for sealant BB
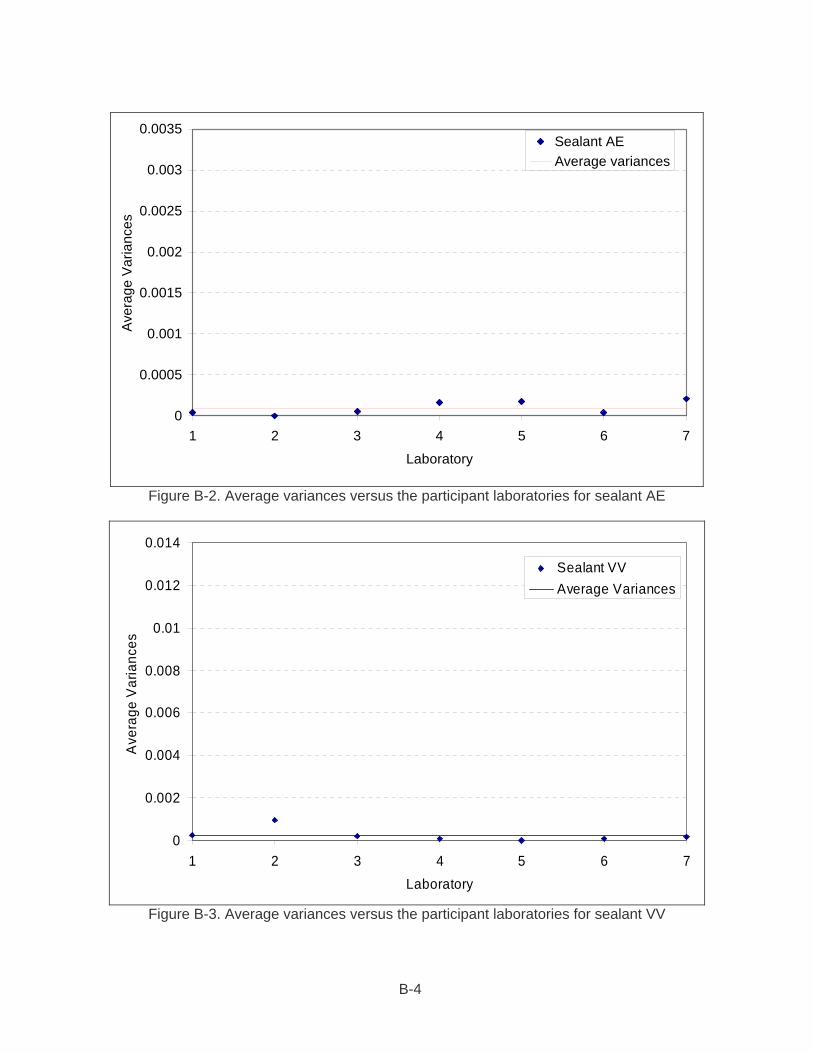
B-4
0
0.0005
0.001
0.0015
0.002
0.0025
0.003
0.0035
1 2 3 4 5 6 7
Laboratory
Aver
age
Varia
nces
Sealant AEAverage variances
Figure B-2. Average variances versus the participant laboratories for sealant AE
0
0.002
0.004
0.006
0.008
0.01
0.012
0.014
1 2 3 4 5 6 7Laboratory
Ave
rage
Var
ianc
es
Sealant VVAverage Variances
Figure B-3. Average variances versus the participant laboratories for sealant VV