development of indian mining industry – the way forward
TRANSCRIPT

1
Development of Indian
Mining Industry – The
Way Forward
Non-Fuel Minerals
FICCI Mines and Metals Division
October 2013

2
Copyright © 2013 Federation of Indian Chambers of Commerce & Industry All contents in this report is the property of Federation of Indian Chambers of
Commerce & Industry (FICCI) and is protected by Indian and international
copyright laws. Any other use, including the reproduction, modification,
distribution, transmission, republication, display or performance, of the content in
this report is strictly prohibited without written permission from FICCI.
Compiled by:
Arnab Kumar Hazra, Director, FICCI
S B S Chauhan, Advisor and Member FICCI Mining Committee
Arpan Gupta, Senior Assistant Director, FICCI
Ekta Sharma, Research Assistant, FICCI
Mines and Metals Division
Federation of Indian Chamber of Commerce and Industry
Federation House
Tansen Marg
New Delhi 110 001
India
www.ficci.com

3
MESSAGE FROM THE SECRETARY GENERAL
Dr. A. Didar Singh
Secretary General
FICCI
FICCI has always thrived in providing thought leadership. In this regard I am extremely
happy and proud that we have developed a comprehensive report on the mining sector
titled “Development of Indian Mining Industry – The Way Forward”. The report covers
all non-fuel minerals that are either produced in India or imported and used in India.
FICCI’s mining division has developed this report in-house which goes to showcase our
capabilities.
India has long been recognised as a nation well endowed in natural mineral resources.
India is ranked 4th amongst the mineral producer countries, behind China, United States
and Russia, on the basis of volume of production It is an extremely important sector and
contributes significantly to our Gross Domestic Product. The Indian mining industry
however is passing through a critical phase, especially in the last two years, witnessing
negative growth. As mining is interlinked with industrial development, availability of raw
material is of prime importance and as such, the pro-active role of union and state
governments is called for to ensure an era of mineral development. This report is an
initiative on the part of FICCI to bring out the issues and concerns plaguing the mining
sector (each non-fuel mineral) for the consideration of the government. There are a
number of unresolved policy issues, which deserve serious consideration by the union
and state governments.
The report is also a ready compendium that gives the reserve and resource position,
the production levels, the demand and the future demand-supply scenario besides
flagging the way forward. I am sure policy makers, geologists and academicians will all
find this report to be extremely useful.

4
FOREWORD
Tuhin Mukherjee
Chair, FICCI Mining Committee &
Managing Director, Essel Mining & Industries Ltd,
Aditya Birla Group
India is well endowed in terms of most minerals. The country produces as many as 87
minerals, including 4 fuel minerals, 10 metallic minerals, 47 non-metallic minerals, 3
atomic minerals and 23 minor minerals (including building and other materials). The
Mineral Development and mining sector is a significant contributor to the India’s GDP
growth; as there is a strong correlation between growth in same and the manufacturing
sector; making it a catalyst for the growth of basic industries such as power, steel,
cement etc.
The National Mineral Policy, 2008 announced by the Union Government, was made to
fulfil this aim. The 2008 Policy differed from the earlier policy by introducing an open sky
policy on non-exclusivity for reconnaissance work, large area prospecting license,
seamless transfer and security of tenure to the entrepreneurs. Government of India
liberalized the grant of licenses and leases for most of the minerals except atomic
minerals and Hydrocarbon energy minerals under the National Mineral Policy, 1993.
However, the sector has witnessed negative growth for two consecutive years now. In
2011-12, the growth outlook had turned negative to register a minus 0.6% contraction.
In 2012-13 too there was no significant improvement, and the sector contracted by
0.6%. This de-growth is having its repercussions on the economy as a whole and is
contributing to the widening current account deficit and resultant weakness in Indian
currency. India needs an evolving and growth oriented mineral development and mining
policy that can foster systematic and sustainable growth in the sector.
At this critical juncture, the FICCI Mining Commitee members unanimously felt the need
of highlighting the issues and concerns for harnessing various minerals present across
the country as one collated document. So it was decided to do a base report on all non-
fuel minerals and present to the Government in one place, both the critical issues and
the way forward, along with the reserve and resource position, by each mineral. This
report, titled “Development of Indian Mining Industry – The Way Forward” is a collective
document on the current requirements of the Indian mining industry.
5
I believe it is time for mineral development and mining to be given its long over-due
recognition as a core industry as is the case in developed countries such as Australia,
Canada and USA. Emphasis should be given on exploration to continuously augment
the resource / reserve base of the country and harness the existing resources through
scientific and sustainable mining including beneficiation technologies and focusing on
zero waste mining. This is possible only through an investor friendly regulatory regime
that provides for security of tenure and encourages investment in exploration and
critical infrastructure for development of the mineral and mining industry.
I would like to acknowledge the contribution of the authors, Mr. S B S Chauhan, who is
also a FICCI Mining Committee member, as well as Mr. Arnab Kumar Hazra and Mr.
Arpan Gupta, who are part of the FICCI Secretariat. I would also like to thank the
various committee members for going through the document and providing valuable
comments.

6
TABLE OF CONTENTS
Executive Summary 09
Chapter 1 – Indian Mining Industry 12
Chapter 2 – Bulk Minerals 26
Chapter 3 - Base Metal Ores and Associated Strategic Minerals / Metals 46
Chapter 4 - High Value Precious Minerals / Metals 60
Chapter 5 - Industrial / Non-Metallic Minerals 73
Chapter 6 – Small Mines 98
Chapter 7 – Summary of Recommendations 105

7
LIST OF EXHIBITS
Exhibit 1.1 Seven Key Mining States have Majority Share in Mineral
Production / Total Reserves 13
Exhibit 1.2 Illustrations of Local Community Development Initiatives by
Mining Companies 14
Exhibit 1.3 India’s Production Rank across Key Minerals in 2010 15
Exhibit 1.4 Intensity of Mineral Consumption Expected to Accelerate 16
Exhibit 1.5 Demand for Key Minerals in India Expected to Grow Significantly 17
Exhibit 1.6 Growth in Key Mineral Consuming Industries Likely to Drive
Demand for Minerals 17
Exhibit 1.7 Global Demand of Key Export Minerals of India is expected to
Increase Significantly 18
Exhibit 1.8 India’s Position in Reserves of Key Minerals – 2010 19
Exhibit 1.9 Significant Mineral Potential still Untapped in India 19
Exhibit 1.10 India’s Share in Global Exploration Budget in 2010 less than 0.5% 20
Exhibit 1.11 Only 60% Mining Projects Proposed in Last 17 Years have got
Forest Clearances 22
Exhibit 2.1 Hematite & Magnetite Resources in India: 1980 to 2010 26
Exhibit 2.2 State-Wise Reserves / Resources of Iron Ore April 2010 27
Exhibit 2.3 Sector Wise Production of Iron Ore 28
Exhibit 2.4 India’s Iron Ore Production by Grade 29
Exhibit 2.5 Exhibit 2.5: Crude Steel Capacity & Production during
12th Five Year Plan 30
Exhibit 2.6 Domestic Usage of Iron Ore 30
Exhibit 2.7 Production of Bauxite 2001-02 to 2011-12 33
Exhibit 2.8 Five Principal Bauxite Mines in India 34
Exhibit 2.9 Production of Bauxite State Wise 2008-09 to 2010-11 34
Exhibit 2.10 Production of Chromite 2001-02 to 2011-12 37
Exhibit 2.11 Production of Manganese Ore 2001-02 to 2011-12 40
Exhibit 2.12 Quantity of Manganese Ore in Different States, 2010-11 40
Exhibit 2.13 Production of Limestone 2001-02 to 2011-12 43
Exhibit 2.14 Broad Chemical Specifications of Cement Grade Limestone 44

8
Exhibit 3.1 Production of Copper Concentrates 2001-02 to 2011-12 47
Exhibit 3.2 Import and Export of Refined Copper in India 48
Exhibit 3.3 Projected Capacity and Production of Refined Copper 48
Exhibit 3.4 Production of Lead and Zinc Metal – 2001-02 to 2010-11 51
Exhibit 3.5 Production of Lead and Zinc Concentrates – 2001-02 to 2011-12 51
Exhibit 3.6 - Demand for Zinc in India 52
Exhibit 3.7 - Demand for Lead in India 52
Exhibit 3.8 Demand-Supply Scenario of Zinc during 12th Plan Period 53
Exhibit 3.9 Characteristics of Strategic Minerals / Metals 55
Exhibit 4.1 Gold Production in India (by-product and mines) 61
Exhibit 4.2 Import of Gold into India 62
Exhibit 4.3 Silver Production in India 65
Exhibit 4.4 India’s Export and Import of Coloured Gemstones 72
Exhibit 5.1 Resources, Production and Demand of Industrial
Minerals during XI and XII Plans 74
Exhibit 5.2 Production, Import, Export & Apparent Consumption of
Industrial Minerals 76
Exhibit 5.4 Production and Value of Industrial Minerals during 2008-09 & 2010-11 81
Exhibit 5.5 Capacity and Production of Nitrogenous and Phosphatic Fertilizers 84
Exhibit 6.1 List of Minerals Produced by “B” Category Mines 102
9
Executive Summary
India has long been recognised as a nation well endowed in natural mineral resources. India
ranked 4th amongst the mineral producer countries, behind China, United States and Russia, on
the basis of volume of production, as per the Report on Mineral Production by International
Organizing Committee for the World Mining Congress, It however ranked 8th on the basis of
value of Mineral production, during 2009.
The Mining sector therefore is one of the important sectors in India’s economy and contributes
about 2% to our GDP. However the contribution of the sector to India’s GDP has been on the
decline. The mining sector contributed 3.4% of India’s GDP in 1992-93. This declined to 3.0% in
1999-2000, and further to 2.3% in 2009-10. And with the sector contracting in absolute terms in
the last couple of years, the contribution of the mining sector to India’s GDP has come down to
2% in 2012-13.
The mining sector has been reeling for more than two years now, under a lethal mix of high
borrowing costs on one hand and policy paralysis on the part of the government on the other
hand. Mining projects across the country remain stalled owing to environmental, regulatory and
land acquisition issues. The study seeks to identify the critical issues and recommend the way
forward that would help the sector come out of the impasse.
India produces as many as 87 minerals, which includes 4 fuel minerals, 10 metallic minerals, 47
non-metallic minerals, 3 atomic minerals and 23 minor minerals (including building and other
materials). Minerals can broadly be divided into fuel and non-fuel minerals. Coal, lignite,
petroleum and natural gas are the four fuel minerals. In a way, atomic minerals also can be
clubbed under this category. Essentially these minerals are used for the nuclear power
programme in India to generate electricity. Uranium and thorium are the two chiefly known
naturally occurring atomic minerals considered as sources of power. These minerals are
excluded from the scope of the present study and this study focuses only on the non-fuel
minerals, which are used in industrial production.
Among the non-fuel minerals, again two broad distinctions can be made – metallic minerals and
non-metallic minerals including minor minerals. Metallic minerals are those minerals that can be
melted to make new products. Examples are iron ore, copper, gold, lead, zinc, silver, tin, etc.
Non-metallic minerals are minerals that are not able to create new products after melting and
are usually sedimentary rocks. Examples are Limestone, mica, gypsum, dolomite, asbestos, etc
Most of the remaining 80 minerals are covered in this report. However the report does not club
these minerals, used for industrial production, into metallic minerals and non-metallic minerals.
Instead the report, on the basis of the characteristics of these minerals, divides them into four
categories and also has a chapter on small mines, as the necessity to add a chapter on small
mines was felt.
10
The first category is Bulk Minerals. These minerals are transacted in high volumes. In other
words, the minerals in this category are characterized by bulkiness in extraction, transportation
and consumption. Limestone, iron ore, chromites, manganese ore, bauxite, granite, marble,
etc., fall in this category. The extraction of these minerals involves shallow depth mining but
with a considerable quantity of over burden removal and waste generation. The input of
resources into production stream is also huge in some cases, for example inputs for 1,000 kg
primary aluminium production requires more than 5,000 kg of bauxite ore, 13,000 litres of fresh
water, 27,500 litres of sea water, 15,711 kWh of electricity consumption. It therefore depicts that
mining of such mineral is not limited to mineral alone, but it is highly intensified resource use of
other resources. The reclamation costs also vary from 2% to 4% of the production costs. The
mining of bulk minerals also disturbs the eco-system beyond their resilience. Understandably,
the mines, from where these minerals are extracted are large mines and their clearances are
easily caught in the quagmire of environmental, forest and other clearances. Hence, there is
need for developing a wide spread understanding for the strategic value of different minerals.
On the other hand, the demand for these minerals is dependent on the demand of the user
industry, which is also produced in bulk. The report seeks to understand these dynamics and
makes the recommendations accordingly.
The next category is Base Metals Ores and associates strategic minerals/metals. This category
mainly comprises of non-ferrous metals such as copper, lead and zinc etc along with twelve
associated metals (Tin, Cobalt, Lithium, Germanium, Gallium, Indium, Niobium, Beryllium.
Tantalum, Tungsten, Bismuth, and Selenium). The minerals/metals in this category have limited
reserves and may be classified as “Deficit Category”. Even though the country is presently self-
sufficient in copper and zinc metal production, but in the long-run, the availability of indigenous
ores will be a cause of concern because of limited ore reserves. In addition, there are strategic
minerals / metals which are largely imported. Hence, this group of metals assumes greater
importance from the point of view of raw material security for industrial development. The base
metals are of high value but require large investments and state-of-the-art technology as most
of them require sophisticated extraction technology mainly from underground mines. We know
that most mines in India are open cast mines as opposed to underground mines. So the scope
of underground mines needs to increase.
The third classification or category of metals is characterized by high value but low volume. This
category consists of precious minerals/metals – gold silver, platinum group of metals, diamonds
and precious stones. They are mostly deep seated involving underground mining with
sophisticated technology. These are at times also extracted as by-product of base metal ores.
Some of these are also used as gem stones. India is known to posses favourable geological
terrain similar to those of gold rich geological terrains of the world, specifically Archean
Greenstone Belts, but the country is largely deficient in the production of these high value
minerals and is heavily dependent on imports. We all have seen the how gold imports unnerved
11
the government and increased the current account deficit. This calls for a proper development
strategy for these high value minerals / metals, which is vital for Indian economy.
The last group of metals is characterized by low value but high volume. India presently
produces a total of 24 non-metallic minerals. The non-metallic minerals can be further sub-
divided into a) Fertilizer Minerals; b) Flux and Construction Minerals; c) Ceramics and
Refractory Minerals; and d) Minerals with Export Potential. These are buy-and-large
characterized as low value and high volume minerals and are basic inputs for a number of
industries like fertilizers, glass & ceramics, refractory, asbestos-cement and chemical products.
This group of minerals are largely produced in small mines owned primarily by individuals or
private firms. Though the resource base of industrial / non-metallic minerals in India are
adequate most of the minerals in this category, but country is deficient in fertilizer minerals for
Rock Phosphate, along with Magnesite and Ball Clay. However estimates show decreasing
reserves for many of these non-metallic minerals.
The report added a chapter on small mines as India is characterized by a large number of small
deposits of metallic and non-metallic minerals and as a consequence, a considerable part of
mining activities comprises small–scale mining, working in small deposits and also operating as
small mining leases granted in large mineral deposits. Most of the minor mineral leases granted
are also in the form of small mines.
Each chapter goes into the mineral positions – reserve and resource, and the demand scenario
which cumulatively results in identifying the critical areas of concern and further - the Way
Forward. There are also certain general and broad areas of concern which needs concerted
government action. All these are cumulatively put together in the last chapter – Summary of
Recommendations.
Much greater emphasis is required on development of mineral deposits by way of prospecting
and zero-waste mining. The Indian government does not formally define mining as a core
industrial activity. Rather it is viewed as more often as an ancillary raw material industry. The
mining legislation always gave accent to regulation which emphasized management of the
mines rather than on exploration and development. The exploration within the lease holds were
confined to the barest minimum to take care of future production schedule as per the market
scenario. This left only the Geological Survey of India (GSI) to do regional exploration whereas
the detailed exploration could not be carried out in all identified potential areas. The future
therefore now lies on deployment of latest technologies as well as interpretation of geological
data to its best advantage for opening up of new mines. As mineral exploration is a key to
attracting investment in the mining sector, separate legislation and procedure for grant of
prospecting / exploration licenses is required. At present, the same procedure is being adopted
as that of a mining lease in grant of prospecting licenses whereas mineral investigation does
not involve acquisition of land, it being a temporary activity for a short period.

12
Indian Mining Industry – An Overview
Mining is one of the core sectors that drive growth in an economy. Not only does it contribute to
GDP, it also acts as a catalyst for the growth of other core industries like power, steel, cement,
etc., which, in turn, are critical for the overall development of the economy. Our analysis has
shown that every one percent increment in the growth rate of mining and quarrying results in
1.2 – 1.4% increment in the growth rate of industrial production and correspondingly, an
approximate increment of 0.3 percent in the growth rate of India’s GDP.
After clocking an average growth rate of 4.8% over the 5 years between 2006-07 and 2010-11,
the sector has witnessed negative growth of 0.6% for two consecutive years now (2011-12 and
2012-13). The mining sector in the last couple of years has been hit hard due to policy paralysis
on a whole gamut of issues, irrespective whether they are in the domain of the Centre of the
States. As a result mining projects across the country has remained stalled owing to court
cases, environmental, regulatory and land acquisition issues. The sector has also been reeling
under high borrowing costs.
Moreover, despite India’s significant geological potential, the country does not rank very high in
terms of its mineral resource base amongst similarly geological endowed nations. It is also a
matter of concern that though as per National Mineral policy, 2008, private sector should have
been at the forefront of mineral production but the public sector continues to play a dominant
role accounting for 68% of mineral production during 2011-12. Clearly policies and incentives
have not been conducive for the private sector players to participate more actively.
There is significant mineral potential that still lay untapped in India for the growth of mining but
historically, mining sector has struggled to exploit the potential due to three big factors i.e.
regulatory and administrative procedures, inadequate infrastructure facilities and sustainability.
These challenges have limited the overall investment in mining and exploration activities in
India, as evident from very low inflow of FDI in the mining sector. India’s spend on mineral
exploration is less than 0.5% of the global spending on exploration in 2010, much below its fair
share given the size of mineral resource potential.
Given the availability of mineral wealth in India, the Ministry of Mines, Government of India, has
targeted significantly higher share of GDP from mining. It aims to increase share of mining and
quarrying in GDP from current 2% of GDP to 5% of GDP over the next 20 years. This requires
mining to grow at 10-12% per annum. On the other hand, within two decades of liberalized
economy, much in contrast with the constitutional objectives, mining as a sector has come to be
associated with scams, conflicts, violence and ecological degradation. The conflict it engenders
is enormous and wide spread. The future should therefore usher in an era of mineral
development with socio-economic development as the focus.
13
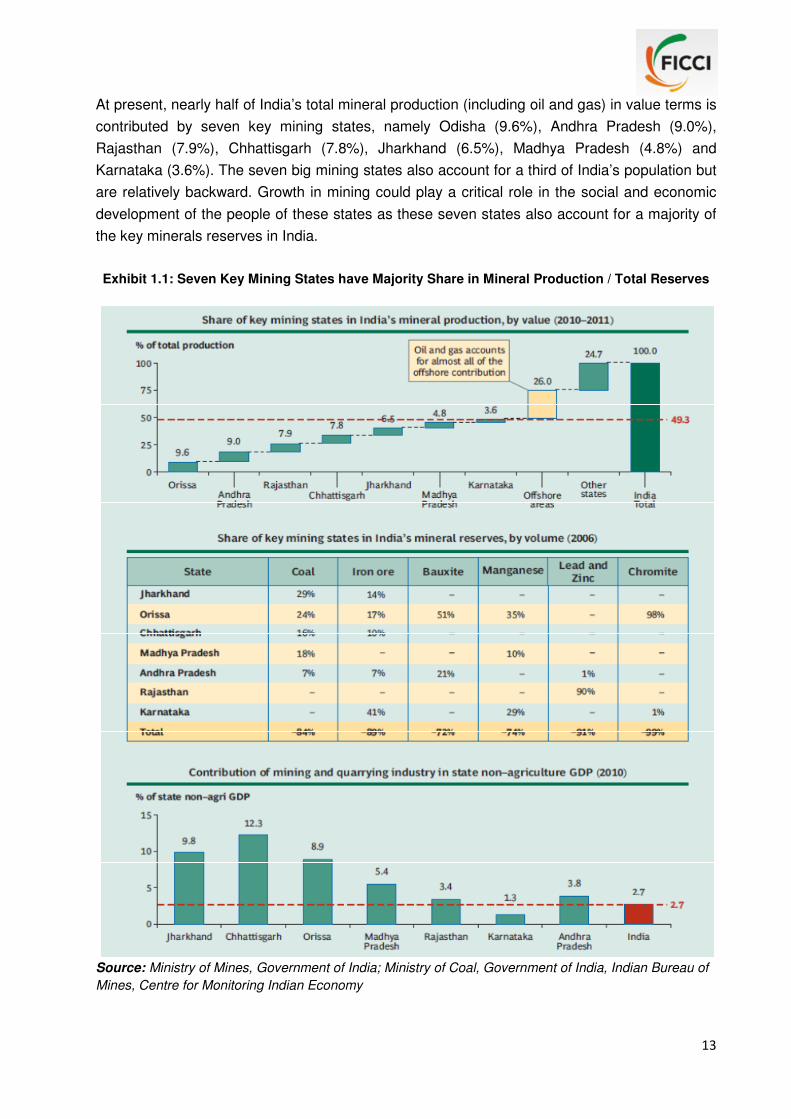
At present, nearly half of India’s total mineral production (including oil and gas) in value terms is
contributed by seven key mining states, namely Odisha (9.6%), Andhra Pradesh (9.0%),
Rajasthan (7.9%), Chhattisgarh (7.8%), Jharkhand (6.5%), Madhya Pradesh (4.8%) and
Karnataka (3.6%). The seven big mining states also account for a third of India’s population but
are relatively backward. Growth in mining could play a critical role in the social and economic
development of the people of these states as these seven states also account for a majority of
the key minerals reserves in India.
Exhibit 1.1: Seven Key Mining States have Majority Share in Mineral Production / Total Reserves
Source: Ministry of Mines, Government of India; Ministry of Coal, Government of India, Indian Bureau of
Mines, Centre for Monitoring Indian Economy
14
Industry’s relationship with society is undeniably both critical and under pressure. Rising levels
of public opposition and social conflicts are impacting operations in India and arguably around
the world. The mining industry in India has however has started to shape the future direction of
this engagement towards an inclusive agenda. There is no doubt that mining investment can
become a positive catalyst for improving livelihoods of the local populace, bringing in much
needed investment job and wealth creation, and government revenues. On its part the industry
is beginning to recognize the difficulties communities are facing in adjusting, particularly since
the local populace mostly has limited exposure to modern living. Severe, rapid disruptions to
local life generate fear and mistrust. The public trust deficit needs to be addressed by both
industry and government alike.
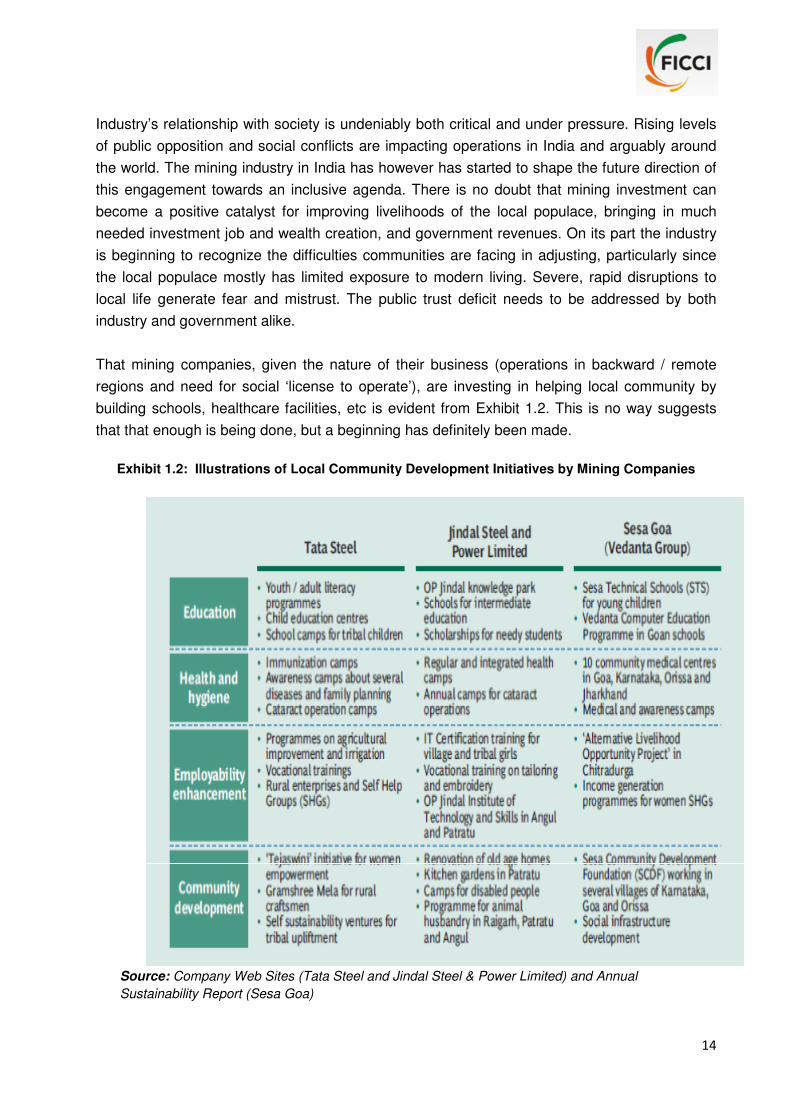
That mining companies, given the nature of their business (operations in backward / remote
regions and need for social ‘license to operate’), are investing in helping local community by
building schools, healthcare facilities, etc is evident from Exhibit 1.2. This is no way suggests
that that enough is being done, but a beginning has definitely been made.
Exhibit 1.2: Illustrations of Local Community Development Initiatives by Mining Companies
Source: Company Web Sites (Tata Steel and Jindal Steel & Power Limited) and Annual
Sustainability Report (Sesa Goa)

15
Potential and Opportunity for Significant Growth of Mining in India
India produces about 87 minerals that include 4 fuel minerals, 3 atomic minerals, 10 metallic
minerals, 47 non-metallic minerals and 23 minor minerals (including building & other materials).
India occupies a dominant position in the production of many minerals across the globe.
There are close to 3000 mines in India. Number of reporting mines during the last decade has
been around 3000 to 3200. However, during 2010-11, it was 2928, out of which, 573 were fuel
mines, 687 were mines for metals, and 1668 mines for extraction of non-metallic minerals. Of
the total number of about 90 minerals, the three key minerals are coal, limestone and iron ore.
There are 560 Coal mines (19% of total number), 553 limestone mines (19% of total number)
and 316 iron ore mines (11 % of total number). They comprise about half of the total number of
reporting mines. The number of mines engaged in extraction was also significant in cases of
bauxite (189), manganese (141), dolomite (116) and Steatite (113). As seen in Exhibit 1.3, with
regard to production of these three key minerals, India ranks 3rd in coal production, 3rd in
limestone production and 4th in iron ore production, in the world as of 2010.
Exhibit 1.3: India’s Production Rank across Key Minerals – 2010
Source: Ministry of Mines, Government of India, US Geological Survey, Goldman Sachs & Morgan
Stanley Metals Playbook
Demand side potential
India has significant potential to further grow its mining industry. This potential is apparent from
both — the demand for minerals and the availability of natural resources in India.
� Countries typically go through a mineral consumption curve where per capita
consumption of minerals accelerates during the industrialization period (developing phase)
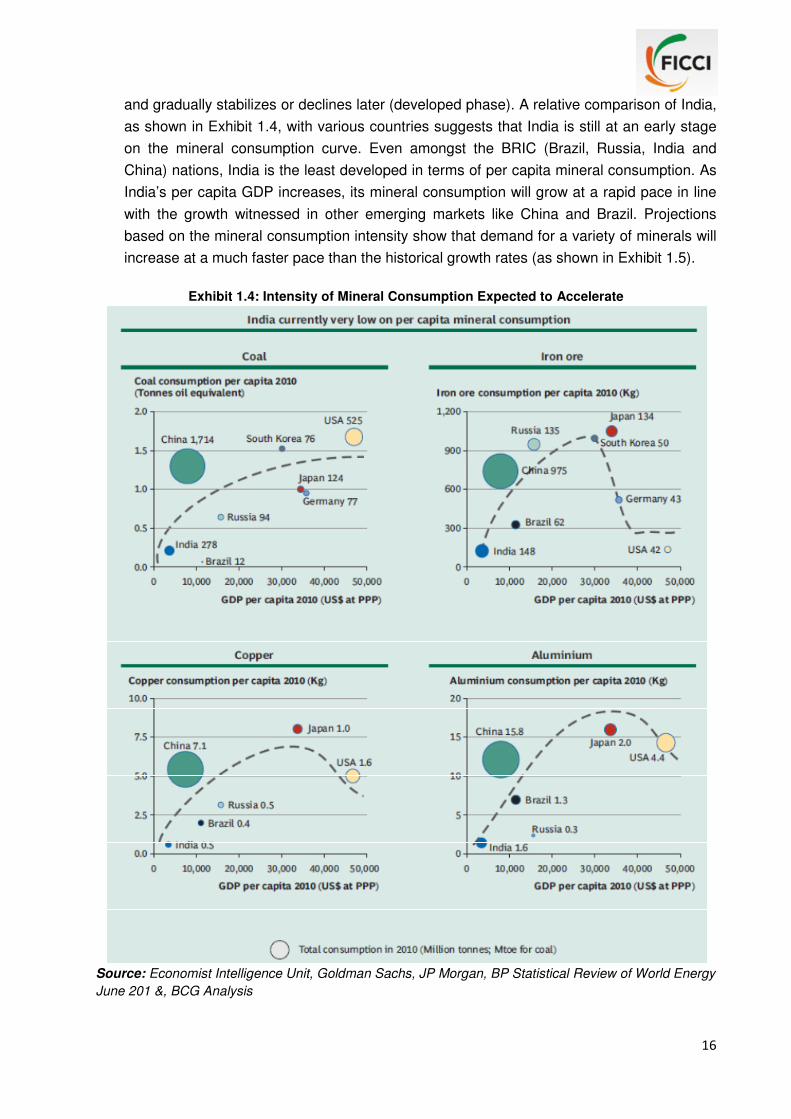
16
and gradually stabilizes or declines later (developed phase). A relative comparison of India,
as shown in Exhibit 1.4, with various countries suggests that India is still at an early stage
on the mineral consumption curve. Even amongst the BRIC (Brazil, Russia, India and
China) nations, India is the least developed in terms of per capita mineral consumption. As
India’s per capita GDP increases, its mineral consumption will grow at a rapid pace in line
with the growth witnessed in other emerging markets like China and Brazil. Projections
based on the mineral consumption intensity show that demand for a variety of minerals will
increase at a much faster pace than the historical growth rates (as shown in Exhibit 1.5).
Exhibit 1.4: Intensity of Mineral Consumption Expected to Accelerate
Source: Economist Intelligence Unit, Goldman Sachs, JP Morgan, BP Statistical Review of World Energy
June 201 &, BCG Analysis

17
Exhibit 1.5: Demand for Key Minerals in India Expected to Grow Significantly
Source: Economist Intelligence Unit, Goldman Sachs, JP Morgan, BP Statistical Review of World Energy
June 2011 & BCG Analysis
� Further, to assess the domestic growth potential for mining sector in India, one can also
look at the future growth potential of its key consumer industries, for example, steel,
cement, etc. The Planning Commission, in its 12th five year plan, had set a target of 9% for
the GDP growth rate which subsequently has been revised to 8%. Nevertheless, this
implies a huge spurt in sectors like construction and power generation (as shown in Exhibit
1.6), which in turn will lead to substantial capacity addition in the steel, cement and thermal
power sectors. These industries, being key consumers of minerals like iron ore, limestone
and copper, will drive significant growth in consumption demand of minerals in India.
Exhibit 1.6: Growth in Key Mineral Consuming Industries Likely to Drive Demand for Minerals
Source: Morgan Stanley, Cement Manufacturers Association, Economist Intelligence Unit, Ministry of
Power and Planning Commission, Government of India

18
� In addition to domestic demand growth, the Indian mining industry is also likely to see
accelerated growth in exports demand. The key minerals exported from India are iron ore
(although this has dipped significantly at present), alumina, and chromite. According to
industry forecasts, the global demand for these minerals is expected to accelerate in the
future. For example, as shown in Exhibit 1.7, the global demand for both seaborne iron ore
and aluminium is expected to grow at the rate of 10% per annum while the global demand
for ferrochrome, an alloy containing chromites, is expected to grow at the rate of 7% per
annum in the coming years.
Thus, there are substantial demand side drivers for the growth of India’s mining industry.
Exhibit 1.7: Global Demand of Key Export Minerals of India is Expected to Increase Significantly
Source: Morgan Stanley, 2011, HARBOR Intelligence, 2011 & Heinz Pariser, 2009
Supply side potential
In global rankings of mineral reserves, India occupies a dominant position for key minerals, for
example, coal and iron ore. India has the world’s 4th largest coal reserves, which is equivalent
to 12% of global reserves. India also possesses the 7th largest reserves of iron ore, 3rd largest
reserves of chromite and 5th largest reserves of manganese ore in the world. In other words, at
the current consumption rank, India has proven reserves for 175–200 years for coal, and 40–50
years for iron ore and limestone (as shown in Exhibit 1.8).
As far as imports are concerned, more than 85 % of the imports are accounted for by petroleum
and diamond. The former is essential to meet the energy requirements whereas the import of
raw diamond is for value added re-exports. India continues to be largely self sufficient in
minerals which constitute primary mineral raw material to industries like iron ore, ferro alloys,
aluminum, cement etc and mineral fuels like coal (except low ash coking coal) etc..

19
Exhibit 1.8: India’s Position in Reserves of Key Minerals - 2010
Source: Ministry of Mines, Government of India, US Geological Survey, Goldman
Sachs & Morgan Stanley Metals Playbook
In addition to the internationally recognized proven and probable ‘reserves’, India has significant
quantity of mineral ‘resources’ which are still under various stages of exploration. A quick look
across key minerals (as shown in Exhibit 1.9) highlights the fact that the unproven ‘resources’
are more than twice the proven reserves. With appropriate investments in infrastructure and
technology used in exploration, there is significant potential for further increase in the realizable
mineral wealth of India.
Exhibit 1.9: Significant Mineral Potential still Untapped in India
Source: Ministry of Mines, Government of India

20
Three Key Challenges to Growth Faced by Industry
Thus there is an enormous potential for growth of mining in India. This is driven by both the
positive demand scenario and substantial existing ‘reserves’ and potential ‘resources’.
However, historically, mining sector has struggled to exploit this potential due to three key
reasons:
a. Regulatory challenges
There are a set of regulatory and administrative challenges in India which restrict the
growth of mining in India. To illustrate:
� The current regulatory provisions make it difficult, if not impossible, to transfer mining
leases. The prospecting licenses are not transferable.
� There is no guarantee of obtaining mining lease even if a successful exploration is done
by a company. The mining licenses are typically awarded on a first come first serve basis in
principle but there is no transparent system.
� Getting all approvals for mining is a long drawn process with multiple agencies involved.
Further, there are substantial delays in disposal of various applications for clearances.
� There are limited incentives for private sector to invest in improvement of technology
and equipment in mining projects as the mining industry is the most heavily taxed industry
in India.
Exhibit 1.10: India’s Share in Global Exploration Budget in 2010 was less than 0.5%
Source: Mining India: Sustainability for Growth; Ernst & Young These challenges have limited the overall investment in mining and exploration activities in
India. This is demonstrated by the fact that despite being one of the few sectors in India which
allows 100% Foreign Direct Investment (FDI) (with the exception of atomic and fuel minerals),
the actual inflow of foreign investment in the mining sector in India has been quite low. Further,

21
as shown in Exhibit 1.10, India’s spend on mineral exploration is less than 0.5% of the global
spending on exploration in 2010 — much below its fair share given the size of our landmass
and our potential mineral wealth. Even this exploration activity has largely been limited to public
sector enterprises.
b. Inadequate infrastructure facilities
The inadequacy of infrastructure is related to the absence of proper transportation and logistics
facilities. Many of our mining areas are in remote locations and cannot be properly developed
unless the supporting infrastructure is set up. For example, the railway connectivity in most key
mining states is poor and it has inadequate capacity for volumes to be transported which adds
to the overall supply chain cost. The government foresees that steel production capacity in the
country by the year 2025 will increase to 300 million tonnes per annum. This would require
Indian Railways freight capacity to be around 1185 million tonnes, for only steel and its raw
material requirements. In 2012-13 the total freight carried by Indian railways was 1,010 million
tonnes. Therefore, unless significant initiatives are taken and are promoted by Indian Railways
through private participation to address the anticipated logistics requirement of the mining and
manufacturing industries, the risk foreseen is too significant in magnitude to hamper the growth
of industry.
Further, there is inadequate capacity at ports for handling minerals and the rail / road
connectivity to some ports is very poor. The key constraints are:
• There is capacity constraint for capital dredging,
• Existing ports are unable to meet the expected 10% growth in traffic at ports,
• High dwell time of cargo in Indian ports due to manual workflow and low level of IT
penetration
• Lack of public investment in capacity building
• Slow evacuation of cargo from ports due to limited hinterland connectivity by rail/road.
c. Sustainability
Mining activity in any area impacts the environment as well as the socio-economic set-up.
Therefore, ensuring that the adverse impacts are minimized and the benefits from mining to the
impacted community are optimized becomes critical for mining to be being carried out in a
sustainable manner.
The importance of sustainability in mining, in India, can be illustrated by the fact that a large
percentage of mining proposals has failed to get environmental / forest clearance from the
Ministry of Environment and Forests, Government of India. For example, out of 2,842 mining
projects proposed for forest clearances in the last 17 years, only 1,723 projects, which
constitute about 60% of the total, have been issued forest clearance by the central government.
The remaining 40% projects are either still pending or have been rejected / closed on grounds
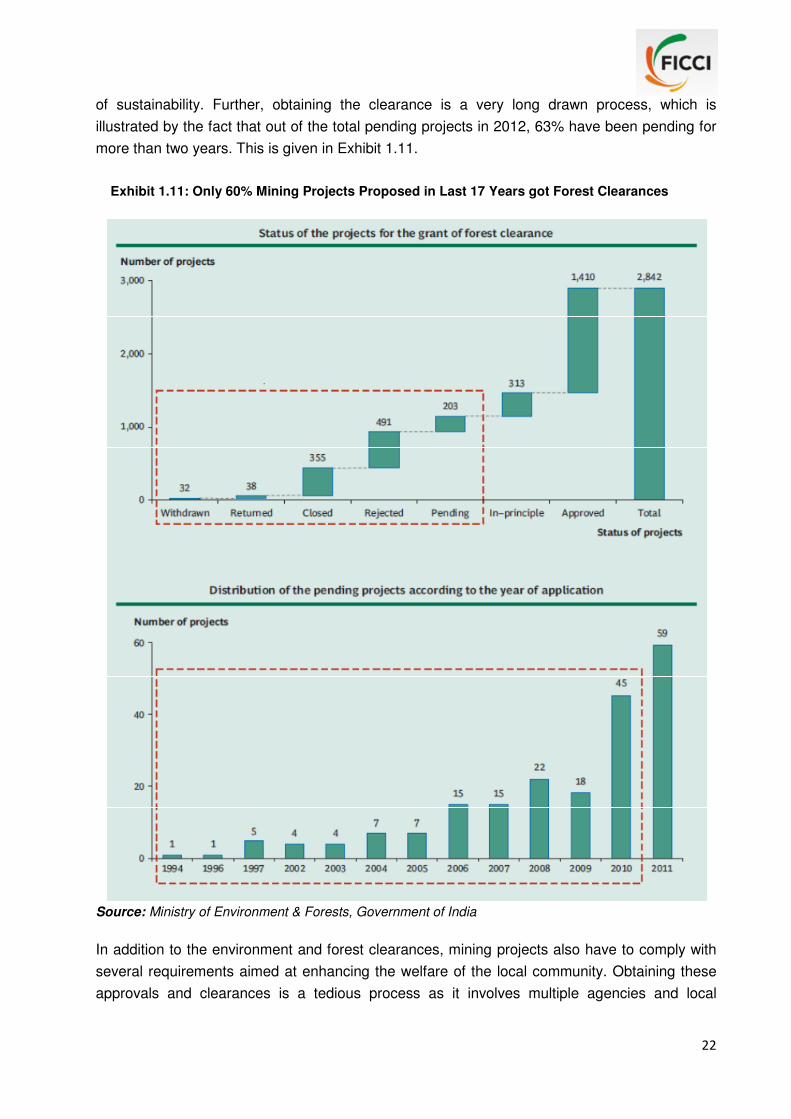
22
of sustainability. Further, obtaining the clearance is a very long drawn process, which is
illustrated by the fact that out of the total pending projects in 2012, 63% have been pending for
more than two years. This is given in Exhibit 1.11.
Exhibit 1.11: Only 60% Mining Projects Proposed in Last 17 Years got Forest Clearances
Source: Ministry of Environment & Forests, Government of India
In addition to the environment and forest clearances, mining projects also have to comply with
several requirements aimed at enhancing the welfare of the local community. Obtaining these
approvals and clearances is a tedious process as it involves multiple agencies and local

23
governing bodies. Over and above these regulations, the mining companies also need to take
the local communities along, to ensure that they have the support of the ‘local’ side for their
projects. As a result, several projects are impacted with challenges by way of opposition from
local communities / NGOs, difficulties in land acquisition, denial of clearances from the
governing bodies, etc. A few instances of some of the major projects that have been impacted
in recent past are as follows:
� Pohang Steel Company (POSCO’s) US$ 11 billion investment plan for mining
and steel production: strong opposition from local people over land acquisition.
� Vedanta’s proposed US$ 1.7 billion bauxite mining project in Odisha: opposition
by local community and eventual withdrawal of the forest clearance
� Utkal alumina project, which was a US$ 1 billion joint venture between M/s.
Hindalco (India) and Alcan (Canada) to mine and refine bauxite: delayed by more than a
decade due to challenges in land acquisition
� Uranium Corporation of India Ltd., UCIL’s two mining projects worth US$ 200
million and US$ 225 million in Meghalaya and Andhra Pradesh respectively: opposition
from local communities and organizations on the grounds of likely effects of radiations
on human health and environment
Unresolved Policy Issues
Notwithstanding the proposed MMDR Bill 2011, there are certain major policy issues which
deserve serious consideration:
1. So far as mining activity is concerned, India is a single economic space and as such,
more delegation of powers to the state governments may jeopardize the interests of
mineral development.
2. While the National Mineral Policy 2008 remains yet to be implemented, the mineral
policies of the state governments are at variance with the same. In fact, the procedures in
the grant of mineral concessions also vary from state to state. It would therefore be
necessary that the state governments may be restricted to formulate their mineral policies
only to minor minerals.
3. To curb the menace of illegal mining and to ensure scientific mining, it would be
necessary to strengthen and re-structure the Departments of Mines & Geology of the
state governments on a uniform pattern.

24
4. As mineral exploration is key to attracting investment in the mining sector, separate
legislation and procedure for grant of prospecting / exploration licenses is required. At
present, the same procedure is being adopted as that of a mining lease in grant of
prospecting licenses whereas mineral investigation does not involve acquisition of land, it
being a temporary activity for a short period.
5. There is incorrect definition of prospecting activity in Forest (Conservation) Act 1980. The
provisions of guidelines 1.3 (v) of the handbook exempts certain activities like oil drilling,
transmission of power lines etc from forest clearance but in case of prospecting though
few drill holes are permitted (16 boreholes per 10 sq km) vide notification no 5-3/2007-FC
dated August 19th, 2010 of Ministry of Environment and Forests, but the collection of
surface samples through trenching / pitting are prohibited. In fact, the prospecting activity
has not been defined properly in the notification and entry to forest land remains a big
issue to the prospectors. As most of the mineral bearing lands overlap the forest lands in
the country, the provisions of Forest (Conservation) Act 1980 need to be amended in the
interest of detailed prospecting and exploration for mineral investigation, where no
degradation of forest is involved; rather, prospecting activity needs to be exempted from
forest clearance.
6. There is a tendency on the part of the state governments to give preference to value
addition and reservation of potential areas to the state PSUs in grant of mineral
concessions. This has resulted in the reservation of large potential areas which have
remained blocked for a long period without any exploration and development. At the same
time, there is hardly any de-reservation of such potential areas.
7. Geological Survey of India (GSI) has identified an area of 5.71 lakh square kilometres as
Obvious Geological Potential (OGP) area in the country. But there is hardly any detailed
mineral exploration activity in the absence of timely follow-up actions on GSI’s
recommendations.
8. A transparent, simple and stable fiscal regime plays a significant role in the growth of the
industry for attracting investment. However, Indian mining sector is already amongst the
highest taxed in the world with effective tax of about 45% compared to other countries
which ranges between 35 to 40% (China-32%, Russia-35%, Australia- 39%, Chile 40%
and Canada- 35 %). The Draft MMDR Bill, 2011 proposes a number of additional taxes
and levies thereby taking the effective taxation to more than 60%. In addition to above
there is huge additional burden from revision of royalty rate and stamp duty.
Taxes/duties/cess etc. should not be prohibitive and should help the industry to survive,
sustain and grow. Further any new taxes/duties/cess should take into consideration
existing burden on the sector.

25
9. Development of dedicated freight corridors linking the iron ore mines to the ports and rail
heads to ensure evacuation from the pit heads without disrupting the public life needs to
be considered. Such corridors can either be in PPP model or a consortium of miners can
develop and operate the rail-line on a royalty/rent basis (examples of such PPP models
exist in Australia and Brazil).
10. Mandatory exploration for the operating mines and adequate incentives for green field
exploration need to be devised to enhance the resource base and convert them to
reserve category.
11. The strategic value of various minerals must be recognized and specific efforts need to be
made to conserve minerals essential for the country’s future. Minerals such as bauxite,
titanium, rare earths and several heavy metals (e.g. gallium germanium, platinum group of
metals, molybdenum, indium and cobalt etc) which will be crucial for future development
of materials need to be addressed for long-term needs of the country.
12. Looking to the complex mineralogy of Indian Hematite ores, IBM needs to go for
evaluation of cut-off in a deposit-wise manner in line with such practice in several
countries. For each deposit, theoretical cut-off and operational cut-off grade may be
declared based only on detailed mineralogical-metallurgical test-work and can be unique
for a particular deposit.
13. There is a need for detailing of the national mineral inventory so as to allow the investor to
get adequate information for taking up investment decisions.
26
Bulk Minerals
The first category of minerals consists of minerals that are characterized by high volume of
extraction, transportation and consumption. This category is thus clubbed as bulk minerals and
the minerals falls in this category are iron ore, chromites, manganese ore, bauxite, granite /
marble etc. The extraction of these minerals involves shallow depth mining but with a
considerable quantity of over burden removal and waste generation. The input of resources into
production stream is also huge in some cases, for example inputs for 1,000 kg primary
aluminium production requires more than 5,000 kg of bauxite ore, 40,000 litres of water, and
more than 15,000 kWh of electricity consumption. Therefore mining of such minerals is not
limited to the mineral alone, but it is highly intensified in the use of other natural resources too.
The reclamation costs also vary from 2% to 4% of the production costs. The mining of bulk
minerals also disturbs the eco-system beyond their resilience. Hence, there is need for
developing a wide spread understanding for the strategic value of different minerals and with
this view, the updates of bulk minerals along with the issues and concerns are outlined below.
Mineral 1: IRON ORE
Being the most important raw material for the steel industry, iron ore commands significant
importance as a basic raw material used in the making of pig-iron, sponge iron, steel and alloy
steel. The other important iron ore consuming industries are cement, coal washeries and ferro-
alloy industries. India has an estimated iron ore resource of over 28 billion tonnes and currently
stands as the fourth largest miner of iron ore.
Reserves and Resources Position
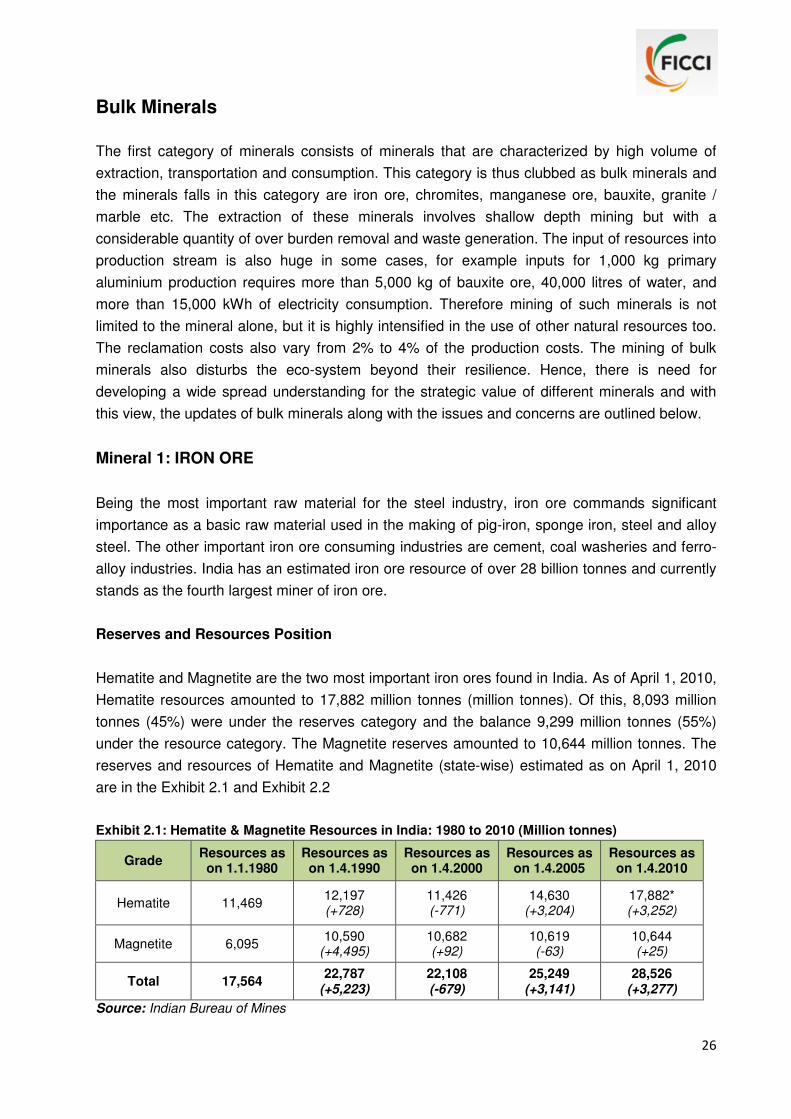
Hematite and Magnetite are the two most important iron ores found in India. As of April 1, 2010,
Hematite resources amounted to 17,882 million tonnes (million tonnes). Of this, 8,093 million
tonnes (45%) were under the reserves category and the balance 9,299 million tonnes (55%)
under the resource category. The Magnetite reserves amounted to 10,644 million tonnes. The
reserves and resources of Hematite and Magnetite (state-wise) estimated as on April 1, 2010
are in the Exhibit 2.1 and Exhibit 2.2
Exhibit 2.1: Hematite & Magnetite Resources in India: 1980 to 2010 (Million tonnes)
Grade Resources as on 1.1.1980
Resources as on 1.4.1990
Resources as on 1.4.2000
Resources as on 1.4.2005
Resources as on 1.4.2010
Hematite 11,469 12,197 (+728)
11,426 (-771)
14,630 (+3,204)
17,882* (+3,252)
Magnetite 6,095 10,590
(+4,495) 10,682 (+92)
10,619 (-63)
10,644 (+25)
Total 17,564 22,787
(+5,223) 22,108 (-679)
25,249 (+3,141)
28,526 (+3,277)
Source: Indian Bureau of Mines

27
It may be seen that during 2005 and 2010, Hematite resources have increased by 3,252 million
tonnes (1,089 million tonnes reserves and 2,162 million tonnes resources). On the other hand,
Magnetite resources have largely remained static during this period. However most of the
Magnetite resources are confined to the Western Ghats region which is considered to be
ecologically fragile area.
Exhibit 2.2: State-Wise Reserves / Resources of Iron Ore (’000 tonnes) – Apr 2010
State Reserves Resources Total
Hematite Magnetite Hematite Magnetite Hematite Magnetite
Andhra Pradesh 152,217 - 229,261 1,463,541 381,478 1,463,561
Assam - - 12,600 15,380 12,600 15,380
Bihar - - 55 2,659 55 2,659
Chhattisgarh 900,110 - 2,391,714 - 3,291,824 -
Goa 469,844 50,112 457,328 164,057 927,172 214,169
Jharkhand 2,304,142 3,391 2,292,478 6,879 4,596,620 10,269
Karnataka 876,866 148,437 1,281,811 7,663,347 2,158,678 7,811,784
Madhya Pradesh 56,814 - 174,632 83,435 234,446 83,435
Maharashtra 13,414 621 269,795 - 283,209 621
Meghalaya - - 225 3,380 225 3,380
Nagaland - - - 5,280 - 5,280
Odisha 3,313,000 156 2,617,232 54 5,930,232 210
Rajasthan 7,139 4,225 23,420 522,652 30,560 526,877
Uttar Pradesh - - 38,000 - 38,000 -
Tamil Nadu - - - 481,876 - 481,876
Total 8,093,546 206,941 9,788,551 10,412,540 17,882,098 10,644,481
Source: Indian Bureau of Mines
Production
The domestic production of iron ore has seen a major dip since 2010-11. From 208 million
tonnes, in 2010-11, it fell to 167 million tonnes in 2011-12, and according to the Planning
Commission, is expected to fall further in 2012-13, to about 120 million tonnes. In the current
fiscal year (2013-14) data for the first three months suggests that production will be restricted to
about 100-110 million tonnes.
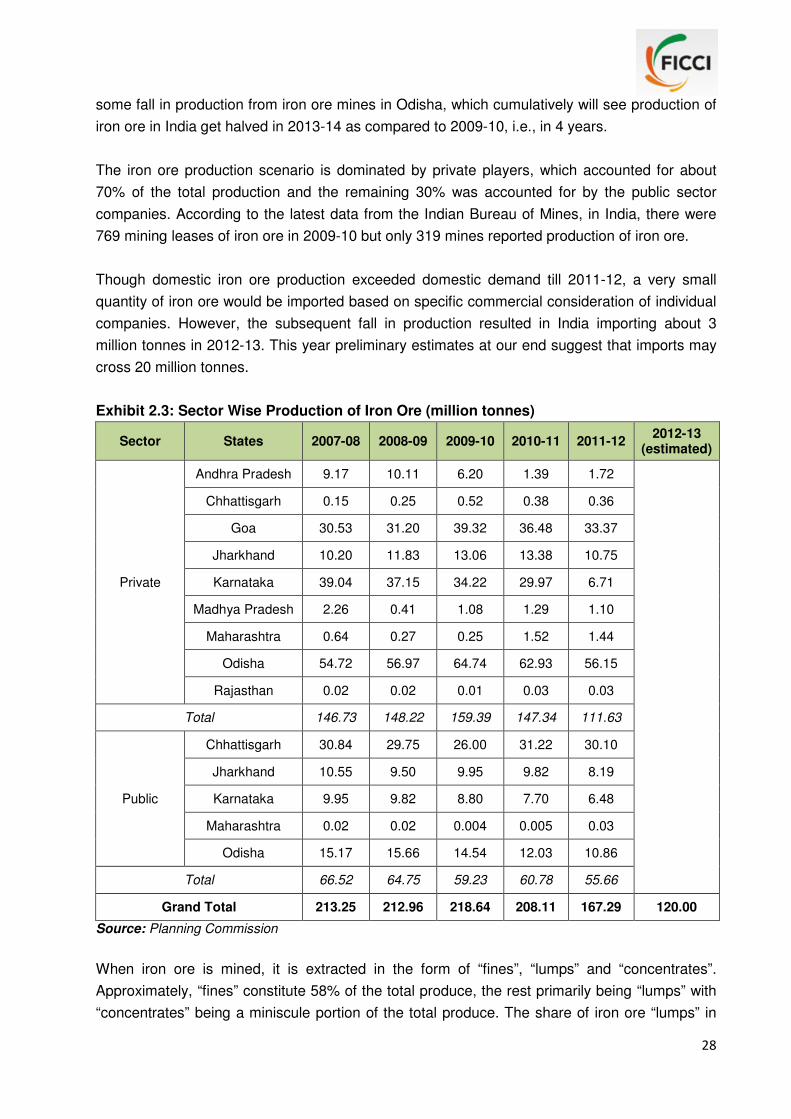
Exhibit 2.3 provides the sector wise production of iron ore in the country. The massive fall in
production from 2010-11 to 2011-12 can easily be traced to the temporary discontinuance of
mining operations in Karnataka, Subsequently there has been a ban on mining in Goa and
28
some fall in production from iron ore mines in Odisha, which cumulatively will see production of
iron ore in India get halved in 2013-14 as compared to 2009-10, i.e., in 4 years.
The iron ore production scenario is dominated by private players, which accounted for about
70% of the total production and the remaining 30% was accounted for by the public sector
companies. According to the latest data from the Indian Bureau of Mines, in India, there were
769 mining leases of iron ore in 2009-10 but only 319 mines reported production of iron ore.
Though domestic iron ore production exceeded domestic demand till 2011-12, a very small
quantity of iron ore would be imported based on specific commercial consideration of individual
companies. However, the subsequent fall in production resulted in India importing about 3
million tonnes in 2012-13. This year preliminary estimates at our end suggest that imports may
cross 20 million tonnes.
Exhibit 2.3: Sector Wise Production of Iron Ore (million tonnes)
Sector States 2007-08 2008-09 2009-10 2010-11 2011-12 2012-13
(estimated)
Private
Andhra Pradesh 9.17 10.11 6.20 1.39 1.72
Chhattisgarh 0.15 0.25 0.52 0.38 0.36
Goa 30.53 31.20 39.32 36.48 33.37
Jharkhand 10.20 11.83 13.06 13.38 10.75
Karnataka 39.04 37.15 34.22 29.97 6.71
Madhya Pradesh 2.26 0.41 1.08 1.29 1.10
Maharashtra 0.64 0.27 0.25 1.52 1.44
Odisha 54.72 56.97 64.74 62.93 56.15
Rajasthan 0.02 0.02 0.01 0.03 0.03
Total 146.73 148.22 159.39 147.34 111.63
Public
Chhattisgarh 30.84 29.75 26.00 31.22 30.10
Jharkhand 10.55 9.50 9.95 9.82 8.19
Karnataka 9.95 9.82 8.80 7.70 6.48
Maharashtra 0.02 0.02 0.004 0.005 0.03
Odisha 15.17 15.66 14.54 12.03 10.86
Total 66.52 64.75 59.23 60.78 55.66
Grand Total 213.25 212.96 218.64 208.11 167.29 120.00
Source: Planning Commission
When iron ore is mined, it is extracted in the form of “fines”, “lumps” and “concentrates”.
Approximately, “fines” constitute 58% of the total produce, the rest primarily being “lumps” with
“concentrates” being a miniscule portion of the total produce. The share of iron ore “lumps” in

29
total production increased from 38% in 2005-06 to over 42% in 2009-10, while that of iron ore
“fines” increased from 53% to nearly 58% in the same period. This is shown in Exhibit 2.4.
Exhibit 2.4: India’s Iron Ore Production by Grade (million tonnes)
Products 2005-06 2006-07 2007-08 2008-09 2009-10 2010-11 2011-12
Lumps 62.64 88.31 97.85 95.57 91.72 82.06 62.70
Fines 87.90 98.24 114.88 119.22 126.16 125.34 104.18
Concentrates 0.60 1.15 0.52 0.64 0.75 0.71 0.41
Total 165.23 187.70 213.24 215.43 218.63 208.11 167.29
Source: Indian Bureau of Mines
The iron ore mining industry in India has been severely hit following the ban on iron ore mining
by the Karnataka Government in July 2010 as well as closure of all mines in Goa in 2012.
Though the ban led to the shortage of iron ore, the global prices didn’t rise, largely on account
of increased supplies from Australia and Brazil as well as global meltdown and resulting lower
demand of iron ore from steel plants in China.
Demand
The demand for iron ore is expected to be from the domestic steel industry, from the domestic
sponge iron industry, and from China, especially of ores with lower fe content. On the domestic
front, iron and steel industry accounts for over 58% of the total iron ore consumption whereas
sponge iron accounts for about 40%.
India presently has an estimated crude steel production capacity of 89 million tonnes per annum
(mpta) as against 57 million tonnes per annum in 2006-07. The Planning Commission estimates
the crude steel capacity and production in the country will increase to 146.6 million tonnes per
annum and 131.9 million tonnes per annum respectively, by 2016-17. According to the
projection by Ministry of Steel, domestic steel production is slated to reach 200 million tonnes
by 2020. However, the current global economic scenario may have a moderating effect on
domestic steel demand. Two of the major steel producers (Tata Steel and SAIL) have captive
raw iron ore mines but other Indian steel producers have varying degrees of self-sufficiency and
primarily depend upon domestic iron ore supply to meet their requirements.
With about 1.6 million tonnes of iron being required for producing 1 million tonne of steel, this
translates to a demand of about 200 million tonnes of iron ore by 2016-17 and about 250-280
million tonnes by 2020, from the domestic steel industry alone (the rest met from scrap).
The iron ore lumps accounted for about 54% of the total dispatches followed by fines at about
46% during 2010-11. Captive sources account for over 25% of the total iron ore consumption
while non-captive sources account for over 74%. The iron ore consumption in India will continue
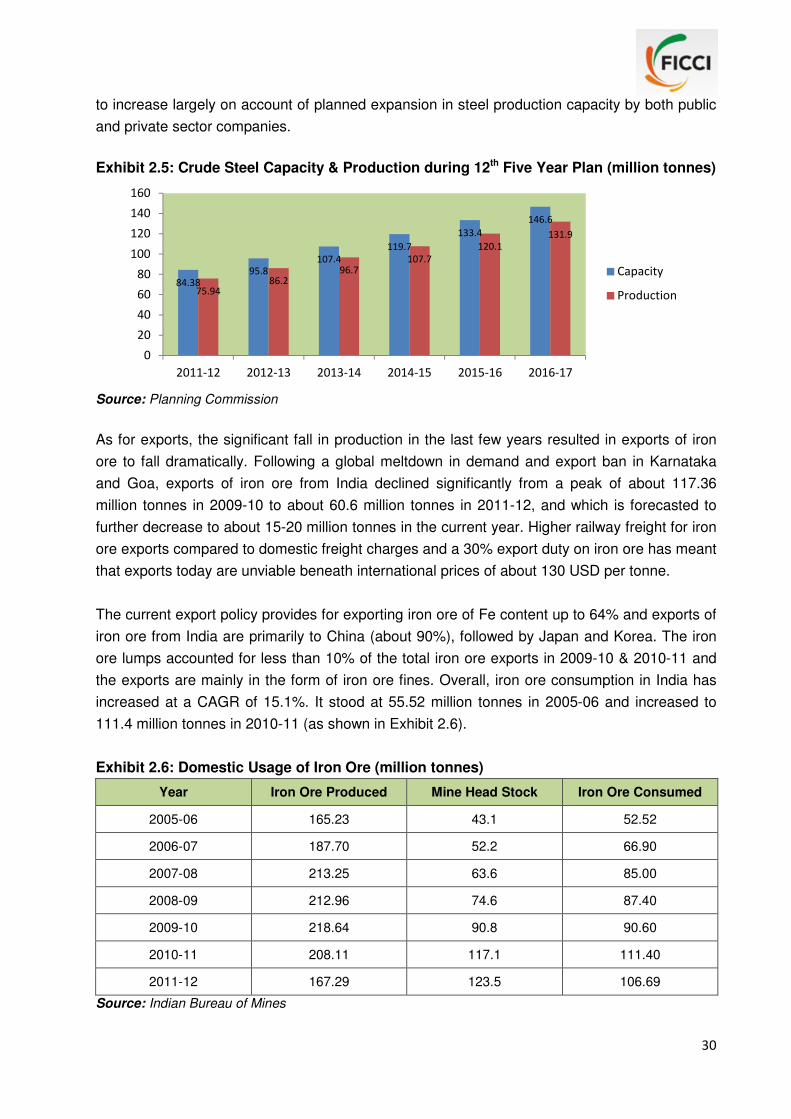
30
to increase largely on account of planned expansion in steel production capacity by both public
and private sector companies.
Exhibit 2.5: Crude Steel Capacity & Production during 12th Five Year Plan (million tonnes)
Source: Planning Commission
As for exports, the significant fall in production in the last few years resulted in exports of iron
ore to fall dramatically. Following a global meltdown in demand and export ban in Karnataka
and Goa, exports of iron ore from India declined significantly from a peak of about 117.36
million tonnes in 2009-10 to about 60.6 million tonnes in 2011-12, and which is forecasted to
further decrease to about 15-20 million tonnes in the current year. Higher railway freight for iron
ore exports compared to domestic freight charges and a 30% export duty on iron ore has meant
that exports today are unviable beneath international prices of about 130 USD per tonne.
The current export policy provides for exporting iron ore of Fe content up to 64% and exports of
iron ore from India are primarily to China (about 90%), followed by Japan and Korea. The iron
ore lumps accounted for less than 10% of the total iron ore exports in 2009-10 & 2010-11 and
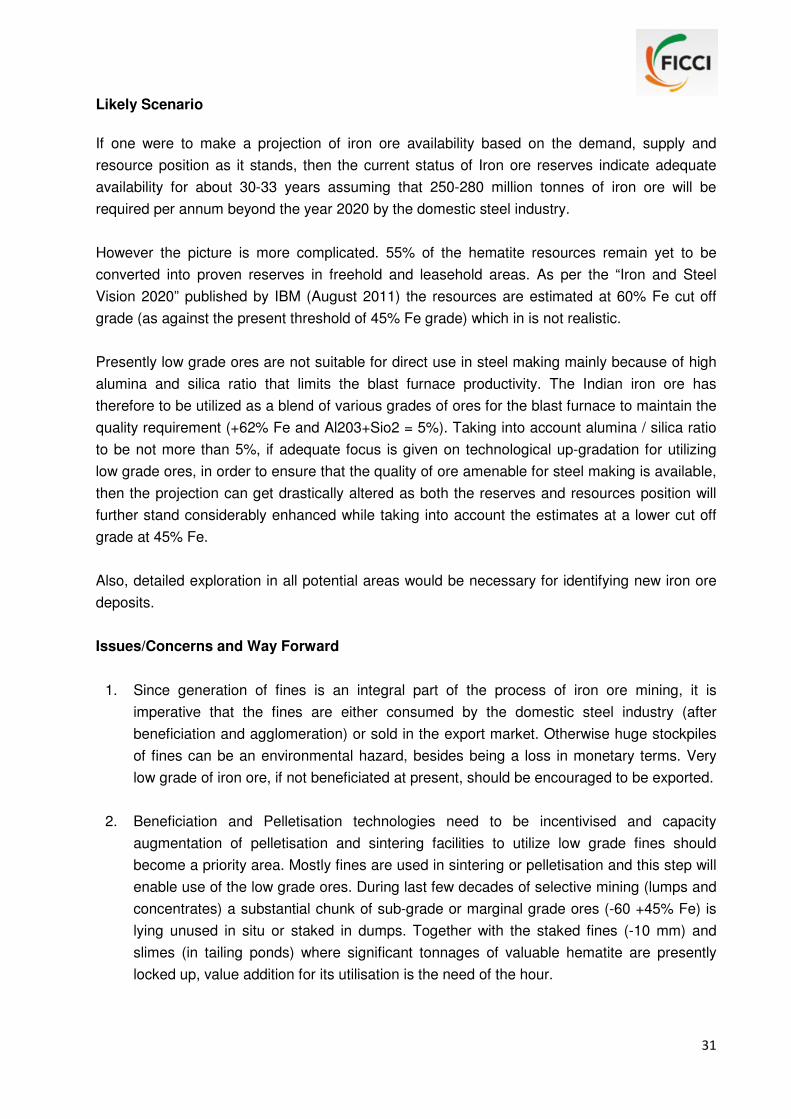
the exports are mainly in the form of iron ore fines. Overall, iron ore consumption in India has
increased at a CAGR of 15.1%. It stood at 55.52 million tonnes in 2005-06 and increased to
111.4 million tonnes in 2010-11 (as shown in Exhibit 2.6).
Exhibit 2.6: Domestic Usage of Iron Ore (million tonnes)
Year Iron Ore Produced Mine Head Stock Iron Ore Consumed
2005-06 165.23 43.1 52.52
2006-07 187.70 52.2 66.90
2007-08 213.25 63.6 85.00
2008-09 212.96 74.6 87.40
2009-10 218.64 90.8 90.60
2010-11 208.11 117.1 111.40
2011-12 167.29 123.5 106.69
Source: Indian Bureau of Mines
84.38
95.8
107.4
119.7
133.4
146.6
75.9486.2
96.7107.7
120.1
131.9
0
20
40
60
80
100
120
140
160
2011-12 2012-13 2013-14 2014-15 2015-16 2016-17
Capacity
Production
31
Likely Scenario
If one were to make a projection of iron ore availability based on the demand, supply and
resource position as it stands, then the current status of Iron ore reserves indicate adequate
availability for about 30-33 years assuming that 250-280 million tonnes of iron ore will be
required per annum beyond the year 2020 by the domestic steel industry.
However the picture is more complicated. 55% of the hematite resources remain yet to be
converted into proven reserves in freehold and leasehold areas. As per the “Iron and Steel
Vision 2020” published by IBM (August 2011) the resources are estimated at 60% Fe cut off
grade (as against the present threshold of 45% Fe grade) which in is not realistic.
Presently low grade ores are not suitable for direct use in steel making mainly because of high
alumina and silica ratio that limits the blast furnace productivity. The Indian iron ore has
therefore to be utilized as a blend of various grades of ores for the blast furnace to maintain the
quality requirement (+62% Fe and Al203+Sio2 = 5%). Taking into account alumina / silica ratio
to be not more than 5%, if adequate focus is given on technological up-gradation for utilizing
low grade ores, in order to ensure that the quality of ore amenable for steel making is available,
then the projection can get drastically altered as both the reserves and resources position will
further stand considerably enhanced while taking into account the estimates at a lower cut off
grade at 45% Fe.
Also, detailed exploration in all potential areas would be necessary for identifying new iron ore
deposits.
Issues/Concerns and Way Forward
1. Since generation of fines is an integral part of the process of iron ore mining, it is
imperative that the fines are either consumed by the domestic steel industry (after
beneficiation and agglomeration) or sold in the export market. Otherwise huge stockpiles
of fines can be an environmental hazard, besides being a loss in monetary terms. Very
low grade of iron ore, if not beneficiated at present, should be encouraged to be exported.
2. Beneficiation and Pelletisation technologies need to be incentivised and capacity
augmentation of pelletisation and sintering facilities to utilize low grade fines should
become a priority area. Mostly fines are used in sintering or pelletisation and this step will
enable use of the low grade ores. During last few decades of selective mining (lumps and
concentrates) a substantial chunk of sub-grade or marginal grade ores (-60 +45% Fe) is
lying unused in situ or staked in dumps. Together with the staked fines (-10 mm) and
slimes (in tailing ponds) where significant tonnages of valuable hematite are presently
locked up, value addition for its utilisation is the need of the hour.

32
3. There are constraints in rail–road–port infrastructure such as lack of power rail
connectivity to ports, inadequate rail capacity for domestic and export of iron ores, lower
haulage capacity of rail wagons etc. besides poor condition of roads and low capacity of
handling of iron ore at ports. The augmentation of rail infrastructure is therefore vital
particularly in eastern sector. Also the railway freight class for both domestic steel industry
and exports of iron-ore should be reduced to 120 class
4. The present estimate of the reserve position does not give a complete picture, as 55% of
the hematite resources remain yet to be converted into reserves. Further, as per the “Iron
and Steel Vision 2020” published by IBM (August 2011) the resources are estimated at
60% Fe+ cut off grade which in is not realistic. The re-assessment of iron ore reserves /
resources at lower cut grades (45% Fe) is called for taking into consideration ore
characterization (Al2O3 +SiO2 <= 5%) so that the steel industry can use the ores. Such a
re-assessment will substantially increase the iron ore resources in the country.
5. The demand of iron ore at present has kept aside the reserves of Banded Iron Formation
(BIF) in the inferior category resulting in huge piles of BIF as rejects. Utilization of these
inferior grade materials by adopting suitable beneficiation techniques may reduce the
burden on land and environment.
6. While there is no dispute that in general iron ore prices are lower in the domestic market
than international prices but selling in international market at internationally prevailing
prices does not necessarily result is higher net realization for iron ore miners due to
various fiscal restrictions like high export duty of 30%, high rail logistic cost from mine-
head to port, etc. However, in the longer term, demand for iron ore from China can make
Indian iron ore exports an attractive preposition provided international prices is above a
threshold which presently is about 130 USD. At the same time, given the capacity addition
in the steel sector that has been happening and which has been planned, domestic
utilization for value addition should not be neglected for want of iron ore. According to the
projection by Ministry of Steel, domestic steel production is slated to reach 200 mt by
2020 and iron ore requirement will be about 250-280 million tonnes per annum (rest met
from scrap), resulting in a likely shortage of ore (+62% Fe) availability for the domestic
steel industry. In view of this, a balance and pragmatic view needs to be adopted so that
neither the steel making industry suffers nor are the iron ore miners completely restricted.
Mineral 2: BAUXITE
Bauxite is the only ore used for commercial production of aluminium using the Basic Bayer
process for alumina refining and Hall–Heroult process for aluminium smelting. After slow growth
for over a long period, there has been all round improvement in the growth of the aluminium
sector. The per capita consumption has now increased to 1.3 kg from 0.5 kg in the last decade.
It is expected that with the significant rise in demand, the consumption of aluminium would be
33
about 3.0 kg by 2017. Presently, there are four primary aluminium producers with five smelters;
while Nalco, Balco and Vedanta operate one smelter each, Hindalco has two smelters.
Reserve and Resource Position
Bauxite resources in the country, as on April 1, 2010, were 3,480 million tonnes, of which 593
million tonnes are reserves and remaining 2,887 million tonnes are resources. By grades 84%
of resources are of metallurgical grade. The resources of chemicals and refractory grade are
limited and accounts for 4% only.
By State, Odisha alone accounts for 52% of country’s resources of Bauxite followed by Andhra
Pradesh (18%), Gujarat (7%), Chhattisgarh and Maharashtra (5% each) and Madhya Pradesh
and Jharkhand (4% each). The major metallurgical grade Bauxite resources are concentrated in
the eastern coast bauxite deposits of Odisha and Andhra Pradesh. The chemical and refractory
grade bauxite is mostly located in Gujarat, Chhattisgarh, Jharkhand and Maharashtra.
There were 345 leases that were granted for bauxite mining as on April 1, 2010 covering an
area of 30,059.10 hectares. Out of the 345 mines, 200 were operational.
Production
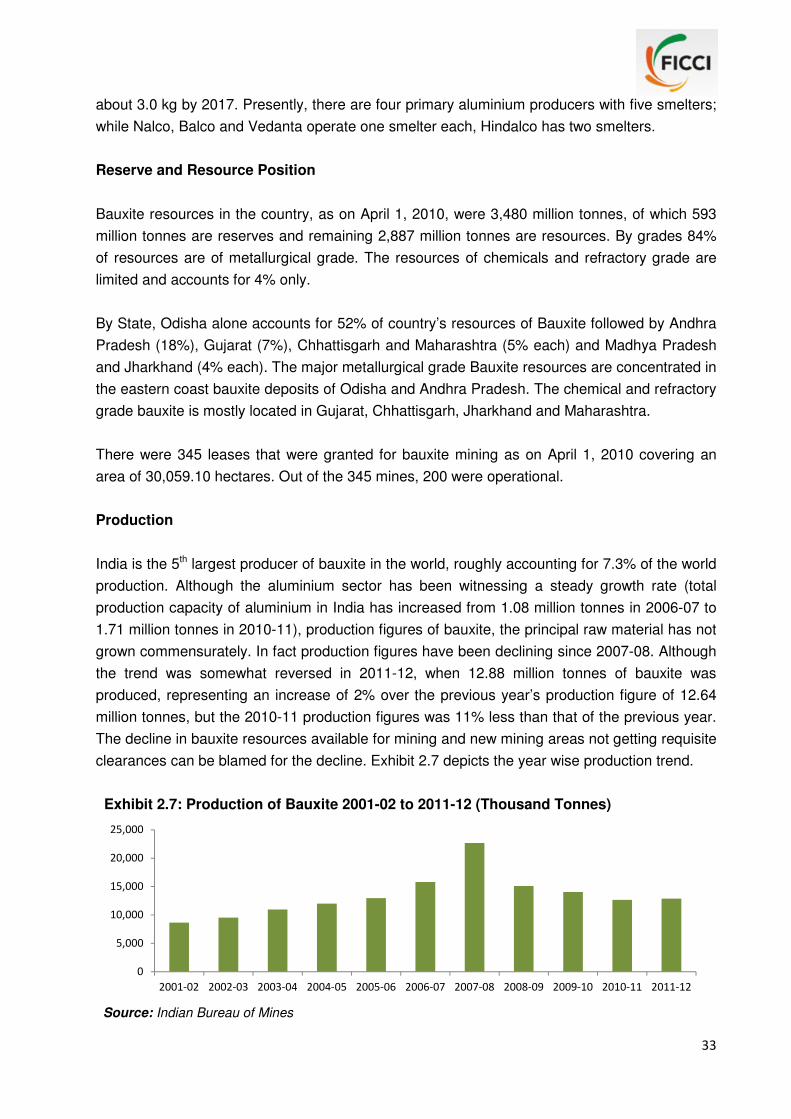
India is the 5th largest producer of bauxite in the world, roughly accounting for 7.3% of the world
production. Although the aluminium sector has been witnessing a steady growth rate (total
production capacity of aluminium in India has increased from 1.08 million tonnes in 2006-07 to
1.71 million tonnes in 2010-11), production figures of bauxite, the principal raw material has not
grown commensurately. In fact production figures have been declining since 2007-08. Although
the trend was somewhat reversed in 2011-12, when 12.88 million tonnes of bauxite was
produced, representing an increase of 2% over the previous year’s production figure of 12.64
million tonnes, but the 2010-11 production figures was 11% less than that of the previous year.
The decline in bauxite resources available for mining and new mining areas not getting requisite
clearances can be blamed for the decline. Exhibit 2.7 depicts the year wise production trend.
Exhibit 2.7: Production of Bauxite 2001-02 to 2011-12 (Thousand Tonnes)
Source: Indian Bureau of Mines
0
5,000
10,000
15,000
20,000
25,000
2001-02 2002-03 2003-04 2004-05 2005-06 2006-07 2007-08 2008-09 2009-10 2010-11 2011-12

34
The share of 18 public sector mines was about 44% of the total production in 2011-12, of which
the contribution of Panchpatmali Bauxite mine of Nalco was 39% of the total production. Exhibit
2.8 gives the top 5 bauxite mines in India, which cumulatively accounted for nearly 50% of the
total production.
Exhibit 2.8: Five Principal Bauxite Mines in India
Name of Mine Location of Mine Mine Owner
Panchpatmali District Koraput, Odisha National Aluminium Co. Ltd., (NALCO)
Chachandi District Shahdol, Madhya Pradesh Ram Avatar Agarawal.
Mainpat District Sarguja, Chhattisgarh Bharat Aluminum Co. Ltd. (BALCO)
Asota – Mevasa District Jamnagar, Gujarat Bombay Minerals Ltd.
Durgamanwadi District Kolhapur, Maharashtra Hindalco Industries Ltd.
Source: Indian Bureau of Mines
About 10% of the total production of Bauxite was of the grade below 40% Al2O3, about 52% of
the total production was of grade 40-45% Al2O3, around 26% of the total production was of the
grade 45-50% Al2O3, around 3% of the total production was of grade 50-55% Al203 and 1% of
the total production was of grade 55-60% of Al2O3. While 4% of total production was of cement
grade, nominal production of 1% was reported to refractory, abrasive & chemical grades.
Exhibit 2.9: Production of Bauxite State Wise - 2008-09 to 2010-11
States
2008-09 2009-10 2010-11
Quantity Value Quantity Value Quantity Value
India 15,460,202 4,703,221 14,124,093 4,887,897 12,640,785 4,737,480
Chhattisgarh 1,674,427 557,371 1,687,069 607,911 2,109,945 765,262
Goa 463,150 34,736 31,050 3,105 100,900 10,090
Gujarat 3,514,016 897,680 2,687,306 667,424 913,421 293,540
Jharkhand 1,585,356 552,684 1,670,577 673,016 1,827,805 619,458
Karnataka 127,830 24,418 123,316 32,748 65,517 14,162
Madhya Pradesh 1,037,724 376,581 1,056,847 365,097 585,791 122,283
Maharashtra 2,053,512 625,275 1,985,006 628,556 2,135,235 550,780
Odisha 4,734,421 1,591,786 4,879,580 1,909,188 4,856,275 2,353,153
Tamil Nadu 269,766 42,690 3,342 852 45,896 8,752
Source: Indian Bureau of Mines

35
Although Gujarat ranked fifth in terms of quantity produced, the state had the maximum Mines
Head Stocks (95% of the total stock of about 10 million tonnes) at the end of the year 2010–11.
Demand
As mentioned earlier, the aluminium sector has been growing at a steady pace increasing the
demand for bauxite. The total production capacity of aluminium in India has increased from 1.08
million tonnes in 2006-07 to 1.71 million tonnes in 2010-11
However production of bauxite has not been commensurate and has been mostly declining
since 2007-08. As a result the exports of bauxite have decreased substantially to 0.12 million
tonnes in 2010-11 as compared to 2007-08 (for calcined & non-calcined ore). This represented
a decline to the tune of 58% in value and 75% in quantity. In order to meet the domestic
demand from the aluminium sector, imports have been increasing, mostly from China.
Likely Scenario
The Bauxite requirement by primary aluminium producers is likely to be around 24 million
tonnes by 2017. There has been addition to refining capacity in the last few years with an
additional refining capacity of 3.21 million tonnes of alumina being envisaged in the 12th plan
period. This would mean that imports will have to increase substantially or else aluminium
production n the country will go down. There are large numbers of small deposits of bauxite,
deposits with less than 50 million tonnes. These mines will assume more significance and may
even get a premium. With anticipated bauxite mining facilities by the end of 12th plan period
(2016–17), there may be a gap of 7 to 10 mt of bauxite production.
There are abundant bauxite reserves in the country. Of nearly 3 billion tonnes of metallurgical
grade resources, less than 600 million tonnes are under the operating mining leases. However
since they are located in heavily forested areas, inhabited by indigenous people; mining has
been unable to start in these regions. For example Vedanta group’s bauxite mining project in
Odisha to feed its Lanjigarh refinery has not been given clearance by the Ministry of
Environment and Forests.
Issues/concerns and Way Forward
1. The quantity of bauxite has been depleting in various mines with respect to alumina and
silica contents and R&D efforts are needed in this regard.
2. Many of the existing leases are also on the verge of expiry, while the reserves in the
existing mines are reported to be depleting, and new leases are not being granted.
Excepting for Nalco, the other two primary producers namely Hindalco and Balco are

36
facing acute shortage of bauxite for sustained running of their refineries. No timely action
has been considered for allocation of bauxite deposits to meet the Brownfield expansion
of the existing alumina refineries. This needs to be developed.
3. In Gujarat and Chhattisgarh, where chemical and refractory grade bauxite are mined
along with inferior grade of metallurgical bauxite; proper utilization is called for, as there
are large number of small mines in Gujarat.
4. A proper reassessment and detailed exploration is the need of hour in all potential areas
to convert 83% of bauxite resources into the proven reserves.
5. As all bauxite areas in Chhattisgarh are reserved for PSUs for a long time and have not
been de-reserved so far, the same are blocked for want of exploration and development.
It is therefore necessary that all the reserved areas are de-reserved for grant of mineral
concessions to the existing aluminium plants and refineries.
Mineral 3: CHROMITE / CHROME ORE
Chromite is an oxide of chromium and iron with chemical composition FeoCr2O3 or FeCr2O4 and
containing Cr:Fe ratio of about 1.8:1. Chromite is used mainly in metallurgical industry for
manufacture of ferro-alloys e.g. ferro-chrome, charge-chrome and silico-chrome which are used
as additives in making stainless steel and special alloy steel as well as mild steel. The demand
for ferro-alloys is associated with the production of alloy steel and as such, chromite has got its
critical importance in the steel industry.
Reserves and Resources Position
The total resources of chromite in the country as on 1.4.2010 was estimated at 203 million
tonnes comprising 54 million tonnes reserves and the remaining 149 million tonnes being
categorized as resources. Thus 27% of the estimated potential is reserves and 73% is
resources. More than 93% of resources of chromite are located in Odisha, mostly in the
Sukinda Valley in Cuttack and Jeypore districts followed by small deposits scattered over
Manipur, Nagaland, Karnataka, Tamil Nadu and Maharashtra. Grade wise charge chrome
grade accounts for 36% resources followed by ferro-chrome grade (19%), beneficiable grade
(17%) and refractory grade (5%). Nearly 2,500 sq km area is the potential geological domain, of
which 85 sq km area only is presently leased out.
Production
The production of chromite was at 4.26 mt during 2010-11 with an increase of 24% compared to
previous year due to improved demand but the production in 2011-12 was at 3.76 mt, a
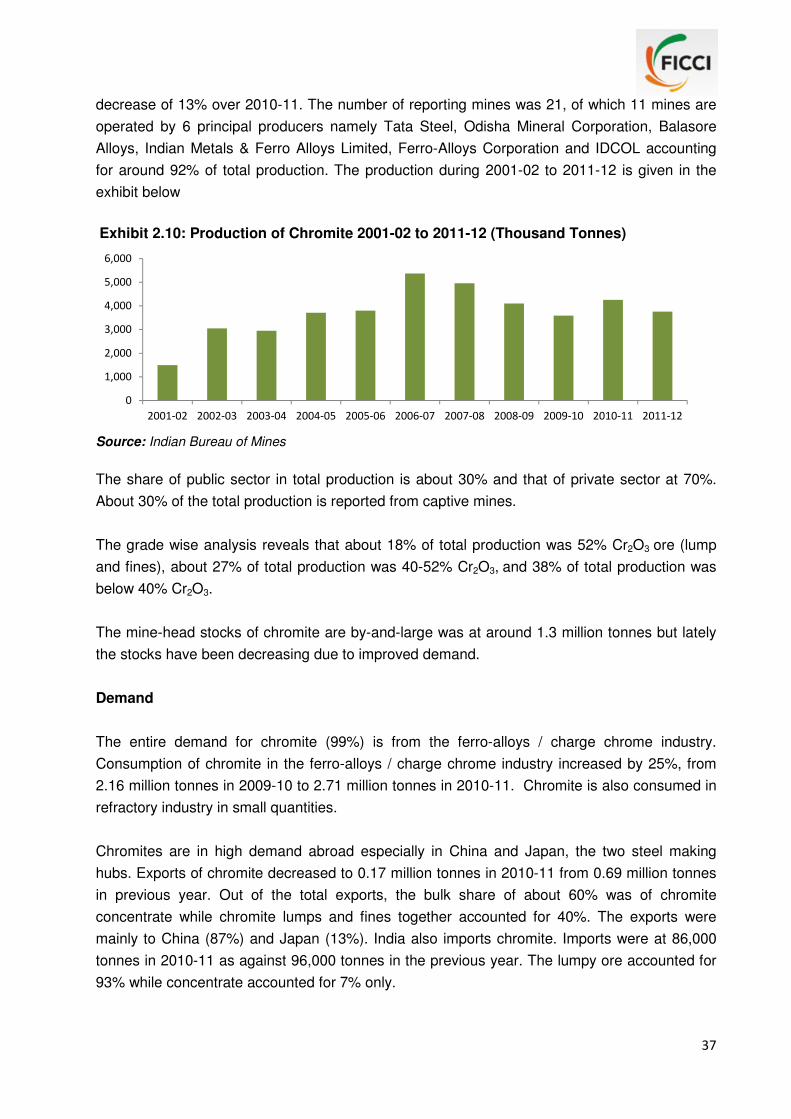
37
decrease of 13% over 2010-11. The number of reporting mines was 21, of which 11 mines are
operated by 6 principal producers namely Tata Steel, Odisha Mineral Corporation, Balasore
Alloys, Indian Metals & Ferro Alloys Limited, Ferro-Alloys Corporation and IDCOL accounting
for around 92% of total production. The production during 2001-02 to 2011-12 is given in the
exhibit below
Exhibit 2.10: Production of Chromite 2001-02 to 2011-12 (Thousand Tonnes)
Source: Indian Bureau of Mines
The share of public sector in total production is about 30% and that of private sector at 70%.
About 30% of the total production is reported from captive mines.
The grade wise analysis reveals that about 18% of total production was 52% Cr2O3 ore (lump
and fines), about 27% of total production was 40-52% Cr2O3, and 38% of total production was
below 40% Cr2O3.
The mine-head stocks of chromite are by-and-large was at around 1.3 million tonnes but lately
the stocks have been decreasing due to improved demand.
Demand
The entire demand for chromite (99%) is from the ferro-alloys / charge chrome industry.
Consumption of chromite in the ferro-alloys / charge chrome industry increased by 25%, from
2.16 million tonnes in 2009-10 to 2.71 million tonnes in 2010-11. Chromite is also consumed in
refractory industry in small quantities.
Chromites are in high demand abroad especially in China and Japan, the two steel making
hubs. Exports of chromite decreased to 0.17 million tonnes in 2010-11 from 0.69 million tonnes
in previous year. Out of the total exports, the bulk share of about 60% was of chromite
concentrate while chromite lumps and fines together accounted for 40%. The exports were
mainly to China (87%) and Japan (13%). India also imports chromite. Imports were at 86,000
tonnes in 2010-11 as against 96,000 tonnes in the previous year. The lumpy ore accounted for
93% while concentrate accounted for 7% only.
0
1,000
2,000
3,000
4,000
5,000
6,000
2001-02 2002-03 2003-04 2004-05 2005-06 2006-07 2007-08 2008-09 2009-10 2010-11 2011-12

38
Likely Scenario
The apparent consumption by 2016-17 is estimated at 4.35 million tonnes while production is
estimated to reach 7 million tonnes by the end of 12th plan.
Chromite is a scarce mineral in India with 1% of the total reserves of the world whereas exports
are 30-35% of the world share.
Unless resources are converted into reserves, and with production slated to be substantially
above domestic demand, exports would increase and India would be facing a shortage of
chromites. Given the requirement of the stainless steel industry, the reserves are likely to last
for only 20 years. There is therefore a need to conserve this critical input for the growth of
domestic steel industry.
Issues/Concerns and Way Forward
1. India has only 54 million tonnes of reserves and the ore is friable at 200-300 meter depth
which cannot be mined with the present technology. Therefore, there is a need to focus
on deep drilling for converting resources into the reserves particularly in Sukinda Valley of
Odisha. Development of underground mining technology for mining of friable and deep
seated chrome ore reserves is urgently required. Further, 73% of the resources remain
yet to be explored and developed to establish the additional reserves and this need to be
given priority by the government and the industry.
2. The beneficiation of low grade ore (less than equal to 32% Cr2O3) is called for as against
38% Cr2O3 ores to augment the reserves.
3. For mining one tonne of chrome ore, 15 tonnes of Over Burden (OB) is excavated in open
cast mines. Management of waste lumps in Sukinda Valley is therefore a major
environmental concern. These overburden lumps modify the land topography, affect the
drainage system and prevent natural succession of plant growth resulting in acute
problems of soil erosion and environmental pollution.
4. The contamination of hexavalent chromium in the local water bodies is a major concern
and a source of environmental pollution in Odisha. The pumped out water from the mine
therefore needs to be doused with ferrous-sulphate solution before being discharged.
5. The existing policy of reservation of chrome ore mining areas in favour of PSUs need to
be discontinued. Rather, such areas may be de-reserved and thrown open for allotment to
private sector to carry out exploration and development

39
Mineral 4: MANGANESE ORE
Manganese ore is anther indispensible raw material in steel making where it is used in the form
of ferro-manganese and also as a direct feed to the blast furnace. The important non
metallurgical uses are in manufacture of dry batteries and chemicals, paints etc. but 95% of
world production of manganese ore is used in metallurgy of iron and steel. Carbon steel is the
principal market accounting for 65-70% of manganese consumption.
The manganese ore mining in the country is carried out by open cast as well as underground
methods.
Reserve and Resources Position
The total resources of manganese ore in the country as on April 1, 2010 was 430 million
tonnes. Out of this, 142 million tonnes (33%) are categorized as reserves and the balance 288
million tonnes (67%) as resources.
As regards grade wise position of reserves, ferro-manganese grade accounts for 8% of the total
reserves, medium grade accounts for 11% of the reserves, Blast Furnace grade accounts for
34% of the reserves, and the remaining 47% of the reserves are mixed and low grade including
battery / chemical grade.
State wise, Odisha has the maximum reserves with 44% share followed by Karnataka with 22%
of the reserves, Madhya Pradesh has 13% of the reserves, Maharashtra has 8% of the
reserves, Andhra Pradesh has 4% of the reserves and Jharkhand & Goa each have 3% of the
reserves. The remaining 3% is scattered in Rajasthan, Gujarat and West Bengal.
There are 142 mines, of which 113 are small mines with capacity less than 20,000 tonnes per
annum. Of these 142 mines, 8 are underground mines (3 in Madhya Pradesh and 5 in
Maharashtra). Seven underground mines are operated by MOIL and one by J K Minerals (a
private company). All underground mines are mechanized or semoi-mechanized and adopt cut
and fill method of stoping.
Production
Although the production of manganese ore during 2010–11 increased by 16% over 2009-10
production figures, to reach 2.88 million tonnes owing to increased demand but subsequently
production decreased to 2.35 million tonnes in 2011-12, a decrease of 23%.
Five principal produces operating 26 mines contributed 69% of the production, namely
Manganese Ore India Limited (MOIL), Tata Iron and Steel Company Limited (TISCO), Odisha

Mines & Minerals (OMM), Sander Manganese & Iron Ores Ltd and Gujarat Mineral
Development Corporation (GMDC); MOIL’s contribution was 46% of
Nearly 85% of the production was by
annum and the rest 15% was produced
tonnes per annum. The contribution of captive mines was 11% of total production whereas 20
public sector mines accounted for 45%
As regards grade wise composition, 66% production was of low grade (below 35% Mn), 22% of
medium grade (35–46% Mn) and 10% of high grade (46% Mn & above).
content of the manganese ore produced was
dioxide ore was only 2%. The status of production of manganese ore during 2001
11and contribution of different states
Exhibit 2.11: Production of Manganese Ore 2001
Source: Indian Bureau of Mines
Exhibit 2.12: Quantity of Manganese Ore in Different States, 2010
Source: Indian Bureau of Mines
0
500
1,000
1,500
2,000
2,500
3,000
3,500
2001-02 2002-03 2003-04
Madhya Pradesh, 25%
Mines & Minerals (OMM), Sander Manganese & Iron Ores Ltd and Gujarat Mineral
ration (GMDC); MOIL’s contribution was 46% of the total production.
production was by 29 big mines with capacity above 20,000 tonnes per
was produced by 113 small mines with capacity less than 20,000
. The contribution of captive mines was 11% of total production whereas 20
public sector mines accounted for 45% of the total production.
As regards grade wise composition, 66% production was of low grade (below 35% Mn), 22% of
) and 10% of high grade (46% Mn & above).
of the manganese ore produced was about 34% Mn. The production of manganese
dioxide ore was only 2%. The status of production of manganese ore during 2001
different states is given in the exhibits below.
: Production of Manganese Ore 2001-02 to 2011-12 (Thousand Tonnes)
: Quantity of Manganese Ore in Different States, 2010-11
04 2004-05 2005-06 2006-07 2007-08 2008-09 2009-
Odisha, 23%
Others, 6%
Andhra Pradesh, 10%
Karnataka, 14%
Madhya Pradesh, 25%
Maharashtra, 22%
Quantity
40
Mines & Minerals (OMM), Sander Manganese & Iron Ores Ltd and Gujarat Mineral
total production.
with capacity above 20,000 tonnes per
with capacity less than 20,000
. The contribution of captive mines was 11% of total production whereas 20
As regards grade wise composition, 66% production was of low grade (below 35% Mn), 22% of
) and 10% of high grade (46% Mn & above). The average metal
The production of manganese
dioxide ore was only 2%. The status of production of manganese ore during 2001–02 to 2010-
12 (Thousand Tonnes)
11
-10 2010-11 2011-12
Others, 6%

41
The mine–head stocks were reported to be around 0.8 million tonnes at the end of 2010-11.
Madhya Pradesh and Odisha each accounted for 25% of the total production.
Demand
The reported consumption of manganese ore in all industries was 3.48 million tonnes in 2010-
11 as against 2.92 million tonnes in 2009-10. Silico-manganese (64%) and ferro-alloys (31%)
industries together accounted for about 95% of the consumption followed by iron and steel (4%)
and remaining 1% by battery, chemicals, glass etc. The Indian manganese ores are preferred
by many, as they are generally hard, lumpy and amenable to easy reduction.
Likely Scenario
The apparent consumption was estimated at around 3.5 million tonnes in 2011-12 and will
reach 4.5 - 5.0 million tonnes by 2016-17.
However production and consumption figures show that for consecutive years, production has
been less than demand. For example, in 2009-10 and in 2010-11 production were at 2.48
million tonnes and 2.88 million tonnes respectively. As against this, demand or consumption
was 2.92 million tonnes in 2009-10 and 3.48 million tonnes in 2010-11. This shortfall is
increasingly met by imports, primarily from South Africa and Australia, which have increased
from 3,000 tonnes in 2005-06 to 0.8 million tonnes in 2009-10 and further.
The proven mineable reserves will last for 20 years at the present rate of extraction of 3 million
tonnes per annum.
Though the manganese consumption has drastically reduced from 45 kg per tonne of steel to
30 kg per tonne of steel, its vital role in steel making is co-status, as there is no substitute for
manganese. The current market trend indicates more consumption of medium grade
manganese ore as compared to high grade ores.
Moreover, production from existing mines as well as opening up new mines is required in order
to bridge the demand-supply gap.
Issues/Concerns and Way Forward
1. Presently, 67% of the total is categorized as resources, which needs suitable techno-
economic measures or additional exploration to convert into reserves if production were to
match demand. Pockets of scattered deposits are uncertain in nature and therefore many
times, mining strategy fails, if the deposits are not scientifically investigated.

42
2. There is a certain rise in the demand for manganese alloys. Higher power tariff in most of
the states has put additional burden on manganese alloy producers. The availability of
power at reasonable tariff needs to be ensured to manganese alloy producers.
3. There is limited high grade low phosphorous manganese ore in India and the imports of
such ores are necessary. South Africa has 80% of the world reserves but accounts for
only 20% of world production. Acquisition of manganese ores in South Africa needs to be
planned.
4. Improvement in quality and recovery of manganese ores by means of beneficiation and
sintering process is required. Import of low phosphorous high grade manganese ore could
be considered for blending, as the Indian ores by-and-large contain high phosphorous.
Mineral 5: LIMESTONE
Limestone occupies the top position among non-fuel solid mineral deposits as per volume of
annual extraction. The mining of about 250 million tonnes of limestone for the cement industry
is only next to coal. Limestone is the primary constituent for the manufacture of cement. Given
India’s rapid urbanization and the demand for housing as well as infrastructure, demand for
limestone is likely to increase further.
There are 23 principal producers (cement plants) contributing 78% of the total production
including 6% of production by public sector mines. There were in all 280 captive mines
contributing 90% of the production.
Reserve and Resources Position
The total resources of limestone of all categories and grades are estimated at 184,935 million
tonnes, of which 14,926 million tonnes (8%) only are under reserves category and remaining
170,009 million tonnes (92%) are under the resources category.
Karnataka is the leading state having 28% of the total resources followed by Andhra Pradesh
with 20% of the total resource. Rajasthan has 12% of the total resource, Gujarat has 11% of the
total resource, Meghalaya has 9% and Chhattisgarh has 5% of the total resource.
Grade-wise, cement grade has leading share of about 69% followed by SMS / BF grades (12%)
and chemical grade (3%). Remaining 16% are of unclassified grades.
In addition to the above, Gujarat has 5 million tonnes of chalk resources and 152 million tonnes
of marl deposits of all grades, of which 92% of resources may be categorized as proven
reserves.

43
Production
The production of limestone in 2011-12 was at around 257 million tonnes, an increase of 4%
over the 240 million tonnes produced in 2010-11, which was again a marginal improvement
over the previous year (see exhibit 2.13). This is more or less in line with the growing demand
of cement.
About 95% of the total production of limestone is of cement grade, 3% of iron & steel grade and
the rest 2% consists of chemical and other grades.
Exhibit 2.13: Production of Limestone 2001-02 to 2011-12 (Thousand Tonnes)
Source: Indian Bureau of Mines
There were 659 reporting mines in 2011-12 as against 592 mines in 2010-11, of which 18
mines produced more than 3 million tonnes each per annum and contributed about 36% of the
total production. Another 15 mines, each in the production range of 2-3 million tonnes per
annum contributed 15% of total production. Further, another 44 mines, each in the production
rage of 1-2 million tonnes per annum contributed 26% of total production. The remaining 23%
production was reported by 476 mines.
Andhra Pradesh is the leading producing state accounting for 22% of the total production of
limestone followed by Rajasthan (18%), Madhya Pradesh (13%), Gujarat (9%), Tamil Nadu,
Chhattisgarh and Karnataka (8% each), Himachal Pradesh (5%), Maharashtra (4%) and the
remaining 5% contributed by Odisha, Uttar Pradesh, Jharkhand, Meghalaya, Jammu and
Kashmir etc. The mine-head stocks of limestone are being maintained at 12 to 13 mt at the end
of the year.
Demand
As mentioned above, 95% of the total production of limestone is of cement grade. Moreover,
280 captive mines contribute 90% of the production. So production of limestone is essentially
for the manufacture of cement.
0
50,000
1,00,000
1,50,000
2,00,000
2,50,000
3,00,000
2001-02 2002-03 2003-04 2004-05 2005-06 2006-07 2007-08 2008-09 2009-10 2010-11 2011-12

44
In terms of volume of cement production, India is second only to China. However the per capita
consumption of cement in India is significantly low in India compared to most major cement
producing countries.
In fact, the location of a green-field cement plant is dictated by the availability of requisite quality
and quantity of limestone. Growth of cement industry is bound to spur a proportionate demand
on limestone availability. The projected cement production by 2016-17 is slated to touch 393
million tonnes per annum.
The exports of limestone ranged from 1 to 2.4 mt to neighbouring countries during the last three
years, whereas imports were from 4 to 5 mt, mainly of calcium carbide, chalk and bleaching
powder etc.
The limestone containing 45% (minimum) CaO and above is usually preferred in the
manufacture of cement, whereas Magnesia, Sulphur and Phosphorous are regarded as
deleterious elements. The broad chemical specifications of cement grade limestone are given in
exhibit 2.14.
Exhibit 2.14: Broad Chemical Specifications of Cement Grade Limestone
Oxide Component / Other Constituents
Acceptable Range for Manufacture of Ordinary
Portland Cement (33, 43 & 53 Grade) - %
Limiting Values Taking into Consideration Other Types
of Cements, Scope of Beneficiation & Blending - %
CaO 44-52 40 (min)
MgO 3.5 (max) 5.0 (max)
SiO2 To satisfy LSF, silica -
Al2O3 Modules & Alumina -
Fe2O3 Modules -
TiO2 <0.5 <1.0
Mn2O3 <0.5 <1.0
R2O (Na2O + K2O) <0.6 <1.0
Total S as SO3 <0.6 <0.8
P2O5 <0.6 <1.0
CI <0.015 <0.05
Free Silica <8.0 <10.0
Source: Report on Norm for Limestone Deposits for Cement Manufacture by National Council for
Cement and Building Materials, New Delhi, May 2001

45
Likely Scenario
Although India seems to have enough limestone to cater to its cement production, there are
some areas of concern.
While considering GDP growth rate of 8% in the 12th plan, the projected cement consumption is
required to grow at 10% per annum. This would mean an annual production requirement of
about 600 million tonnes per annum production of limestone would be required by 2016-17 or
roughly double of the present capacity of about 300 million tonnes per annum.
The gross resources of cement grade limestone are not fully utilized for cement making due to
various constraints such as inaccessibility of some deposits in hilly terrains, environmental
regulations e.g. Coastal Regulation Zone and technological constraints. This reduces the
availability of cement grade limestone for cement manufacturing.
Availability of limestone reserves for future requirements may prove to be an area of concern
while considering that 30% of reserves fall under forest and other regulated areas not available
for cement manufacture. About 22.5% of the limestone bearing areas falls under forested areas
totalling a reserve position of 28,022 million tonnes. Similarly 7.5% of the limestone bearing
areas falls under Coastal Regulation Zone, totalling a reserve position of 9,340 million tonnes.
In view of above, limestone availability for sustainable development of cement industry is not
assured beyond 50 years.
Issues/Concerns and Way Forward
1. As only 8% of the total resources are classified as reserves, efforts are needed to convert
resources into the reserve category by means of detailed exploration by the government
agencies as well as by the industry. There is a need to increase proven reserves through
development of deposits in inaccessible areas (as Himalayas, Indo-Gangetic Plain,
Desert Area and NER), through relaxation of norms and undertaking exploration, etc.
2. In the existing mining areas, the depth continuity of limestone beyond 50 meters needs to
be explored for further development.
3. Incentives on utilization of mineral beneficiation techniques with better recovery from low
grade limestone and mine rejects may be considered by incentives such as reduction in
royalty rates on such material.
4. Development of rail-road infrastructural network may be taken up on priority to utilize the
available resources especially in hilly and inaccessible areas.

46
Base Metal Ores and Associated Strategic Minerals / Metals
This chapter deals with those metals/minerals that can collectively be called “Base Metals”. This
group of metals are characterized by being “non-ferrous” in nature and are of high value.
Moreover most of these metals are not easy to extract (and therefore need state-of-the-art
technology) and are usually extracted through underground mining.
The base metals mainly comprise of copper, lead and zinc etc along with associated metals and
may be classified as “Deficit Category”. Even though country is presently self-sufficient in
copper and zinc metal production, but in the long-run, availability of indigenous ores will be a
cause of concern because of limited ore reserves. In addition, there are strategic minerals /
metals which are largely imported. Hence, this group of metals assumes great importance from
the point of view of raw material security for industrial development.
Mineral 1: COPPER ORE
Copper ranks third in terms of tonnage consumption after iron and aluminium. Copper is a
strategic metal essential for development. It is acclaimed for its conductivity and anti-bacterial
quality as well as for production of important alloys such as brass and bronze. The electrical
industry is by far the largest consumer of copper in the country.
Till 1997, Hindustan Copper Limited (HCL) was the only integrated producer of primary refined
copper in the country. The scenario changed with setting up of the smelters by Hindalco
Industries (Birla Copper) and Sterlite Industries (India) Limited (SIL) solely based on imported
concentrates and this significantly enhanced the refined copper production capacity to one
million tonne per annum as against 47,500 tonnes per annum capacity in 1997. The low grade
quality of Indian copper ores and nature of ore bodies (narrow width) restrict large scale
production from underground mines and as such, the domestic demand of copper and its alloys
is met through domestic production, recycling of scrap and by imports. India is not self-sufficient
in the reserves of copper ore.
Reserve and Resources Position
The total resource of copper ore as on April 1, 2010 was estimated at 1.56 billion tonnes. Of
this, 394 million tonne (25%) only fall under reserve category (proven and probable) while the
balance 1,164 million tonne (75%) are remaining resources. The grade of copper ore reserves
varies largely between 1% Cu and 1.85% Cu whereas identified resources contain less than 1%
Cu grade. The largest resources confine in the state of Rajasthan (50%) followed by Madhya
Pradesh (24%) and Jharkhand (18%), along with small occurrences in other states.

47
Production
The production of copper ore in 2010-11 was 3.62 million tonnes, which was an increase of
11% over the previous year but production in 2011-12 declined by 3% to 3.48 million tonnes.
The metal content in the ore produced worked out to be 35,477 tonnes. The production of
copper concentrates was 136,856 tonnes by HCL alone, of which contribution of Malanjkhand
mines was 58% with average metal content of 26% Cu in the concentrates. The average copper
content in the ore produced from four mines varied between 0.94% Cu to 0.98% Cu. The
production of copper concentrates decreased by 5% in 2011-12 over the previous year. The
status of copper concentrates production during 2001-02 to 2010-11 is given the exhibit below.
Exhibit 3.1: Production of Copper Concentrates 2001-02 to 2011-12 (Thousand Tonnes)
Source: Indian Bureau of Mines
Demand
Refined copper production in India is currently dominated by three major players, HCL,
Hindalco and SIL. While HCL produces copper metal from the ore produced at its captive
mines, Hindalco and SIL have shore-based smelters and are dependent entirely on imported
metal-in-concentrates.
Refined copper is traded globally in the form of copper cathodes and continuous cast (CC)
copper rods while other forms are very insignificant. India is a net exporter of refined copper,
though exports have reduced over the last few years, with the expansion of domestic demand
and range-bound production. Refined copper exports account for 36% of domestic production.
Nearly 50% of India’s copper and alloy exports are to China, Saudi Arabia and the United Arab
Emirates.
Refined copper imports, on the other hand accounted for less than 4% of the domestic demand
for refined copper. Copper sales in India have increased at a CAGR of 8% during the last five
years, whereas refined copper consumption has witnessed a growth of 10% CAGR.
0
50
100
150
200
2001-02 2002-03 2003-04 2004-05 2005-06 2006-07 2007-08 2008-09 2009-10 2010-11 2011-12

48
Exhibit 3.2: Import and Export of Refined Copper in India (tonnes)
Year Export Import
2006-07 376,000 19,045
2007-08 337,000 23,781
2008-09 226,000 24,546
2009-10 252,000 21,497
2010-11 235,874 16,072
Source: Indian Bureau of Mines
The per capita consumption of copper in India is around 0.5 kg as against 4.6 kg in China and
10kg in developed nations. The consumption is expected to grow by 8-9% in the coming years
driven by the government’s increased expenditure in the power and transport sectors. The total
refined copper consumption as reported in 2010-11 was 560,836 tonnes.
Likely Scenario
As Hindustan Copper Limited has planned more than tripling of its mine output through
expansion of Malanjkhand mines for 5 million tonnes production per annum, India’s
dependence on import of copper concentrates may come down to 90% in the 12th plan period
as against 95% at present. As regards to refined capacity, it may increase to nearly 1.5 million
tonnes by 2015-16 as given below:
Exhibit 3.3: Projected Capacity and Production of Refined Copper (tonnes)
Year Capacity Production Concentrate Requirement (MIC)
2011-12 949,500 735,500 758,000
2012-13 949,500 707,500 822,000
2013-14 949,500 847,500 874,000
2014-15 1,449,500 1,322,500 1,363,000
2015-16 1,449,500 1,347,500 1,389,000
Source: Indian Bureau of Mines
The copper industry in India faces a high level of deficit in copper ore mining capacity and
surplus in refining capacity. The domestic production of concentrates accounts for only 4% of
the total requirement. As a result, two major companies (Hindalco and SIL) rely on overseas
markets for almost their entire requirement of copper concentrates.
As demand and per capita consumption grows, India will face a challenge in importing copper
concentrates as in the long term restrictions in sourcing copper concentrates from abroad will
49
come to play. The increase in mining output by Hindustan Copper Limited will at best lower the
import requirements somewhat and temporarily.
Again for custom smelters, (such as Hindalco and SIL) the treatment and refining charges (TC /
RC) are an important source of income or alternatively, they are major cost heads for mining
companies. Consequently, their profitability is strongly dependent on the international variation
in TC / RC charges. While the TC / RC charges have declined at a CAGR of more than 20%
during last five years, this has resulted in a tight global copper concentrate market and in turn, a
significant adverse impact on the profit margins of custom smelters. On the other hand, copper
prices increased at a CAGR of 15% in the last 10 years, driven by high prices in the world, the
copper producing companies may witness impact of product substitution mainly by aluminium.
Issues/Concerns and Way Forward
1. India is heavily dependent on imported copper concentrates and will continue to have
surplus refining capacity in the long-term. However, looking at the international long-term
scenario, there could be restrictions in sourcing copper concentrates from abroad and in
view of this, priority for indigenous development of known resources need to be given.
Moreover, India’s share in world copper mineral reserve base is only 0.7%. Therefore,
there is an urgent need to increase the resources within the country by increased
investment in detailed exploration. As of now, there is huge gap between domestic
demand and production of concentrates.
2. Copper concentrates invariably contain precious metals like gold, silver and selenium.
Birla copper recovers these metals to some extent but refining of gold is not taken up. On
the other hand, SIL does not produce gold and silver but exports anode slime containing
these metals whereas HCL has discontinued their precious metal recovery plant in 2007-
08 on economic consideration. The main issue that has affected gold recovery from
copper concentrates is of inverted duty structure with respect to gold and silver content.
Though the import duty on gold content in concentrate was removed in 2011, but an
excise duty of Rs 300 per 10 gram on finished gold is imposed. This duty cannot be
passed on to the buyers of gold, since there is no countervailing duty on finished gold.
Thus, the potential of copper industry to produce gold remains underutilized.
3. There is also a strong case for acquiring copper mining properties abroad with the
purpose of importing the concentrates into India. A case in point is of Konkola copper
mines in Zambia acquired by Vedanta Resources but the concentrates are not allowed for
import into India. The government support for overseas mines acquisition will be
necessary for free import of copper concentrates into India from such acquisitions.
4. It is necessary to reduce the customs duty on copper concentrates as well as the CST to
NIL so as to ensure viability of custom smelting model.
50
5. Effective recycling of scrap needs to be ensured through the organized sector in the
interest of mineral conservation.
Mineral 2: Zinc and Lead Ores
Zinc is the third most used non-ferrous metal after aluminium and copper. Globally, about 50%
of the zinc produced is used in galvanizing of steel products to protect them from corrosion.
Lead is frequently recovered as a by-product of lime production. Over 80% of all lead produced
is used in making lead–acid batteries for storage of energy.
India has a combined zinc–lead production capacity of more than one million tonne per annum.
Reserve and Resources Position
The total resources of zinc and lead ore as on April 1, 2010 were estimated at 686 million
tonnes. Of these, 109 million tonnes (16%) fall under reserves category while the balance 576
million tonnes (84%) are classified as remaining resources. Of the 686 million tonnes of total
resources, ore containing (+10% Zn & Pb) was estimated at 140 million tonnes, whereas ores
containing (5 to 10% Zn & Pb) was estimated at around 252 million tonnes while ore containing
less than 5% Zn & Pb was estimated at 293 million tonnes.
The total metal content out of the total ore resources (686 million) is 11.55 million tonnes of lead
metal and 36.66 million tonnes of zinc metal. In terms of proven ore reserves, out of the total
109 million ores, 2.24 million tonnes of lead metal and 12.45 million tonnes of zinc metal are
estimated to be proven.
Rajasthan is endowed with the largest resource base having 89% of the total resource, followed
by Andhra Pradesh at 3% and Madhya Pradesh at 2%, Bihar and Maharashtra each have about
1.5% of the estimated resources.
Production
At present, zinc is produced in India by Hindustan Zinc limited (HZL) and Binani Zinc Limited
(BZL). On the other hand, the sole producer of Lead is Hindustan Zinc limited. However,
Hindustan Zinc limited is the only integrated producer of primary zinc and lead from its mines in
Rajasthan. The other producer Binani Zinc Limited produces zinc from imported concentrates.
Indian Lead Limited (ILL) is yet to start production.
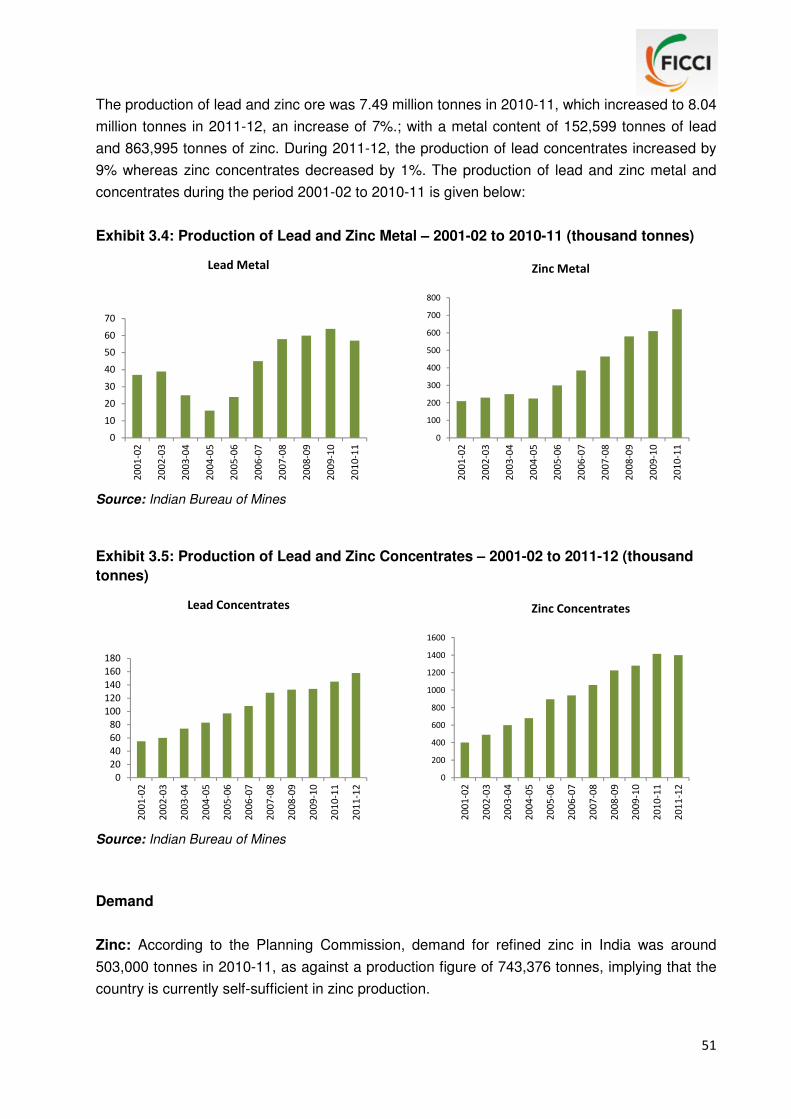
51
The production of lead and zinc ore was 7.49 million tonnes in 2010-11, which increased to 8.04
million tonnes in 2011-12, an increase of 7%.; with a metal content of 152,599 tonnes of lead
and 863,995 tonnes of zinc. During 2011-12, the production of lead concentrates increased by
9% whereas zinc concentrates decreased by 1%. The production of lead and zinc metal and
concentrates during the period 2001-02 to 2010-11 is given below:
Exhibit 3.4: Production of Lead and Zinc Metal – 2001-02 to 2010-11 (thousand tonnes)
Source: Indian Bureau of Mines
Exhibit 3.5: Production of Lead and Zinc Concentrates – 2001-02 to 2011-12 (thousand
tonnes)
Source: Indian Bureau of Mines
Demand
Zinc: According to the Planning Commission, demand for refined zinc in India was around
503,000 tonnes in 2010-11, as against a production figure of 743,376 tonnes, implying that the
country is currently self-sufficient in zinc production.
0
10
20
30
40
50
60
70
20
01
-02
20
02
-03
20
03
-04
20
04
-05
20
05
-06
20
06
-07
20
07
-08
20
08
-09
20
09
-10
20
10
-11
Lead Metal
0
100
200
300
400
500
600
700
800
20
01
-02
20
02
-03
20
03
-04
20
04
-05
20
05
-06
20
06
-07
20
07
-08
20
08
-09
20
09
-10
20
10
-11
Zinc Metal
0
20
40
60
80
100
120
140
160
180
20
01
-02
20
02
-03
20
03
-04
20
04
-05
20
05
-06
20
06
-07
20
07
-08
20
08
-09
20
09
-10
20
10
-11
20
11
-12
Lead Concentrates
0
200
400
600
800
1000
1200
1400
1600
20
01
-02
20
02
-03
20
03
-04
20
04
-05
20
05
-06
20
06
-07
20
07
-08
20
08
-09
20
09
-10
20
10
-11
20
11
-12
Zinc Concentrates

52
Exhibit 3.6: Demand for Zinc in India (tonnes)
Source: Working Group Report on Mineral Exploration and Development (other than coal and
lignite) for the Twelfth Five Year Plan
It is pertinent to note that the current per capita consumption of zinc in the country is 0.41 kg as
against a world average of 1.7 kg. The low level of per capita consumption and a large pipeline
of infrastructure projects in the country will significantly push up the demand for zinc in the
country in the future. Zinc metal consumption in India is expected to grow at the same rate as
the Gross Domestic Product (GDP) of the country according to Hindustan Zinc limited.
Lead: While India is self sufficient in the production of zinc, the country’s lead producing
capacity is far below demand. According to the Planning commission, the demand for lead in
India grew by 7% to 380,000 tonnes in 2010-11 as against 355,000 tonnes in 2009-10. The
current demand for lead metal is about 4 lakh tonnes. The main growth driver has been the
increase in the demand for auto batteries by original equipment manufacturers. According to
Hindustan Zinc limited, lead demand is expected to grow and sustain the 7% growth rate in the
coming years.
Exhibit 3.7: Demand for Lead in India (tonnes)
Source: Working Group Report on Mineral Exploration and Development (other than coal and
lignite) for the Twelfth Five Year Plan
4,10,000
4,30,000
4,50,000
4,70,000
4,90,000
5,10,000
5,30,000
5,50,000
2007-08 2008-09 2009-10 2010-11
2,70,000
2,90,000
3,10,000
3,30,000
3,50,000
3,70,000
3,90,000
2007-08 2008-09 2009-10 2010-11

53
Likely Scenario
The enhancement in zinc production capacity in the country has translated into supply being
currently more than demand and the surplus resulting in increased exports primarily to Korea,
China, Italy, Belgium and Netherlands. However this situation may last for the next few years
only. It is estimated that Zinc metal consumption in India is expected to grow at the same rate
as the Gross Domestic Product (GDP) of the country. As the economy recovers to a higher
growth trajectory, per capita consumption of zinc improves and the infrastructure projects which
are in the pipeline takes off, the supply-demand gap is likely to narrow down with demand
catching up to supply levels. The zinc demand–supply scenario during the 12th Five Year Plan
(2012-13 to 2016-17) is given in the exhibit below:
Exhibit 3.8: Demand-Supply Scenario of Zinc during 12th Plan Period (tonnes)
Year Demand Production (estimated)
Imports Secondary
Zinc Exports Supply
2012-13 60,000 916,500 50,000 20,000 386,500 600,000
2013-14 66,000 917,000 50,000 20,000 327,000 660,000
2014-15 73,000 959,000 50,000 20,000 299,000 730,000
2015-16 80,000 979,000 50,000 20,000 249,000 800,000
2016-17 88,000 979,000 50,000 20,000 169,000* 880,000
Source: Indian Bureau of Mines
*only surplus zinc is likely to be exported
On the other hand, India is net importer of lead metal, as the country’s demand for lead metal
far exceeds its supply. Refined lead imports which were above 110,000 tonnes in 2009–10,
declined by 16% in 2010–11. India Imports lead and alloys mainly from Australia, China and
Korea. The primary lead demand by the end of the 12th Five Year Plan (2016-17) is estimated
at 5.68 lakh tonnes as against a present demand of around 4 lakh tonnes, whereas the supply
is envisaged to be at 1.85 lakh tonnes only as against nearly 1 lakh tonnes at present.
Issues/Concerns and Way Forward
1. India’s primary metal production capacity build-up is constrained on account of limited
lead resources. Further, only 16% of zinc resources are classified as reserves and there
is an acute need to take steps for enhancing the reserves of both lead and zinc. As 50%
of the total zinc resources are of low grade, mining of such deposits may be encouraged
by way of special relaxation in royalty payment and/or through fiscal incentives.
2. Many of the base metal deposits are located in forest areas, where exploratory drilling is
required but because of stringent forest regulation, prospecting activity is not permitted. In
54
fact, mining exploration by modern techniques to locate deep seated deposit requires
certain concessions and special dispensation which are presently lacking.
3. In order to promote mineral exploration activity, the equipment / technology should be
available in a cost effective manner. So, the import duties (currently 28%) on drilling rigs,
bits, accessories and fluids need to be brought at par with those needed for CBM (Coal
Bed Methane) exploration, which is duty free. Duty structure should also be favourable for
procurement of geo-physical / geo-chemical surveying instruments.
4. With rapid expansion of smelter capacities, imports of zinc and lead concentrates are
inevitable, as domestic production will be insufficient to meet the requirements. A
supportive tariff regime (NIL Duty) is required on raw materials such as zinc and lead
concentrates.
5. In the long-term, future of lead–zinc industry will depend upon the new mineral
discoveries as well as economic viability of mining of marginal grade deposits and all
efforts are needed to increase the zinc-lead reserves in the country.
Strategic Minerals and Metals
Economic growth, industrialization and urbanization of economies have been associated with
the rising use of certain minerals. These minerals are extremely important for new and existing
technologies related to electronics, ceramics, defence and other critical industries. Some of
these minerals also find use in nuclear applications, manufacture of super-alloys, magnets, flat
panel television etc. The demand of these minerals will continue to increase as our economy
progresses. However, supply has struggled to keep pace with the demand for these minerals.
This has led to significant increase in price levels and greater sensitivity to unexpected
production disruptions, natural disaster and geo-political events. Hence, many of the countries
have started securing supplies and developing their own resources to match the demand. Given
the importance of these metals in the economies, securing the access and supply of these
mineral resources is becoming a matter of strategic importance.
The following minerals / metals are accordingly classified as strategic minerals:
1. Tin
2. Cobalt
3. Lithium
4. Germanium
5. Gallium
6. Indium
7. Niobium
8. Beryllium
9. Tantalum
10. Tungsten
11. Bismuth
12. Selenium
Globally, there are growing risks and challenges to secure the supplies of these minerals.
Globally the demand is only increasing. China is a major producer of many of these minerals
and have started putting quantitative restrictions on their exports in order to conserve them and
even imports some of them. A brief summary of certain characteristics of these strategic
minerals / metals is given in the exhibit below.

55
Exhibit 3.09: Characteristics of Strategic Minerals / Metals
Mineral Source User Industry Major Producers
India’s Production (TPY)
Imports (tonnes)
Estimated Global
Demand – 2030
(tonnes)
Tin Cassiterite Soldering, Tin Plate and Chemicals
China, Indonesia and Peru
60 8,000 NA
Cobalt By-product of copper and nickel mining
Defence, Chemicals, paints and Ceramics
Congo, China, Zambia and Russia
1,560 9,953 240,000
Lithium Electrolysis of Lithium Chloride and Potassium Chloride and Glass
Battery manufacturing industry, Paint, Grease and Aluminium production
Chile, Australia and China
NA NA 340,000
Germanium Zinc and Copper smelting process
Solar cells, Defence and Optical Fibre
China, USA and Russia
NA NA 220
Gallium By-product of Aluminium production process
LEDs, Mobile communication and Integrated circuits
China, Japan Germany, Kazakhistan and Ukraine
55 kg NA 603
Indium By-product of extraction of Zinc, Lead, Copper & Tin
Television industry and Soldering
China, Korea, Canada, Belgium and Japan
NA NA 1,911
Niobium Pyrochlore Magnets, Steel and Aerospace
Brazil and Canada
NA NA NA
Beryllium Electrolysis of Beryllium Fluoride and Sodium Fluoride
Military, Space, Nuclear Energy and Electronics
USA and China
NA NA NA
Tantalum Tantalum oxide
Capacitors Brazil, China, Australia, Mozambique, and Rwanda
NA NA 1,410
Tungsten Ammonium Paratungstate
Light Bulbs, Defence and Drills
China, Russia, Canada, Bolivia and Austria
NA NA 500,000
Bismuth By-product of extraction process of Lead, Zinc and Tin
Pharmaceutical, Soldering and Electronic circuits
China, Mexico and Peru
NA NA NA
Selenium Sulphide deposits
Glass, Agriculture, Dairy industry and Manufacture of alloys
Japan, Belgium, Canada and Germany
NA NA NA
Source: Own Research; Figures are approximate

56
From the table, it is very clear that India is dependent on imports to a large extent and is
vulnerable to supply / price fluctuations. Hence, there are challenges for India, so far as these
strategic metals are concerned. India should therefore develop its own policy and draft an
integrated roadmap for mining, production and usage of these minerals. It may be mentioned
that resource / reserve base of these minerals in India is not yet known or ascertained. The
briefs on these minerals and metals are given below:
Tin
In 2006, India reportedly consumed 300,000 tonnes of tin plate of which nearly two-third were
imported. Major tin plate producers in the country are Tin Plate Company of India, GPI Steel
and SAIL (Rourkela). The occurrence of the strategic atomic metals i.e. niobium and tantalum in
cassiterite deposits (tin-ore) led the Department of Atomic Energy to set-up a pilot plant for
recovery of all three components. However, the commercial production remains yet to be
planned. On the other hand, the total resources of tin ore are estimated at 83,719,066 tonnes,
of which the reserves are 7,131 tonnes only containing 1,132 tonnes of metal. This means that
the economics of mining of resources needs to be worked out.
India produced around 60,000 kilograms of tin in 2009, all of which was reported from
Dantewada district of Chhattisgarh. Further in 2009 imports of tin and alloys including scrap was
7,689 tonnes.
Cobalt
The world cobalt resources are estimated at just 13 million tonnes of metal content. The African
nation Congo (DRC) has 35% of resource base.
India has around 45 million tonnes resources of cobalt ore, although no production takes place
indigenously. Most of the cobalt refined is from imported ores. In India, the total refined capacity
is around 1,500 tonnes per annum and the production is around 1,000 tonnes per annum. The
prices of cobalt ranged between US$ 30 to 50 per pound during the last 3 years.
Of the 45 million tonnes of resources that India purportedly has, 69% of this is in Odisha
followed by 31% in Nagaland and Jharkhand.
Lithium
China and Chile have the maximum (85%) share in world reserves of Lithium, estimated at
around 11 million tonnes. The main countries producing Lithium are Chile, China, Australia and
Argentina. The total production reported in 2010 was 25,300 tonnes. There is no production of
lithium in India, though its use is increasing in battery manufacturing industry and in the field of
medicine.

57
Germanium
It is mined primarily from Sphalerite (zinc ore) and is also recovered from silver, lead and
copper ores smelting as by-product. The total refinery production in the world was at 120,000
tonnes in 2010, of which 80,000 tonnes capacity was in China. Around 30% of total germanium
consumed is produced from recycling scrap.
Presently, its use is in the manufacture of photo-voltaic cells in the satellite industry for
conversion of solar energy to electricity. There is no production of Germanium in India.
Gallium
Primary gallium production in terms of metal content was around 106 tonnes in 2010. China,
Germany, Kazakhistan and Ukraine are the leading producers and the world refining capacity
was around 141 tonnes of gallium in 2010. However in India, gallium is not produced, as earlier
attempts did not succeed due to low gallium content in Indian Bauxite ores.
Indium
Indium is a very versatile metal and its concentration on earth is the same as silver but it is not
mined because of poor concentrations. It is mainly produced as a by-product of the commercial
extraction of base metals. The major producers are China, Canada and Korea; Japan being the
largest consumer.
Niobium
Though, niobium and tantalum minerals often occur together but approximately 85-90% of
niobium industry obtains its niobium ores from sources other than those associated with the
mining of tantalum containing ores. The main consumption of niobium is in steel industry and
super alloys. The major producer is Brazil followed by Canada and the total production was
around 62,000 tonnes in 2009.
The world’s largest deposit of Pyrochlore is located in Brazil. The reserves of Pyrochlore in
Brazil are estimated at 478 million tonnes followed by just 18,000 tonnes in Quebec (Canada).
There are two companies in Brazil and one in Canada which produce 85% of the world’s
demand for niobium products, mainly the ferro-niobium.
In India, small quantity of columbite-tantalite minerals has been produced as by-product of mica
and cassiterite ore mining. Today indigenous process technology for extraction of niobium and
tantalum metals from the ores has been established but the regular production is not reported.

58
Beryllium
The key markets for beryllium are aerospace, automotive electronics, ceramics, computer and
telecommunications. USA is the leading producer of Beryllium followed by China. The total
production ranges between 150-200 tonnes per annum.
India has substantial deposits of Beryl ore and the process technologies for treating the
indigenous resources have been developed and a pilot plant is being operated by the
Department of Atomic Energy.
Tantalum
Tantalum is mainly found in the form of tantalum oxide and the concentrates have 20%-60% of
tantalum depending on the mine source. Brazil is the major producer followed by Australia,
China, Mozambique and Rwanda. The total production is around 9,000 tonnes per annum.
In India, very small quantities of columbite-tantalite minerals have been recovered as by-
product of mica and cassiterite ore mining but there is no production of tantalum at present.
Tungsten
Tungsten is whitish grey metal used largely as tungsten carbide for cutting as well as in
electrodes and super alloys. The metal is mainly extracted from ammonium paratungstate.
China is the largest producer and exporter of tungsten to USA; the other producers are Russia
and Austria. The total world production is reported to be 58,000 to 60,000 tonnes per annum,
whereas global consumption is estimated at 85,000 tonnes including recycled material.
In India, the total ore resources are estimated at 87 million tonnes with metal content of 142,094
tonnes but no mineable reserves are established. Out of the total resources, Karnataka’s share
is 42% fallowed by 27% by Rajasthan, Andhra Pradesh had a 17% share and Maharashtra’s
share was 9%. India imported around 20 tonnes of tungsten ore in 2008-09.
Bismuth
World reserves of bismuth are usually based on bismuth content in lead resources because
bismuth production is most often a by–product of processing of lead ores. The world reserves of
bismuth are estimated at 120,000 tonnes with major contribution by China followed by Mexico,
Peru, Bolivia and Canada.
The world production per annum is in the range of 7,300 to 8,000 tonnes, of which China
contributes 5,000 to 6,000 tonnes of production of bismuth. There is no production of bismuth is
India so far.

59
Selenium
Primary selenium is recovered from anode slimes generated in the electrolytic refining of
copper. The metal is also produced as a by-product of lead, zinc, gold and platinum processing.
Reserves of selenium are based on identified copper deposits. Coal also contains 0.5 to 12
ppm of selenium but it is not recovered. The total world reserves are estimated at 88,000
tonnes of the metal, the biggest resource being in Chile and Russia followed by USA, Peru and
Canada. The total world production of the metal in 2009 was reported to be 2,260, which
increased marginally to 2,300 tonnes in 2010.
In India, Selenium is produced by Hindalco and the annual production in 2008-09 was reported
at 37 tonnes whereas Hindustan Copper Limited (HCL) has not produced selenium from its
Ghatshila copper smelter in the recent years. India imported around 164 tonnes of selenium in
2008-09.
Issues/Concerns and Way Forward
1. India is dependent on the imports of these strategic minerals to a large extent and is
vulnerable to supply / price fluctuations. However the applications of these metals are
mainly in the field of hi-tech technology. So a proper strategy for the development of these
metals is required.
2. A detailed assessment of potential resource base and its economic feasibility is the need
of hour for proper development.
3. Building a national stockpile for strategically critical input materials as identified is
essential.

60
High Value Precious Metals
In this chapter we look at a cluster of metals which are of “High Value”, extracted in “Low
Volumes” and are precious/semi-precious. This group of metals are therefore called High Value
Precious Metals. In most cases; these are deep seated involving underground mining with
sophisticated technology. These are also extracted as by-product of base metal ores. Some of
these are also used as gem stones. India is known to have favourable geological terrain similar
to those of gold rich geological terrains of the world, specifically Archean Greenstone Belts, but
the country is largely deficient in the production of these high value metals and is heavily
dependent on imports. This calls for a proper development strategy for these high value
minerals / metals, for which there is a substantial demand in India.
Metal 1: GOLD
During the days of Gold Standard in the pre-Brettton Wood days, the prosperity of a nation was
linked to the amount of Gold it possessed. Since then it has evolved as a form of investment
too. Gold in bulk form is referred to as “Bullion” that can be casted as ingots or minted into
coins. On account of its volatility in terms of price, gold has the ability to tilt the individual’s or
nations economic fortunes. Around 25,000 tonnes of gold out of the 166,600 tonnes of above
ground stocks is reported to be available in India.
Reserve and Resources Position
The global geological reserves of gold (metal content) have been placed at 51,000 tonnes, of
which 14% are located in Australia, 12% in South Africa, 10% Russia, 6% in USA and
Indonesia each, 3.9% in Peru, 3.7% in China and 3.3% in Uzbekistan. The reserve base
(reserves and resources) is estimated at 1 lakh tonnes world over after the intensive exploration
efforts, of which South Africa contains 31% share followed by Russia, Australia, Indonesia,
China and Others.
The average mine production of gold for last the three years was around 2,500 tonnes per
annum. In 2010, China reported a production figure of 345 tonnes, followed by 255 tonnes by
Australia, 230 tonnes by USA and 190 tonnes each by South Africa and Indonesia. It is
noteworthy that China has been steadily increasing its gold production, whereas south Africa is
showing a decreasing trend. The gross world supply of gold in 2010 was at 4,196 tonnes
(higher than the demand) which included 2,543 tonnes from mine production and 1,653 tonnes
from recycling.
In India, the total resources of gold ore is estimated at 494 million tonnes, of which 24 million
tonnes only are placed in reserve category and remaining 470 million tonnes under resource

61
category. The total resource in terms of metal (primary gold) is at 659.84 tonnes. Out of this,
110.54 tonnes is under reserve category and 549.30 tonnes under remaining resource category
which also includes placer type gold resources. By states, largest resources in terms of gold ore
(primary) are located in Bihar (45%), followed by Rajasthan (23%), Karnataka (22%), West
Bengal (3%), Andhra Pradesh and Madhya Pradesh (2% each). In terms of metal content,
Karnataka remains on top followed by Rajasthan.
Production
After the closure of Kolar Gold Fields Mines of BGML in 2001, the Hutti Gold Mines Limited
(HGML), a government of Karnataka enterprise has become the sole producer of primary gold
in the country. The principal mine, Hutti and two other units viz Hira–Buddini and Utti are all
underground mines located in Raichur district of Karnataka. The resource potential in HGML
mines is at 223 tonnes of metal and the production is at 2.219 tonnes of gold metal in 2010-11.
In addition, there is production as by-product of copper concentrates. A few mines in private
sector such as RMML, Geo–Mysore (Pvt) Ltd and Deccan Explorations etc are set to start
production in next 2 years The present status is given in the exhibit below
Exhibit 4.1: Gold Production in India (by-product and mine - tonnes)
Year
Mine
Production
(HGML)
Birla copper
(Hindalco) HCL
Total
Produced
Sterlite (gold
content in anode
slimes exported)
2006-07 2.336 10.33 0.13 12.796 8.44
2007-08 2.808 9.14 - 11.948 9.11
2008-09 2.420 4.87 - 7.29 5.50
2009-10 2.070 9.11 - 11.18 10.57
2010-11 2.219 6.96 - 9.179 10.09
2011-12 2.192 NA NA NA NA
Source: Indian Bureau of Mines
Demand
The demand for gold in India is not only the highest in the world but also the fastest growing.
With the Indian economy projected to grow at 8% during 12th plan, the demand for gold can only
increase further. The World Gold Council (WGC) has estimated India’s gold consumption in
2011 to be 1,167 tonnes, whereas gold demand in the world has been relatively stable ranging
between 3,729 and 3,812 tonnes during the period 2001 to 2010. However, on account of
increase in prices, the world demand in value terms has increased five times (from 32.5 billion
to 150 billion) during the last 10 years.

62
The gross supply of gold in 2010 in India was 2.54 tonnes of mine production and 1.653 tonnes
by recycling. India imported about 1,059 tonnes of gold in 2011 and the projection till 2017 are
given in exhibit 4.2.
Exhibit 4.2: Import of Gold into India (tonnes)
Year Imports
2008 (Actual) 771
2009 (Actual) 851
2010 (Actual) 963
2011 (Actual) 1,059
2012 (Projected) 1,176
2013 (Projected) 1,305
2014 (Projected) 1,449
2015 (Projected) 1,608
2016 (Projected) 1,785
2017 (Projected) 1,982
Source: Indian Bureau of Mines
Likely Scenario
Demand for gold in India outstrips supply; the gap being met through imports. This scenario will
continue. High prices have hardly been a deterrent. The highest demand for gold in the world is
from India. So imports of gold in significant quantities will continue, un\less there is higher
production in India. This will require more reserves to be explored and established.
Geologically, India has a shared history with Western Australia and parts of Africa as these
were formerly part of the Gondwana super-continent that existed 300 million years ago. So
there remains a positive probability of more discoveries..
There has been a substantial augmentation in gold resources (from 187 tonnes in 2000 to 659
tonnes in 2010), mainly due to increase in gold exploration activity but keeping in view the vast
potential in the country, a lot of efforts are needed and certain incentives for detailed exploration
have to be considered in this regard to encourage more investors / explorers.
The 12th plan envisages 44 tonnes of production by 2016-17 and 100 tonnes by 2025 - 2030
but the strategy as to how the gold prospects having potential resources are to be developed
into mines while considering the techno-economics and level of investment required is unclear.
The indentified prospects (33) are small deposits with low treasure of ore are as given below:
• Karnataka (22): Kempinkote, Manighatta, South Kolar cluster mines, KGF west reefs,
Hanni–Ajjampur, Karajgi, Chinmulgund, Ganajur, Kuluvalli, Bhavihal, Mangalgatti,

63
Lakkikoppa, Hiriyur, Hosur-Champion, Yelisirur, Hirenagur, Buddini–Maski, Kadoni, Uti
South-West, Hutti North-Prospect, Jainapur, Wandalli and Surapalli
• Andhra Pradesh (5): Bhadrampaile, Ramapura, Venkatampalli, Chinnabhari and Jibutil
• Madhya Pradesh (1): Gurharpahar–Sankorwa
• Chhattisgarh (3): Sonakhan, Sonadehi and Pathalgaon cluster
• Jharkhand (2): Parasi and Lawa
Issues/Concerns and Way Forward
1. India today has a reserve base of 659 tonnes of gold metal, which needs to be converted
into minable reserves through intensive exploration. Also India is characterized by a
number of small gold occurrences and there is no deposit of substantial size and grade
discovered so far during the last 25 years mainly because of lack of concerted efforts in
detailed exploration neither by government agencies, nor by private parties. The
government needs to expeditiously grant prospecting licenses and create a favourable
environment for exploration.
2. The production of gold in the country has actually reduced in last 6 years, primarily due to
reduced by-product recovery and due to inability of HGML to increase its production
despite holding significant reserves. The by–product source has a potential of producing
25 tonnes of gold at the current level of refined copper operations in the country, if
supported by appropriate tax and duty structure.
3. More than 100,000 sq km area has been identified as potential for gold minalization in the
country but only 462 sq km area has been approved for grant of prospecting licenses. In
view of this, lengthy and avoidable procedures for grant of PLs need to be addressed by
central and state governments. Facilitating expeditious grant of PLs and MLs to applicants
interested in development of small and marginal grade gold deposits is essential, while
considering that the time lag of more than 5 years in prospecting and mining is required.
4. The tailings from 32 mt dumps of BGML must be considered for recovery of gold to
produce around 2 tonnes per annum.
5. Development of ore specific metallurgical flow sheet is the need of hour for commercial
mining of small deposits.
6. Fund raising mechanism need to be in place through the amendments in regulation to
allow SEBI for listing of exploration companies, particularly junior exploration companies
on Indian stock exchanges. Also, the private sector companies may be permitted to issue
flow-through shares for funding risky exploration activities.
64
Metal 2: SILVER
Ores of silver metal, in which silver is practically the only valuable metal, are primarily mined in
Mexico, Peru, USA (to a minor extent). The average world mine production of silver metal is in
the range of 2,600 to 3,000 tonnes per annum during last five years, Mexico and Peru are the
leading producers.
In India, there are no native silver deposits except the small and unique Bherak deposits in
Rajasthan. It occurs generally with lead, zinc, copper and gold ores and is extracted as a by-
product from electrolysis or chemical methods.
Silver on account of its physical properties, is now being increasingly used in industry
applications (55%) followed by jewellery (19%) and coins / metals (12%). There has been a
sharp increase in silver prices in recent times from 4.4 US$ per oz in 2001 to 20.19 US$ per oz
in 2010. The total world supply of silver metal was at 1,056 tonnes in 2010.
The demand for silver in investment has seen a significant surge lately and the prices are also
expected to maintain a firm trend with a target US$ 50 per oz in near term.
Reserve and Resources Position
The total resources of silver ore in the country as on April 1, 2010 was estimated at 467 million
tonnes, out of which 188 million tonnes are placed in reserve category and remaining 279
million tonnes under resource category. However, in terms of metal content, the total resource
is at 27,628 tonnes comprising 8,040 tonnes as reserves and remaining 19,588 tonnes as
resources. Rajasthan accounts for 87% resources of ore followed by Jharkhand (5%), Andhra
Pradesh (4%) and Karnataka (2%).
Production
Silver is recovered primarily as a by–product in the country besides being recycled. The current
production comes from Hindustan Zinc Limited (Chandria smelter) of lead and zinc and also
from Birla Copper of Hindalco as a by–product. A small quantity is also co–produced along with
gold refining by HGML in Karnataka.
With mine production commencing from Sindesar Khurd of Hindustan Zinc Limited and
consequent increase in silver refining capacity, Hindustan Zinc Limited is targeting a production
of 500 tonnes of metal production in the 12th plan period by 2016-17 and similarly, Birla Copper
(Hindalco) also have plans to enhance production of silver metal.

65
The indigenous production of silver from 2006-07 to 2010-11 is given in the exhibit next
Exhibit 4.3: Silver Production (tonnes) in India
Year
Hindustan
Copper
Limited
Birla Copper Hindustan
Zinc Limited
Sterlite
Copper Total
2006-07 1.71 48.46 53.00 - 103.17
2007-08 - 52.94 80.40 - 133.34
2008-09 - 37.31 105.00 - 142.31
2009-10 - 44.86 138.50 - 183.36
2010-11 - 45.06 148.00 - 193.06
2016-17 (Projected) - 150.00 500.00 150 800.00
Source: Indian Bureau of Mines
Demand
Against the current meagre indigenous production (around 200 tonnes) from primary sources,
the demand estimates are for 3,000 tonnes per annum. Thus, demand satisfaction is only 6%
by primary production. The balance demand is met by imports from various countries. This will
continue in future.
Likely Scenario
According to an estimate, the demand for silver is expected to double to 6,000 tonnes annually
mainly because of consumer preference for jewellery and as an investment avenue during next
5 to 10 years. This reflects a big demand–supply gap against 800 tonnes of production as
projected by 2016-17.
As the demand-supply gap is primarily met from imports, India’s reliance on world prices and
fluctuations in international prices will remain.
Issues/Concerns and Way Forward
1. There is a need to develop indigenous expertise for recovering / recycling silver from
large varieties of industrial waste being generated.
2. Encouragement to copper producers to recover gold and silver as by-products from
anode slimes indigenously by providing the necessary fiscal / taxation incentives in terms
of relaxing excise duty provision.

66
Metal 3: PLATINUM GROUP OF ELEMENTS / METALS
The Platinum Group of Elements (PGEs) or Platinum Group of Metals (PGMs) covers Platinum
(Pt), Palladium (Pd), Rhodium (Rh), Iridium (Ir), Osmium (Os) and Ruthenium (Ru) and these
find applications in several important fields including automobile industry, medicine, jewellery,
electrical and electronics sector. About 40% of the world supply of platinum is consumed by the
jewellery sector. Platinum, being more resistant to corrosion, has also got several industrial
applications.
These six elements are classified into two groups with respect to special gravity of gold (19.2).
The elements Ru, Rh and Pd (sp gr 12) are lighter, while the other three (Os, Ir and Pt) are
heavier than gold with special gravity of 21.
Reserve and Resources Position
The largest resource of PGE are located in Bushveld igneous complex of South Africa (87%)
followed by Russia and USA. The total reserve base is estimated at 80,000 tonnes. In India, of
the major part of 15.7 tonnes of resources estimated so far, 14.2 tonnes are located in Nilgiri,
Boula-Nuasahi and Sukinda areas in Odisha and remaining 1.5 tonnes in Hanumalpura in
Shimoga Schist belt of Karnataka. PGEs commercially exploitable grade is 4-10 g/t but in India,
the reserves are of low grade containing less than 2 g/t metal content.
Production
India is not a PGE producing country and no production is reported from mine sources. The
demand is entirely met from imports. As these metals are scarce in their occurrences, their
production is reported from very few countries e.g. South Africa, Zimbabwe, Russia, USA,
Canada and Australia.
Demand
The platinum demand in India is increasingly steadily over the years with rising imports of
around 10 tonnes in 2009-10. The demand is however increasing substantially.
Likely Scenario
In India sustained efforts are in progress to explore the potential of PGEs / PGMs. However it is
unlikely that domestic supply will come up in the near future.
The total demand for PGEs is expected to touch 80 tonnes by 2017 and 120 tonnes by 2025. It
will be entirely met from imports.
67
Issues/Concerns and Way Forward
1. Since the ultramafic rocks of layered complex as well as those of granite-greenstone belts
are the favourable host for PGE mineralization, it becomes necessary to study such areas
in detail including the geo-chemistry for identifying new areas for detailed exploration.
2. Major investment is essential to establish new resource base of PGEs, as only 5% of the
total potential area has been investigated so far. The private sector through junior
exploration companies need to be involved in detailed investigations. The Baula–Nauschi
prospect in Odisha with 14 million tonnes of PGE ores at a cut off of 1 g/t of Platinum &
Palladium must be accorded priority in developing it for commercial exploitation. The
resource identified in Hanumalpura and Sittampundi areas or Karnataka and Tamil Nadu
need to be converted into reserves.
3. The economic viability of PGE deposits largely depends upon the amenability of the ores
for beneficiation keeping in view marginal / low grade nature of resources indentified so
far. Hence there is a need to develop a suitable flow sheet for the PGE bearing ores of
Odisha, Karnataka and Tamil Nadu on priority basis.
4. The expertise for recycling of above ground resources in the country is also lacking.
There is a need to develop expertise for recovery of PGEs from recycled materials such
as catalytic converters, computer hard discs and electronics waste.
5. The level of concentration of PGE in the mineralized zones has to be determined by high
precision technologies such as ICPM with nickel sulphide fire array.
Metal 4: DIAMOND
The first recorded history of diamonds dates back 3000 years to India, where allurial diamonds
were mined from Krishna Gravels (Golconda Region) in Andhra Pradesh. After India, the first
primary source of diamonds was discovered in 1869 at Kimberley in South Africa and the
volcanic rock “Kimberlite” derives its name after Kimberley. Subsequently most world production
came from South Africa exceeding one million carats per annum from 1870 onwards.
India largely depends on imports of rough gem diamonds for its cutting and polishing Industry,
which handles 80% of the global polished diamonds market. There is only one producer in India
and the production is negligible to meet the requirement of cutting and polishing located at
Surat. The cut and polished diamonds are re–exported. The diamond has been the most
valuable among gems and hardest natural substance known so far. The price of gem diamonds
depends upon their rarity, weight, quality, shape and flawlessness whereas industrial varieties
of diamonds are used in grinding, drilling, cutting and as polishing tool. Flawless stones of good

68
colour are considered in gem trade while off colour, flawed and defective stones chips, small
grains and dust are used in industry. In fact, industrial diamonds are produced as by-product of
mines for gem diamonds.
Reserve and Resources Position
Diamond occurrences and potential are reported mainly from four regions in India. There are
1. South India tract of Andhra Pradesh, parts of Anantpur, Cuddapah, Guntur, Krishna,
Mahboobnagar and Kurnool districts
2. Central Indian tract of Madhya Pradesh Panna Belt – Bundelkhand
3. Behradih – Kodawali area in Raipur district and Tokapal, Dugapal etc in Baster,
Chhattisgarh
4. Eastern Indian tract mostly in Odisha between Mahanadi and Godavari Valleys
All India resources of diamonds are placed at 31.92 million carats. Out of these, only one million
carats are reserves and the remaining nearly 31 million carats are resources. By grades, about
2.37% of the resources are of gem variety, 2.63% are of industrial variety and the bulk of
resources (95%) are placed under unclassified category. Madhya Pradesh accounts for 90%
known resources followed by Andhra Pradesh 5.71% and Chhattisgarh 4.08%
The total world reserve base of diamonds is placed at 1,300 million carats, of which reserves
are reported to be at 580 million carats only. The biggest potential is confirmed to Congo,
Botswana, Australia and South Africa. In India, recently a major deposit at Bunder in Madhya
Pradesh was discovered by Rio Tinto, which has added 27 million carats to its resources.
Production
The total world rough diamond production was at 140 million carats in 2010-11 from 23
countries. The African continent contributes 50% of the production. In India, there is only one
mine at Majhgaon in Panna (Madhya Pradesh) of NMDC for a production capacity of 84,000
carats and the total diamonds recovered from this mine so far are around 1 million carats. The
incidence of diamond is 10 carats per 100 tonnes of tuff material. The ratio of gem to off-colour
to industrial diamonds is 28:36:36 (% by weight). Average size of the diamond is 0.50 carat and
large size diamonds are rare but the gem diamonds are of high quality.
Demand
The consumption of diamonds jewellery in India presently is more than US$ 6 billion (Rs 30,000
crores) as against US$ 1 billion five years ago. This accounts for 45% of the global jewellery
consumption. The demand is expected to rise to 10% of the global demand in the near future.
India exported cut and polished diamonds worth US$ 28.26 billion in 2010-11 against rough
diamonds imports of US$ 11.93 billion with a significant value addition of US$ 16.32 billion.

69
Likely Scenario
There are two aspects – one of domestic consumption for diamond jewellery and the other of
the diamond cutting and polishing industry.
India accounts for 45% of the global jewellery consumption and the market has grown six times
in five years. The market is expect to double itself in another five years. Although the potential
exists, but production from India will not be able to meet the demand and we will be import
dependent in future.
As for the diamond cutting and polishing sector, the sector is facing growing competition from
China. Further, African countries are demanding greater share of processing of roughs within
their countries. In view of this, India’s share in value terms may come down to 49% from the
present 60-65% of the world rough diamonds market.
Issues/Concerns and Way Forward
1. The basic customs duty on cut and polished diamonds have been reduced from 15% to
5% and the rough broken pieces are fully exempted from basic duty but the royalty rates
of 10% of sale price on ad valorem basis have been increased to 11.5% and are 7% more
than any other country in the world. This may discourage MNCs which are engaged in
exploration of diamonds for indigenous production.
2. The Reconnaissance Permits (RPs) over almost 1,40,000 sq km area have been granted
for diamond exploration during the last eight years but only few prospecting licenses have
been granted over 900 sq km in Andhra Pradesh and Madhya Pradesh and not a single
mining lease has come into force so far. This reflects unusual delay in grant of mineral
concessions whereas large potential tracts for diamonds in the country remain yet to be
explored in the Bundelkhand area, in the Dharwar Craton, in teh Singhbhum craton and in
the Bastar craton.
3. India has the potential for new discoveries and should aim for 7-8 million carats annual
production by 2020 through private sector investment in exploration provided there are
investor friendly policies.
4. Diamond exploration is very high risk venture and on an average, less than 1% of
kimberlites results into diamond mines. In India, out of 200 odd kimberlites / lamproites
identified so far, only one has resulted into potential diamond mine (Rio Tinto at Bunder in
Madhya Pradesh).
70
5. As there is a need for discovering deep seated diamond deposits in the cratons and
deccan traps area, GSI must emphasize for Magnet-Telluric (MT) surveys allonym with
lithoprobe studies in their regional survey programme across the country on priority basis
in a time bound manner.
6. Laboratory facilities of GSI and also of the diamond industry need to be upgraded to
ascertain praise chemistry of indicator minerals as well as of diamonds.
7. Encouragement to private sector in diamond exploration and mining is necessary keeping
in view of high risk investment. Also, there is need to remove major bottlenecks and
constraints in getting mineral concessions and other clearances, as bulk of resources
(95%) remain yet to be converted into proven reserves by detailed exploration.
Metal 5: PRECIOUS AND SEMI-PRECIOUS STONES
Coloured gemstones may be precious or semi-precious. The stones that qualify as being
precious are Emeralds, Rubies, Sapphires and Corundum.
Other coloured stones are labelled as semi-precious. The main semi-precious stones are
Tanzanite, Topaz and Opal. However, this terminology is changing being replaced by
“gemstone” in common parlance. Coloured gemstones are after mined using picks, chisels and
hammers by small scale minors in contrast to diamond mining by companies of large
mechanized operations.
Precious Stones
1. Emeralds: The wonderful green colour gives it a unique position in the gem kingdom. The
occurrences in India are reported from Rajasthan, Odisha, Tamil Nadu and Andhra
Pradesh. Emeralds bearing zones are found along 195 km long ultra-mafic rocks from
Ajmer to Udaipur but no reserve estimate is done so far.
2. Rubies: It is a variety of corundum (aluminium oxide) with chromium as an impurity. Apart
from being used in jewellery, rubies are used in space research for communication
systems. Major producers are Myanmar, Madagascar, Afghanistan, Pakistan and India.
3. Sapphires: These are available in colours ranging from very pale blue to deep indigo
depending upon the presence of iron and titanium. Key production centres are Myanmar,
Sri Lanka, Thailand and Madagascar, including India.
4. Corundum: Corundum is another precious mineral found in Assam, Meghalaya, Madhya
Pradesh, Maharashtra and Andhra Pradesh in association with Kyanite and sillimanite.
71
There are 2 mines in Maharashtra (Bhandara district) and the production as reported in
2006-07 was 152,170 kilograms but these mines are not in operation now.
Semi-Precious Stones
1. Tanzanite: It is one of the recent finds in semi-precious gemstones segment discovered in
1967. The stone is primarily mined in Tanzania.
2. Topaz: The largest commercial reserves are confined to Ore Preto hills in Brazil for
colourless topaz. The most common colour of topaz is yellow with reddish tint.
3. Opal: Australia account for more than 95% of the world supply. Opals are found in
locations all over the world.
Production
The world production of emeralds was reported at about 5,500 kilograms, the major share being
from Columbia, Brazil and Zambia with 1,500 kilograms each.
The total world production of rubies was reported at 10,000 kilograms in 2005–06. Kenya,
Tanzania and Myanmar were the leading producers followed by Madagascar, Thailand and
Pakistan. India has been the biggest supplier of low–end rubies. Andhra Pradesh, Bihar and
Tamil Nadu produce facet grade rubies while Karnataka produces gem quality rubies.
The world production of sapphires was reported to be around 26,000 kilograms in 2005. The
major share was from Australia, Madagascar, Kenya, China, Myanmar, Sri Lanka, Tanzania,
Thailand and Nepal. The production from India is not reported but Kashmir sapphires are
considered to be of very high value.
Tanzanite is mined mainly in Tanzania at a production level of 3,500–4,000 kilograms per
annum in the form of crystals. Topaz is mainly mined and produced in Brazil while Opal is
primarily mined and produced in Australia.
Demand
The cutting and polishing of precious and semi-precious stones has been mainly performed in
the traditional low cost centres located at Thailand, India and Sri Lanka. Thailand supplies
around 80% of the cut rubies and sapphires in the world, however, with rising labour costs in
Thailand, China is also emerging as a major cutting centre for coloured gemstones. In India,
Jaipur is the world’s largest and most diversified centre for coloured gemstones.

72
India imported US$ 146 million worth of coloured gemstones and exported US$ 315 million
worth of cut stones in 2010-11. The industry is getting more organized now with the mining
centres increasingly setting up their own processing units in-house e.g. Zambia and Tanzania.
Likely Scenario
Though India is a major trading centre for coloured gemstones but by-and-large, small traders
are involved in collection of gemstones from different parts of the country. The whole industry is
in unorganized sector.
Although there has been a steady demand for both precious and semi-precious stones in India,
data is not readily available on production or sales. Moreover, with no proper assessment of the
resources potential for precious and semi–precious stones it is difficult to draw up a likely
scenario. Nevertheless it must be mentioned that most of the requirements are met after value
addition to the imported stones.
Exhibit 4.4: India’ Export and Import of Coloured Gemstones (Value in US$ Million)
Year Export Import
1981-82 41 19
1991-92 104 46
2004-05 193 83
2005-06 234 115
2006-07 247 132
2007-08 276 147
2008-09 261 106
2009-10 287 117
2010-11 315 146
Source: Gems and Jewellery Export Promotion Council
Issues/Concerns and Way Forward
1. There is no proper assessment of resources and potential of precious / semi–precious
minerals and the reporting of production, if any is not done or available.
2. The current mining operations must be legalized through an appropriate licensing
framework and the new mining areas need to be explored in the potential regions. A proper
assessment of resources is also called for.
3. Favourable trade regimes and agreements need to be negotiated with the countries e.g.
(Brazil, Mexico and China), which currently impose high tariffs on imports from India.

73
Industrial / Non-Metallic Minerals
India presently produces a total of 47 non-metallic minerals. These are buy-and-large
characterized as “low value and high volume minerals” and are basic inputs for a number of
industries like fertilizers, glass & ceramics, refractory, asbestos-cement and chemical products.
The overall value of these industrial minerals during 2009-10 was about Rs 1,399 crores. In
India, this sector largely consists of small mines owned by individuals or private firms. However,
the number of mines of non-metallic minerals reporting for production has shown a declining
trend over 2008-09 to 2010-11, decreasing from 1,857 mines in 2008-09 to 1,725 mines in
20090-10 to 1,446 mines in 2010-11. However the number of mines reporting production for
non-metallic minerals increased to 2,030 in 2011-12.
The resource base of industrial / non-metallic minerals in India is adequate except for Rock
Phosphate, Magnesite and Ball Clay, for which the estimates show decreasing reserves. In fact,
country is deficient in fertilizer minerals and heavily depends upon imports. Based on the
industry these minerals find use in, they are grouped under four categories
A. Fertilizer Minerals
1. Rock Phosphate
2. Potash
3. Sulphur and Pyrites
B. Flux and Construction Minerals
4. Asbestos
5. Dolomite
6. Fluorspar
7. Gypsum
8. Wollastonite
9. Non-cement grade limestone
C. Ceramics and Refractory Minerals
10. Quartz and other silica minerals
11. Fireclay
12. China clay and Ball clay
13. Magnesite
14. Graphite
15. Pyrophyllite
16. Kyanite
17. Sillimanite
18. Vermiculite
19. Non-metallurgical bauxite
D. Export Potential Minerals
20. Barytes
21. Bentonite
22. Fuller’s Earth
23. Mica
24. Talc, Soapstone and Steatite
The salient features like resources, production and demand of these minerals along with their
export, import and apparent consumption etc at projected growth rate of 8% are summarized in
the exhibits given next

74
Exhibit 5.1: Resources, Production and Demand of Industrial Minerals during XI and XII Plans (Million Tonnes or otherwise specified)
Sl
No Mineral
World Reserves
Indian Resources
India
Recommendations of XII Plan working Group Present Production (2010-11)
Estimated Demand
2011-12 2016-17
1 Rock
Phosphate 65,000 296 1.65 8,434 12.393
1. Open for private sector 2. Cluster mining 3. Technology for extraction of low grade ores may be adopted 4. Further exploration is needed in various parts of the country
2 Potash 9,500 21,815 - - - 1. Open for private sector 2. Glauconitic sand stone as substitute 3. State governments for further development
3 Sulphur and
Pyrites Large 1,674 0.263 1.896 2.787
1. Deposits may be re-opened for private sector 2. Incentives for refinery and petro-chemicals
4
Asbestos
(‘000
Tonnes)
200,000 21,740 0.233 386 567 1. Lift ban on asbestos mining with stringent constraints to present
asbestos
5 Dolomite Large 8,000 5.200 6.030 8.870 1. Exploration for low silica 2. Involvement of state DGM
6 Fluospar 23 18 0.014 0.182 0.267 1. Sector wise consumption 2. Need for beneficiation 3. Exploration and re-assessment of reserves
7 Gypsum Large 1,286 3.423 5.554 8.167 1. State-of-the-art technology to be adopted for the exploitation of
deep-seated gypsum deposits
8 Wollastonite NA 16.57 0.132 0.130 0.191 1. Further exploration in Tamil Nadu and Gujarat
9 Quartz and Silica sand
Large 3,499 3.54 3.090 4.540 1. Environmental constraints may be cleared for mining in Haryana

75
10 Fireclay Large 714 0.57 0.471 0.692 1. Attention for quality improvement
11 Kaolin Large 2,705 2.52 2.939 4.319 1. Attention for quality improvement
12 Ball Clay Large 79.290 0.898 1.162 1.708 1. Attention for quality improvement
13 Magnesite 2,400 335 0.23 0.397 0.583 1. Discourage imports
14 Graphite 71 175 0.115 0.133 0.195 1. Incentives for beneficiation of low grade
15 Pyrophyllite Large 269 0.234 0.282 0.415 1. More exploration
16 Kyanite (‘000 Tonnes)
Large 103,000 5 6 9 1. Detailed exploration for grade analysis
17 Sillimanite (‘000 Tonnes)
Large 67,000 47 37 54 1. Exports may be encouraged
18 Vermiculite (‘000 Tonnes)
- 2,500 22 14 21 1. Exports may be encouraged
19 Barytes 240 73 2.33 1.330 1.960 1. Exploration required
20 Bentonite Large 568 NA NA NA 1. Exports may be encouraged
21 Fullers Earth Large 256 Na NA NA 1. Exports may be encouraged
22 Mica (‘000 Tonnes)
Very Large
532 1.2 NA NA 1. Process know-how for extraction of lithium and rubidium 2. To establish wet ground mica plants
23 Talc / Steatite
Large 169 0.896 0.863 1.270 1. Exports may be increased
Source: Ministry of Mines, Government of India

76
Exhibit 5.2: Production, Import, Export and Apparent Consumption of Industrial Minerals (unit: “000 tonnes unless otherwise specified)
Mineral 2005-06 2006-07 2007-08 2008-09 2009-10 2010-11 2011-12
A. Fertilizer Minerals
Apatite and Rock Phosphate
Production 2,058 1,596 1,859 1,810 1,552 2,101 2,330
Import 4,478 5,009 5,018 5,010 5,684 5,194 -
Export 1 1 3 5 5 0.711 -
Consumption 6,535 6,604 6,874 6,815 7,231 3,676 -
Potash
Production - - - - - - -
Import 3,711 3,039 3,719 5,063 5,063 - -
Export 10 13 27 41 41 - -
Consumption - - - - - 1,885 -
Sulphur and Pyrite
Production 152 204 227 270 263 237 381
Import 1,390 1,402 1,406 1,286 1,534 1,357 -
Export 5 137 4 171 171 167 -
Consumption 1,537 1,469 1,629 1,385 1,626 1,670 -
B. Flux and Construction Minerals
Asbestos (Tonnes)
Production 2,323 390 269 315 233 268 280
Import 236,492 253,382 311,705 346,658 331,415 365,795 -
Export 289 525 3,942 918 918 252 -
Consumption 238,526 253,247 308,032 346,055 330,730 103,300 -

77
Dolomite
Production 4,751 5,172 5,852 5,504 5,182 5,840 5,417
Import 3 53 8 10 10 612 -
Export 13 12 15 19 19 23 -
Consumption 4,741 5,213 5,845 5,495 5,173 5,942 -
Fluospar (Tonnes)
Production 3,764 0 3,794 6,814 8,486 5,995 4,856
Import 105,952 131,000 162,110 153,749 147,138 161,925 -
Export 2,626 1,111 467 203 203 345 -
Consumption 107,090 129,889 165,437 160,360 155,271 69,400 -
Gypsum
Production 3,291 3,006 3,400 3,877 3,422 4,918 3,189
Import 76 422 582 891 1,549 1,698 -
Export 88 116 121 209 209 100 -
Consumption 3,279 3,312 3,861 4,559 4,762 7,145 -
Wollastonite (Tonnes)
Production 128,582 131,572 118,666 111,581 132,385 183,381 184,445
Import 29 97 153 223 223 2,600 -
Export 18,466 17,760 23,643 21,413 21,413 20,151 -
Consumption 110,145 113,909 95,176 90,391 111195 3,300 -
C. Ceramic and Refractory Minerals
Quartz and Other Silica Minerals
Production 2,781 3,060 4,715 3,361 2,898 3,879 4,855
Import 4 7 13 11 11 94 -

78
Export 186 255 249 202 256 178 -
Consumption 2,599 2,812 4,479 3,170 2,653 1,453 -
Fireclay
Production 536 497 545 496 410 857 760
Import - - - - - 0.689 -
Export 3 4 8 6 6 9 -
Consumption 533 493 537 490 404 518 -
Ball clay
Production 407 627 796 998 898 1,087 1,595
Import 111 77 166 122 122 127 -
Export 4 11 12 23 23 19 -
Consumption 514 693 950 1,097 997 596 -
China clay (Kaolin)
Production 1,336 1,460 1,466 2,084 2,578 2,728 2,734
Import 41 30 44 62 62 53 -
Export 65 70 59 120 120 110 -
Consumption 1,312 1,420 1,451 2,026 2,520 1,477 -
Magnesite
Production 341 239 253 253 286 - -
Import 84 92 76 51 66 55 -
Export 7 13 9 12 12 23 -
Consumption 418 318 320 292 340 241 -
Graphite
Production 126 162 171 118 109 116 149

79
Import 8 10 12 7 7 14 -
Export 2 2 1 2 2 1 -
Consumption 13 17 15 14 14 15 -
Pyrophyllite
Production 183 148 204 256 242 240 240
Import NA NA NA NA NA NA -
Export NA NA NA NA NA NA -
Consumption 183 1 2 7 7 8 -
Kyanite (Tonnes)
Production 8,869 8,059 5,102 4,620 5,553 5,954 4,064
Import 435 54 210 200 200 504 -
Export 91 - 2,471 219 219 208 -
Consumption 9,213 8,113 2,841 4,601 5,534 4,500 -
Sillimanite (Tonnes)
Production 33,119 26,366 40,537 33,702 30,690 48,784 58,043
Import 104 35 37 2,745 2,745 1,363 -
Export 1,891 328 1,445 2,013 2,013 2,325 -
Consumption 31,332 26,073 39,129 13700 14400 15,300 -
Vermiculite (Tonnes)
Production 6,674 11,827 8,910 12,647 12,847 19,234 9,746
Import 182 106 34 305 305 312 -
Export 1,353 2,351 1,005 1,118 1,118 1,449 -
Consumption 5,503 9,582 7,939 800 800 800 -
D. Export Potential Minerals

80
Barytes
Production 1,156 1,681 1,076 1,686 2,138 2,339 1,723
Import - 3 1 2 2 3 -
Export 555 630 565 844 999 816 -
Consumption 601 1,054 512 141 201 192 -
Bentonite
Production NA NA NA NA NA NA NA
Import 2 5 8 5 5 2.3 -
Export 465 480 463 567 457 629 -
Fuller’s Earth (Tonnes)
Production NA NA NA NA NA NA NA
Import 2,946 2,696 NA NA NA NA -
Export 82,351 39,592 84,015 NA NA NA -
Consumption - - - - 5,600 5,600 5,600
Mica (crude) (Tonnes)
Production 2,116 1,411 4,578 1,462 1,213 1,807 1,807
Import 1,135 1,579 2,645 2,323 2,323 409 -
Export 80,173 80,795 99,888 191,037 94,216 124,796 -
Talc / Steatite
Production 682 740 923 888 835 903 959
Import 1 1 1 5 5 10 -
Export 47 113 154 100 100 113 -
Consumption 636 628 770 793 740 381 -
Source: Ministry of Mines, Government of India

81
Exhibit 5.3: Production and Value of Industrial Minerals during 2008-09 & 2010-11 (Quantity in ’000 tonnes and Value in Rs Crores)
Mineral 2008-09 2009-10 2010-11 2011-12
Quantity Value Quantity Value Quantity Value Quantity Value
Apatite 6.42 1.30 5.40 1.04 3.8 0.83 3.0 0.64
Phosphorite 1,804 308.76 1,547 312.01 2,097 501 2,327 643
Asbestos 0.32 1.45 0.23 1.14 0.268 1.3 0.3 1.2
Ball clay 998 20.08 898 18.88 1,087 39.0 1,595 63.6
Barites 1,686 96.64 2,138 234.97 2,339 269.8 1,723 165.2
Bauxite (non-
metallurgical
grade)
3,660 111.34 3,303 100.40 NA - NA -
Bentonite NA 12.84 NA 12.84 NA NA NA NA
Dolomite 5,504 155.41 5,182 144.79 5,840 187.0 5,417 152.1
Fireclay 496 8.34 410 6.62 857 13.7 760 13.0
Fluorite
(graded) 3.18 1.56 5.00 2.18 60 5.0 5 1.1
Fluorite
(concentrate) 6.81 8.87 8.79 12.64 - - - -
Fuller’s Earth NA 9.47 NA 9.47 NA - NA -
Grpahite 118 4.66 109 4.42 116 5.0 149 6.6
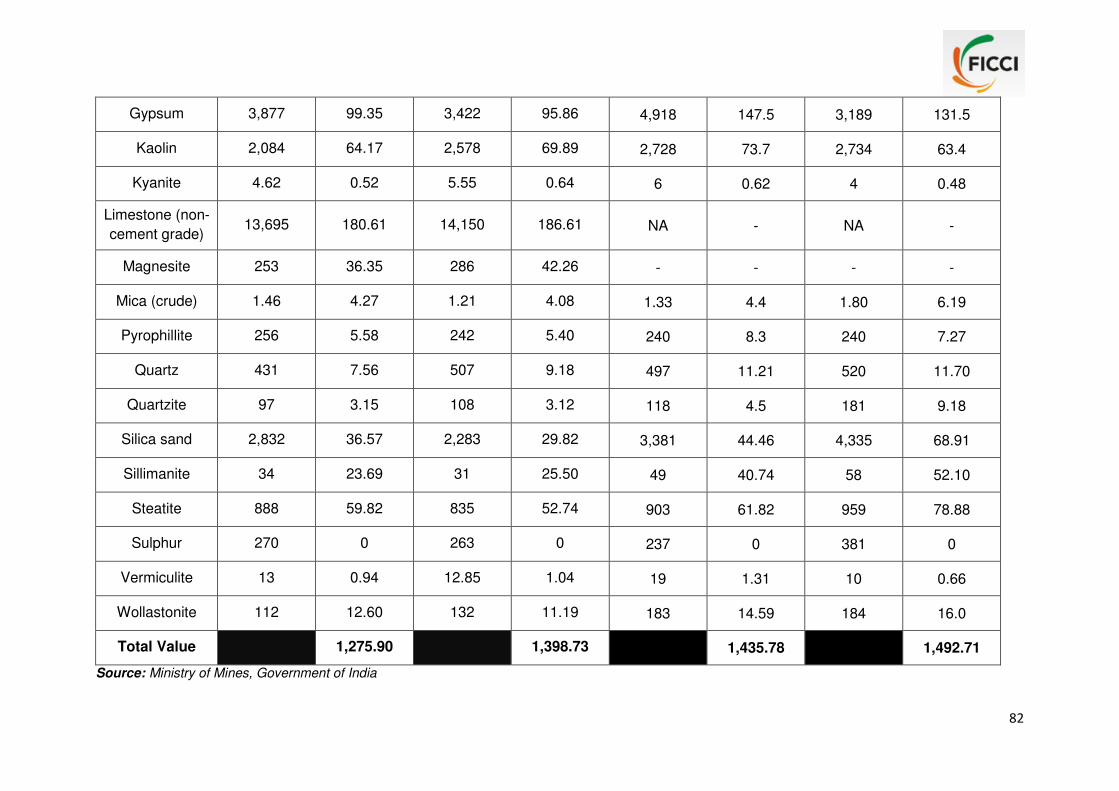
82
Gypsum 3,877 99.35 3,422 95.86 4,918 147.5 3,189 131.5
Kaolin 2,084 64.17 2,578 69.89 2,728 73.7 2,734 63.4
Kyanite 4.62 0.52 5.55 0.64 6 0.62 4 0.48
Limestone (non-
cement grade) 13,695 180.61 14,150 186.61 NA - NA -
Magnesite 253 36.35 286 42.26 - - - -
Mica (crude) 1.46 4.27 1.21 4.08 1.33 4.4 1.80 6.19
Pyrophillite 256 5.58 242 5.40 240 8.3 240 7.27
Quartz 431 7.56 507 9.18 497 11.21 520 11.70
Quartzite 97 3.15 108 3.12 118 4.5 181 9.18
Silica sand 2,832 36.57 2,283 29.82 3,381 44.46 4,335 68.91
Sillimanite 34 23.69 31 25.50 49 40.74 58 52.10
Steatite 888 59.82 835 52.74 903 61.82 959 78.88
Sulphur 270 0 263 0 237 0 381 0
Vermiculite 13 0.94 12.85 1.04 19 1.31 10 0.66
Wollastonite 112 12.60 132 11.19 183 14.59 184 16.0
Total Value 1,275.90 1,398.73 1,435.78 1,492.71
Source: Ministry of Mines, Government of India

83
The mineral-wise briefs are as follows:
Mineral 1: ROCK PHOSPHATE
Rock phosphate or phosphorite is mainly fossilyferrous calcareous sandstone with reddish-
brown colour. The world reserves of rock phosphate stands at 65,000 million tonnes, of which
50,000 million tonnes confine to Morocco and Western Sahara, 3,700 million tonnes in China,
2,200 million tonnes in Algeria, 1,800 million tonnes in Syria and 1,500 million tonnes each in
Jordan and South Africa.
The world production was at 176 million tonnes in 2010 with China being the leading producer
at 65 million tonnes production.
The total resource of rock phosphate in India was estimated at 296 million tonnes, of which 35
million tonnes are the reserves and 261 million tonnes are resources. Jharkhand has 36% of
the total resources followed by 30% in Rajasthan and 17% in Madhya Pradesh.
The grade wise resources contain 39% low grade followed by 29% beneficiable grade, 12% soil
reclamation grade, 9% blendable grade, 6% chemical fertilizer grade and 5% as of unclassified
grade.
India’s production was a meagre 1.65 million tonnes in 2010-11 which increased by 41% to 2.33
million tonnes in 2011-12, because of more lifting of ore dumps by RSMML. As such, the
country will continue to rely on imports to meet its demand. There are only seven reporting
mines. The principal producer is Rajasthan (RSMML) followed by Madhya Pradesh (MPSMC).
Out of the total production, 49% is of 30-35% P2O5 grade, 44% is of 15-20% P2O5 grade, 6% is
of 25-30% P2O5 grade and 1% is of 20-25% P2O5 grade.
The consumption of rock phosphate including that of apatite as reported in 20101-11 was at
3.68 million tonnes as against 3.15 million tonnes in 2009-10. The share of fertilizers in total
consumption is about 77% whereas chemical industry’s share is at 23%. There are 56 large
size fertilizer units in the country manufacturing a wide range of nitrogenous, phosphatic and
complex fertilizers. India is the third largest producer in the world and the overall consumption of
fertilizers in terms of nutrients (N, P and K) is around 168 lakh tonnes per annum. The
indigenous raw materials are available mainly for nitrogenous fertilizers in the country.
In case of phosphate fertilizers, the indigenous rock phosphate supply meets only 5-10% of the
total requirement of P2O5 whereas the entire demand of potasic fertilizers is met through
imports. The installed capacity of phosphatic and nitrogenous fertilizers as on April 1, 2009 is
shown in the next exhibit.

84
Exhibit 5.5: Capacity & Production of Nitrogenous & Phosphatic Fertilizers (’000 Tonnes)
Sector / Nutrient Capacity as on 31.03.2009 Production
2007-08 2008-09
Nitrogen (N) 12,061 10,900 10,870
Public Sector 3,498 2,887 2,925
Co-operative Sector 3,169 3,031 3,133
Private sector 5,394 4,982 4,812
Phosphates (P) 5,659 3,807 3,464
Public Sector 433 161 192
Co-operative Sector 1,713 969 916
Private sector 3,513 2,677 2,356
Source: Annual Report, 2009-10, Ministry of Chemicals and Fertilizers, Government of India
Exports of rock phosphate to Malaysia, Kenya, Nepal, Germany and Bangladesh are at about
5,000-5,500 tonnes whereas imports remain at 5 million tonnes mainly from Jordan and
Morocco.
The reserves of chemical and fertilizer grades apatite and rock phosphate in India are very
limited and till the domestic resources are improved, the country has no alternative but to
depend upon the imports. On the other hand, as the demand of phosphatic fertilizer will
continue to rise due to growth in population and increase in food requirements, there is no
substitute for phosphorus in agriculture.
Mineral 2: POTASH
Potash is an essential nutrient for protein synthesis and it aids plants to use water more
efficiently. The world reserves stand at 9,500,000 thousand tonnes of K2O, of which largest
potential is in Canada, Russia, Germany, USA and Belarus. The total production of Potash in
the world was at 33 million tonnes of K2O content in 2010. About 93% of the production is
consumed by the fertilizer industry.
In India, bedded marine evaporate deposits are the principal sources of potash. The ore is
sylvinite, a mixture of KCL and NaCl. The total resources of potash are estimated at 21,815
million tonnes in the country but remain yet to be exploited. Rajasthan alone contributes 94%
resources followed by Madhya Pradesh (5%) and Uttar Pradesh, a negligible quantity. Reported
consumption of potash in 2009-10 was around 9 lakh tonnes by the fertilizer industry. The
government envisages a comprehensive programme for increasing consumption of potash in
India to achieve N:K ratio of 4:1 in long-run and 6:1 soon. Presently, there is no production of
potash in the country mainly because of lack of exploration in depth and high costs.

85
Mineral 3: SULPHUR AND PYRITES
World resources of elemental sulphur in evaporates and volcanic deposits and of sulphur
associated with natural gas and petroleum amount to 5 billion tonnes and the production of
sulphur and pyrites in 2010 was 68 million tonnes and 53 million tonnes respectively. USA,
Canada, Russia, China, Japan and Germany are the leading producers of sulphur whereas
China, Finland, Turkey, Russia and South Africa are the principal producers of pyrite.
In India, there are no mineable elemental sulphur reserves. Pyrites were used as a substitute
for sulphur in manufacture of sulphuric acid by PPCL but the operations were discontinued in
2003 for production of pyrite. The by-product recovery of sulphur is limited from petroleum
refineries as well as from sulphuric acid obtained from non-ferrous metal plants.
The total resources of pyrite in the country as on April 1, 2010 were placed at 1,674 million
tonnes, of which only 27 million tonnes are the proven reserves. The major resources are
located in Bihar (low grade) to the tune of 1,553 million tonnes. The total production of sulphur
recovered as by-product from fertilizer plants and oil refineries was at 263,000 tonnes in 2009-
10, whereas the total consumption of elemental by-product sulphur in 2008-09 was 1.72 million
tonnes. The apparent consumption of sulphur and pyrites is estimated at 2.97 million tonnes by
2016-17. The country however will continue to rely on imports to meet its domestic demand.
Mineral 4: ASBESTOS
Asbestos is a group of fibrous minerals and is classified into Chrysotile Asbestos and
Amphibole Asbestos based on mineralogy. The world has 200 million tonnes of identified
resources and Russia, China, Brazil, Kazakistan, Canada and Zimbabwe are the important
producers of chrysotile asbestos. India’s production is around 233 tonnes only in 2009-10,
which decreased further due to closure of mines.
The total resource of asbestos in the country is estimated at 22 million tonnes, of which 6 million
tonnes are the reserves and 16 million tonnes remaining resources. Rajasthan accounts for
61% and Karnataka 38% of the total resources. The entire production reported is of chrysotile
variety from four mines in Andhra Pradesh. The internal consumption of asbestos was about
109,000 tonnes per annum mostly in asbestos cement and other products manufacturing in
2008-09. The apparent consumption of asbestos in 2009-10 was 331,000 tonnes. There are
restrictions on mining of asbestos in India on account of lung diseases. As a result demand has
started falling and the demand estimate is that by 2016-17 demand will come down to roughly
500-600 thousand tonnes.
86
Mineral 5: DOLOMITE
The world resources of dolomite are quite large. In India, dolomite occurrences are also wide
spread in almost all parts of the country. The total resources of all grades are placed at around
8,000 million tonnes, of which reserves are to the order of about 738 million tonnes. The
production of dolomite was at 5.2 million tonnes in 2009-10, a decrease of 6% over the previous
year. The share of six mines in public sector has been 40% and Chhattisgarh is the leading
producing state with 30% share, followed by Andhra Pradesh and Odisha. The production in
2011-12 was reported at 5.41 million tonnes, a decrease of 7% over the previous year from 165
reporting mines.
The iron and steel industry is the biggest consumer of dolomite. The apparent domestic
demand presently is for 6 million tonnes and around 9 million tonnes by 2016-17. The resources
of refractory grade dolomite in the country are meagre and this type of material is in short
supply for making tar-bonded dolomite bricks. The exploration of low silica dolomite deposits is
therefore necessary to build-up additional reserves in the country.
Mineral 6: FLUOSPAR
Fluospar is an indispensable flux material to aluminium metallurgy and has a variety of
applications. There are two primary grade of fluorspar i.e. metallurgical grade containing <97%
CaF2 and acid grade material containing >97% CaF2. The world resources of fluorspar are
estimated at around 230 million tonnes and the production was at 5.4 million tonnes in 2010
with largest contribution by Mexico (1 million tonnes) followed by Mongolia, Russia and South
Africa.
The total resources of fluorspar in India are estimated at 18 million tonnes, of which 4.7 million
tonnes are the reserves. By states, Gujarat and Rajasthan account for 69% and 26% of the
resources respectively. The total production of fluorite (graded) and fluorite concentrates is
reported at 13,782 tonnes in 2009-10. In addition, by-product fluorosiliac acid obtained from
phosphoric acid plants in processing rock phosphate also supplements fluorspar as a source of
fluorine. The average total consumption of fluorspar by all industries has been around 72,000
tonnes per annum, whereas apparent demand is estimated at 2 lakh tonnes by 2016-17.
The resources of fluorspar in India are limited and grades produced do not meet the
specification of the chemical industry which is the bulk consumer of fluorspar. GMDC mine in
Gujarat is the only source of acid grade fluorspar but has high phosphorous content. Hence, to
meet the requirements of domestic chemical industry, the country will have to depend both
qualitatively and quantitatively for imports of fluorspar in the coming years. However, there is a
need for setting-up of beneficiation facilities to utilize low grade resources as well as exploration
in potential areas to build-up additional reserves.
87
Mineral 7: GYPSUM
It is (CaSo42H2O), a hydrated calcium sulphate which is used widely in industry like port land
cement, paper, paints and textile goods. The world resources of gypsum are quite large. In
India, the total resources are estimated at 1,286 million tonnes, of which 39 million tonnes are
the reserves and the remaining 1,168 million tonnes as resources. The production of gypsum in
2009-10 was 3.42 million tonnes by 24 reporting mines in the country. RSMML and FCI were
the two major principal producers in the state of Rajasthan contributing 99% of the production.
The production in 2011-12 was at 3.19 million tonnes, a decrease of 3.5% over the previous
year.
The consumption of gypsum (6.85 million tonnes) is just the double of the production because
of by-product gypsum also added to the consumption. The apparent domestic demand of
gypsum is estimated at about 8 million tonnes by 2016-17. India’s position is comfortable as
regards to the resources of gypsum but there is a need to encourage value addition in making
wall boards and other products.
Mineral 8: WOLLASTONITE
The wollastonite is CaSiO3 and contains 48% CaO and 52% SiO2. Its main use is in ceramic
industry as filler. The world production is reported at 0.54 million tonnes in 2010, with China and
India being the main producers. The major deposits in India are in Rajasthan (Sirohi district)
and in Gujarat. The total resources are placed at 16.57 million tonnes, of which 14.58 million
tonnes are in Rajasthan with two reporting mines.
The total production was at 0.132 million tonnes, which satisfies the demand of wollastonite in
the country, but the demand estimate is for 0.2 million tonnes by 2016-17. Moreover, there is an
increasing demand for wollastonite in the international market, there is a scope for increase in
exports of wollastonite from India in value added form of powder, while considering competition
from China and USA.
Mineral 9: NON-CEMENT GRADE LIMESTONE
The principal uses of limestone other than in manufacture of cement is in aluminium, alloy steel,
chemical, fertilizer, ferro-alloys, foundry, glass, iron and steel, metallurgy, paper and sugar.
According to our estimates, about 40% of total limestone resources i.e. 71 million tonnes are of
non-cement grade. The production of such limestone is reported at 15 million tonnes presently.
Madhya Pradesh, Gujarat and Rajasthan were the leading states in the production of non-
cement grade limestone with shares of 39%, 34% and 15% respectively. The estimated

88
production may go up to 25 million tonnes by 2016-17, whereas apparent consumption is
estimated to touch 28 million tonnes by 2016-17.
India has large resources of limestone distributed over different parts of the country but SMS,
BF and chemical grades limestone occur in selective areas only. However, with the increase in
steel production, the demand for such types of limestone may increase and it is therefore
desirable to locate new deposits of SMS and BF grades limestone.
Mineral 10: QUARTZ AND OTHER SILICA MINERALS
Quartz, silica sand, moulding sand and quartzite are different forms of silica minerals and differ
from each other only in their physical characteristics. This group of minerals constitute the
largest volume of all the minerals and are used in several industries like glass, foundry, ferro–
alloys, iron and steel, cement, refractory and ceramics and sodium silicate. Sand and gravel
resources in the world are large. However, because of their geographical distribution,
environmental restrictions and quality requirements, extraction of these resources become
sometimes uneconomical. Quartz rich sand and sandstone, the main source of industrial silica
sand occur throughout the world. The total world production of sand and gravel (industrial) was
108 million tonnes in 2010 with major producing countries being USA, Italy and Germany.
In India, the total resources of quartz and silica sand are estimated at 3,499 million tonnes, of
which only 12% i.e. 429 million tonnes are placed under reserves category. Resources by
grades reflect foundry and moulding grade (19%), glass grade (14%), ceramic & pottery grade
(11%) and ferro-silicon grade (5%). The other unclassified grades account for 51% of the
resources. The total resources of quartzite are estimated at 1,251 million tonnes, of which
reserves are about 87 million tonnes. Bulk resources (50%) of quartzite are reported in
Haryana, followed by Bihar, Maharashtra and Jharkhand.
The production of quartz was 0.46 million tonnes in 2010-11. There were 87 reporting mines in
2010-11 as against 92 in 2009-10. Andhra Pradesh is the leading producer of quartz in the
country followed by Rajasthan.
The production of silica sand in 2010-11 was at 3.08 million tonnes and in 2011-12 at 4.34
million tonnes with an increase of 28% over the previous year. Gujarat was the leading
producer of silica sand. There were 132 reporting mines as against 122 in previous year.
However, the demand and production of silica sand and quartzite have increased by 10% per
annum.
The consumption of quartz and silica sand in 2010-11 was 1.45 million tonnes, whereas
consumption of quartzite was 0.273 million tonnes. The domestic demand of quartz and silica
minerals is estimated at about 4.5 million tonnes by 2016-17. As the requirements of these

89
minerals are linked directly with the iron and steel industry, the demand for silica mineral is
expected to increase further. However, keeping in view large resources, there are good
prospects for export to neighbouring countries too.
Mineral 11: FIRECLAY
Fireclay is one of the most important minerals used in the refractory industry and India
possesses substantial reserves of fireclay. The best deposits occur in association with the coal
seams of Gondwana fields. The total resources are estimated at 714 million tonnes, of these 30
million tonnes are grouped under reserves category. Though, there is no problem in supply of
fireclay to refractory industry but a serious dearth is felt in the industry with respect to the
availability of high grade clay analysing 37% and above Al2O3 and less than 2% Fe2O3 and
fluxing impurities.
The production of fireclay at around 0.57 million tonnes in 2010-11and 0.76 million tonnes in
2011-12 has met the demand of refractory industry. The cement industry was the major
consumer (47%) followed by refractory and ceramic industry. The apparent demand of fireclay
in estimated at about 0.70 million tonnes by 2016-17 in the county. The export of fireclay shows
a decreasing trend mainly to Kuwait, Bangladesh and Nepal whereas imports increased to 689
tonnes in 2010-11 from 43 tonnes in 2009–10 from Thailand and China. The use of fireclay in
refractory bricks as an export commodity therefore needs to be encouraged.
Mineral 12: KAOLIN (CHINACLAY) AND BALL CLAY
The clays are essential raw materials for ceramic products and refractory. The ball clay is high
plastic variety of china clay with more binding power and shrinkage. The total resources of
china clay in India have been estimated at 2,705 million tonnes, of which, the reserves
constitute only 7% (177 million tonnes). The resources are spread over in a number of states
like Gujarat (23%), Kerala (25%), West Bengal (16%), Rajasthan (16%), Odisha (10%) and
Karnataka (10%).
The production of kaolin in 2011-12 was 2.73 million tonnes, decreasing by 11% over the
previous year due to temporary discontinuance in some of the mines. About 50% of the
production is reported from Gujarat. The consumption was at 1.47 million tonnes, the cement
industry accounting for 45% and ceramics for 42% of the total.
The production of ball clay was at about 0.90 million tonnes in 2011-12, Rajasthan being the
leading producer followed by Andhra Pradesh. The total resources of ball clay is estimated at
80 million tonnes in the country.

90
The consumption of ball clay shows increasing trend (0.56 million tonnes) in 2009-10 mostly by
ceramic industry. The exports of ball clay (23,228 tonnes) in 2009-10 indicate an increase over
the previous year whereas imports showed a declining trend for ball clay variety.
The apparent demand for china clay is estimated at 4.50 million tonnes by 2016-17 and for ball
clay at 1.80 million tonnes by 2016-17.
The resources of kaolin in India are abundant and there are prospects to increase the exports
particularly to potential markets like Egypt, Zimbabwe, Iran and neighbouring countries.
However, hi-tech processing techniques would be necessary for generation of processed china
clay with improved quality along with augmenting the existing capacities.
Mineral 13: MAGNESITE
Magnesite (MgCo3) is a very important mineral in the manufacture of basic refractory largely
used in the steel industry. The world resources are at 2,400 million tonnes and the level of
production is at 25 million tonnes per annum with China being the principal producer. The total
resources of magnesite in India are placed at 335 million tonnes, of which 42 million tonnes are
the reserves and rest are in the resources category. The potentials confine to Uttaranchal,
Tamil Nadu and Rajasthan. The production in India was at 0.23 million tonnes in 2010-11 and
0.22 million tonnes in 2011-12. Production has been showing a declining trend over the
previous years. There were 8 reporting mines as against 16 in 209-10 and the leading
producing state is Tamil Nadu followed by Uttaranchal.
The consumption of magnesite in organized sector is around 0.28 million tonnes, with higher
consumption by refractory industry. The apparent demand estimates are for 0.60 million tonnes
by 2016-17 and the exports and imports also indicate an increasing trend.
India has substantial resources of magnesite but because of cheap imports, the domestic
reserves are not being mined optimally. There is therefore a need to reduce imports of
magnesite and encourage exploitation of domestic resources by means of increasing the
imports duty.
Mineral 14: GRAPHITE
Graphite is used as a raw material in large number of industries such as crucible, foundry
facing, dry cell battery, lubricants, pencils and paints etc. It is found in two commercial varieties
(i) crystalline and (ii) amorphous graphite. Both flaky and amorphous varieties are produced in
the country whereas synthetic graphite is manufactured on a large scale in electric furnaces.
91
The world reserves stand to the order of 71 million tonnes, with the largest reserves being in
China and Mexico.
The total resources in India are placed at 175 million tonnes, of which 8 million tonnes only are
in reserves category. The resource containing +40% fixed carbon content constitute about 1.1
million tonnes and of 10-40% fixed carbon content of 23 million tonnes. The rest are of low
grade in unclassified category. The deposits of economic importance are located in Andhra
Pradesh, Jharkhand, Karnataka, Kerala, Odisha, Rajasthan and Tamil Nadu.
The production of graphite in 2010-11 was 115,000 tonnes by 20 reporting mines as against 32
mines in previous year due to lesser demand and temporary closure of mines. Tamil Nadu was
in the leading position with 46% of the total production followed by Jharkhand and Odisha. The
consumption of various grades of graphite in organized sector was in the range of 14,000 to
15,000 tonnes during the last five years with refractory and crucible industries accounting for
45% and 30% of consumption respectively. The domestic demand is estimated at 200,000
tonnes by 2016-17. The exports show an increasing trend while imports of graphite crucibles
also increasing.
The graphite reserves having +40% fixed carbon are limited in the country and the cost
effective beneficiation technologies for low grade graphite ore (+10%carbon) need to be
developed. Due emphasis is also required for additional reserve build-up and incentives for
beneficiation of low grade ores.
Mineral 15: PYROPHYLLITE
It is different in composition from steatite but both are similar in their physical properties and are
used for the same purpose. The pyrophyllite is somewhat harder than steatite and does not flux
when heated. The world resources are quite large and total production is around 169 million
tonnes. Korea, Japan and India are the main producers.
In India, the total resources of pyrophyllite stand at 56 million tonnes, of which 23 million tonnes
(41%) are in reserves category and the rest in resources category. The major occurrences are
in Madhya Pradesh, Maharashtra, Uttar Pradesh, Odisha and Rajasthan.
The production of pyrophyllite was 234,000 tonnes in 2010-11 and there were 8 principal
producers. The reported consumption was at 800,000 tonnes in 2010-11 mainly by the
refractory industry. The apparent domestic demand is estimated at 400,000 tonnes by 2016-17.
The use of pyrophyllite in ceramic industry appears to be static, whereas there are certain
problems in its application in refractory industry due to change in technology.

92
Mineral 16: KYANITE
The estimated world production of kyanite is at 430,000 tonnes. India is the third largest
producer of the mineral. The countries reporting significant production of kyanite are South
Africa, USA, and France. The total resources of Kyanite in India are estimated at 103 million
tonnes, of which only 1.57 million tonnes are reserves and the balance are resources. The
production was at 4,064 tonnes in 2011-12 from 3 reporting mines only as against 4 in previous
year. The consumption is reported to be around 4,500 tonnes per annum during the last three
years and has remained somewhat static. The demand is estimated to grow though and touch
10,000 tonnes by 2016-17.
The resources of kyanite need to be converted into reserves and the analysis for different grade
is also called for, as only 12% of production constitute for Al2O3 above 40%. In fact, a re-
assessment of reserves and resources is required at this stage.
Mineral 17: SILLIMANITE
Australia, China and India are the major producers of sillimanite. The total resources in India
are placed at 67 million tonnes, of which reserves are only 4 million tonnes and the balance as
resources. The resources (72%) are of granular high grade while resources of massive
sillimanite of all grades are about 5% only.
The production was reported to be at 47,671 tonnes in 2010-11 with 42% increase over
previous year from the 4 mines located in Odisha and Maharashtra. The production in 2011-12
was at 58,043 tonnes with an increase of 19% over the previous year. The consumption was
however reported at 15,300 tonnes in 2010-11 mainly by the refractory industry. The apparent
demand is estimated to touch 50,000 tonnes by 2016-17. The imports of sillimanite were 1,363
tonnes in 2010-11 from South Africa, while exports are declining.
Mineral 18: VERMICULITE
Vermiculite is a term applied commercially to micaseous material (hydrated silicates of Al, Mg
and Fe) but it differs from mica in its characteristic property of exfoliation. The world reserves
are located primarily in South Africa, Australia, Brazil, China, Russia and Uganda and the total
production stood at 530,000 tonnes in 2010, with South Africa being the principal producer.
The resources of vermiculite in India are placed at about 2.5 million tonnes and major deposits
are located in Tamil Nadu, Madhya Pradesh and Andhra Pradesh. Owing to rising demand,
22,038 tonnes of vermiculite was produced in 2010-11, an increase of 89% over the previous
year, 2009-10.

93
There were 5 mines reporting production of vermiculite. The reported consumption was at 8,000
tonnes in 2010-11. The exports were at 1,449 tonnes whereas imports increased to 312 tonnes
in 2010-11 mainly from South Africa. The demand is estimated at grow nearly four-fold to about
30,000 tonnes by the year 2016-17.
Mineral 19: NON-METALLURGICAL GRADE BAUXITE
Out of the total world reserves estimated at around 28,000 million tonnes of bauxite,
approximately only 5% are of non-metallurgical grade. The bauxite other than metallurgical
grade is categorized into cement grade, abrasive grade, refractory and chemicals grade as per
its use and application in various industries. The total resources of bauxite in India of other than
metallurgical grade are 160 million tonnes, of which 62 million tonnes are in reserves category.
The production is around 4 million tonnes but decreased in 2011-12 due to closure of few
mines. There were 189 mines reporting production of bauxite in 2010-11 against 197 in
previous year. Gujarat is the leading producer state with 79% of total production of non-
metallurgical grade followed by Andhra Pradesh (14%) and Madhya Pradesh (7%).
The reported consumption of bauxite in the organized sector other than metallurgical during
2008-09 was 1.38 million tonnes. The estimated production is at about 6 million tonnes by
2016-17, whereas apparent consumption is projected at about 3.54 million tonnes in 2016-17 as
against 1.5 to 2 million tonnes at present. Exports of bauxite decreased substantially to 119,000
tonnes in 2010-11 from 476,000 tonnes in 2009-10 mainly to Middle East countries whereas
imports increased from China marginally.
The resources of refractory and chemical grade bauxite are relatively limited as against the
estimated future requirement. However a proper assessment of these grades of bauxite needs
to be done because of common occurrences of both the metallurgical and non–metallurgical
grades of bauxite together. The proper utilization of all grades is also called for.
Mineral 20: BARYTES
Barytes (BaSo4), a high specific gravity mineral which finds its use largely in the oil and gas well
drilling. The world reserves of barytes are at 240 million tonnes and the production is 6.9 million
tonnes in 2010. The largest producer is China (3.6 million tonnes) followed by India (1 million
tonnes), USA and Mexico. The total resources in India are placed at 73 million tonnes, of which
43% are the reserves and 57% are resources. Andhra Pradesh alone accounts for 99% of
country’s reserves. The production of barytes (off colour) was at about 2.33 million tonnes from
six reporting mines in 2010–11 showing an increase of 8% over the previous year. However,
the production declined by 26% to 1.72 million tonnes in 2011-12. The oil well drilling industry
94
was the main consumer accounting for 78% of the consumption followed by the chemicals
industry for 18% consumption. The reported consumption was around 2 million tonnes. The
apparent domestic demand of barytes is estimated at about 2 to 2.5 million tonnes by 2016–17.
The exports of barytes stand at 0.8 million tonnes with increasing trend to Venezuela, Saudi
Arabia, USA and UAE, while the imports of 1,674 tonne were mainly from China in 2009-10.
India has surplus resources of barytes and therefore concerted efforts are necessary to boost
the export of barytes and its micronized products from the country. Also, the additional reserves
build up in Rajasthan and Himachal Pradesh is desirable based on more exploration in the
potential areas.
Mineral 21: BENTONITE
Bentonite is essentially high plastic clay possessing inherent bleaching properties like fuller’s
earth. Bentonite is valued foundry and binding, drilling mud, iron ore palliation and water-
proofing. The world production was 14 million tonnes in 2009 and the leading producers were
USA and China. However, production declined by 26% to 1.72 million tonnes in 2011-12. The
total resources of bentonite in India are placed at 568 million tonnes of which 25 million tonnes
only are categorized as reserves. Bulk of the resource (76%) are in Rajasthan followed by
(24%) in Gujarat. The value of bentonite produced in India in 2009-10 increased to Rs 40
crores. The total consumption in 2010-11 was at 112,400 tonnes comprising 48% consumption
by foundry industry and 20% consumption by oil well drilling. The exports increased
considerably to 628,612 tonnes in 2010-11, whereas the imports decreased to 2,300 tonnes.
Bentonite is one of the exportable commodities in India and is exported both in crude and
processed forms. But exports of processed material fetch higher value than crude benetonite.
Hence, there is a need to develop processing techniques for making the product more valuable
and to suit the international standards.
Mineral 22: FULLER’S EARTH
Fullers Earth like bentonite is brown and used as bleaching clay. The only difference is that it is
a non-swelling type of clay and contains calcium whereas bentonite contains sodium. The world
production of fuller’s earth was 3.7 million tonnes. in 2010, USA was the leading producer.
The total resources of fuller’s earth in India are placed at 256 million tonnes, of which only
58,000 tonnes are in reserve category and rest are remaining resources. About 74% of the
resources are located in Rajasthan. The value of fuller’s earth produced in India is around Rs
0.35 crores. The consumption in organized sector was at 5,600 tonnes in 2010-11. The
vanaspati industry is the largest consumer accounting for 92% consumption. There were no

95
export and import of fuller’s earth in 2010-11 but India’s position as an important exporter of
fuller’s earth in the world needs to be maintained.
Mineral 23: MICA
Commercially important mica minerals are muscovite and phlogopite. The world production of
mica was 350,000 tonnes in 2010. Russia was leading producer (29%) followed by Finland
(19%), UAE (15%) and Korea Republic (14%). India’s crude mica production was 1,293 tonnes
in 2010-11, an increase of 22% over previous year.
Over fifty years ago, India enjoyed the monopoly in the production and export of sheet mica in
the world but lately from 1980 onwards, the production is on continuous declining trend due to
lack of demand on account of emergence of mica substitutes in the world market. India has
largest reserve of mica in the world. The total resources are placed at 532,237 tonnes, of which
190,741 tonnes are under reserve category and remaining as resources. Andhra Pradesh leads
with 41% share of country’s resources followed by Rajasthan (21%) and Odisha (20%) and
balance in Jharkhand and Maharashtra etc. There were only 31 reporting mines in 2010-11 for
total production of crude mica at 1,293 tonnes; whereas the production in 2011-12 was at 1,807
tonnes of crude mica showing an increase of 36% over the previous year. The production of
mica waste / scrap was 5,820 tonnes and Andhra Pradesh was the sole producing state.
Exports of mica increased to 125,367 tonnes in 2010-11, whereas imports of mica decreased to
1,687 tonnes. World demand for sheet mica is expected to decline, but this is being
compensated by the demand of scrap / waste mica and other mica based products. Therefore
to take the full advantage for exports, the mica industry should diversify to manufacture and
export fabricated value added products such as mica paper, micanite sheets and mica based
paper.
Mineral 24: TALC, SOAPSTONE AND STEATITE
The talc mineral includes flakes and fibres while steatite indicates massive compact variety of
talc and the soapstone for the massive talcose variety of rock. The main property is the softness
and the smoothness of the mineral. The world production of talc was 7.15 million tonnes in 2010
and the major producers were China, USA, Brazil, Finland and France.
The total resources of talc / steatite / soapstone in India are placed at 269 million tonnes, of
which 90 million tonnes are in reserve category and remaining 179 million tonnes in resources
category. Rajasthan has 50% of resources followed by Uttarakhand having 32% of the
resource.

96
The production of steatite in 2010-11 and 2011-12 was at 0.90 and 0.96 million tonnes
respectively from 113 private sector mines Rajasthan was the main producing state. The total
consumption was 380 thousand tonnes in 2010-11. The exports increased to 113 thousand
tonnes whereas imports of steatite were 10,000 tonnes only mainly for the lumps.
The world market condition is steadily growing and India being one of the principal sources for
good quality of steatite, there is scope for increasing the exports by adopting modern
pulverising techniques.
Issues/Concerns and Way Forward
1. The non–metallic (industrial) mineral sector in India is characterized by a large number of
small mines in the private sector. Most of the non-metallic minerals are of low value and
high volume, and occur as small deposits involving manual to semi-mechanized mining
operations. The number of reporting mines has considerably been reduced in the last five
years mainly because of non renewal of lease and closure of mines on environmental
consideration. As the mining leases in most of the cases are of 5-10 hectare or less in area,
spread over far flung areas with poor infrastructure, and given the manual to semi-
mechanized modes of mining operations, certain relaxations in environmental norms would
be necessary to maintain the productions level commensurate with demand. Also, the
renewals of mining leases need to be expedited by the state governments along with grant
of new mineral concessions.
2. A comparison of estimates of mineral inventory of 2005 and 2010 indicates that the
reserves of important mineral have decreased and the proven reserves are only 5-10% of
the total resources. This reflects lack of exploration efforts to build up additional mineable
reserves required for augmentation of production levels in most of the cases. Again, the
non-metallic minerals support critical industries such as iron and steel, cement, chemicals,
fertilizers, ceramics and paints etc. which have a direct bearing on infrastructure
development of the country and this will propel demand for these minerals in future. The
Government therefore needs to put in a strategy to systematically invest in exploration and
build up the inventory.
3. Particularly for rock phosphate and potash, large areas are reserved for state PSUs by the
state governments (mainly Rajasthan), which needs to be de-reserved. This would result in
more efforts by private sector enterprises in exploration and development of un-worked
potential areas.
4. The reserves of chemicals and fertilizer grade rock phosphate in India are very limited and
of low grade. Therefore, beneficiation of domestic low grade ore needs to be given priority
in addition to utilization of potash feldspar as an alternate to rock phosphate.
97
5. The total resources of potash are estimated at 21,815 million tonnes but there is no
production at all, mainly due to lack of investments required for deep drilling in exploration
and development of such potash deposits in Rajasthan.
6. The resources of refractory grade dolomite in the country are meagre and in short supply
as required by steel industry. Hence, identification of such dolomite deposits in the country
is necessary.
7. Search for new deposits of fluorspar needs to be intensified to meet the specification of
chemical industry or else the country will have to depend on imported fluorspar in the
coming years.
8. Though India has large reserves of fireclay but the high grade (37% Al2O3 and above) clay
is in short supply as required by refractory industry. In view of this, delineation of high grade
fireclay deposit needs to be done.
9. The graphite reserves having +40% fixed carbon are rather limited. It is therefore
necessary to develop cost effective beneficiation technologies to utilize the low grade ores
in the country.
10. There is large reserve base and surplus production of barytes, wollastonite, bentonite,
fuller’s earth, mica and soapstone / steatite in the country but the export potential remain
yet to be realized commensurate with the demand of these minerals in other countries. A
reassessment of mineable reserves and export potential needs to be carried out.

98
Small Mines
India is characterized by a large number of small deposits of metallic and non-metallic minerals
and as a consequence, a considerable part of mining activities comprises of small–scale
mining, working in small deposits and also operating small mining leases granted in large
mineral deposits. Most of the minor mineral leases granted are also mined in small mines.
The small mines are located throughout the country mostly in rural and forest areas and are
operated seasonally but provide employment to the rural people during a large part of the year.
The small mines contribute a fifth of the total value of the metallic / non-metallic mineral sector
and provide 38% of the total employment in this sector. Nearly 84% of the metallic and non-
metallic (non-fuel and non-atomic) minerals are mined in small mines. The small mines operate
with minimum infrastructural support and are responsible for major part of operational and
environmental shortcomings attributed to the mining industry.
Except that of few small mines of high value precious minerals, the small mines by and large
may be categorized as mining of small deposits which are developed by forming benches with
heights ranging from 1.0 metre to 4.0 metres with an annual production up to 50,000 tonnes.
These mines include manual as well as semi-mechanized operations where jack hammer drills,
wagon drill, small front-end loaders, small hydraulic shovels and tipper- trucks etc are deployed
for removal of thick over burden. The small mines largely contribute to low value and high
volume mineral production which cannot be imported but is needed for essential activities.
Criteria for Defining Small Scale Mining
The perception of small scale mining charges from country to country. There is no uniform
standard definition of small scale mining. It is however different from artisan mining. In India,
there is a strange phenomenon of small mines in large deposits and this is against the
principles of scientific mining and economics, as this negates the advantage of economies of
scale in operations. Usually, the mineral deposits of limited spatial extent, discontinuous in
nature with narrow widths and shallow in depth qualify for small mining operations. The extent
and measure of mining operations and availability of mineral reserves defines its size and
shape attributing as small deposits. The geological disposition of mineral deposits suitable for
small scale mining can be divided into the following categories:
a) Lenticular bodies including those occurring on en-echelon pattern as well as those with
composite veins for e.g. quartz-feldspar bearing pegmatite’s and quartz reefs
b) Lenses, veins and pockets of modest and small sized bodies for e.g. zoned pegmatites,
manganese and iron ore, graphite, calcite etc

99
c) Alteration aureoles as ellipsoidal pockets small bog type for e.g. china clay, silica sand
d) Pegmatite’s containing rare metals and gem stones, reefs and veins
e) Placer and residual mineral deposits of hill and valley wash float ores, river placer for e.g.
hyalite, sillimanite, clay, iron and manganese float ore deposits
Mineral deposits are worked on a small scale ordinarily, when they are too small not to be
worked by large scale mining. In view of this, the following definition as propounded by MGMI
may deserve consideration.
“The small mineral deposits are those which would permit economic operations of only small
scale mines for reasonable life-time with future provision for expansion and not merely short
time intensive exploitation.”
On the other hand, depending upon, whether the mineral is of high bulk / low value or low bulk /
high value, the mineable reserves of small deposits for small scale mining could be as follows:
a) Low bulk / high value mineral (e.g. kanite, barites, graphite, phosphate ores, apatite,
manganese chromite, magnesite, talc / soapstone and china clay / fireclay etc.)
b) High bulk / low value and medium value minerals (e.g. bauxite, iron ore, limestone
dolomite, storing sand, silica sand, moulding sand and lime shale etc.)
The small mineral deposits are available as (a) erratic and inconsistent deposits (b) as lens /
vein and pockets and (c) as cavity and other deposits. The precious / semi-precious minerals
like emeralds, garnet opal, diamond, tin and tungsten would qualify for first category, whereas
most of the non-metallic minerals will fall in the second category and the deposits of agate,
jasper, perlite, lime-kankar etc. will be placed in the third category.
The main characteristics for categorizing a small mine may be as follows:
i. The nature of mining operation could be either purely manual or semi-mechanized open
pit operations or manual underground operations
ii. The average daily employment may not usually exceed 40
iii. The depth of open pit may be up to 50 m from surface
iv. The annual Pit Mouth Value (PMV) of the ore produced may be up to Rs 1 crores with
annual production ranging from 1,000 to 5,000 tonnes

100
Why Small Scale Mining for Small Mineral Deposits
Many times, reserve of high grade and low grade deposits are too small and large scale mining
is not possible. The small investors can invest small capital to work these deposits, even if the
returns are not high. Value–wise, the contribution of small mines is about 21% of the total value
realized from mineral sales. The small mines also contribute significantly to the economic
activity besides a number of benefits and advantages, which are:
i. Because of the configuration and disposition of small deposits with simple geographical
extent and lower grade, it warrants economic mining by small scale open cast operations
ii. Low capital expenditure and low working cost involved in development activity
iii. Short gestation period to achieve production
iv. Availability of manpower in rural areas and boosting employment generation
v. Augmentation of infrastructure facilities and community development and optimum
exploitation of mineral resource for the local needs
Constraints in Small Scale Mining
The various constraints, which come in way of viable small scale mining, are as follows:
I. Deficient techno-economic feedback: The technical information on small deposits is
meagre in survey reports in most of the cases and in the absence of proper geological
appraisal, this leads to loss of investment by small entrepreneurs.
II. Constraints in mine-planning: In the absence of proper exploration, the mine plan that
is prepared is of poor quality and as such, the scientific mining remains a casualty
adversely affecting conservation aspects.
III. Financial constraints and risks: Small investors are unable to make requisite level of
investments required for scientific development of mineral deposits. Also the banks and
financial institutions are reluctant to grant loans to small mines owners, as they prefer
loans with commitment on investment in mining machinery. Other financial constraints
include payment of high cost of land, cost of preparation of mining plan, EIA / EMP and
obtaining environment or forest clearances etc.
IV. Poor infrastructure and communication facilities: As the small mines are generally
located in remote rural areas, where there is a lack of good roads and other

101
transportation facilities. Sometimes there is non-availability of power and communication
facilities as well.
V. Marketing constraints: Small mines generally lack suitable mineral processing know
how to maintain the requisite quality and grade of the ore production and in view of this,
there are irregular off take of the material by the consuming industry.
VI. Cost effective development: This often leads to haphazard and dumping of wastes in
the vicinity of the mines to save transport costs and all these practices hamper
reclaiming of the damaged land.
VII. Unawareness to environmental protection and pollution control: Small mines often
ignore environment protection measures as well as lack social welfare amenities.
VIII. Lack of technical expertise: Small mines generally do not employ qualified mining
engineers and geologists, whom they cannot afford but this leads to unscientific and
unsafe operations.
Operational Aspects of Small Mines
At present, there are no incentives for small mines, which are available to other small-scale
industry in the states. On the other hand, due to the constraints as given above, many small
sized mineral deposits becomes unprofitable and remain dormant. A number of small mines
occurring between mine clusters or as part of a mining belt are reported to be closed or are
working intermittently. For example, in Kerala, 29 china clay mines in the Kollam sector are
lying idle. Similarly in Tamil Nadu, 15 leases of gypsum in Coimbatore, 16 leases of limestone
and 19 quartz mines in various mining clusters are reported to be closed. Again, in Madhya
Pradesh, 11 bauxite and 41 limestone mines in Katni-Satna sector, 64 dolomite mines and 21
fireclay mines in katim-Jabalpur–Mandla area are closed. In Gujarat, 37 bauxite mines in Virper-
Mewasa sector of Jam Nagar district, 112 limestone chalk mines in Adityana in Porbander
district, 35 dolomite mines in Baroda and few fireclay mines in Surendra Nagar district were
closed in 2006 to 2008. Therefore, specific studies are required to evaluate the problems and of
non-working group of small mines.
These mines are usually developed as small open cast pits forming benches in overburden and
ore with heights ranging from 1.0 metre to 4.0 metres. In case of underground mines, it is
opened by aidit or incline with levels at 10-15 metres. Vertical intervals in depth and winzes at
15-30 metres intervals along strike connecting different levels in depth. In the open cast
operations, jack hammer drilling and blasting is involved manually to remove overburden and or
winning the ore.

102
Environmental and Social Aspects of Small Scale Mining
The technical and infrastructural facilities are found wanting in case of small mines. Moreover,
the way small mines operate invariably implies certain negative externalities on the rural
environment and social welfare of the rural economy.
� If the mine pit is located in agricultural land it cannot usually be reclaimed due to non-
preservation of top soil and scattered overburden waste dumps that gets mixed with the soil.
� Cost saving measures may include non-use of dust suppression techniques exposing
workmen to dusty condition. Also localized air and water pollution can easily be envisaged
� During the rainy season, waste dumps get wasted off causing silting of streams.
� If the mine is situated in forest land, it disturbs wild fauna besides illegal felling of trees
causing damage to the ecology of the area.
� The accommodation and welfare amenities to the workers are generally far from satisfactory.
Contribution of Small Mines in Indian Context
The small mines consist of both major and minor minerals. The minor mineral concession
largely involve small mining activity for construction materials but a considerable contribution in
mineral production of metallic and non-metallic (major minerals) is attributed to small mines. Out
of the total working mines of around 3,000 in number of major minerals (excluding atomic, minor
and fuel minerals), 84% of the mines are small mines which fall in category “B’ mines. These
pertain to 46 minerals as per list given below:
Exhibit 6.1: List of Minerals Produced by “B” Category Mines
Agate Apatite Asbestos Ball Clay Barytes
Bauxite Calcite Chalk Chromite Clay (other)
Diamond Dolomite Dunite Felsite Felspar
Fire Clay Fluorite Garnet Gold Graphite
Gypsum Iron ore Kaolin Kyanite Laterite
Lime kankar Lime Shell Limestone Magnesite Manganese ore
Mica Ochre Vermiculite Pyrophyllite Pyroxenite
Quartz Quartzite Rock Salt Sand (other) Shale
Silica Sand Sillimainte Slate Cassiterite (tin ore)
Phosphorite (rock phosphate) Steltite / Talc / Soapstone
Source: Indian Bureau of Mines
103
The status of mining lease as on April 1, 2009 indicates existence of 8,670 leases in 23 states
covering up to 60 minerals (metallic and non-metallic). The small mines also contribute to the
export of mineral significantly in respect of bauxite, limestone, chromite, feldspar manganese
ore, quartz, quartzite, gypsum, mica and silica sand.
The mining lease area varies from less than 1 hectare and up to 10 hectares covering most of
the small mines and the reserves do not normally exceed 2 million tonnes, being more for high
bulk / low value minerals. The production per annum normally is a maximum of 50,000 tonnes.
In addition to distribution of small mines over scattered smaller deposits, there are also a large
number of small mines located in rich mineral belts, mainly of those bulk minerals like
limestone, dolomite, fireclay, china clay and silica sand etc. A close look on these small mines
reveals a mushroom growth and such mines may be categorized as “cluster” serving the
industry in the vicinity of mining belt. Therefore, apart from susceptibility of small mines
confining over small deposits, the sustainable development of small mines with “cluster mining”
also deserves merit, as development of small deposits on a cluster basis is practically non-
existent. The OMS for manual mines is 0.8, while for those mines using some machinery may
go up to 2.0.
However, there are a large number of small mines leases of less than 5 hectares in existence
but in the interest of sustainable development of such small mines, “cluster mining” approach
will be necessary. Also the minimum mining lease area for major minerals in small mine sector
need to be considered to be 10 hectares (instead of 5 hectares) which can accommodate
existing mining leases subject to its population on spatial and geological considerations for a
single mining lease.
Issues/Concerns and Way Forward
1. The Indian mining sector (non-fuel) consists of large number of small mines and their
contribution is significant in total mineral production of metallic and non-metallic minerals,
besides having export potential. But somehow, the production is nearly stagnant for the
want of capital required for expansion of the mining activity. The banks and financial
institutions are generally reluctant to give loans to small mine owners without having
heavy equipment and machinery and this is coming in the way of augmentation of mines
capacity. Therefore, some relaxation by the financial institutions to small mine owners
need to be considered based on the valuation of mineral reserves.
2. Large numbers of small miners are not able to employ qualified mining engineers and
geologists and this has led to unscientific mining in number of cases in violation of MMDR
Act and rules. The respective state governments and Indian Bureau of Mines may have to
be proactive in this regard.

104
3. There is a large number of non-working mines in various mining belts in the country due
to uneconomic working, high stripping ratio, grade and recovery constraints and also
forest and environment clearances and poor infrastructure facilities. A critical analysis of
small mining sector to address various reasons behind non-working and dormant situation
of small mines needs to be undertaken by the state governments.
4. Though the National Mineral Policy (NMP 2008) has envisaged cluster mining approach
in small mines but the same remains unimplemented. Operation of cluster mining over
large mineralized areas like limestone, dolomite, bauxite, slate, clay belts, can be
considered in respect of following identified type areas – a) Indrawad – Jaitaram
Chinaclay belt in Nagaur district, Rajasthan; b) Kolayat - Mudh-kotri – Guda fireclay belt in
Bikaner district, Rajasthan; c) Quartz feldspar mica belt of Ajmer - Bhiwara in Rajasthan;
d) China clay belt of Singhbhum district in Jharkhand; e) Graphite mines in Bolangir
districts, Odisha; f) Jangir – Chopa lime stone belt in Chhattisgarh; g) Limestone of katni –
Jhukehi and Satna belt in Madhya Pradesh and Bhagokot area of Karnataka; i) Bauxite
leases in Jamnagar and Kutch districts in Gujarat; j) Limestone mines in Yeotmal district
and Western Ghat bauxite in Maharashtra; k) Soapstone and Baryties mines in Andhra
Pradesh; and l) Gypsum and quartz- feldspar mines in Tamil Nadu.
5. A mechanism for amalgamation of small leases into one single lease needs to be evolved
along with the modalities for some relaxation in forest and environment clearance. It is
noteworthy that till 2010, small mines of less than 5 hectare areas were exempted from
environmental clearances. The same rule needs to be applicable again.
6. Granting of very small leases by sub dividing of a large deposit should be avoided by the
state governments in the interest of mineral conservation and minimum land degradation.
7. The minimum area for grant of a mining lease for major mineral needs to be enhanced to
10 hectares.

105
Summary of Recommendations
The Indian mining industry is passing through a critical phase, especially in the last two years
witnessing even negative growth rate primarily due to closure of iron ore mines in the states of
Karnataka, Goa and Odisha, high costs of borrowing and policy paralysis. This report is an
initiative on the part of FICCI to bring out the issues and concerns plaguing the mining sector by
each non-fuel mineral for the consideration of the government. There are a number of
unresolved policy issues, which may deserve serious consideration by the union and state
governments. Briefly, these issues are summarized here. We hope that this will be a ready
compendium for the government to act upon.
The mining and quarrying sector needs to grow at rate of 10 to 12% per annum in order to cater
to the requirement of raw materials by the industries. As mining is interlinked with industrial
development, the security of raw material is of prime importance and as such, the pro-active
role of union and state governments is called for to ensure an era of mineral development. It is
time we address the areas of concern coming in the way of mining or we will need to import
both the raw materials and the finished products, which the country can ill afford. We are of the
opinion that the steps outlined need to be resolved and acted upon at the earliest.
Rapid economic growth and technological advancements in India in the recent years has
created demand for a wide range of non-fuel minerals to perform essential functions in sectors
like automobiles, aerospace, telecommunications and renewable energy. But, India is partially
or completely dependent on imports for many of its non-fuel minerals which include among
others Gallium, Platinum Group of Metals, Antimony, Molybdenum, Nickel, Tin, Tungsten,
Cobalt, Potash, Sulphur and Borax etc. New resources therefore need to be identified through
increased exploration activities. As preliminary geological data (G3, G4 level) of GSI is not
sufficient to make investment decisions in most of the cases, the detailed exploration is
essential to attract investment in mining sector so as to establish feasibility of the prospect. It
may also be mentioned that only 10% of the total hard rock area in the country has been
explored so far leaving a great scope for discovery of new deposits through detailed
exploration.
The areas of concerns coming in the way of mineral development and growth of the mining
sector have been highlighted based on available data. The remedial measures deserve serious
considerations by union and state governments as well as by industry. The scarcity of raw
material resources faced by basic industries like aluminium and power is not in the interest of
industrial development. The future, therefore, warrants focus to an era of mineral development
to ensure growth of the mining industry.
Given below are a set of recommendations that have evolved through the discussions in the
previous chapters.

106
Overall Recommendations and General Remedial Measures
1. The minerals listed in part C, of Schedule I of MMDR Act should remain intact, requiring
union government’s approval. So far as mining activity is concerned, India is a single
economic space and as such, more delegation of powers to the state governments may
jeopardize the interests of mineral development.
2. While the National Mineral Policy 2008 remains yet to be implemented, the mineral policies
of the state governments are at variance with the same. In fact, the procedures in the grant
of mineral concessions also vary from state to state. It would therefore be necessary that
the state governments may be restricted to formulate their mineral policies only to minor
minerals.
3. To curb the menace of illegal mining and to ensure scientific mining, it would be necessary
to strengthen and re-structure the Departments of Mines & Geology of the state
governments on a uniform pattern.
4. Geological Survey of India (GSI) has identified an area of 5.71 lakh square kilometres as
Obvious Geological Potential (OGP) area in the country. But there is hardly any detailed
mineral exploration activity in the absence of timely follow-up actions on GSI’s
recommendations.
5. As mineral exploration is key to attracting investment in the mining sector, separate
legislation and procedure for grant of prospecting / exploration licenses is required. At
present, the same procedure is being adopted as that of a mining lease in grant of
prospecting licenses whereas mineral investigation does not involve acquisition of land, it
being a temporary activity for a short period.
6. A transparent, simple and stable fiscal regime plays a significant role in the growth of the
industry for attracting investment. However, Indian mining sector is already amongst the
highest taxed in the world with effective tax of about 45% compared to other countries
which ranges between 35 to 40% (China-32%, Russia-35%, Australia- 39%, Chile 40% and
Canada- 35 %). The Draft MMDR Bill, 2011 proposes a number of additional taxes and
levies thereby taking the effective taxation to more than 60%. In addition to above there is
huge additional burden from revision of royalty rate and stamp duty. Taxes/duties/cess etc.
should not be prohibitive and should help the industry to survive, sustain and grow. Further
any new taxes/duties/cess should take into consideration existing burden on the sector.
7. There is incorrect definition of prospecting activity in Forest (Conservation) Act 1980. The
provisions of guidelines 1.3 (v) of the handbook exempts certain activities like oil drilling,
transmission of power lines etc from forest clearance but in case of prospecting though few
drill holes are permitted (16 boreholes per 10 sq km) vide notification no 5-3/2007-FC dated

107
August 19th, 2010 of Ministry of Environment and Forests, but the collection of surface
samples through trenching / pitting are prohibited. In fact, the prospecting activity has not
been defined properly in the notification and entry to forest land remains a big issue to the
prospectors. As most of the mineral bearing lands overlap the forest lands in the country,
the provisions of Forest (Conservation) Act 1980 need to be amended in the interest of
detailed prospecting and exploration for mineral investigation, where no degradation of
forest is involved; rather, prospecting activity needs to be exempted from forest clearance.
8. Policies to enhance the efficiency of the mining activities are needed so that the life of a
mine is shortened
9. There is a tendency on the part of the state governments to give preference to value
addition and reservation of potential areas to the state PSUs in grant of mineral
concessions. This has resulted in the reservation of large potential areas which have
remained blocked for a long period without any exploration and development. At the same
time, there is hardly any de-reservation of such potential areas.
10. Development of dedicated freight corridors linking the iron ore mines to the ports and rail
heads to ensure evacuation from the pit heads without disrupting the public life needs to be
considered. Such corridors can either be in PPP model or a consortium of miners can
develop and operate the rail-line on a royalty/rent basis (examples of such PPP models
exist in Australia and Brazil).
11. Mandatory exploration for the operating mines and adequate incentives for green field
exploration need to be devised to enhance the resource base and convert them to reserves
12. The strategic value of various minerals must be recognized and specific efforts need to be
made to conserve minerals essential for the country’s future. Minerals such as bauxite,
titanium, rare earths and several heavy metals (e.g. gallium germanium, platinum group of
metals, molybdenum, indium and cobalt etc) which will be crucial for future development of
materials need to be addressed for long-term needs of the country.
13. Looking to the complex mineralogy of Indian Hematite ores, IBM needs to go for evaluation
of cut-off in a deposit-wise manner in line with such practice in several countries. For each
deposit, theoretical cut-off and operational cut-off grade may be declared based only on
detailed mineralogical-metallurgical test-work and can be unique for a particular deposit.
14. There is a need for detailing of the national mineral inventory so as to allow the investor to
get adequate information for taking up investment decisions.
In addition to the above, given next are the mineral specific recommendations

108
Bulk Minerals
Iron ore
1. Since generation of fines is an integral part of the process of iron ore mining, it is imperative
that the fines are either consumed by the domestic steel industry (after beneficiation and
agglomeration) or sold in the export market. Otherwise huge stockpiles of fines can be an
environmental hazard, besides being a loss in monetary terms. Very low grade of iron ore,
if not beneficiated at present, should be encouraged to be exported.
2. Beneficiation and Pelletisation technologies need to be incentivised and capacity
augmentation of pelletisation and sintering facilities to utilize low grade fines should
become a priority area. Mostly fines are used in sintering or pelletisation and this step will
enable use of the low grade ores. During last few decades of selective mining (lumos and
concentrates) a substantial chunk of sub-grade or marginal grade ores (-60 +45% Fe) is
lying unused in situ or staked in dumps. Together with the staked fines (-10 mm) and
slimes (in tailing ponds) where significant tonnages of valuable hematite are presently
locked up, value addition for its utilisation is the need of the hour.
3. There are constraints in rail–road–port infrastructure such as lack of power rail connectivity
to ports, inadequate rail capacity for domestic and export of iron ores, lower haulage
capacity of rail wagons etc. besides poor condition of roads and low capacity of handling of
iron ore at ports. The augmentation of rail infrastructure is therefore vital particularly in
eastern sector. Also the railway freight class for both domestic steel industry and exports of
iron-ore should be reduced to 120 class
4. The present estimate of the reserve position does not give a complete picture, as 55% of
the hematite resources remain yet to be converted into reserves. Further, as per the “Iron
and Steel Vision 2020” published by IBM (August 2011) the resources are estimated at
60% Fe+ cut off grade which in is not realistic. The re-assessment of iron ore reserves /
resources at lower cut grades (45% Fe) is called for taking into consideration ore
characterization (Al2O3 +SiO2 <= 5%) so that the steel industry can use the ores. Such a
re-assessment will substantially increase the iron ore resources in the country.
5. The demand of iron ore at present has kept aside the reserves of Banded Iron Formation
(BIF) in the inferior category resulting in huge piles of BIF as rejects. Utilization of these
inferior grade materials by adopting suitable beneficiation techniques may reduce the
burden on land and environment.
6. While there is no dispute that in general iron ore prices are lower in the domestic market
than international prices but selling in international market at internationally prevailing
prices does not necessarily result is higher net realization for iron ore miners due to various

109
fiscal restrictions like high export duty of 30%, high rail logistic cost from mine-head to port,
etc. However, in the longer term, demand for iron ore from China can make Indian iron ore
exports an attractive preposition provided international prices is above a threshold which
presently is about 130 USD. At the same time, given the capacity addition in the steel
sector that has been happening and which has been planned, domestic utilization for value
addition should not be neglected for want of iron ore. According to the projection by Ministry
of Steel, domestic steel production is slated to reach 200 million tonnes by 2020 and iron
ore requirement will be about 250-280 million tonnes per annum (rest met from scrap),
resulting in a likely shortage of ore (+62% Fe) availability for the domestic steel industry. In
view of this, a balance and pragmatic view needs to be adopted so that neither the steel
making industry suffers nor are the iron ore miners completely restricted.
Bauxite
1. The quantity of bauxite has been depleting in various mines with respect to alumina and
silica contents and R&D efforts are needed in this regard.
2. Many of the existing leases are also on the verge of expiry, while the reserves in the
existing mines are reported to be depleting, and new leases are not being granted.
Excepting for Nalco, the other two primary producers namely Hindalco and Balco are facing
acute shortage of bauxite for sustained running of their refineries. No timely action has
been considered for allocation of bauxite deposits to meet the Brownfield expansion of the
existing alumina refineries. This needs to be developed.
3. In Gujarat and Chhattisgarh, where chemical and refractory grade bauxite are mined along
with inferior grade of metallurgical bauxite; proper utilization is called for, as there are large
number of small mines in Gujarat.
4. A proper reassessment and detailed exploration is the need of hour in all potential areas to
convert 83% of bauxite resources into the proven reserves.
5. As all bauxite areas in Chhattisgarh are reserved for PSUs for a long time and have not
been de-reserved so far, the same are blocked for want of exploration and development. It
is therefore necessary that all the reserved areas are de-reserved for grant of mineral
concessions to the existing aluminium plants and refineries.
Chromites (Chrome Ore)
1. India has only 54 million tonnes of reserves and the ore is friable at 200-300 meter depth
which cannot be mined with the present technology. Therefore, there is a need to focus on

110
deep drilling for converting resources into the reserves particularly in Sukinda Valley of
Odisha. Development of underground mining technology for mining of friable and deep
seated chrome ore reserves is urgently required. Further, 73% of the resources remain yet
to be explored and developed to establish the additional reserves and this need to be given
priority by the government and the industry.
2. The beneficiation of low grade ore (less than equal to 32% Cr2O3) is called for as against
38% Cr2O3 ores to augment the reserves.
3. For mining one tonne of chrome ore, 15 tonnes of Over Burden (OB) is excavated in open
cast mines. Management of waste lumps in Sukinda Valley is therefore a major
environmental concern. These overburden lumps modify the land topography, affect the
drainage system and prevent natural succession of plant growth resulting in acute
problems of soil erosion and environmental pollution.
4. The contamination of hexavalent chromium in the local water bodies is a major concern
and a source of environmental pollution in Odisha. The pumped out water from the mine
therefore needs to be doused with ferrous-sulphate solution before being discharged.
5. The existing policy of reservation of chrome ore mining areas in favour of PSUs need to be
discontinued. Rather, such areas may be de-reserved and thrown open for allotment to
private sector to carry out exploration and development
Manganese Ore
1. Presently, 67% of the total is categorized as resources, which needs suitable techno-
economic measures or additional exploration to convert into reserves if production were to
match demand. Pockets of scattered deposits are uncertain in nature and therefore many
times, mining strategy fails, if the deposits are not scientifically investigated.
2. There is a certain rise in the demand for manganese alloys. Higher power tariff in most of
the states has put additional burden on manganese alloy producers. The availability of
power at reasonable tariff needs to be ensured to manganese alloy producers.
3. There is limited high grade low phosphorous manganese ore in India and the imports of
such ores are necessary. South Africa has 80% of the world reserves but accounts for only
20% of world production. Acquisition of manganese ores in South Africa needs to be
planned.

111
4. Improvement in quality and recovery of manganese ores by means of beneficiation and
sintering process is required. Import of low phosphorous high grade manganese ore could
be considered for blending, as the Indian ores by-and-large contain high phosphorous.
Limestone
1. As only 8% of the total resources are classified as reserves, efforts are needed to convert
resources into the reserve category by means of detailed exploration by the government
agencies as well as by the industry. There is a need to increase proven reserves through
development of deposits in inaccessible areas (as Himalayas, Indo-Gangetic Plain, Desert
Area and NER), through relaxation of norms and undertaking exploration, etc.
2. In the existing mining areas, the depth continuity of limestone beyond 50 meters needs to
be explored for further development.
3. Incentives on utilization of mineral beneficiation techniques with better recovery from low
grade limestone and mine rejects may be considered by incentives such as reduction in
royalty rates on such material.
4. Development of rail-road infrastructural network may be taken up on priority to utilize the
available resources especially in hilly and inaccessible areas.
Base Metal Ores and Associated Strategic Minerals / Metals
Copper Ore
1. India is heavily dependent on imported copper concentrates and will continue to have
surplus refining capacity in the long-term. However, looking at the international long-term
scenario, there could be restrictions in sourcing copper concentrates from abroad and in
view of this, priority for indigenous development of known resources need to be given.
Moreover, India’s share in world copper mineral reserve base is only 0.7%. Therefore,
there is an urgent need to increase the resources within the country by increased
investment in detailed exploration. As of now, there is huge gap between domestic demand
and production of concentrates.
2. Copper concentrates invariably contain precious metals like gold, silver and selenium. Birla
copper recovers these metals to some extent but refining of gold is not taken up. On the
other hand, SIL does not produce gold and silver but exports anode slime containing these
metals whereas HCL has discontinued their precious metal recovery plant in 2007-08 on
112
economic consideration. The main issue that has affected gold recovery from copper
concentrates is of inverted duty structure with respect to gold and silver content. Though
the import duty on gold content in concentrate was removed in 2011, but an excise duty of
Rs 300 per 10 gram on finished gold is imposed. This duty cannot be passed on to the
buyers of gold, since there is no countervailing duty on finished gold. Thus, the potential of
copper industry to produce gold remains underutilized.
3. There is also a strong case for acquiring copper mining properties abroad with the purpose
of importing the concentrates into India. A case in point is of Konkola copper mines in
Zambia acquired by Vedanta Resources but the concentrates are not allowed for import
into India. The government support for overseas mines acquisition will be necessary for
free import of copper concentrates into India from such acquisitions.
4. It is necessary to reduce the customs duty on copper concentrates as well as the CST to
NIL so as to ensure viability of custom smelting model.
5. Effective recycling of scrap needs to be ensured through the organized sector in the
interest of mineral conservation.
Zinc and Lead Ores
1. India’s primary metal production capacity build-up is constrained on account of limited lead
resources. Further, only 16% of zinc resources are classified as reserves and there is an
acute need to take steps for enhancing the reserves of both lead and zinc. As 50% of the
total zinc resources are of low grade, mining of such deposits may be encouraged by way
of special relaxation in royalty payment and/or through fiscal incentives.
2. Many of the base metal deposits are located in forest areas, where exploratory drilling is
required but because of stringent forest regulation, prospecting activity is not permitted. In
fact, mining exploration by modern techniques to locate deep seated deposit requires
certain concessions and special dispensation which are presently lacking.
3. In order to promote mineral exploration activity, the equipment / technology should be
available in a cost effective manner. So, the import duties (currently 28%) on drilling rigs,
bits, accessories and fluids need to be brought at par with those needed for CBM (Coal
Bed Methane) exploration, which is duty free. Duty structure should also be favourable for
procurement of geo-physical / geo-chemical surveying instruments.
4. With rapid expansion of smelter capacities, imports of zinc and lead concentrates are
inevitable, as domestic production will be insufficient to meet the requirements. A

113
supportive tariff regime (NIL Duty) is required on raw materials such as zinc and lead
concentrates.
5. In the long-term, future of lead–zinc industry will depend upon the new mineral discoveries
as well as economic viability of mining of marginal grade deposits and all efforts are
needed to increase the zinc-lead reserves in the country.
Strategic Minerals and Metals
1. While considering hi-tech applications in new technologies critical to India’s national
security, metals like tin, cobalt, lithium, germanium, gallium, indium, niobium, beryllium,
tantalum tungsten, bismuth, selenium may be termed as strategic, as India is dependent
on imports to a large extent and is vulnerable to supply / price fluctuations
2. As many of these minerals / metals can only be produced as a by-product of base metals
extraction, the potential for enhancing production / supply on a stand-alone basis is
seriously limited. So a proper strategy for the development of these metals or ensuring
supplies is required.
3. A detailed assessment of potential resource base and its economic feasibility is the need of
hour for proper development.
4. Building a national stockpile for strategically critical input materials as identified is essential.
High Value Precious Metals
Gold
1. India today has a reserve base of 659 tonnes of gold metal, which needs to be converted
into minable reserves through intensive exploration. Also India is characterized by a
number of small gold occurrences and there is no deposit of substantial size and grade
discovered so far during the last 25 years mainly because of lack of concerted efforts in
detailed exploration neither by government agencies, nor by private parties. The
government needs to expeditiously grant prospecting licenses and create a favourable
environment for exploration.
2. The production of gold in the country has actually reduced in last 6 years, primarily due to
reduced by-product recovery and due to inability of HGML to increase its production
despite holding significant reserves. The by–product source has a potential of producing 25

114
tonnes of gold at the current level of refined copper operations in the country, if supported
by appropriate tax and duty structure.
3. More than 100,000 sq km area has been identified as potential for gold minalization in the
country but only 462 sq km area has been approved for grant of prospecting licenses. In
view of this, lengthy and avoidable procedures for grant of PLs need to be addressed by
central and state governments. Facilitating expeditious grant of PLs and MLs to applicants
interested in development of small and marginal grade gold deposits is essential, while
considering that the time lag of more than 5 years in prospecting and mining is required.
4. The tailings from 32 million tonnes dumps of BGML must be considered for recovery of
gold to produce around 2 tonnes per annum.
5. Development of ore specific metallurgical flow sheet is the need of hour for commercial
mining of small deposits.
6. Fund raising mechanism need to be in place through the amendments in regulation to allow
SEBI for listing of exploration companies, particularly junior exploration companies on
Indian stock exchanges. Also, the private sector companies may be permitted to issue flow-
through shares for funding risky exploration activities.
Silver
1. There is a huge demand–supply gap in silver. As against a demand of 3,000 tonnes per
annum (and which is set to double), supply from meagre indigenous production is around
200 tonnes. Thus about 6% of the demand is being met from primary sources. There is a
need to develop indigenous expertise for recovering / recycling silver from large varieties of
industrial waste being generated. The necessary expertise for this kind of recovery of silver
from large varieties of industrial waste being generated needs to be developed urgently.
2. Encouragement to copper producers to recover gold and silver as by-products from anode
slimes indigenously by providing the necessary fiscal / taxation incentives in terms of
relaxing excise duty provision.
Platinum Group of Elements / Metals
1. Since the ultramafic rocks of layered complex as well as those of granite-greenstone belts
are the favourable host for PGE mineralization, it becomes necessary to study such areas
in detail including the geo-chemistry for identifying new areas for detailed exploration.

115
2. India is not PGE producing country whereas demand is expected to touch 80 tonnes by
2017. The non-availability of PGE deposit for commercial exploitation is the major area of
concern. Major investment is essential to establish new resource base of PGEs, as only 5%
of the total potential area has been investigated so far. The private sector through junior
exploration companies need to be involved in detailed investigations. The Baula–Nauschi
prospect in Odisha with 14 million tonnes of PGE ores at a cut off of 1 g/t of Platinum &
Palladium must be accorded priority in developing it for commercial exploitation. The
resource identified in Hanumalpura and Sittampundi areas or Karnataka and Tamil Nadu
need to be converted into reserves.
3. The economic viability of PGE deposits largely depends upon the amenability of the ores
for beneficiation keeping in view marginal / low grade nature of resources indentified so far.
Hence there is a need to develop a suitable flow sheet for the PGE bearing ores of Odisha,
Karnataka and Tamil Nadu on priority basis.
4. The expertise for recycling of above ground resources in the country is also lacking. There
is a need to develop expertise for recovery of PGEs from recycled materials such as
catalytic converters, computer hard discs and electronics waste.
5. The level of concentration of PGE in the mineralized zones has to be determined by high
precision technologies such as ICPM with nickel sulphide fire array.
Diamond
1. The basic customs duty on cut and polished diamonds have been reduced from 15% to 5%
and the rough broken pieces are fully exempted from basic duty but the royalty rates of
10% of sale price on ad valorem basis have been increased to 11.5% and are 7% more
than any other country in the world. This may discourage MNCs which are engaged in
exploration of diamonds for indigenous production.
2. The Reconnaissance Permits (RPs) over almost 1,40,000 sq km area have been granted
for diamond exploration during the last eight years but only few prospecting licenses have
been granted over 900 sq km in Andhra Pradesh and Madhya Pradesh and not a single
mining lease has come into force so far. This reflects unusual delay in grant of mineral
concessions whereas large potential tracts for diamonds in the country remain yet to be
explored in the Bundelkhand area, in the Dharwar Craton, in teh Singhbhum craton and in
the Bastar craton.
3. India has the potential for new discoveries and should aim for 7-8 million carats annual
production by 2020 through private sector investment in exploration provided there are
investor friendly policies.
116
4. Diamond exploration is very high risk venture and on an average, less than 1% of
kimberlites results into diamond mines. In India, out of 200 odd kimberlites / lamproites
identified so far, only one has resulted into potential diamond mine (Rio Tinto at Bunder in
Madhya Pradesh).
5. As there is a need for discovering deep seated diamond deposits in the cratons and deccan
traps area, GSI must emphasize for Magnet-Telluric (MILLION TONNES) surveys allonym
with lithoprobe studies in their regional survey programme across the country on priority
basis in a time bound manner.
6. Laboratory facilities of GSI and also of the diamond industry need to be upgraded to
ascertain praise chemistry of indicator minerals as well as of diamonds.
7. Encouragement to private sector in diamond exploration and mining is necessary keeping
in view of high risk investment. Also, there is need to remove major bottlenecks and
constraints in getting mineral concessions and other clearances, as bulk of resources
(95%) remain yet to be converted into proven reserves by detailed exploration.
Precious and Semi-Precious Stones
1. Though India is a major trading centre for coloured gemstones but by-and-large, small
traders are involved in collection of gemstones from different parts of the country. The
entire industry is in the unorganized sector. There is no proper assessment of resources
and potential of precious / semi–precious minerals and the reporting of production, if any is
not done or available
2. Favourable trade regimes and agreements need to be negotiated with the countries e.g.
(Brazil, Mexico and China), which currently impose high tariffs on imports from India
3. The current mining operations must be legalized through an appropriate licensing
framework and the new mining areas need to be explored in the potential regions. A proper
assessment of resources is also called for.
Industrial / Non Metallic Minerals
1. The non–metallic (industrial) mineral sector in India is characterized by a large number of
small mines in the private sector. Most of the non-metallic minerals are of low value and
high volume, and occur as small deposits involving manual to semi-mechanized mining

117
operations. The number of reporting mines has considerably been reduced in the last five
years mainly because of non renewal of lease and closure of mines on environmental
consideration. As the mining leases in most of the cases are of 5-10 hectare or less in
area, spread over far flung areas with poor infrastructure, and given the manual to semi-
mechanized modes of mining operations, certain relaxations in environmental norms
would be necessary to maintain the productions level commensurate with demand. Also,
the renewals of mining leases need to be expedited by the state governments along with
grant of new mineral concessions.
2. A comparison of estimates of mineral inventory of 2005 and 2010 indicates that the
reserves of important mineral have decreased and the proven reserves are only 5-10% of
the total resources. This reflects lack of exploration efforts to build up additional mineable
reserves required for augmentation of production levels in most of the cases. Again, the
non-metallic minerals support critical industries such as iron and steel, cement,
chemicals, fertilizers, ceramics and paints etc. which have a direct bearing on
infrastructure development of the country and this will propel demand for these minerals
in future. The Government therefore needs to put in a strategy to systematically invest in
exploration and build up the inventory.
3. Particularly for rock phosphate and potash, large areas are reserved for state PSUs by
the state governments (mainly Rajasthan), which needs to be de-reserved. This would
result in more efforts by private sector enterprises in exploration and development of un-
worked potential areas.
4. The reserves of chemicals and fertilizer grade rock phosphate in India are very limited
and of low grade. Therefore, beneficiation of domestic low grade ore needs to be given
priority in addition to utilization of potash feldspar as an alternate to rock phosphate.
5. The total resources of potash are estimated at 21,815 million tonnes but there is no
production at all, mainly due to lack of investments required for deep drilling in exploration
and development of such potash deposits in Rajasthan.
6. The resources of refractory grade dolomite in the country are meagre and in short supply
as required by steel industry. Hence, identification of such dolomite deposits in the
country is necessary.
7. Search for new deposits of fluorspar needs to be intensified to meet the specification of
chemical industry or else the country will have to depend on imported fluorspar in the
coming years.
8. Though India has large reserves of fireclay but the high grade (37% Al2O3 and above)
clay is in short supply as required by refractory industry. In view of this, delineation of high
grade fireclay deposit needs to be done.

118
9. The graphite reserves having +40% fixed carbon are rather limited. It is therefore
necessary to develop cost effective beneficiation technologies to utilize the low grade ores
in the country.
10. There is large reserve base and surplus production of barytes, wollastonite, bentonite,
fuller’s earth, mica and soapstone / steatite in the country but the export potential remain
yet to be realized commensurate with the demand of these minerals in other countries. A
reassessment of mineable reserves and export potential needs to be carried out.
Small Mines
1. The Indian mining sector (non-fuel) consists of large number of small mines and their
contribution is significant in total mineral production of metallic and non-metallic minerals,
besides having export potential. But somehow, the production is nearly stagnant for the
want of capital required for expansion of the mining activity. The banks and financial
institutions are generally reluctant to give loans to small mine owners without having
heavy equipment and machinery and this is coming in the way of augmentation of mines
capacity. Therefore, some relaxation by the financial institutions to small mine owners
need to be considered based on the valuation of mineral reserves.
2. Large numbers of small miners are not able to employ qualified mining engineers and
geologists and this has led to unscientific mining in number of cases in violation of MMDR
Act and rules. The respective state governments and Indian Bureau of Mines may have to
be proactive in this regard.
3. There is a large number of non-working mines in various mining belts in the country due
to uneconomic working, high stripping ratio, grade and recovery constraints and also
forest and environment clearances and poor infrastructure facilities. A critical analysis of
small mining sector to address various reasons behind non-working and dormant situation
of small mines needs to be undertaken by the state governments.
4. Though the National Mineral Policy (NMP 2008) has envisaged cluster mining approach
in small mines but the same remains unimplemented. Operation of cluster mining over
large mineralized areas like limestone, dolomite, bauxite, slate, clay belts, can be
considered in respect of following identified type areas – a) Indrawad – Jaitaram
Chinaclay belt in Nagaur district, Rajasthan; b) Kolayat - Mudh-kotri – Guda fireclay belt in
Bikaner district, Rajasthan; c) Quartz feldspar mica belt of Ajmer - Bhiwara in Rajasthan;
d) China clay belt of Singhbhum district in Jharkhand; e) Graphite mines in Bolangir
districts, Odisha; f) Jangir – Chopa lime stone belt in Chhattisgarh; g) Limestone of katni –
Jhukehi and Satna belt in Madhya Pradesh and Bhagokot area of Karnataka; i) Bauxite

119
leases in Jamnagar and Kutch districts in Gujarat; j) Limestone mines in Yeotmal district
and Western Ghat bauxite in Maharashtra; k) Soapstone and Baryties mines in Andhra
Pradesh; and l) Gypsum and quartz- feldspar mines in Tamil Nadu.
5. A mechanism for amalgamation of small leases into one single lease needs to be evolved
along with the modalities for some relaxation in forest and environment clearance. It is
noteworthy that till 2010, small mines of less than 5 hectare areas were exempted from
environmental clearances. The same rule needs to be applicable again.
6. Granting of very small leases by sub dividing of a large deposit should be avoided by the
state governments in the interest of mineral conservation and minimum land degradation.
7. The minimum area for grant of a mining lease for major mineral needs to be enhanced to
10 hectares

120
About FICCI
Established in 1927, FICCI is the largest and oldest apex business organization in India. Its
history is closely interwoven with India's struggle for independence, its industrialization, and its
emergence as one of the most rapidly growing global economies. FICCI has contributed to this
historical process by encouraging debate, articulating the private sector's views and influencing
policy. A non-government, not-for-profit organization, FICCI is the voice of India's business and
industry.
FICCI draws its membership from the corporate sector, both private and public, including SMEs
and MNCs; FICCI enjoys an indirect membership of over 2, 50,000 companies from various
regional chambers of commerce.
FICCI provides a platform for sector specific consensus building and networking and as the first
port of call for Indian industry and the international business community.
Our Vision
To be the thought leader for industry, its voice for policy change and its guardian for effective
implementation
Our Mission
� To carry forward our initiatives in support of rapid, inclusive and sustainable
growth that encompasses health, education, livelihood, governance and skill
development
� To enhance efficiency and global competitiveness of Indian industry and
� To expand business opportunities both in domestic and foreign markets through
a range of specialized services and global linkages
Mines and Metals Division at FICCI
The Mines and Metals Division at FICCI endeavors to support the mining and metal industries
(both steel and non-ferrous metals) in India as well as for the global players looking to foray into
the Indian markets. It is strongly committed to provide a platform for industry players to raise
their voices over a number of points covering investments, operations, issues & future
roadmaps to the decision making authorities. The key contacts for the division are
Name: Arpan Gupta
Senior Assistant Director, FICCI
Tel: 011-23487564
Mob: +91 9810572331
Email: [email protected]
Name: Arnab Kumar Hazra
Director, FICCI
Tel: 011-23487291
Mob: +91 9958599032
Email: [email protected]