mining; leveraging from backward and forward … · 2bnbn 3 mining background note mining;...
TRANSCRIPT

September 2013BACKGROUND NOTE
Mining; leveraging from backward and forward linkages for diversified growth
and wealth creation

2 Mining
BN Background Note
FDI Foreign Direct Investment
MCTI Ministry of Commerce Trade and Industry
SME Small Medium Enterprise
IMF/WB International Monetary Fund and World Bank
UNECA United Nations Economic Commission for Africa
UNIP United Nations Independence Party
GDP Gross Domestic Product
ZCCM Zambia Consolidated Copper Mines
MMD Movement for Multi-Party Democracy
Prepared by: Agatha Siwale (Head of Research and Analysis) with the Support of Michelle Morel (Executive Director), Salim Kaunda, (Head of Monitoring & Evaluation),Chileshe Chaunga (Research) Brian Sambo Mwila (Communication Specialist) & Masuzyo Mtawali (Communication Specialist)
ABBREVIATIONS

3Mining
Mining Background Note
Mining; leveraging from backward and forward linkages for diversified growth and wealth creation

4 Mining
Zambia is the seventh largest producer of copper and is among the largest pro-ducers of cobalt worldwide (The World Copper Fact Book, 2012, See Figure 1). Zambia is also richly endowed with other mineral deposits including gold, ura-nium, gemstones and coal (Nyambe and Phiri, 2010). The mining sector has thus been the key driver of Zambia’s economy dating back to the colonial era. In 2012, mining accounted for up to 80% foreign exchange earnings and attract-ed Foreign Direct Investment (FDI) worth up to US$991 million (World Bank, 2012) making Zambia one of the fastest growing economies in the world at a 7.3% growth rate (ibid, 2012).
Zambia is richly endowed with substantial mineral wealth and yet con-tinues to be ranked among the poorest countries in the world. In order fully realize its mining potential, Zambia must adopt comprehensive, development-driven policies that move beyond a narrow focus on cop-
per to other minerals and effectively link mining to the other economic sec-tors. This would lead to significant poverty reduction and sustainable job and wealth creation.
BACKGROUND NOTE
Chile
China
Peru
United States
Australia
Russian Fed
Zambia
Canada
Indonesia
Mexico
Congo
Poland
Kazakhstan
Iran
Brazil
Papua New Guinea
Laos
Mongolia
Argentina
Bulgaria
0 1000 2000 3000 4000 5000
Thousand metric tonnes
Co
un
try
Co
pp
er P
rod
uct
ion
Source: The World Copper Fact Book, 2012
Figure 1: Copper Mine Production by Country: Top 2011 (Thousand metric tonnes)
5Mining
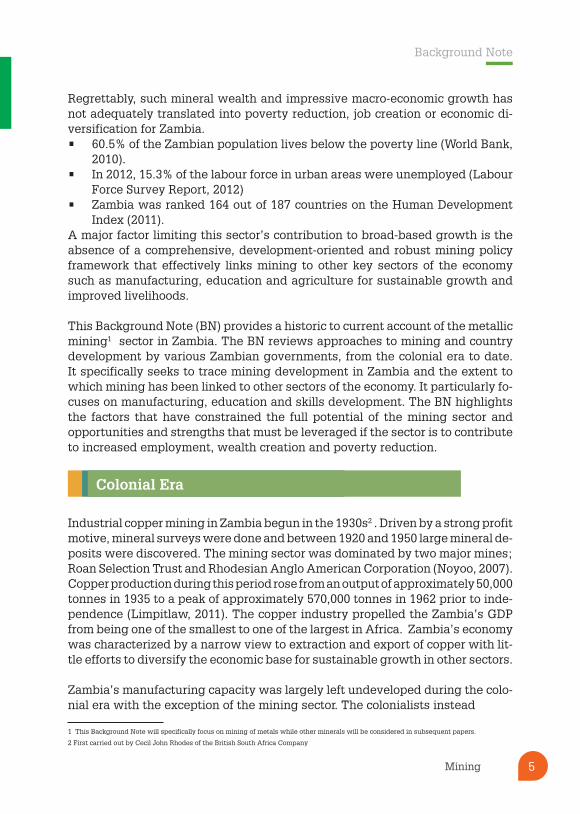
Regrettably, such mineral wealth and impressive macro-economic growth has not adequately translated into poverty reduction, job creation or economic di-versification for Zambia. • 60.5% of the Zambian population lives below the poverty line (World Bank,
2010). • In 2012, 15.3% of the labour force in urban areas were unemployed (Labour
Force Survey Report, 2012)• Zambia was ranked 164 out of 187 countries on the Human Development
Index (2011). A major factor limiting this sector’s contribution to broad-based growth is the absence of a comprehensive, development-oriented and robust mining policy framework that effectively links mining to other key sectors of the economy such as manufacturing, education and agriculture for sustainable growth and improved livelihoods.
This Background Note (BN) provides a historic to current account of the metallic mining1 sector in Zambia. The BN reviews approaches to mining and country development by various Zambian governments, from the colonial era to date. It specifically seeks to trace mining development in Zambia and the extent to which mining has been linked to other sectors of the economy. It particularly fo-cuses on manufacturing, education and skills development. The BN highlights the factors that have constrained the full potential of the mining sector and opportunities and strengths that must be leveraged if the sector is to contribute to increased employment, wealth creation and poverty reduction.
Colonial Era
Industrial copper mining in Zambia begun in the 1930s2 . Driven by a strong profit motive, mineral surveys were done and between 1920 and 1950 large mineral de-posits were discovered. The mining sector was dominated by two major mines; Roan Selection Trust and Rhodesian Anglo American Corporation (Noyoo, 2007). Copper production during this period rose from an output of approximately 50,000 tonnes in 1935 to a peak of approximately 570,000 tonnes in 1962 prior to inde-pendence (Limpitlaw, 2011). The copper industry propelled the Zambia’s GDP from being one of the smallest to one of the largest in Africa. Zambia’s economy was characterized by a narrow view to extraction and export of copper with lit-tle efforts to diversify the economic base for sustainable growth in other sectors.
Zambia’s manufacturing capacity was largely left undeveloped during the colo-nial era with the exception of the mining sector. The colonialists instead
1 This Background Note will specifically focus on mining of metals while other minerals will be considered in subsequent papers.
2 First carried out by Cecil John Rhodes of the British South Africa Company
BACKGROUND NOTE
Background Note
0 1000 2000 3000 4000 5000

6 Mining
focused of building the manufacturing capacity of Southern Rhodesia (Zimbabwe), which supplied Zambia with most manufactured commodities ex-cept for maize-meal, which was processed locally (Economist Intelligence Unit, 2003). There was therefore no deliberate focus on value-addition or the devel-opment of manufacturing capacity, that was derived from the mining process.
Similarly, the colonial administration neglected investment in education in Zambia. At independence, Zambia had only approximately 100 university grad-uates and less than 1,500 holders of a complete secondary school certificate (Mwanakatwe, 1968). This resulted in a very narrow educated workforce, which later failed to effectively operate the mining industry as well as other manufac-turing enterprises that were nationalized in the Second Republic (Grant, 2007).
The only linkages created to other sectors were those incidental to mining, For example infrastructure development and roads constructed were mainly for transportation of copper to export markets and not to link strategic locations within the country (UNECA, 2013). Mining activities did however lead to the development of five major towns in the Copperbelt; which became Zambia’s industrial hub. The economic health of these towns is nevertheless highly reli-ant on the mining industry.
Mining in the First and Second Republic
At independence, copper production rose to 640,000 tonnes from 570,000 tonnes in 1960 (Limpitlaw, 2011). Production however fell sharply in 1976 from 713,000 tonnes to 479,000 tonnes in 1985 (Karmiloff, 1988) (See Figure 2).
Figure 2: Copper Production (1960-1985)
Background Note
0
400
500
600
700
800
1960 1964 1976 1985
Cop
per P
rodu
ctio
n (T
onne
s)
Years
Copper Production (Tonnes)Source Adaped by PMRC from: Karmiloff (1988)

7Mining
Background Note
During the boom of copper prices in the early 60’s, 90% of the foreign exchange in the Zambian economy was attributed to copper and to a the lesser excent Zinc and Lead. Mining also contributed the largest share to GDP, at 37% in 1970 (See Figure 3) (Kamiloff, 1988). Figure 3: Sectorial-Contribution to GDP (1970) During the 1st Reuplic Industrialisation ranked high on the Government’s agen-da, which led to the adoption of the Import Substitution Industrialisation Strat-egy (ISI)3 . Government established the Zambia Industrial Mining Corporation (ZIMCO), an umbrella body to promote mining, manufacturing and service in-dustries in the country (Encyclopaedia Britannica, 2013). This was an attempt to restructure the economic base and create linkages between mining and oth-er sectors of the economy. Through provision of protective tariffs and state sub-sidies, manufacturing became one of the fastest growing sectors, at a 12.6% growth rate between 1964 and 1974 and increased its contribution to GDP from 6.3% to 12% during the same period (MCTI, 2007). This investment in manu-facturing was facilitated by increased Government revenues from high copper prices. However, ISI proved uncompetitive and unsustainable due to heavy re-liance on subsidies and costly importation of spare parts and inputs, which led to a drain on Government revenues and negative Balance of Payments. This unfavourable climate was worsened by high fuel costs and deteriorating terms of trade for primary products (drop in copper prices, See Figure 4 next page) on the global market.
3 A strategy in which Government sought to locally produce imported manufactured products mainly through assembly plants and adoption of turnkey technology
7% Construction
20% Other services incl. Govt.
11% Agriculture
1O% Wholesale & Retail Trade37% Mining,
quarrying, public utilities
4% Transport & Communications
10% Manufacturing
SECTORAL CONTRIBUTION TO GDP (1970)
Source Adaped by PMRC from: (World Bank cited in Kamiloff, 1988)
8 Mining
Background Note
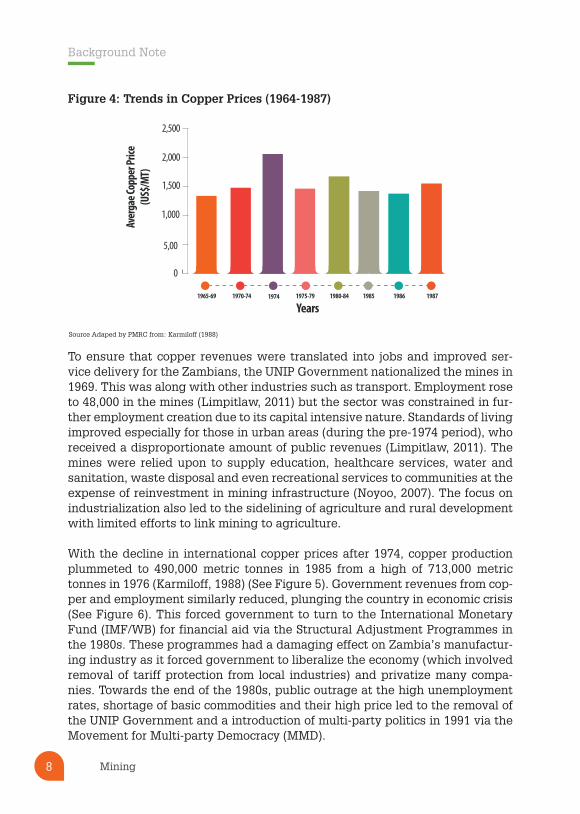
Figure 4: Trends in Copper Prices (1964-1987)
To ensure that copper revenues were translated into jobs and improved ser-vice delivery for the Zambians, the UNIP Government nationalized the mines in 1969. This was along with other industries such as transport. Employment rose to 48,000 in the mines (Limpitlaw, 2011) but the sector was constrained in fur-ther employment creation due to its capital intensive nature. Standards of living improved especially for those in urban areas (during the pre-1974 period), who received a disproportionate amount of public revenues (Limpitlaw, 2011). The mines were relied upon to supply education, healthcare services, water and sanitation, waste disposal and even recreational services to communities at the expense of reinvestment in mining infrastructure (Noyoo, 2007). The focus on industrialization also led to the sidelining of agriculture and rural development with limited efforts to link mining to agriculture.
With the decline in international copper prices after 1974, copper production plummeted to 490,000 metric tonnes in 1985 from a high of 713,000 metric tonnes in 1976 (Karmiloff, 1988) (See Figure 5). Government revenues from cop-per and employment similarly reduced, plunging the country in economic crisis (See Figure 6). This forced government to turn to the International Monetary Fund (IMF/WB) for financial aid via the Structural Adjustment Programmes in the 1980s. These programmes had a damaging effect on Zambia’s manufactur-ing industry as it forced government to liberalize the economy (which involved removal of tariff protection from local industries) and privatize many compa-nies. Towards the end of the 1980s, public outrage at the high unemployment rates, shortage of basic commodities and their high price led to the removal of the UNIP Government and a introduction of multi-party politics in 1991 via the Movement for Multi-party Democracy (MMD).
Source Adaped by PMRC from: Karmiloff (1988)
1965-69 19741970-74
Years
Aver
gae C
oppe
r Pric
e (U
S$/M
T)
1975-79 1980-84 1985 1986 1987
0
5,00
1,000
2,000
1,500
2,500

9Mining
Background Note
Attempts at promoting manufacturing and public service delivery through min-ing revenues during this era were largely unsustainable and did not diversify the economy away from copper mining. Improved public service delivery and employment heavily relied on mining revenues which, when withdrawn, led to high unemployment and a food crisis. Figure 5: Copper production in Zambia (1930-2010)
Figure 6: Employment in Copperbelt Mines (1930s - 2010)
Source: (Limpitlaw, 2011)
Source: (Limpitlaw, 2011)
700,000
600,000
500,000
400,000
300,000
200,000
100,000
0
1930 1940 1950 1960 1970 1980 1990 2000 2010
Empl
oym
ent L
evel
Colonial period
Independence
Nationalisation Privatisation
800,000
700,000
600,000
500,000
400,000
300,000
200,000
100,000
0
1930 1940 1950 1960 1970 1980 1990 2000 2010
Colonial period
Independence
Nationalisation Privatisation
Copp
er P
rodu
ctio
n (T
onne
s)
10 Mining
Background Note
Mining in the 3rd Republic
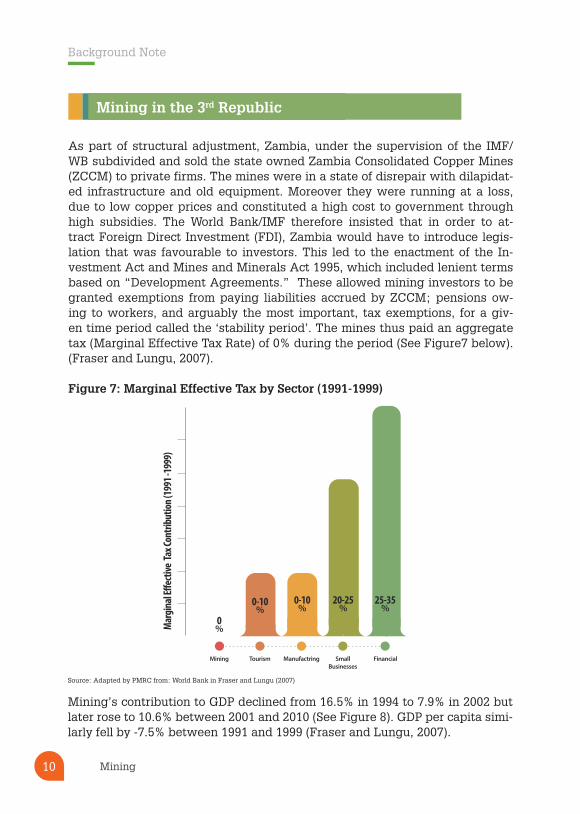
As part of structural adjustment, Zambia, under the supervision of the IMF/WB subdivided and sold the state owned Zambia Consolidated Copper Mines (ZCCM) to private firms. The mines were in a state of disrepair with dilapidat-ed infrastructure and old equipment. Moreover they were running at a loss, due to low copper prices and constituted a high cost to government through high subsidies. The World Bank/IMF therefore insisted that in order to at-tract Foreign Direct Investment (FDI), Zambia would have to introduce legis-lation that was favourable to investors. This led to the enactment of the In-vestment Act and Mines and Minerals Act 1995, which included lenient terms based on “Development Agreements.” These allowed mining investors to be granted exemptions from paying liabilities accrued by ZCCM; pensions ow-ing to workers, and arguably the most important, tax exemptions, for a giv-en time period called the ‘stability period’. The mines thus paid an aggregate tax (Marginal Effective Tax Rate) of 0% during the period (See Figure7 below). (Fraser and Lungu, 2007). Figure 7: Marginal Effective Tax by Sector (1991-1999) Mining’s contribution to GDP declined from 16.5% in 1994 to 7.9% in 2002 but later rose to 10.6% between 2001 and 2010 (See Figure 8). GDP per capita simi-larly fell by -7.5% between 1991 and 1999 (Fraser and Lungu, 2007).
Source: Adapted by PMRC from: World Bank in Fraser and Lungu (2007)
0%
Mining Tourism Manufactring SmallBusinesses
Sectors
Financial
Mar
gina
l E�e
ctive
Tax C
ontri
butio
n (19
91 -1
999)
0-10%
0-10%
20-25%
25-35%

11Mining
Background Note
Source: Adapted from Fraser and Lungu (2007) and MCTI, 2007
Figure 8: Contribution of Mining to GDP (1994 - 2010)
Privatization led to an immediate surge in unemployment with the loss of 23,000 jobs in mining between 1995 and 2000. Labour laws also had no clear direction on the employment of expatriate staff or differences in salary scales for local and expatriate staff; this encouraged companies to hire high-ly paid expatriates (Fraser and Lung, 2007). Although jobs were later creat-ed, employment rose to only 31,000 as opposed to the initial 45,000 before privatization (World Bank and UKAid, 2011). Moreover, the employment cre-ated was largely of low quality. It was characterized by casualization of la-bour, in which 45% of employees were placed on contractual employment, which denied them long-term employment benefits (Fraser and Lungu, 2007). Privatization did however lead to resuscitation of mining operations and in-creased production and profitability. Closed mines were reopened and recapi-talized and new investment led to the opening up of new mines. Moreover, in 2003, there was a global surge in copper prices, which has continued to date. Increased mining revenues did not however immediately translate into a com-mensurate increase in government revenues due to the continued enforcement of the Development Agreements. The high losses in tax revenue eventually triggered public disapproval and in 2008 led to the amendment of the mining tax regime to allow for increased mineral royalties and windfall tax (World Bank and UKAid, 2011). In 2009, Government proposed mining taxes of 47 % in view of expansion in mineral exploration by the mines and increased capacity. Only towards the end of 2010, did some mining companies begin to pay increased taxes having resisted in the first instance (ibid, 2011).
Cont
ribut
ion
of M
inin
g to
GDP
%
20
15
10
5
Contribution to GDP
1994 1997 2002 2010
Years

12 Mining
Background Note
Privatization did not significantly strengthen linkages between mining and other sectors of the economy. The contribution to GDP from manufactur-ing reduced to only 10% in 1995 from 15% in 1991 (Figure 9) (MCTI, 2007). Figure 9: Contribution of Manufacturing to GDP and Employment Levels (1991-1999)
Externalisation of profits was another factor that weakened investment in oth-er sectors. This was driven by the fact that the majority of the mines were bought by foreign companies therefore profits from mining were mostly ex-ternalised as opposed to being reinvested in growth of other sectors (Fraser and Lungu, 2007). Unlike ZCCM, which supported local producers, new mine owners depended on external suppliers for inputs. The preference for external suppliers was justified on the basis of high prices and low quality of locally produced inputs. Lack of capacity among local businesses to adequately meet mining demand is largely as a result of the lack of a deliberate policy strategy by Government to support local suppliers through protection of local industries, facilitation of effective technological skills transfer to Zambians or provision of incentives for production (Fraser and Lungu, 2007). Current Context
Currently, mining continues to play a central role in Zambia’s economy. Copper production rose from a low of 257,000 tonnes in 2000 to 819,574 tonnes in 2011 (2011 Annual Progress Report - SNDP, 2012) while cobalt production declined from 4,648 to 1,411 tonnes (Zambia Review 2012/13). Prices of copper on the in-ternational market also surged in recent years reaching an average of US $8,811 per tonne in 2011 from US$1,600 in 1999.
Source: Adapted by PMRC from: MCTI (2007)
0
2,000
4,000
6,000
8,000
10,000
Contribution to GDP from Manufacturing
Employment in Manufacturing
1991 1992 1993 1994
Years
Cont
ribut
ion of
Man
ufac
turin
g to
GDP a
nd Em
ploy
men
t
1995 1996 1997 1998 1999
15% 13.5%11.6%
9.7% 10%11.8% 11.6% 11.5% 10.8%

13Mining
Background Note
Figure 10: London Metal Exchange Prices, US$ per tonne of copper, annual averages, (1997 - 2005)
Copp
er P
rice P
er To
nne
4,000
3,500
3,000
2,500
2,000
1,500
1,000
500
0
1997 1998 1999 2000 2001 2002 2003 2004 2005
The sector has thus continued to be a major driver of economic growth with an average share of 9.1%GDP (2006-2009); foreign exchange contribution of 8.5% and 70.3% contribution to formal employment (Sixth National Develop-ment Plan, 2011-2015). The mining sector has also received up to US$5 billion in investments over the past decade (Zambia Review, 2012/13). However, while the mining sector has prospered, poverty levels in Zambia have remained high with only a 2.3% decline in poverty from 62.8% in 2006 to 60.5% in 2010(LCMS, 2010). Furthermore, even though mining has contributed to em-ployment growth in the formal sector, its potential contribution to other sectors is yet to be realized. This is especially evident considering the fact that approx-imately 300,000 graduates are released from higher education institutions into the labour market annually while 90% of Zambia’s labour force is in the informal sector. This implies a significant shortfall in terms of available jobs within the country. Zambia has also thus far largely failed to use the thriving copper sector to di-versify its economic base away from copper through effective use of linkag-es. The Economic Report on Africa, 2013, states that Zambia’s export product concentration index stands at 0.63, this indictes that Zambia is amongst the top quarter of African countries with the highest reliance on a single export. Zambia also showed the least amount of trade diversification (0.85) with more than 70% of exports flowing from a single export - copper (ERA Report, 2013). Opportunities for diversification and sustainable wealth creation however still
Source: (Fraser and Lungu, 2007)

14 Mining
Background Note
remain. Projections indicate that there will be continued high demand for cop-per leading to sustained high copper prices mainly due to urbanisation and growth in China and India. The continued investment in copper mining in Zam-bia and decline in global supply of copper are also likely to keep the price of copper high. This presents lucrative prospect for Zambia to formulate a policy strategy, which will maximise on these benefits (ERA Report, 2013).
Zambia also holds potential to utilize both backward/ up-steam linkages and forward/down-stream linkages along the mining value chain4, which it has failed to effectively do since the first Republic.
The first area requiring action is that expansion of mining activities themselves and of the levels of productivity in the mining sector. This is crucial in order to continue generating revenue, which can then be used for re-investment in other sectors (fiscal linkages).
The mining sector continues to be dominated by copper mining in spite of the presence of other mineral deposits within the country (See Fig-ure 11). Zambia for example imports steel and yet possesses in excess of 500 metric tonnes of iron. Zambia also has manganese deposits in the Luapula province, which could be used for battery manufacture (Nyam-be and Phiri, 2010). Such activities would help diversify the economy away from copper and would also create jobs and wealth for the country. Figure 11: Zambia’s Mineral Deposits
4 Up-stream /backward linkages refer to input supply relationships into mining at any point in the mining value chain (exploration,development, processing, refining and value addition) while forward linkages entail value addition and processing of commodities.
Source: Nyambe and Phiri (2010)
Copper/CobattGold
Lead ZincNickel
TinManganese
Iron
AquamarineEmerald
DiamondCoal
Oil,GasUrarium
Amethyst
N
Lusaka

15Mining
Investment in other metallic minerals is however constrained by the lack of ad-equate information on mineral availability. Even though Government has made efforts to increase the geologically mapped surface area of the country, much more remains to be done as only 58% of the country had been mapped by 2010 (See Figure 12 Below).
Figure 12: Geologically mapped regions in Zambia
The 2011 Annual Progress Report on the SNDP also shows that even though the target of establishing a mineral resource database was set in 2011, this was not done and only Luapula province was mapped out of a target of four quarters. Zambia therefore loses out on investment due to lack of accurate in-formation on mineral availability within the country.
The process of issuing licenses also needs to be expedited as the lack of li-censes prevents mining companies from beginning or proceeding with mining operations. The delays in issuing licenses may also lead to loss of employment for local workers if investors abandon the project and may also constitute a running cost to investors as projects may be required to run for a longer time frame than planned.
Another critical need is that of human capital development in Zambia. The Man-ufacturing Sector Survey of 2001-2002, revealed that 35% of manufacturing firms identified shortages in skilled manpower and low productivity as a major con-straint in business while 17% classified it as a ‘chronic problem.’ (MCTI, 2007). This calls for restructuring of the educational system particularly curricula at tertiary level to be more responsive to industrial needs thus strengthening the links between the two sectors.
Map and report published
Map and report in press
Mapping Completed
Current mapping
Map only published
Not map
ANGOLA
DEM. REP. CONGO
TANZANIA
MALAWI
N
MOZAMBIQUE
ZIMBABWE
NAMIBIA
Source: Nyambe and Phiri (2010)
Only58%
Only 58% of the country had been mapped by 2010

16 Mining
Background Note
Mining linkages to manufacturing have also remained low with regards to both supplying manufactured inputs to the mines or value addition. Mineral pro-cessing facilities, for instance, remained constant at twenty-two between 2009 and 2011 (2011 Annual Progress Reports, 2012). Moreover, Zambia only utilizes 25% of its manufacturing capacity (MCTI, 2007). On one hand, some scholars have argued that value addition beyond smelting and refining would not ben-efit Zambia significantly due to distance from markets and technological and skills limitations (Hausmann, 2008, World Bank, 2011).
However, promotion of local manufacturing capacity both in terms of ensuring access to financial resources by Small and Medium sized Enterprises (SMEs) and building their technical skills and administrative capacity to supply the mines with consumables is a viable option (World Bank, 2010). The SMEs would manufacture inputs for which they would have a ready market – the mines. Currently the mines incur significant expenses in importing inputs from abroad. While some of these imports are complex, hi-tech goods, which local producers lack capacity to produce, others are consumables, which local producers could manufacture, such as mill balls and other services.
Lastly, the high costs of doing business must be reduced to attract manufacturers to the industry. High costs of electricity, fuel, tariffs as well as acute skills shortage in the mining sector must be addressed to counter high labour and operational costs by mining companies.
Conclusion
Zambia’s mining sector holds considerable potential to boost self-sustaining growth in other sectors of the economy through employment and wealth crea-tion. Past governments in Zambia’s history have failed to adequately tap into this potential, future opportunities remain. Key aspects in forming linkages are a comprehensive policy framework that links education to industrial needs (hu-man capital development); build up of manufacturing capacity along the min-ing value chain; and increased geological mapping and exploration.
Bibliography
Economic Report on Africa (2013). Making the Most of Africa’s Commodities: Industrializing for Growth, Jobs and Economic Transformation. United Nations Economic Commission for Africa
Fraser and Lungu (2007). For whom the wind falls. Civil Society Trade Network of Zambia / Catholic Centre for Justice, Development and Peace.
Grant, W. D. (2007). Zambia: Reflections on Colonialism and After. Queen’s Quarterly 114.2 (Summer 2007): 224-235.
Source: World Bank Report – 2005 in MCTI, 2007
Net Total factor productivityv

17Mining
Haglund, D. (2013). Zambia Mining Sector Fiscal Benchmarking and Assessment. Ox-ford: Oxford Policy Management.Hausmann, R., Bailey K., and Robert L. (2008). Examining Beneficiation. CID Working Paper No. 162: Harvard University
International Labour Organisation. (2012). Decent Work Country Profile: Zambia. ILO
Karmiloff, I. (1988). Industrialisation in Sub-Saharan Africa: Country Case Study - Zambia. Sussex: Overseas Developme nt Institute.
Limpitlaw, D. (2011). Nationalisation and Mining: Lessons from Zambia. The Journal of The Southern African Institute of Mining and Metallurgy, Vol 111 , 737 - 739.
Ministry of Commerce Trade and Industry. (2007). Manufacturing Sector Survey 2000 – 2001 Final Report. Government of the Republic of Zambia.
Mwanakatwe, J. M. (1974). The Growth of Education in Zambia Since Independence. Oxford: Oxford University Press.
Nyambe, I and Phiri, C. (2010). Database of Mineral Resources of Zambia. Internation-al Workshop on UNFC-2009 (pp. 1-29). Warsaw: University of Zambia.
Osei-Hwedie, B. Z. ( 2003). Development Policy and Economic Change in Zambia: A Re-Assessment. DPMN Bulletin: Volume X, Number 2, April 2003.
Sixth National Development Plan. (2011-2015). Sustained Economic Growth and Pov-erty Reduction. Lusaka: Government of the Republic of Zambia.
The World Copper Fact Book 2012, International Copper Study Group
United Nations Economic Commission for Africa, African Union. (2011). Minerals and Africa’s Development. Au Conference of Ministers Responsible for Mineral Resources Development.
World Bank and UKAid. (2011). What Would it take for Zambia’s Copper Mining to Achieve its full Potential? World Bank/UKAid.
World Bank. (2011). What is the Potential for More Copper Fabrication in Zambia? World Bank, Report No. 62379-ZM
World Bank. (2013). Poverty Headcount ratio. World Bank Country DataThe World Bank Group.
World Bank. (2013). Zambia Overview. World Bank (http://www.worldbank.org/en/country/zambia/overview).
Zambia Review 2012/13 (13th Ed) (2013). Mining and Copperbelt. Lusaka: Directory Publishers of Zambia Ltd.

18 Mining
In the Mining Background Note (BN) entitled “Mining; leveraging from backward and forward linkages for diversified growth and wealth creation”, PMRC assesses the various approaches to mining and country development in Zambia from the colonial era to date. The BN identifies
Zambia’s significant mineral potential and economic benefits that have resulted from a thriving copper industry. However, it also illustrates that the mining sector has not attained its full potential on poverty reduction, diversified growth or job creation in Zambia. PMRC observes that the absence of a robust, comprehensive mining policy framework that effectively links mining, to other sectors of the economy such as manufacturing, education and skills training and agriculture has been a significant inhibitor to the attainment of full potential in the mining sector. In view of the foregoing
PMRC recommends the formulation of a decisive, comprehensive policy framework which; encourages diversification in the economy through
creation of strong backward and forward linkages between mining and other sectors; provides a clear strategy for human capital development in mining; provides for expansion of mining activities and increased productivity levels within the mining sector.
Mining; leveraging from backward and forward linkages for diversified growth and wealth creation
To read the PMRC Mining
Background Note please go to:

19Mining
MIN
ING;
LEVE
RAGI
NG FR
OM B
ACKW
ARD
AND
FORW
ARD
LINK
AGES
FOR
DIVE
RSIF
IED
GROW
TH A
ND W
EALT
H CR
EATI
ON

20 Mining
Unlocking Zambia's PotentialCorrespondence on this Background Note can be sent to:[email protected]
Policy Monitoring and Research Centre (PMRC)Plot No. 32 Sable Road, corner Bishop and Sable Roads, Kabulonga, Lusaka, ZambiaPrivate Bag KL 10Tel: +260 211 268 385 | +260 979 015 660
www.pmrczambia.org