development of si-o-c based ceramic matrix composites...
TRANSCRIPT

Development of Si-O-C Based Ceramic Matrix
Composites Produced via Pyrolysis of a Polysiloxane
By
Hatice Deniz AKKA�
A Dissertation Submitted to the
Graduate School in Partial Fulfillment of the Requirements for the Degree of
MASTER OF SCIENCE
Department: Materials Science and Engineering Major: Materials Science
�zmir Institute of Technology �zmir, Turkey
July, 2004

We approve the thesis of Hatice Deniz Akka�
Date of Signature
------------------------------------- 29.07.2004
Assoc. Prof. Dr. Metin Tano�lu
Supervisor
Department of Mechanical Engineering
------------------------------------- 29.07.2004
Prof. Dr. Muhsin Çiftçio�lu
Department of Chemical Engineering
------------------------------------- 29.07.2004
Assoc. Prof. Dr. Funda Tıhmınlıo�lu
Department of Chemical Engineering
------------------------------------- 29.07.2004
Prof. Dr. Muhsin Çiftçio�lu
Head of Department

ACKNOWLEDGEMENTS
I wish to express my sincere gratitude to my advisors Assoc. Prof. Metin
Tano�lu and Prof. M. Lütfi Öveço�lu for their supervisions, guidance, encouragement
and supports during the course of this thesis and in the experimental study. I
acknowledge the supports of The Scientific and Technical Research Council of Turkey
(TÜB�TAK) for the financial support for M�SAG 215 project. Finally, I would like to
thank my family for their understanding, encouragement and supports.

iv
ABSTRACT
The traditional ceramic processing techniques of CMCs such as hot pressing are
high-temperature, high-cost processes, and unsuitable for manufacturing complex and
near-net shapes. Fabrication of ceramic matrix composites (CMCs) from pyrolytic
conversion of preceramic polymers has gained considerable attention in recent years
due to their unique combination of low temperature processing, applicability of versatile
plastic shaping technologies and microstructural control capabilities.
In the present work, phenyl (PPS) and methyl (PMS) containing polysiloxanes
were pyrolyzed at elevated temperatures (900-1500oC) without filler addition under
argon atmosphere to investigate the thermal conversions and phase formations in the
polymer matrix. X-Ray diffraction (XRD) and Infrared spectroscopy (FTIR) techniques
were used for this purpose. It was found that pyrolysis of the polymers under inert
atmosphere up to 1300oC lead to amorphous silicon oxycarbide (SiOxCy) ceramics.
Conversions at higher temperatures caused the transformation into the crystalline β-SiC
phases. % Weight changes of the samples without filler addition were also followed by
measuring the masses before and after pyrolyzation of the samples.
CMC monoliths were fabricated with the addition of 60-80 wt% active and inert
fillers by hot pressing under 15 MPa pressure and pyrolysis at elevated temperatures
between 900-1500oC under inert argon and reactive nitrogen atmosphere. Effects of the
filler type and ratio, pyrolysis temperature and atmosphere on the phase formations
were investigated by using XRD, SEM-EDX and TGA techniques. The results showed
that with the incorporation of active Ti fillers, formation of TiC, TiSi, and TiO within
the amorphous matrix occurred due to the reactions between the Ti and the polymer
decomposition products. However, no new phase development was observed in the case
of inert SiC particulate addition. SEM-EDX analysis was also performed to monitor the
new phase formations. Mass loss and densification values of the CMCs were measured
to investigate the effect of active filler controlled polymer pyrolysis process (AFCOP).
Weight changes were considerably affected in the case of addition of the fillers into the
ceramic structure due to the reduction of the polymer ratio in the composite systems and
the reactions between polymer and filler particles. As an example weight loss of 27 %
was measured for PPS samples without filler addition, while 17 % weight reduction was
measured for PMS without filler addition after pyrolysis at 1500oC. On the other hand,

v
it was found that for the composite systems the weight loss values were reduced to 2 %.
Mechanical property characterization of samples with and without filler addition was
done by Vickers Indentation tests. It was found that ceramics that is the product of the
pyrolysis of the polymer without filler addition exhibited the maximum hardness values
(8.88 GPa for neat PPS, 10.67 GPa for neat PMS) at 1100oC, which is the optimum
temperature for crack free samples with the least amount of porosity. Also, the
composite system exhibited the hardness values up to 14 GPa.

vi
ÖZ
Sıcak preseme gibi seramik matriks kompozitlerin (CMC) geleneksel üretim
yöntemleri, yüksek sıcaklık gerektiren yüksek maliyetli yöntemlerdir ve kompleks ve
son net �ekle benzer yapıların üretimi için uygun de�illerdir. CMClerin önseramik
polimerlerin pirolitik dönü�ümü ile üretimleri, son zamanlarda, dü�ük sıcaklık, çok
yönlü plastik �ekillendirme yöntemlerinin uygulanabilirli�i ve mikroyapısal kontrol
kolaylı�ı gibi özgün kombinasyonlarına ba�lı olarak artan bir önem kazanmı�tır.
Bu çalı�mada, fenil (PPS) ve metil (PMS) ihtiva eden polisiloksanlar
polimerlerin ısıl dönü�ümleri ve faz olu�umlarının incelenmesi için dolgu malzemesi
ilave edilmeden, artan piroliz sıcaklıklarında (900-1500oC) ve argon atmosferinde
üretilmi�tir. Bu amaç için X-ı�ınları kırınımı (XRD) ve kızılötesi spektroskopisi (FTIR)
yöntemleri kullanılmı�tır. Bunun sonucunda, inert atmosferde 1300oC’ye kadar
gerçekle�en pirolizin amorf silikon oksikarbür (SiOxCy) seramiklerine yol açtı�ı
gözlenmi�tir. Daha yüksek sıcaklıklardaki dönü�üm β-SiC kristallerinin olu�umuna
sebep olmu�tur. Piroliz öncesi ve sonrası kütlelerin ölçülmesi ile % a�ırlık de�i�imleri
takip edilmi�tir.
CMC kompozitler a�ırlıkça % 60-80 arasında de�i�en aktif ve inert dolgular
ilave edilerek 15 MPa basınçta sıcak preslemeyle üretilmi� ve inert argon ve reaktif azot
atmosferinde 900-1500oC arasındaki sıcaklıklarda piroliz edilmi�lerdir. Dolgu tipi ve
oranının, piroliz sıcaklı�ı ve atmosferin faz olu�umlarına etkileri XRD, SEM-EDX ve
TGA yöntemleriyle incelenmi�tir. Sonuçlar göstermi�tir ki, Ti gibi aktif bir dolgu
maddesinin kullanılması sonucu bunun polimerin bozunma ürünleri ile reaksiyonuna
ba�lı olarak amorf matriks içerisinde TiC, TiSi, ve TiO olu�mu�tur. Ancak inert SiC
ilavesi durumunda yeni faz olu�umu gözlenmemi�tir. SEM-EDX analizleri bu faz
olu�umlarının saptanmasında kullanılmı�tır. Aktif dolgu kontrollü polimer piroliz
(AFCOP) tekni�inin etkilerini incelemek için CMClerin kütle kaybı ve yo�unluk artı�ı
de�erleri ölçülmü�tü. Kütle de�i�imleri seramik yapılara dolgu ilave edilerek polimer
oranının dü�mesi ve dolgu malzemesi ile polimer arasındaki reaksiyonlara ba�lı olarak
belirgin �ekilde etkilenmi�tir. Dolgusuz PPS örnekleri için % 27’lik, dolgusuz PMS için
ise % 17’lik bir kütle kaybı 1500oC’de pirolizlenen örneklerde ölçülmü�tür. Di�er
yandan kompozit sistemlerinde bu de�erin % 2’lere kadar dü�tü�ü görülmü�tür. Kütle
de�i�imlerinin ölçülmesinde ısıl analiz yöntemleri (TGA) de kullanılmı�tır. Katkısız ve

vii
dolgu ilave edilmi� örneklerin mekanik karakterizasyonları Vickers Sertlik testleri ile
yapılmı�tır. Bunun sonucunda, dolgusuz seramikler maksimum sertlik de�erlerine
(dolgusuz PPS için 8.88 GPa, dolgusuz PMS için 10.67 GPa) çatlaksız ve en az gözenek
içeren örneklerin üretildi�i optimum sıcaklık olan 1100oC’de ula�ılmı�tır. Kompozit
sistemlerde ise sertlik de�erleri 14 GPa kadar çıkmı�tır.

viii
TABLE OF CONTENTS
LIST OF FIGURES .......................................................................................................... x
LIST OF TABLES.........................................................................................................xiii
Chapter 1 INTRODUCTION......................................................................................... 1
Chapter 2 CERAMICS .................................................................................................. 3
2.1 Advanced Ceramics ........................................................................................ 3
2.1.1 Properties of Advanced Ceramics.................................................... 4
2.1.2 Types of Advanced Ceramic Materials ........................................... 5
2.1.3 Applications of Advanced Ceramics ............................................... 7
Chapter 3 CERAMIC PROCESSING TECHNIQUES.................................................. 8
3.1 Conventional Ceramic Processing Techniques............................................... 8
3.1.1 Glass Forming Processes ................................................................. 9
3.1.2 Cementation ................................................................................... 10
3.1.3 Particulate Forming Processes ....................................................... 10
3.1.3.1 Powder Pressing (Dry Pressing) ..................................... 10
3.1.3.2 Hydroplastic Forming ..................................................... 11
3.1.3.3 Slip Casting..................................................................... 11
3.2 Noval Ceramic Processing Techniques ........................................................ 12
3.2.1 Sol-Gel Process.............................................................................. 13
3.2.2 Polymer Pyrolysis .......................................................................... 14
3.2.2.1 Preceramic Polymers ...................................................... 17
3.2.2.2 Pyrolysis Chemistry of Polysiloxane Precursors ............ 19
3.2.3 Active Filler Controlled Polymer Pyrolysis................................... 23
Chapter 4 EXPERIMENTAL ...................................................................................... 26
4.1 Materials ....................................................................................................... 26
4.2 Processing of Neat Silicon Oxycarbide Ceramics ........................................ 26
4.3 Processing of Composite Monoliths ............................................................. 27

ix
4.4 Monitoring of Thermal Conversion of Polysiloxanes and
Characterization of Ceramics........................................................................ 28
4.4.1 X-Ray Diffraction Method................................................................... 28
4.4.2 Scanning Electron Microscopy (SEM) ................................................ 28
4.4.3 Infrared Spectroscopy (FTIR).............................................................. 29
4.4.4 Thermal Analysis (TGA-DTA) ........................................................... 29
4.4.5 Optical Microscopy.............................................................................. 29
4.4.6 Determination of Mass Losses and Densities ...................................... 29
4.4.7 Vickers Indentation Tests .................................................................... 30
Chapter 5 RESULTS AND DISCUSSIONS............................................................... 31
5.1 Thermal Conversion of Polysiloxane ........................................................... 31
5.2 Microstructural Features of Si-O-C Based Ceramic Composites................. 35
5.3 Thermal Transformations, Ceramic Yield and Mass Losses ........................ 43
5.4 Mechanical Behavior of SiOC Based Composites ....................................... 52
Chapter 6 CONCLUSIONS......................................................................................... 54
REFERENCES ............................................................................................................... 56

x
LIST OF FIGURES
Figure 3.1 A classification scheme for the ceramic-forming techniques ....................8
Figure 3.2 Glass forming by (a) Pressing, (b) Blowing...............................................9
Figure 3.3 Powder Pressing by (a) Uniaxially, (b) Isotactically..................................11
Figure 3.4 Slip Casting Process...................................................................................12
Figure 3.5 Formation steps of sol-gel glass.................................................................13
Figure 3.6 Sol-Gel pechnologies and their products ...................................................14
Figure 3.7 Synthesis of Silicon oxycarbide and oxynitride glasses from
polysiloxane precursors .............................................................................17
Figure 3.8 Depolymerization reactions in linear polysiloxanes by
redistribution of Si-OSi/Si- OSi bonds (a) or by nucleophilic
attack of terminal silanols (b) ....................................................................19
Figure 3.9 Examples of thermal depolymerization products of cross-linked
polysiloxanes containing Me2SiO (D) and SiO2 (Q) units (a) or
containing MeSiO1.5 (T) units (b) ..............................................................19
Figure 3.10 Condensation reactions involving silanols ................................................20
Figure 3.11 Redistributions involving the exchange of Si-C or Si-H bonds
with Si-O-Si bonds: (a) Schematic representation (silsesquioxane
units); (b) Formation of SiH4 by successive Si-H/Si-O
redistribution steps from a HSiO1.5 gel; (c) Formation of
Me3SiOSiMe3 by successive Si-Me/Si-O redistribution steps
from a MeSiO1.5 gel ...................................................................................21
Figure 3.12 Mineralization step: (a) formation of gases and generation of �Si·
and �C· free radicals; (b) formation of CSi4 tetrahedra
(methylated precursor) ...............................................................................22
Figure 3.13 Carbothermal reductions of silica (a) and SiOxCy glasses (b, c)................22
Figure 3.14 Effect of active/inert filler addition on final ceramic structure..................24
Figure 4.1 Ceramic composite processing with PPS and PMS preceramic
polymers.....................................................................................................26
Figure 4.2 A typical pyrolysis schedule ......................................................................27

xi
Figure 5.1 X-ray diffraction patterns of the poly(phenyl)siloxane (PPS)
without filler addition pyrolyzed under Ar at various
temperatures................................................................................................31
Figure 5.2 X-ray diffraction patterns of the poly(methyl)siloxane (PMS)
without filler addition pyrolyzed under Ar at 1500oC ...............................32
Figure 5.3 FTIR of the poly(methyl)siloxane (PMS) without filler addition
after polymerization at 220oC and pyrolysis under Ar at
various temperatures ..................................................................................33
Figure 5.4 Fracture surface SEM images of PPS samples without filler
addition pyrolysed at (a) 900oC, (b) 1200oC, (c) 1400oC, (d)
1500oC .......................................................................................................34
Figure 5.5 Fracture surface SEM images of PMS samples without filler
addition pyrolysed at (a) 1100oC, (b) 1300oC, (c) 1500oC ........................35
Figure 5.6 SEM micrographs of 70 wt% Ti /PMS system before pyrolysis
(a) SE image (b) BSE image......................................................................36
Figure 5.7 SEM micrographs of 70 wt% Ti /PPS system (a) before pyrolysis
(b) pyrolyzed under Ar at 1100oC..............................................................36
Figure 5.8 X-ray diffraction patterns of 60 wt% Ti /PPS pyrolyzed under Ar
at various temperatures ..............................................................................38
Figure 5.9 X-ray diffraction patterns of 60 wt% SiC /PPS pyrolyzed under
Ar at various temperatures .........................................................................38
Figure 5.10 X-ray diffraction patterns of 80 wt% Ti /PPS pyrolyzed under Ar
at various temperatures ..............................................................................39
Figure 5.11 X-ray diffraction patterns of 80 wt% Ti /PPS pyrolyzed under N2
at various temperatures ..............................................................................39
Figure 5.12 X-ray diffraction patterns of 60 wt% Ti /PMS pyrolyzed under
Ar at various temperatures .........................................................................40
Figure 5.13 Fracture surface SEM micrograph of 80wt% Ti filled CMC
monolith prepared from Ti/PMS bodies at 900oC .....................................41
Figure 5.14 Fracture surface SEM micrograph of 80wt% Ti filled CMC
monolith prepared from Ti/PMS bodies at (a) 1100oC (b) 1300oC
(c) 1500oC ..................................................................................................42
Figure 5.15 Weight changes values as a function of pyrolysis temperature for
samples of 0, 60, 70, 80 wt% Ti added PPS ..............................................43

xii
Figure 5.16 Weight changes values as a function of pyrolysis temperature for
samples of 0, 60, 70, 80 wt% Ti added PMS.............................................44
Figure 5.17 Weight change values as a function of pyrolysis temperature for
samples of 0, 60, 70, 80 wt% Si added PPS ..............................................45
Figure 5.18 Weight change values as a function of pyrolysis temperature for
samples of 0, 60, 70, 80 wt% SiC added PMS ..........................................45
Figure 5.19 Fracture surface SEM micrograph of (a) 80wt% Ti (b) 80 wt%
SiC filled PPS precursor pyrolyzed at 1300oC...........................................46
Figure 5.20 TGA micrographs of neat, 80wt% Ti, 60 wt% of Ti and 60
wt%Al2O3 filled PPS precursor pyrolyzed up to 1300oC under N2
atmosphere .................................................................................................46
Figure 5.21 Weight change values as a function of pyrolysis temperature for
samples of PPS without filler addition and 80 wt% Ti and Al2O3
added PPS pyrolyzed under N2 atmosphere...............................................47
Figure 5.22 Density values for the samples prepared with addition of 60, 70,
80wt% Ti into PPS as a function of pyrolysis temperature .......................48
Figure 5.23 Density values for the samples prepared with addition of 60, 70,
80wt% Ti into PMS as a function of pyrolysis temperature ......................49
Figure 5.24 Density values for the samples prepared with addition of
80wt%Ti, Si, SiC, and Al2O3 into PPS as a function of pyrolysis
temperature ................................................................................................50
Figure 5.25 SEM polished surface micrographs of 80 wt% active Ti filled
PPS pyrolyzed at various temperatures (a) 900, (b) 1100, (c)
1300, (d) 1500°C........................................................................................51
Figure 5.26 SEM polished surface micrographs of 80 wt% active Ti filled
PMS pyrolyzed at various temperatures (a) 900, (b) 1100, (c)
1300, (d) 1500°C........................................................................................51
Figure 5.27 Vickers hardness values as a function of pyrolysis temperature
for neat ceramics and composites made with various Ti added
PPS precursor.............................................................................................52
Figure 5.28 Vickers hardness values as a function of pyrolysis temperature
for neat ceramics and composites made with various Ti added
PMS precursor ...........................................................................................53

xiii
LIST OF TABLES
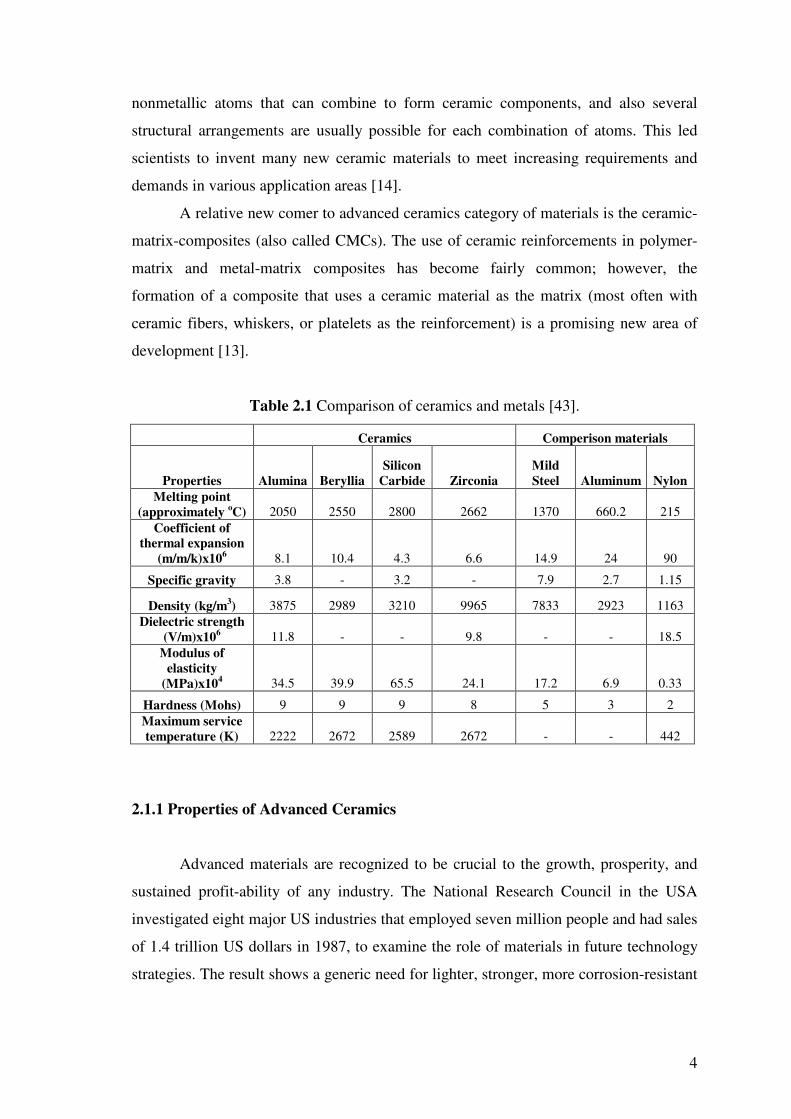
Table 2.1 Comparison of ceramics and metals ........................................................4
Table 2.2 Properties of some advanced ceramics produced in Kyocera
Industrial Ceramic Corporation ...............................................................6
Table 2.3 Current and future products for advanced ceramics ................................7
Table 3.1 Ceramic products manufactured from basic polymeric
precursors...............................................................................................18
Table 3.2 Pyrolysis products and yields ................................................................18
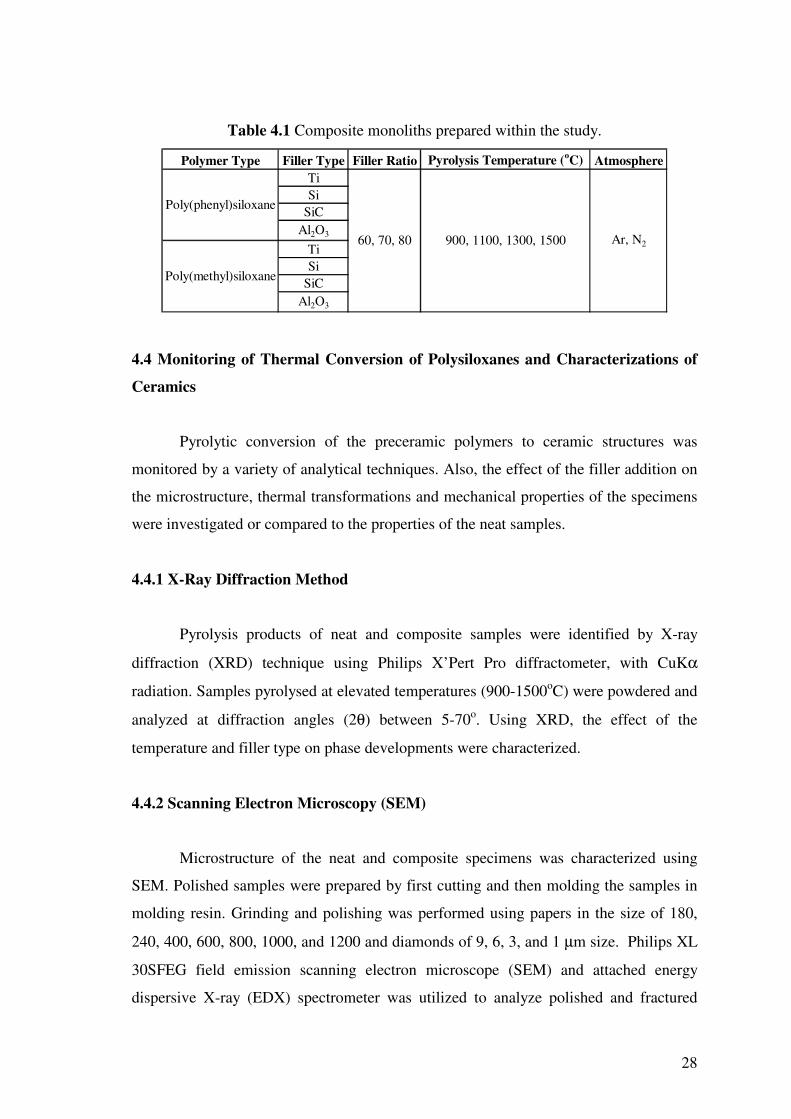
Table 4.1 Composite monoliths processed prepared within the study...................28
Table 5.1 SEM-EDX analysis of PPS samples without filler addition
pyrolysed at elevated temperature .........................................................34
Table 5.2 Elemental distributions along the line between two adjacent
Ti rich particulates for 80 wt% Ti filled CMC monolith
prepared from Ti/PMS bodies at 900oC.................................................41
Table 5.3 Elemental distributions at different regions of samples shown
in Figure 5.14.........................................................................................42
Table 5.4 Density values of some metals and ceramics.........................................49
Table 5.5 Vickers hardness values of some ceramic structures.............................53

1
CHAPTER 1
INTRODUCTION
There is a great interest for low cost, low temperature (<1000oC), near-net-shape
ceramic-matrix-composites (CMCs). The traditional processing techniques of CMCs
such as hot pressing are high-temperature, high-cost processes, and unsuitable for
manufacturing complex and near-net-shapes. Ceramic and CMC manufacturing from
pyrolytic conversion of preceramic polymers has gained considerable attention in recent
years due to their unique combination of low temperature processing, applicability of
versatile plastic shaping technologies and microstructural control capabilities. These
materials have potential applications such as lightweight high temperature structural
materials, fibers, catalyst supports, and anodes in lithium ion rechargeable batteries.
Poly(silanes), -(carbosilanes), -(silazanes) and -(siloxanes) have been the most
studied preceramic precursors because of their commercial availability and high
ceramic yields. Silicon oxycarbide glasses that contain silicon atoms bonded to oxygen
and carbon randomly are a group of materials that can be produced by pyrolysis of some
specific preceramic precursors. The replacement of part of the divalent oxygen atoms of
silica by tetravalent carbon atoms leads to an improvement in the thermomechanical
properties [1-4]. Substitution of oxygen in silica glass with carbon is not feasible
through conventional glass melting techniques due to their high processing temperatures
(1600-1800oC). However, it may be obtained via pyrolysis of the preceramic polymers
[3].
Main drawback of the polymer pyrolysis technique is the manufacturing of crack
free bulk ceramic components. Due to inherent density increase by outgassing of the
organic matter, extensive shrinkage that causes the formation of pores and cracks may
occur. To compensate this effect and to control shrinkage and crack formation, a
relatively new concept, active filler controlled polymer pyrolysis process (AFCOP) has
been developed [5-7]. This concept became a scope of many other researches, recently
[3, 8-11]. According to this method, the polymer is partially filled with inert or active
powder particles in order to decrease the shrinkage and to allow the fabrication of bulk,
crack free ceramics. By incorporation of the active fillers, reaction between the particles
and the precursor occurs, which typically results in a volume expansion of the reaction
product, as compared to the starting compounds. This expansion counteracts the

2
shrinkage during densification and can lead to near-net shaped crack-free components.
Suitable active fillers are elements or compounds such as Al, B, Si, Ti, CrSi2, MoSi2,
etc. to obtain carbide, nitride or oxide reaction products.
The objective of the present study is to develop ceramic composites from the
pyrolysis of two preceramic polymers; poly(phenyl)siloxane and poly(methyl)siloxane
with the addition of the active (Ti) and inert (SiC) fillers. Another objective is to
investigate the effect of polymer and filler type, filler concentration and pyrolysis
temperature on the microstructure, phase development, densification, mass losses and
hardness values of the composites.
In the present work, phenyl and methyl containing siloxanes were pyrolyzed
without filler addition under argon atmosphere at temperatures between 900-1500oC and
thermal conversions and phase formations of the samples was monitored using X-Ray
diffraction and infrared spectroscopy techniques. Microstructural features of the neat
samples were investigated using SEM micrograph coupled with EDX analyzer. Weight
changes of the neat samples were followed by measuring the masses before and after
pyrolysation of the samples. CMC composite monoliths were also fabricated with the
addition of 60-80 wt % active and inert fillers by hot pressing under 15 MPa pressure
and pyrolysis at elevated temperatures between 900-1500oC under inert argon and
reactive nitrogen atmospheres. Effects of filler type and weight fraction, pyrolysis
temperature and atmosphere on the phase formations were investigated. SEM-EDX
analysis was also performed to monitor the new phase formations. Mass losses and
densification behavior of the CMCs were measured to investigate the effect of AFCOP.
Thermal Analysis (TGA) was also performed for measuring the mass changes of the
samples. Mechanical characterization of the samples with and without filler addition
was done by Vickers Indentation tests.

3
CHAPTER 2
CERAMICS
The term “ceramic” comes from the Greek word keramikos, which means “burnt
earth”, indicating that desirable properties of these materials are normally achieved
through a high temperature heat treatment process called firing. Most ceramics are
compounds between metallic and nonmetallic elements for which the interatomic bonds
are either totally ionic or predominantly ionic but having some covalent character. Up
until the past 40 or so years, the most important materials in this class were termed the
“traditional ceramics”, those for which the primary raw material is clay; products
considered to be traditional ceramics are china, porcelain, bricks, tiles, and, in addition,
glasses and high temperature ceramics. Of late, significant progress has been made in
understanding the fundamental character of these materials and of the phenomena that
occur in them that are responsible for their unique properties. Consequently, a new
generation of these materials has evolved, and the term “ceramic” has taken on a much
broader meaning [12].
2.1 Advanced Ceramics
The new and emerging family of ceramics are referred to as advanced, new or
fine, and utilize highly refined materials, often using new forming techniques, special
firing treatments, and frequently requiring extensive finishing and testing before being
placed in use [13]. These “new” or “advanced” ceramics, when used as an engineering
material, posses several properties which can be viewed as superior to metal-based
systems that are listed in Table 2.1.
The advance of ceramics technology drew on experience from metallurgical
technologies. In the nineteenth and twentieth centuries, there appeared in the
marketplace a wide variety of new types of building materials with superior durability,
strength, and other properties. These included brick, tile piping for drainage systems and
roofing, sanitary ware and refractory (high-temperature) insulation materials which
served as furnace linings for glass, steel, and other industries dependant on high-
temperature processing of new materials. There are many combinations of metallic and
4
nonmetallic atoms that can combine to form ceramic components, and also several
structural arrangements are usually possible for each combination of atoms. This led
scientists to invent many new ceramic materials to meet increasing requirements and
demands in various application areas [14].
A relative new comer to advanced ceramics category of materials is the ceramic-
matrix-composites (also called CMCs). The use of ceramic reinforcements in polymer-
matrix and metal-matrix composites has become fairly common; however, the
formation of a composite that uses a ceramic material as the matrix (most often with
ceramic fibers, whiskers, or platelets as the reinforcement) is a promising new area of
development [13].
Table 2.1 Comparison of ceramics and metals [43].
Ceramics Comperison materials
Properties Alumina Beryllia Silicon
Carbide Zirconia Mild Steel Aluminum Nylon
Melting point (approximately oC) 2050 2550 2800 2662 1370 660.2 215
Coefficient of thermal expansion
(m/m/k)x106 8.1 10.4 4.3 6.6 14.9 24 90
Specific gravity 3.8 - 3.2 - 7.9 2.7 1.15
Density (kg/m3) 3875 2989 3210 9965 7833 2923 1163 Dielectric strength
(V/m)x106 11.8 - - 9.8 - - 18.5 Modulus of
elasticity (MPa)x104 34.5 39.9 65.5 24.1 17.2 6.9 0.33
Hardness (Mohs) 9 9 9 8 5 3 2 Maximum service temperature (K) 2222 2672 2589 2672 - - 442
2.1.1 Properties of Advanced Ceramics
Advanced materials are recognized to be crucial to the growth, prosperity, and
sustained profit-ability of any industry. The National Research Council in the USA
investigated eight major US industries that employed seven million people and had sales
of 1.4 trillion US dollars in 1987, to examine the role of materials in future technology
strategies. The result shows a generic need for lighter, stronger, more corrosion-resistant

5
materials capable of withstanding high temperatures. Ceramic materials are the leading
candidates for meeting these requirements.
There has been great interest shown in advanced or high technology ceramic
materials among scientists, policymakers, and corporations in recent years. Varieties of
ceramic materials, which hold remarkable properties able to meet the need for high end
applications, have appeared. In general terms, advanced ceramics exhibit exceptional
properties that make them highly resistant to melting, bending, stretching, corrosion or
wear. Their hardness, physical stability, high mechanical strength at high temperature,
stiffness, low density, optical conductivity, radiation resistance, extreme heat resistance,
chemical inertness, biocompatibility, superior electrical properties and, not least, their
stability for use in mass produced products make them one of the most versatile groups
of materials in the world. [15] Today, there are a wide range of advanced ceramics
including oxides, carbides, nitrides, borides, silicates and glass ceramics and composite
(ceramic matrix (CMC), and carbon-carbon (CCC)) materials. The most commonly
used are alumina, zirconia, silicon nitride, silicon carbide, steatite, cordierite and many
more –each with their own particular performance characteristic and benefits. New
materials are being developed all the time in response to the challenges posed by new
and changing applications [14].
2.1.2 Types of Advanced Ceramic Materials
Alumina is the most widely used advanced ceramic material. It offers very good
performance in terms of wear resistance, corrosion resistance and strength at a
reasonable price. Its high dielectric properties are beneficial in electronic products.
Silicon nitride exceeds other ceramic materials in thermal shock resistance. It also offers
an excellent combination of low density, high strength, low thermal expansion and good
corrosion resistance and fracture toughness. Silicon carbide has the highest corrosion
resistance of all the advanced ceramic materials. It also retains its strength at
temperatures as high as 1400°C and offers excellent wear resistance and thermal shock
resistance. Zirconia has the highest strength and toughness at room temperature of all
the advanced ceramic materials. The fine grain size allows for extremely smooth
surfaces and sharp edges [16]. Single crystal sapphire offers superior mechanical
properties and chemical stability coupled with light transmission [42]. Some
specifications of these materials can be seen in Table 2.2.

6
Table 2.2 Properties of some advanced ceramics produced in Kyocera Industrial
Ceramic Corporation [42].
Material Silicon Nitride (Si3N4)
Silicon Carbide
(SiC)
Zirconia (ZrO2
Alumina (Al2O3) Aluminum
Nitride AlN
Kyocera No. SN-220
SN-235P
SC-211
SC-1000 Z-201N A-
479 A-
479G 99.9%
Alumina 99.95% Alumina AN2000 AN2170
Color Black Gray Black Black Ivory 99% White
99.5% Ivory
99.9% Ivory
99.95% white Ivory Brown
Bulk Density — 3.2 3.2 3.2 3.16 6.0 3.8 3.8 3.95 3.95 3.2 3.4 Water
Absorption % 0 0 0 0 0 0 0 0 0 0 0
Vickers Hardness Load 500g
GPa 13.7 14.2 23.5 24.0 12.3 16.2 17.6 17.6 20.6 10.0 10.0
R.T. kg/mm2 MPa
60 590
69 676
55 539
49 480
100 *980
31 *304
33 *323
50 *490
60 *588
27 267
35 343
800° kg/mm2 MPa
61 600
69 676 — — 42
*412 28
*274 — — — 25 246 —
1000° kg/mm2 MPa
52 510
60 600
48 470
49 480
28 *274
18 *176 — — — 24
235 —
1200° kg/mm2 MPa
33 323
40 392
40 392
49 480
17 *167 — — — — 21
208 —
1300° kg/mm2 MPa
12 117 — — — — — — — — — —
Flexural Strength (4-point Bending *3-point Bending)
1400° kg/mm2 MPa — — 36
353 49
480 — — — — — — —
Fracture Toughness (K1C)M.I
MPa�m 5.7 5.9 5.6 — 6.7 — — — — 3.1 1.8
Young's Modulus
R.T. x106psi
GPa 43
294 43
294 63
431 63
430 30
206 50
343 53
363 56
391 56
391 43
298 44
304
Poisson's Ratio R.T. — 0.28 0.28 0.16 0.17 0.31 0.25 0.23 0.23 0.23 0.24 0.24
40-400°C 2.6 2.6 4.0 3.9 10.5 7.1 7.1 — — 5.0 4.8 Coefficient
of Linear Thermal
Expansion 40-
800°C
(x106/°C 3.2 3.1 4.4 4.5 11.0 7.9 7.9 — — — 5.4
cal/cm • sec • °C 0.05 0.06 0.15 0.31 0.009 0.06 0.06 0.08 0.09 0.22 0.41 Thermal
Conductivity R.T. W/m •
K 21 25 63 130 4 25 25 33 37 91 170
Specific Heat R.T.
cal/g • °C 0.16 0.16 0.15 0.16 0.12 0.19 0.19 0.19 0.19 0.18 0.18
Heat Shock Resistance �T °C 550 670 400 300 300 300 — — — 290 350
Volume Resistivity R.T. � • cm >1014 >14 8x10¹⁴ 103 2x10¹² >1014 >1014 >1014 >1014 >1014 >1014

7
2.1.3 Applications of Advanced Ceramics
Ceramics applications could be categorized as structural ceramics, electrical
ceramics, ceramic composites, and ceramic coatings. Current and future advanced
ceramic products tabulated in Table 2.3. Today, advanced ceramics have been widely
used in wearing parts, seals, low weight components and fuel cells in transportation
industry, to reduce the weight of product, increase performance especially at high
temperatures, prolong the life cycle of a product and improve the efficiency of
combustion [17]. To provide some insight into the spectrum of special characteristics
and sophisticated applications of advanced ceramics, three important types – structural
ceramics, electronic ceramics, and optical ceramics – will be discussed in some details.
Table 2.3 Current and future products for advanced ceramics [14].
Mechanical Engineering Aerospace Automotive Defense industry
Cutting tools and dies Fuel systems and valves Heat engines Tank power trains
Abrasives Power units Catalytic converters Submarine shaft seals Precise instrument
parts Low weight components Drivetrain components Improved armors
Molten metal filter Fuel cells Turbines Propulsion systems Turbine engine
components Thermal protection systems Fixed boundary recuperators Ground support vehicles
Low weight components for rotary
equipment Turbine engine components Fuel injection components Military weapon systems
Wearing parts Combustors Turbocharger rotors Military aircraft (airframe and engine)
Bearings Bearings Low heat rejection diesels Wear-resistant precision bearings
Seals Seals Waterpump seals Solid lubricants Structures
Biological, Chemical processing
engineering
Electrical, Magnetic Engineering Nuclear industry
Artificial teeth, bones and joints Memory element Nuclear fuel
Catalysts and igniters Resistance heating element Nuclear fuel cladding Heart valves Varistor sensor Control materials
Heat exchanger Integrated circuit substrate Moderating materials
Reformers Recuperators
Multilayer capacitors Advanced multilayer integrated
packages Reactor mining
Refractories Nozzles
Oil industry Electric power generation Optical Engineering Thermal Engineering Bearings Bearings Laser diode Electrode materials
Flow control valves Ceramic gas turbines Optical communication cable
Heat sink for electronic parts
Pumps High temperature components Heat resistant translucent porcelain
High-temperature industrial furnace lining
Refinery heater Fuel cells (solid oxide) Light emitting diode Blast sleeves Filters

8
CHAPTER 3
CERAMIC PROCESSING TECHNIQUES
3.1 Conventional Ceramic Processing Techniques
Similar to other engineering materials, ceramics have also some limitations in
applications, due to their high brittleness and poor workability. There have been
intensive research efforts in this field and great progress has been achieved over the past
three decades. A scheme for the several types of ceramic-forming techniques is
presented in Figure 3.1
Ceramic Fabrication Techniques
Glass FormingProcesses
Particulate FormingProcesses
Cementation
Pressing Blowing Drawing Fiber forming
Powderpressing
Hydroplasticforming
SlipCasting
Hot Uniaxial Isotactic
Drying
Firing
Ceramic Fabrication Techniques
Glass FormingProcesses
Particulate FormingProcesses
Cementation
Pressing Blowing Drawing Fiber forming
Powderpressing
Hydroplasticforming
SlipCasting
Hot Uniaxial Isotactic
Drying
Firing Figure 3.1 A classification scheme for the ceramic-forming techniques [12].
Many of the metal forming operations rely on casting and/or techniques that
involve some form of plastic deformation. Since ceramic materials have relatively high
melting temperatures, casting them is normally impractical. Furthermore, in most
instances the brittleness of these materials precludes deformation. Some ceramic pieces
formed from powders (or particulate collection) must ultimately be dried and fired.
Glass shapes are formed at elevated temperatures from a fluid mass that hardens and
assumes a permanent set by virtue of chemical reactions. Cements are shaped by placing

9
into forms a fluid that hardens and assumes a permanent set by virtue of chemical
reactions.
3.1.1 Glass Forming Processes
Glass is produced by heating the raw materials to an elevated temperature above
which melting occurs. Most commercial glasses are of the silica-soda-lime variety. Four
different forming methods are used to fabricate glass products: pressing, blowing,
drawing, and fiber forming [18]. Pressing is used in the fabrication of relatively thick-
walled pieces such as plates and dishes (Figure 3.2). The glass piece is formed by
pressure application in a graphite-coated cast iron mold having the desired shape; the
mold is ordinarily heated to ensure an even surface. Blowing is completely automated
for the production of glass jars, bottles, and light bulbs [12]. From a raw gob of glass, a
parison, or temporary shape, is formed by mechanical pressing in a mold. This piece is
inserted into a finishing or blow mold and forced to conform to the mold contours by
the pressure created from a blast of air. Drawing is used to form long glass pieces such
as sheet, rod, tubing, and fibers, which have constant cross section [18].
(a) (b)
Figure 3.2 Glass forming by (a) Pressing, (b) Blowing [47].

10
3.1.2 Cementation
Several familiar ceramic materials are classified as inorganic cements: cement,
plaster of paris, and lime, which, as a group, are produced in extremely large quantities.
The characteristic feature of these materials is that when mixed with water, they form a
paste that subsequently sets and hardens [12]. Portland cement is consumed in largest
tonnages. It is produced by grinding and intimately mixing clay and lime-bearing
minerals in the proper proportions, and then heating the mixture to about 1400oC in a
rotary kiln: this process is sometimes called calcinations, produces physical and
chemical changes in the raw material. The resulting “clinker” product is then ground
into a very fine powder to which is added a small amount of gypsum (CaSO4-2H2O) to
retard the setting process. This product is Portland cement, including setting time and
final strength; to a large degree depend on its composition [46].
3.1.3 Particulate Forming Processes
3.1.3.1 Powder Pressing (Dry Pressing)
Ceramic ware can be formed under high pressure from powders with relatively
low moisture content or often with no moisture at all. The degree of compaction is
maximized and fraction of void space is minimized by using coarse and fine particles
mixed in appropriate proportions [18]. There are three basic powder pressing procedure.
The forming technique, in which powder is compacted in a metal die by pressure
applied in one direction, is called uniaxial pressing (Figure 3.3a). It is an inexpensive
process with high production rates; however, only simple shapes are possible. In
isotactic pressing powdered material is contained in a rubber envelope and the pressure
is applied in all directions with same magnitude (Figure 3.3b). More complicated shapes
are possible than with uniaxial pressing; however, it is more time consuming and
expansive. Both uniaxial and isotactic pressing finishes with drying and firing
operations [46]. With hot pressing, the powder pressing and heat treatment are
performed simultaneously. This is an expensive fabrication technique that has some
limitations. It is costly in terms of time, since both mold and die must be heated and
cooled during each cycle. In addition, the mold is usually expensive to fabricate and
ordinarily has a short lifetime [13].

11
(a) (b) Figure 3.3 Powder Pressing by (a) Uniaxially, (b) Isotacticly [47].
3.1.3.2 Hydroplastic Forming
Clay minerals, when mixed with water, become highly plastic and pliable and
may be molded without cracking; however, they have extremely low yield strengths.
The water-clay ratio of the hydroplastic mass must give yield strength sufficient to
permit a formed ware to maintain its shape during handling and drying. Extrusion is the
most common hydroplastic forming technique. A stiff plastic ceramic mass is forced
through a die orifice. Constant cross-section is a must. Brick, pipe, ceramic blocks, and
tiles are all commonly fabricated by this method [18].
3.1.3.3 Slip Casting
A slip is a suspension of clay and/or other nonplastic materials in water. When
pored into a porous mold (commonly made of plaster of paris), water from the slip is
absorbed into the mold, leaving behind a solid layer on the mold wall that the thickness
of which depends on the time (Figure 3.4). This process may be continued until the
entire mold cavity becomes solid, or it may be terminated when the solid shell wall
reaches the desired thickness, by inverting the mold and pouring out the excess slip. In
slip casting, production rates and dimensional precision are low. Slip must have high
specific gravity, be very fluid and porable, cast must be free of bubbles. Products have
low drying shrinkage and high strength [13].

12
Figure 3.4 Slip Casting Process [47].
3.2 Novel Ceramic Processing Techniques
Advanced ceramics have well-known disadvantages. It is difficult to fabricate
them reproducibly because they are brittle, sensitive to microcracking and difficult to
machine. Properties of the products are dependent on the purity and physical
characteristics of raw materials. Small changes in processing parameters significantly
affect their final properties. Traditional advanced ceramic processing techniques require
high temperature that is why they are high cost processes and it is hard to produce
complex and near-net-shapes. Novel processing techniques which operates at the lower
processing temperatures and have potential to easy controlling of improved properties
of final products with complex shapes has been essential to be developed. Sol-Gel and
polymer pyrolysis techniques are the most recent techniques. Formation of ceramic
materials from Si containing polymers has gained a considerable attention due to their
unique combination of high purity precursor materials, applicability of versatile plastic
shaping technologies and low manufacturing temperatures. Silicon oxycarbide glasses
that contain silicon atoms bonded to oxygen and carbon randomly are a group of
materials that can be produced by pyrolysis of sol-gel derived precursors or from
polymer resins. The replacement of part of the divalent oxygen atom of silica by
tetravalent carbon atom leads to an improvement in thermomechanical properties.

13
3.2.1 Sol-Gel Process
The sol-gel process allows synthesizing ceramic materials of high purity and
homogeneity by utilization of techniques different from the traditional process of fusion
of oxides. This process occurs in liquid solution of organometallic precursors (TMOS,
TEOS, Zr(IV)-Propoxide, Ti(IV)-Butoxide, etc.) by means of hydrolysis and
condensation reactions (described in Equation 3.1), lead to the formation of a new phase
(SOL).
M-O-R + H2O → M-OH + R-OH (hydrolysis)
M-OH + HO-M→ M-O-M + H2O (water condensation)
M-O-R + HO-M → M-O-M + R-OH (alcohol condensation) (3.1)
(M = Si, Zr, Ti)
The SOL is made of solid particles of a diameter of few hundred of nm
suspended in a liquid phase. Then the particles condense in a new phase (GEL) in which
a solid macromolecule is immersed in a liquid phase (solvent). Drying the GEL by
means of low temperature treatments (25-100 C), it is possible to obtain porous solid
matrices (XEROGELs). Heat treatment at temperatures higher than 600oC forms dense
ceramic structures from xerogels (Figure 3.5) [45].
Figure 3.5 Formation steps of sol-gel glass [45].
The fundamental property of the sol-gel process is that it is possible to generate
ceramic material at a temperature close to room temperature. Therefore, such a
procedure opened the possibility of incorporating soft dopants, such as fluorescent dye
molecules and organic cromophores in these glasses [19]. Thin films can be produced

14
on a piece of substrate by spin-coating or dip-coating. When the "sol" is cast into a
mold, a wet "gel" will form. With further drying and heat-treatment, the "gel" is
converted into dense ceramic or glass articles. If the liquid in a wet "gel" is removed
under a supercritical condition, a highly porous and extremely low density material
called "aerogel" is obtained. As the viscosity of a "sol" is adjusted into a proper
viscosity range, ceramic fibers can be drawn from the "sol". Ultra-fine and uniform
ceramic powders are formed by precipitation, spray pyrolysis, or emulsion techniques
(Figure 3.6) [45].
Figure 3.6 Sol-Gel Technologies and Their Products [45].
3.2.2 Polymer Pyrolysis Process
Pyrolysis of polymeric precursor is another way of formation of ceramic
structures at low temperatures. Si-containing polymers [R1….2,Si(C,N,B,O)0.5…..1.5]
where R is an organic functional group (for example alkyl, aryl, etc. group) are used for
these processes. Cross-linked poly(silanes), -(carbosilanes), -(silazanes), -(siloxanes)
and their molecular mixtures are mostly used precursors with high ceramic yields (more
than 50 wt% of the initial polymer weight are retained in the ceramic residue) [5].
Polymer pyrolysis technique offers several advantages over conventional melt

15
processing, as the control of the shape and purity of the final ceramic. In addition, the
relatively low temperatures required in these processes allow the preparation of
metastable phases. For example, silicon oxycarbide and oxynitride glasses are
amorphous materials, characterized by a mixed environment of the silicon atoms, which
may be bonded simultaneously to oxygen and carbon in oxycarbide glasses or to oxygen
and nitrogen in oxynitride glasses. The replacement of part of divalent oxygen atom of
silica by tetravalent carbon atoms or trivalent nitrogen atoms leads to an improvement
in the thermomechanical properties. However, because of high temperature degradation
reactions and the metastability of these glasses, conventional melt processing is not
appropriate for their preparation. On the other hand, the pyrolysis under argon or
ammonia of polysiloxane precursors offers a convenient route to respectively silicon
oxycarbide and oxynitride glasses (Figure 3.7) [2, 3, 20].
Polymer pyrolysis process can be used in manufacturing a variety of materials as
novel binders for ceramic powders, Stuart and co-workers studied on polysilazanes for
synthesizing Si3N4 as binder. The use of traditional, fugitive binders allows for void
formation during binder burn off, while the use of binders with high ceramic yields may
allow the more facile attainment of high density in the ceramic [23].
For matrix formation in fiber reinforced ceramic composites, ceramic matrix
composites are expected to play an important a role in high temperature applications as
polymeric matrix composites do at low to medium temperature. The development of
cost effective processing techniques remains the key challenge. Processing routes such
as slurry infiltration, melt infiltration, chemical vapor infiltration, gas melting reaction,
sol-gel and polymer pyrolysis are available for the fabrication of long fiber CMCs.
Polymer pyrolysis has been successfully used for fabrication of advanced fibers, such as
carbon fiber, silicon carbide fiber and Si-C-N fiber. This technique is also suitable for
producing matrices for CMCs, and is particularly attractive as it involves a pressureless
pyrolysis process without high pressure sintering. Polysilazanes with backbone Si-N is a
desirable candidate for fabrication of Si3N4 ceramic matrix composites. The chemistry
and pyrolytic characteristics of polysilazanes with proper molecular structure and good
control of processing parameters can successfully lead to the fabrication of Si3N4 based
composites [24, 25].
For production of coatings, Kawamura et. al. [21] used silicon carbide coatings
on a thin high purity of alumina film which was produced from aluminum alkoxide.
This alumina film was treated with a polycarbosilane solution and heat treated at

16
1200oC. The bending strength of the coated alumina film was improved and no
electrical resistivity change was observed in the thickness direction [21]. Goerke and
co-workers used Si-based inorganic polymers because of their good dissolving
properties in an organic solution and exhibiting a sufficiently low viscosity to be
processed by spraying. Polymer spraying process has been developed to generate
ceramic coatings on different materials by spraying a precursor solution and subsequent
pyrolysis. The use of polymer solutions was more successful as compared to polymer
melting because of too fast polymerization [22].
Production of ceramic foams was studied by Colombo and co-workers. Porous
silicon oxycarbide (SiOC) ceramics in particular bulk and cellular structures were
produced via polymer pyrolysis. By using optimal pyrolysis parameters (i.e., heating
rate, maximum temperature), the addition of either solid fillers or chemically active
additives is efficient in preventing the collapse of pore structure and controlling pore
formation through a loss of specific surface area at temperatures above 600oC, whereas
slow pyrolysis is able to preserve mesopores up to 1200oC combined with high surface
areas. They also investigated the mechanical properties of the ceramic foams obtained
through a novel process that uses the direct foaming and pyrolysis of preceramic
polymer/polyurethane solutions. The elastic modulus, flexural strength, and
compressive strength were obtained for foams in the as-pyrolyzed condition; values up
to 7.1 GPa, 13 MPa, and 11 MPa, respectively, were obtained. The strength of the foam
was virtually unchanged at temperatures up to 1200oC in air; however, long-term
exposure at 1200oC led to a moderate degradation in strength, which was attributed to
the evolution of intrastrut porosity during the oxidation of residual free carbon, as well
as devitrification of the foam struts. The electric properties of the foams was another
scope of Colombo and his co-workers’. The electric properties of the foams were varied
by adding suitable fillers to the precursor mixture in amounts up to 80 wt%. The
electrical conductivity of the foams was varied by several orders of magnitude. The
effect of the type of the filler and preceramic polymer (methylsiloxane or
methylphenylsiloxane resins), as well as the used filler precursor, on the properties of
the ceramic foams were investigated. While SiC, C, and MoSi2 fillers increased the
electrical conductivity even at high filler loadings (9-30 wt%) the presence of copper
species led to a dramatic increase of the electrical conductivity even at very small filler
loadings (~1 wt%). The presence of copper species seems to affect the carbon structure,
which then would play a role in the conduction mechanism [26-28].

17
Figure 3.7 Synthesis of silicon oxycarbide and oxynitride glasses from polysiloxane
precursors [2].
3.2.2.1 Preceramic Polymers
Inorganic Si-based polymers (silanes, siloxanes, silazanes, carbosilanes, etc.)
have been the most commonly studied materials in research. These precursors have
polymer constitution in which the desired covalent bonds are already persisting in the as
synthesized state and remain in the system through the whole process. The polymer
processing has the advantage to avoid any type of powder and their associated problems
like agglomerates, particle packing, heterogeneities and high-sintering temperatures.
Basically Si-polymers are thermoset materials which start with a comparably short
chain precursor and than undergo a network formation either due to heating, radiation,
or catalysis. The material is then no longer meltable or soluble but it is still a polymer.
Pyrolysis changes the entire molecular structure due to a loss of side groups which
leaves an amorphous inorganic glassy material behind [22]. The composition and
structure of the glasses depend on the composition and the structure of the precursors
and on the reactions that take place during the pyrolysis step. Polymers used in different
research and their products are given in Table 3.1.

18
Table 3.1 Ceramic products manufactured from basic polymeric precursors.
Polymer Precursors Ceramic Products References
Polycarbosilane [ -R2SiCH2 -]n SiC(O) [29-31]
Polysilazane [ -RSiNH1.5 -]n Si3N4(C) [32-35]
Polysiloxane [ -RSiO1.5 -]n SiO2, SiC, C 2,5,20,36-39
Polyborosilazane [ -N(BR)2SiR2 -]n SiBNxC 40, 41
Polysiloxanes have received particular attention as polymeric precursors of
silicon oxycarbide glasses (SiCxOy), because this class of polymers provides an easy
and inexpensive route to the formation of such materials [20]. The design of a good
precursor (that is a precursor leading in high yields to glass with the desired
composition) requires an extensive knowledge of the pyrolysis chemistry of
polysiloxanes. Table 3.2 shows some of the precursors pyrolysis products and yields
[48].
Table 3.2 Pyrolysis products and yields [48].
Max. Yield (wt%) Precursor Products Calcd. Obsd.
Carborane-Siloxane (Dexsil, 202) SiC/B4C 64.5 60 Carborane-Siloxane (Ucarsil) SiC/B4C 64.5 70
1,1,1,2,3,3,3-Heptamethyl-2-vinyltrisilane SiC 60 50 Polyfurfuryl alcohol ester Glassy Carbon 60 50
Poly(borodiphenyl)siloxane SiC/B4C 43 43 Ammonioborane BN 81 65 Boronylpyridine B4C 27 22
Alkalenetrisilazane SiC/Si3N4 20 10 Tetraphenylsilane SiC 50 6
N,N-Diphenyltetraphenylcyclodisilazane SiC/Si3N4 15 5 Diphenyldipropenylsilane SiC 15 3
Triphenylvinylsilane SiC 69 2 Carborane B4C 78 2
Phenyltrimethylsilane SiC 27 1 Triphenylsilane SiC 15 1
N-6,9-Bis(trimethylsily)adenine SiC/Si3N4 33 1 Triphenylboron B4C 23 <1
Trimethylaminoborine BN/B4C - 0
Bis(diethylamino)dimethylilane Si3N4/SiC - 0
Polydimethylsilane SiC - 0
1,1,3,3-Tetramethyldisilazane Si3N4/SiC - 0
Tetramethylammonium tetrahydroborate BN/B4C - 0

19
3.2.2.2 Pyrolysis Chemistry of Polysiloxane Precursors
The pyrolysis of linear polysiloxanes usually leads to zero or poor ceramic
yields. This may be ascribed to the occurrence of depolymerization reactions (Figure
3.8), involving the redistribution of Si-OSi/Si-OSi bonds or the nucleophilic attack of
silanols, which lead to the formation of volatile cyclic oligomers. Conversely, highly
cross-linked polysiloxanes lead to much higher ceramic yields. In this case, the
depolymerization reactions are hindered by the lack of mobility of the chains (Figure
3.9). Moreover, several depolymerization steps are required to fragment the polymer
network, and the fragments formed are of low volatility.
Figure 3.8 Depolymerization reactions in linear polysiloxanes by (a) redistribution of
Si-OSi/Si- OSi bonds or (b) nucleophilic attack of terminal silanols [2].
Figure 3.9 Examples of thermal depolymerization products of cross-linked polysiloxanes
containing (a) Me2SiO (D) and SiO2 (Q) units or (b) MeSiO1.5 (T) units [2].

20
Most of the polysiloxane gel precursors contain residual silanol groups, which
certainly play an important part in the depolymerization, as in linear polysiloxanes,
unless they are consumed before this step. Apart from Si-OH/Si-OH condensation,
leading to the formation of siloxane linkages and water (Figure 3.10(a)), these silanols
may be consumed by condensation with Si-R groups (Figure 3.10(b)). The cleavage of
Si-H bonds by this reaction takes place above 250oC, the cleavage of Si-Ph bonds above
ca. 300oC, as in linear PMPS. On the other hand, the cleavage of aliphatic Si-C bonds
by Si-OH apparently requires a much higher temperature, above 500oC.
Figure 3.10 Condensation reactions involving silanols [2].
The increased thermal stability of cross-linked polysiloxanes permits the
occurrence of redistribution reactions involving the exchange of Si-O bonds with Si-H
bonds (above 300oC) or Si-C bonds (above 500oC). These reactions are characterized by
the formation of new siloxane units SiOxX4-x (readily evidenced by 29Si NMR), as
illustrated in Figure 3.10(a) for a silsesquioxane gel. It is noteworthy that heating at
500oC a gel built of D and Q units leads to the formation of T units, which illustrates the
reversibility of such reactions. Successive redistribution steps may lead to the formation
of volatile silicon compounds, such as SiH4 in the case of HSiO1.5 gels, or Me3SiOSiMe3
in MeSiO1.5 gels (Figure 3.10(b) and (c)).
At high temperature (between 500 and ca. 1000oC), reactions involving the
cleavage of Si-C, C-C and C-H bonds occur, leading to the escape of hydrocarbons and
hydrogen and to the formation of an inorganic material. The formation of the gases may
be accounted for by simple mechanisms, involving the formation of free-radicals by
homolytic bond-cleavage, followed by hydrogen abstraction, combination or
rearrangement (Figure 3.12(a)).

21
Figure 3.11 Redistributions involving the exchange of Si-C or Si-H bonds with Si-O-Si
bonds: (a) Schematic representation (silsesquioxane units); (b) Formation of SiH4 by
successive Si-H/Si-O redistribution steps from a HSiO1.5 gel; (c) Formation of
Me3SiOSiMe3 by successive Si-Me/Si-O redistribution steps from a MeSiO1.5 gel [2].
At high temperature (between 500 and ca. 1000oC), reactions involving the
cleavage of Si-C, C-C and C-H bonds occur, leading to the escape of hydrocarbons and
hydrogen and to the formation of an inorganic material. The formation of the gases may
be accounted for by simple mechanisms, involving the formation of free-radicals by
homolytic bond-cleavage, followed by hydrogen abstraction, combination or
rearrangement (Figure 3.12(a)). The formation of the residue is much more complex,
and only general trends may be given. As long as hydrogen atoms are abundant, the
most probable reaction is hydrogen abstraction. As the temperature increases, the
hydrogen atoms become less and less abundant, due to the escape of H2 and
hydrocarbons, and the rate of bond cleavage increases. The probability of combination
between Si and C free-radicals becomes more and more important, producing an
increase of the cross-linking around Si and C atoms. Successive bond cleavages,
combinations and rearrangements gradually lead to the formation of the CSi4 units of
the oxycarbide phase. For instance, in the case of methylated precursors, the
intermediate formation of Si-CH2-Si species at 750oC has been evidenced by IR
spectroscopy. The formation of such species may be well accounted for by a free-radical
mechanism (Figure 3.12(b)).

22
Figure 3.12 Mineralization step: (a) formation of gases and generation of �Si· and �C·
free radicals; (b) formation of CSi4 tetrahedra (methylated precursor) [2].
Above ca. 1450oC, silica reacts with carbon to give silicon carbide and carbon
monoxide. The overall reaction is given in Figure 3.13(a). In a silicon oxycarbide glass,
of composition SiOxCy, the reaction products depend on the amount of carbon in the
glass. When the carbon content is high enough (y >1+x), the carbothermal reduction
leads to the formation of silicon carbide and free-carbon with an escape of carbon
monoxide only (Figure 3.13(b)). This reaction was used to prepare silicon carbide from
polysiloxane precursors. When y is lower than 1+x, the carbothermal reduction leads to
the formation of SiC with loss of carbon monoxide and silicon monoxide (Figure
3.13(c)).
Figure 3.13 Carbothermal reductions of silica (a) and SiOxCy glasses (b, c) [2].

23
3.2.3 Active Filler Controlled Polymer Pyrolysis Process
Polymer pyrolysis is a relatively new and very promising technique for
processing of advanced ceramics in the form of powder particles, thin films and/or
protective coatings as well as fibers. The major advantages of such polymer-derived
materials are their intrinsic homogeneity on the atomic level, the rather low processing
temperatures, and the use of established polymer-processing techniques that enable
complex shaping. However, the applicability of subsequent polymer pyrolysis to the
fabrication of monolithic components is quite difficult, in particular, owing to the high
volume shrinkage associated with the polymer-ceramic transition that often leads to the
development of intrinsic microcracks.
In general, processing of ceramic monoliths via organometallic compounds
involves crosslinking of the starting precursor followed by pyrolysis at elevated
temperatures either in inert or reactive atmospheres. The applied heat treatment initiates
the organic-inorganic transition and results in the formation of an amorphous covalent
ceramic. Annealing at temperatures exceeding 1000oC yields a partially or completely
crystallized ceramic material, which commonly reveals both a residual porosity up to
15% and in some cases a high microcrack density. To overcome this latter problem, a
modified process, active filler controlled pyrolysis (AFCOP), has been developed by
Greil and co-workers [5-7]. The concept became a scope of many other researches
recently [3, 8-11].
According to this method, the polymer is partially filled with inert or active
powder particles in order to decrease the shrinkage and to allow the fabrication of bulk,
crack free ceramics. Employing active fillers, a reaction between the filler particles and
the precursor is initiated which typically results in a volume expansion of the reaction
product, as compared to the starting compounds. This expansion counteracts the
shrinkage during densification and can lead to near-net shaped crack-free components.
Suitable active fillers are elements or compounds such as Al, B, Si, Ti, CrSi2, MoSi2,
etc. forming carbide, nitride, or oxide reaction products which exhibit a high specific
volume increase upon reaction. Ceramic fillers like AlN, B4C, etc. offer the possibility
of forming matrices of the sialon, mullite or borosilicate type when reacting with the
siloxane polymer, for example. When metal oxide fillers such as NiO, Mn2O3, CuO, etc.
are used, reduction of the active filler results in the formation of the novel ceramic
composite materials containing highly dispersed metal or metal silicide particles. The

24
active fillers can be combined or partly replaced by inactive fillers which do not react
during the pyrolysis process but can provide specific functionality to the ceramic
material. Thus, for adjusting elasticity, thermal expansion, electrical resistance, etc.
inactive fillers offer an additional degree of freedom for tailoring the material
properties. When utilizing inert fillers, simply the precursor volume is reduced which
lowers the volumetric changes of the sample (Figure 3.14).
InertFiller
R1...2, Si(C,N,O) 0.5...1.5 Si-Cx-Oy Gas+
∆∆∆∆V/Vo - 80 %
Polymer
Porosity
Polymer + Inert Filler
Polymer + Active
Filler
ActiveFiller
∆
∆
∆
R1...2, Si(C,N,O) 0.5...1.5
R1...2, Si(C,N,O) 0.5...1.5
+
+
+ IF Si-Cx-Oy + IF
Gas∆∆∆∆V/Vo - 10 %
+ M (AF) Si-Cx-Oy
+ M (C,O) Gas∆∆∆∆V/Vo 0 %
R = H, CH3, CH=CH2, C6H5, ...Polysiloxane
Figure 3.14 Effect of active/inert filler addition on final ceramic structure [5].
Polymer/filler reactions that can be occurred as a function of increase in
pyrolysis temperature may be described as below:
1. In between 600-800oC: an organic-inorganic transformation, leading to an
amorphous hydrogenated oxycarbide built on tetrahedral structures of the
type Si (CaOb) with a + b = 4 depending on the initial polymer composition.
2. Above 800oC: Precipitation of excessive carbon to form a network of
turbostratic carbon.
3. 1100-1600oC: Nucleation of crystalline precipitations such as SiC and SiO2
(Equation 3.2).
4. Grain coarsening that results in consumption of the residual amorphous
phase and reduction of oxygen content due to evaporation of SiO and CO.
Si – Oa – Cb (am) (s) → (1-1/2) SiC (s) + a/2 SiO2 (s) + (a/2 + b – 1) C (s) (3.2)
Depending on their reactivity, filler particles begin to react with solid or gaseous
decomposition products at 400oC (Ti) or 1300oC (B).

25
In the presence of reactive filler, solid carbon and gaseous hydrocarbon species can
react to form carbide phases resulting in a significant increase of ceramic yield
(Equation 3.3).
[RSiO1.5](s) + F(s) → Si-O-C(s) + FCx(s) + H2(g) (3.3)
For example, poly(phenyl)siloxane loaded with Ti and pyrolyzed in Ar-atmosphere at
1000oC yields a siliconoxycarbide composite (Equation 3.4)
[(C6H5)SiO1.5](s) + Ti(s) → Si-O-C(s) + TiC(s) + CHx(g) + H2(g) (3.4)
where CHx mainly represents C6H6. When pyrolysis is carried out in a reaction
atmosphere, the filler particles can react with the gaseous phase present in the open pore
network, which forms during polymer decomposition between 400 and 800oC (transient
porosity) or due to carbothermal decomposition at temperatures above 1000oC. For
example, reaction of poly(phenyl)siloxane with CrSi2 in N2-atmosphere at 1400oC
yields an oxycarbonitride ceramic composite (Equation 3.5).
[(C6H5SiO1.5](s) + CrSi2(s) + N2(g) → Si-O-C-N(s) + Cr3C2(s) + Si3N4(s) + CHx(g)
(3.5)
If the carbon activity at the filler particle surface is sufficiently high (ac > 0.1), carbon
generated by polymer decomposition reacts with chromium, whereas silicon reacts with
nitrogen from reactive atmosphere to form a carbide/nitride scale of the Cr3C2-Si3N4
type on the filler particle surface. The deriving force to form nitrides can be increased
with increasing external nitrogen pressure. Reaction of poly(methyl)siloxane with B in
N2-atmosphere at 1500oC (Equation 3.6)
[(CH3)SiO1.5](s) + B(s) + N2(g) → Si-O-C-N(s) + BN(s) + Si2N2O(s) + CHx(g) (3.6)
results in the formation of nitride and oxynitride reaction products. Due to a specific
volume increase of +39% from CrSi2 to (Cr3C2 + Si3N4) and even +142% from B to BN
zero shrinkage polymer-ceramic transformation can be obtained with volume fraction of
30-40%.

26
CHAPTER 4
EXPERIMENTAL
4.1 Materials
Two different preceramic polymers, poly(phenyl)siloxane (PPS) (H62C, Wacker
Chemie, GE) and poly(methyl)siloxane (PMS) (MK, Wacker-Belsil, GE) were used.
PPS was used as received while PMS was a solid solvent free resin, which was
dissolved in toluene and mixed with Zr-acetylacetonate. As inert filler, SiC with particle
sizes in the range of 10-40 µm, and active filler, Ti with particle size of -149 µm were
used.
4.2 Processing of Neat Silicon Oxycarbide Ceramics
To monitor the thermal transformation of the preceramic polymers neat
polymers without any filler addition were prepared. Figure 4.1 shows the processing
stages to prepare ceramics without filler addition and composite (CMC) samples as
well.
Figure 4.1 Ceramic composite processing with PPS and PMS preceramic polymers.

27
Polymers (after addition of catalyst for PMS) were vacuumed for half an hour
and casted in Teflon moulds and cured in an oven at 220oC under open-air atmosphere.
Parts were machinable with convenient tools (drilling, cutting, milling, etc.).
Pyrolysation of the neat samples took place in a tubular furnace operated under inert
argon atmosphere at various temperatures (900-1500oC). A typical heating cycle
involved heating to 400°C at 5°C/min, held at this temperature for 30 min, then a
second ramp to 530oC at 5°C /min, held at this temperature for 60 min and heating to
the final temperatures (Tu) at 5°C/min and held the sample for 90 min at Tu and finally
cooling the samples to the room temperature (Figure 4.2). In addition to inert argon,
specimens were prepared under reactive nitrogen atmosphere based on the same
preparation treatment.
Figure 4.2 A typical pyrolysis schedule.
4.3 Processing of Composite Monoliths
To monitor the effect of filler addition on the microstructural and mechanical
properties of the composites, composite samples were prepared (Table 4.1). To prepare
ceramic composites, inert and active powders were mixed with the polymers at various
ratios in the range of 60-80 wt% to obtain green bodies (Figure 4.1). Blends were casted
in metal moulds, partially stabilized in an oven at 150oC and then uniaxially pressed
using a hot press under 15 MPa at 220oC for 2 hours for complete curing. After cutting
the specimens in the desired dimensions, green bodies were finally pyrolyzed following
a multi-step heating schedule shown in Figure 4.2.
28
Table 4.1 Composite monoliths prepared within the study.
Polymer Type Filler Type Filler Ratio Pyrolysis Temperature (oC) AtmosphereTiSi
SiCAl2O3
TiSi
SiCAl2O3
Ar, N260, 70, 80 900, 1100, 1300, 1500
Poly(phenyl)siloxane
Poly(methyl)siloxane
4.4 Monitoring of Thermal Conversion of Polysiloxanes and Characterizations of
Ceramics
Pyrolytic conversion of the preceramic polymers to ceramic structures was
monitored by a variety of analytical techniques. Also, the effect of the filler addition on
the microstructure, thermal transformations and mechanical properties of the specimens
were investigated or compared to the properties of the neat samples.
4.4.1 X-Ray Diffraction Method
Pyrolysis products of neat and composite samples were identified by X-ray
diffraction (XRD) technique using Philips X’Pert Pro diffractometer, with CuKα
radiation. Samples pyrolysed at elevated temperatures (900-1500oC) were powdered and
analyzed at diffraction angles (2θ) between 5-70o. Using XRD, the effect of the
temperature and filler type on phase developments were characterized.
4.4.2 Scanning Electron Microscopy (SEM)
Microstructure of the neat and composite specimens was characterized using
SEM. Polished samples were prepared by first cutting and then molding the samples in
molding resin. Grinding and polishing was performed using papers in the size of 180,
240, 400, 600, 800, 1000, and 1200 and diamonds of 9, 6, 3, and 1 µm size. Philips XL
30SFEG field emission scanning electron microscope (SEM) and attached energy
dispersive X-ray (EDX) spectrometer was utilized to analyze polished and fractured

29
specimen surfaces. Back scattered electron images of the composite samples was also
used to identify the distribution of filler particles in polymer matrix.
4.4.3 Infrared Spectroscopy Technique (FTIR)
Infrared spectroscopy technique (FTIR) was also used to identify the phase
changes by pyrolytic heat treatment using Nicolet Magna-IR 550 Spectrometer.
Samples after curing at 150oC and pyrolyzing at elevated temperatures (900-1500oC)
were ground and analyzed.
4.4.4 Thermal Analysis (TGA-DTA)
Thermal analyses were performed for determination of the mass changes and
phase developments with different filler addition. Samples were pyrolyzed at 1300oC
with 5oC/min heating rate under reactive N2 atmosphere.
4.4.5 Optic Microscopy
Using optic microscope, particle and pore dispersion in the composite structure
were identified. Nikon Eclipse L150 optic microscope was used for the analysis of the
polished samples.
4.4.6 Determination of Mass Losses and Densities
Effect of the filler type, ratio and pyrolysis temperature on the mass losses and
density changes was measured. Mass loss determinations were done based on the
weight of samples before pyrolysis (m1) and weight after pyrolysis (m2) from equation
(4.1)
(4.1)
Thermogravimetric analysis was also being carried out for determination of the
mass changes. To monitor the effect of filler type and pyrolysis temperature on density
100 %1
21 ×−=m
mmChangeMass

30
changes Archimedes method was used. Measurements were performed using Precisa
XB 220A Archimedes measurement kit.
4.4.7 Vickers Indentation Tests
The hardness values of the ceramics without filler addition and composite
samples were measured by Vickers indentation test to investigate the effect of filler
type, its weight fraction and pyrolysis temperature on the mechanical behavior of the
samples. Polished samples were also used for indentation tests with HV10 (100N) using
Zwick/Roell-TestX’Pert V9.0 machine. The indentation tip displacement rate was
selected as 0.2 mm/min.

31
CHAPTER 5
RESULTS AND DISCUSSION
5.1 Thermal Conversion of Polysiloxane
Green bodies were obtained after polymerization of the precursors at 220oC. The
stability of green bodies indicated the network formation. The organic to inorganic
conversions were studied by IR spectroscopy and X-Ray diffraction techniques. Figure
5.1 shows the XRD patterns of the neat poly(phenyl)siloxane (PPS) samples pyrolyzed
at different temperatures. The patterns up to 1300°C are characteristic of amorphous
materials of SiOxCy. The broad peaks with low intensities at above 1300°C are the
diffractions associated to β-SiC. The peaks of 2θ =36° and 60° at 1500oC are
characteristic for β-SiC crystals.
0
50
100
150
200
5 15 25 35 45 55 65
Diffraction Angle (2θ)
900°C
1100°C
1200°C
1300°C
1400°C
1500°C
SiC
Inte
nsity
(a.u
.)
Figure 5.1 X-ray diffraction patterns of the poly(phenyl)siloxane (PPS) without filler
addition pyrolyzed under Ar at various temperatures.
Figure 5.2 shows the XRD patterns of the PMS after pyrolysis at various
temperatures. As seen from the patterns the formation of β-SiC crystals occurs with low

32
intensities at 1500oC at diffraction angles 2θ = 36o and 60o, whereas an amorphous
structure can be observed at lower temperatures.
0
10
20
30
40
50
60
70
80
90
100
5 15 25 35 45 55 65
Diffraction Angle (2θ)
900°
1100°C
1300°C
1500°C
Inte
nsity
(a.u
.)SiC
Figure 5.2 X-ray diffraction patterns of the poly(methyl)siloxane (PMS) without filler
addition pyrolyzed under Ar at elevated temperatures.
The thermal conversion from organic siloxane network into the inorganic
ceramic structure was also investigated using FTIR method. Figure 5.3 shows the
infrared spectra of the PMS polymer without filler addition processed at various
temperatures. The spectra give the vibration bands of 770 (assym. n Si-CH3), 1030 (Si-
OR), 1120 (Si-O-Si), 1280 (sym. Si-CH3) and a broad band between 2000-3000 (SiOC-
H) for the samples prepared at 220oC. After pyrolysation of the samples above 1100oC,
the volatile hydrocarbons release from the structure, which is in agreement with the
FTIR results, no C-H absorption bands, was detected.

33
Figure 5.3 FTIR of the poly(methyl)siloxane (PMS) without filler addition after
polymerization at 220oC and pyrolysis under Ar at various temperatures.
Figure 5.4 shows the fracture surface SEM micrographs of the pyrolysis
products of the PPS processed at various temperatures. At lower temperatures, glassy
surfaces with low porosity were observed. Higher pyrolysis temperatures yielded
uniformly distributed submicron sized pores formed due to the density changes from the
polymer to the ceramic phases. SEM-EDX analyses were performed on the same
surfaces and the chemical composition of the pyrolysis products at various temperatures
are listed in Table 5.1. The SEM-EDX analysis for these samples also confirms the
formation of the SiOC structure.
The microstructure of the PMS samples without filler addition pyrolyzed at
elevated temperatures is different as compared to PPS samples. Pore formations cannot
be observed with this polymer (Figure 5.4); however SiOC structure formations was
monitored again by EDX analysis (Table 5.1). Different microstructure of these samples
may be the result of methyl containing structure of the precursor.

34
Figure 5.4 Fracture surface SEM images of PPS samples without filler addition
pyrolyzed at (a) 900oC, (b) 1200oC, (c) 1400oC, (d) 1500oC.
Table 5.1 SEM-EDX analysis of PPS samples without filler addition pyrolyzed at
elevated temperatures.
Average wt.%
Sample Pyrolysis Temperature(oC) C O Si
900 47 20 3 1200 34 28 39 1300 9 36 55
PPS
1400 41 15 44 900 26 54 20
1100 21 41 39 1300 15 46 39
PMS
1500 23 38 40

35
(a)
(c)
(b)(a)
(c)
(b)
Figure 5.5 Fracture surface SEM images of PMS samples without filler addition
pyrolyzed at (a) 1100oC, (b) 1300oC, (c) 1500oC.
5.2 Microstructural Features of Si-O-C Based Ceramic Composites
Monolithic CMC structures with active and inert filler incorporation were
prepared at various pyrolysis temperatures. Figure 5.6 is an example showing the SE
and BSE images of the green bodies of Ti/PMS sample before pyrolysation. As seen
from the figures, a uniform distribution of the particles within the polymer matrix
occurs by blending and hot pressing of the materials. Figure 5.7 shows the SEM image
of the same Ti/PMS system before and after pyrolysation. As can be observed from the
figure, the microstructure of the CMC is changing after pyrolysation of the samples.

36
(a) (b)(a) (b)
Figure 5.6 SEM micrographs of 70 wt% Ti /PMS system before pyrolysis (a) SE image
(b) BSE image.
(a) (b)(a) (b)
Figure 5.7 SEM micrographs of 70 wt% Ti /PMS system (a) before pyrolysis (b)
pyrolyzed under Ar at 1100oC.
The effect of the filler type and ratio, pyrolysis temperature and atmosphere on
the microstructural features of the samples was investigated. Figure 5.8 and 5.9 show
the XRD patterns of the 60wt% active Ti and inactive SiC particulate added CMCs
prepared from PPS at various temperatures, respectively. The results showed that with
the use of active fillers formation of the new phases; TiC, TiSi and TiO within the
amorphous matrix occurred due to the reactions between the Ti and decomposition
products of the polymer.

37
-30
170
370
570
770
970
1170
1370
20 30 40 50 60 70
Diffraction Angle (2θ)
Before Pyrolysis
900oC
1100oC
500oC
1300oC
1500oC
Ti Powder
Inte
nsity
(a.u
.)
TiSiTiOTi
TiC
Figure 5.8 X-ray diffraction patterns of 60 wt% Ti /PPS pyrolyzed under Ar at various
temperatures.
Pyrolysis temperature is the most critical parameter in the formation of new
phases. Up to 500oC, Ti peaks were observed. At 900oC, the formation of TiC was
detected. With increasing the pyrolysis temperatures the peak intensities of the TiC
phase get higher. 1100oC was critical temperature in the formation of TiSi. This silicate
phase was observed up to 1300oC. At around 1500oC, formation of TiC was significant.
Figure 5.9 shows the XRD patterns for composite system with inert filler (SiC / PPS
system). As seen in the figure no new phase development was observed in the case of
inert SiC particulate addition.
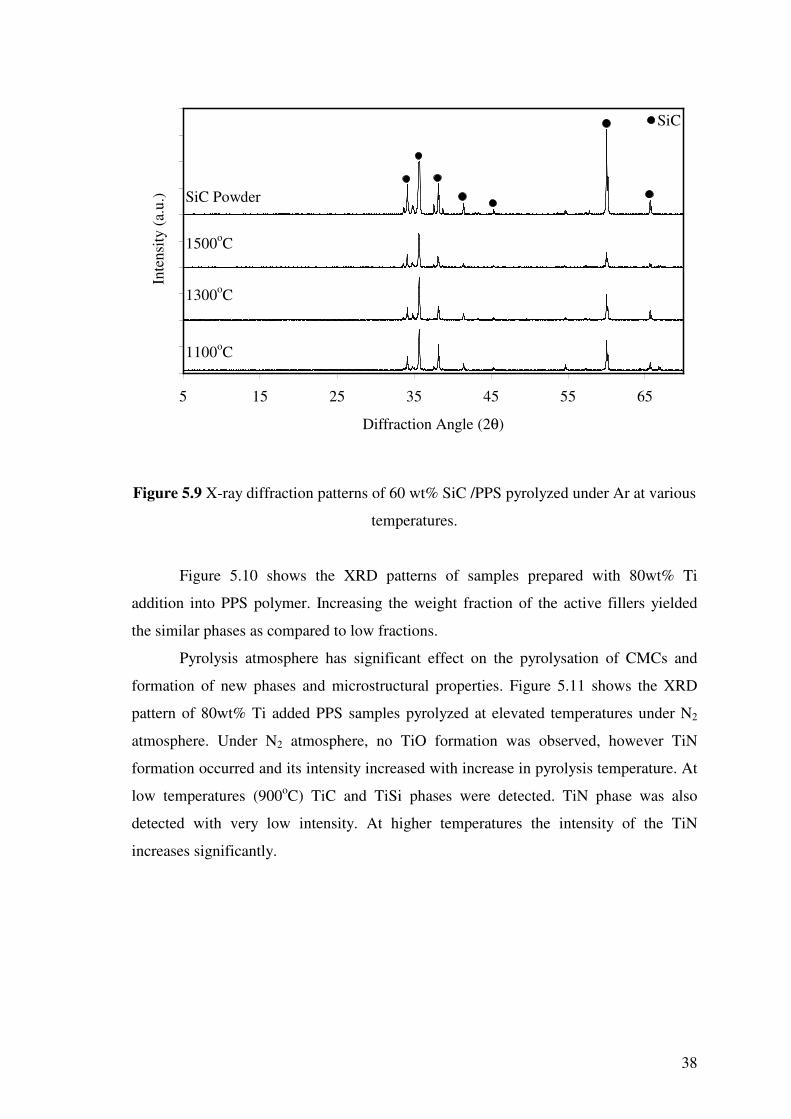
38
0
200
400
600
800
1000
1200
1400
1600
1800
2000
5 15 25 35 45 55 65
Diffraction Angle (2θ)
SiC
Inte
nsity
(a.u
.)
1100oC
1300oC
1500oC
SiC Powder
Figure 5.9 X-ray diffraction patterns of 60 wt% SiC /PPS pyrolyzed under Ar at various
temperatures.
Figure 5.10 shows the XRD patterns of samples prepared with 80wt% Ti
addition into PPS polymer. Increasing the weight fraction of the active fillers yielded
the similar phases as compared to low fractions.
Pyrolysis atmosphere has significant effect on the pyrolysation of CMCs and
formation of new phases and microstructural properties. Figure 5.11 shows the XRD
pattern of 80wt% Ti added PPS samples pyrolyzed at elevated temperatures under N2
atmosphere. Under N2 atmosphere, no TiO formation was observed, however TiN
formation occurred and its intensity increased with increase in pyrolysis temperature. At
low temperatures (900oC) TiC and TiSi phases were detected. TiN phase was also
detected with very low intensity. At higher temperatures the intensity of the TiN
increases significantly.
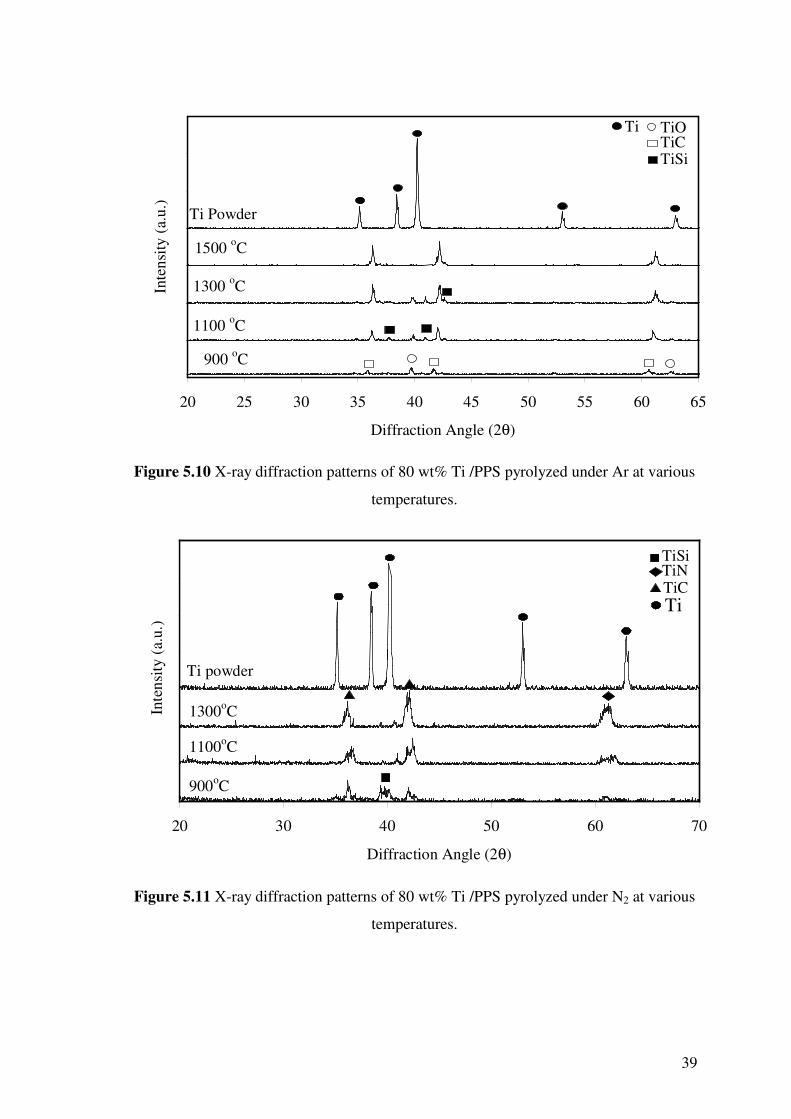
39
0
200
400
600
800
1000
1200
1400
20 25 30 35 40 45 50 55 60 65
Diffraction Angle (2θ)
TiCTiSi
TiOTi
Inte
nsity
(a.u
.)
900 oC
1100 oC
1300 oC
1500 oC
Ti Powder
Figure 5.10 X-ray diffraction patterns of 80 wt% Ti /PPS pyrolyzed under Ar at various
temperatures.
0
50
100
150
200
250
300
350
20 30 40 50 60 70
Diffraction Angle (2θ)
Ti
TiSiTiNTiC
900oC
1300oC
1100oC
Ti powder
Inte
nsity
(a.u
.)
Figure 5.11 X-ray diffraction patterns of 80 wt% Ti /PPS pyrolyzed under N2 at various
temperatures.

40
To monitor the effect of the polymer type on the microstructural development,
composite specimens with PMS precursor were prepared in addition to the samples with
PPS. Figure 5.12 shows the XRD patterns of the 60wt% Ti added CMC monoliths
prepared from PMS at various temperatures. Similar to PPS, pyrolysis of Ti/PMS green
bodies yields the formation of TiC, TiSi and TiO phases. Samples pyrolyzed at
temperatures lower then 1500oC showed the formation of TiO, TiC and TiSi phases at
1500oC only TiC phases was observed. The phase developments were also monitored
using SEM-EDX analysis. As an example, fracture surface SEM image of 80wt% Ti
filled CMC prepared at 900oC from Ti/PMS bodies was shown in Figure 5.13. On this
image, elemental distributions along the line A to E were given in Table 5.2. As seen
from the table, regions A and E are Ti rich and a matrix region with some compositional
gradients may form between the adjacent Ti particulates. The matrix may consist of the
decomposition products of the preceramic polymers and their reaction with Ti powder.
Region B and D may compose of TiO, TiSi and TiC while Region C is SiOC rich
phases.
0
50
100
150
200
250
300
350
400
20 30 40 50 60 70
Diffraction Angle (2θ)
Ti Powder
900oC
1100oC
1300oC
1500oC
Inte
nsity
(a.u
.)
TiC
TiSiTiO
Ti
Figure 5.12 X-ray diffraction patterns of 60 wt% Ti /PMS pyrolyzed under Ar at
various temperatures.

41
A B C D EA B C D E
(a) (b)
A B C D EA B C D E
(a) (b)
Figure 5.13 Fracture surface SEM micrograph of 80wt% Ti filled CMC monolith
prepared from Ti/PMS bodies at 900oC.
Table 5.2 Elemental distributions along the line between two adjacent Ti rich
particulates for 80 wt% Ti filled CMC monolith prepared from Ti/PMS bodies at 900oC.
Region C wt% Si wt% Ti wt% O wt%A 3 4 82 11B 3 17 44 36C 5 47 7 41D 4 12 71 13E 2 1 80 17
On the other hand, at pyrolysis temperatures above 1100oC, these distinct phases cannot
be detected evidently, as shown in Figure 5.14. At elevated temperatures,
compositional gradients and also the interphases may diminish due to extensive
reaction/diffusion of the filler and pyrolysis products as can be followed from the EDX
analysis shown in Table 5.3. This may give more homogeneous distribution of the
elements in the ceramic structure. As shown in Figure 5.14 (a) samples pyrolyzed at
1100oC still show distinct phase distributions region (A and D are Ti rich and Si poor, B
and C may be composed of TiO, TiSi and TiC). However Figure 5.14 (b) and (c) show
more homogenous distribution of Ti and other elements.
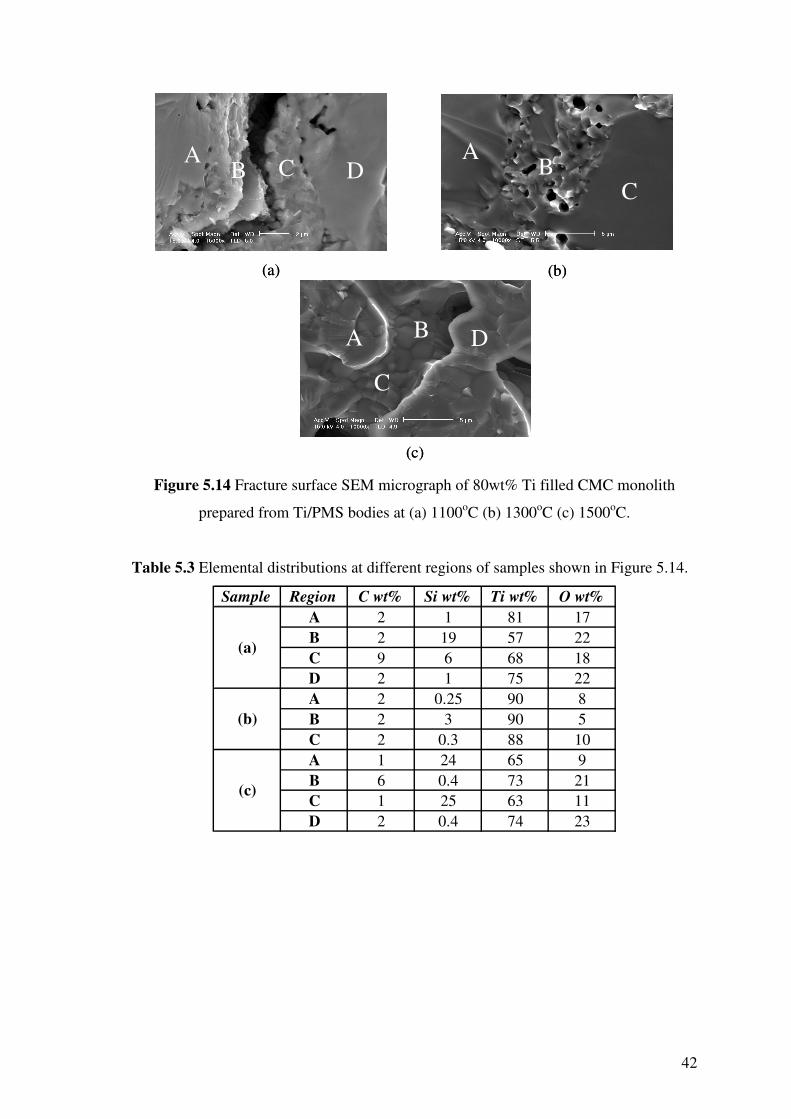
42
AB C D
AB
C
A
C
B D
(a)
(c)
(b)
AB C D
AB C D
AB
C
AB
C
A
C
B DA
C
B D
(a)
(c)
(b)
Figure 5.14 Fracture surface SEM micrograph of 80wt% Ti filled CMC monolith
prepared from Ti/PMS bodies at (a) 1100oC (b) 1300oC (c) 1500oC.
Table 5.3 Elemental distributions at different regions of samples shown in Figure 5.14.
Sample Region C wt% Si wt% Ti wt% O wt%A 2 1 81 17B 2 19 57 22C 9 6 68 18D 2 1 75 22A 2 0.25 90 8B 2 3 90 5C 2 0.3 88 10A 1 24 65 9B 6 0.4 73 21C 1 25 63 11D 2 0.4 74 23
(a)
(c)
(b)

43
5.3 Thermal Transformations, Ceramic Yield and Mass Losses
Pyrolytic conversions of polymeric precursor into Si-O-C systems may lead to
the formation of gaseous products that causes weight losses, volumetric changes and
formation of micro cracks due to shrinkages and finally a deterioration of mechanical
properties. Figure 5.15 and 5.16 show the weight changes of the neat and active Ti
added PPS and PMS samples pyrolyzed at various pyrolysis temperatures. For pyrolysis
in the range of 900-1500oC, phenyl containing precursor, PPS lose its weight of 15-17
%, while methyl containing precursor PMS lose 22-27 % of the weight, respectively.
This is due to the highest carbon content of PPS precursor.
Weight changes are considerably affected by the incorporation of active Ti
fillers into ceramic structure. This is due to the reduction of the polymer ratio in the
green composite and the reactions between the decomposition products of the polymer
and filler particles. Incorporation of Ti fillers into PPS polymers reduced weight change
values to about 2%. Filler ratio also affects the weight change values of the Ti / PPS
systems. However in the Ti / PMS system the filler ratio doesn’t have a considerable
effect on weight change values, but addition of Ti also reduced the values from 17% to
1.5%.
0
5
10
15
20
25
30
35
800 1000 1200 1400 1600
Pyrolysis Temperature (oC)
Wei
ght C
hang
e (%
)
PPS without filler60% Ti added70% Ti added80% Ti added
Figure 5.15 Weight changes values as a function of pyrolysis temperature for samples
of 0, 60, 70, 80 wt% Ti added PPS.

44
0
5
10
15
20
25
800 1000 1200 1400 1600
Pyrolysis Temperature (oC)
Wei
ght C
hang
e (%
)
60% Ti added70% Ti added80% Ti addedPMS without filler
Figure 5.16 Weight changes values as a function of pyrolysis temperature for samples
of 0, 60, 70, 80 wt% Ti added PMS.
Figure 5.17 shows the weight change values of Si / PPS system. Si addition also
affects the weight change values considerably, and in this system the effect of filler ratio
is much evident. For example with the addition of 60 wt% Si weight changes values
were about 10 %, with the addition of 70 wt% about7 %, and with the addition of 80
wt% about 5% at 1300oC. Addition of inactive fillers into the polymers shows the same
effects on weight change values with active filler addition. Figure 5.17 shows the
weight change values of SiC/PPS system. Here, also the effect of filler ratio was
followed. Weight change values decreased with increasing filler ratio.

45
0
5
10
15
20
25
30
35
800 900 1000 1100 1200 1300 1400
Pyrolysis Temperature (oC)
Wei
ght C
hang
e (%
)
PPS without filler60% Si added70% Si added80% Si added
Figure 5.17 Weight change values as a function of pyrolysis temperature for samples of
0, 60, 70, 80 wt% Si added PPS.
0
5
10
15
20
25
800 900 1000 1100 1200 1300 1400 1500 1600
Pyrolysis Temperature (oC)
Wei
ght C
hang
e (%
)
PMS without filler60% SiC added70% SiC added80% SiC added
Figure 5.18 Weight change values as a function of pyrolysis temperature for samples of
0, 60, 70, 80 wt% SiC added PMS.

46
Differences in the microstructure between active and inert filler added samples
after pyrolyzation can be easily observed with SEM analysis. In Figure 5.19 fracture
surface SEM micrographs of samples prepared with addition of active Ti and inert SiC
powders into PPS precursor are seen after pyrolyzation under 1300oC. It is apparent that
adhesion of polymer and filler particles is better in active filler containing composites
than that of inert filler ones. Also, in Ti added samples a structure with continuity is
observed as compared to those with SiC particles. The microstructural feature of the
samples is expected to affect the mechanical properties.
(a) (b)(a) (b) Figure 5.19 Fracture surface SEM micrograph of (a) 80wt% Ti (b) 80 wt% SiC filled
PPS precursor pyrolyzed at 1300oC.
-50
-40
-30
-20
-10
0
10
20
30
40
0 200 400 600 800 1000 1200
Pyrolysis Temperature (ºC)
∆m/m
o (%
)
Ti (60 wt%) / PPS
PPS without filler
Al2O3 (60 wt%) / PPS
Ti (80 wt%) / PPS
Figure 5.20 TGA micrographs of without filler addition, 80wt% Ti, 60 wt% of Ti and
60 wt%Al2O3 filled PPS precursor pyrolyzed up to 1300oC under N2 atmosphere.

47
-10
0
10
20
30
40
800 900 1000 1100 1200 1300 1400
Pyrolysis Temperature (oC)
Wei
ght C
hang
e (%
)
80 wt% Ti added PPSPPS without filler 80 wt% Al2O3 added PPS
Figure 5.21 Weight change values as a function of pyrolysis temperature for samples of
PPS without filler addition and 80 wt% Ti and Al2O3 added PPS pyrolyzed under N2
atmosphere.
As seen in Figure 5.20, TGA analysis showed that the mass loss of the samples
starts at 500oC which is the decomposition temperature of the polymer. Neat polymer
loses 41.2% of its weight at 1000oC. Addition of the fillers decreases the weight loss
ratio depending on the decrease in the polymer ratio. In 60 wt% Al2O3 added samples,
weight loss value was about 25%. By the addition of active fillers, the weight loss was
minimum and by pyrolysis above 800oC a weight gain was monitored. This may be due
to the reactions between filler particles and reactive gas atmosphere (N2). Figure 5.21
that shows the weight change of the samples pyrolyzed in tubular furnace confirms the
weight gains observed in TGA with pyrolysis under N2 atmosphere. Addition of inert
Al2O3 reduces the weight change ratio, however, active filler added samples show
weight gain values above 900oC. Polymer to ceramic conversions may also lead to an
increase in the density and the resulting densification may result in the formation of
cracks in the microstructure of the pyrolysis product. Densification during organic to
inorganic conversion can be controlled by incorporation of the active fillers by reducing
the polymer ratio and promoting the reactions between the polymer decomposition
products and the filler particles to control the shrinkage, porosity formation and

48
microcracking. Effects of the type of the polymer and pyrolysis temperature on the final
densities of the ceramic monoliths made with PPS and PMS are shown in Figures 5.22
and 5.23, respectively. The density of the green bodies was measured in the range of 2-
2.7 g/cm3 before pyrolysis. The highest density values for CMCs were obtained with
addition of 80wt% Ti (4.689 g/cm3) in PPS samples, however, the effect of the filler
ratio in PMS samples were found to be negligible. Density values of the PPS samples
increase with increasing pyrolysis temperature, while 1100oCwas found to be optimum
point for PMS.
2
2.5
3
3.5
4
4.5
5
800 1000 1200 1400 1600
Pyrolysis Temperature (oC)
Den
sity
(g/c
m3 )
60% Ti added70% Ti added80% Ti added
Before Pyrolysis
Figure 5.22 Density values for the samples prepared with addition of 60, 70, 80wt% Ti
into PPS as a function of pyrolysis temperature.

49
2
2.5
3
3.5
4
4.5
5
800 900 1000 1100 1200 1300 1400 1500 1600
Pyrolysis Temperature (oC)
Den
sity
(g/c
m3 )
60% Ti added80% Ti added
BeforePyrolysis
Figure 5.23 Density values for the samples prepared with addition of 60 and 80wt% Ti
into PMS as a function of pyrolysis temperature.
The effect of the filler type on density changes was also measured. Density
values of 80 wt% active (Ti, Si) and inert (SiC, Al2O3) filler added PPS samples are
shown in Figure 5.24. Density values of some metals and ceramics are also given in
Table 5.3 for comparison. As seen from the table the density of Ti metal is 4.5 g/cm3
and TiC ceramic is 4.94 g/cm3. The measured value at 900oC for Ti added samples is
3.83 g/cm3 and this value reached up to 4.7 g/cm3 at 1500oC because of the formation of
TiC phases in the structure. Also, addition of 80 wt% Si powder gives very low density
values of about 2 g/cm3, because of the low density of Si powder (1.5 g/cm3).
Table 5.4 Density values of some metals and ceramics [46].
Material Density (g/cm3)Ti 4.5
TiC 4.94Si 1.5
SiC 3.2Al2O3 3.96Glass 2.6

50
0
1
2
3
4
5
6
800 900 1000 1100 1200 1300 1400 1500 1600
Pyrolysis Temperature (oC)
Den
sity
(g/c
m3 )
80% Ti added80% Si added80% Al2O3 added80% SiC added
Figure 5.24 Density values for the samples prepared with addition of 80wt% Ti, Si,
SiC, and Al2O3 into PPS as a function of pyrolysis temperature.
Polished surface SEM images for CMCs made with 80 wt% Ti filled PPS and
PMS polymers pyrolyzed at various temperatures are illustrated in Figures 5.25 and
5.26, respectively. As seen in the figures, as the pyrolysis temperatures increases a
reduction of porosity is observed for PPS, while pore fraction increases for PMS made
composites. This is in agreement with density values of these samples. For PPS samples
the density values increases with increasing temperature and poreless samples were
formed, however in PMS samples at 1500oC pore formations increased and low density
samples were formed.

51
Figure 5.25 SEM polished surface micrographs of 80 wt% active Ti filled PPS
pyrolyzed at various temperatures (a) 900, (b) 1100, (c) 1300, (d) 1500°C.
Figure 5.26 SEM polished surface micrographs of 80 wt% active Ti filled PMS
pyrolyzed at various temperatures (a) 900, (b) 1100, (c) 1300, (d) 1500°C.

52
5.4 Mechanical Behavior of SiOC Based Composites
Hardness tests were carried out to evaluate the effects of pyrolysis temperature
and filler addition into the polymers on the mechanical behavior of the composites.
Figure 5.27 and 5.28 shows the hardness values of ceramics without filler addition and
Ti added PPS and PMS samples, respectively. It was found that neat ceramics reach the
maximum hardness values (8.88 GPa for neat PPS, 10.67 GPa for neat PMS) at 1100oC,
which is the optimum temperature for crack free samples with the least amount of
porosity. However, the polymers exhibited distinct behavior by the incorporation of Ti
particulates. For PPS, at low concentrations and pyrolysis temperatures, the addition of
Ti reduced the hardness values, however, at concentrations above 70 wt% resulted in
the higher values (up to 13.20 ±2.05 GPa) as compared with those with neat polymer.
On the other hand, for PMS, addition of Ti reduced the hardness of composites for all
concentrations.
0
2
4
6
8
10
12
14
16
18
800 900 1000 1100 1200 1300 1400 1500 1600
Pyrolysis Temperature (oC)
Har
dnes
s (G
Pa)
Neat PPS60% Ti added70% Ti added80% Ti added
Figure 5.27 Vickers hardness values as a function of pyrolysis temperature for neat
ceramics and composites made with various Ti added PPS precursor.

53
0
2
4
6
8
10
12
14
800 900 1000 1100 1200 1300 1400 1500 1600
Pyrolysis Temperature (oC)
Har
dnes
s (G
Pa)
Neat PMS60% Ti added 70% Ti added 80% Ti added
Figure 5.28 Vickers hardness values as a function of pyrolysis temperature for neat
ceramics and composites made with various Ti added PMS precursor.
Table 5.4 shows Vickers hardness values of some advanced ceramic structures
for comparison. It is seen from the table that glasses have the hardness values between
5-10 GPa. When compared with this neat PPS and PMS samples, which have the
hardness values of about 9 GPa and 11 GPa at 1100oC, respectively gives very
comparable results. After addition of Ti powder these values reach up to 14 GPa in PPS
samples depending on the microstructure, which is very close to the values of aluminas
and silicon nitrides.
Table 5.5 Vickers hardness values of some ceramic structures.
Material Class Vickers Hardness (HV) GPa
Glasses 5 – 10
Zirconias, Aluminium Nitrides 10 - 14
Aluminas, Silicon Nitrides 15 - 20
Silicon Carbides, Boron Carbides 20 - 30
Cubic Boron Nitride CBN 40 - 50
Diamond 60 – 70 >

54
CHAPTER 6
CONCLUSIONS
Active and inert filler incorporated ceramic composites were developed based on
the pyrolytic conversion of – phenyl and – methyl containing polysiloxanes. This study
focused on investigating the effect of filler type and ratio, pyrolysis temperature and
atmosphere on the phase development and mechanical properties of the SiOC based
ceramic matrix composites. X-ray diffraction (XRD) measurements revealed that the
thermal transformation of the polymers without filler yielded amorphous silicon
oxycarbide (SiOxCy) ceramics at temperatures below 1300oC, however, at higher
temperatures (~1500oC) crystalline β-SiC phases formed. At pyrolysis temperatures
above 900oC, the release of volatiles such as hydrocarbons occurs by the decomposition
of the preceramic polymers. This was confirmed by Fourier Transform Infrared (FTIR)
studies. SiOC phase formations were also confirmed with SEM-EDX analysis
performed on fracture surfaces of neat ceramic samples. The decompositions of the
polymers and release of hydrocarbons resulted with shrinkage and porosity formations.
SEM micrographs of neat poly(phenyl)siloxane (PPS) samples shows that formation of
pores increased with increasing pyrolysis temperature, however no pore formations
observed in poly(methyl)siloxanes (PMS). This may be the result of the different methyl
containing structure of the precursor.
Active (Ti and Si) and inert (SiC and Al2O3) fillers were added into the polymers
to compensate the negative mass loss and shrinkage effect due to the decomposition of
the polymers. Inert fillers compensate the mass losses by decreasing the polymer ratio.
Active fillers however, compensate the mass losses with both decreasing the polymer
ratio and with reaction of active filler and decomposition products of the polysiloxanes.
XRD analysis revealed that TiC, TiSi and TiO phases formed within the amorphous
matrix due to the reactions between the active Ti particulates and the polymers, however
addition of inert SiC resulted with no new phase formations. Pyrolysis of the samples
under reactive N2 atmosphere also yielded new phases such as TiN.
Effect of the thermal transformations on the mass loss and density values was
also measured and found that they are considerably affected by the addition of fillers.
Neat PPS samples show weight loss values about 25% while PMS polymer shows 17%.
This may be due to the highest carbon content of phenyl containing PPS polymer.

55
Incorporation of active and inert fillers decreases these values nearly to 2%. Filler ratio
also effects the weight change values of the CMCs. The results imply that pyrolysis
temperature has some significant effect on the densification behavior. The highest
density values for CMCs were obtained with the addition of 80 wt% Ti in PPS samples,
however, the effect of the filler ratio in PMS samples were found to be negligible and a
decrease in density values was observed with increasing pyrolysis temperature in
Ti/PMS systems. These results were confirmed by the SEM polished surface
micrographs of the Ti added PPS and PMS samples. At higher pyrolysis temperatures
the formation of pores was detectable in Ti/PMS samples while a relatively smooth
surface was observed in Ti/PPS systems.
The polymers exhibited distinct mechanical behavior by the incorporation of Ti
particulates. Unfilled samples gave the maximum hardness values at 1100oC which is
the optimum temperature for crack free samples with least amount of porosity.
Maximum hardness values for the neat samples are comparable with conventional
glasses (~10GPa). With addition of Ti into PPS increased the hardness values with
increasing the filler ratio and reached to ~14GPa which is very close to the hardness of
aluminas and silicon nitrides. However, addition of filler into PMS polymer decreases
hardness values for all compositions and this is in agreement with microstructural
features of the samples.
56
REFERENCES [1] Parmentier J., Soraru G. D., Babonneau F., “Influence of the Microstructure on
the High Temperature Behavior of Gel-Derived SiOC Glasses”, J. Eu. Ceram.
Soc. 21 (2001) 817-824
[2] Mutin P .H., “Control of the Composition and Structure of Silicon Oxycarbide
and Oxynitride Glasses Derived from Polysiloxane Precursors”, J. Sol-Gel Sci.
Tech. 14 (1999) 27-38
[3] Harshe R., Balan C., Riedel R, “Amorphous Si(Al)OC Ceramic from
Polysiloxanes: Bulk Ceramic Processing, Crystallization Behavior and
Applications”, J. Eu. Ceram. Soc. V:24 I:12 (2004) 3471-3482
[4] Walter S., Soraru G. D., Brequel H., Enzo S., “Microstructural and Mechanical
Characterization of Sol-Gel Derived Si-O-C Glasses”, J. Eu. Ceram. Soc. 22
(2002) 2389-2400
[5] Greil P., “Near Net Shape Manufacturing of Polymer Derived Ceramics”, J. Eu.
Ceram. Soc. 18 (1998) 1905-1914
[6] Kaindl A., Lehner W., Greil P., Kim D. J., “Polymer-Filler Derived Mo2C
Ceramics”, Mat. Sci. and Eng. A260 (1999) 101-107
[7] Greil P., “Near Net Shape Manufacturing of Ceramics”, Mat. Chem. Phys. 61
(1999) 64-68
[8] Michalet T., Parlier M., Addad A., Duclos R., Crampon J., “Formation at Low
Temperature with Low Shrinkage of Polymer/Al/Al2O3 Derived”, Ceram. Int. 27
(2001) 315-319
[9] Soraru G. D., Kleebe H. J., Ceccato R., Pederiva L., “Development of Mullite-
SiC Nanocomposites by Pyrolysis of Filled Polymethylsiloxane Gels”, J. Eu.
Ceram. Soc. 20 (2000) 2509-2517
[10] Schiavon M. A., Radovanovic E., Yoshida I. V. P., “Microstructural
Characterisation of Monolithic Ceramic Matrix Composites from Polysiloxane
and SiC Powder”, Pow. Tech. 123 (2002) 232-241
[11] Michalet T., Parlier M., Beclin F., Duclos R., Crampon J., “Elaboration of Low
Shrinkage Mullite by Active Filler Controlled Pyrolysis of Siloxanes”, J. Eu.
Ceram. Soc. 22 (2002) 143-152
[12] William D., Callister J. R., “Materials Science and Engineering, An
Introduction”; published by John Wiley and Sons, (1991)

57
[13] Jones J. T., Benard M. F., “Ceramics Industrial Processing and Testing”, Iowa
State University Press, (1993)
[14] Liang Y., Dutta S. P., “Application Trend in Advanced Ceramic Technologies”,
Technovation 21 (2001) 61-65
[15] Somiya S. “Advanced Technical Ceramics”, Academic Press, (1989)
[16] Kingery W. D., Bowen H. K., Uhlmann D. R., “Introduction to Ceramics”,
Wiley-Interscience Press, (1976)
[17] Barsoum M. “Fundamentals of Ceramics”, Iop Institute of Physics, (2003)
[18] Reed J. S., “Principals of Ceramic Processing”, Wiley-Intersicence Press,
(1995)
[19] Brinker C. J., Scherer G. W., “Sol-Gel Science-The Physics and Chemistry of
Sol-Gel Processing”, New York, Academic Press, (1990)
[20] Schiavon M. A., Redondo S. U. A., Pina S. R. O., Yoshida I. V. P.,
“Investigation on Kinetics of Thermal Decomposition in Polysiloxane Networks
Used as Precursors of Silicon Oxycarbide Glasses”, J Non-cryst. Solids. 304
(2002) 92-100
[21] Kawamura K., Kaga J., Iwata T., Yamanaka S., Ono M., “Silicon Carbide
Coating on Alumina Film Using Polycarbosilane”, 99 [1] (1991) 94-96
[22] Goerk O., Feike E., Heine T., Trampert A., Schubert H., “Ceramic Coatings
Processed by Spraying of Siloxane Precursors (Polymer-Spreying)”, J. Eu.
Ceram. Soc. (Article in Press)
[23] Schwab S. T., Blachard C. R., “The Use of Organometallic Precursors to Silicon
Nitride as Binders”, Mat. Res. Soc. Symp. Proc. Vol. 121, (1998)
[24] Lu C. C., Wei T., Pajidi A. P., “Fabrication of a SiC Fiber Reinforced Ceramic
Composites by Polymer Pyrolysis Method”
[25] Suttor D., Erny T., Greil P., “Fiber Reinforced Ceramic Matrix Composites With
a Polysiloxane/Boron Derived Matrix”, J. Am. Ceram. Soc. 80 [7] (1997) 1831-
1840
[26] Schmidt H., Koch D., Grathwohl G., Colombo P., “Micro/Macroporous
Ceramics from Preceramic Precursors”, J. Am. Ceram. Soc. 84 [10] (2001)
2252-55
[27] Colombo P., Hellmann J. R., Shelleman D. L., “Mechanical Properties of Silicon
Oxycarbide Ceramic Foams”, J. Am. Ceram. Soc. 84 [10] (2001) 2245-51

58
[28] Colombo P., Gambaryan-Roisman T., Scheffler M., Buhler P., Greil P.,
“Conductive Ceramic Foams from Preceramic Polymers”, J. Am. Ceram. Soc.
84 [10] (2001) 2265-68
[29] Kotani M., Kohyama A., Katoh Y., “Development of SiC/SiC Composites by
PIP in Combination with RS”, J. Nuclear Mater. 289 (2001) 37-41
[30] Kaneko K., Kakimoto K. I., “HRTEM and ELNES Analysis of Carbosilane
Derived Si-O-C Bulk Ceramics”, J. Non-cryst. Solids. 270 (2000) 181-190
[31] Schilling C. L., JR., “Polymeric Routes to Silicon Carbide”, Brit. Polm. J. Vol.
18, No.6 (1986) 355-358
[32] Bao X., Edirisinghe M. J., “Different Strategies for the Synthesis of Silicon
Carbide-Silicon Nitride Composites from Preceramic Polymers”, Composites:
Part A 30 (1999) 601-610
[33] Wills R. R., Markle R. A., Mukherjee S. P., “Siloxanes, Silanes, and Silazanes in
the Preparation of Ceramics and Glasses”, J. Am. Ceram. Soc. (1983) 904
[34] Trassl S., Motz G., Rössler E., Ziegler G., “Characterization of the Free-Carbon
Phase in Precursor Derived SiCN Ceramics”, J. Non-cryst. Solids 293-295
(2001) 261-267
[35] Ziegler G., Richter I., Suttor D., “Fiber Reinforced Composites with Polymer
Derived Matrix: Processing, Matrix Formation and Properties”, Composites:
Part A. 30 (1999) 411-417
[36] Radovanovic E., Gozzi M. F., Gonçalves M. C., Yoshida I. V. P., “Silicon
Oxycarbide Glasses from Silicon Networks”, J. Non-cryst. Solids. 248 (1999)
37-48
[37] Michalet T., Parlier M., Addad A., Duclos R., Crampon J., “Formation at Low
Temperature with Low Shrinkage of Polymer/Al/Al2O3 Derived”, Ceram. Int. 27
(2001) 315-319
[38] Educhi K., Zank G. A., “Silicon oxycarbide Glasses Derived from Polymer
Precursors”, J. Sol-Gel Sci. Tech. 13 (1998) 945-949
[39] Wei Q., Pippel E., Woltersdorf J., Scheffler M., Greil P., “Interfacial SiC
Formation in Polysiloxane Derived Si-O-C Ceramics”, Mat. Chem. Phys.73
(2002) 281-289
[40] Haug R., Weinmann M., Bill J., Aldinger F., “Plastic Forming of Preceramic
Polymers”, J. Eu. Ceram. Soc. 19 (1999) 1-6

59
[41] Baufeld B., Gu H., Wakai F., Aldinger F., “High Temperature Deformation of
Precursor Derived Amorphous Si-B-C-N Ceramics”, J. Eu. Ceram. Soc. 19
(1999) 2797-2814
[42] www.americas.kyocera.com
[43] http://mst-online.nsu.edu/mstonline/ceramics/Table72.htm
[44] http://optoweb.fis.uniroma2.it/opto/solgel
[45] http://ceiba.cc.ntu.edu.tw/U1200/chap13/11
[46] Cahn R. W., Haasen P., Kramer E. J., “ Processing of Advanced Ceramics Part
I”, Materials Science and Technology, Vol:17 (1996)
[47] http://www.mcelwee.net/html/densities_of_various_materials.html
[48] Walker B. E. JR., Rice R. W., Becher P. F., Bender B. A., Coblenz W. S.,
“Preparation and Properties of Monolithic and Composite Ceramics Produced by
Polymer Pyrolysis”, J. Am. Ceram. Soc. No. 19-B-81 (1981)