development of spray arm-report-final-2 · 2014-11-17 · prevailing sea state. when breaking waves...
TRANSCRIPT

www.sintef.no
SINTEF Materials and ChemistryMarine Environmental Technology
Oil in Ice - JIP
REPORT


Funding Partners
R&D Partners
Cooperating Partners
Preface SINTEF has in cooperation with SL Ross Environmental Research Ltd and DF Dickins Associates LLC on behalf of the oil companies AGIP KCO, Chevron, ConocoPhillips, Shell, Statoil and Total initiated an extensive R&D program; Joint industry program on oil spill contingency for Arctic and ice covered waters. This program was a 3-year program initiated in September 2006 and finalized in December 2009.
The objectives of the program were; • To improve our ability to protect the Arctic environment against oil spills. • To provide improved basis for oil spill related decision-making: • To advance the state-of-the-art in Arctic oil spill response.
The program consisted of the following projects: • P 1: Fate and Behaviour of Oil Spills in Ice • P 2: In Situ Burning of Oil Spills in Ice • P 3: Mechanical Recovery of Oil Spills in Ice • P 4: Use of Dispersants on Oil Spills in Ice • P 5: Remote Sensing of Oil Spills in Ice • P 6: Oil Spill Response Guide • P 7: Program Administration • P 8: Field Experiments, Large-Scale Field Experiments in the Barents Sea • P 9: Oil Distribution and Bioavailability
The program has received additional financial support from the Norwegian Research Council related to technology development (ending December 2010) and financial in kind support from a number of cooperating partners that are presented below. This report presents results from one of the activities under this program.
Stein Erik Sørstrøm Program Coordinator ([email protected])

2
TABLE OF CONTENTS
1 Introduction ............................................................................................................................ 4
2 Objective.................................................................................................................................. 7
3 Laboratory Testing of Spraying Performance under Controlled Cold/Arctic Conditions ............................................................................................................................... 8 3.1 Background ..................................................................................................................... 8 3.2 Experimental Setup ......................................................................................................... 9
3.2.1 Test Conditions ................................................................................................... 9 3.2.2 Determination of Flow Rates ............................................................................ 10 3.2.3 Determination of Dispersant Droplet Size Distribution .................................... 11
3.3 Results and Discussion ................................................................................................. 13 3.3.1 Physical Properties of the Tested Dispersants .................................................. 13 3.3.2 Pressure Drop through the Test Rig System – Preliminary Tests ..................... 14 3.3.3 Flow Rate Capacity Testing .............................................................................. 15 3.3.4 Spray Pattern and Determination of Dispersant Droplet Size Distribution ...... 16 3.3.5 Start and Stop Testing under Freezing and Icing Conditions ........................... 19
3.4 Conclusions/Recommendations .................................................................................... 20
4 Design, Construction and Laboratory Testing of the Spray Arm Prototype ................. 21 4.1 Criteria for the Design and Construction of the Prototype ........................................... 21 4.2 General Description of the Spraying System Prototype (Version 01) - Technical
Specifications: ............................................................................................................... 21 4.3 Experimental Setup for Laboratory Testing of Prototype (Version 01) ....................... 23
4.3.1 Testing Purpose ................................................................................................. 23 4.3.2 Test Conditions and Measuring Parameters (Methods) .................................... 23
4.4 Results and Discussion of Laboratory Testing ............................................................. 25 4.4.1 Installation/Rigging of the Spraying Container in the SINTEF Basin .............. 25 4.4.2 Preliminary Testing - Pressure Drop and Flow Rate Using Water at 20oC ...... 25 4.4.3 Heating Capacity in the Dispersant Day Tank .................................................. 27 4.4.4 Spray Pattern Testing for Optimal Application Height..................................... 28 4.4.5 Pressure Drop and Flow Rate Measurements Using Corexit 9500 ................... 29 4.4.6 Start/Stop Testing at -15oC - without Recirculation ......................................... 31 4.4.7 Operational Maneuverable Training of Hydraulic Spray Arm ......................... 32
4.5 Summary/Action Points Taken before FEX 2009 ........................................................ 32 4.6 Upgrading the Prototype (Version 02) Prior to FEX 2009 ........................................... 33
5 Field Validation of the Spray Arm Prototype during FEX 2009 ..................................... 34 5.1 Background/Objectives ................................................................................................. 34 5.2 Installation and Spraying Capacities of the Application System on the R/V Lance .... 34 5.3 Dispersant Application (Pre-Test) of 0.5 m3 Troll Crude (P4-1 Slick – Release 1) ..... 37 5.4 Dispersant Application of the P4-2 slick (2 m3 Troll Crude – Release 2) .................... 39 5.5 In Situ UVF Monitoring of Dispersed Oil in Water Column (P4-2 Slick– Release 2) 43 5.6 Dispersant Application of the P1-2 slick (7 m3 Troll Crude – Release 3) .................... 45 5.7 Conclusions and General Comments of the Dispersant Field Testing ......................... 48
6 Further Refinements of the Spray Arm System (Version 02 to Version 03) .................. 50
7 References ............................................................................................................................. 51
Appendix A Tables Capacity Testing ........................................................................................ 54
Appendix B Figures on Droplet Size Distribution .................................................................... 57

3
Appendix C Table C-1: Concentration of Dispersed Oil in Water Samples Taken under
the P4-2 Slick ........................................................................................................................ 60
Appendix D Table D-1: Physical Properties of the Surface Oil/Emulsion of the P1.1, P2.1 and P4-2 Slicks ...................................................................................................................... 61

4
1 Introduction The use of dispersants has a great potential in ice-infested waters, but has not been sufficiently documented by previous laboratory testing, or operationally tested during field experiments (Lewis and Daling, 2007A).
The most critical parameters for the operational use of dispersants under Arctic conditions are:
1. Dispersant performance and properties under relevant conditions (salinity, temperature, oil type).
2. Oil’s dispersibility and weathering properties at low temperatures. 3. Good access and contact between dispersant and oil. 4. Sufficient energy for the dispersion process.
During the project “Use of Dispersants in Ice-covered Areas” (part of the Oil-in-Ice JIP) (Sørstrøm et al., 2010), all four of these fundamental topics have undergone rigorous testing in order to better define and extend the potential use of dispersants as an operational response tool in cold and ice-covered areas. Studies connected to Topics 1 and 2 are presented in Daling et al., (2010A). This paper focuses on the more operational aspects (Topics 3 and 4) so as to better optimize the dispersant application on the oil layer with the required local turbulence needed to fulfill the dispersion process. The aim has been to evaluate existing application equipment and suggest improvements and adaptations (“winterization”) for dispersant use in cold conditions and in the presence of ice.
Based on an earlier feasibility study (Daling et al., 1990), the potential for various application methods with different ice coverage was briefly evaluated (see Figure 1.1 below).
Figure 1.1 Tentative application area for various methods under different ice conditions/coverage (from a feasibility study, ONA, Daling et al., 1990).
The aim of the Oil-in-Ice JIP of Task 4.2 “Improvement of dispersant application technology” has been to evaluate existing application equipment and suggest improvements and adaptations (“winterization”) for use in cold conditions and in the presence of ice. The Oil-in-Ice JIP report “Evaluation of dispersant spray systems and platforms for use on spilled oil in seas with ice present” (Lewis and Daling 2007A, JIP report no. 12) describes an evaluation of different dispersant application platforms as well as the pros and cons for use in ice-covered areas. Based on this evaluation, it has been recommended to focus further work in Task 4.2 on vessels as application platforms for dispersant operations under cold and ice-covered areas. Some
Application Platforms
New technologyBoat “maneuverable
arms”
Ice Coverage
Fixed-wing Aircraft
Helicopter
Boat “static” Arms
New Technology Boat “Maneuverable Arms”
?How far into the ice can
we ”expand” theoperation?
Open Water

5
of the arguments for in favor of this were the recent positive experiences in the 2006 NOFO oil on water exercise with testing of a new vessel-based dispersant application in combination with aerial support by using live forward-looking IR video transmission to the vessel from a helicopter/remote sensing aircraft. The success of this guidance strategy with real time FLIR video transmission through a downlink system from helicopter and remote sensing aircraft was later successfully practiced in the same year during dispersant application on a real accidental oil spill on the Norwegian continental shelf in total darkness (Jensen et al., 2008). Another argument for focusing on vessel application is the potential use of Fi-Fi monitors or prop washing to enhance turbulence and the dispersion process after dispersant application on oil in high ice conditions with the presence of low natural turbulence (e.g. Spring et al., 2006; Nedwed et al., 2007). In general, the addition of dispersants to spilled oil increases the potential for the oil to be dispersed into the water column, although some “mixing energy” input is required in order to:
Create small oil droplets; Maintain the oil droplets within the water column, causing them to be spread, diluted and
subsequently biodegraded. In open (ice-free) seawater, both these sources of “mixing energy” can be provided by a suitable prevailing sea state. When breaking waves are present (at wind speeds greater than 4-5 m/s), the crest of a breaking wave passing through a dispersant-treated oil slick possesses sufficient shearing action to convert the oil into small droplets which are initially pushed into the water column by the passage of the breaking wave. The oil droplets (typically 30-70 microns in diameter) are maintained in the water column by the water motion that exists under all waves (whether breaking or non-breaking), and the volume of oil contained in these small droplets is then permanently dispersed by the prevailing sea state. For situations in which no external mixing can be applied such as the aerial application of dispersants, this will be the mechanism that leads to the permanent dispersion of the oil. If dispersant is sprayed onto spilled oil from a vessel, additional “mixing energy” can be incidentally supplied by the passage of the vessel itself, by the prop wash in the wake of the vessel, by intentionally adding further energy with the use of thrusters or, e.g. Fi-Fi monitors to mix the dispersant-treated oil into the water. The use of such artificially applied “high shear” energy after the dispersant treatment may create even smaller oil droplets that will have a very low rise velocity (e.g. hours to days to float one meter upwards). This means that even small vertical advection forces/currents should be sufficient for maintaining such small droplets in the water column and for stimulating a high microbiological degradation of the dispersed oil.
In high ice coverage, such as in the Marginal Ice Zone in the Barents Sea, the mixing energy needed to break up the dispersant-treated oil between the ice leads into oil droplets may be a limiting factor. The use of thrusters or other high shear agitation devices (e.g. Fi-Fi monitors) may therefore be necessary. Nedwed et al., (2007) considered the utilization of azimuthal stern drive (ASD) icebreakers to provide the necessary mixing energy required to enhance the chemical dispersion of oil spilled in a sea ice environment. Through laboratory and basin model studies, their findings indicated that the prop wash from large ASD icebreakers possess the potential to promote dispersion of a chemically treated oil slick to a depth of 20 m due to the turbulence generated by large pods with propellers with the capability of rotating 360o. In connection with the large-scale field trial (FEX 2009), the intention was to look further into the concept of combining the optimal dispersant application of oil-in-ice followed by an artificial turbulence to enhance the dispersion process. The potential of this operational concept based on experiences from the FEX 2009 field trials are discussed in this paper. The more long-term spreading and fate of the dispersed oil plume after dispersant treatment and mixing agitation will
6
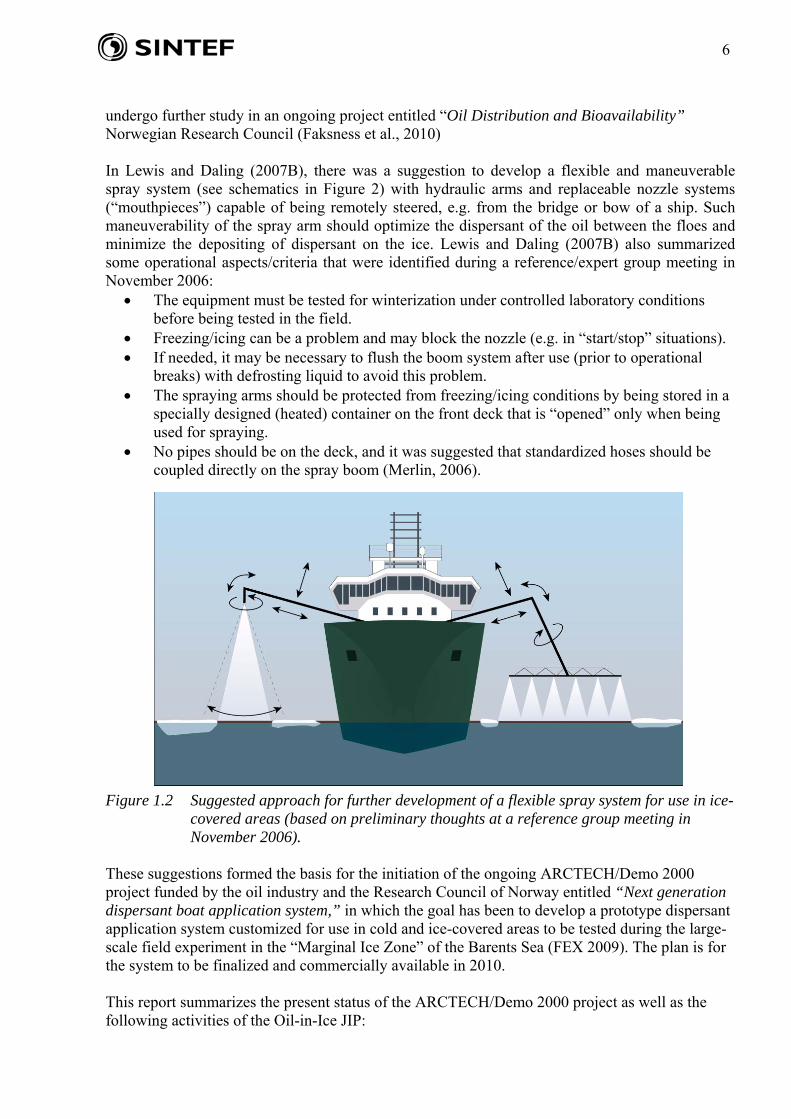
undergo further study in an ongoing project entitled “Oil Distribution and Bioavailability” Norwegian Research Council (Faksness et al., 2010) In Lewis and Daling (2007B), there was a suggestion to develop a flexible and maneuverable spray system (see schematics in Figure 2) with hydraulic arms and replaceable nozzle systems (“mouthpieces”) capable of being remotely steered, e.g. from the bridge or bow of a ship. Such maneuverability of the spray arm should optimize the dispersant of the oil between the floes and minimize the depositing of dispersant on the ice. Lewis and Daling (2007B) also summarized some operational aspects/criteria that were identified during a reference/expert group meeting in November 2006:
The equipment must be tested for winterization under controlled laboratory conditions before being tested in the field.
Freezing/icing can be a problem and may block the nozzle (e.g. in “start/stop” situations). If needed, it may be necessary to flush the boom system after use (prior to operational
breaks) with defrosting liquid to avoid this problem. The spraying arms should be protected from freezing/icing conditions by being stored in a
specially designed (heated) container on the front deck that is “opened” only when being used for spraying.
No pipes should be on the deck, and it was suggested that standardized hoses should be coupled directly on the spray boom (Merlin, 2006).
Figure 1.2 Suggested approach for further development of a flexible spray system for use in ice-
covered areas (based on preliminary thoughts at a reference group meeting in November 2006).
These suggestions formed the basis for the initiation of the ongoing ARCTECH/Demo 2000 project funded by the oil industry and the Research Council of Norway entitled “Next generation dispersant boat application system,” in which the goal has been to develop a prototype dispersant application system customized for use in cold and ice-covered areas to be tested during the large-scale field experiment in the “Marginal Ice Zone” of the Barents Sea (FEX 2009). The plan is for the system to be finalized and commercially available in 2010. This report summarizes the present status of the ARCTECH/Demo 2000 project as well as the following activities of the Oil-in-Ice JIP:
7
Act. P4.22: Laboratory testing for the spraying performance of existing boat application
spray unit (module) under simulated controlled cold/arctic conditions; Act. P4.23: Design, construction and functionality testing of spray arm prototype; Act. P4.24: Dispersant treatment of oil in ice - field validation of the containerized spray
arm prototype.
2 Objective Based on an evaluation of existing dispersant application systems, the overall goal has been to optimize and improve the methodology and strategies for dispersant response operations in cold and ice-covered areas through the following sub-goals/activities:
Test the applicability and spraying performance of existing boat application spray unit
(module) under “controlled” cold/arctic conditions to identify operational limitations or possible changes in functionalities (in general) when operating at temperatures down to -15oC. The findings from this study should be taken into account in the design of the prototype application system that was planned for use in FEX 2009.
Design, construction and functionality testing of spray arm prototype (Version 01). Validate the functionality of the spraying system prototype (Version 02) and offer
recommendation for further modifications through experiences in the treatment of oil slicks during the FEX 2009 field experiment.
8
3 Laboratory Testing of Spraying Performance under Controlled Cold/Arctic Conditions
3.1 Background
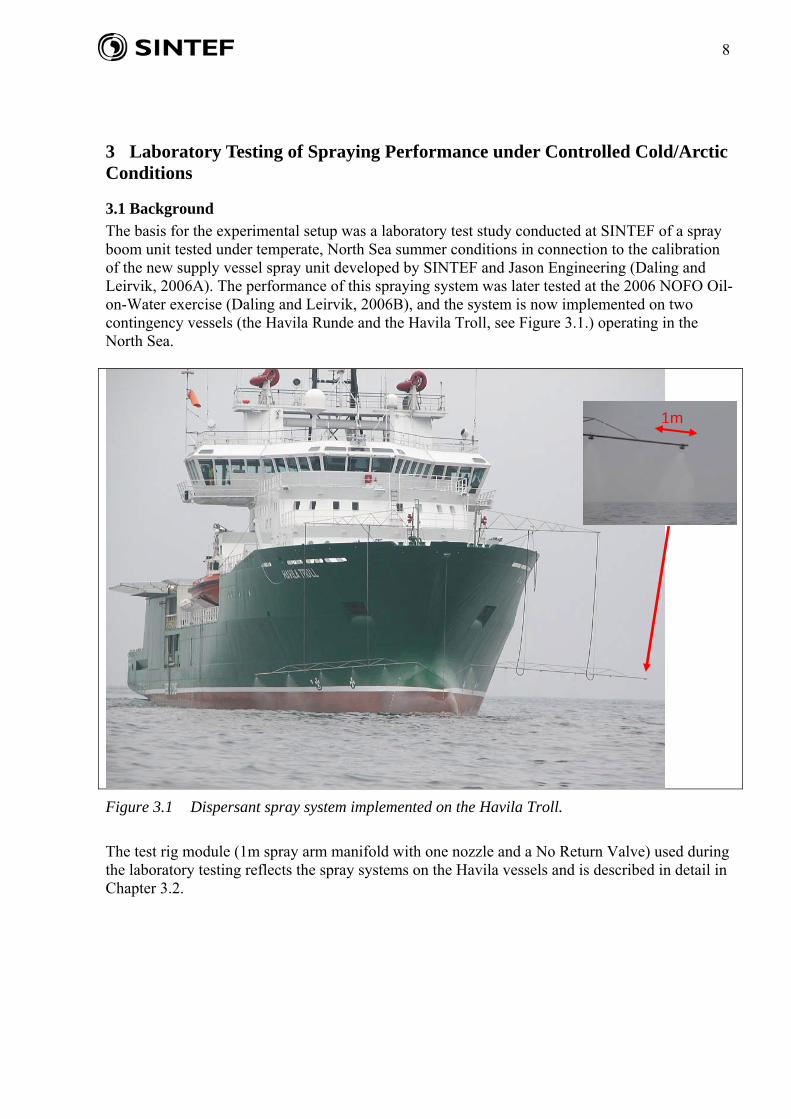
The basis for the experimental setup was a laboratory test study conducted at SINTEF of a spray boom unit tested under temperate, North Sea summer conditions in connection to the calibration of the new supply vessel spray unit developed by SINTEF and Jason Engineering (Daling and Leirvik, 2006A). The performance of this spraying system was later tested at the 2006 NOFO Oil-on-Water exercise (Daling and Leirvik, 2006B), and the system is now implemented on two contingency vessels (the Havila Runde and the Havila Troll, see Figure 3.1.) operating in the North Sea.
Figure 3.1 Dispersant spray system implemented on the Havila Troll.
The test rig module (1m spray arm manifold with one nozzle and a No Return Valve) used during the laboratory testing reflects the spray systems on the Havila vessels and is described in detail in Chapter 3.2.
1m
9
3.2 Experimental Setup
3.2.1 Test Conditions
The testing was performed under temperature controlled conditions at the SINTEF SeaLab. A total of seven test series were performed that measured the flow capacity and dispersant droplet size distribution under different temperature conditions (20.0 and -15°C), as well as a function of variable pressure in the spray boom. Dispersants: Two different dispersants were used in the testing:
Corexit 9500 (also called EC9500A) Dasic Slickgone NS
The Corexit product is the most common dispersant in stock in the US (including Alaska), while Dasic NS is the most stocked dispersant for Norwegian oil spill contingencies (a total of >600 m3
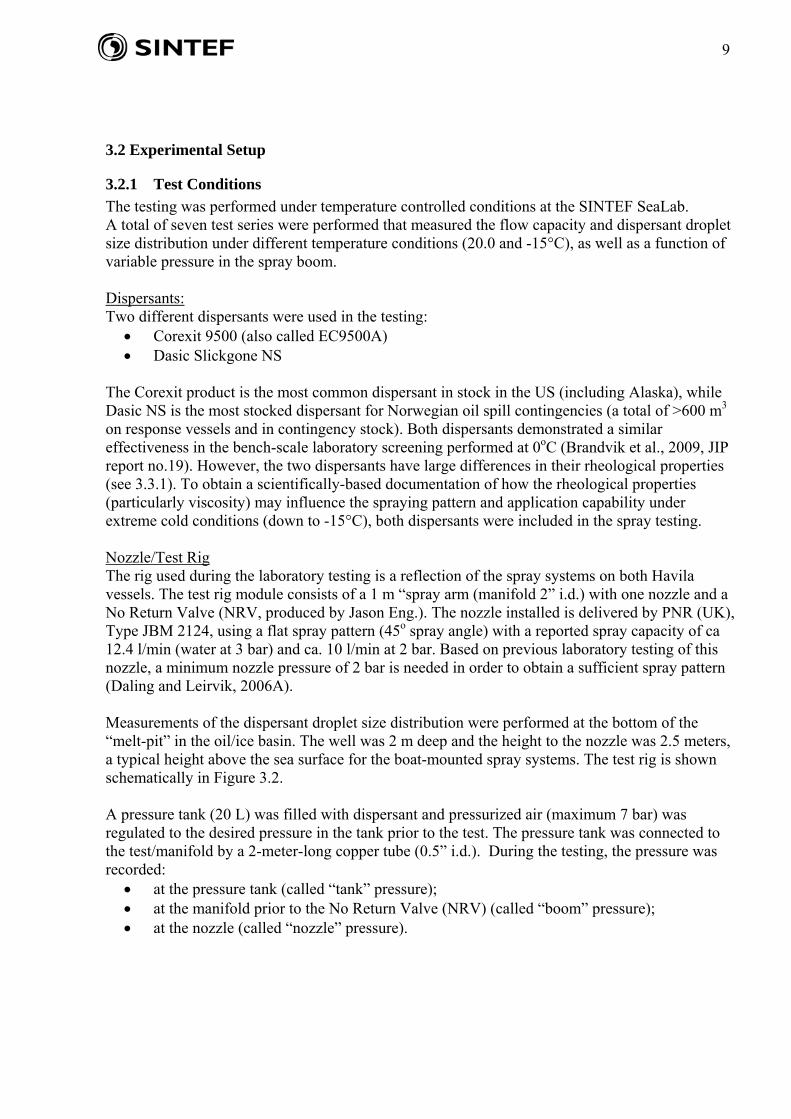
on response vessels and in contingency stock). Both dispersants demonstrated a similar effectiveness in the bench-scale laboratory screening performed at 0oC (Brandvik et al., 2009, JIP report no.19). However, the two dispersants have large differences in their rheological properties (see 3.3.1). To obtain a scientifically-based documentation of how the rheological properties (particularly viscosity) may influence the spraying pattern and application capability under extreme cold conditions (down to -15°C), both dispersants were included in the spray testing. Nozzle/Test Rig The rig used during the laboratory testing is a reflection of the spray systems on both Havila vessels. The test rig module consists of a 1 m “spray arm (manifold 2” i.d.) with one nozzle and a No Return Valve (NRV, produced by Jason Eng.). The nozzle installed is delivered by PNR (UK), Type JBM 2124, using a flat spray pattern (45o spray angle) with a reported spray capacity of ca 12.4 l/min (water at 3 bar) and ca. 10 l/min at 2 bar. Based on previous laboratory testing of this nozzle, a minimum nozzle pressure of 2 bar is needed in order to obtain a sufficient spray pattern (Daling and Leirvik, 2006A). Measurements of the dispersant droplet size distribution were performed at the bottom of the “melt-pit” in the oil/ice basin. The well was 2 m deep and the height to the nozzle was 2.5 meters, a typical height above the sea surface for the boat-mounted spray systems. The test rig is shown schematically in Figure 3.2. A pressure tank (20 L) was filled with dispersant and pressurized air (maximum 7 bar) was regulated to the desired pressure in the tank prior to the test. The pressure tank was connected to the test/manifold by a 2-meter-long copper tube (0.5” i.d.). During the testing, the pressure was recorded:
at the pressure tank (called “tank” pressure); at the manifold prior to the No Return Valve (NRV) (called “boom” pressure); at the nozzle (called “nozzle” pressure).
10
Figure 3.2 Schematic of dispersant spray rig with the 2-meter-deep basin well, with the exposure table for droplet size measurement at the well bottom.
3.2.2 Determination of Flow Rates
The flow rate was determined by collecting dispersant for a predetermined period of time (20 or 30 seconds), and the flow rate gradually increased when the valve was opened. As a result, the collection of dispersant was started when the flow had stabilized (typically after 20 sec). The collected dispersant was weighed, and the flow rate in liters/min was calculated. The testing was performed at 3 temperatures: -15°C, 0°C and 20°C with the two dispersants, Dasic NS and Corexit 9500, with the intention of using the No Return Valve (NRV) in all the test series. Experience gained from the calibrating of the Havila Troll spray system in 2006 showed that the NRV led to a drop in pressure to the nozzle of approximately 2.5-3.0 bar. The limitation of the current laboratory test rig was a maximum flask pressure of 7 bar. During the test program, it became apparent that there was an additional pressure drop of 3.5-4.0 bar through the copper tubing between the pressure tank and manifold. When testing the most viscous dispersant (Corexit 9500) at low temperature, it was not possible to obtain the necessary pressure of 2 bar at the nozzle to generate a sufficient flow rate. For most of the series, the testing were therefore performed without the NRV by measuring the “boom” pressure directly at the nozzle (see Table 3.1) as illustrated in Figure 3.2A. Table 3.1 Capacity tests performed. -15°C 0°C 20°C Dasic NS DIRECT - NRV Corexit 9500 DIRECT/NRV DIRECT DIRECT *) DIRECT – Direct application
2,5m
Pressure tank
Fork lift Winch
Spray
Exposure ”table” for oil sensitive
paper

11
Figure 3.3 Schematic of dispersant spray rig. A: Boom pressure directly on nozzle (no NRV), B: Use of No Return Valve (NRV).
3.2.3 Determination of Dispersant Droplet Size Distribution
Dispersant droplet size distributions were calculated by exposing oil sensitive papers (produced by CIBA-Geigy and delivered by Tee Jet-Spraying Systems Co.) to the dispersant spray. Sampling was achieved by use of a pneumatically controlled “exposure rig” placed in a well 2.5 meters below the nozzle. The dispersant spray fell through a slit in the exposure rig (Figure 3.4A), and the oil-sensitive paper was exposed to the spray by passing it under a slit (see Figure 3.4B). The paper speed and the width of the slit were adjusted in order to obtain an optimal dispersant spray density on the paper. The oil-sensitive paper impacted by dispersant droplets turned black. The oil sensitive paper was photographed exactly 1.5 minutes after being sprayed, with an example of the image shown in Figure 3.5.
Figure 3.4 Exposure rig for dispersant droplet size distribution lowered into the 2.5 meter well.
A B
A B
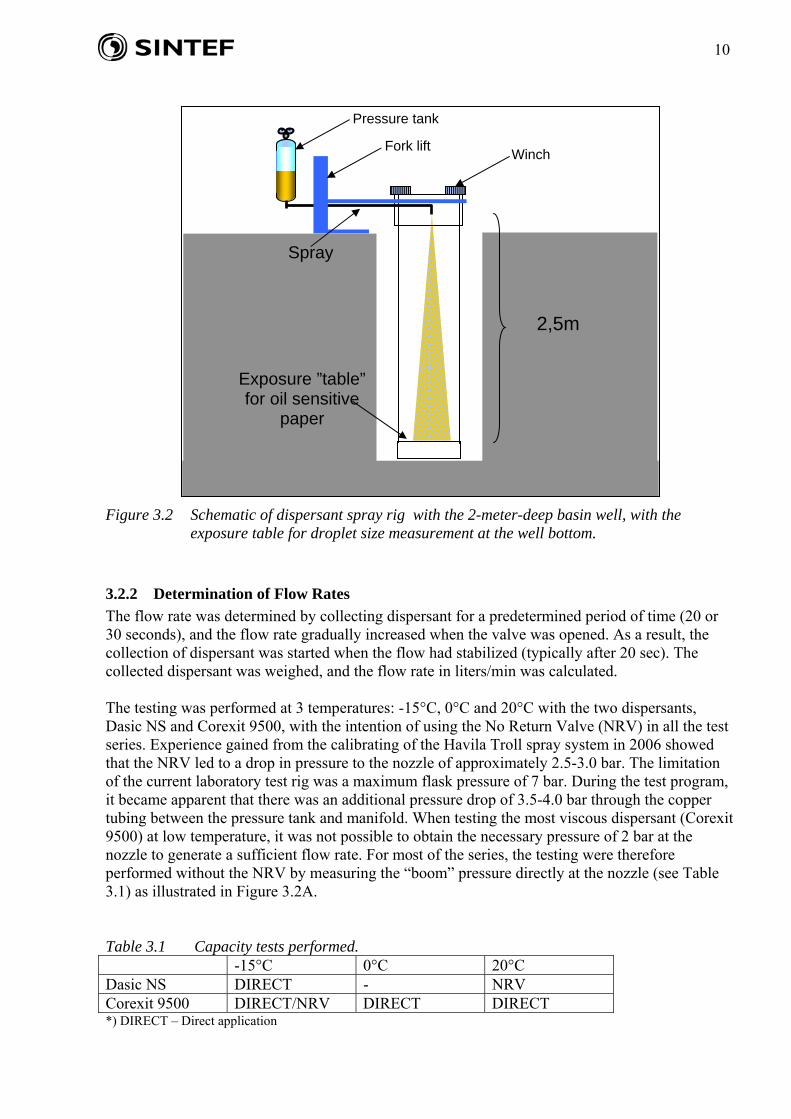
12
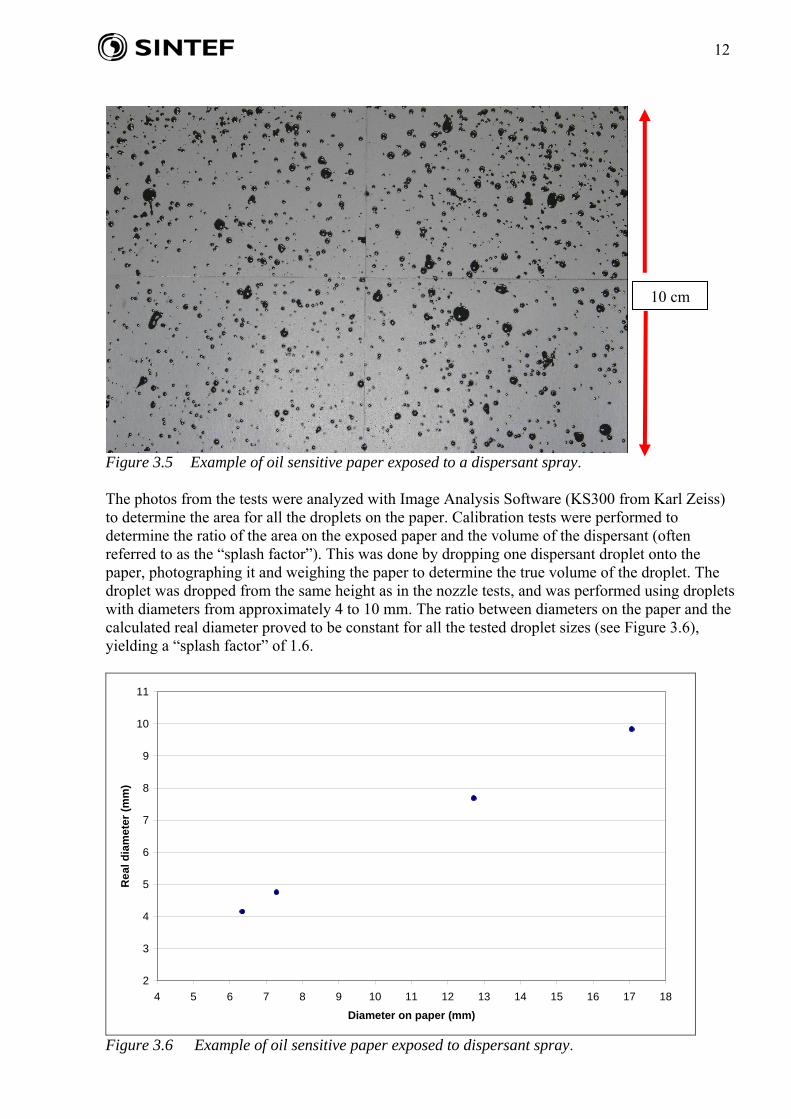
Figure 3.5 Example of oil sensitive paper exposed to a dispersant spray. The photos from the tests were analyzed with Image Analysis Software (KS300 from Karl Zeiss) to determine the area for all the droplets on the paper. Calibration tests were performed to determine the ratio of the area on the exposed paper and the volume of the dispersant (often referred to as the “splash factor”). This was done by dropping one dispersant droplet onto the paper, photographing it and weighing the paper to determine the true volume of the droplet. The droplet was dropped from the same height as in the nozzle tests, and was performed using droplets with diameters from approximately 4 to 10 mm. The ratio between diameters on the paper and the calculated real diameter proved to be constant for all the tested droplet sizes (see Figure 3.6), yielding a “splash factor” of 1.6.
2
3
4
5
6
7
8
9
10
11
4 5 6 7 8 9 10 11 12 13 14 15 16 17 18
Diameter on paper (mm)
Re
al d
iam
eter
(m
m)
Figure 3.6 Example of oil sensitive paper exposed to dispersant spray.
10 cm

13
3.3 Results and Discussion
This section presents the main findings from the laboratory testing. All results of the flow capacity and dispersant droplet size distributions are given in tables and plots in Appendices A and B, respectively.
3.3.1 Physical Properties of the Tested Dispersants
The density and viscosity of the two dispersants are shown in Table 3.2. The viscosity was measured at the three test temperatures 20°C, 0°C and -15°C with a reported shear rate of 10 s-1. Figure 3.7 shows the temperature dependency of the viscosity for the two dispersants. The measurement was performed at a fixed shear rate (10 s-1), while the temperature was decreased at a rate of 0.5°C/min. Table 3.2 Physical properties of the dispersants.
Dasic NS Corexit 9500 Density (g/ml) 0.876 0.956 Viscosity @ -15°C (mPas = cP) 250 750 Viscosity @ 0°C (mPas = cP) 80 250 Viscosity @ 20°C (mPas = cP) 20 70
Figure 3.7 Temperature dependency of the viscosity for the dispersants, Dasic NS and Corexit 9500.
10
100
1.000
mPa·s
-15 -10 -5 0 5 10 15 20°C
Temperature T
Temperature vs viscosity
Copyright (C) 1999 Physica Meßtechnik GmbH
2007-0430 Dasic NS 1
PP 50 d=1 mm
Viscosity
2007-0513 Corexit 9500
PP 50 d=1 mm
Viscosity
-15 -5 -10 0oC 10 5 15 20
14
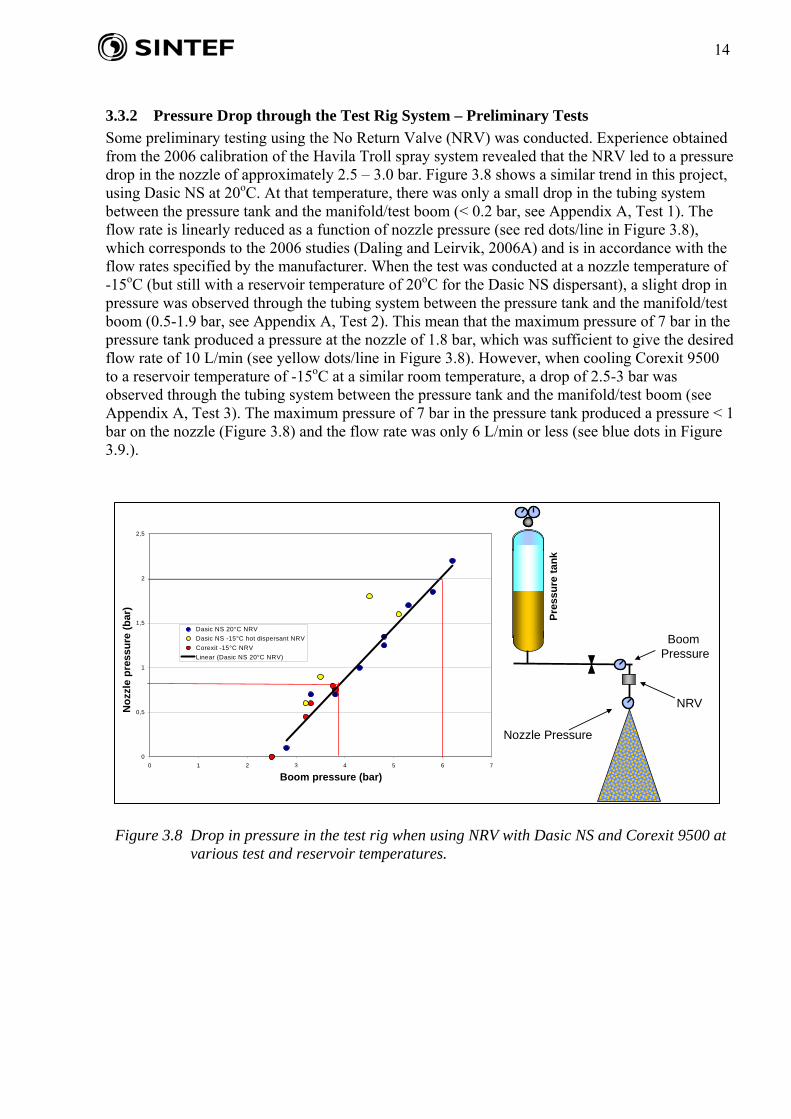
3.3.2 Pressure Drop through the Test Rig System – Preliminary Tests
Some preliminary testing using the No Return Valve (NRV) was conducted. Experience obtained from the 2006 calibration of the Havila Troll spray system revealed that the NRV led to a pressure drop in the nozzle of approximately 2.5 – 3.0 bar. Figure 3.8 shows a similar trend in this project, using Dasic NS at 20oC. At that temperature, there was only a small drop in the tubing system between the pressure tank and the manifold/test boom (< 0.2 bar, see Appendix A, Test 1). The flow rate is linearly reduced as a function of nozzle pressure (see red dots/line in Figure 3.8), which corresponds to the 2006 studies (Daling and Leirvik, 2006A) and is in accordance with the flow rates specified by the manufacturer. When the test was conducted at a nozzle temperature of -15oC (but still with a reservoir temperature of 20oC for the Dasic NS dispersant), a slight drop in pressure was observed through the tubing system between the pressure tank and the manifold/test boom (0.5-1.9 bar, see Appendix A, Test 2). This mean that the maximum pressure of 7 bar in the pressure tank produced a pressure at the nozzle of 1.8 bar, which was sufficient to give the desired flow rate of 10 L/min (see yellow dots/line in Figure 3.8). However, when cooling Corexit 9500 to a reservoir temperature of -15oC at a similar room temperature, a drop of 2.5-3 bar was observed through the tubing system between the pressure tank and the manifold/test boom (see Appendix A, Test 3). The maximum pressure of 7 bar in the pressure tank produced a pressure < 1 bar on the nozzle (Figure 3.8) and the flow rate was only 6 L/min or less (see blue dots in Figure 3.9.).
Figure 3.8 Drop in pressure in the test rig when using NRV with Dasic NS and Corexit 9500 at various test and reservoir temperatures.
0
0,5
1
1,5
2
2,5
0 1 2 3 4 5 6 7
pressure boom (bar)
No
zzle
pre
ssu
re (
bar
)
Dasic NS 20°C NRV
Dasic NS -15°C hot dispersant NRV
Corexit -15°C NRV
Linear (Dasic NS 20°C NRV)
Nozzle Pressure
Pre
ssu
reta
nk
BoomPressure
NRVNo
zzle
pre
ssu
re (
bar
)
Boom pressure (bar)

15
Figure 3.9 Nozzle flow rate measurements when using NRV with Dasic NS and Corexit 9500 at
various test and reservoir temperatures.
3.3.3 Flow Rate Capacity Testing
Based on the preliminary testing which produced the pressure drop and pressure delivery limitation, it was decided to perform further tests without using the NRV. This would allow sufficient pressure at the nozzle and fulfill the scope of this test. Figure 3.10 summarizes the nozzle flow rate measurements with Dasic NS and Corexit 9500 at various test temperatures without using NRV. During all tests, the varying test temperatures, the ambient (room) temperature and the dispersant storage temperature were similar. Appendix A shows the results for all the tests performed. The flow rate tests using Corexit 9500 at 20ºC and 0oC yield similar results comparable to those obtained with Dasic NS at -15oC. All three test series produced satisfactory flow rates that were close to the specification rates. However, when testing Corexit 9500 at -15oC the flow rate was significantly reduced (see light blue dots/line in Figure 3.10.). The spray pattern (droplet size) observed during these tests is discussed in Chapter 3.3.4.
0,0
2,0
4,0
6,0
8,0
10,0
12,0
14,0
0 0,5 1 1,5 2 2,5
Dasic NS 20°C NRV
Dasic NS -15°C hot dispersant NRV
Corexit 9500 -15°CNRV
Linear (Corexit 9500 -15°CNRV)
Linear (Dasic NS 20°C NRV)
Linear (Dasic NS -15°C hot dispersant NRV)
Nozzle flow rate spec
Nozzle pressure (bar)
Flo
w (
l /
min
)
0,0
2,0
4,0
6,0
8,0
10,0
12,0
14,0
0 0,5 1 1,5 2 2,5
Dasic NS 20°C NRV
Dasic NS -15°C hot dispersant NRV
Corexit 9500 -15°CNRV
Linear (Corexit 9500 -15°CNRV)
Linear (Dasic NS 20°C NRV)
Linear (Dasic NS -15°C hot dispersant NRV)
Nozzle flow rate spec
Nozzle pressure (bar)
Flo
w (
l /
min
)
16
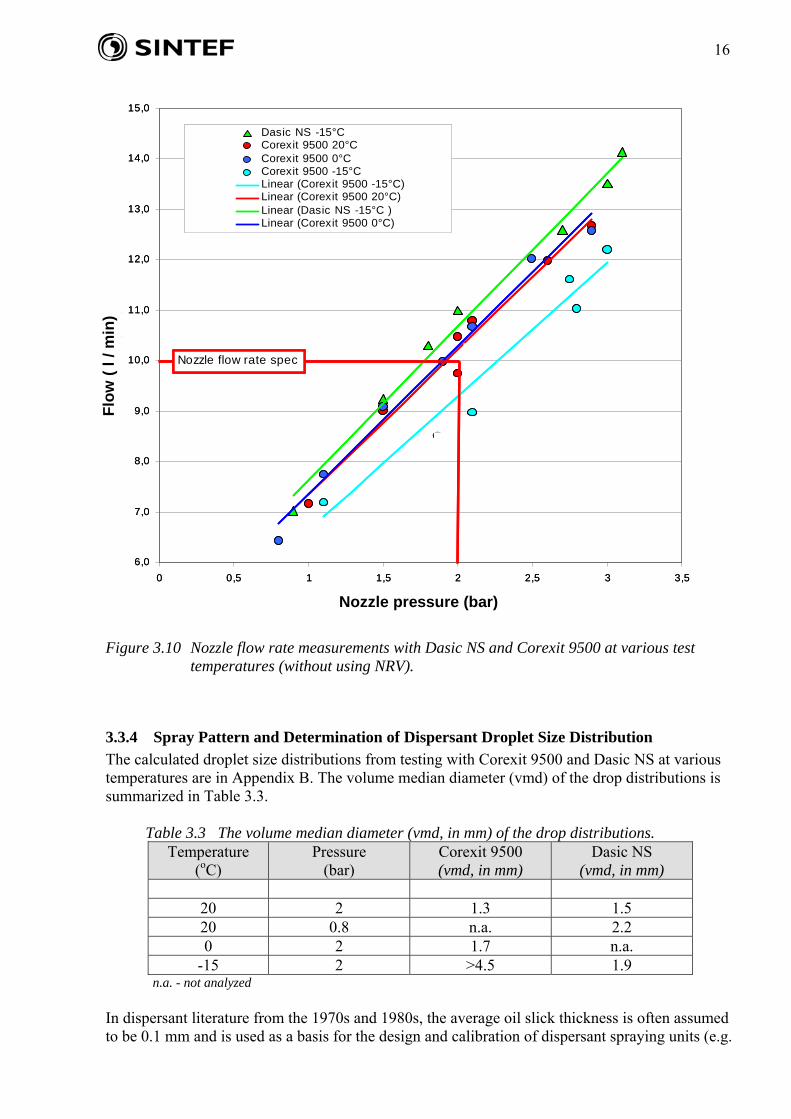
Figure 3.10 Nozzle flow rate measurements with Dasic NS and Corexit 9500 at various test
temperatures (without using NRV).
3.3.4 Spray Pattern and Determination of Dispersant Droplet Size Distribution
The calculated droplet size distributions from testing with Corexit 9500 and Dasic NS at various temperatures are in Appendix B. The volume median diameter (vmd) of the drop distributions is summarized in Table 3.3. Table 3.3 The volume median diameter (vmd, in mm) of the drop distributions.
Temperature (oC)
Pressure (bar)
Corexit 9500 (vmd, in mm)
Dasic NS (vmd, in mm)
20 2 1.3 1.5 20 0.8 n.a. 2.2 0 2 1.7 n.a.
-15 2 >4.5 1.9 n.a. - not analyzed
In dispersant literature from the 1970s and 1980s, the average oil slick thickness is often assumed to be 0.1 mm and is used as a basis for the design and calibration of dispersant spraying units (e.g.
6,0
7,0
8,0
9,0
10,0
11,0
12,0
13,0
14,0
15,0
0 0,5 1 1,5 2 2,5 3 3,5
Nozzle pressure (bar)
Flo
w (
l/min
)
Dasic NS -15°C Corexit 9500 20°CCorexit 9500 0°CCorexit 9500 -15°CLinear (Corexit 9500 -15°C)Linear (Corexit 9500 20°C)Linear (Dasic NS -15°C )Linear (Corexit 9500 0°C)
Nozzle flow rate spec
Nozzle pressure (bar)
Flo
w (
l /
min
)
17
Lindblom, 1979, 1983, 1987). The optimum dispersant droplet diameter range for effective dispersant spraying, particularly from aircraft, is considered to be 0.4-0.7 mm. Nevertheless, experience and documentation from both real oil spills and experimental oil releases have shown that a thickness of 0.1 mm is rarely present since free drifting crude oil slicks do not spread uniformly. As a general rule of thumb, most of the oil volume (typically > 90-95% volume) within an oil slick consists of areas/patches of emulsions that are usually > 1mm thick, though these often cover less than 5-10% of the total slick area. The relatively thick areas are surrounded by thinner oil described as sheen, rainbow and metallic (0.1-50 μm). The application of dispersants over such an area will lead to herding, irrespective of the dispersant droplet size and is documented and discussed by, e.g. Lichtenthaler and Daling (1985), Lewis et al. (1995 A and B), and by Ross et al. (1998, 2001). Recent studies (Ebert et al., 2006) have further documented that dispersant droplets of up to 2 mm in diameter sprayed onto an oil film thickness of 0.2 mm and higher will not penetrate the oil slick. In ice-covered areas where the oil slick is contained and trapped within the ice leads, it is expected that the crude oil thickness can be several millimeters or even several centimeters. Based on these considerations, dispersant droplet diameters of 1-2 mm are considered to be the optimum size for spraying dispersant onto thick oil layers in ice leads. Table 3.3 summarizes the results from the droplet size distribution measurements which are given in volume median diameter (vmd). The results show that the spraying pattern using Dasic NS through the JBM 2124 nozzles at a standard 2 bar generates suitable droplet size distributions, even when the dispersant is cooled to a temperature of -15oC. The more viscous Corexit 9500, however, caused a poor spray pattern (see Figure 3.11) and too large a size of dispersant droplets at a temperature of -15°C (see Figure 3.12), thereby leading to poor coverage of the dispersant on the oil (e.g. Mackay, 1985 and 1986). Consequently, the recommendation is to avoid the dispersant being cooled down below 0°C when using C-9500, while for Dasic NS the critical temperature is -15oC. The results in Table 3.3 also demonstrate that a nozzle pressure below 2 bar will give an increase in the vmd and a less optimal spraying pattern. It is important to take these findings into account in terms of the design of the spray arm system.

18
Figure 3.11 Spray pattern of Corexit 9500 and Dasic NS at – 15oC.
Figure 3.12 Droplet size distribution of Corexit 9500 and Dasic NS at -15oC.
Corexit at -15°C 10 l/min Dasic at -15°C 10 l/min
10mm
Corexit at -15°C 10 l/min Dasic at -15°C 10 l/min
10mm
19
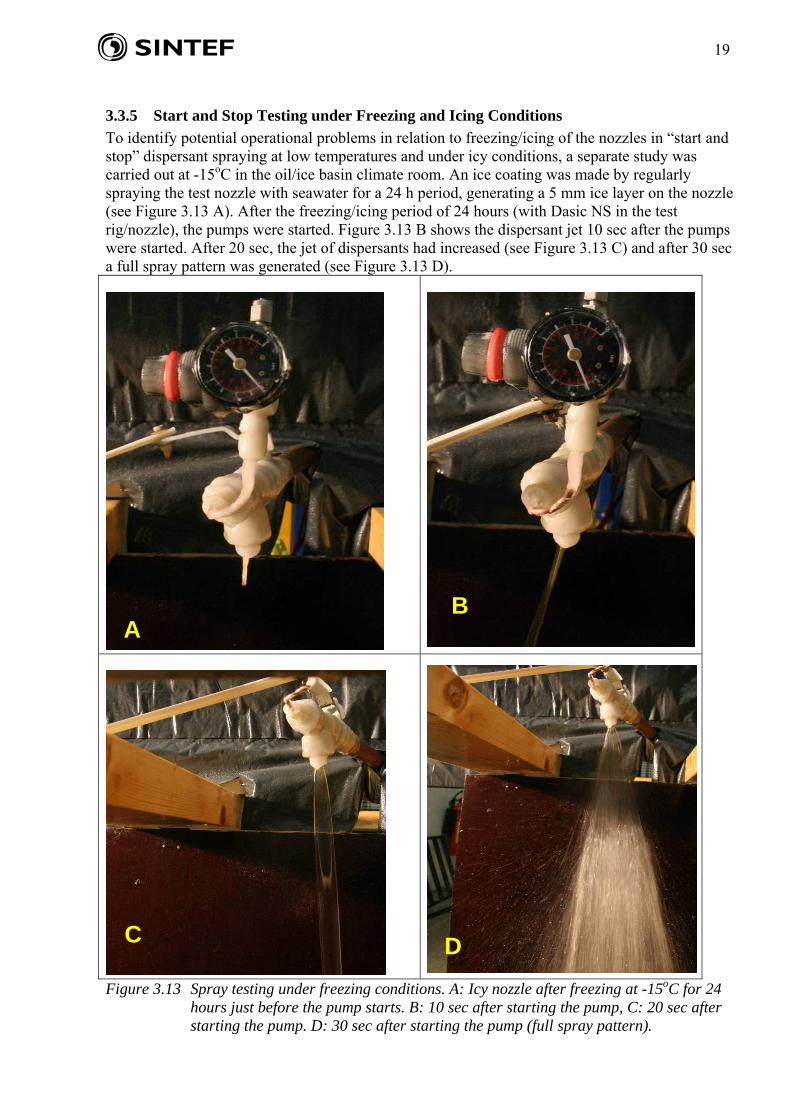
3.3.5 Start and Stop Testing under Freezing and Icing Conditions
To identify potential operational problems in relation to freezing/icing of the nozzles in “start and stop” dispersant spraying at low temperatures and under icy conditions, a separate study was carried out at -15oC in the oil/ice basin climate room. An ice coating was made by regularly spraying the test nozzle with seawater for a 24 h period, generating a 5 mm ice layer on the nozzle (see Figure 3.13 A). After the freezing/icing period of 24 hours (with Dasic NS in the test rig/nozzle), the pumps were started. Figure 3.13 B shows the dispersant jet 10 sec after the pumps were started. After 20 sec, the jet of dispersants had increased (see Figure 3.13 C) and after 30 sec a full spray pattern was generated (see Figure 3.13 D).
Figure 3.13 Spray testing under freezing conditions. A: Icy nozzle after freezing at -15oC for 24 hours just before the pump starts. B: 10 sec after starting the pump, C: 20 sec after starting the pump. D: 30 sec after starting the pump (full spray pattern).
C
B A
D
20
This experiment indicated that there is a small risk for nozzle “blocking.” The dispersant is able to pass through the icy layer and a full opening of the nozzle slit, giving a full spray pattern that was obtained within 30 sec.
3.4 Conclusions/Recommendations
Based on this laboratory dispersant spray testing under cold conditions using the JBM 2124 Nozzle with a 45o flat spray pattern, the following conclusions were able to be drawn:
There are large differences in the physical properties of the two dispersants tested which can be very critical for generating a good spray pattern. The critical (minimum) storage dispersant temperatures for ensuring a satisfactory delivery flow and good spray pattern using the two dispersants are:
Corexit 9500: 0ºC Dasic NS: -15ºC
Dispersants used for application under very cold conditions should therefore be stored in temperate/heated containers (preferably at 10 to 20ºC).
A minimum nozzle pressure of 2 bar (i.e. a flow rate of 10 L/min) is needed in order to obtain a good spray pattern with a good dispersant droplet size distribution (vmd < 1.5 mm).
No “plugging” of nozzles due to icing occurred during the start/stop testing at – 15oC; however, there was no optimal spray pattern for the dispersant cooled in the hoses between the nozzles and the dispersant storage tank.
A recirculating flow system can avoid the dispersant in the hoses between the spray nozzles and storage tank being cooled to ambient temperature during “stop” periods.
It is important to take the aforementioned findings and observations into account in the further development of the spray arm system in order to avoid operational problems during application in cold conditions. The nozzle used in the laboratory testing (JBM 2124 with a 45o flat spray pattern) will then give flow rates and dispersant droplet size distributions that are considered optimal when spraying dispersant under cold conditions onto relatively thick oil layers in ice.
As a result, a decision was made to continue using this nozzle type as the basis for further design of the spray arm in addition to using a pump system that delivers a constant nozzle pressure of 2 bar (i.e. a flow rate of 10 L/min per nozzle) during the spray operation.
21
4 Design, Construction and Laboratory Testing of the Spray Arm Prototype
4.1 Criteria for the Design and Construction of the Prototype
The objective of the ARCTECH P4 project is to develop a prototype for the new dispersant application system optimized primarily for use under Arctic conditions that will allow for a more flexible application between the floes. The following criteria formed the basis for the design of the spray system:
It should be based on maneuverable hydraulic spraying arms instead of traditional “static” arms with a fixed length.
It should be easily transportable. It should be protected from icing (containerized). It should be operated from a wide range of vessels. The system should be operated by a remote control unit (from the bridge or the bow).
Based on these criteria, Jason Eng. started (in close dialogue with SINTEF) the construction of the prototype in the autumn of 2008. In March 2009, the first version (Version 01) of the prototype was ready for functionality testing (see Chapter 4.3).
4.2 General Description of the Spraying System Prototype (Version 01) - Technical Specifications:
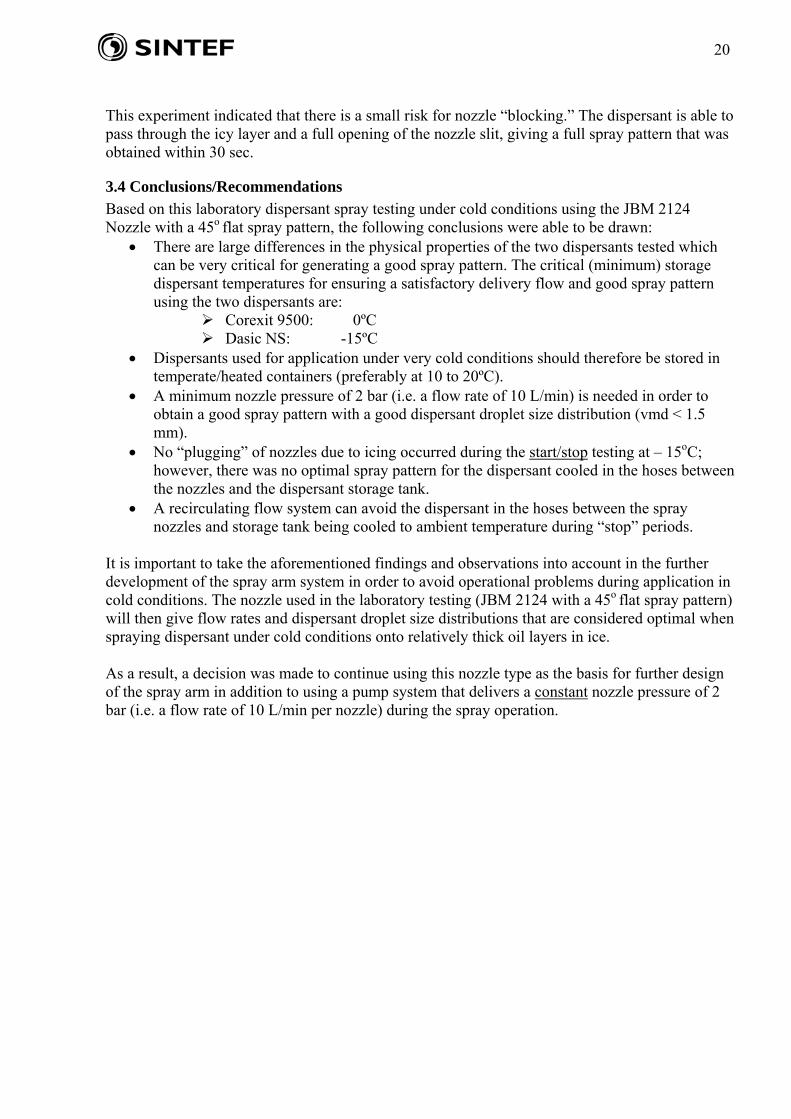
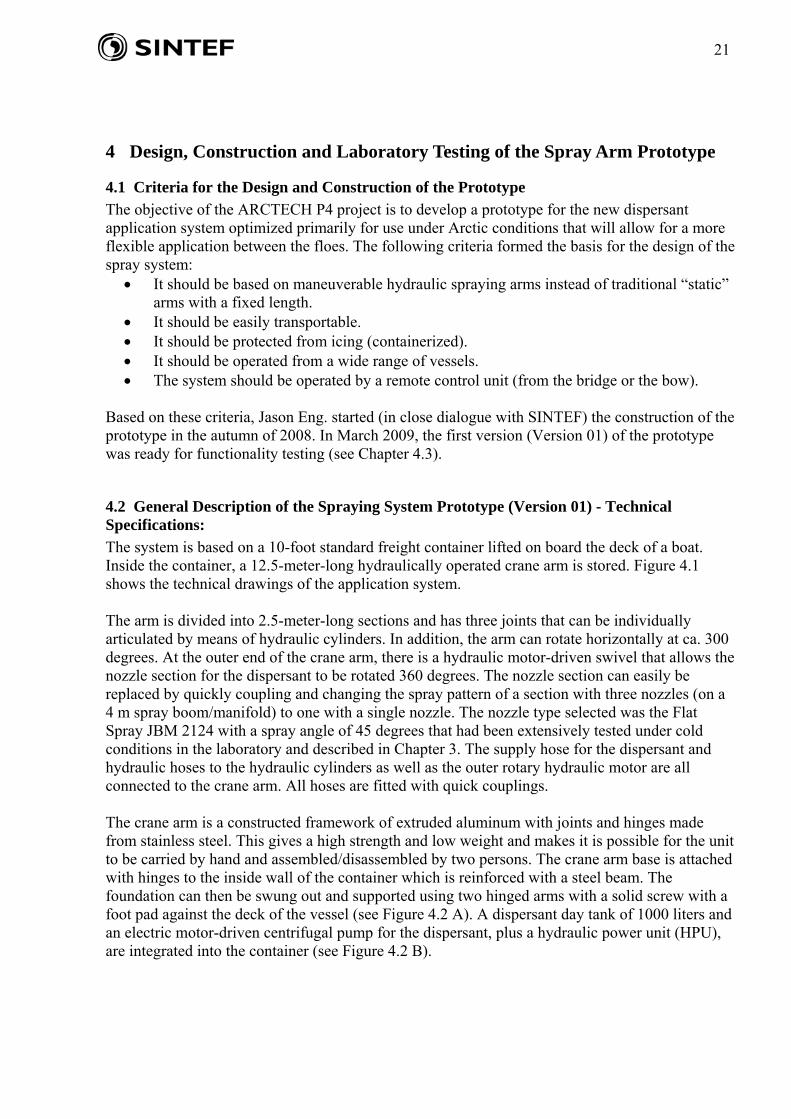
The system is based on a 10-foot standard freight container lifted on board the deck of a boat. Inside the container, a 12.5-meter-long hydraulically operated crane arm is stored. Figure 4.1 shows the technical drawings of the application system. The arm is divided into 2.5-meter-long sections and has three joints that can be individually articulated by means of hydraulic cylinders. In addition, the arm can rotate horizontally at ca. 300 degrees. At the outer end of the crane arm, there is a hydraulic motor-driven swivel that allows the nozzle section for the dispersant to be rotated 360 degrees. The nozzle section can easily be replaced by quickly coupling and changing the spray pattern of a section with three nozzles (on a 4 m spray boom/manifold) to one with a single nozzle. The nozzle type selected was the Flat Spray JBM 2124 with a spray angle of 45 degrees that had been extensively tested under cold conditions in the laboratory and described in Chapter 3. The supply hose for the dispersant and hydraulic hoses to the hydraulic cylinders as well as the outer rotary hydraulic motor are all connected to the crane arm. All hoses are fitted with quick couplings. The crane arm is a constructed framework of extruded aluminum with joints and hinges made from stainless steel. This gives a high strength and low weight and makes it is possible for the unit to be carried by hand and assembled/disassembled by two persons. The crane arm base is attached with hinges to the inside wall of the container which is reinforced with a steel beam. The foundation can then be swung out and supported using two hinged arms with a solid screw with a foot pad against the deck of the vessel (see Figure 4.2 A). A dispersant day tank of 1000 liters and an electric motor-driven centrifugal pump for the dispersant, plus a hydraulic power unit (HPU), are integrated into the container (see Figure 4.2 B).
22
Figure 4.1 The first technical drawings of the application system prototype (Version 01).
158 - 10/10/2009Applied Chemistry
Figure 4.2 A: During construction of the spray arm at Jason Engineering, autumn 2008. B: Showing the container system with all the spraying units installed, March 2009.
The dispersant tank, pumps and necessary valves are installed in an isolated section of the container with electrical trace heating in the floor. Dispersant liquid can also be circulated with a pump through a heat exchanger that uses the HPU as the heating source. The dispersant in the hoses between the nozzles and dispersant is continuously circulated in order avoid cooling in, e.g. “stop” periods during application under cold conditions. An electric control cabinet is attached to the wall inside the container, while another cabinet with hydraulic control valves is mounted on the gearbox for rotation of the crane arm. All control functions are controlled from a portable control panel equipped with a 15 m flexible cable and plug-in connector.
A B
23
The total amount of required electrical power supply is about 5 kW via a flexible cable and a 3-phase connector in the container wall (230 V). The container is equipped with interior lighting and a single phase socket for electric hand tools, etc. Main Technical Data: Outer Dimensions: L x W x H = 2980 x 2435 x 2600 mm Total Weight: 2000 kg Crane Section Weight: 30 kg Length of Section: 2.5 m Number of Sections: 5 (plus nozzle section) Tank Volume: 1000 liters (possible refilling during operation) Motor Disp. Pump: 1.5 kW (230V) Motor HPU: 3.0 kW Nozzles: delivered by PNR (UK), Type: JBM 2124, with a flat spray pattern (45o spray angle) and a manufacturer’s reported spray capacity of ca. 12.4 l/min at 3 bar (water) and 10 l/min at 2 bar Total Design Flow Rate: 30 l/min (3 nozzles)
4.3 Experimental Setup for Laboratory Testing of Prototype (Version 01)
A large-scale functionality testing of the prototype (Version 01) was performed at SINTEF’s climate laboratory in Trondheim from March 23rd- 27th 2009.
4.3.1 Testing Purpose
The purpose was to test relevant operational functions of the entire application under a “normal” Arctic application temperature (i.e. -5°C), while some critical functions were also tested at -15°C. The aim was to identify operational limitations or possible changes in functionalities when operating at temperatures down to -15oC (both with/without wind chilling). After this laboratory testing, minor modifications/improvements were carried out at Jason Eng. in Drammen during April before the modified version (Version 02) was transported to Longyearbyen and installed on the RV Lance for participation at FEX 2009 (see Chapter 5).
4.3.2 Test Conditions and Measuring Parameters (Methods)
The testing was performed under temperature controlled conditions in the cold climates laboratory at SINTEF’s SeaLab, investigating the following test parameters/variables:
Room temperatures: -5ºC and -15ºC; Container (dispersant) temperature: 20ºC; Dispersants: Corexit 9500 (pre-testing using water)
Inlet (pump) pressures: 3-6.5 bar.
The testing included the following operational and measuring parameters: Installation time; Introductory testing: pressure drop and flow rate using water at 20ºC; Heating capacity in dispersant day tank; Testing spray pattern and application height; Pressure drop and flow rate using Corexit 9500 at -5ºC; Start/stop testing at -15oC without recirculation; Operational maneuverability training of hydraulic spray arm.
Figure 4.3 shows the positions of the sensors for pressure and temperature measurements of the
24
system:
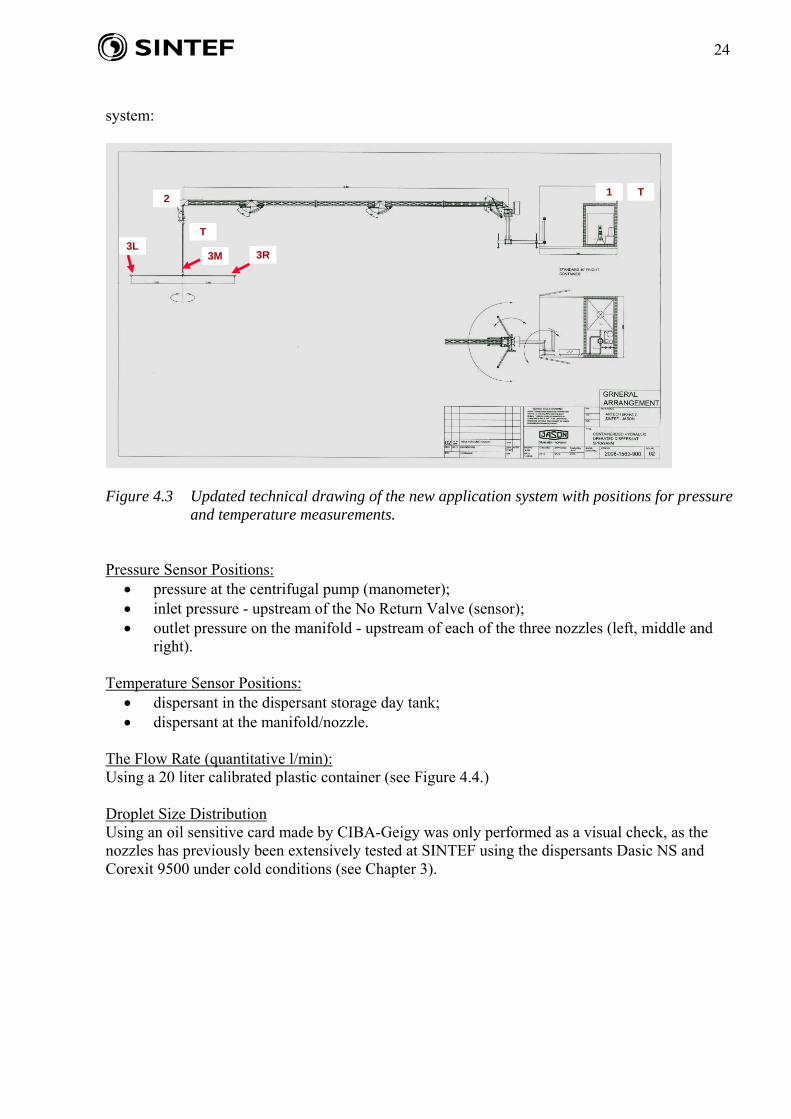
Figure 4.3 Updated technical drawing of the new application system with positions for pressure
and temperature measurements. Pressure Sensor Positions:
pressure at the centrifugal pump (manometer); inlet pressure - upstream of the No Return Valve (sensor); outlet pressure on the manifold - upstream of each of the three nozzles (left, middle and
right).
Temperature Sensor Positions: dispersant in the dispersant storage day tank; dispersant at the manifold/nozzle.
The Flow Rate (quantitative l/min): Using a 20 liter calibrated plastic container (see Figure 4.4.) Droplet Size Distribution Using an oil sensitive card made by CIBA-Geigy was only performed as a visual check, as the nozzles has previously been extensively tested at SINTEF using the dispersants Dasic NS and Corexit 9500 under cold conditions (see Chapter 3).
1 2
3R 3L
T
T
3M

25
Figure 4.4 Picture taken during flow rate measurements.
4.4 Results and Discussion of Laboratory Testing
4.4.1 Installation/Rigging of the Spraying Container in the SINTEF Basin
The installation of the container in the SINTEF oil/ice basin was done during the afternoon of March 23rd. The rigging of the spraying arm went well, and the total rigging time was 1-1.5 hours for two persons.
4.4.2 Preliminary Testing - Pressure Drop and Flow Rate Using Water at 20oC
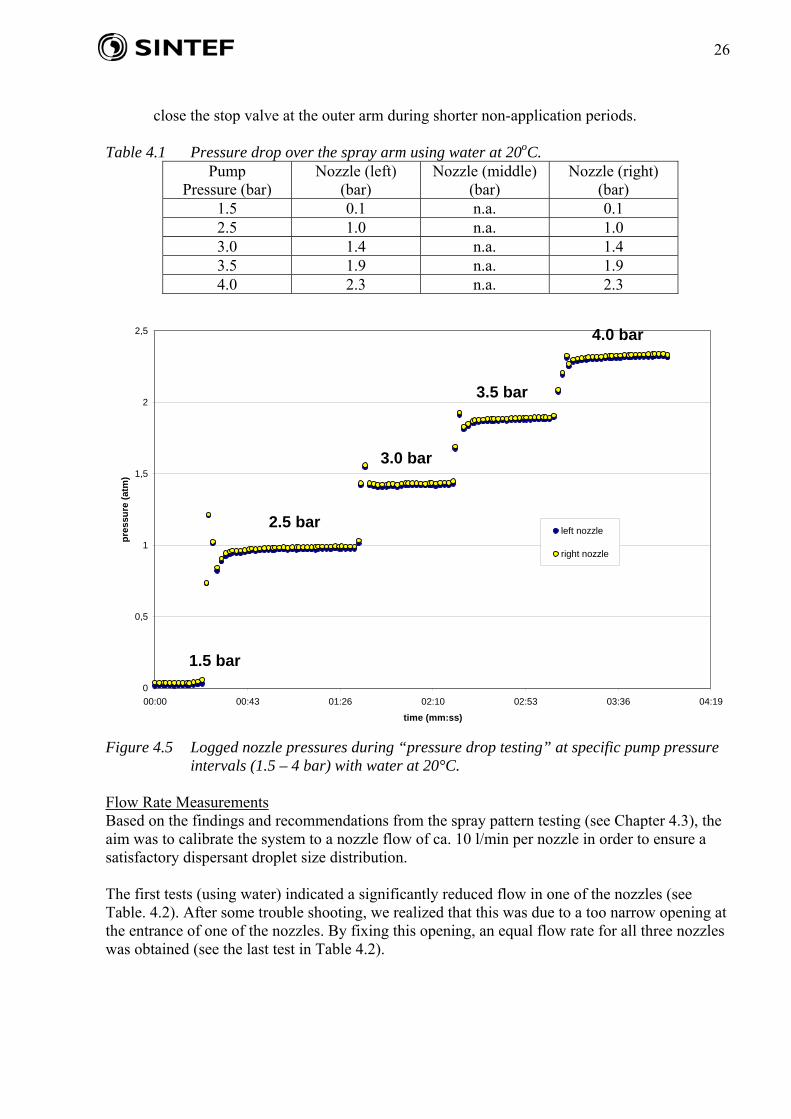
On the first test day (March 24th), some preliminary testing of pressure drop and flow rate measurement was performed with water: Pump Pressure The pump pressure varied from 1.5 to 4.0 bar. The outlet pressure at the nozzles was measured at 0.5 bar intervals. The results are presented in Table 4.1, and the continuous logged nozzle pressure measurements are presented in Figure 2.1. The following findings were identified in these introductory tests:
Generally speaking, the testing yielded very reproducible measurements. A pressure drop between the pump and nozzles was consistent (1.4-1.6 bar) over the pump
pressure area. This pressure drop is mainly connected to the No Return Valve (and limited due to the tubing).
A separate test started at an inlet pressure of 3 bar and gradually reduced the pump pressure to 1.4 bar with the NRV closed. A minimum pressure of 1.4 bar is needed to open the NRV.
A pump pressure of 0.5 bar (i.e. no flow through the NRV) is sufficient to open the re-circulation hose, giving a measured flow of 27 l/min. This flow is sufficient to keep the dispersant in the spray arm close to the required temperature, and it is not necessary to
26
close the stop valve at the outer arm during shorter non-application periods.
Table 4.1 Pressure drop over the spray arm using water at 20oC. Pump
Pressure (bar) Nozzle (left)
(bar) Nozzle (middle)
(bar) Nozzle (right)
(bar) 1.5 0.1 n.a. 0.1 2.5 1.0 n.a. 1.0 3.0 1.4 n.a. 1.4 3.5 1.9 n.a. 1.9 4.0 2.3 n.a. 2.3
0
0,5
1
1,5
2
2,5
00:00 00:43 01:26 02:10 02:53 03:36 04:19
time (mm:ss)
pre
ssu
re (
atm
)
left nozzle
right nozzle
Figure 4.5 Logged nozzle pressures during “pressure drop testing” at specific pump pressure intervals (1.5 – 4 bar) with water at 20°C.
Flow Rate Measurements Based on the findings and recommendations from the spray pattern testing (see Chapter 4.3), the aim was to calibrate the system to a nozzle flow of ca. 10 l/min per nozzle in order to ensure a satisfactory dispersant droplet size distribution. The first tests (using water) indicated a significantly reduced flow in one of the nozzles (see Table. 4.2). After some trouble shooting, we realized that this was due to a too narrow opening at the entrance of one of the nozzles. By fixing this opening, an equal flow rate for all three nozzles was obtained (see the last test in Table 4.2).
1.5 bar
2.5 bar
3.0 bar
3.5 bar
4.0 bar
27
Table 4.2 Flow rate (l/min) from the three nozzles using water at 20oC.
March 24th Time
Pump (bar) Nozzle (left) l/min
Nozzle (middle) l/min
Nozzle (right) l/min
16:20 3.5 9.0 10.5 10.7 Changed Nozzle
16:25 3.5 9.1 10.4 10.5 Realized that the opening to the nozzle was too narrow and was fixed:
16:50 3.5 10.6 10.4 10.6
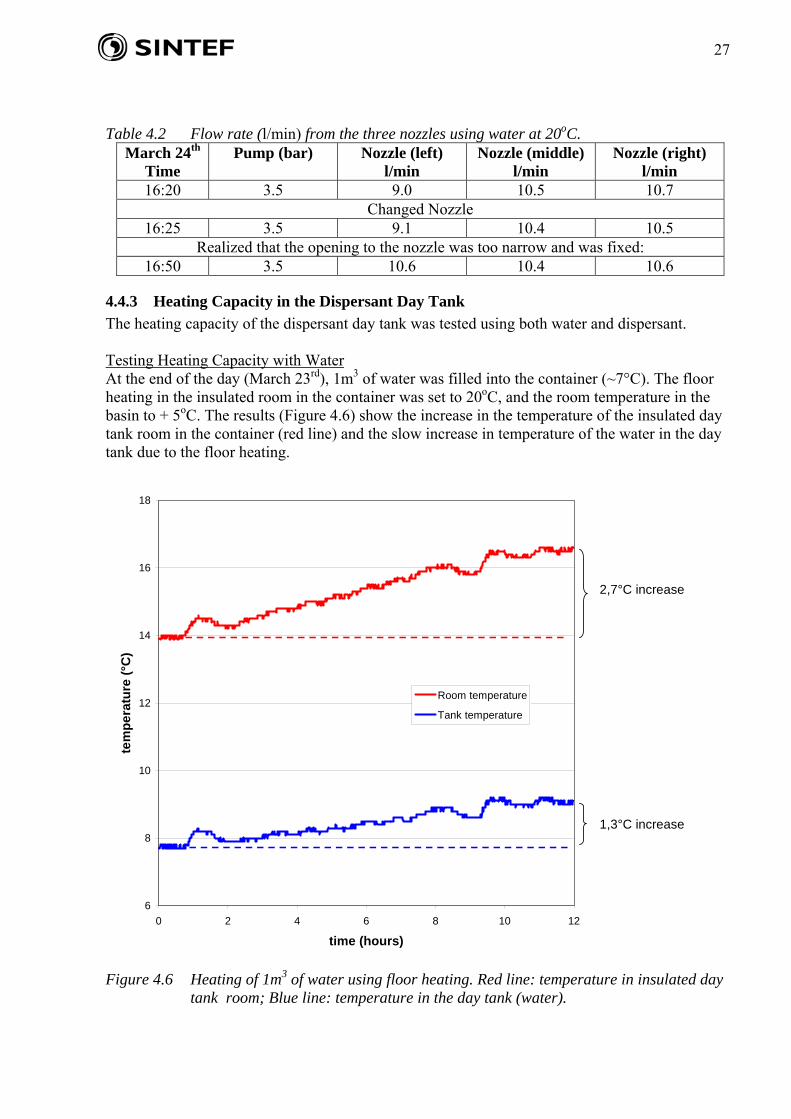
4.4.3 Heating Capacity in the Dispersant Day Tank
The heating capacity of the dispersant day tank was tested using both water and dispersant. Testing Heating Capacity with Water At the end of the day (March 23rd), 1m3 of water was filled into the container (~7°C). The floor heating in the insulated room in the container was set to 20oC, and the room temperature in the basin to + 5oC. The results (Figure 4.6) show the increase in the temperature of the insulated day tank room in the container (red line) and the slow increase in temperature of the water in the day tank due to the floor heating.
6
8
10
12
14
16
18
0 2 4 6 8 10 12
time (hours)
tem
pe
ratu
re (
°C)
Room temperature
Tank temperature
2,7°C increase
1,3°C increase
Figure 4.6 Heating of 1m3 of water using floor heating. Red line: temperature in insulated day tank room; Blue line: temperature in the day tank (water).
28
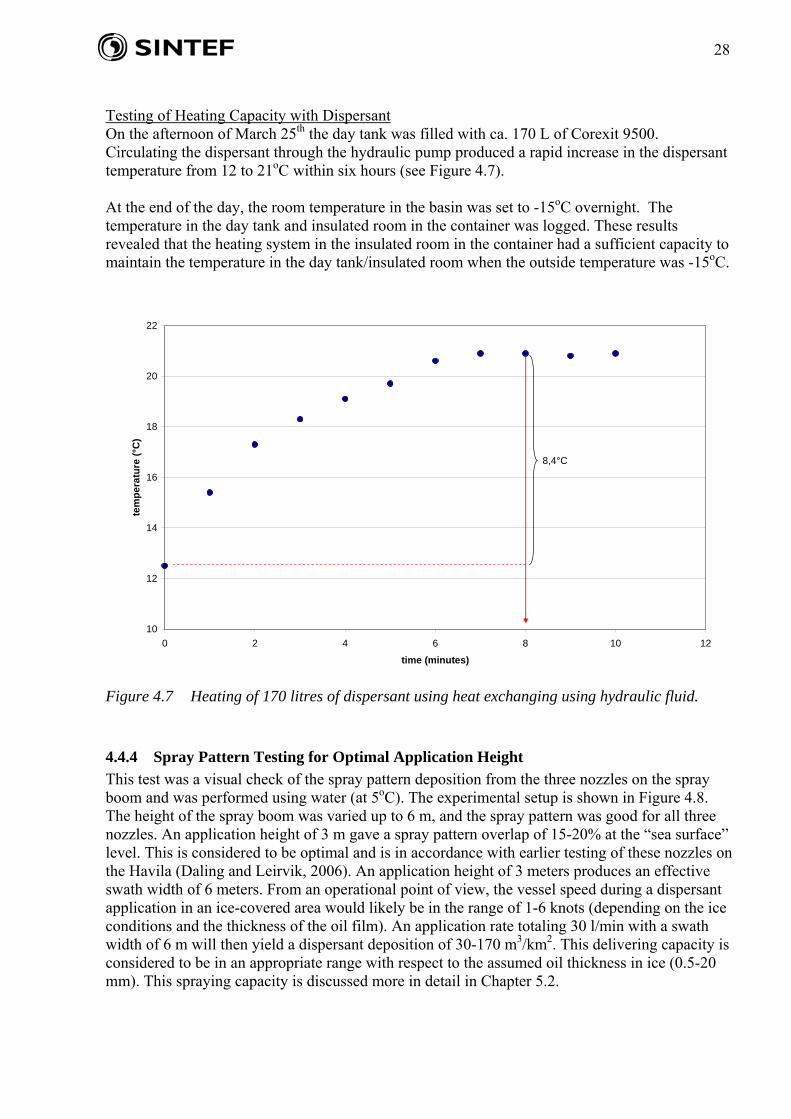
Testing of Heating Capacity with Dispersant On the afternoon of March 25th the day tank was filled with ca. 170 L of Corexit 9500. Circulating the dispersant through the hydraulic pump produced a rapid increase in the dispersant temperature from 12 to 21oC within six hours (see Figure 4.7). At the end of the day, the room temperature in the basin was set to -15oC overnight. The temperature in the day tank and insulated room in the container was logged. These results revealed that the heating system in the insulated room in the container had a sufficient capacity to maintain the temperature in the day tank/insulated room when the outside temperature was -15oC.
10
12
14
16
18
20
22
0 2 4 6 8 10 12
time (minutes)
tem
per
atu
re (
°C)
8,4°C
Figure 4.7 Heating of 170 litres of dispersant using heat exchanging using hydraulic fluid.
4.4.4 Spray Pattern Testing for Optimal Application Height
This test was a visual check of the spray pattern deposition from the three nozzles on the spray boom and was performed using water (at 5oC). The experimental setup is shown in Figure 4.8. The height of the spray boom was varied up to 6 m, and the spray pattern was good for all three nozzles. An application height of 3 m gave a spray pattern overlap of 15-20% at the “sea surface” level. This is considered to be optimal and is in accordance with earlier testing of these nozzles on the Havila (Daling and Leirvik, 2006). An application height of 3 meters produces an effective swath width of 6 meters. From an operational point of view, the vessel speed during a dispersant application in an ice-covered area would likely be in the range of 1-6 knots (depending on the ice conditions and the thickness of the oil film). An application rate totaling 30 l/min with a swath width of 6 m will then yield a dispersant deposition of 30-170 m3/km2. This delivering capacity is considered to be in an appropriate range with respect to the assumed oil thickness in ice (0.5-20 mm). This spraying capacity is discussed more in detail in Chapter 5.2.

29
Figure 4.8 Image from the spray pattern testing. Red lines indicate an operative (average) spray angle of 22.5°.
4.4.5 Pressure Drop and Flow Rate Measurements Using Corexit 9500
The day before the tests (March 24th), the day tank was filled with 170 liters of Corexit 9500. During the night, the dispersant was heated to ca. 20oC (i.e. a viscosity of ca. 70-80 cP) by circulating it through the hydraulic pump (see Chapter 4.4.3). Prior to the testing, the ambient temperature in the room was set at -5oC. The pump pressure was varied from 1.8 to a maximum of 3.2 bar. The inlet pressure in front of the NRV (Pos. 2 in Figure 4.3) and on the two outer nozzles was measured at 0.5 bar intervals. The results are presented in Table 4.3, the continuous logged outlet pressures are presented in Figure 4.9 and the flow rates at maximum pump pressure are given in Table 4.4. The results are consistent with the measurements taken when using water (see Chapter 4.4.2) up to an outlet pressure of 3 bar. The pressure drop between the pump and through the hosing (before the No Return Valve) seem to be ca. 0.2 bar, while the pressure drop through the NRV also seems to be 1.4 bar when using dispersant, thus giving an overall nozzle pressure drop of 1.6 bar compared to the pump pressure. Due to a maximum pump frequency delivery of 50 Hz, the pump was not able to deliver a higher pressure than 3.2 bar when using the Corexit 9500 dispersant. This resulted in a nozzle pressure that was too low (1.6 bar instead of the hoped for 2 bar) and a flow rate that was also slightly too low (Table 4.4.).

30
Table 4.3 Pressure drop over the spray arm using Corexit 9500 with an ambient room
temperature of -5oC. March 25th
Time Pump Pressure
(bar) Prior No Return
Valve (inlet pressure - bar)
Nozzle (left) (bar)
Nozzle (right) (bar)
15:50 1.8 1.7 0.5 0.5 16:00 2.5 2.3 1.0 1.0 16:02 3.0 2.8 1.4 1.4 16:05 3.2 3.0 1.6 1.6
Further testing was stopped because of a failure to obtain a higher pressure on the dispersant pump.
0
0,5
1
1,5
2
2,5
3
3,5
00:00 00:43 01:26 02:10 02:53 03:36 04:19 05:02
time (mm:ss)
pre
ssu
re (
bar
)
before bp valve
left nozzle
right nozzle
Figure 4.9 Logged nozzle pressures and pressure in front of the No Return Valve during
“pressure drop testing” with dispersant at -5°C. Table 4.4 Flow rate (l/min) from the three nozzles using Corexit 9500, with an ambient room
temperature of -5oC.
March 25th Time
Pump (bar) Nozzle (left) l/min
Nozzle (middle) l/min
Nozzle (right) l/min
16:50 3.1 9.5 9.7 9.5 16:57 3.1 9.4 9.5 9.4
31
Due to pump limitations, it was decided to stop this test. To increase the pressure capacity of the pump, it was decided to adjust the frequency of the pump when the spray system was sent back to Jason Eng. after the testing in Trondheim (see action point in Chapter 4.5).
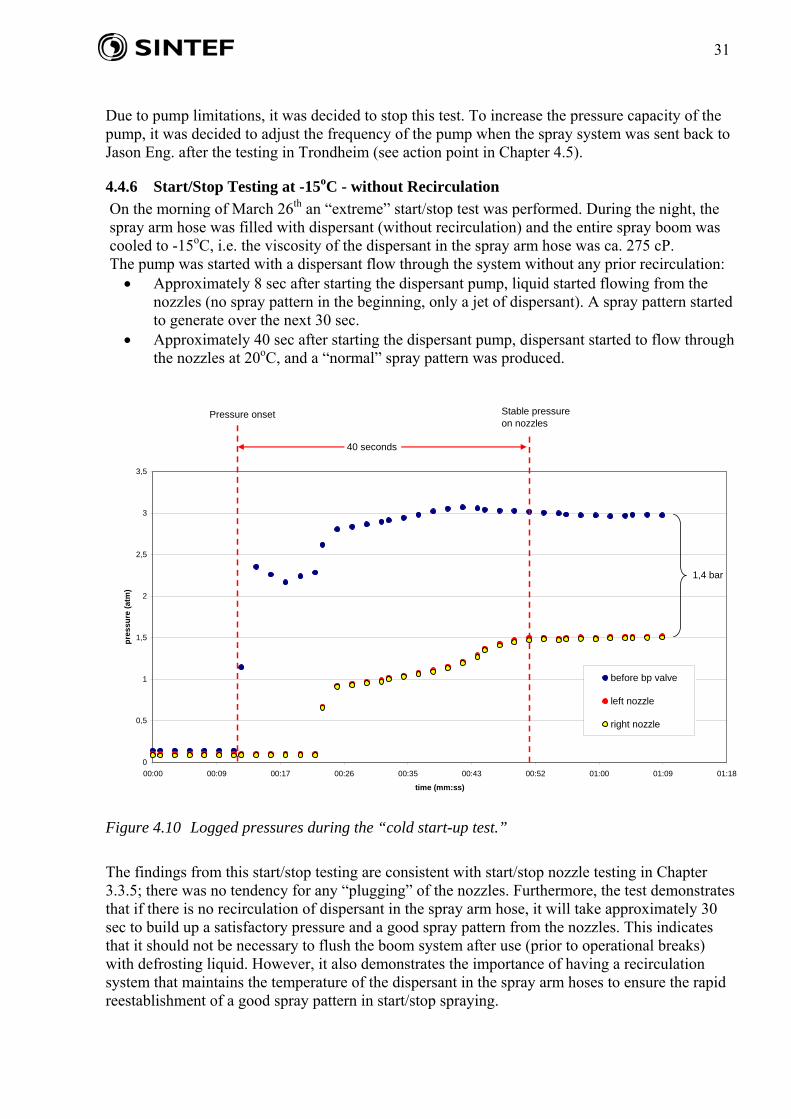
4.4.6 Start/Stop Testing at -15oC - without Recirculation
On the morning of March 26th an “extreme” start/stop test was performed. During the night, the spray arm hose was filled with dispersant (without recirculation) and the entire spray boom was cooled to -15oC, i.e. the viscosity of the dispersant in the spray arm hose was ca. 275 cP. The pump was started with a dispersant flow through the system without any prior recirculation: Approximately 8 sec after starting the dispersant pump, liquid started flowing from the
nozzles (no spray pattern in the beginning, only a jet of dispersant). A spray pattern started to generate over the next 30 sec.
Approximately 40 sec after starting the dispersant pump, dispersant started to flow through the nozzles at 20oC, and a “normal” spray pattern was produced.
0
0,5
1
1,5
2
2,5
3
3,5
00:00 00:09 00:17 00:26 00:35 00:43 00:52 01:00 01:09 01:18
time (mm:ss)
pre
ssu
re (
atm
)
before bp valve
left nozzle
right nozzle
Pressure onset Stable pressure on nozzles
40 seconds
1,4 bar
Figure 4.10 Logged pressures during the “cold start-up test.”
The findings from this start/stop testing are consistent with start/stop nozzle testing in Chapter 3.3.5; there was no tendency for any “plugging” of the nozzles. Furthermore, the test demonstrates that if there is no recirculation of dispersant in the spray arm hose, it will take approximately 30 sec to build up a satisfactory pressure and a good spray pattern from the nozzles. This indicates that it should not be necessary to flush the boom system after use (prior to operational breaks) with defrosting liquid. However, it also demonstrates the importance of having a recirculation system that maintains the temperature of the dispersant in the spray arm hoses to ensure the rapid reestablishment of a good spray pattern in start/stop spraying.
32
4.4.7 Operational Maneuverable Training of Hydraulic Spray Arm
The last day of testing at SINTEF in March was connected to the functionality and maneuverability of the hydraulic spray arm. The following conclusions were made based on the experiences acquired when operating the system:
The spray arm needs a higher degree of “bending angle” in order to be applied more closely to the side of the ship. This implies that the: - inner arm section needs to be steeper (see action points) - middle/outer arms need a better bending angle (90ºs, see action points);
Up/down movements have to be optimized after changing to 50 cm pistons (see action points);
A more robust hinge system between the swivel motor and the down tube for the rotation of the boom is needed (see action point).
4.5 Summary/Action Points Taken before FEX 2009
The laboratory testing of this first version of the spray arm prototype at SINTEF’s laboratory in March was found to be very useful for documenting relevant operational functionalities (see, e.g. development of spraying deposition diagrams in Chapter 5.2) and in identifying weaknesses and potential improvements. The following conclusions and action points were taken in order to modify/optimize the prototype prior to the field trial in May 2009. Container
1. The frequency of the dispersant pump has to be increased from 50 to 60 Hz. The pump will then be able to deliver a needed pressure of at least 3.5 bar in order to obtain an inlet pressure of ca 2.0 bar on the nozzles, thereby giving the necessary delivery rate of 10 l/min on each nozzle.
2. The display of the manometer on the dispersant pump should be installed on the wall outside the insolated room in the container.
3. Install a sounding pipe on the dispersant day tank. 4. The refill of dispersant to the day tank through a connector on the wall outside the
insulated room.
Spray Arm 5. A more robust and stable foundation hinged to the inside wall of the container has to be
reinforced with a steel beam. Using solid screws, the two support hinged arms with foot pads against the vessel deck have to be reinforced.
6. Change all the hydraulic pistons from 30 to 50 cm in length. Also of importance for performing applications close to the ship’s hull:
a. The inner boom arm section needs to have the possibility for a steeper position (“ a one o’clock position”) and a flexible position (three options for fastening the pistons);
b. The middle and outer spray arm sections need to have the possibility for a 90º bending angle.
7. Optimize the movement for each hydraulic piston (particularly the up/down movement).
Spray boom/Nozzles 8. The hinge between the swivel motor and the outer down tube section needs to be more
stable. 9. Flexible lengths of down tubes (1, 2 and 3 m) should be included in the system in order to
obtain an ideal application height for the specific vessel. 10. Install a drain valve (with a rapid coupling) beneath the No Return Valve.

33
11. The hydraulic motor-driven swivel for rotation of the spray boom/nozzles needs a more
robust coupling. 12. “Emergency stop” push bottom on the spray arm! 13. “Support feet” at the end of the spraying boom (manifold) for protecting the nozzles.
Miscellaneous Items (need to be in the container when going into the field)
Three barrels of dispersant (Corexit EC9500) in addition to the remaining dispersant in the day tank;
Pneumatic barrel pump; Spare parts: No Return Valve, nozzles, spray booms, down tubes, etc. 3 x 20 L calibrated plastic containers/tarpaulins (for possible on site testing/calibration of
spray arm in the field).
4.6 Upgrading the Prototype (Version 02) Prior to FEX 2009
In the period between the laboratory testing of the prototype at SINTEF in March and the FEX field trial in May, the system was brought back to Jason’s facilities in Drammen and modified according to the action points described in Chapter 4.5. The picture below (Figure 4.11) was taken during this upgrading and demonstrates the improved bending flexibility of the spray arm after the exchange of hydraulic pistons.
Figure 4.11 The upgrading of the spray arm prototype at Jason’s facilities in April of 2009
(photo by Jason).
34
5 Field Validation of the Spray Arm Prototype during FEX 2009
5.1 Background/Objectives
The next step in the development of the new dispersant spray arm was to test the prototype in real Arctic field conditions during the large-scale field experiment (FEX 2009) that took place in the marginal ice zone in the Barents Sea northeast of Hopen during the period between May 9-May 25, 2009 (Sørstrøm, 2009). The main objective was to validate the operational applicability of the prototype using Corexit EC9500 dispersant on two dispersant-dedicated slicks, using stabilized Troll crude oil:
Release P4.1 (0.5 m3) was a “pre-test slick” planned to be treated after approx. 1 hour of weathering;
Release P4.2 (2 m3) was planned to be treated after 0.5 day of weathering. In addition to the visual documentation of the application operations, a monitoring of the oil’s weathering properties before dispersant application, as well as an in situ monitoring of the concentration and oil droplet size distribution in the water column after dispersant application, was performed. In addition to the planned scientific dispersant tests dedicated through the P4 slicks, the dispersant application was a response/contingency option for the major 7 m3 P1.2 slick (Sørstrøm, 2009). On May 21st, it was decided to use dispersants on the remaining P1.2 slick. At that time, the slick had been weathered and monitored for six days before it was decided to terminate the experiment and treat the remaining surface oil/emulsion using the dispersant Corexit (0.3 m3) and Dasic Slickgone NS (0.7 m3). At that weathering stage the surface oil was still dispersible but not ignitable, or it had too low a thickness for in situ burning or mechanical recovery.
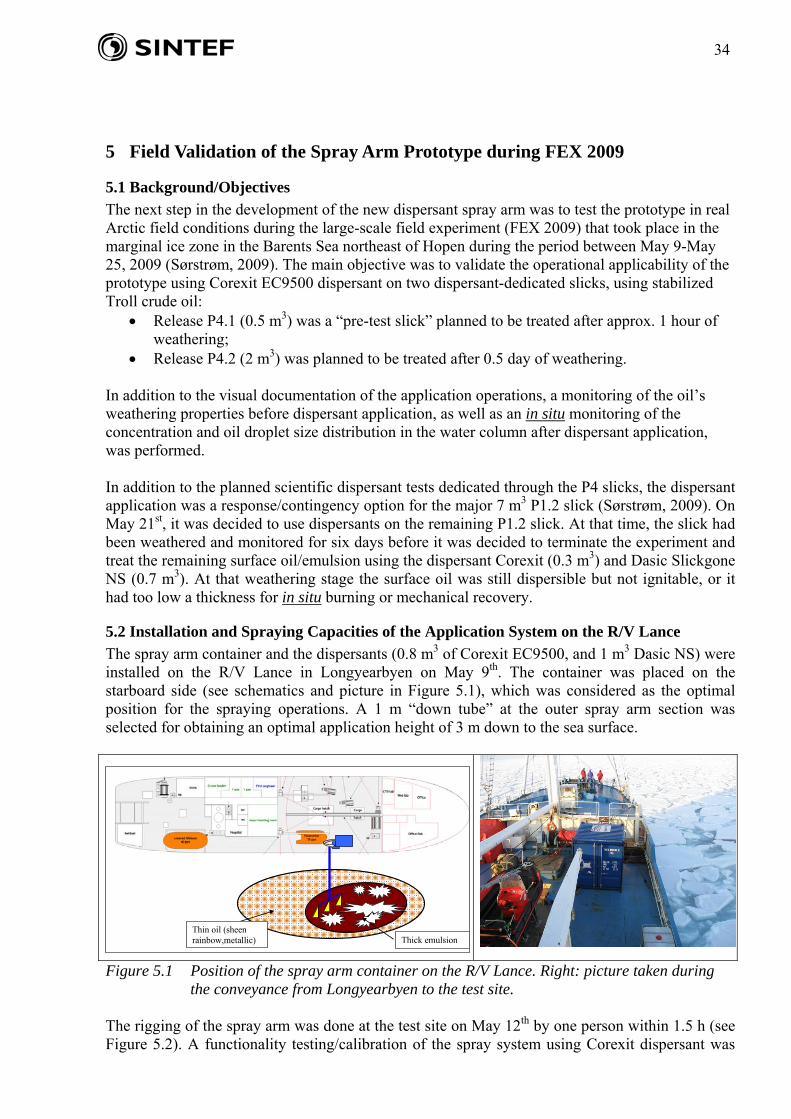
5.2 Installation and Spraying Capacities of the Application System on the R/V Lance
The spray arm container and the dispersants (0.8 m3 of Corexit EC9500, and 1 m3 Dasic NS) were installed on the R/V Lance in Longyearbyen on May 9th. The container was placed on the starboard side (see schematics and picture in Figure 5.1), which was considered as the optimal position for the spraying operations. A 1 m “down tube” at the outer spray arm section was selected for obtaining an optimal application height of 3 m down to the sea surface.
Thick emulsion Thin oil (sheen rainbow,metallic)
Figure 5.1 Position of the spray arm container on the R/V Lance. Right: picture taken during the conveyance from Longyearbyen to the test site.
The rigging of the spray arm was done at the test site on May 12th by one person within 1.5 h (see Figure 5.2). A functionality testing/calibration of the spray system using Corexit dispersant was
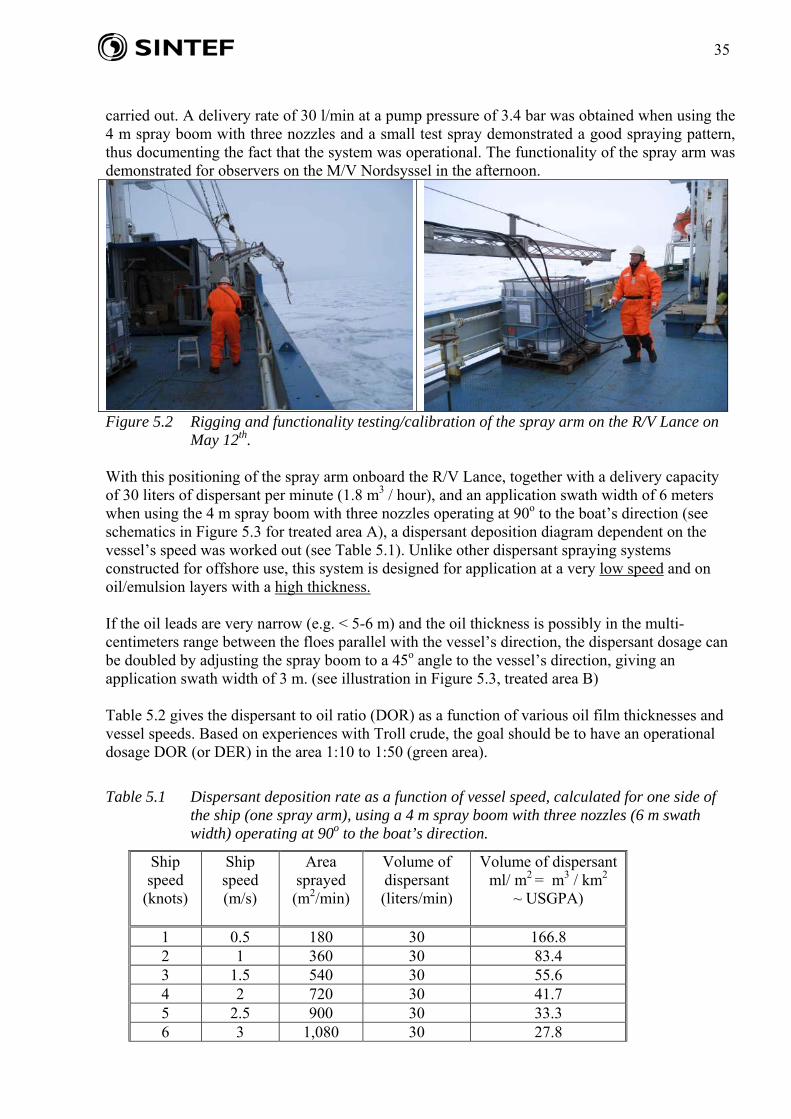
35
carried out. A delivery rate of 30 l/min at a pump pressure of 3.4 bar was obtained when using the 4 m spray boom with three nozzles and a small test spray demonstrated a good spraying pattern, thus documenting the fact that the system was operational. The functionality of the spray arm was demonstrated for observers on the M/V Nordsyssel in the afternoon.
Figure 5.2 Rigging and functionality testing/calibration of the spray arm on the R/V Lance on May 12th.
With this positioning of the spray arm onboard the R/V Lance, together with a delivery capacity of 30 liters of dispersant per minute (1.8 m3 / hour), and an application swath width of 6 meters when using the 4 m spray boom with three nozzles operating at 90o to the boat’s direction (see schematics in Figure 5.3 for treated area A), a dispersant deposition diagram dependent on the vessel’s speed was worked out (see Table 5.1). Unlike other dispersant spraying systems constructed for offshore use, this system is designed for application at a very low speed and on oil/emulsion layers with a high thickness. If the oil leads are very narrow (e.g. < 5-6 m) and the oil thickness is possibly in the multi-centimeters range between the floes parallel with the vessel’s direction, the dispersant dosage can be doubled by adjusting the spray boom to a 45o angle to the vessel’s direction, giving an application swath width of 3 m. (see illustration in Figure 5.3, treated area B) Table 5.2 gives the dispersant to oil ratio (DOR) as a function of various oil film thicknesses and vessel speeds. Based on experiences with Troll crude, the goal should be to have an operational dosage DOR (or DER) in the area 1:10 to 1:50 (green area).
Table 5.1 Dispersant deposition rate as a function of vessel speed, calculated for one side of the ship (one spray arm), using a 4 m spray boom with three nozzles (6 m swath width) operating at 90o to the boat’s direction.
Ship speed
(knots)
Ship speed (m/s)
Area sprayed (m2/min)
Volume of dispersant (liters/min)
Volume of dispersant ml/ m2 = m3 / km2
~ USGPA)
1 0.5 180 30 166.8 2 1 360 30 83.4 3 1.5 540 30 55.6 4 2 720 30 41.7 5 2.5 900 30 33.3 6 3 1,080 30 27.8

36
Figure 5.3 Schematic showing flexibility in adjusting the angle of the spray boom depending on
the width of the oil leads.
Table 5.2 Dispersant to Oil Ratio (DOR) as a function of oil film thickness and vessel speed, calculated for one side of the ship (one spray arm), using a 4 m spray boom with three nozzles (6 m swath width) operating at 90o to the boat’s direction. Aiming dosage area DOR (or DER) = 1: 10 - 1:50 (green area)
Ship speed
(knots)
DOR
on 0.5 mm thick
oil
DOR
on 1 mm thick oil
DOR
on 2 mm thick oil
DOR
on 5 mm thick oil
DOR
on 10 mm thick oil
DOR
on 20 mm thick oil
1 1:3 1:6 1:12 1:24 1:48 1:96 2 1:6 1:12 1:24 1:48 1:96 1:192 3 1:9 1:18 1:36 1:72 1:144 1:288 4 1:12 1:24 1:48 1:96 1:192 1:384 5 1:15 1:30 1:60 1:120 1:240 1:480 6 1:18 1:36 1:72 1:144 1:288 1:576
In situations where the leads of thick oil between the floes are more perpendicular to the vessel’s direction, sweeping the area by a horizontal rotation of the spray arm is a possible application approach. Figure 5.4 illustrates the maximum sweeping application for a semicircular area. It takes about 10 sec to rotate the spray arm from the maximum forward to the outer position (90o to the boat’s direction – see rotation A in Figure 5.4). This gives an effective “outward movement” of the spray boom of approximately 1 m/s (relative to the vessel’s movement). Figure 5.4 also illustrates the recommended horizontal rotations of the spray arm when applying on oil in leads perpendicular to the vessel’s direction: A: rotation when applying in “forward position,” B: rotation when applying in “backward position.” In situations where the slick is trapped only in very narrow leads, it is recommended to change to a one-nozzle mouthpiece (see Chapter 5.5).
: 6 m
Treated area A: Spray boom: 90o
Treated area B: Spray boom : 45o
6 m
3 m
Ice
Oil

37
Figure 5.4 Illustration of the sweeping application area of the dispersant spray arm on the R/V
Lance. A and B: Recommended horizontal rotations of the spray arm when applying on oil in leads perpendicular to the vessel’s direction.
The following chapters give a short description of the dispersant application operations of the three slicks.
5.3 Dispersant Application (Pre-Test) of 0.5 m3 Troll Crude (P4-1 Slick – Release 1)
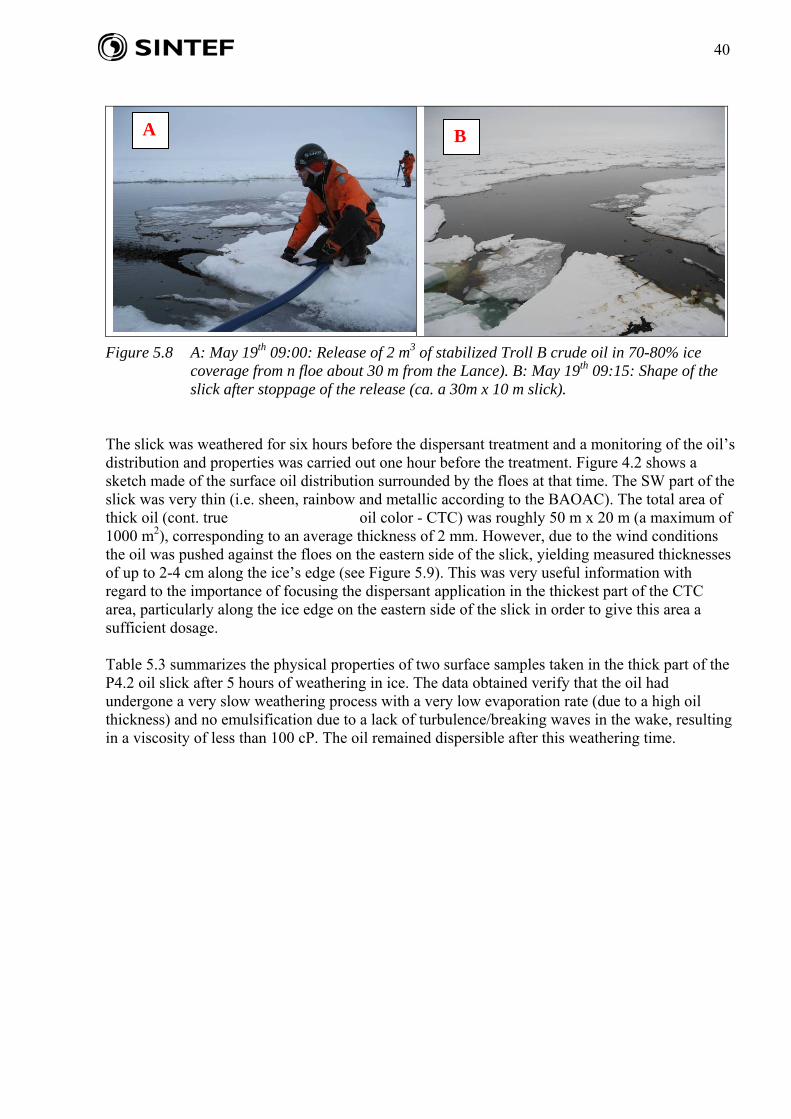
On Sunday afternoon, May 17th, a test site for the dispersant pre-test was defined in a wake/hole in the ice area of 70-80% ice coverage. Stabilized Troll B crude oil (0.5 m3) was released using a 10 m hose connected to the dispersant spray arm. By using the maneuverable hydraulic arm, the oil slick was released over an area of ca. 20 m x 5 m. Unfortunately, when the Lance was gently backing out from the slick, the oil slick was pushed slightly into more narrow leads between the floes (see Figure 5.5 and 5.6), which made it a challenge for the dispersant application.
The dispersant application was initiated about 0.5 h after the oil release. The triple-nozzle spray boom (4-meters long) mounted on the spray arm was used during dispersant application of this P4.1 test slick. In the first spray run (effective spraying time: ca. 2:50 min), 85 L of dispersant was applied on the oil in the leads, while the Lance was slowly moving forward. After the first spray run, about 15-20% of the oil area was left untreated. A repositioning of the Lance was then carried out in order to make a second spray run for another 1 min (= 30 L of dispersant), i.e. ca. 100 L of Corexit 9500 was applied in total. Due to high ice concentrations, the energy input in the oil/ice system was very low. The planned strategy was therefore to enhance the dispersion process by making use of the ship’s thrusters. About 15 min after the dispersant treatment, the Lance went along the side of the treated slick and used both its bow and rear thrusters. This resulted in a very effective turbulence that gave an immediate and significant dispersion of the treated oil. After ending the prop washing operation, only a weak, light brown color on the slush ice/edges on the floes was visible over an area of 200-300 m2 (see Figure 5.5). This lack of black/“true oil” color indicates thicknesses that likely correspond to “metallic” thicknesses (i.e. < 50-100 μm), and it was calculated that less than 20-50 L of oil remained on the surface after ending the 15 min of prop washing operations, indicating a
A
Oil to be treated
B
38
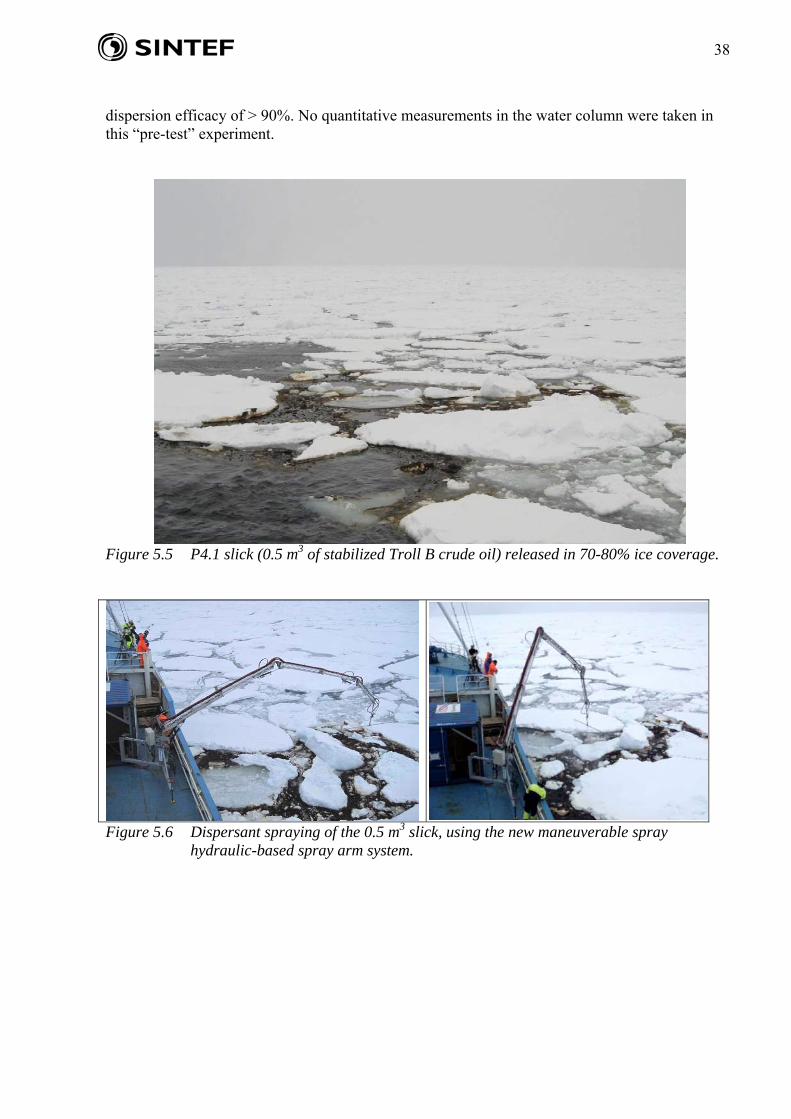
dispersion efficacy of > 90%. No quantitative measurements in the water column were taken in this “pre-test” experiment.
Figure 5.5 P4.1 slick (0.5 m3 of stabilized Troll B crude oil) released in 70-80% ice coverage.
Figure 5.6 Dispersant spraying of the 0.5 m3 slick, using the new maneuverable spray hydraulic-based spray arm system.

39
Figure 5.7 The remainder of the P4.1 slick one day after the dispersant treatment. Only a very
thin film of oil is left on the ice. Summary/Findings from the Dispersant Application of the 0.5 m3 P4.1 Pre-Test Slick:
Using the new dispersant spray arm in combination with the thrusters on the R/V Lance has been demonstrated to be a highly effective method for dispersing oil (in 70-80% ice coverage) into the water column.
It is estimated that <20-50 L of oil remained on the surface (only a thin sheen on the slush ice and the edges of the floes) after finishing the experiment.
This very small release was heavily squeezed into the dense ice, which resulted in a relatively high volume (85 L) of dispersant use relative to the 0.5 m3 of oil (giving an overall dispersant to oil ratio, DOR, of 1: 6).
In general, a 0.5 m3 oil slick is too small to gain any operational learning/experience with the spray system. However, the experience obtained from this pre-test was very valuable when designing the strategy for the 2 m3 P4.2. slick (Releas
e 2).
5.4 Dispersant Application of the P4-2 slick (2 m3 Troll Crude – Release 2)
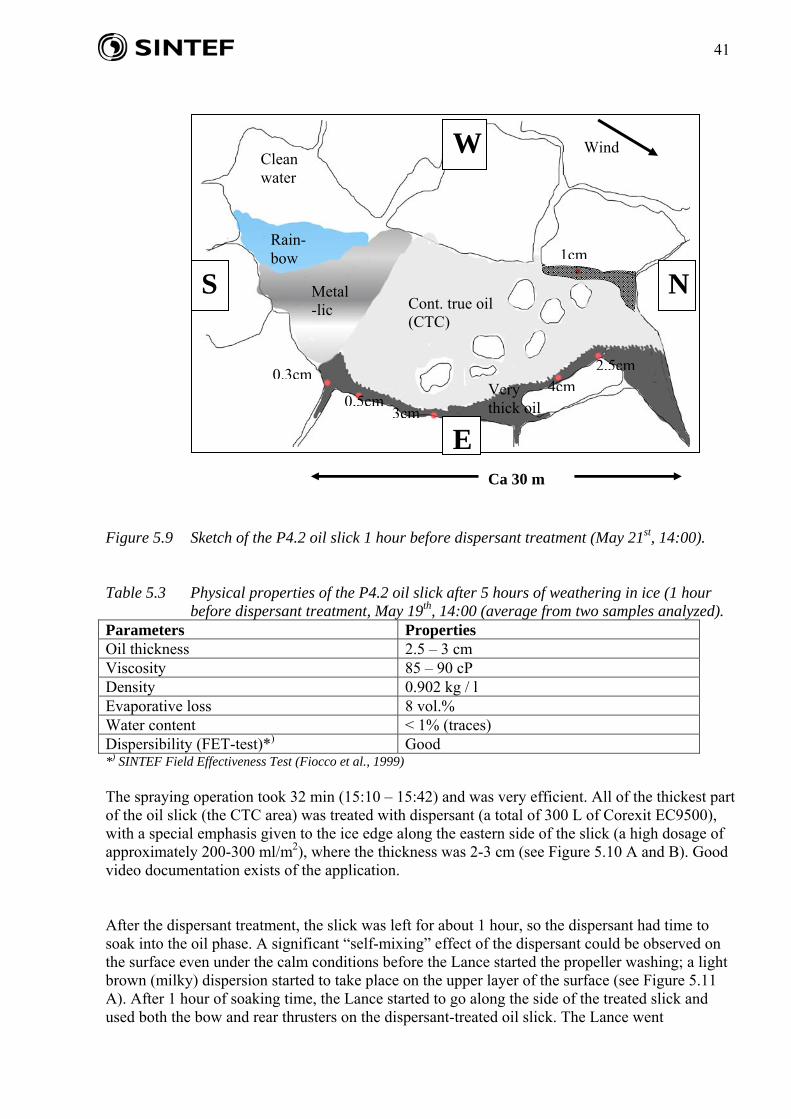
On the morning of Tuesday, May 19th, a test site was defined in the wake (approximately 100 x 30 m, see Figure 5.8B) of an area with 70-80% ice coverage. Based on the experience obtained from the pre-test release, the 2 m3 of stabilized Troll B crude oil was released at 09:00 from an floe about 25 m from the side of the Lance using a 30 m hose (see Figure 5.8A), giving an initial slick of ca. 30 m x 10 m (see Figure 5.8B).
40
Figure 5.8 A: May 19th 09:00: Release of 2 m3 of stabilized Troll B crude oil in 70-80% ice coverage from n floe about 30 m from the Lance). B: May 19th 09:15: Shape of the slick after stoppage of the release (ca. a 30m x 10 m slick).
The slick was weathered for six hours before the dispersant treatment and a monitoring of the oil’s distribution and properties was carried out one hour before the treatment. Figure 4.2 shows a sketch made of the surface oil distribution surrounded by the floes at that time. The SW part of the slick was very thin (i.e. sheen, rainbow and metallic according to the BAOAC). The total area of thick oil (cont. true oil color - CTC) was roughly 50 m x 20 m (a maximum of 1000 m2), corresponding to an average thickness of 2 mm. However, due to the wind conditions the oil was pushed against the floes on the eastern side of the slick, yielding measured thicknesses of up to 2-4 cm along the ice’s edge (see Figure 5.9). This was very useful information with regard to the importance of focusing the dispersant application in the thickest part of the CTC area, particularly along the ice edge on the eastern side of the slick in order to give this area a sufficient dosage. Table 5.3 summarizes the physical properties of two surface samples taken in the thick part of the P4.2 oil slick after 5 hours of weathering in ice. The data obtained verify that the oil had undergone a very slow weathering process with a very low evaporation rate (due to a high oil thickness) and no emulsification due to a lack of turbulence/breaking waves in the wake, resulting in a viscosity of less than 100 cP. The oil remained dispersible after this weathering time.
B A
41
Figure 5.9 Sketch of the P4.2 oil slick 1 hour before dispersant treatment (May 21st, 14:00). Table 5.3 Physical properties of the P4.2 oil slick after 5 hours of weathering in ice (1 hour
before dispersant treatment, May 19th, 14:00 (average from two samples analyzed). Parameters Properties Oil thickness 2.5 – 3 cm Viscosity 85 – 90 cP Density 0.902 kg / l Evaporative loss 8 vol.% Water content < 1% (traces) Dispersibility (FET-test)*) Good *) SINTEF Field Effectiveness Test (Fiocco et al., 1999) The spraying operation took 32 min (15:10 – 15:42) and was very efficient. All of the thickest part of the oil slick (the CTC area) was treated with dispersant (a total of 300 L of Corexit EC9500), with a special emphasis given to the ice edge along the eastern side of the slick (a high dosage of approximately 200-300 ml/m2), where the thickness was 2-3 cm (see Figure 5.10 A and B). Good video documentation exists of the application. After the dispersant treatment, the slick was left for about 1 hour, so the dispersant had time to soak into the oil phase. A significant “self-mixing” effect of the dispersant could be observed on the surface even under the calm conditions before the Lance started the propeller washing; a light brown (milky) dispersion started to take place on the upper layer of the surface (see Figure 5.11 A). After 1 hour of soaking time, the Lance started to go along the side of the treated slick and used both the bow and rear thrusters on the dispersant-treated oil slick. The Lance went
S
W
E
N
Clean water
Rain- bow
Metal-lic Cont. true oil
(CTC)
Very thick oil
Wind
0.5cm
0.3cm
3cm
4cm
1cm
2.5cm
Ca 30 m

42
systematically into the various wakes/channels that contained treated oil and completed the dispersion process quite efficiently.
Figure 5.10 Dispersant application of the P4.2 slick. Unfortunately, during the middle portion of the prop washing process, the bow thrusters failed, so the remaining agitation was done using the rear thrusters only. The pictures below in Figure 5.11B were taken during this agitation using the rear thrusters, clearly demonstrating the enhanced dispersion process taking place. The visual efficacy of the prop washing agitation was considered to be even larger than in the treatment of the 0.5 m3 pre-test slick. By using the BAOAC terminology, the following conclusion can be drawn: After the thruster’s agitation, all the black (“cont. true oil color” - CTC) disappeared, leaving only a “metallic” thicknesses (i.e. < 50-100 μm) on the ice sea surface with only a light brown color on the edges of the floe. Based on these visual evaluations, it was estimated that < 100 L of the surface oil was left within the treated area (assuming a >95% efficacy).
Figure 5.11 A: Details of surface oil before agitation. B: Enhancing the dispersion process by propeller wash, using the rear thrusters of the Lance 1 h after the dispersant application.
Because the thrusters agitation of the dispersant-treated oil resulted in a significant increase in the surface spreading of the P4-2 slick, it appears that the P4-2 slick approached the P2-2 slick that had been released about 300m from the P4-2 slick, which was planned to be ignited by an in situ burning some hours later. For that reason, it was decided to terminate the dispersant treatment and the thrusters agitation before the entire slick had been treated. Approximately 20% of the slick was to be treated when the decision to stop further spraying was taken.
B A
B A
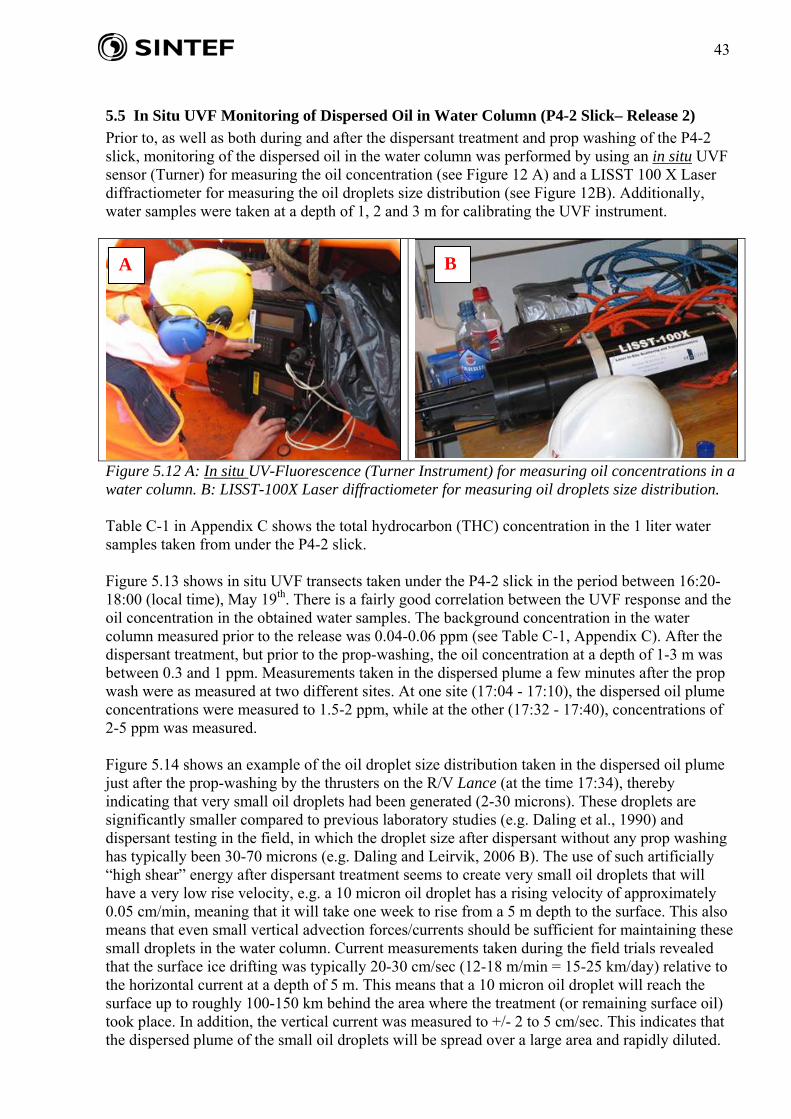
43
5.5 In Situ UVF Monitoring of Dispersed Oil in Water Column (P4-2 Slick– Release 2)
Prior to, as well as both during and after the dispersant treatment and prop washing of the P4-2 slick, monitoring of the dispersed oil in the water column was performed by using an in situ UVF sensor (Turner) for measuring the oil concentration (see Figure 12 A) and a LISST 100 X Laser diffractiometer for measuring the oil droplets size distribution (see Figure 12B). Additionally, water samples were taken at a depth of 1, 2 and 3 m for calibrating the UVF instrument.
Figure 5.12 A: In situ UV-Fluorescence (Turner Instrument) for measuring oil concentrations in a water column. B: LISST-100X Laser diffractiometer for measuring oil droplets size distribution. Table C-1 in Appendix C shows the total hydrocarbon (THC) concentration in the 1 liter water samples taken from under the P4-2 slick. Figure 5.13 shows in situ UVF transects taken under the P4-2 slick in the period between 16:20-18:00 (local time), May 19th. There is a fairly good correlation between the UVF response and the oil concentration in the obtained water samples. The background concentration in the water column measured prior to the release was 0.04-0.06 ppm (see Table C-1, Appendix C). After the dispersant treatment, but prior to the prop-washing, the oil concentration at a depth of 1-3 m was between 0.3 and 1 ppm. Measurements taken in the dispersed plume a few minutes after the prop wash were as measured at two different sites. At one site (17:04 - 17:10), the dispersed oil plume concentrations were measured to 1.5-2 ppm, while at the other (17:32 - 17:40), concentrations of 2-5 ppm was measured.
Figure 5.14 shows an example of the oil droplet size distribution taken in the dispersed oil plume just after the prop-washing by the thrusters on the R/V Lance (at the time 17:34), thereby indicating that very small oil droplets had been generated (2-30 microns). These droplets are significantly smaller compared to previous laboratory studies (e.g. Daling et al., 1990) and dispersant testing in the field, in which the droplet size after dispersant without any prop washing has typically been 30-70 microns (e.g. Daling and Leirvik, 2006 B). The use of such artificially “high shear” energy after dispersant treatment seems to create very small oil droplets that will have a very low rise velocity, e.g. a 10 micron oil droplet has a rising velocity of approximately 0.05 cm/min, meaning that it will take one week to rise from a 5 m depth to the surface. This also means that even small vertical advection forces/currents should be sufficient for maintaining these small droplets in the water column. Current measurements taken during the field trials revealed that the surface ice drifting was typically 20-30 cm/sec (12-18 m/min = 15-25 km/day) relative to the horizontal current at a depth of 5 m. This means that a 10 micron oil droplet will reach the surface up to roughly 100-150 km behind the area where the treatment (or remaining surface oil) took place. In addition, the vertical current was measured to +/- 2 to 5 cm/sec. This indicates that the dispersed plume of the small oil droplets will be spread over a large area and rapidly diluted.
A B
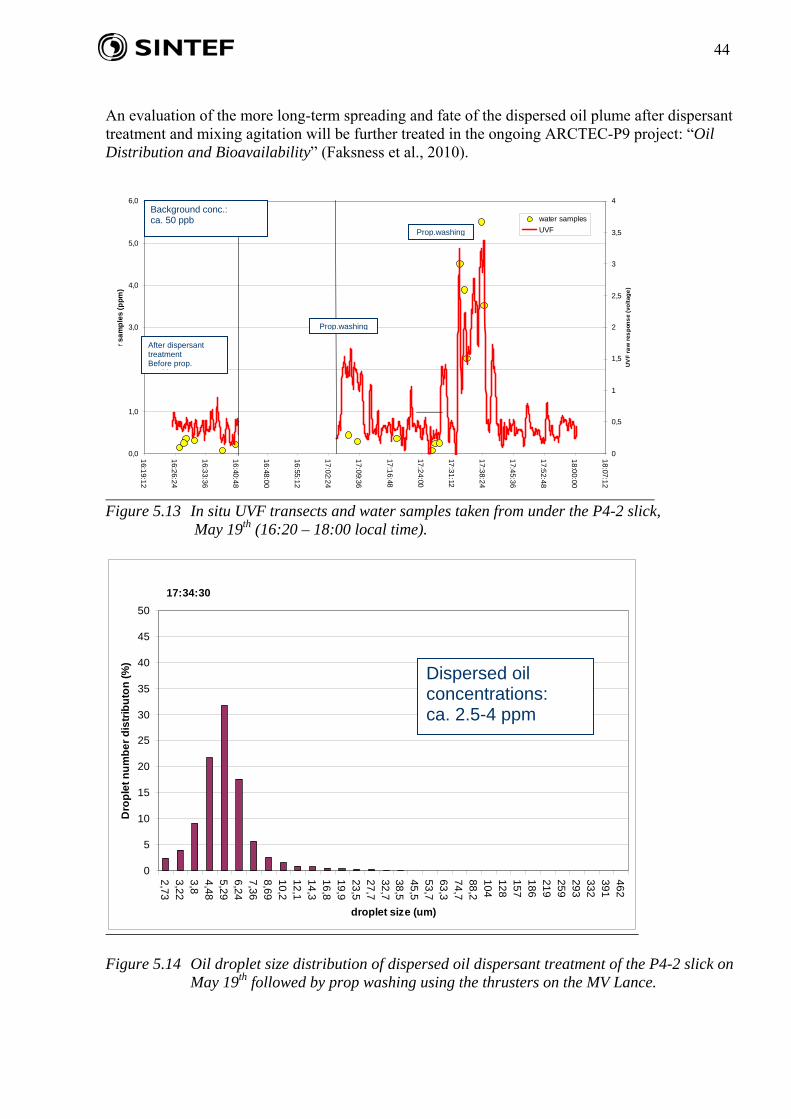
44
An evaluation of the more long-term spreading and fate of the dispersed oil plume after dispersant treatment and mixing agitation will be further treated in the ongoing ARCTEC-P9 project: “Oil Distribution and Bioavailability” (Faksness et al., 2010).
Figure 5.13 In situ UVF transects and water samples taken from under the P4-2 slick,
May 19th (16:20 – 18:00 local time).
Figure 5.14 Oil droplet size distribution of dispersed oil dispersant treatment of the P4-2 slick on
May 19th followed by prop washing using the thrusters on the MV Lance.
17:34:30
0
5
10
15
20
25
30
35
40
45
50
2,7
33
,22
3,8
4,4
85
,29
6,2
47
,36
8,6
91
0,2
12
,11
4,3
16
,81
9,9
23
,52
7,7
32
,73
8,5
45
,55
3,7
63
,37
4,7
88
,21
04
12
81
57
18
62
19
25
92
93
33
23
91
46
2
droplet size (um)
Dro
ple
t n
um
be
r d
istr
ibu
ton
(%
)
Dispersed oil concentrations: ca. 2.5-4 ppm
0,0
1,0
2,0
3,0
4,0
5,0
6,0
16:1
9:1
2
16:2
6:2
4
16:3
3:3
6
16
:40:4
8
16
:48:0
0
16
:55:1
2
17
:02:2
4
17
:09:3
6
17:1
6:48
17:2
4:00
17:3
1:12
17:3
8:2
4
17:4
5:3
6
17
:52
:48
18
:00
:00
18
:07:1
2
Wat
er
sa
mp
les
(p
pm
)
0
0,5
1
1,5
2
2,5
3
3,5
4
UV
F r
aw
res
pon
se
(vo
ltag
e)
water samples
UVF
After dispersant treatment Before prop.
hi
Prop.washing
Prop.washing
Background conc.: ca. 50 ppb
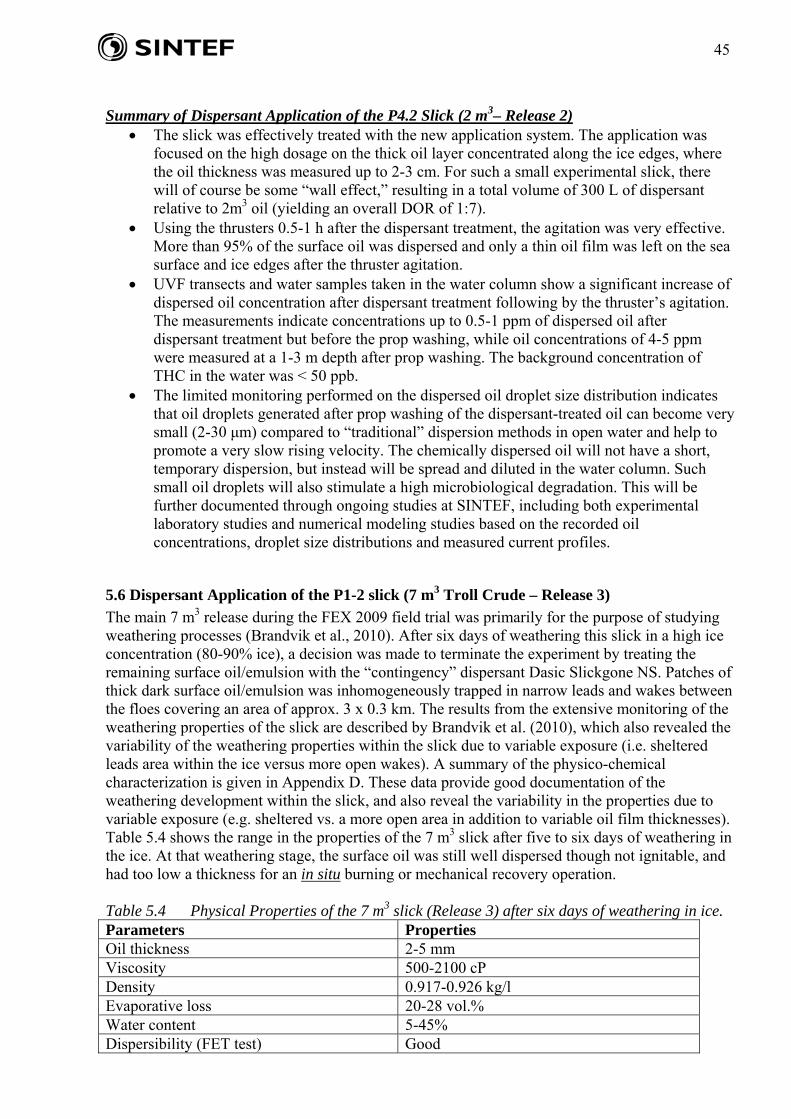
45
Summary of Dispersant Application of the P4.2 Slick (2 m3– Release 2)
The slick was effectively treated with the new application system. The application was focused on the high dosage on the thick oil layer concentrated along the ice edges, where the oil thickness was measured up to 2-3 cm. For such a small experimental slick, there will of course be some “wall effect,” resulting in a total volume of 300 L of dispersant relative to 2m3 oil (yielding an overall DOR of 1:7).
Using the thrusters 0.5-1 h after the dispersant treatment, the agitation was very effective. More than 95% of the surface oil was dispersed and only a thin oil film was left on the sea surface and ice edges after the thruster agitation.
UVF transects and water samples taken in the water column show a significant increase of dispersed oil concentration after dispersant treatment following by the thruster’s agitation. The measurements indicate concentrations up to 0.5-1 ppm of dispersed oil after dispersant treatment but before the prop washing, while oil concentrations of 4-5 ppm were measured at a 1-3 m depth after prop washing. The background concentration of THC in the water was < 50 ppb.
The limited monitoring performed on the dispersed oil droplet size distribution indicates that oil droplets generated after prop washing of the dispersant-treated oil can become very small (2-30 μm) compared to “traditional” dispersion methods in open water and help to promote a very slow rising velocity. The chemically dispersed oil will not have a short, temporary dispersion, but instead will be spread and diluted in the water column. Such small oil droplets will also stimulate a high microbiological degradation. This will be further documented through ongoing studies at SINTEF, including both experimental laboratory studies and numerical modeling studies based on the recorded oil concentrations, droplet size distributions and measured current profiles.
5.6 Dispersant Application of the P1-2 slick (7 m3 Troll Crude – Release 3)
The main 7 m3 release during the FEX 2009 field trial was primarily for the purpose of studying weathering processes (Brandvik et al., 2010). After six days of weathering this slick in a high ice concentration (80-90% ice), a decision was made to terminate the experiment by treating the remaining surface oil/emulsion with the “contingency” dispersant Dasic Slickgone NS. Patches of thick dark surface oil/emulsion was inhomogeneously trapped in narrow leads and wakes between the floes covering an area of approx. 3 x 0.3 km. The results from the extensive monitoring of the weathering properties of the slick are described by Brandvik et al. (2010), which also revealed the variability of the weathering properties within the slick due to variable exposure (i.e. sheltered leads area within the ice versus more open wakes). A summary of the physico-chemical characterization is given in Appendix D. These data provide good documentation of the weathering development within the slick, and also reveal the variability in the properties due to variable exposure (e.g. sheltered vs. a more open area in addition to variable oil film thicknesses). Table 5.4 shows the range in the properties of the 7 m3 slick after five to six days of weathering in the ice. At that weathering stage, the surface oil was still well dispersed though not ignitable, and had too low a thickness for an in situ burning or mechanical recovery operation.
Table 5.4 Physical Properties of the 7 m3 slick (Release 3) after six days of weathering in ice. Parameters Properties Oil thickness 2-5 mm Viscosity 500-2100 cP Density 0.917-0.926 kg/l Evaporative loss 20-28 vol.% Water content 5-45% Dispersibility (FET test) Good

46
The decision for the dispersant operation of the 7 m3 slick became an excellent opportunity to acquire some additional extensive experience in operating the spray arm system. Because the majority of the remaining surface oil was trapped in narrow leads, a decision was made to change to a “one-nozzle” mouthpiece on the spray arm. Prior to the spraying operation, this one-nozzle spray unit was calibrated to deliver a dispersant application rate of 10 l/min (600 l/h). The application swath width with this spray unit was up to three meters. In more narrow leads, the swath width could be reduced by changing the spraying angle of the “flat spray” nozzle or by lowering the application height.
The modification of the spray system was demonstrated to be an optimal response solution for the remaining surface emulsion. The one-nozzle spray unit was easy to operate, which resulted in a very precise application on the oil (see Figure 10 A). Even without any artificial turbulence, some significant (“self-mixing”) effects from the dispersant application were observed during the treatment of this highly weathered slick (same effects as seen in Slick 2, Figure 10 B).
To enhance the dispersion process after the dispersant treatment, it was decided to use the water jet from the MOB boat to create artificial turbulence, enabling the R/V Lance to focus on the dispersant application operation. Particularly in the narrow leads between the floes, the water jet washing from the MOB boat proved to be highly efficient (see Figure 13 B and C). This agitation using the MOB boat was systematically performed on the chemically treated oil approximately 15-20 min after the dispersant application. After this operation, the area of thick “cont. true oil” (CTC) had been dispersed, leaving only a very thin “sheen” and “metallic” film (thicknesses of, e.g. < 50-100 μm) of oil remaining on the surface, which gave a light brown color to the edges of the ice floes (Figure 13 C). This thin dispersant-treated oil film is expected to have a short “lifetime” when the slick comes into more turbulent conditions in the Marginal Ice Zone (MIZ). After six days of weathering for the P1-2 slick in a high ice concentration (80-90% ice, see Sørstrøm et al., 2009) it was decided on Thursday, May 21st to terminate the experiment by treating the remaining surface oil/emulsion using the “contingency” dispersant Dasic Slickgone NS. The extensive monitoring of the weathering properties of the P1-2 slick is described by Brandvik et al. (2009B), with a summary of the physico-chemical characterization given in Appendix D. These data provide a good documentation of the weathering development within the slick, and also reveal the variability in the properties due to variable exposure (e.g. sheltered vs. a more open area, as well as variable oil film thicknesses). Table 5.4 shows the properties of the P1-2 slick after 5-6 days of weathering in ice. At that weathering stage the surface oil was still dispersible though not ignitable, and it had too low a thickness for in situ burning or for a mechanical recovery operation. Patches of thick dark surface oil/emulsion was very inhomogeneously trapped in narrow leads/wakes between the floes, covering an area of approx. 3 x 0.3 km.
Table 5.4 Physical properties of the P1-2 oil slick after 5-6 days of weathering in ice (before
dispersant treatment on May 2nd. Parameters Properties Oil thickness 2-5 mm Viscosity 500-2100 cP Density 0.917-0.926 kg/l Evaporative loss 20-28 vol.% Water content 5-45% Dispersibility (FET test) Good
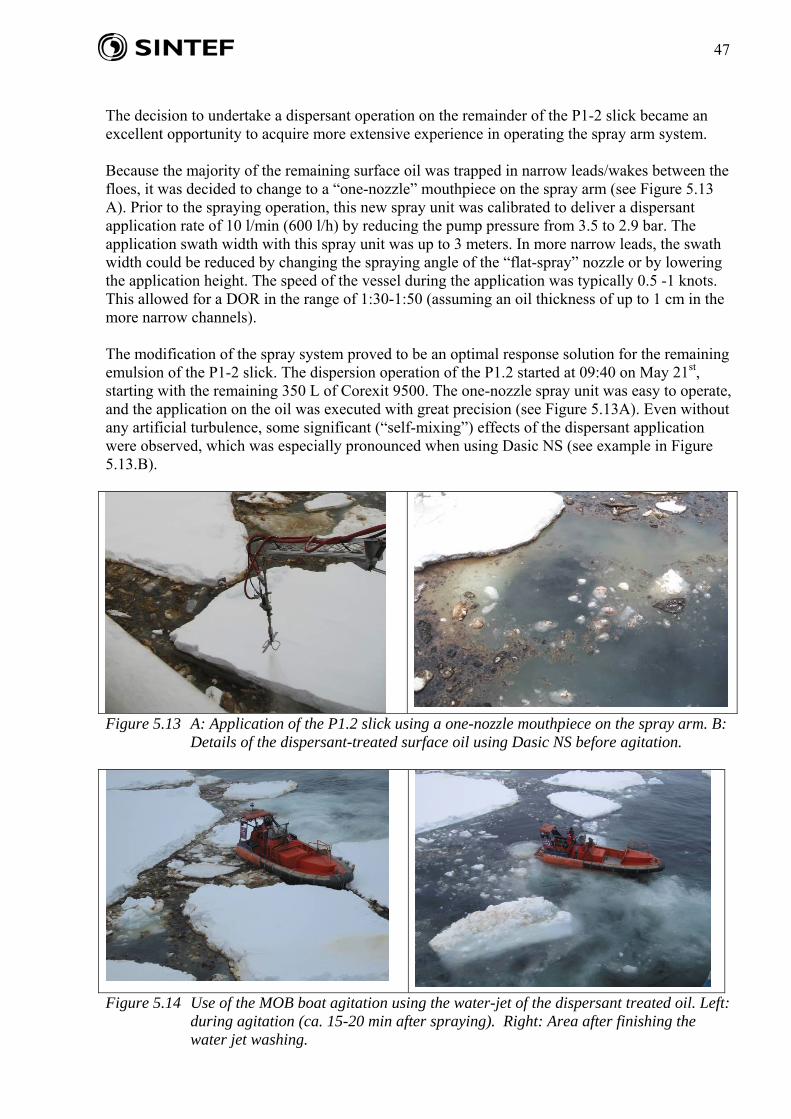
47
The decision to undertake a dispersant operation on the remainder of the P1-2 slick became an excellent opportunity to acquire more extensive experience in operating the spray arm system. Because the majority of the remaining surface oil was trapped in narrow leads/wakes between the floes, it was decided to change to a “one-nozzle” mouthpiece on the spray arm (see Figure 5.13 A). Prior to the spraying operation, this new spray unit was calibrated to deliver a dispersant application rate of 10 l/min (600 l/h) by reducing the pump pressure from 3.5 to 2.9 bar. The application swath width with this spray unit was up to 3 meters. In more narrow leads, the swath width could be reduced by changing the spraying angle of the “flat-spray” nozzle or by lowering the application height. The speed of the vessel during the application was typically 0.5 -1 knots. This allowed for a DOR in the range of 1:30-1:50 (assuming an oil thickness of up to 1 cm in the more narrow channels). The modification of the spray system proved to be an optimal response solution for the remaining emulsion of the P1-2 slick. The dispersion operation of the P1.2 started at 09:40 on May 21st, starting with the remaining 350 L of Corexit 9500. The one-nozzle spray unit was easy to operate, and the application on the oil was executed with great precision (see Figure 5.13A). Even without any artificial turbulence, some significant (“self-mixing”) effects of the dispersant application were observed, which was especially pronounced when using Dasic NS (see example in Figure 5.13.B).
Figure 5.13 A: Application of the P1.2 slick using a one-nozzle mouthpiece on the spray arm. B:
Details of the dispersant-treated surface oil using Dasic NS before agitation.
Figure 5.14 Use of the MOB boat agitation using the water-jet of the dispersant treated oil. Left:
during agitation (ca. 15-20 min after spraying). Right: Area after finishing the water jet washing.

48
To enhance the dispersion process after the dispersant treatment, it was decided to use the water jet of the MOB boat to create artificial turbulence, allowing the Lance to focus on the dispersant application operation. Particularly in the narrow leads between the floes, the water jet washing of the MOB boat proved to be highly efficient (see Figure 5.13 A and B). This agitation using the MOB boat was systematically performed on the chemically treated oil for roughly 15-20 min after the dispersant application. In total, the dispersant application/prop washing took 7.5 hours (6 hours on May 21st and 1.5 hours on the morning of May 22nd). At that time, a total of 350 L of Corexit and 700 L of Dasic NS had been applied on the remaining part of the slick. The final turbulence input to the dispersant-treated slick was provided by running the Lance through the experimental area (3 x 0.3 km) a couple of times. After this operation, only an area with a very thin layer (light brown color) of oil was left on the surface. This thin film dispersant-treated oil was expected to have a short “lifetime” when the slick came into more turbulent conditions in the Marginal Ice Zone (MIZ). Summary/Findings from the Dispersant Treatment of the Weathered P1.2 Slick (7 m3)
After six days of weathering in 80-90% ice coverage, the slick was efficiently treated during a 7.5 hour spraying operation. A total of approximately 1m3 of dispersant was applied on the widely fragmented slick during this spraying operation, yielding an overall dispersant to emulsion ratio (DER) of approximately 1:7.
The strategy of combining a dispersant application using the one-nozzle unit on the spray arm, followed by agitation using the water jet from the MOB boat after 15-20 min of “soaking” time, proved to be very effective in treating oil trapped in narrow leads between the floes. Only a thin oil film was left on the sea surface and ice edges after agitation by the MOB boat.
This response operation became an excellent opportunity to obtain some additional extensive experience in operating the spray arm system.
5.7 Conclusions and General Comments of the Dispersant Field Testing
The experimental oil releases in the field trials verified the findings from the laboratory/basin tests conducted during this JIP that the weathering process is slowed down, enabling a longer window of opportunity for dispersant application. Certain oils spilled in the high ice concentrations may remain dispersible for a period of up several days.
The new dispersant application system demonstrated a good flexibility in targeted dispersant application over an ice-covered area. A great advantage of this system compared to conventional vessel-mounted spray arms is the ability to maneuver the spray arm close to the slick so as to better conduct a more precise application. This reduces the loss of dispersant due to wind drift and spraying on the floes. Even if this spray system is customized for application of dispersant at a low speed in an ice-covered area, it also has the potential to be used in open (ice-free) water operating at a higher application speed (e.g. 4-6 knots)
Both single-nozzle and triple-nozzle spray boom mouthpieces mounted on the maneuverable spray arm were tested and shown to have a great potential for applying
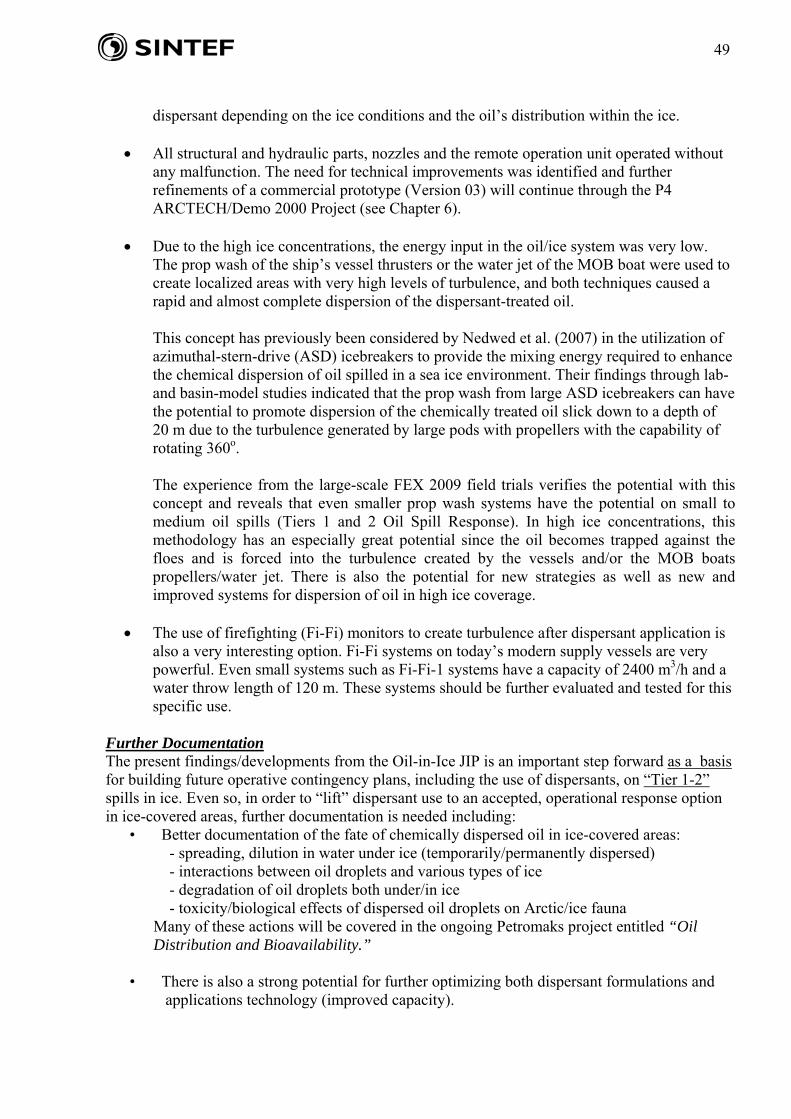
49
dispersant depending on the ice conditions and the oil’s distribution within the ice.
All structural and hydraulic parts, nozzles and the remote operation unit operated without any malfunction. The need for technical improvements was identified and further refinements of a commercial prototype (Version 03) will continue through the P4 ARCTECH/Demo 2000 Project (see Chapter 6).
Due to the high ice concentrations, the energy input in the oil/ice system was very low.
The prop wash of the ship’s vessel thrusters or the water jet of the MOB boat were used to create localized areas with very high levels of turbulence, and both techniques caused a rapid and almost complete dispersion of the dispersant-treated oil.
This concept has previously been considered by Nedwed et al. (2007) in the utilization of azimuthal-stern-drive (ASD) icebreakers to provide the mixing energy required to enhance the chemical dispersion of oil spilled in a sea ice environment. Their findings through lab- and basin-model studies indicated that the prop wash from large ASD icebreakers can have the potential to promote dispersion of the chemically treated oil slick down to a depth of 20 m due to the turbulence generated by large pods with propellers with the capability of rotating 360o.
The experience from the large-scale FEX 2009 field trials verifies the potential with this
concept and reveals that even smaller prop wash systems have the potential on small to medium oil spills (Tiers 1 and 2 Oil Spill Response). In high ice concentrations, this methodology has an especially great potential since the oil becomes trapped against the floes and is forced into the turbulence created by the vessels and/or the MOB boats propellers/water jet. There is also the potential for new strategies as well as new and improved systems for dispersion of oil in high ice coverage.
The use of firefighting (Fi-Fi) monitors to create turbulence after dispersant application is
also a very interesting option. Fi-Fi systems on today’s modern supply vessels are very powerful. Even small systems such as Fi-Fi-1 systems have a capacity of 2400 m3/h and a water throw length of 120 m. These systems should be further evaluated and tested for this specific use.
Further Documentation The present findings/developments from the Oil-in-Ice JIP is an important step forward as a basis for building future operative contingency plans, including the use of dispersants, on “Tier 1-2” spills in ice. Even so, in order to “lift” dispersant use to an accepted, operational response option in ice-covered areas, further documentation is needed including:
• Better documentation of the fate of chemically dispersed oil in ice-covered areas: - spreading, dilution in water under ice (temporarily/permanently dispersed) - interactions between oil droplets and various types of ice - degradation of oil droplets both under/in ice - toxicity/biological effects of dispersed oil droplets on Arctic/ice fauna Many of these actions will be covered in the ongoing Petromaks project entitled “Oil Distribution and Bioavailability.”
• There is also a strong potential for further optimizing both dispersant formulations and applications technology (improved capacity).

50
6 Further Refinements of the Spray Arm System (Version 02 to Version 03) The experience acquired through the testing of the present spray arm prototype (Version 02) has been very positive. The improvements done based on the functionality testing of the first prototype in SINTEF’s cold climate basins in March has proven to be very valuable for the success of the large-scale field testing in May. Due to the decision to conduct a dispersant operation, in addition to using the spray arm system in applying dispersant on the large P1-2 slick during the field trial, this became an excellent opportunity to obtain more extensive experience in operating the spray arm prototype. Based on these experiences, some needs for further technical improvements and refinements have been identified and the following action points for the maximum optimization of the spray arm system will continue through Phase 2 of the P4 ARCTECH/Demo 2000 Project that is planned to be finalized in 2010:
The inner unit and the foundation of the spray arms should be more robust in order to improve the stability of the entire spray arm;
A need for more robust hydraulic cylinders on the inner hinge;
Flexibility in choice/exchange of nozzle/spray boom units is important: One- and Three-nozzle systems with quick couplings;
Install a separate hydraulic cylinder between the outer arm section and down tube with the rotary hydraulic motor;
The hydraulic system should generally be upgraded!
The control panel should be made more user-friendly, e.g.: - one separate stick for the hydraulic maneuvering of the spray arm functions - one separate stick for start/stop of the dispersant flow.
Upon the completion of the prototype (Version 03), there should be field validation in relation to future field trials (including testing its use in ice-free waters with the potential for application with a higher speed).

51
7 References Brandvik, P.J., P.S. Daling, J.L.M. Resby, M. Reed, and N.R. Bosberg, “Mapping Weathering Properties as a Function of Ice Conditions. A Combined Approach using Flume Basin Verified by Large-scale Experiments”. In Proceedings of the Thirty-third AMOP Technical Seminar on Environmental Contamination and Response, Environment Canada, Ottawa, ON (in print), 2010. Daling P.S., Ø. Johansen, and K. Åreskjold, “Potential in use of Chemical Agents in Arctic Waters”, ONA Project: F, IKU (SINTEF) report: 22.1956-00/01/90, (182 pp. in Norwegian), 1990. Daling, P.S. and F. Leirvik, Capacity Testing and Calibration of New Dispersant Application System on M/S Havila Troll – Sea Test at the Troll Oil field, May 2006. SINTEF report: STF80MK F05286 (in Norwegian), 2006A. Daling, P.S. and F. Leirvik, Documentation and Characterization of Oil on Water in Connection to Testing of Countermeasures in NOFO’s 2006 OOW Exercise. SINTEF report, STF80MK F06185 (in Norwegian), 2006B. Daling, P.S., P.J. Brandvik, and J.B. Resby, “Dispersant Effectiveness Testing of Crude Oils Weathered under Various Ice Conditions”. Presentation at the Thirty-third AMOP Technical Seminar on Environmental Contamination and Response, Environment Canada, Ottawa, ON, 2010A. Daling, P.S., A. Holumsnes, C. Rasmussen, P.J. Brandvik, and F. Leirvik, Development and Testing of a Containerized Dispersant Spray System for Use in Cold and Ice-covered Areas. Oil-in-Ice JIP report no. 13. SINTEF report, STF80MK 2010B. Ebert, T.A., R. Downer, J. Clark, and C.A. Huber, “Summary of Studies of Corexit Dispersant Droplet Impact Behavior into Oil Slicks. In Proceedings of the 2006 International Oil Spill Conference, pp. 797-800, 2006. Faksness, L-G., P.J. Brandvik, R.L. Daae, and F. Leirvik, “Monitoring of Oil in Water and Met Ocean Interactions during a Large-Scale Oil-in-Ice Experiment in the Barents Sea”. In Proceedings of the Thirty-third AMOP Technical Seminar on Environmental Contamination and Response, Environment Canada, Ottawa, ON (in print), 2010. Jensen, H., J.H. Andersen, P.S. Daling, and E. Nøst, “Recent Experience from Multiple Remote Sensing and Monitoring to Improve Oil Spill Response Operations”. In Proceedings of the 2008 International Oil Spill Conference, pp. 407-4412, 2008. Lewis, A., P.S. Daling, T. Strøm-Kristiansen, A. Nordvik, and R.J. Fiocco, “Weathering and Chemical Dispersion of Oil at Sea”. In Proceedings of the 1995 International Oil Spill Conference, pp. 157-164,1995A. Lewis, A., P.S. Daling, T. Strøm-Kristiansen, and P.J. Brandvik, “The Behaviour of Sture Blend Crude Oil Spilled at Sea and Treated with Dispersants”. In Proceedings of the Eighteenth Technical Seminar on Environmental Contamination and Response, Environment Canada, Ottawa, ON, 453-469. 1995B.

52
Lewis, A. and P.S. Daling, “A Review of Studies of Oil Spill Dispersant Effectiveness in Arctic Conditions”. Oil-in-Ice JIP Report. No. 11, SINTEF report: STF80MK F07095, p. 22, 2007A. Lewis, A. and P.S. Daling, “Evaluation of dispersant spray systems and platforms for use on spilled oil in sea with ice present”. Oil in Ice JIP Report no. 12, SINTEF report: STF80MK F07094 , p. 20, 2007B. Lewis, A., “Current status of the Bonn Agreement Oil Appearance Code - BAOAC”. Document OTSOPA 07/2/2 Bonn Agreement Report, 2007. Lichtenthaler, R.G. and P.S. Daling, “Aerial Application of Dispersants - Comparison of Slick Behaviour of Chemically Treated versus Non-treated Slicks”. In Proceedings of the 1985 International Oil Spill Conference, pp. 471-478, 1985. Lindblom, G.P, “Logistic Planning for Oil Spill Chemical Use” In Proceedings of the 1979 International Oil Spill Conference, pp. 453-458, 1979. Lindblom, G.P. and B.S. Cashion, “Operational Consideration for Optimal Deposition Efficiency in Aerial Application of Dispersants”. In Proceedings of the 1983 International Oil Spill Conference, pp. 53-60, 1983. Lindblom, G.P., “Measurement and Prediction of Depositional Accuracy in Dispersant Spraying from Large Airplanes”, In Proceedings of the 1987 International Oil Spill Conference, pp. 325-333, 1987. Mackay, D., “Chemical Dispersion: a Mechanism and a Model”. In Proceedings of the Eight AMOP Technical Seminar on Environmental Contamination and Response, Environment Canada, Ottawa, ON, pp. 260-268, 1985. Mackay, D., A. Chau, and Y.C. Poon, A Study of the Mechanisms of Chemical Dispersion of Oil Spills. Env. Canada, EE-76,1986. Merlin, F., CEDRE; Brest, France: 2006: Personal communication. Nedwed, T., W. Spring, D. Blanchet, and R. Belore, “Basin-scale Testing of ASD Ice breaker Enhanced Chemical Dispersion of Oil Spills”. In Proceedings of the Thirtieth AMOP Technical Seminar on Environmental Contamination and Response, Environment Canada, Ottawa, pp. 151-160, 2007. Ross, S.L. 1998, “The Case for Using Vessel-based Systems to Apply Oil Spill Dispersants”. In Proceedings of the Twenty-first AMOP Technical Seminar on Environmental Contamination and Response, Environment Canada, Ottawa, ON, pp., 201-220, 1998. Ross S.L., R. Belore, and K. Trudel, “Vessel-based Dispersant Application: New Approaches, Equipment and Logistics”. In Proceedings of the 2001 International Oil Spill Conference, pp. 1195-1201, 2001. Spring, W., T. Nedwed, and R. Belore, “Ice Breaker Enhanced Chemical Dispersion of Oil Spills”. In Proceedings of the Twenty-ninth AMOP Technical Seminar on Environmental Contamination and Response, Environment Canada, Ottawa, ON, 711-727, 2006.

53
Sørstrøm, S.E., P.J. Brandvik, I. Buist, P.S. Daling, D. Dickins, L-G. Faksness, S. Potter, J.F. Rasmussen, and I. Singsaas, “Joint Industry Program. Oil Spill Response for Arctic and Ice-covered Waters”. Summary Report – Oil-in-Ice JIP, SINTEF report A14181, ISBN no. 978-82-14-04759-2. 2010.
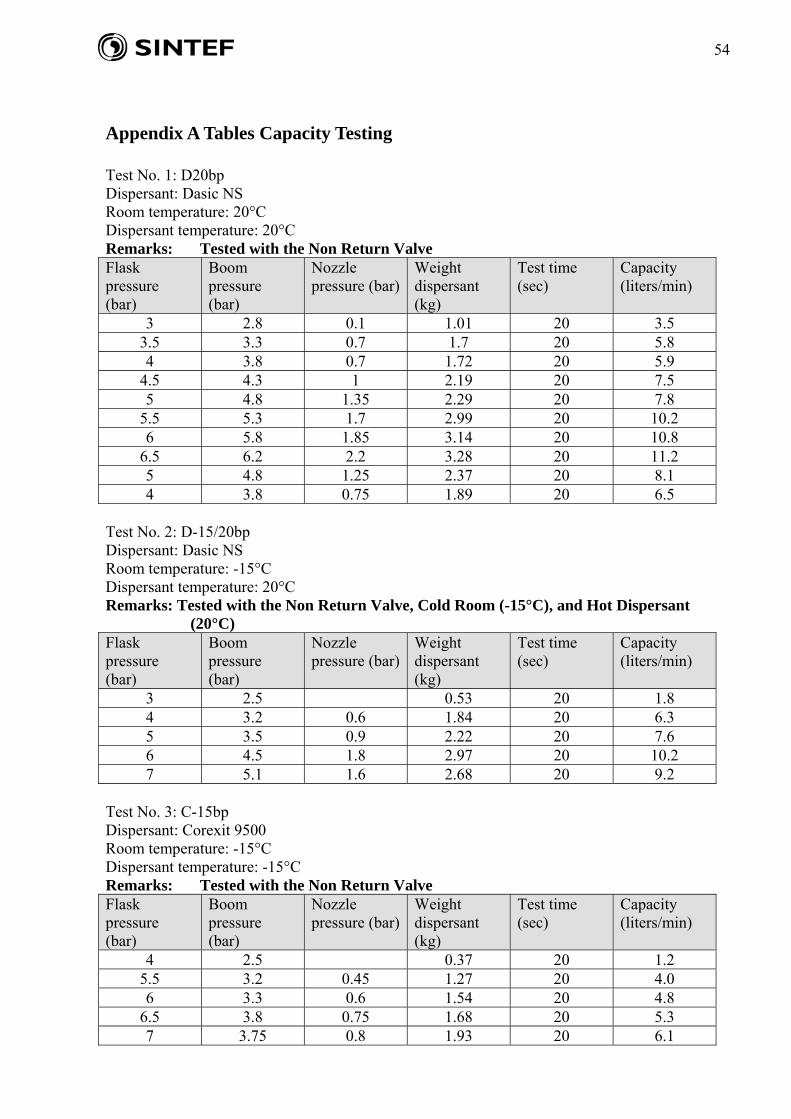
54
Appendix A Tables Capacity Testing Test No. 1: D20bp Dispersant: Dasic NS Room temperature: 20°C Dispersant temperature: 20°C Remarks: Tested with the Non Return Valve Flask pressure (bar)
Boom pressure (bar)
Nozzle pressure (bar)
Weight dispersant (kg)
Test time (sec)
Capacity (liters/min)
3 2.8 0.1 1.01 20 3.5 3.5 3.3 0.7 1.7 20 5.8 4 3.8 0.7 1.72 20 5.9
4.5 4.3 1 2.19 20 7.5 5 4.8 1.35 2.29 20 7.8
5.5 5.3 1.7 2.99 20 10.2 6 5.8 1.85 3.14 20 10.8
6.5 6.2 2.2 3.28 20 11.2 5 4.8 1.25 2.37 20 8.1 4 3.8 0.75 1.89 20 6.5
Test No. 2: D-15/20bp Dispersant: Dasic NS Room temperature: -15°C Dispersant temperature: 20°C Remarks: Tested with the Non Return Valve, Cold Room (-15°C), and Hot Dispersant
(20°C) Flask pressure (bar)
Boom pressure (bar)
Nozzle pressure (bar)
Weight dispersant (kg)
Test time (sec)
Capacity (liters/min)
3 2.5 0.53 20 1.8 4 3.2 0.6 1.84 20 6.3 5 3.5 0.9 2.22 20 7.6 6 4.5 1.8 2.97 20 10.2 7 5.1 1.6 2.68 20 9.2
Test No. 3: C-15bp Dispersant: Corexit 9500 Room temperature: -15°C Dispersant temperature: -15°C Remarks: Tested with the Non Return Valve Flask pressure (bar)
Boom pressure (bar)
Nozzle pressure (bar)
Weight dispersant (kg)
Test time (sec)
Capacity (liters/min)
4 2.5 0.37 20 1.2 5.5 3.2 0.45 1.27 20 4.0 6 3.3 0.6 1.54 20 4.8
6.5 3.8 0.75 1.68 20 5.3 7 3.75 0.8 1.93 20 6.1
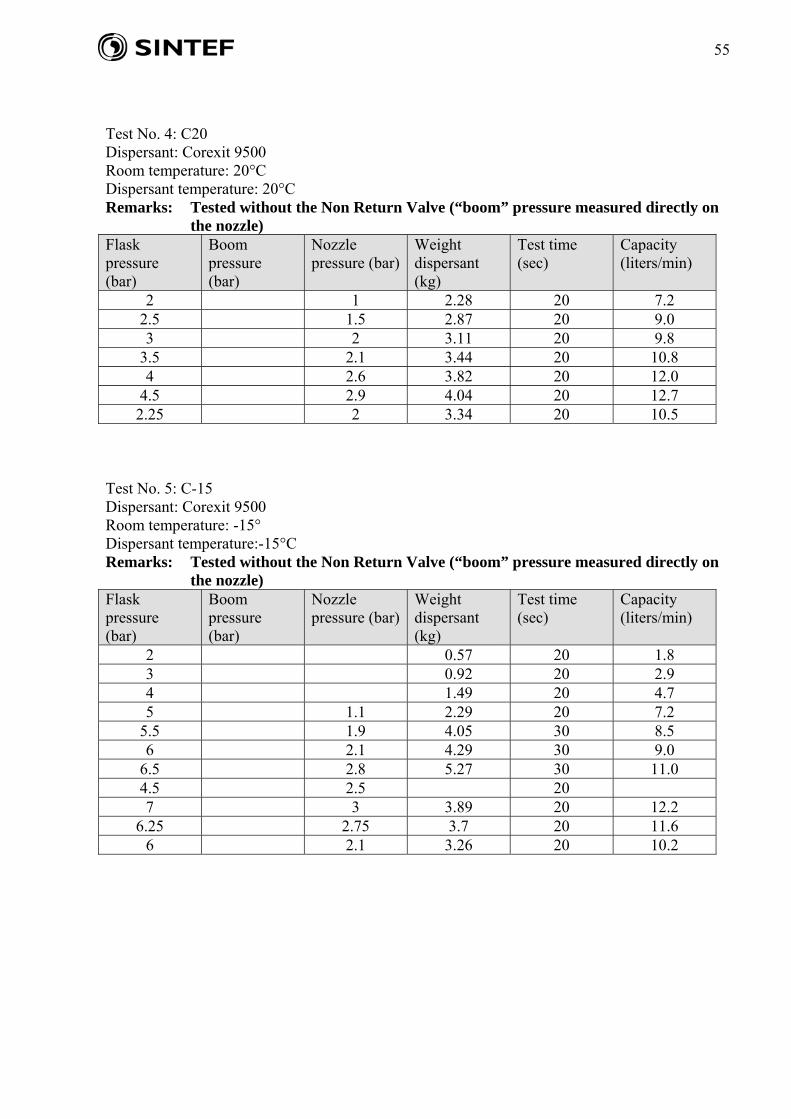
55
Test No. 4: C20 Dispersant: Corexit 9500 Room temperature: 20°C Dispersant temperature: 20°C Remarks: Tested without the Non Return Valve (“boom” pressure measured directly on
the nozzle) Flask pressure (bar)
Boom pressure (bar)
Nozzle pressure (bar)
Weight dispersant (kg)
Test time (sec)
Capacity (liters/min)
2 1 2.28 20 7.2 2.5 1.5 2.87 20 9.0 3 2 3.11 20 9.8
3.5 2.1 3.44 20 10.8 4 2.6 3.82 20 12.0
4.5 2.9 4.04 20 12.7 2.25 2 3.34 20 10.5
Test No. 5: C-15 Dispersant: Corexit 9500 Room temperature: -15° Dispersant temperature:-15°C Remarks: Tested without the Non Return Valve (“boom” pressure measured directly on
the nozzle) Flask pressure (bar)
Boom pressure (bar)
Nozzle pressure (bar)
Weight dispersant (kg)
Test time (sec)
Capacity (liters/min)
2 0.57 20 1.8 3 0.92 20 2.9 4 1.49 20 4.7 5 1.1 2.29 20 7.2
5.5 1.9 4.05 30 8.5 6 2.1 4.29 30 9.0
6.5 2.8 5.27 30 11.0 4.5 2.5 20 7 3 3.89 20 12.2
6.25 2.75 3.7 20 11.6 6 2.1 3.26 20 10.2
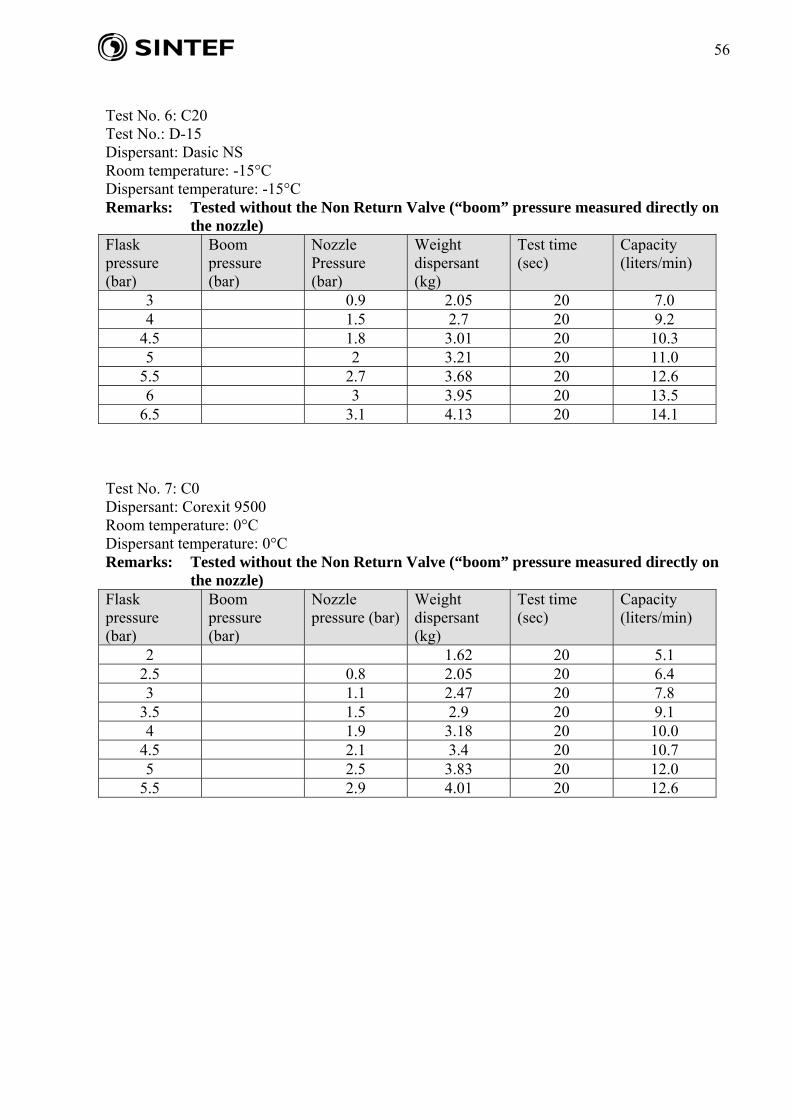
56
Test No. 6: C20 Test No.: D-15 Dispersant: Dasic NS Room temperature: -15°C Dispersant temperature: -15°C Remarks: Tested without the Non Return Valve (“boom” pressure measured directly on
the nozzle) Flask pressure (bar)
Boom pressure (bar)
Nozzle Pressure (bar)
Weight dispersant (kg)
Test time (sec)
Capacity (liters/min)
3 0.9 2.05 20 7.0 4 1.5 2.7 20 9.2
4.5 1.8 3.01 20 10.3 5 2 3.21 20 11.0
5.5 2.7 3.68 20 12.6 6 3 3.95 20 13.5
6.5 3.1 4.13 20 14.1 Test No. 7: C0 Dispersant: Corexit 9500 Room temperature: 0°C Dispersant temperature: 0°C Remarks: Tested without the Non Return Valve (“boom” pressure measured directly on
the nozzle) Flask pressure (bar)
Boom pressure (bar)
Nozzle pressure (bar)
Weight dispersant (kg)
Test time (sec)
Capacity (liters/min)
2 1.62 20 5.1 2.5 0.8 2.05 20 6.4 3 1.1 2.47 20 7.8
3.5 1.5 2.9 20 9.1 4 1.9 3.18 20 10.0
4.5 2.1 3.4 20 10.7 5 2.5 3.83 20 12.0
5.5 2.9 4.01 20 12.6
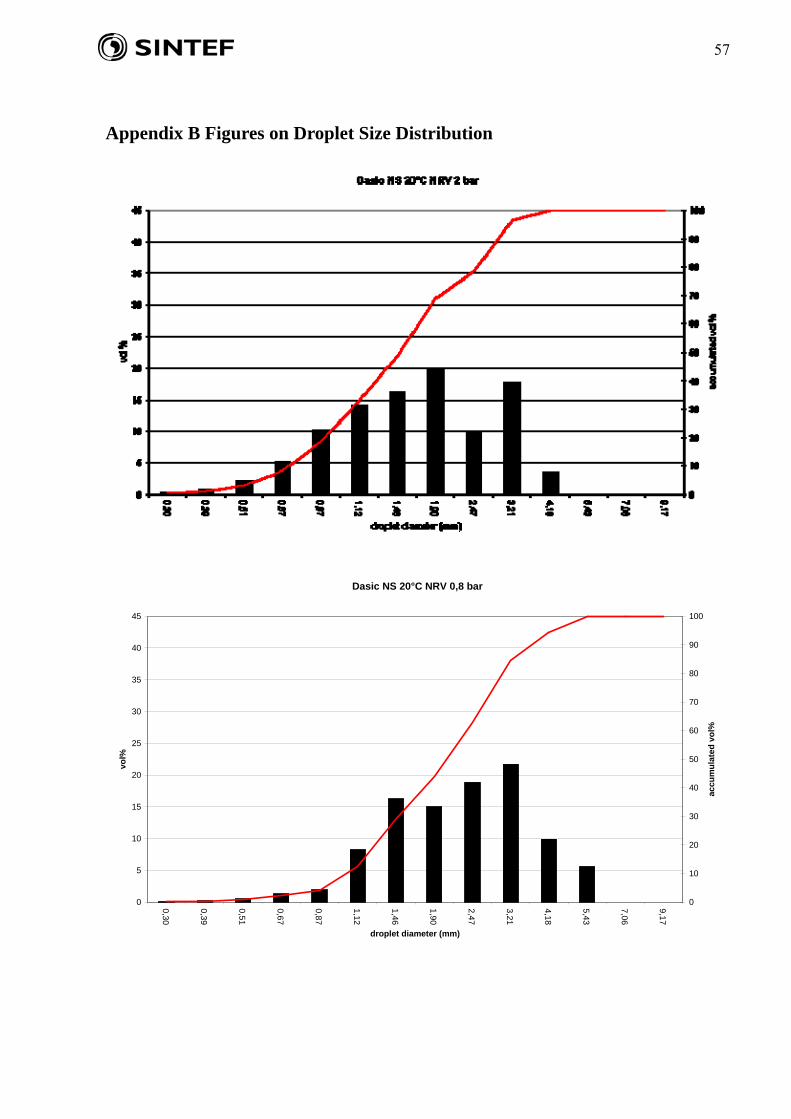
57
Appendix B Figures on Droplet Size Distribution
Dasic NS 20°C NRV 0,8 bar
0
5
10
15
20
25
30
35
40
450
,30
0,39
0,51
0,67
0,87
1,12
1,46
1,90
2,47
3,21
4,18
5,43
7,06
9,17
droplet diameter (mm)
vol%
0
10
20
30
40
50
60
70
80
90
100
accu
mu
late
d v
ol%

58
Corexit 9500 20°C
0
5
10
15
20
25
30
35
40
45
0,30
0,39
0,51
0,67
0,87
1,12
1,46
1,90
2,47
3,21
4,18
5,43
7,06
9,17
droplet diameter (mm)
vol%
0
10
20
30
40
50
60
70
80
90
100
accu
mu
late
d v
ol%
Corexit 9500 0°C
0
5
10
15
20
25
30
35
40
45
0,30
0,39
0,51
0,67
0,87
1,12
1,46
1,90
2,47
3,21
4,18
5,43
7,06
9,17
droplet diameter (mm)
vol%
0
10
20
30
40
50
60
70
80
90
100
accu
mu
late
d v
ol%
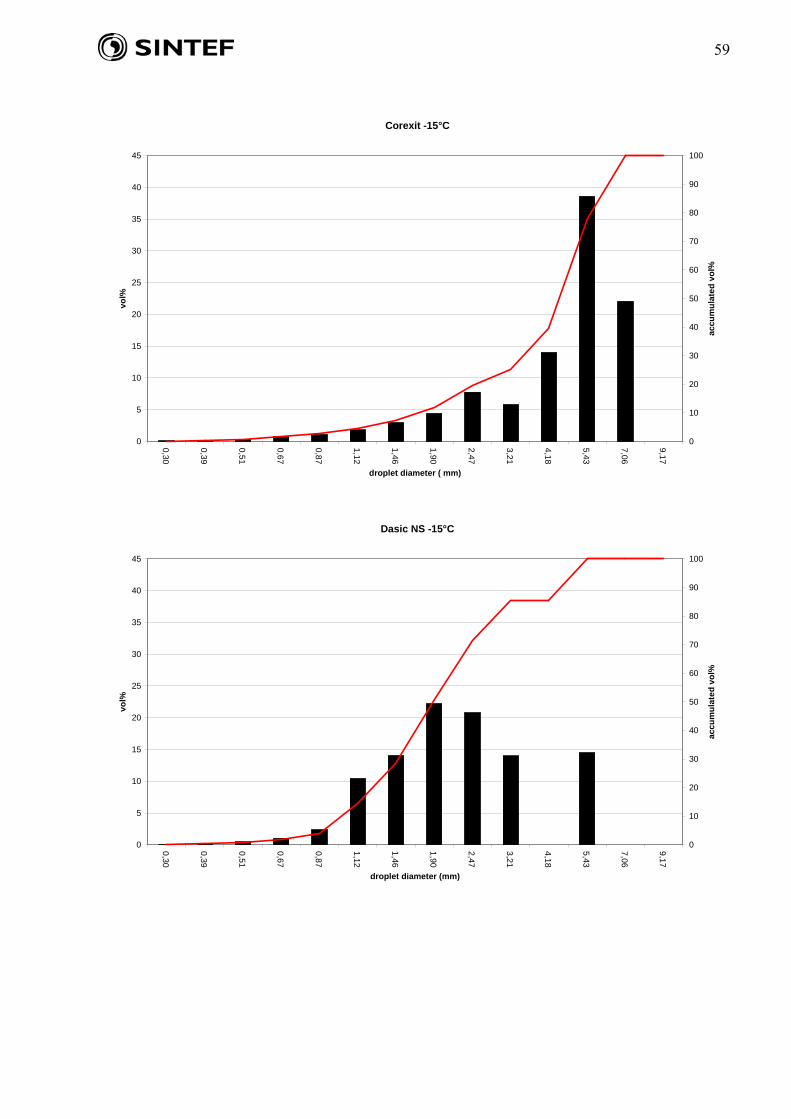
59
Corexit -15°C
0
5
10
15
20
25
30
35
40
45
0,30
0,39
0,51
0,67
0,87
1,12
1,46
1,90
2,47
3,21
4,18
5,43
7,06
9,17
droplet diameter ( mm)
vol%
0
10
20
30
40
50
60
70
80
90
100
accu
mu
late
d v
ol%
Dasic NS -15°C
0
5
10
15
20
25
30
35
40
45
0,30
0,39
0,51
0,67
0,87
1,12
1,46
1,90
2,47
3,21
4,18
5,43
7,06
9,17
droplet diameter (mm)
vol%
0
10
20
30
40
50
60
70
80
90
100
accu
mu
late
d v
ol%

60
Appendix C Table C-1: Concentration of Dispersed Oil in Water Samples Taken under the P4-2 Slick
THC fra C10-C36. Kvantifisert mot ekstern kalibreringskurve med Troll (2009-0702)og istd (5a-androstane)
SINTEF ID Prøve beskrivelse L (vol) ug/L (ppb) mg/L (ppm)
2009-0274 ref 120509 (3m) 0,98 61 0,061 Bakgrunnsverdier Barentshavet (fra 12/5-09)
2009-0275 ref 120509 (3m) 0,91 67 0,067 Bakgrunnsverdier Barentshavet (fra 12/5-09)
2009-0276 ref 120509 (3m) 0,95 41 0,041 Bakgrunnsverdier Barentshavet (fra 12/5-09)
2009-0277A st 1 - 3m kl 16:27:30 0,91 138 0,138 Etter spraying med dispergeringsmiddel
2009-0277B st 1 - 2m kl 16:29:00 0,93 362 0,362
2009-0277C st 1 - 1m kl 16:31:00 0,98 320 0,320
2009-0278A st 2 - 3m kl 16:40:30 1,04 222 0,222
2009-0278B st 2 - 2m kl 16:37:30 1 85 0,085
2009-0278C st 2 - 1m kl 16:28:30 1,02 252 0,252
2009-0279A st 3 - 3m kl 17:07:00 1,02 447 0,447 Etter miksing olje/disp m/Lance
2009-0279B st 3 - 2m kl 17:08:15 1,06 375 0,375
2009-0279C st 3 - 1m kl 17:09:00 1,05 294 0,294
2009-0280A st 4 - 3m kl 17:26:30 1,12 76 0,076
2009-0280B st 4 - 2m kl 17:27:15 0,99 242 0,242
2009-0280C st 4 - 1m kl 17:28:15 1,11 254 0,254
2009-0281A st 5 - 3m kl 17:33:05 1,01 4510 4,510
2009-0281B st 5 - 2m kl 17:34:05 1,06 3893 3,893
2009-0281C st 5 - 1m kl 17:34:40 1,08 2259 2,259
2009-0282A st 6 - 3m kl 17:36:27 1,05 93 0,093
2009-0282B st 6 - 2m kl 17:38:10 1,06 5504 5,504
2009-0282C st 6 - 1m kl 17:38:41 0,97 3528 3,528
Background values
After dispersant treatment
After prop. washing from thrusters of treated oil
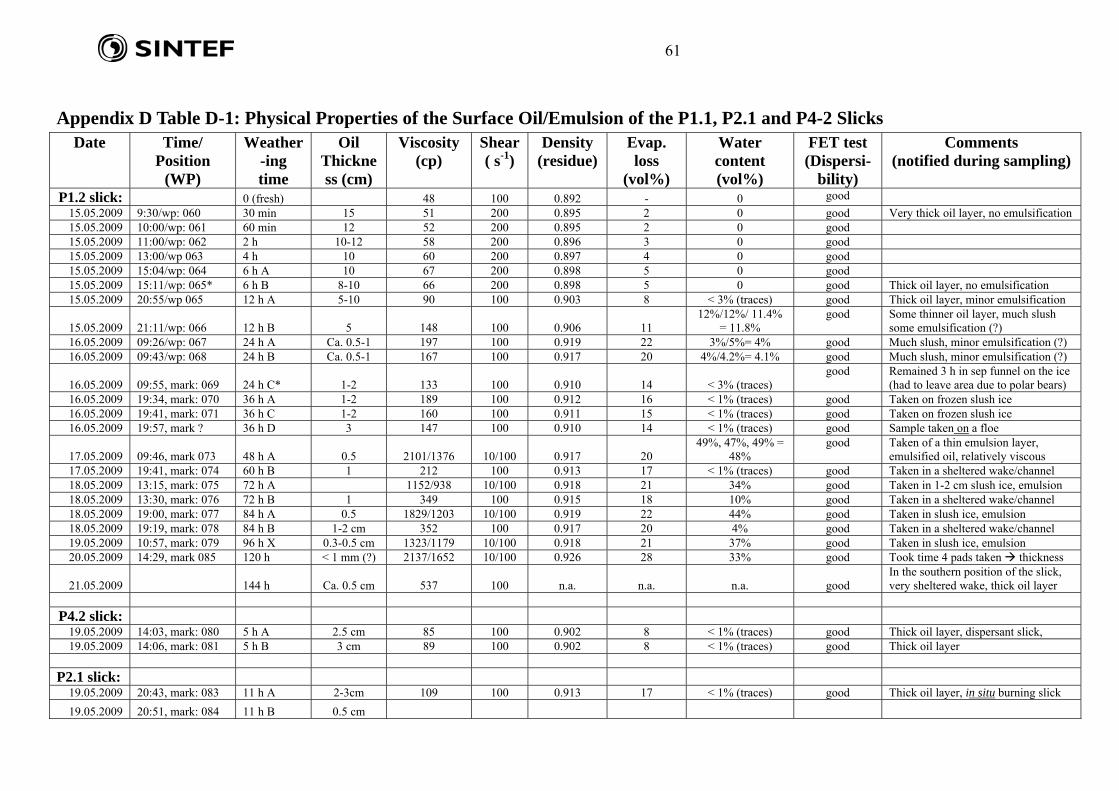
61
Appendix D Table D-1: Physical Properties of the Surface Oil/Emulsion of the P1.1, P2.1 and P4-2 Slicks
Date Time/ Position
(WP)
Weather-ing time
Oil Thickness (cm)
Viscosity (cp)
Shear( s-1)
Density (residue)
Evap. loss
(vol%)
Water content (vol%)
FET test (Dispersi-
bility)
Comments (notified during sampling)
P1.2 slick: 0 (fresh) 48 100 0.892 - 0 good
15.05.2009 9:30/wp: 060 30 min 15 51 200 0.895 2 0 good Very thick oil layer, no emulsification 15.05.2009 10:00/wp: 061 60 min 12 52 200 0.895 2 0 good 15.05.2009 11:00/wp: 062 2 h 10-12 58 200 0.896 3 0 good 15.05.2009 13:00/wp 063 4 h 10 60 200 0.897 4 0 good 15.05.2009 15:04/wp: 064 6 h A 10 67 200 0.898 5 0 good 15.05.2009 15:11/wp: 065* 6 h B 8-10 66 200 0.898 5 0 good Thick oil layer, no emulsification 15.05.2009 20:55/wp 065 12 h A 5-10 90 100 0.903 8 < 3% (traces) good Thick oil layer, minor emulsification
15.05.2009 21:11/wp: 066 12 h B 5 148 100 0.906 11 12%/12%/ 11.4%
= 11.8% good Some thinner oil layer, much slush
some emulsification (?) 16.05.2009 09:26/wp: 067 24 h A Ca. 0.5-1 197 100 0.919 22 3%/5%= 4% good Much slush, minor emulsification (?) 16.05.2009 09:43/wp: 068 24 h B Ca. 0.5-1 167 100 0.917 20 4%/4.2%= 4.1% good Much slush, minor emulsification (?)
16.05.2009 09:55, mark: 069 24 h C* 1-2 133 100 0.910 14 < 3% (traces) good Remained 3 h in sep funnel on the ice
(had to leave area due to polar bears) 16.05.2009 19:34, mark: 070 36 h A 1-2 189 100 0.912 16 < 1% (traces) good Taken on frozen slush ice 16.05.2009 19:41, mark: 071 36 h C 1-2 160 100 0.911 15 < 1% (traces) good Taken on frozen slush ice 16.05.2009 19:57, mark ? 36 h D 3 147 100 0.910 14 < 1% (traces) good Sample taken on a floe
17.05.2009 09:46, mark 073 48 h A 0.5 2101/1376 10/100 0.917 20 49%, 47%, 49% =
48% good Taken of a thin emulsion layer,
emulsified oil, relatively viscous 17.05.2009 19:41, mark: 074 60 h B 1 212 100 0.913 17 < 1% (traces) good Taken in a sheltered wake/channel 18.05.2009 13:15, mark: 075 72 h A 1152/938 10/100 0.918 21 34% good Taken in 1-2 cm slush ice, emulsion 18.05.2009 13:30, mark: 076 72 h B 1 349 100 0.915 18 10% good Taken in a sheltered wake/channel 18.05.2009 19:00, mark: 077 84 h A 0.5 1829/1203 10/100 0.919 22 44% good Taken in slush ice, emulsion 18.05.2009 19:19, mark: 078 84 h B 1-2 cm 352 100 0.917 20 4% good Taken in a sheltered wake/channel 19.05.2009 10:57, mark: 079 96 h X 0.3-0.5 cm 1323/1179 10/100 0.918 21 37% good Taken in slush ice, emulsion 20.05.2009 14:29, mark 085 120 h < 1 mm (?) 2137/1652 10/100 0.926 28 33% good Took time 4 pads taken thickness
21.05.2009 144 h
Ca. 0.5 cm
537 100 n.a. n.a. n.a.
goodIn the southern position of the slick, very sheltered wake, thick oil layer
P4.2 slick:
19.05.2009 14:03, mark: 080 5 h A 2.5 cm 85 100 0.902 8 < 1% (traces) good Thick oil layer, dispersant slick, 19.05.2009 14:06, mark: 081 5 h B 3 cm 89 100 0.902 8 < 1% (traces) good Thick oil layer
P2.1 slick:
19.05.2009 20:43, mark: 083 11 h A 2-3cm 109 100 0.913 17 < 1% (traces) good Thick oil layer, in situ burning slick
19.05.2009 20:51, mark: 084 11 h B 0.5 cm