development report 201 - umar.si
TRANSCRIPT

deve
lopm
ent r
epor
t 201
6
dev
elop
men
t re
por
t 20
10
development report 2010

dev
elop
men
t re
por
t 20
10
development report 2010

Development Report 2016Ljubljana, June 2016
Published by: IMAD, Ljubljana, Gregorčičeva 27Responsible Person: Boštjan Vasle, MSc, DirectorEditor: Rotija Kmet Zupančič, MScAssistant Editor: Matevž Hribernik
Authors of the Development Report 2016: Marijana Bednaš, MSc (Macroeconomic framework, Macroeconomic stability and economic growth, Financial system and corporate sector indebtedness, Challenges), Jure Brložnik (Macroeconomic stability and economic growth, Real GDP growth), Tanja Čelebič, MSc (Human capital, Challenges, Quality of life, Share of the population with tertiary education, Education expenditure, Participation of adults in lifelong learning, Science and technology graduates, Young people neither in employment nor in education or training, Share of population with at least upper secondary education), Aleš Delakorda, MSc (Stability and quality of the public finances, General government debt), Janez Dodič (Macroeconomic stability and economic growth, Inflation, Yield on 10-year government bonds), Lejla Fajić (Stability and quality of the public finances, Challenges, General government balance), Barbara Ferk, MSc (Demographic trends and the welfare state, Social protection systems and their long-term sustainability, Material living conditions and social inclusion, Fertility rate and life expectancy, Net migration, Age-dependency ratio, Pension expenditure), Marko Glažar, MSc (Macroeconomic stability and economic growth, Stability and quality of the public finances, Overview of indicators), Marjan Hafner, MSc (Financial system and corporate sector indebtedness, Strengthening the institutional framework for the operation of the financial system and corporate restructuring, Development of the financial system, Loan-to-deposit ratio, Non-perfoming claims), Matevž Hribernik (Indicators of Slovenia’s development, The role of the state and its institutions, The withdrawal of the state from the economy, The functioning of the public administration and the judiciary, Challenges, Sustainable spatial development), Slavica Jurančič (Competitiveness of the corporate sector, Market share, Unit labour costs), Alenka Kajzer, PhD (Demographic trends and the welfare state, Labour market, Social protection systems and their long-term sustainability, Challenges, Temporary and part-time employment), Rotija Kmet Zupančič, MSc (Introductory remarks, Main findings, Summary, Macroeconomic stability and economic growth, Factors of competitiveness, Competitiveness of the corporate sector, Human capital, Challenges, Use of Internet and e-services), Mojca Koprivnikar Šušteršič (Competitiveness of the corporate sector, Sustainable spatial development, Knowledge-intensive market services), Tanja Kosi-Antolič, PhD (Stability and quality of the public finances, Selected environmental measures, Taxes and social security contributions, Tax burden by economic function, Environmental taxes), Mateja Kovač, MSc (Environmental, regional and spatial development, Environmental development, Natural resources and natural resource management, Selected environmental measures, Challenges, Greenhouse gas emissions, Waste, Agricultural intensity, Intensity of tree felling), Valerija Korošec, PhD (Quality of life and social inclusion, Income inequality, Life satisfaction, At-risk-of-poverty rate, Material deprivation); Janez Kušar (Macroeconomic stability and economic growth), Urška Lušina, MSc (Financial system and corporate sector indebtedness, Strengthening the institutional framework for the operation of the financial system and corporate restructuring, Indebtedness of the corporate sector), Jože Markič, PhD (Macroeconomic stability and economic growth, Competitiveness of the corporate sector, Current account of the balance of payments, Gross external debt, Net financial position), Helena Mervic (Social protection systems and their long-term sustainability, Material living conditions and social inclusion, Social protection expenditure, Gross-adjusted disposable income per capita, Actual individual consumption per capita), Ana Murn, PhD (Stability and quality of the public finances, Quality of life and social inclusion, Material living conditions, Quality of life, State aid), Tina Nenadič, MSc (Competitiveness of the corporate sector), Janja Pečar (Regional development, Sustainable spatial development, Regional variation in GDP per capita, Regional variation in the registered unemployment rate, Challenges), Mitja Perko, MSc (Macroeconomic stability and economic growth, Labour market, Employment rate, Unemployment rate and long-term unemployment rate, Temporary and part-time employment), Jure Povšnar (Network industries, Natural resources and natural resource management, Energy efficiency, Renewable energy sources, Road freight transport), Matija Rojec, PhD (Competitiveness of the corporate sector, The withdrawal of the state from the economy, Foreign direct investment), Urška Sodja (Trust in institutions, Quality of life and social inclusion), Metka Stare, PhD (Competitiveness of the corporate sector, Human capital, Innovation capacity, Challenges), Dragica Šuc, MSc (Stability and quality of the public finances, Selected environmental measures, Regional development), Branka Tavčar (GDP per capita in purchasing power standards), Ana T. Selan, MSc (Macroeconomic stability and economic growth, Labour market, Material living conditions and social inclusion, Minimum wage); Ana Vidrih, MSc (Innovation capacity, Selected environmental measures, Competitiveness of the corporate sector, Entrepreneurial activity, Gross domestic expenditure on research and development, Intellectual property); Ivanka Zakotnik (Competitiveness of the corporate sector, Natural resources and natural resource management, Labour productivity, Structure of merchandise exports by factor intensity, Emission- intensive industries), Eva Zver, MSc (Social protection systems and their long-term sustainability, Quality of life and social inclusion, Health expenditure, Expenditure on long-term care, Healthy life years).
Editorial board: Marijana Bednaš, MSc; Jure Brložnik; Aleš Delakorda, MSc; Lejla Fajić; Alenka Kajzer, PhD; Mateja Kovač, MSc; Janez Kušar; Metka Stare, PhD; Boštjan Vasle, MSc
Concept and design: Katja Korinšek, Pristop,DTP: Ema Bertina Kopitar, Bibijana Cirman NagličFigures: Marjeta Žigman
© The contents of this publication may be reproduced in whole or in part provided that the source is acknowledged.


3Development Report 2016Table of Contents
Table of contentsIntroductory remarks.................................................................................................................. 9
Main findings.............................................................................................................................. 11
Summary .................. .................................................................................................................. 13
1 Macroeconomic framework ................................................................................................. 17 1.1 Macroeconomic stability and economic growth ............................................................................. 17 1.2 Stability and quality of the public finances ...................................................................................... 22 1.3 Financial system and corporate sector indebtedness .................................................................... 27 1.3.1 The situation of the financial sector and deleveraging of the corporate sector ........................................27 1.3.2 Indebtedness of the corporate sector .............................................................................................................30 1.3.3 Strengthening of the institutional framework for the operation of the financial system and corporate restructuring ....................................................................................................................................32 1.4 Challenges ............................................................................................................................................... 33
2 Factors of competitiveness ................................................................................................... 35 2.1 Competitiveness of the corporate sector ......................................................................................... 35 2.2 Human Capital ........................................................................................................................................ 41 2.3 Innovation capacity ............................................................................................................................... 44 2.4 The role of the state and its institutions ............................................................................................ 47 2.4.1 The withdrawal of the state from the economy.............................................................................................49 2.4.2 The functioning of the public administration and the judiciary .................................................................50 2.5 Challenges ............................................................................................................................................... 52
3 Demographic trends and the welfare state ...................................................................... 54 3.1 Labour market ........................................................................................................................................ 55 3.2 Social protection systems and their long-term sustainability ...................................................... 58 3.3 Quality of life and social inclusion ...................................................................................................... 61 3.3.1 Material living conditions and social inclusion .............................................................................................62 3.3.2 Quality of life .....................................................................................................................................................64 3.4 Challenges ............................................................................................................................................... 67
4 Environmental, regional and spatial development ......................................................... 68 4.1 Environmental development ............................................................................................................... 68 4.1.1 Natural resources and natural resource management ................................................................................68 4.1.2 Selected environmental measures ..................................................................................................................76 4.2 Regional development.......................................................................................................................... 79 4.3 Sustainable spatial development ....................................................................................................... 82 4.4 Challenges ............................................................................................................................................... 84
Appendix: Indicators of Slovenia’s development .................. ............................................. 87
1 Macroeconomic framework ................................................................................................. 89 1.1 Real GDP growth .................................................................................................................................... 91 1.2 Inflation .................................................................................................................................................... 92 1.3 Current account of the balance of payments ................................................................................... 93 1.4 Gross external debt ............................................................................................................................... 94 1.5 Net financial position ............................................................................................................................ 95 1.6 General government balance .............................................................................................................. 96 1.7 General government debt .................................................................................................................... 97

4 Development Report 2016Table of Contents
1.8 Yield on 10-year government bonds .................................................................................................. 98 1.9 Taxes and social security contributions ............................................................................................. 99 1.10 Tax burden by economic function ................................................................................................. 100 1.11 State aid .............................................................................................................................................. 101 1.12 Development of the financial sector .............................................................................................. 102 1.13 Loan-to-deposit ratio ........................................................................................................................ 103 1.14 Non-performing claims .................................................................................................................... 104 1.15 Indebtedness of the corporate sector ........................................................................................... 105
2 Factors of competitiveness .................................................................................................107 2.1 GDP per capita in purchasing power standards ............................................................................ 109 2.2 Labour productivity ............................................................................................................................. 110 2.3 Market share ......................................................................................................................................... 111 2.4 Unit labour costs .................................................................................................................................. 112 2.5 Structure of merchandise exports by factor intensity .................................................................. 113 2.6 Knowledge-intensive market services ............................................................................................. 114 2.7 Network industries .............................................................................................................................. 115 2.8 Foreign direct investment .................................................................................................................. 116 2.9 Entrepreneurial activity ..................................................................................................................... 117 2.10 Share of the population with tertiary education ......................................................................... 118 2.11 Education expenditure ..................................................................................................................... 119 2.12 Participation of adults in lifelong learning ................................................................................... 120 2.13 Gross domestic expenditure on research and development .................................................... 121 2.14 Science and technology graduates ................................................................................................ 122 2.15 Intellectual property ........................................................................................................................ 123 2.16 Use of Internet and e-services ......................................................................................................... 124 2.17 Trust in institutions ............................................................................................................................ 125
3 Demographic changes and the welfare state .................................................................127 3.1 Fertility rate and life expectancy ...................................................................................................... 129 3.2 Net migration ........................................................................................................................................ 130 3.3 Age-dependency ratio ....................................................................................................................... 131 3.4 Employment rate.................................................................................................................................. 132 3.5 Unemployment rate and long-term unemployment rate ............................................................ 133 3.6 Temporary and part-time employment ........................................................................................... 134 3.7 Minimum wage ..................................................................................................................................... 135 3.8 Young people neither in employment nor in education or training .......................................... 136 3.9 Social protection expenditure ........................................................................................................... 137 3.10 Health expenditure .......................................................................................................................... 138 3.11 Expenditure on long-term care ....................................................................................................... 139 3.12 Pension expenditure ......................................................................................................................... 140 3.13 Gross adjusted disposable income per capita ............................................................................. 141 3.14 Actual individual consumption ....................................................................................................... 142 3.15 Income inequality .............................................................................................................................. 143 3.16 Life satisfaction .................................................................................................................................. 144 3.17 Healthy life years................................................................................................................................ 145 3.18 Share of population with at least upper secondary education ................................................ 146 3.19 At-risk-of-poverty rate ...................................................................................................................... 147 3.20 Material deprivation rate ................................................................................................................. 148
4 Environmental, regional and spatial development .......................................................149 4.1 Greenhouse gas emissions ............................................................................................................... 151 4.2 Energy efficiency .................................................................................................................................. 152 4.3 Emission-intensive industries ............................................................................................................ 153

5Development Report 2016Table of Contents
4.4 Renewable energy sources ................................................................................................................ 154 4.5 Share of road transport in total freight transport ......................................................................... 155 4.6 Waste ...................................................................................................................................................... 156 4.7 Agricultural intensity........................................................................................................................... 157 4.8 Intensity of tree felling ........................................................................................................................ 158 4.9 Environmental taxes ............................................................................................................................ 159 4.10 Regional variation in GDP per capita ............................................................................................ 160 4.11 Regional variation in the registered unemployment rate ......................................................... 161
Bibliography and sources .................. ...................................................................................162
List of acronyms and abbreviations used.................. .........................................................172
Tables
Table 1: Absorption of EU funding by fund in the period 2007–2015 in Slovenia .................................. 23Table 2: The market share of Slovenian exports of services in EU service imports ................................. 38Table 3: Changes in the number of employed persons (in %), Slovenia ................................................... 55Table 4: Share of fixed-term employment contracts in the total number of new employment contracts, Slovenia ................................................................................................................................ 57Table 5: Gross wage growth, private and public sector, Slovenia ............................................................... 58Table 6: Disposable income, Slovenia .............................................................................................................. 63Table 7: Wage inequality indicators, Slovenia ................................................................................................ 63Table 8: Social exclusion risk rate, Slovenia .................................................................................................... 64Table 9: Basic natural resources and their use ................................................................................................ 68Table 10: Waste production and management, in thousand tonne, Slovenia ........................................... 74Table 11: Forest and commercial utilisation, Slovenia .................................................................................... 76Table 12: Government budget appropriations for environment and energy as a percentage of total government R&D budget ...................................................................................................... 78Table 13: Development risk index ....................................................................................................................... 80
Figures
Figure 1: Gross domestic product, exports and gross fixed capital formation – a comparison between Slovenia and the EU ............................................................................................................. 17Figure 2: Ratio of debt to gross operating surplus of the non-financial corporate sector ...................... 18Figure 3: Changes to the current account of the balance of payments, Slovenia ..................................... 20Figure 4: General government revenue and expenditure in Slovenia......................................................... 22Figure 5: Sources of financing gross general government investment ....................................................... 23Figure 6: Actual and structural general government balance, Slovenia ..................................................... 23Figure 7: Structure of general government revenue and expenditure in Slovenia .................................. 25Figure 8: General government debt, Slovenia.................................................................................................. 25Figure 9: Capital adequacy (TIER 1) of the banking systems ......................................................................... 27Figure 10: Change in the volume of loans to households, corporates and NFIs and the government, Slovenia .................................................................................................................................................. 28Figure 11: Volume of newly granted loans to non-banking sectors in Slovenia.......................................... 28Figure 12: The corporate demand for loans by size of enterprises, Slovenia and the EMU ....................... 29Figure 13: The ratio between the debt and equity of non-financial companies .......................................... 30
6 Development Report 2016Table of Contents
Figure 14: Change in bank debt of the entire corporate sector, Slovenia ..................................................... 31Figure 15: Indicators of the ability of private sector conventional companies to repay their debts, Slovenia .................................................................................................................................................. 31Figure 16: Indicators of the ability of private sector unconventional companies to repay their debts, Slovenia ................................................................................................................................................... 31Figure 17: GDP per capita in terms of purchasing power parity and its components (productivity and employment) .................................................................................................................................. 35Figure 18: Slovenia’s share of merchandise in foreign markets and shift-share decomposition analysis of Slovenia’s global merchandise market share ............................................................... 36Figure 19: Relative market shares by structure of merchandise exports according to factor intensity .. 36Figure 20: Real unit labour costs, Slovenia and the EU ..................................................................................... 37Figure 21: Productivity of manufacturing industries in comparison with the EU ....................................... 38Figure 22: Services value added share in manufacturing industry exports, 2011 ...................................... 38Figure 23: Degree of participation in global value chains in terms of value added ................................... 39Figure 24: Fast-growing companies, Slovenia .................................................................................................... 41Figure 25: The share of employed persons (aged 25–64) with tertiary education, 2014 ........................... 42Figure 26: Employed tertiary-educated graduates (aged 25–34) overqualified in their current job ...... 42Figure 27: Participation of employed persons aged 25–64 in lifelong learning, Slovenia ........................ 43Figure 28: Public expenditure for R&D in the business and public sectors .................................................. 44Figure 29: Enterprises that recruited ICT specialists but had difficulties in filling vacancies, 2012 and 2015 ....................................................................................................................................... 47Figure 30: Government efficiency according to the IMD and the WEF .......................................................... 48Figure 31: Major obstacles to doing business in Slovenia (WEF survey) ....................................................... 48Figure 32: WEF indicators of efficiency of the judiciary in Slovenia ............................................................... 52Figure 33: The number of working-age people and older people and the old-age dependency ratio, Slovenia ................................................................................................................................................... 54Figure 34: Scenario for an increase in the number of economically active and employed persons, Slovenia ................................................................................................................................................... 54Figure 35: Employment and unemployment flows ........................................................................................... 55Figure 36: Unemployment outflow rate with regard to unemployment duration, and the Beveridge curve, Slovenia ................................................................................................................... 56Figure 37: Projections of public expenditure on pensions, health care and long-term care, Slovenia ................................................................................................................................................... 59Figure 38: Average efficiency estimates of health care systems in the EU .................................................... 61Figure 39: Pension distribution and years of pensionable service in December 2015, Slovenia ............. 62Figure 40: Proportion of informal care recipients and unmet needs in the population aged 50 and older, 2013, in % .................................................................................................................................... 65Figure 41: Issues considered most important by respondents on a personal level, Slovenia ................... 66Figure 42: GHG emissions and emission intensity ............................................................................................. 70Figure 43: PM10 pollution and the exposure of the population to PM10, Slovenia and the EU............... 71Figure 44: Energy intensity, Slovenia and comparison between Slovenia and the EU ............................... 72Figure 45: Domestic material consumption and resource productivity, Sloveniaand the cost of materials used per unit of output by sectors of industry and construction in 2012 ........... 73Figure 46: Municipal waste management, Slovenia and the EU ..................................................................... 74Figure 47: Organic farming areas, Slovenia and the EU .................................................................................... 76Figure 48: Unprocessed timber production, its structure and net exports, Slovenia ................................. 76Figure 49: Revenues from environmental taxes, Slovenia ............................................................................... 77Figure 50: Taxes and other public duties levied on gasoline and diesel fuel, Slovenija, neighbouring countries and the EU ............................................................................................................................ 77Figure 51: The structure of payments from 2007–2013 ETID OP, 2015 year-end stock, Slovenia ............ 78Figure 52: Transactions and prices of new and existing residential real estate properties, Slovenia ..... 84

7Development Report 2016Table of Contents
Boxes
Box 1: Growth of potential GDP and output gap ......................................................................................... 19Box 2: Assessment of Slovenia in the European Commission’s excessive imbalance procedure ........ 21Box 3: Scope and efficiency assessment of government financial support to the corporate sector .. 24Box 4: Snowball effect and public debt .......................................................................................................... 26Box 5: Export-oriented Slovenian economy - comparison of gross exports and value added exports ...................................................................................................................................................... 40Box 6: Characteristics of Slovenia’s startup entrepreneurship .................................................................. 46Box 7: International comparison of public administration efficiency ...................................................... 51Box 8: Ecological footprint ................................................................................................................................ 69Box 9: The United Nations Climate Change Conference in Paris ............................................................... 70Box 10: A new Circular Economy Package of the European Commission .................................................. 75
Maps
Map 1: Development risk index (DRI), 2015 ................................................................................................... 79Map 2: Social exclusion, 2014 ............................................................................................................................ 81


9Development Report 2016 Introductory remarks
Introductory remarksThe Development Report is a document that monitors the fulfilment of the strategic guidelines for Slovenia’s economic, social and environmental development. At a time when a new strategy for Slovenia’s development is being drafted, the Development Report 2016 shows the baseline situation and development challenges, not only in terms of ensuring macroeconomic stability and the long-term sustainability of economic, social and environmental development, but also in terms of meeting the country’s international commitments (e.g. within the Europe 2020 strategy, the Stability and Growth Pact and the mechanism for detecting excessive imbalances).
The Development Report analysis is based on selected development indicators, and focuses attention on areas that represent a particular development challenge. The findings rely on official data released by domestic and foreign institutions until 31 March 2016 and the revision of public finance data released on 20 April 2016. This year’s report therefore presents a review of trends up to 2015 or up to the last year for which data are available. In areas where no relevant indicators exist owing to a lack of data, we have also consulted other sources, particularly analyses by national and international institutions and reports on the implementation of sectoral strategies and programmes. In the analyses conducted, Slovenia is mainly compared with EU Member States. Where we did not have data for the entire EU, the average of those EU Member States for which data were available was used. Slovenia is also occasionally compared with OECD countries, usually with the average of the 21 EU Member States that are also OECD members. The terms ‘European average‘ or ‘EU average‘ refer to the EU-28 group, whereas the term ‘new Member States‘ means the EU-13 countries that joined the EU in the enlargements after 2004 (or the EU-12, without Croatia).
The Development Report is divided into two parts. The findings of the analysis are summarised in the main body of the Report, which is then followed by a detailed report on progress by individual indicators for Slovenia’s development. The subject matter is divided into four sections: macroeconomic framework; competitiveness factors; the population and the welfare state; and environmental, regional and spatial development.


11Development Report 2016Main findings
Main findingsIn the past few years, Slovenia has taken a number of positive steps and slightly narrowed its development gap with the EU. During the crisis, Slovenia’s economic development gap widened considerably in relation to the EU average. The economic downturn also disrupted macroeconomic balances and weakened the material welfare of the population. In recent years, however, the economic situation has been improving. The average annual growth of 3% of GDP in 2014 and 2015 was achieved in an environment of increased foreign demand, improved economic competitiveness and stronger government investment. The economic recovery was favourably impacted by the implementation of banking system stabilisation and the financial and ownership restructuring of companies. In 2015 the general government deficit dropped below 3% of GDP for the first time since the onset of the crisis. Economic growth has been accompanied by a recovery on the labour market. This led to renewed growth in disposable income, which is a significant factor in the material welfare of the population. Despite the decline in disposable income during the crisis, Slovenia, owing to its highly developed social protection systems, has managed to keep social inclusion and access to public services at a relatively high level, by international standards, and retain one of the lowest income inequality rates in the EU. Life satisfaction has also remained relatively high despite the crisis. Pressures on the environment have also eased in the past few years, but more as a result of lower economic activity during the crisis and some non-systemic factors than sustainable shifts towards the more efficient use of energy and commodities.
Regardless of these positive shifts, challenges remain in terms of ensuring a more sustainable improvement to Slovenia’s growth potential and the welfare of its population, which will require more radical structural changes. To strengthen its growth potential and improve the quality of life and welfare of its population, it is vital that Slovenia increases its productivity and adjusts its social protection systems to demographic changes, i.e. the rising share of the elderly population. Both would also have a positive impact on fiscal consolidation, which is essential for Slovenia to create a stable macroeconomic framework as a basis for sustainable development. However, economic development must also pursue the goal of reducing the environmental burden, and the measures taken towards more efficient use of energy and commodities should be considered an opportunity to increase productivity and competitiveness.
Priority measures should be focused on:
Establishing strategic development priorities and improving the efficiency of the government and its institutions responsible for making and executing coordinated development decisions;
Increasing productivity by boosting the innovative capacity of businesses, providing a business environment that fosters entrepreneurship, developing human capital supportive to the competitiveness of the economy and encouraging the more efficient use of digital technologies;
Ensuring sources of finance for businesses by establishing an effective banking system, faster restructuring of enterprises, improving access to funding for small and medium-sized enterprises and developing the non-bank segments of the financial system;
Improving the governance of state-owned enterprises and restructuring their ownership;
Continuing fiscal consolidation through more permanent measures for reducing the structural deficit, particularly in order to ensure the fiscal sustainability of the pension system;
Adjusting social protection systems to the ageing population, establishing a comprehensive system of long-term care, improving the efficiency of the health system and strengthening its preventive activities;
Improving the system of labour market flexicurity in order to improve the efficiency of labour force allocation and reduce labour market segmentation;
Reducing environmental pressures through the more efficient use of energy and raw materials and a transition to sustainable mobility.


13Development Report 2016Summary
SummaryAfter the deterioration during the crisis, the economic situation and material living conditions have been improving in recent years, but a more lasting improvement to growth potential and the welfare of the population will require more radical structural changes. During the crisis, Slovenia significantly increased its gap in GDP pc in relation to the EU average. The economic downturn also disrupted macroeconomic balances and exacerbated the material welfare of the population. In the last few years, however, positive shifts have been recorded in a number of areas. As a result of economic growth boosted by exports and government investment, Slovenia stopped moving away from the EU average in terms of GDP pc in 2014 and brought the general government deficit below 3% of GDP in 2015. The material situation of the population also started to improve with the recovery of labour market conditions. However, since Slovenia’s growth potential declined during the crisis, economic progress has been relatively slow; this has in turn diminished the possibilities for a greater improvement to the welfare of the population, which is increasingly jeopardised by society not adjusting sufficiently to demographic changes. This should be addressed by more radical structural changes, focused primarily on raising productivity and adjusting social protection systems to reflect the accelerating ageing of the population. These changes are also essential in order to consolidate the public finances and restore a stable macroeconomic framework as a basis for sustainable development. Economic development should also pursue environmental goals, and the measures taken towards the more efficient use of energy and commodities should also be considered an opportunity to raise productivity and improve economic competitiveness.
After deteriorating during the crisis, the competitiveness of exporters has improved and positively affected economic growth; however, in order to further improve the economic position, it is essential to boost productivity. Cost and price competitiveness factors, in particular, have strengthened in recent years. Several years of cost competitiveness gains have had a positive effect on the position of exporters on foreign markets. Higher export competitiveness has increased Slovenia’s integration into international trade flows. The composition of exports is also improving. However, these positive shifts have yet to be supported by gains in productivity, which is low by international standards. Increasing productivity is essential for a more sustainable improvement in competitiveness and to hasten the closing of the development gap, particularly in light of rising limitations to labour force supply owing to population ageing. Alongside an urgent increase in investment, which could also accelerate productivity growth in the short term, Slovenia also faces a number of challenges regarding investment in longer-term productivity factors such as innovation capacity, the digital economy and human capital. Competitiveness should also be boosted by creating an environment that is conducive to the establishment and growth of businesses. In recent years, Slovenia has made particular headway regarding the ease of starting a business; it is also improving the regulatory environment for start-up enterprises, but excessive red tape, especially the lengthy procedures involved in obtaining permits, remains a significant burden on business operations.
The investment climate is improving, but investment that is essential to increasing productivity has yet to be revived. Private investment, a key factor in raising productivity and preserving economic competitiveness, is recovering only gradually; nevertheless the investment environment has improved over the past few years owing to increased banking system stability, the deleveraging of companies and their increased profitability. Lending activity, however, continues to contract owing to limited corporate demand and the persistent risk aversion of banks. Given the high reliance of enterprises on bank funding owing to the poor development of other segments of the financial system, this makes it very difficult for them to secure financing. In order to accelerate investment activity, it is also necessary to expedite the ownership and financial restructuring of companies; with a view to achieving this goal, the government has also strengthened the institutional framework in the past few years. By privatising some of its companies, Slovenia has also increased the inflow of foreign investment over the last two years, which is a welcome development in terms of strengthening the country’s growth potential, as foreign investment enables the corporate sector to gain access not only to fresh sources of funding but also to new know-how and markets. A rebound in investment activity would also help reduce the surplus of savings over investment, which has widened significantly in recent years.
While investment in some long-term factors of value added growth is relatively high by international standards, its efficient use in support of higher productivity remains a challenge. Slovenia’s R&D investment is relatively high in comparison with investment in its international counterparts. Owing to the absorption of EU funds and boosted by tax relief, business sector investments, in particular, have increased since the beginning of the crisis. Expenditure on tertiary education is also high. The share of the population with tertiary education reached the EU average; the strengthening of human capital in science and technology is especially encouraging. Despite positive shifts, human capital, a significant factor of competitiveness and long-term growth, is not efficiently used in

14 Development Report 2016Summary
Slovenia. The composition and skills of tertiary educated people often fail to match the business sector’s demand. Moreover, Slovenia has also had to deal with human capital flight in recent years. At the same time, as the cohorts of prospective tertiary students are shrinking as a result of demographic changes, it will become increasingly difficult to ensure that staff are sufficiently educated to support the competitiveness of the economy in the future. The innovative capacity of the economy also remains weak, the main challenges being the insufficient transfer of knowledge from the research to the business sector, the low rate of innovation activity on the part of small businesses and the slow response to the rapid development of new technologies and process digitalisation. In recent years, a reduction in public R&D investment has also become a matter of concern.
The favourable developments in fiscal consolidation should be reinforced by more permanent measures for fiscal stability. After the significant deterioration in public finances in 2008, positive shifts have been witnessed recently, which arise from the improvement in the economic situation and government intervention measures. In 2015 the general government deficit dropped below 3% of GDP for the first time since the onset of the crisis. With a significant improvement in financing conditions in the last two years, expenditure on interest also fell in 2015. This is favourable in view of the necessary reduction in general government debt, which in 2015 was still rising and is already approaching levels which could have a negative effect on economic growth. In order to correct the structural deficit, which goes back to the pre-crisis period, Slovenia will have to adopt more permanent measures to stabilise the public finances. These should also tackle the areas where expenditure growth is also related to demographic changes that affect long-term fiscal sustainability. The pressures on the public finances will also have to be eased by boosting productivity and economic growth. On the revenue side, Slovenia could also make better use of the possibility to increase revenues by broadening the tax base, changing the taxation of property and improving the efficiency of state asset management.
The opportunities to improve quality of life increase as the economy recovers, but Slovenia must strengthen its growth potential and adjust to demographic changes in order to achieve a more sustainable improvement to the welfare of its population. Having contracted during the crisis due to the tightening labour market conditions, household disposable income has mainly been rising since 2014 owing to growing employment and earnings amid the recovering economy. Although during the crisis the material situation of the population deteriorated, owing to its well developed social protection systems, Slovenia has managed to retain the relatively high levels of the indicators of social inclusion, inequality and access to public services. Life satisfaction has also remained high by international comparison. Over the longer term, most composite indicators of health have improved, but the indicators for life-style related health status have deteriorated. However, in the years to come, it will not be possible for Slovenia to maintain or even improve the quality of life and welfare of the population without making major economic and social changes. In order to further improve basic material conditions, it is therefore vital to improve productivity as the basis for sustainable growth in population income and to establish a system of flexicurity on the labour market that reduces segmentation and is conducive to the efficient allocation of the labour force. However, the main challenge is adjusting social protection systems to demographic changes.
It is becoming increasingly important for Slovenia to adjust its social protection systems to its ageing population in order to further improve the quality of life and lower the pressures on the public finances. The ageing of the population is reflected in rising pressures on public expenditure for their financing. The number of older people per one working-age person will have doubled by 2060. Long-term projections indicate that age-related expenditures will increase more in Slovenia than for all other EU Member States by 2060. Although the 2013 pension reform temporarily decelerated growth in the number of old-age pensioners, it did not significantly improve the long-term sustainability of the pension system. The needs for health and long-term care services, areas in which reforms have been in preparation for more than ten years, are also rising rapidly. The challenges to social protection systems mainly involve adjusting their financing to the shrinking proportion of the active population (i.e. taking account of population ageing), continuously improving the efficiency of the health care system, strengthening preventive activities and establishing a comprehensive system of long-term care.
Slovenia has made progress in terms of reducing the environmental burden over the last few years, but long-term management remains a challenge, particularly in view of faster economic growth. Greenhouse gas emissions have been declining since 2008, largely as a consequence of lower energy consumption amid declining economic activity during the crisis, but also due to the mild winters in recent years and the shut-down of a thermal power plant. Despite this decline, the emission and energy intensities of the economy remain high, and so Slovenia has not narrowed its gap with the EU average since the beginning of the crisis. With faster economic

15Development Report 2016Summary
growth, it could therefore be more difficult to achieve further energy savings and emission reductions. Slovenia stands out particularly with regard to its extensive energy consumption for transport, which is attributable to the high level of transit through Slovenia and unsustainable mobility. More favourable developments are recorded in manufacturing, although this sector’s energy consumption per unit of GDP also still exceeds the EU average. Slovenia’s economy is characterised by low material productivity, meaning that it also has potential to increase its competitive position by more efficient use of raw materials and energy. In some areas Slovenia performs better than the EU. In view of its favourable natural assets, Slovenia not only has larger shares of renewable energy sources and organically farmed areas, but also generates less municipal waste per person than the EU average. Nevertheless, a transition towards a green economy, which will increase the competitiveness of the economy and the welfare of the population with minimum impact on the environment, will require a shift towards more sustainable production and consumption patterns.
Improvements in the efficiency of the government and its institutions would significantly contribute to the implementation of development-oriented changes towards more stable and welfare-oriented economic growth. Since the beginning of the crisis, Slovenia has slipped significantly on the international scales of institutional competitiveness, and the trust of its people and companies in politics, the government and its institutions is among the lowest in the EU. In the past few years, significant progress has been made towards improving the efficiency of the government, for example, by reducing the administrative burden and the grey economy and improving insolvency legislation; Slovenia has also adopted constitutional amendments to fiscal policy and referendum rules and increased the efficiency of its judiciary. However, in order to help the economy and society adapt to changes in the economic environment, Slovenia should increase the efficiency of the government and its institutions responsible for making and executing key development decisions. In recent years, the comprehensive and consistent planning of structural reforms has been increasingly impeded by the absence of a strategic development framework that defines the development priorities and their effective implementation. Development could also be boosted by establishing a more efficient spatial planning system, which is currently characterised by extremely lengthy procedures. Strategic decisions on development orientations are essential not only to formulate appropriate domestic development policies, but also for effective drawing on EU funds, which can make a significant contribution to Slovenia’s development.

17Development Report 2016Macroeconomic framework
1 Macroeconomic framework
A stable macroeconomic environment is vital in order to rapidly improve competitiveness factors, generate sustained economic growth and create new jobs. Since the onset of the economic crisis, the decline in GDP has been accompanied by a deterioration in a number of macroeconomic indicators, and the imbalances in several areas have remained or only gradually improved. The public deficit has been relatively high throughout the entire period, but declined below 3% of GDP in 2015, primarily as a result of the influence of intervention measures. With the economic policy measures implemented and the gradual recovery of economic growth, imbalances related to a lack of capital and pressures on long-term fiscal sustainability are increasingly coming to the fore. Owing to the deleveraging of the private sector, the surplus of savings over investment has been increasing for several years, which is reflected in the wide surplus in the current account of the balance of payments. An intensive bank recovery process has been under way since the bank recapitalisation in 2013; however, lending activities have not yet started to recover, partly because of the cautiousness of banks and partly because of weak demand for company loans. With some positive shifts in the economic, fiscal and finance situation in 2014 and 2015, a further reduction to macroeconomic imbalances and the provision of stable financing resources for companies are vital in order to achieve sustained economic growth.
1.1 Macroeconomic stability and economic growth
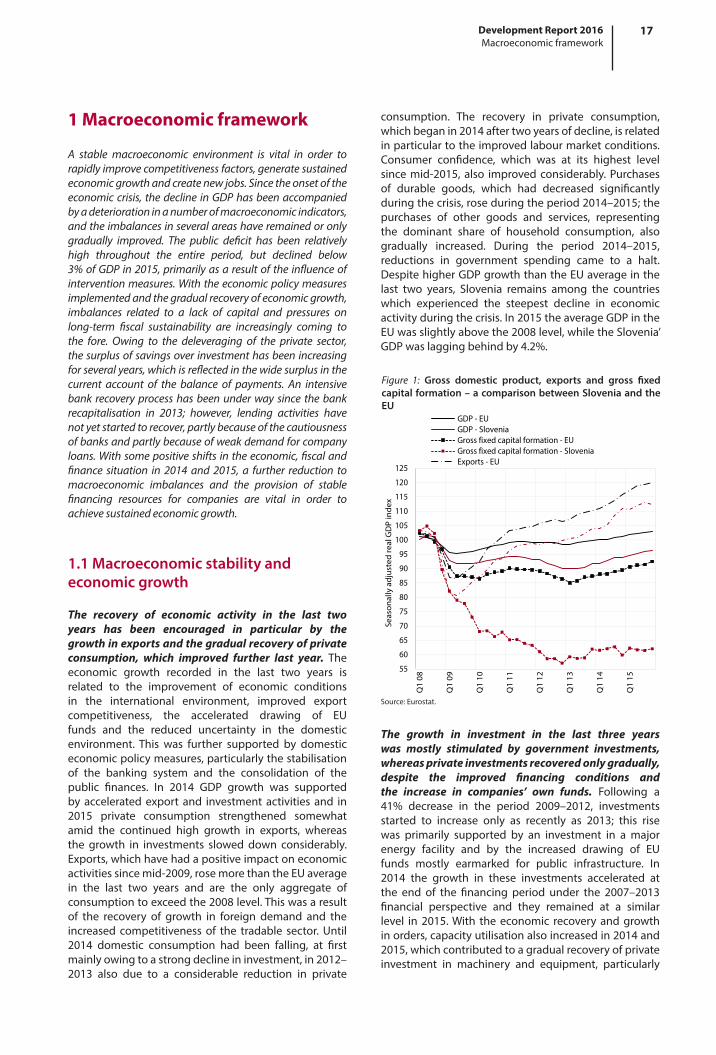
The recovery of economic activity in the last two years has been encouraged in particular by the growth in exports and the gradual recovery of private consumption, which improved further last year. The economic growth recorded in the last two years is related to the improvement of economic conditions in the international environment, improved export competitiveness, the accelerated drawing of EU funds and the reduced uncertainty in the domestic environment. This was further supported by domestic economic policy measures, particularly the stabilisation of the banking system and the consolidation of the public finances. In 2014 GDP growth was supported by accelerated export and investment activities and in 2015 private consumption strengthened somewhat amid the continued high growth in exports, whereas the growth in investments slowed down considerably. Exports, which have had a positive impact on economic activities since mid-2009, rose more than the EU average in the last two years and are the only aggregate of consumption to exceed the 2008 level. This was a result of the recovery of growth in foreign demand and the increased competitiveness of the tradable sector. Until 2014 domestic consumption had been falling, at first mainly owing to a strong decline in investment, in 2012–2013 also due to a considerable reduction in private
consumption. The recovery in private consumption, which began in 2014 after two years of decline, is related in particular to the improved labour market conditions. Consumer confidence, which was at its highest level since mid-2015, also improved considerably. Purchases of durable goods, which had decreased significantly during the crisis, rose during the period 2014–2015; the purchases of other goods and services, representing the dominant share of household consumption, also gradually increased. During the period 2014–2015, reductions in government spending came to a halt. Despite higher GDP growth than the EU average in the last two years, Slovenia remains among the countries which experienced the steepest decline in economic activity during the crisis. In 2015 the average GDP in the EU was slightly above the 2008 level, while the Slovenia’ GDP was lagging behind by 4.2%.
The growth in investment in the last three years was mostly stimulated by government investments, whereas private investments recovered only gradually, despite the improved financing conditions and the increase in companies’ own funds. Following a 41% decrease in the period 2009–2012, investments started to increase only as recently as 2013; this rise was primarily supported by an investment in a major energy facility and by the increased drawing of EU funds mostly earmarked for public infrastructure. In 2014 the growth in these investments accelerated at the end of the financing period under the 2007–2013 financial perspective and they remained at a similar level in 2015. With the economic recovery and growth in orders, capacity utilisation also increased in 2014 and 2015, which contributed to a gradual recovery of private investment in machinery and equipment, particularly
Figure 1: Gross domestic product, exports and gross fixed capital formation – a comparison between Slovenia and the EU
Source: Eurostat.
55
60
65
70
75
80
85
90
95
100
105
110
115
120
125
Q1
08
Q1
09
Q1
10
Q1
11
Q1
12
Q1
13
Q1
14
Q1
15
Seas
onal
ly a
djus
ted
real
GD
P in
dex
GDP - EUGDP - SloveniaGross fixed capital formation - EUGross fixed capital formation - SloveniaExports - EU

18 Development Report 2016Macroeconomic framework
in the tradable sector, according to our estimate. The improved operating results, especially those related to the deleveraging of the corporate sector (see Chapter 1.3) in recent years, have significantly reduced the debt-to-gross operating surplus ratio of non-financial companies, which was close to the entire euro area average in the first half of 2015. Along with the more favourable borrowing conditions (lower loan interest rates), this improved the environment for new investment decisions taken by companies which were increasing relatively modestly in 2015. This is also partly due to the extreme cautiousness of banks which is a limiting factor for those companies that have insufficient own resources available or no access to alternative sources of financing in the capital market or abroad. Furthermore, it is likely that this is also partly due to the reluctance of enterprises to increase demand for financial resources. Housing investments, which had reached almost half the level in the years before the crisis (2005–2007), began to grow towards the end of 2015 and are the main reason why, out of all the aggregates, joint investments continue to lag the most behind the pre-crisis level.
The continued recovery in economic activity caused a strengthening of employment growth in 2015, whereas the growth in wages eased owing to structural reasons and the need to maintain competitiveness1. The year 2014 witnessed the first positive turn in the labour market since the beginning of the crisis and in 2015 the growth of employment picked up pace (1.5%) by increasing in almost all private sector activities. The most significant contribution to this acceleration in employment growth was made by activities with relatively high growth in their value added (manufacturing, trade, transport, hotels and restaurants as well as ICTs). The growth in employment
1 For more details on labour market trends, see Chapter 3.1.
Figure 2: Ratio of debt to gross operating surplus of the non-financial corporate sector
Source: Eurostat, ECB; calculations by IMAD.
0
1
2
3
4
5
6
Q1
06
Q1
07
Q1
08
Q1
09
Q1
10
Q1
11
Q1
12
Q1
13
Q1
14
Q1
15
Slovenia Euro area
activities remained high, which is indicative either of the persisting cautiousness of companies regarding the recruitment of new employees or a desire for more flexible forms of employment. In 2015 the growth of the average gross wage per employee slowed down visibly after a significant rise in the previous year. As the tendency for companies to maintain their competitiveness continues, this is attributed to the increase in the share of employees with low wages and the absence of price pressures. Despite the slowdown, the increase in wages remained highest in manufacturing, pointing to the existence of a stronger base and the capacity of companies for further growth. After the decline during the period 2012–2013, the average wage in the public sector also increased slightly in 2014 and 2015. This was due to the commencement of the promotion payment, while wages in public corporations also continued to rise (see Chapter 3.1).
The growth in consumer prices has been very low since the onset of the crisis due to the weak economic activity and the process related to the internal adjustment of relative prices, whereas the considerable reduction in the price of raw materials in 2015 contributed to deflation for the first time since independence. In the period 2009–2013, the growth of prices eased due to economic growth and adjustment processes: particularly food and energy prices were rising, inflation being also due to measures related to fiscal consolidation and the introduction of certain environmental taxes. In the last two years, price growth slowed further due to the fall in raw material prices (in particular oil2) on the international markets, the lower prices of imported products and the smaller contribution of fiscal measures. At the end of 2015, the general price level was 0.5% lower than for the previous year. External environment factors also strongly affected the movement of the average prices in the EU, where prices increased slightly (by 0.2%) in 2015. The difference could be partly explained by a higher share of energy products in the structure of consumption in Slovenia (higher negative impact on the decrease in prices and vice versa). In the last two years, core inflation which does not include the prices of food and energy products has also been relatively lower in Slovenia. It is estimated that this was mainly a result of two groups of factors. Firstly, the process of adjusting the relative prices through the reduction of unit labour costs was carried out intensively, and was necessary in order to meet cost competitiveness requirements; therefore, there were no supply-side pressures for the rise in prices. Secondly, after a sharp fall, economic activity in Slovenia started to recover later than the EU average, with private consumption in particular recovering later and more slowly, which was reflected in the relatively slow growth in the prices of non-energy products and services.
2 In 2015 the price of Brent crude oil decreased by 47% and reached its lowest values in the last ten years.

19Development Report 2016Macroeconomic framework
Box 1: Growth of potential GDP and output gap
The growth of potential GDP had slowed at the beginning of the crisis, but was increasing gradually in the last two years. In the period before the crisis (2000–2007), the growth of potential GDP was estimated at just above 3%, before declining rapidly and significantly. GDP started to rise again in 2014 and 2015, when it was estimated at 0.9%. The significant decline in potential growth in Slovenia is largely due to the structure of economic growth in the past. In addition to exports, it was largely based on investments in infrastructure and the high degree of dependence on foreign funding sources, which led to an immediate stagnation at the onset of the crises. Because of the insufficient structural adjustments aimed at increasing the resilience of the economy to shocks in the years before the crisis and not always appropriate or timely action during the crisis, a potential for GDP growth diminished. The decrease in potential GDP growth in comparison to the period preceding the crisis was due to a reduced capital contribution (in 2015, this was 1.5% lower than the pre-crisis average) and total factor productivity (by 1%). In 2015 the contribution of labour was above the pre-crisis average, and contributed significantly to lower potential GDP growth during the period 2010–2013 (on average, 0.3% per year).
The output gap has been negative since the onset of the crisis, and began to close considerably in 2014 and 2015. The output gap,1 which measures the utilisation of production capacities and shows price pressures in the economy, was positive in the pre-crisis period and particularly high in 2006 and 2007. Since the onset of the crisis, it has been negative. In the early years of the crisis, the decline in investment demand therefore significantly contributed to a sharp fall in foreign demand and to companies experiencing difficulties gaining access to financial resources, whereas in 2012 and 2013 there was a considerable decline in private consumption associated with the deterioration of the situation in the labour market and the austerity fiscal measures taken. The negative output gap widened further during these years. Since 2014, the production gap has begun to gradually narrow, primarily owing to increased government investments financed mainly from EU funds. This figure remains negative because of uncertain circumstances on the financial markets and consumer cautiousness exerting an influence on corporate investments and household spending.
Figure: Growth of potential GDP in Slovenia
Source: calculations by IMAD.
-0.5
0.0
0.5
1.0
1.5
2.0
2.5
3.0
3.5
4.0
2000
2001
2002
2003
2004
2005
2006
2007
2008
2009
2010
2011
2012
2013
2014
2015
Con
trib
utio
n to
the
grow
th o
f pot
entia
l GD
P in
pps
LabourTotal factor productivityCapitalGrowth of potential GDP
1 The output gap is the difference between the actual and potential GDP, expressed as a percentage of potential GDP. Given the factors affecting the calculation of potential growth, in particular the changes in methodology, the estimated growth in the past and the GDP forecast, the output gap is a rather unstable macroeconomic indicator whereas, with the preparation of new calculations, its value may change considerably, also for the past periods.
-6
-4
-2
0
2
4
6
8
2000
2001
2002
2003
2004
2005
2006
2007
2008
2009
2010
2011
2012
2013
2014
2015
% o
f pot
entia
l GD
P
Output gapSlovenia Slovenia EC EU28 EA19
-1.0
-0.5
0.0
0.5
1.0
1.5
2.0
2.5
3.0
3.5
4.0
2000
2001
2002
2003
2004
2005
2006
2007
2008
2009
2010
2011
2012
2013
2014
2015
In %
Growth of potential GDP
Slovenia Slovenia EC EU28 EA19
Source: EC, IMAD.

20 Development Report 2016Macroeconomic framework
The current account surplus of the balance of payments, which reflects the widening of the gap between saving and investments, reached 7.3% of GDP in 2015. After the high deficit in the pre-crisis years, the current account of the balance payments was roughly balanced during the first three years of the economic crisis. Given the accelerated deleveraging of commercial banks and the corporate sector, the surplus then started to rise in the following years, boosted by the increased competitiveness of the tradable sector (see Chapter 2.1) and the related strengthening of exports. Despite the considerable debt reduction (see Chapter 1.3) and improvement in business results, private sector investments did not yet start to increase noticeably, so that the savings-investment gap widened further. The restricted access to bank loans and lack of capital financing sources had a significant impact on the uncertain economic prospects at the time and the reluctance of enterprises to make major investment decisions. The current account surplus increased substantially in 2012, 2013 and 2015 (by approx. EUR 2 billion in total), mainly due to the growing surplus in the balance of trade in goods. This was due to price factors and better terms of trade in addition to a higher growth in exports than imports in the last years. The surplus has also been due to the accelerated drawing down of EU funds, especially in 2014. On account of private sector deleveraging abroad, net interest payments have decreased since 2009 despite the growth in external government debt financing expenses.
Adjustment of current accounts of the balance of payments in the euro area has been asymmetrical since the onset of the crisis and continues to increase the macroeconomic imbalance of the entire area. A similar change or turn in the current account balance in Slovenia, resulting in a surplus, has been recorded in a number of euro area countries since the beginning of the financial crisis. In
2009 and 2010 the current account deficit also began to decline in countries that had large fiscal imbalances and an increasing number of austerity measures in place. According to the European Commission, this was largely due to the fall in domestic spending, particularly private sector investments and private consumption, as the limited increase in disposable income resulted in higher savings on average. At the same time, most of the countries that had a surplus prior to the crisis either maintained or further increased it. Current account adjustments in the euro area were asymmetric, which increased the macroeconomic imbalance, i.e. the average surplus of savings over investment, for the entire area. In this regard, Slovenia, in particular, has a surplus of savings over investment in the private sector which has been net deleveraging abroad for the past seven years amid the limited access to sources of finance.
Gross external debt, having maintained a similar level since the onset of the crisis, changed its structure radically. The share of public debt increased considerably, rising by EUR 22.4 billion in comparison with the pre-crisis period, and accounts for more than half of the gross external debt (42.2 pps higher than in 2008). Significant growth in external government debt associated with the recapitalisation of state-owned companies, mainly of banks, the covering of the state budget deficit and the pre-financing of debtors’ obligations has, in individual years, even greatly exceeded the net repayment of debts raised by the private sector in the pre-crisis period. In 2015, after an increase in 2014, it declined by EUR 1.5 billion and amounted to EUR 44.8 billion (116% of GDP) at the end of the year. This was largely a consequence of the slower growth in general government debt (see Chapter 2.1) with regard to the continued deleveraging of companies and banks abroad. At the end of the year the external debt of commercial banks fell by EUR 12.6 billion compared to 2008, while non-guaranteed private
Figure 3: Changes to the current account of the balance of payments, Slovenia
Real export
Real import
Terms of trade
Primary income
Current transfers
-4
-2
0
2
4
6
8
10
12
14
16
Con
trib
utio
ns in
pp
of G
DP
(200
8-20
15)
Current account sub-balances
Private consumption
Gross capital formation
Fiscal balance
Disposable private sector income
-4
-2
0
2
4
6
8
10
12
14
16
Con
trib
utio
ns in
pp
of G
DP
(200
8-20
15)
Changes in saving-investment gaps
Source: SURS, BS, Eurostat, calculations by IMAD.

21Development Report 2016Macroeconomic framework
Table: Results of the macroeconomic imbalance indicators for Slovenia
Indicator/Limit value 2004 2005 2006 2007 2008 2009 2010 2011 2012 2013 2014
Indi
cato
rs o
f ext
erna
l im
bala
nces
Current account, % of GDP (three-year average) +6/–4 % -0.9 -1.8 -2.1 -2.6 -3.8 -3.3 -2.0 -0.2 0.9 2.8 5.1
Net international investment position, % of GDP –35 % -8 -11 -17 -26 -39 -43 -47 -45 -50 -46 -44
Real effective exchange rate (HICP deflator), three-year increase +/–11 % 4.7 0.9 -2.9 -1.2 2.1 5.2 1.2 -1.1 -4.5 -0.7 1.2
Share of the world market (goods and services), five-year increase –6 % 18.3 30.0 21.4 23.6 16.0 9.5 -1.7 -5.5 -20.6 -17.6 -11.8
Nominal unit labour cost index, three-year increase +9 % 14.6 9.7 6.3 5.4 10.6 18.5 16.1 8.2 0.6 0.3 -0.2
Indi
cato
rs o
f int
erna
l im
bala
nces
Real estate prices, annual increase +6 % 6.4 12.1 14.0 18.8 1.3 -10.3 -1.3 0.9 -8.1 -6.0 -6.6
Private sector borrowing, credit, flow in % of GDP 15 % 8.5 12.4 13.6 21.5 15.5 2.9 1.9 0.4 -2.9 -4.0 -4.6
Private debt, % of GDP 160 % 67 76 83 96 106 114 115 113 113 108 100
General government debt, % of GDP 60 % 27 26 26 23 22 35 38 46 54 71 81
Unemployment rate, three-year average 10 % 6.4 6.5 6.3 5.8 5.1 5.1 5.9 7.1 8.1 9.1 9.6
Financial sector liabilities, unconsolidated, annual growth in % 16.5 % 11.5 17.7 13.8 28.6 6.6 7.7 -3.4 -1.2 -0.7 -10.3 -0.4
abou
r mar
ket
indi
cato
rs
Employment rate (15–64), 3-year change in pp -0.2 % 1.7 2.9 3.8 1.5 1.1 0.9 0.2 -1.5 -1.4 -1.0 0.6
Long-term unemployment rate (15–74), 3-year change in pp 0.5 % -0.5 -0.4 -0.6 -1.0 -1.2 -1.1 1.0 1.7 2.5 2.0 1.7
Youth unemployment rate (15–24), 3-year change in pp 0.2 % -1.7 -0.6 -3.4 -6.0 -5.5 -0.3 4.6 5.3 7.0 6.9 4.5
Source: Eurostat Portal Page – Macroeconomic imbalance procedure statistics, 2015. Note: Indicators found to exceed the threshold value in the EU excessive imbalance procedure are marked in grey.
Box 2: Assessment of Slovenia in the European Commission's excessive imbalance procedure
Under the EU economic governance, the European Commission has devoted special emphasis to the early identification and correction of excessive macroeconomic imbalances in the EU Member States since 2012. The imbalance identification procedure is based on 14 imbalance indicators (see Table) and an in-depth analysis to establish the impact of the imbalances identified by the indicators on macroeconomic stability. If the European Commission finds that macroeconomic imbalances exist, it will issue policy recommendations for the Member State(s) concerned. In severe cases of excessive macroeconomic imbalances that could also put the operations of the Economic and Monetary Union at risk, the EU Council shall initiate a procedure which will, in addition to recommendations to a particular Member State, enhanced surveillance and monitoring, require that the State concerned submits a plan of corrective actions. If a euro area Member State fails to take appropriate corrective action on several occasions in succession, it may be fined up to 0.1% of its GDP.
According to the European Commission1 report for 2015, the imbalances in Slovenia are no longer excessive; however, they still require careful monitoring and prevention. According to the data for 2014, Slovenia still exceeds the limit value in 5 out of 14 indicators (6 in the preceding year); however, their values (except for the general improvement debt) improved in 2014 and 2015. This is due to more favourable economic trends, including improved export competitiveness and measures taken in the area of bank rehabilitation, as well as the restructuring and privatisation of the financial and corporate sectors. The in-depth analysis of the European Commission2 published at the beginning of 2016 shows that the positive economic trends have continued and that they are accompanied by a recovery in the labour market and private consumption growth. It also reports that there has been a certain level of progress regarding the 2015 recommendations in the corporate restructuring area and the labour market, and improved efficiency of justice, whereby the key challenges of Slovenia, according to the European Commission, remain associated with long-term fiscal sustainability (including the adjustment of social protection systems to demographic changes) and the establishment of an appropriate environment to revive investment activity.
1 Alert Mechanism Report 2016, 2015. 2 Country Report Slovenia 2016, Including an In-Depth Review on the prevention and correction of macroeconomic imbalances, 2016.
debt decreased by EUR 14.4 billion. Despite its growth in individual years, the publicly guarantee debt in 2015 was lower than in 2008.
Despite the deleveraging of the private sector, the net financial position deteriorated considerably since the
onset of the crisis as a result of the increased borrowing by the general government; in 2015, this figure fell below 40% of GDP for the first time in this period. Since 2008, Slovenia has managed to exceed the limit of the EU indicator for external imbalances (35% of GDP) because of a considerable increase in total liabilities as external

22 Development Report 2016Macroeconomic framework
claims. The rise in obligations was driven exclusively by increased borrowing by the general government (see Indicators 1.4 and 1.7) which exceeded the scope of private sector debt repayment almost every year, particularly for banks abroad. With the exception of 2013 and 2015, particularly 2015, the further deleveraging of commercial banks abroad was the main reason for the decrease in joint liabilities. The growth in joint foreign claims, which was relatively slow, was primarily due to debt claims, particularly in 2014. In that year, the outflow of currency and deposits out of the country increased and, at the same time, portfolio investments abroad in connection with higher yields in international financial markets increased notably. Total foreign claims remained at the level attained, with a relative higher transfer of national funds to accounts abroad.3 In 2015 the net improvement to the financial position was mostly a result of the decrease in total liabilities. At the end of 2015 the net international investment position recorded a net debt external position amounting to EUR 14.4 billion or 37.3% of GDP (43.6% of GDP in 2014). In 2015, Slovenia therefore came very close to the indicative limit for the EU indicator of external imbalances (35% of GDP), and was considerably below the level of the most indebted euro area countries.4
1.2 Stability and quality of the public finances
Fiscal stability represents one of the key elements of macroeconomic stability. Structural problems arising from the pre-crisis period along with the severe cyclical deterioration of the public finances during the crisis had an impact on the high deficits and considerable increase in public debt after 2008. In this way, Slovenia lost an important buffer to mitigate adverse economic fluctuations, while the debt financing costs began to crowd-out other expenditure, thereby increasing pressure on their restructuring. The delay in reform measures and an increasing number of people having reached retirement age, which coincided with the crisis period, strongly influenced the increase in pension expenses, permanently altering the structure of general government expenditure and increasing the transfer of the state budget to cover the pension expenses in recent years. Despite the improving fiscal indicators in 2014 and 2015, the long-term prospects underline the importance of implementing further and more permanent fiscal balance measures, which should be taken in the areas that pose major challenges to long-term fiscal sustainability (social protection systems, management of state-owned assets, measures to increase the potential growth).
3 At the end of 2015 the amount of state funds abroad totalled EUR 3,888 million, representing EUR 2,415 million more than in 2014.4 At the end of 2015 Greece exhibited the negative international investment position, amounting to 126.2%, Ireland: 81.0%, Portugal: 116.5%, Spain: 91.0% and Cyprus: 138.1% of GDP.
In the last two years, fiscal indicators have improved on the basis of enhanced economic activity, a smaller impact of one-off factors and due to measures, which however were mainly temporary.5 The measures were designed in emergency circumstances, and were not long-term oriented. It is therefore reasonable to retain them only for a short period until they are replaced by measures which do not pursue only short-term austerity goals but rather contribute to the long-term structural adjustment of the public finances. The effects of these measures, along with the renewed economic growth, significantly contributed to the reduction of the public deficit reaching the lowest level since the onset of the crisis (2.9% of GDP) last year whereas the primary balance6 (0.0% of GDP) was balanced for the first time in this period. The measures adopted so far have only partially curbed the total rise in expenditure which, since the onset of the crisis, has been strongly affected by numerous one-off factors and growing interest expenditure as well as pension expenses, which have been financed by an increasing transfer from the state budget in recent years. Such trends strongly reduced the possible increase in other expenditure categories and therefore undermined the development role of the public finances.
5 Temporary measures in terms of expenditure had an impact on the wage policy, the employment of civil servants, social benefits and transfers. In recent years, fiscal consolidation has also been carried out by restricting expenditure on goods and services; these effects were mostly achieved through linear approach-based measures and not on the basis of systemic expendiutre reviews. Moreover, in order to support consolidation, subsidies were reduced and largely replaced by other instruments (see Box 3) of support to the corporate sector. Most of the permanent measures were adopted in order to support an increase in revenues; moreover, activities to enhance tax collection were also introduced.6 General government balance, excluding interest expenditure.
Figure 4: General government revenue and expenditure in Slovenia
Source: SI-STAT Data Portal – National accounts – General government accounts – Main general government aggregates, April 2016.
12000
14000
16000
18000
20000
22000
2007 2008 2009 2010 2011 2012 2013 2014 2015
In E
UR
mill
ion
Total general government revenueTotal general government expenditureGeneral government expenditure excluding interest
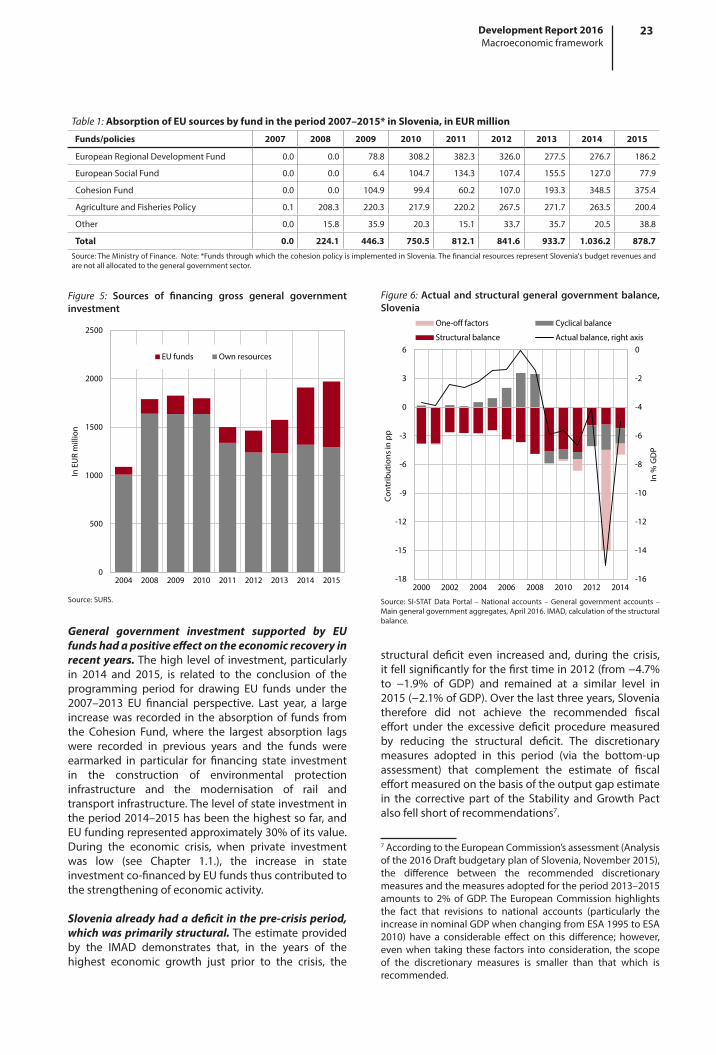
23Development Report 2016Macroeconomic framework
Table 1: Absorption of EU sources by fund in the period 2007–2015* in Slovenia, in EUR million
Funds/policies 2007 2008 2009 2010 2011 2012 2013 2014 2015
European Regional Development Fund 0.0 0.0 78.8 308.2 382.3 326.0 277.5 276.7 186.2
European Social Fund 0.0 0.0 6.4 104.7 134.3 107.4 155.5 127.0 77.9
Cohesion Fund 0.0 0.0 104.9 99.4 60.2 107.0 193.3 348.5 375.4
Agriculture and Fisheries Policy 0.1 208.3 220.3 217.9 220.2 267.5 271.7 263.5 200.4
Other 0.0 15.8 35.9 20.3 15.1 33.7 35.7 20.5 38.8
Total 0.0 224.1 446.3 750.5 812.1 841.6 933.7 1.036.2 878.7
Source: The Ministry of Finance. Note: *Funds through which the cohesion policy is implemented in Slovenia. The financial resources represent Slovenia's budget revenues and are not all allocated to the general government sector.
Figure 5: Sources of financing gross general government investment
Source: SURS.
0
500
1000
1500
2000
2500
2004 2008 2009 2010 2011 2012 2013 2014 2015
In E
UR
mill
ion
EU funds Own resources
General government investment supported by EU funds had a positive effect on the economic recovery in recent years. The high level of investment, particularly in 2014 and 2015, is related to the conclusion of the programming period for drawing EU funds under the 2007–2013 EU financial perspective. Last year, a large increase was recorded in the absorption of funds from the Cohesion Fund, where the largest absorption lags were recorded in previous years and the funds were earmarked in particular for financing state investment in the construction of environmental protection infrastructure and the modernisation of rail and transport infrastructure. The level of state investment in the period 2014–2015 has been the highest so far, and EU funding represented approximately 30% of its value. During the economic crisis, when private investment was low (see Chapter 1.1.), the increase in state investment co-financed by EU funds thus contributed to the strengthening of economic activity.
Slovenia already had a deficit in the pre-crisis period, which was primarily structural. The estimate provided by the IMAD demonstrates that, in the years of the highest economic growth just prior to the crisis, the
structural deficit even increased and, during the crisis, it fell significantly for the first time in 2012 (from −4.7% to −1.9% of GDP) and remained at a similar level in 2015 (−2.1% of GDP). Over the last three years, Slovenia therefore did not achieve the recommended fiscal effort under the excessive deficit procedure measured by reducing the structural deficit. The discretionary measures adopted in this period (via the bottom-up assessment) that complement the estimate of fiscal effort measured on the basis of the output gap estimate in the corrective part of the Stability and Growth Pact also fell short of recommendations7.
7 According to the European Commission’s assessment (Analysis of the 2016 Draft budgetary plan of Slovenia, November 2015), the difference between the recommended discretionary measures and the measures adopted for the period 2013–2015 amounts to 2% of GDP. The European Commission highlights the fact that revisions to national accounts (particularly the increase in nominal GDP when changing from ESA 1995 to ESA 2010) have a considerable effect on this difference; however, even when taking these factors into consideration, the scope of the discretionary measures is smaller than that which is recommended.
Figure 6: Actual and structural general government balance, Slovenia
Source: SI-STAT Data Portal – National accounts – General government accounts – Main general government aggregates, April 2016. IMAD, calculation of the structural balance.
-16
-14
-12
-10
-8
-6
-4
-2
0
-18
-15
-12
-9
-6
-3
0
3
6
2000 2002 2004 2006 2008 2010 2012 2014
In %
GD
P
Con
trib
utio
ns in
pp
One-off factors Cyclical balance
Structural balance Actual balance, right axis

24 Development Report 2016Macroeconomic framework
Box 3: Scope and efficiency assessment of government financial support to the non-financial corporate sector
Support to the corporate sector has only gradually decreased since 2008. With the onset of the economic crisis, the previously high amounts of government financial intervention1 in the economy continued to increase, not only owing to the recapitalisations of the banking sector but also the increased support to other companies. In the period 2009–2014, under a scheme termed “aid to remedy a serious disturbance in the economy during the crisis” (primarily for the bank recapitalisation), Slovenia allocated EUR 4.7 billion (12.9% of the average GDP in this period); the amount of this intervention was one of the largest in the EU. The already high level of financial support to the non-financial corporate sector before the crisis (2005: 2.2% GDP) began to rise further in 2006 and peaked in 2009 when, with additional measures to mitigate the consequences of the crisis, it reached 3% of GDP amid a fall in GDP. Later on, the support started to gradually decline; however, it remained at a high level in 2014 (2.5% of GDP).
Among instruments of the government’s financial support to the non-financial corporate sector (excluding recapitalisations of the banking sector), particularly tax instruments which are considered less transparent, have increased considerably. As a result of the elimination of special measures to mitigate the crisis, different classification of transactions to Slovenian Railways, and the introduction of austerity measures, general government subsidies have gradually decreased since 2010. After 2007, their decrease has been partially replaced by increased subsidies from funding of the European Structural Funds. Since 2011, subsidies have also been increasingly replaced by tax instruments. The tax instruments which have the nature of state aid, focus on tax reliefs in paying environmental taxes and reducing social contributions (see Indicator 1.11). General tax exemptions and reliefs which are not state aids and derive from tax liability arrangement from corporate income tax also provide support to the economy. In 2006, tax reliefs for R&D, for employment of disabled persons, and for carrying out practical training in professional education were introduced, while in the following years reliefs for investment and employment were also introduced. The amount of these reliefs has gradually increased, too. In the early years of the economic crisis when the corporate income tax rate decreased, the total amounts of these tax reliefs did not increase significantly; however, since 2012, the growth of tax reliefs has accelerated and they are estimated to have exceeded 0.4% of GDP in 2014. Supports through tax instruments are considered less transparent and less target-oriented; it is also difficult to control and reduce them.2
Given the insufficient target-orientation, the efficiency of government financial support in Slovenia is considerably low compared to other EU Member States. Analyses based on state aid data show that the forms of support are less efficient in Slovenia than in other countries due to insufficient orientation to development targets and poor selection of recipients and allocation of amounts of aid (fragmentation).3 As a rule, subsidies are more efficient than tax instruments, which are on the rise. In the period 2007–2013, with regard to the increased tax relief for R&D, gross domestic expenditure on research, development and innovations by business sector increased significantly in nominal terms (see Chapter 2.3), which may have a favourable influence on the entire society and may also reflect these reliefs. On the other hand, under the impact of other corporate sector issues (indebtedness, access to financial sources), the increased investment tax reliefs until 2012 failed to boost the investments. Considerable support to the corporate sector constitutes a redistribution of funds from very successful to less successful companies, which is not encouraging for the development of the economy and society in the long run and is not in accordance with Slovenia’s industrial policy and its Smart Specialisation Strategy.
1 Our assessment of government financial support included data on the following: (i) the general government subsidies; (ii) the subsidies obtained from the EU structural funds; (iii) the state aid for instruments such as: rail grants (under the general government, rail grants have no longer been shown among the subsidies since 2011), grants for corporate investments, tax reliefs from environmental taxes and reduction in social contributions, favourable loans and guarantees; and (iv) the general tax reliefs from corporate income tax for R&D, investments, employment, employment of disabled persons and provision of practical training in professional education.2 Klemm, 2009, Niche, Heidhues, 2006, Hyman, 1993, Aronson, 1985.3 Rojec et al., 2008; Rojec et al., 2010; Burger et al., 2012; and Murn, 2015, Ministry of Finance, 2016.
Figure: Assessment of government financial support, Slovenia, current prices
Source: The Ministry of Finance, SURS, calculations by IMAD.
0
200
400
600
800
1000
1200
2005
2006
2007
2008
2009
2010
2011
2012
2013
2014
In E
UR
mill
ion
Tax sources GuaranteesFavourable loans Capital investmentsCorporate investments Subsidies for railsSubsidies from abroad (EU funds) General government subsidies

25Development Report 2016Macroeconomic framework
The main challenge for the years ahead remains the need to replace the intervention measures with more permanent measures supporting further fiscal effort. The documents adopted8 in 2015, which define the fiscal policy, indicate a gradual release of temporary measures in terms of expenditure, which have helped reduce the deficit in recent years. Therefore, the main challenge for the coming years remains their replacement with more permanent measures. Otherwise, the fiscal effort will be insufficient to reach structural balance by 2020 and achieve fiscal stability. Fiscal policy aimed at more permanent structural adjustments should focus on several areas and systemic measures to curb the growth of expenditures and support the growth of revenues. This refers primarily to the following: (i) the renewal of social protection systems and their adjustment to demographic changes; (ii) the systemic rationalisation in individual areas of general government expenditure based on the detailed review of expenditure; (iii) the management of state assets to guarantee their higher profitability, thereby reducing the risks which caused a huge increase in public debt during the last crisis; (iv) the active management of debt with a view to reducing the debt and interest incurred, including through revenues from the privatisation; and (v) the improvement of the tax revenue structure. The latter has slightly improved in terms of competitiveness since 2008 by reducing taxes on corporate earnings and increasing taxes on consumption.9
8 Stability Programme 2015, 2016 and 2017 state budgets, Draft budgetary plan 20169 Studies show that taxes on property and consumption have a smaller negative impact on economic growth than taxes on corporate profits and taxes on income from labour (IMF, 2015, p. 28).
Restructuring tax burdens by reducing tax on labour and replacing a part of this loss by increasingly taxing wealth could bring about additional improvements.10 Additional tax savings could also result from curbing or reducing state financial support to the corporate sector, which has recently increased through tax instruments (see Box 3 and Indicator 1.11).
10 Austria, for example, plans to finance its reduced tax burden on labour with the income from improvements in collecting existing duties (since the introduction of cash registers).
Figure 7: Structure of general government revenue and expenditure in Slovenia
-600
-400
-200 0
200
400
600
800
1,00
0
1,20
0
1,40
0
Marketable pro., own final…
Other current transfers
Capital transfers…
Property income
OTHER…
SOCIAL SECURITY…
Tax on capital
Current tax on income,…
Taxes on production…
TAX REVENUE
TOTAL GENERAL…
In EUR million
2015-2008 Change 2015-2014 Change
-80
0
-40
0 0
40
0
80
0
1,2
00
1,6
00
GROSS FIXED CAPITAL FORMATION
CAPITAL TRANSFERS
Other current expendit. and transfers
Social benefits and transfers
Subsidies
Interest
Employee compensation
Intermediate consumption
CURRENT EXPENDITURE AND TRANSFERS
TOTAL GENERALGOVERNM. EXPENDITURE
In EUR million
2015-2008 Change 2015-2014 Change
Source: SI-STAT Data Portal – National accounts – General government accounts – Main general government aggregates, March 2016.
Figure 8: General government debt, Slovenia
Source: SI-STAT Data Portal – National accounts – General government accounts – Main general government aggregates, April 2016.
0
10
20
30
40
50
60
70
80
90
0
5,000
10,000
15,000
20,000
25,000
30,000
35,000
40,000
1995
1997
1999
2001
2003
2005
2007
2009
2011
2013
2015
In %
GD
P
In E
UR
mill
ion
In EUR million
In % GDP
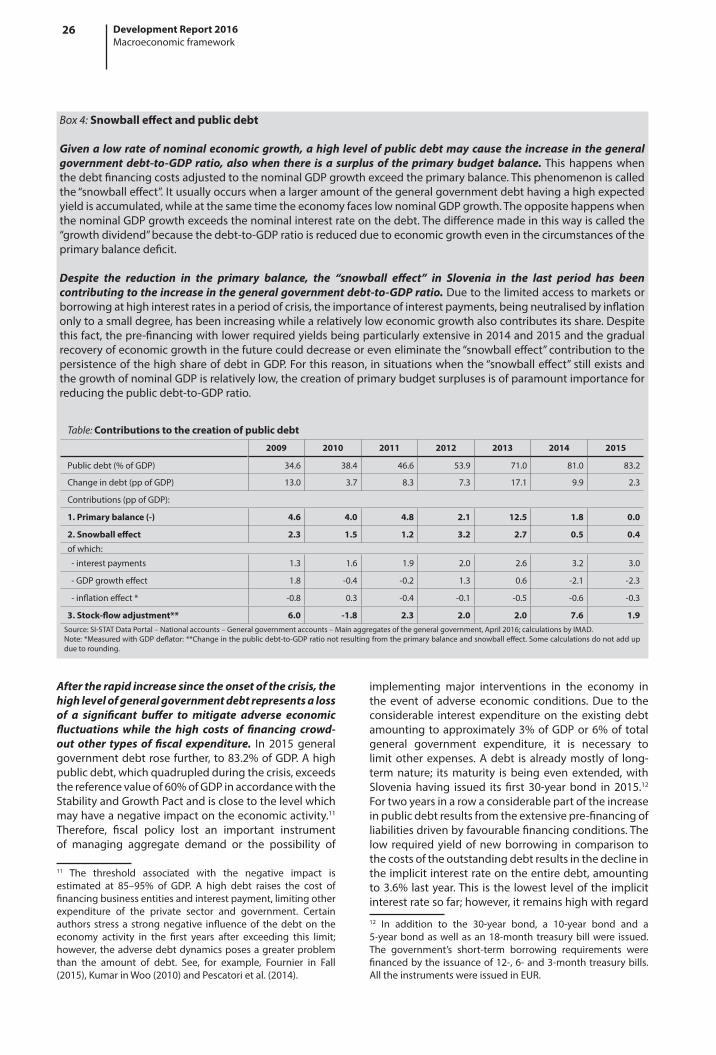
26 Development Report 2016Macroeconomic framework
After the rapid increase since the onset of the crisis, the high level of general government debt represents a loss of a significant buffer to mitigate adverse economic fluctuations while the high costs of financing crowd-out other types of fiscal expenditure. In 2015 general government debt rose further, to 83.2% of GDP. A high public debt, which quadrupled during the crisis, exceeds the reference value of 60% of GDP in accordance with the Stability and Growth Pact and is close to the level which may have a negative impact on the economic activity.11 Therefore, fiscal policy lost an important instrument of managing aggregate demand or the possibility of
11 The threshold associated with the negative impact is estimated at 85–95% of GDP. A high debt raises the cost of financing business entities and interest payment, limiting other expenditure of the private sector and government. Certain authors stress a strong negative influence of the debt on the economy activity in the first years after exceeding this limit; however, the adverse debt dynamics poses a greater problem than the amount of debt. See, for example, Fournier in Fall (2015), Kumar in Woo (2010) and Pescatori et al. (2014).
Box 4: Snowball effect and public debt
Given a low rate of nominal economic growth, a high level of public debt may cause the increase in the general government debt-to-GDP ratio, also when there is a surplus of the primary budget balance. This happens when the debt financing costs adjusted to the nominal GDP growth exceed the primary balance. This phenomenon is called the “snowball effect”. It usually occurs when a larger amount of the general government debt having a high expected yield is accumulated, while at the same time the economy faces low nominal GDP growth. The opposite happens when the nominal GDP growth exceeds the nominal interest rate on the debt. The difference made in this way is called the “growth dividend” because the debt-to-GDP ratio is reduced due to economic growth even in the circumstances of the primary balance deficit.
Despite the reduction in the primary balance, the “snowball effect” in Slovenia in the last period has been contributing to the increase in the general government debt-to-GDP ratio. Due to the limited access to markets or borrowing at high interest rates in a period of crisis, the importance of interest payments, being neutralised by inflation only to a small degree, has been increasing while a relatively low economic growth also contributes its share. Despite this fact, the pre-financing with lower required yields being particularly extensive in 2014 and 2015 and the gradual recovery of economic growth in the future could decrease or even eliminate the “snowball effect” contribution to the persistence of the high share of debt in GDP. For this reason, in situations when the “snowball effect” still exists and the growth of nominal GDP is relatively low, the creation of primary budget surpluses is of paramount importance for reducing the public debt-to-GDP ratio.
Table: Contributions to the creation of public debt
2009 2010 2011 2012 2013 2014 2015
Public debt (% of GDP) 34.6 38.4 46.6 53.9 71.0 81.0 83.2
Change in debt (pp of GDP) 13.0 3.7 8.3 7.3 17.1 9.9 2.3
Contributions (pp of GDP):
1. Primary balance (-) 4.6 4.0 4.8 2.1 12.5 1.8 0.0
2. Snowball effect 2.3 1.5 1.2 3.2 2.7 0.5 0.4of which:
- interest payments 1.3 1.6 1.9 2.0 2.6 3.2 3.0
- GDP growth effect 1.8 -0.4 -0.2 1.3 0.6 -2.1 -2.3
- inflation effect * -0.8 0.3 -0.4 -0.1 -0.5 -0.6 -0.3
3. Stock-flow adjustment** 6.0 -1.8 2.3 2.0 2.0 7.6 1.9Source: SI-STAT Data Portal – National accounts – General government accounts – Main aggregates of the general government, April 2016; calculations by IMAD.Note: *Measured with GDP deflator: **Change in the public debt-to-GDP ratio not resulting from the primary balance and snowball effect. Some calculations do not add up due to rounding.
implementing major interventions in the economy in the event of adverse economic conditions. Due to the considerable interest expenditure on the existing debt amounting to approximately 3% of GDP or 6% of total general government expenditure, it is necessary to limit other expenses. A debt is already mostly of long-term nature; its maturity is being even extended, with Slovenia having issued its first 30-year bond in 2015.12 For two years in a row a considerable part of the increase in public debt results from the extensive pre-financing of liabilities driven by favourable financing conditions. The low required yield of new borrowing in comparison to the costs of the outstanding debt results in the decline in the implicit interest rate on the entire debt, amounting to 3.6% last year. This is the lowest level of the implicit interest rate so far; however, it remains high with regard
12 In addition to the 30-year bond, a 10-year bond and a 5-year bond as well as an 18-month treasury bill were issued. The government’s short-term borrowing requirements were financed by the issuance of 12-, 6- and 3-month treasury bills. All the instruments were issued in EUR.

27Development Report 2016Macroeconomic framework
to the current and the expected nominal GDP growth (see Box 4).
Slovenia has been gradually complementing the institutional framework which could contribute to the achievement of fiscal objectives. Constitutional amendments in 2013 were followed by the adoption of the Fiscal Rule Act in 2015. It defined in detail the implementation of the constitutional provisions relating to the medium-term balance of state budgets (fiscal rule), provided a legal basis for establishing the Fiscal Council and a mechanism for handling the deviations from the medium-term balance and determined exceptional circumstances in which such a deviation may be possible. In addition to the Fiscal Council, which has not yet been established, additional changes in the institutional framework to modify the preparation of medium-term planning and establish mechanisms for effective determination of priorities regarding public expenditure and adjust the procedure of adopting or amending the state budget would contribute to attaining the medium-term fiscal objectives.
1.3 Financial system and corporate sector indebtedness
An effective financial system is vital in order to ensure a stable climate for financing the economy and providing support for development and investment decisions. The situation in the credit markets and in the banking system seriously deteriorated at the outbreak of the crisis whereas in highly indebted companies, the ability of companies to repay debts deteriorated. Although the indicators of business performance and capital adequacy of banks significantly improved after the recovery of banks at the end of 2013 and the high corporate debt level is on the decline, the lending activity continues to decrease. Given the high degree of dependence of businesses on bank financing due to the poorly developed other areas of the financial sector, this renders access to sources of corporate financing extremely difficult, in particular for SMEs. After the decrease at the beginning of banking system stabilisation, the level of non-performing claims still remains high and represents further risks to the financial stability of banks. The deterioration of the situation in the financial sector and corporate over-indebtedness in recent years have also revealed the inadequacies of the institutional framework; therefore, measures to support corporate deleveraging and restructuring were adopted in the last three years. Further measures, especially to deepen financial markets and to provide access to loans and other financing resources for all business entities will be necessary.
1.3.1 The situation of the financial sector and deleveraging of the corporate sector
The situation in the banking system has stabilised considerably after the rehabilitation of banks, but the further contraction in bank activity has started to show in a gradual decline in bank revenues. Since the onset of the financial crisis, the capital adequacy ratio of the banking system has gradually decreased and in the third quarter of 2013 (prior to the banking sector stabilisation) reached the lowest level (9.5%) among all EU Member States, for which data were available.13 As a result of bank recapitalisations in the amount of EUR 3.6 billion by December 2014, it improved significantly and in the third quarter of 2015, it amounted to 17.4% being among the highest in the EU. In 2015 the banks made a profit of EUR 195 million, which is the highest profit since the start of the financial crisis. Such a result was largely due to creating a smaller extent of additional provisions and impairments as the scope of operations of banks continues to decrease. Net financial revenues were more than a tenth lower. This was largely due to the reduction of net interest income as the consequence of a more rapid decrease in interest income owing to lower active interest rates, a gradual maturing of securities with high interest rates and weak lending activity.
The structure of sources of banking system financing has changed significantly in recent years, foreign liabilities and ECB funds decreased whereas the share of deposits increased. The share of foreign liabilities, which amounted to more than 35% of the total assets
13 Data for Bulgaria, France, Italy, Luxembourg, Spain and the United Kingdom is not available; therefore we used data for the second quarter of 2013 in order to compare the data between the countries.
Figure 9: Capital adequacy (TIER 1) of the banking systems
Source: IMF, ECB (data for Finland and France). Note: *Data for Bulgaria, Finland, France and Ireland refer to the last quarter of 2014.
0
3
6
9
12
15
18
21
24
27
30
Esto
nia
Lith
uan
iaC
roat
iaSw
eden
Irel
and
Bu
lgar
iaLu
xem
bo
urg
Latv
iaSl
ove
nia
Fin
lan
dD
enm
ark
Cze
ch R
.Sl
ova
kia
Bel
giu
mRo
man
iaG
erm
any
Cyp
rus
Net
her
lan
ds
Hu
ng
ary
Pola
nd
U. K
ing
do
mFr
ance
Au
stri
aSp
ain
Ital
yPo
rtu
gal
Mal
taG
reec
e
In %
Q2 2015 Q3 2013

28 Development Report 2016Macroeconomic framework
of the banking system in 2008, decreased to 13.3% (EUR 5.5 billion) by the end of 2015. The banks made a net repayment of EUR 13.6 billion in foreign liabilities between September 2008, when the international financial crisis worsened, and the end of 2015. As late as in the second half of 2015, the deleveraging started to decrease noticeably. The assets of the central bank, which have been a significant source of financing since December 2011 when the first long-term refinancing operation was carried out, decreased. The share of liabilities to the ECB thus fell from EUR 3.7 billion to less than EUR 1 billion. Deposits by the non-banking sectors (mainly domestic) continue to increase, but at a slower pace than in previous years. As a result of the decline in other sources compared to 2008, their share in the structure of sources increased by approximately 20 pp and amounted to 63.2%. The decrease in inflows of non-banking sectors in the last year is due to the contributions made by the government and households. Inflows of government deposits which had, prior to the bank rehabilitation, increased with a view to maintaining the liquidity of the banking system, declined substantially in 2015 and are earmarked for meeting own liquidity needs. Inflows of household deposits also decreased last year, which is estimated to have been the result of: (i) high inflows from 2014, after confidence in the banking system was restored and savers returned part of deposits that had been withdrawn in 2013; and (ii) low passive interest rates due to which, according to our estimates, part of the savings were also transferred to the capital market.14 Corporate deposits have increased at a steady pace (between EUR 400 and 600 million per year) in the last three years. Despite a slowdown in growth since 2014, their volume has exceeded the volume of loans, but with impaired maturity, as, due to low rates of interest on deposits, the overnight deposits are predominating.
After the strong growth of loans prior to the escalation of the crisis, the provision of loans to the domestic economy is on the sharp decline, remaining at the low level, while the volume of loans to households and the government is on the rise. In the pre-crisis period, the volume of loans to non-banking sectors was rapidly rising, only in the period from 2006 to 2008, their volume almost doubled. During the economic crisis, the conditions on the credit markets deteriorated at an accelerated pace. In mid-2010 the volume of loans to corporates and NFIs started to decline and had more than halved by the end of 201515. The total volume of all loans to domestic non-banking sectors decreased by more than one third in this period. The volume of loans to domestic non-
14 In 2015 only the inflows in Slovenian mutual funds exceeded EUR 140 million, reaching the highest level since 2007. Low passive interest rates have a strong impact on the maturity structure of deposits of non-banking sectors, as only the volume of overnight deposits has been increasing whereas the volume of deposits with agreed maturity has been decreasing rapidly.15 It is estimated that approximately two-fifths of a decrease in the volume of loans to corporates and NFIs is due to the transfers to the BAMC.
banking sectors, which has been on the decline since 2011, decreased by EUR 1.1 million (approximately 30% less than in 2014) in 2015.16 This was primarily due to the deleveraging of companies and NFIs throughout the period.17 In 2015 the total volume of lending to households rose slightly, while housing loans have been on the increase since the second quarter of 2014. This is partly a consequence of the improvement in the overall
16 The impact on the transfer of claims to the BAMC was eliminated in September, October and December 2014 in a total amount of EUR 1.7 billion. 17 The volume of loans for commercial real estate and business activity was on the decrease. In the last months in 2015, the volume of loans for other purposes started to increase.
Figure 10: Change in the volume of loans to households, corporates and NFIs and the government, Slovenia
Source: Bank of Slovenia, calculations by IMAD.
-3,000
-2,000
-1,000
0
1,000
2,000
3,000
4,000
5,000
6,000
7,000
8,000
2007 2008 2009 2010 2011 2012 2013 2014 2015
In E
UR
mill
ion
Government Corporates and NFIs* Households
Figure 11: Volume of newly granted loans to non-banking sectors in Slovenia
Source: Bank of Slovenia.
0
5,000
10,000
15,000
20,000
25,000
2011 2012 2013 2014 2015
In E
UR
mill
ion
Government NFI Households Non-financial companies

29Development Report 2016Macroeconomic framework
economic conditions, the growth in household incomes and the gradual improvement to the real estate market situation, whereas the nominal increase in loan volumes is partly attributed to the depreciation of the Swiss franc at the beginning of 2015. Positive trends associated with loans to households are also shown by the data on new lending where the volume of housing loans amounted to approximately EUR 900 million, representing 40% more than in the previous year. A slightly less distinct increase is recorded in the volume of lending to households in a form of consumer credit. However, the volume of loans to corporates and NFIs continues to decrease. In 2015 it amounted to EUR 7.3 million, which is almost 20% less than in 2014 and 60% less than in 2011, when it had peaked.18
Lending activity remains low due to supply and demand factors. Supply is limited in particular due to the extreme cautiousness of banks which, given the relative slow decrease in the share of non-performing claims, are still not willing to assume additional risks. This is also a limiting factor for those companies that are creditworthy and do have business opportunities but cannot fully exploit them because of the limited availability of financial resources. On the other hand, banks are very cautious in lending activity because they assess that the credit worthiness of companies is still relatively weak despite the recent positive trends. A survey on the lending activity of banks shows that the corporate demand for loans increased more significantly in micro, small and medium-sized enterprises (SME). The increase in the demand for loans in large enterprises was relatively small which may indicate that those companies which are sufficiently large and financially stable to take advantage of favourable borrowing conditions abroad or have access to other sources of financing are withdrawing gradually from the Slovenian banking
18 The data has been available since 2011.
system. The differences between domestic and foreign interest rates19 continue to gradually decrease but are relatively high, amounting to more than 120 basis points in January 2016. The net borrowing in a form of short-term loans abroad was increasing, while companies and NFIs were still making net repayments of their long-term loans.
After completing the transfers to the BAMC20 the decline in the level of non-performing claims continued, more significantly towards the end of 2015. A significant risk for financial stability is still a relatively high level of non-performing claims. Prior to the rehabilitation of banks, the level of non-performing claims amounted to EUR 7.8 billion, then with transfers made to the BAMC, it decreased to EUR 4.4 billion by the end of 2014. In 2015 the decrease in the level of non-performing claims continued although no new transfers were made. In January 2016 this figure amounted to EUR 3.4 million, reaching 9.7% of the total banking system exposure. The sharpest decrease was recorded in the level of non-performing claims against foreign entities and domestic non-financial companies. In the case of the latter, it is estimated that this is also due to the successful restructuring of companies under the Master Restructuring Agreements (MRA). These agreements have so far mainly involved only large companies whereas the major part of the SMEs was not yet included. In mid-2015 non-performing claims against SME amounted to approximately EUR 1.8 billion or more than 40% of all bank system non-performing claims.21 The speed at which non-performing claims (expressed in relative terms) were reduced also reflected the further contraction in bank lending activity. Given the deteriorated loan portfolio (the outflow of high-grade customers) and the decline in interest income, such trends represent an additional risk for the stability of banks.
The significance of other segments of the financial system in financing Slovenia’s economic activity has remained rather modest. Financial resources of monetary financial institutions represent approximately a 75% share of the entire financial system, which is much higher than in the EU22 where this share is approximately 50%. The share has been gradually growing due to the shrinking of the banking sector and to a lesser extent, due to the growth of financial assets of other financial institutions which increase at a slower pace. Despite some positive trends in 201523, financing through the
19 Interest rates on loans over EUR 1 million with a variable interest rate and a fixed interest rate up to one year.20 By the end of 2014, EUR 5 billion of banking system claims had been transferred to the BAMC. 21 Information on the implementation of the measures for systemic deleveraging of micro and small enterprises, 201522 Data not available for the Czech Republic.23 The volume of transactions in debt securities in the first three quarters of 2015 was above the average in comparison to the period since 2010.
Figure 12: The corporate demand for loans by size of enterprises, Slovenia and the EMU
Source: ECB; calculations by IMAD.
-2.5
-2.0
-1.5
-1.0
-0.5
0.0
0.5
1.0
1.5
2.0
2.5
Q1
07
Q1
08
Q1
09
Q1
10
Q1
11
Q1
12
Q1
13
Q1
14
Q1
15
Q1
16
Stan
dard
ised
val
ue
Slovenia large companies EMU large companiesSMEs, Slovenia SMEs, EMU

30 Development Report 2016Macroeconomic framework
capital market remains relative low and inaccessible for SMEs facing relative big problems in providing sources of financing. The non-banking system could gradually be strengthened and provide additional supply of long-term sources of financing to the economy by eliminating barriers to provide greater access to capital markets (see Chapter 1.3.3.) and promoting savings for old age in the form of life and pension insurance.
The structure of sources of financing non-financial companies is unfavourable also due to the insufficiently developed other segments of the financial market. Insufficient importance is given to equity and debt securities. The ratio between debt and equity of non-financial companies is still significantly above the EU average, indicating a low capitalisation of Slovenian companies. In the period 2010–2014, the volume of transactions related to the increase in equity, on average, amounted to 0.5% of GDP while in the EU, it amounted to 2% of GDP. The same applies to financing with debt securities. The share of financial liabilities of non-financial companies in the form of equity and debt securities in Slovenia has achieved slightly more than 45% and is approximately 10 pps below the EU average.
1.3.2 Indebtedness of the corporate sector
The indebtedness and over-indebtedness24 of the corporate sector,25 which has decreased only in recent years, are largely due to the previous inadequate policies which were based on the development with the help of domestic capital, particularly domestic
24 Over-indebtedness is calculated as the sum of all financial debts, exceeding EBITDA by a factor of five (if FV≥5) or as the overall financial debt (if EBITDA <0).25 Source: AJPES. For a more detailed analysis of corporate sector indebtedness, see Lušina, U., Kušar, J., 2015.
bank loans which were not properly allocated and were insufficient. Corporate indebtedness increased significantly in the period before the crisis. Foreign debt financing started to grow after Slovenia’s accession to the EU and under favourable economic conditions. Additionally, in that period, the concept of national interests allowed for the management buyouts of Slovenian companies which, with the help of domestic banks, took place particularly through financial holding companies. As a result, bank financing was not always allocated in an appropriate manner, since it was insufficiently directed at increasing productive investments. The reliance of the Slovenian economy on debt financing caused a sudden increase in over-indebtedness in circumstances of declining economic activity at the outbreak of the economic crisis and limited access to bank financing. This has considerably contributed to the continuation of adverse economic conditions as companies have mainly dealt with financial problems rather than with their main activities.
According to the majority of indicators, the indebtedness and over-indebtedness of companies in Slovenia reached its peak in 2009; since then, they have been on the wane, especially in 2013 and 2014. The reduction in total debt26 is mostly due to the decrease in bank debt, especially in 2014. In the first years, it decreased mainly as a result of the winding down of companies,27 and since 2012, it has also been due to the companies that continued to operate and actually repaid the debt. It is encouraging to note that among the less and least28 indebted conventional companies, the number of export-oriented companies has been growing.29 Over-indebted companies are mainly oriented toward the domestic market;30 micro, small and medium-sized enterprises predominate. About half of them are the so-called “problem companies”; these are companies which in addition to the financial debt, have negative EBITDA31 and represent a significant burden in bank balance sheets.32
26 Overall debt comprises financial (within the bank), operational and other liabilities of companies.27 The term “wound down” is used for all companies that did not submit their final accounts. 28 Export-oriented companies are those companies whose sale revenues on foreign markets exceed the sales revenues on the domestic market. They are divided into: (1) primarily and (2) moderately export-oriented companies Primarily export-oriented companies have a share of the revenue from sales on the domestic market in total turnover of less than 30%, while moderately export-oriented companies have a share of the revenue from sales in total turnover between 30 and 50%29 Financial leverage, less than 1.30 Domestic market-oriented companies are those companies whose sales revenues on the domestic market exceed the share of sales revenues on foreign markets.31 EBITDA (Earnings Before Interest, Taxes, Depreciation and Amortisation) – positive cash-flow from operation (earnings before interest, taxes, depreciation and amortisation). 32 The data does not allow for a separation between the debt of domestic and foreign banks.
Figure 13: The ratio between the debt and equity of non-financial companies
Source: Bank of Slovenia, Eurostat; calculations by IMAD.
0.0
0.2
0.4
0.6
0.8
1.0
1.2
1.4
1.6
2004 2005 2006 2007 2008 2009 2010 2011 2012 2013 2014 Q32015
EU Slovenia

31Development Report 2016Macroeconomic framework
The process of deleveraging was carried out in all groups of companies. Conventional companies,33 which constitute the largest group, reached, on average, the 2007 level of (over)-indebtedness in 2014. In 2014 these companies generated two-thirds of the total financial debt (EUR 20.2 billion) and half of the total over-indebtedness (EUR 8.8 billion).34 Less indebted companies among conventional companies were deleveraging, on average, until 2013; however, in 2014, their debt increased again while over-indebted conventional companies were reducing their debt during the whole period 2010–2014. Unconventional companies35 reached the 2006 level of (over)-indebtedness in 2014. Although they are of less significance for the entire economic activity (they generated only 3.6% of total value added and employed less than 1% of all employees), they generated a half of the total over-indebtedness (EUR 8.6 billion) and a good third of the total financial debt (EUR 10.8 billion) in 2014. Among these companies, there is a significant proportion of problem companies which generated 18% of total financial debt in the corporate sector in 2014.
33 All companies which, according to the Standard Classification of Activities, do not fall within the activities of holding companies and financial leasing, have no employees and are other than DARS. There were 40,776 such companies in 2014. 34 Of these, there is the amount of EUR 3.9 billion of such debt that cannot be currently financed by companies (an interest coverage ratio below 1 (IC<1)). The financial debt of conventional companies with negative EBITDA amounted to EUR 2.8 billion in 2014.35 Companies which, according to the Standard Classification of Activities, do not fall within the activities of holding companies and financial leasing, have no employees and DARS. There were 22,814 such companies in 2014.
Figure 16: Indicators of the ability of corporate sector unconventional companies to repay their debts, Slovenia
Source: AJPES, calculations by IMAD. Note: Financial debt/EBIDTA ratio – financial leverage specifying how long a company will have to repay the financial debt with generated cash flow, Interest coverage ratio – EBITDA/Interest Expense ratio.
53.5 56.748.5
71.4
37.730.4
39.047.8
219.5
1.6 1.6
1.2 1.2
2.1
2.5
2.01.9
0.4
0.0
0.5
1.0
1.5
2.0
2.5
3.0
0
50
100
150
200
250
300
2006 2007 2008 2009 2010 2011 2012 2013 2014
In %
Total debt/total liabilities ratio (in %)Financial debt/EBITDA ratio, left axisInterest coverage, right axis
Concentration of the debt of over-indebted conventional companies is rather high; in over-indebted conventionally companies it is even higher. Over-indebted conventional companies which mainly focus on the domestic market, accounted for approximately two-thirds of the financial debt of over-indebted companies in 2014. Ten of the most indebted conventional companies had about 30% while 50 of the most indebted companies had almost 50% of the financial debt of over-indebted conventional companies. Given the size groups of companies, the concentration
Figure 14: Change in bank debt of the entire corporate sector, Slovenia
Source: AJPES, calculations by IMAD.Note: New companies – the increase in debt at the end of two consecutive years, due to new companies (i.e. companies that have been newly established in the last consecutive year); failed companies – the reduction of debt at the end of two consecutive years, as a result of the winding down of companies; surviving companies – change in the debt of the companies which operated in both consecutive years, All companies – joint change in the debt at the end of two consecutive years (new companies + failed companies + surviving companies).
-4.0
-3.5
-3.0
-2.5
-2.0
-1.5
-1.0
-0.5
0.0
0.5
1.0
2009 2010 2011 2012 2013 2014
In b
illio
n EU
R
Failed companies Surviving companiesNew companies All companies
Figure 15: Indicators of the ability of corporate sector conventional companies to repay their debts, Slovenia
Source: AJPES, calculations by IMAD.Note: Financial debt/EBITDA ratio - financial leverage specifying how long a company will have to repay the financial debt with generated cash flow, Interest coverage ratio - EBITDA/Interest Expense ratio.
11.7
10.7
8.3 8.0 7.98.4 8.6
10.4
13.0
3.13.4
4.1
5.2 5.2 5.0 4.84.4
3.6
0
2
4
6
8
10
12
14
48
50
52
54
56
58
60
62
64
2006 2007 2008 2009 2010 2011 2012 2013 2014
In %
Total debt/total liabilities ratio (in %)Interest coverage, right axisFinancial debt/EBITDA ratio, right axis

32 Development Report 2016Macroeconomic framework
legal bases and different other measures were provided in recent years.
• Legal bases: (i) Act Governing the Rescue and Restructuring Aid for Companies in Difficulty according to which state aid is granted to companies in difficulty by the Ministry of Economic Development and Technology; (ii) Act on Financial Operations, Insolvency Proceedings and Compulsory Winding-up regulating: (a) financial operations of legal persons, (b) insolvency proceedings against the legal and natural persons and (c) the proceedings of compulsory winding-up of legal persons; and (iii) Measures of the Republic of Slovenia to Strengthen the Stability of Banks Act that was completed by providing more clearly a legal basis for the operation of the BAMC which is important to define the role of the BAMC in restructuring companies.
• The Slovenian principles of financing debt restructuring in the economy prepared by the Bank Association of Slovenia define the approach which the banks should voluntarily observe during the financial restructuring of companies with a large number of creditors. The basic assumption is to maintain economic activity wherever there is a reasonable chance of survival in the market. The Bank of Slovenia assessed on the basis of the agreements of financial restructuring37 and other reports that 71 companies, in particular large companies, were restructured on this restructuring basis in the period 2013–2015. The Bank of Slovenia adopted several measures to reduce the non-performing exposure and to improve the efficiency of restructuring process; some of them have already started to implement them.
• Due to the unmet corporate demand for financing and with a view to promoting development investments and the development of SMEs in cooperation with the Ministry for Economic Development and Technology, Slovenian Development Bank (SID) began to carry out measures of financial engineering, namely in the form of the loan funds: (1) financial engineering to promote technological development projects 2011–2013, (2) financial engineering to promote the development of small and medium-sized enterprises and (3) financial engineering to promote investments, operation and capital strengthening of micro, small and medium-sized enterprises. The deadline for placing funds to final beneficiaries from the first two measures, originally foreseen by the end of 2015, was extended by the beginning of implementation of financial instruments from the European Cohesion Policy funds under the current financial perspective, but no longer than by the end of 2016. The third measure which is intended only for undercapitalised companies, is to be implemented by 2018, its objective being in particular the capital strengthening of SMEs capable of accessing the sources of financing with commercial banks at the end of the on-going financial assistance.
37 Ang. Master Restructuring Agreement.
of the debt was the highest in large companies where by activities36 two-thirds of over-indebtedness were concentrated in wholesale and retail trade and in the sale of motor vehicles, manufacturing, professional, scientific and technical activities as well as in energy supply in 2014. Over-indebted unconventional companies which also mainly focus on the domestic market, accounted for approximately 99% of the total financial debt of unconventional companies in 2014. Ten of the most indebted unconventional companies had about 50% of the financial debt of over-indebted unconventional companies. By activities, a good two-thirds of the over-indebtedness were concentrated in holding and leasing companies (approximately 43%), real estate activities (18%) and transport (15%) in 2014.
The ability of companies to repay debt has improved in conventional companies in recent years, while the ability in unconventional companies has deteriorated, more significantly in 2014. The ability to repay debt significantly improved in conventional companies in 2014. This applies particularly to less indebted companies where all indicators are already at the pre-crisis level while some (the interest coverage ratio, the total debt-to-liabilities ratio) achieved the most favourable values in the entire period of observation (since 2006). In addition to deleveraging, EBIDTA of companies which, in less indebted conventional companies, increased on average in the five years to 2014, had a considerable impact on the trends of some indicators of the ability to repay debt. On the other hand, in over-indebted conventional companies, EBIDTA had decreased for six consecutive years. By 2014 this had had a negative influence on relative indicators of indebtedness (companies deleveraged to a lesser extent than a decrease in EBIDTA); however, in 2014, the ability of these companies to repay debt improved according to all indicators. In unconventional companies, most indicators of the ability to repay debt deteriorated, significantly in 2014 when all indicators deteriorated, most considerably those related to EBIDTA which decreased considerably (by 80%; in two companies, there was a noticeable decrease).
1.3.3 Strengthening of the institutional framework for the operation of the financial system and corporate restructuring
In recent years, several measures for a system-wide deleveraging of companies have been adopted; in 2015 the upgrade of this institutional framework continued and greater attention has been devoted to implementing measures for a system-wide deleveraging of SMEs. Among the measures to support the corporate deleveraging and restructuring, several
36 Financial and insurance activities (K) are not exposed (included in the group “Other”); the data acquisition in the database of AJPES is modest (banks and insurance companies are not included, while the activities of holding and financial leasing companies were classified into unconventional companies).

33Development Report 2016Macroeconomic framework
against potential losses in the case of increased risk arising from excessive credit growth. As a key indicator for determining the value of the buffer, the deviation of the relationship between the loans to the private sector and GDP from the long-term trends is taken into consideration; besides, five additional indicators are determined.43 The value of the buffer varies between 0 and 2.5% of the total exposure (exceptionally also higher). The current value of the buffer for exposures in the Republic of Slovenia is 0%. The capital buffer for other system-relevant banks is intended to increase the ability to cover losses and thus to reduce the likelihood of the occurrence of stressful events and their consequences. The criteria for determining the importance of the bank system are set out in the guidelines of the European Banking Authority and consist of four sets: (i) the size of the bank (total assets); (ii) significance (the value of domestic payment transactions, the deposits of the private sector, loans to the private sector); (iii) complexity (the value of derivative financial instruments traded on the markets, liabilities and claims under the jurisdiction of another country); and (iv) interconnection (liabilities and assets available within the financial system, outstanding debt securities). The value of the capital buffer varies between 0 and 2%, depending on the result achieved by an individual bank in the procedure of determining the importance of the banks within the system.
1.4 Challenges
After a significant deterioration in the first crisis years, improvement has been recorded with regard to some macro-economic indicators, but many imbalances remain. In recent years, in relation to the gradual revival of economic activity and the economic policy measures implemented, positive steps have been made regarding fiscal consolidation and the rehabilitation of the banking system, while the creation of more sustainable solutions will be required for the development of the financial system as a whole and in order to ensure fiscal sustainability. Imbalances associated with the lack of sources of financing for companies become increasingly prominent while in the area of public finance, the pressures related to a high level of general government debt and in the medium and long terms, the urgent need to create a solution to reduce the pressures on the sustainability of social protection systems are being placed in the foreground.
A stable macroeconomic environment is vital for a rapid strengthening of competitiveness, sustained economic growth and creation of new jobs. Besides strengthening of the capital contribution that will
43 These are: (i) the annual real estate price growth; (ii) the annual growth rate of loans to the domestic private non-financial sector; (iii) the relationship between the private non-banking sector credits and loans; (iv) return on capital; and (v) the relationship between loans and the gross operating surplus.
• The Slovenian Enterprise Fund with its own instruments provides favourable financial resources for SMEs; these are primarily the measures of debt financing of companies - guarantees and micro loans for companies.
A major step in providing greater support to SMEs at the EU level will be the establishment of a capital union. In September 2015 an action plan for the establishment of capital union at the EU level was presented38; an important part of the document is also intended for financing SMEs which by establishing the capital union should have access to financing resources comparable to large enterprises. SMEs are now the most dependent on bank financing39; therefore, banking system problems make access to new financial resources more difficult. In order to have better access to capital markets, the action plan provides for the adoption of measures such as: (i) the modernisation of regulations which would reduce the cost of financing via capital markets and eliminate regulatory barriers for the inclusion of small enterprises in capital markets; (ii) a package of measures for financing via venture capital funds and equity financing including the EU resources and establishing good practices related to taxation; (iii) the promotion of innovative methods of financing (crowd-funding); and (iv) the examination of the possibility for establishing a pan-European approach to better connect SMEs and providers of different financial resources.
In 2015, under macro-prudential supervision,40 two additional measures to provide financial stability were adopted in Slovenia: the counter-cyclical capital buffer41 and the capital buffer for other system-relevant banks.42 In the event of a perceived increased risk, capital requirements will increase for the entire banking sector and individual banks. The purpose of the counter-cyclical capital buffer is to protect the banking system
38 For more details, see the Action Plan on Building Capital Markets Union.39 See, for example, the Survey on the Access to Finance of Enterprises in the Euro Area – April to September 2015.40 On the recommendation of the European Systemic Risk Board on the macro-prudential mandate of national authorities ESRB/2011/3 regarding the establishment of an effective system of macro-prudential supervision of the financial system, the Macro-prudential Supervision of the Financial System Act was adopted at the end of 2013, establishing the Financial Stability Board and defining the method of implementation and operation of supervisory bodies in the field of macro-prudential supervision. The main objective of macro-prudential supervision is to prevent and reduce systemic risks within the financial system. 41 It must be complied with by the banks as of 1 January 2016. 42 It must be complied with by the banks as of 1 January 2019. On the basis of scoring carried out in accordance with the guidelines of the European Banking Authority, the Bank of Slovenia decided that NLB d.d., SID banka, d.d., Ljubljana, Unicredit banka Slovenija d.d., Abanka d.d., Nova KBM d.d., SKB d.d., Sberbank d.d. and Banka Koper d.d. are determined as other system-relevant banks.

34 Development Report 2016Macroeconomic framework
capital. Additional incentives to investors, such as tax relief for pension funds and promotion of old age saving would contribute to an easier access to fresh capital on the market and the deepening of financial markets. To ensure a better financial structure of companies, it will be crucial to enhance the role of other segments of financial services that are based on long-term sources of financing, particularly on deepening the capital market and increasing access to sources of financing for SMEs as well as increasing the stock of foreign direct investment (FDI).
increase the production capacity and lower the current surplus of savings over investment, the introduction of structural reforms is also important for boosting the economic growth, since it will improve the conditions of conducting business and enable the creation of products and services with high value added (see Chapter 2). Further improvement of private consumption that will follow the improvement of the labour market conditions due to faster economic growth will also reduce deflation risks that could derive from the domestic environment.
The adoption of measures addressing the areas which will pose major long-term challenges to Slovenia remains at the core of economic policies for the further consolidation of the public finances. The general government deficit which increased considerably during the crisis, decreased below 3% last year, while the public debt continues to increase. The measures taken so far have been mostly interventionist and temporary in nature, thus the main challenge of the coming years remains their replacement with more permanent measures, which should include measures for adapting the systems that represent the biggest risk for long-term sustainability of public finances (pension, healthcare and long-term expenditures). In order to increase our revenues, we should take advantage of the possibility of extending the tax bases, implementing changes in property taxation and improving the efficiency of state property management. The financial support to the corporate sector should be renewed or systems should be established, increasing their efficiency and effectiveness and thus making a larger contribution to the long-term economic growth and not redistributing funds from the more successful to less successful.
Successful completion of the banking sector rehabilitation, rapid restructuring of businesses, enhanced volume of equity capital and development of non-bank segments of the financial system are of vital importance for securing financial resources for the corporate sector and faster revival of economic activity. Encouraging lending activity, particularly to promising companies among the SMEs is an important factor in improving the economic growth. Greater access to bank financing will improve the operating conditions of companies with a healthy financial structure and good business opportunities. An increase in the volume of loans to prospective customers would have a positive effect on the operation of banks, in particular on the interest income. This could reduce more quickly the proportion of non-performing claims where the challenge remains the creation of systemic solutions for SMEs. A further decline in the total share of non-performing claims and efficient implementation of risk management measures would provide a more stable banking system, one that would be capable to deal with pressures in the event of a renewed tightening on international financial markets. Given the further deleveraging and the financial restructuring of companies, it will be crucial to ensure additional equity

35Development Report 2016Factors of competitiveness
2. Factors of competitiveness
One of the priorities is to strengthen the competitiveness of the economy in order to catch up with advanced economies. In addition to a stable macroeconomic environment, it is vital to improve productivity and, consequently, the competitiveness of the economy in the long term in order to increase GDP. In the short term, the increased investment activity indicated by the improved investment environment could contribute towards achieving this goal. In the past Slovenia has been increasing its investments into long-term factors of added value creation (such as knowledge and R&D) too. They are relatively high by international comparison, but the key issue remains their effective use. Priority areas of future action thus include increasing the economy’s innovation capacity and its human capital. Competitiveness should also be enhanced by increasing the efficiency of the general government and its institutions, including ensuring a stimulating environment for business formation and growth.
The economic development setback of Slovenia that was the result of the crisis has begun to diminish since 2014, however, the lagging behind the more developed countries remains important due to low productivity. Slovenia is ranked among medium developed EU countries with a GDP per capita below the EU average, and with a discontinued process of catching up with more developed countries hit by the crisis. The GDP per capita (in terms of purchasing power parity), after several years of falling behind the EU average, saw a greater increase in comparison with the EU only in 2014, and the data on economic growth show that the process of closing the gap has continued also in 2015. However, at 83% of the European average (data 2014), Slovenia remains far behind the more developed countries and the 2008 peak (89%). It lost its advantage in the most
recent period (over the Czech Republic and Malta) and it has weakened considerably in relation to some of the new EU members (in particular Slovakia, Estonia, Lithuania, Poland). The key reason for this lagging behind is low productivity, i.e. low value added per employee. The productivity has become to slow down already before the onset of the crisis, and has remained relatively low (below ten -year average before the crisis) also in the recent period. Increase in added value and, consequently, the productivity, will be of utmost importance for further development, taking into consideration the ageing of the population and the resulting shrinking of the labour force contribution to GDP growth.
2.1 Competitiveness of the corporate sector
A competitive corporate sector is a basis for increased exports and integration into global value chains with products and services in the higher price bracket. After a significant deterioration during the crisis, the cost and price indicators of competitiveness have recently much improved. The composition of exports is also gradually improving and shows increase in the share of high-tech products and knowledge-intensive services. However, productivity remains the area where there is much to be done, with possibilities for improvement in particular in strengthening long-term, non-price factors, such as innovation capacity and human capital.
In 2013 and 2014 Slovenia regained the market share it lost in the most important export markets between 2008 and 2012. In 2014 Slovenia’s market share in the EU commodities market exceeded the pre-crisis level by approximately 3%, while in the markets of the fourteen main trading partners, which include also non-EU countries, has reached the 2007 level. In the global market, where the extent of the market share is more significantly affected by the difference between domestic exports and the global imports structure, the share remains below the pre-crisis level, as is also the case for the whole EU. However, in 2013–2014 Slovenia was the third best within the EU in terms of the global market share increase; and was in the middle of EU countries (behind most of the new countries and in front of the majority of more developed countries) in the period after the onset of the crisis (2008–2014). Data for the first nine months of 2015 show a slowed down growth of the EU market share, as the share in the three main trading partners (Austria, Italy and Croatia) diminished after the steep rise in recent years, but remained considerably higher in relation to the pre-crisis level.44 Slovenia’s market share in the global market and in the markets of the fourteen main trading partners was slightly lower in year-on-year terms in the first nine months, due mainly to the steep rise of those import
44 In most other EU markets favourable trends continued also in 2015.
Figure 17: GDP per capita in terms of purchasing power parity and its components (productivity and employment)
Source: Eurostat Portal Page – National accounts, 2015; calculations by IMAD.
79 79
8283
86 86 8687
89
8583 83
81 8183
75
80
85
90
95
100
105
110
115
2000
2001
2002
2003
2004
2005
2006
2007
2008
2009
2010
2011
2012
2013
2014
Inde
x EU
= 1
00
GDP per capita in terms of purchasing power standards
Productivity (GDP in terms of purch. power standards per employee)
Employment rate

36 Development Report 2016Factors of competitiveness
markets that are relatively less important in Slovenia’s exports structure (structural effects)45. The calculation (dismissing structural effects) shows a steady increase of Slovenia’s market share in the fourteen main trading partners, however, this increase was, as in the EU market, smaller than in the past two years. Export performance index also shows an upward trend in 2015.46
The increase in market share since 2012 has been the result of improved cost competitiveness, while in 2013 and 2014 it was also the result of the exports structure. This improved competitiveness was notably impacted by the decline in unit labour costs in the tradable sector, in particular in manufacturing, present in the past five years. The period since 2012 has also benefited from improved terms of trade connected to low prices of raw materials in the global market. It is estimated that lower costs of firms (labour and material) have partially resulted in lower prices. They also made possible higher profits, which in conditions of limited access to other sources of financing represent an important potential for new investments necessary for further maintain and enhance the competitive position of firms. The structure effect is the result of differences between the structure of domestic exports in relation to the composition of
45 The North and South American imports stand out in particular, which resulted in the decrease of Slovenia's market share due to the much greater share of these countries in the global imports and in the imports of our fourteen main trading partners (including the USA) in comparison to the share in Slovenia's exports.46 The export performance increased in 2015 by 1.5%, less than in 2014 (2.6%).
the global demand. While in 2008–2012 the structure of Slovenia’s exports (production and geographical orientation) had a strong adverse effect on the market share growth, in 2013–2014 more than one-third of market share increase (on the global market) was due to structural effects, i.e. due to a relatively higher rise of import demand on Slovenia’s main export markets in comparison with less important markets.
Figure 18: Slovenia’s share of merchandise in foreign markets (left) and shift-share decomposition**analysis of Slovenia’s global merchandise market share (right)
-12
-9
-6
-3
0
3
6
9
12
2001
2002
2003
2004
2005
2006
2007
2008
2009
2010
2011
2012
2013
2014
1-9.
201
5
Year
-on-
year
incr
ease
in %
On the market of 14 main trade partnersOn the EU marketOn the market of 14 main trade partners - weighted*On the world market
-6
-4
-2
0
2
4
6
2001-2007 2008-2012 2013-2014
Ann
ual a
vera
ge in
%
Geographical market share gainsProduct market share gainsInitial product specialisationInitial geographical specialisation
Source: UN, SURS, Eurostat, WIIW, US Census Bureau, calculations by IMAD.Note: *With shares of Slovenia’s exports in the fourteen main trade partners. **The product and geographical composition in the base year (initial product and geographical specialisation) indicate whether a country is specialised in fast-growing product markets and whether trade partners are fast-growing geographical destinations. The remaining two components, market share gains in geographic destinations or in product markets, show whether market shares increased within geographical markets and product markets. The latter two components represent the export competitiveness in the period analysed. Shift-share decomposition is made separately for the geographical and product component. Therefore the change in the market share as shown in the figure is equal to the sum of all four components divided by two (A Closer Look ... V. Quarterly Report on the Euro Area, 2012).
Figure 19: Relative* market shares by structure of merchandise exports according to factor intensity
Source: UN, Unctad, calculated by IMAD.Note: *A relative market share is the market share of a specific group of products compared to the total share of such goods on the world market.
0.5
0.7
0.9
1.1
1.3
1.5
1.7
Resource-intensiveproducts
Labourintensiveproducts
Low-technology
products
Medium-technology
products
High-technology
products
Rela
tive
mar
ket s
hare
s, to
tal =
1
Slovenia 2007 Slovenia 2014 EU 2014 EU 2007

37Development Report 2016Factors of competitiveness
Changes in the composition of goods exports after the onset of the crisis are favourable in terms of competitiveness of the economy, but are still not intensive enough to enable Slovenia to match the technology intensity of EU exports. The expansion of technology intensive products contributed significantly to the increase of exports in recent years, while at the outbreak of the crisis they dimisished the least in comparison to other products. This resulted in a significant change in the composition of merchandise exports, with the expansion of high-technology products (by approx. 5 pps) and reduction of mainly low-technology and labour-intensive products. In 2012, the share of high-technology products was higher that the average in new Member States, yet considerably lower than the EU average (see Indicator 2.5). This contributed to improve the structure of the market share in goods exports too. In comparison to the pre-crisis year 2007 Slovenia increased its global market share of high-technology products, and decreased its market share of labour-intensive products (by one-third in 2007–2014). However, the relative market share47 of high-technology intensive products remains considerably lower than in the EU, while the relative share of medium-technology products, which remains stable, is quite high by international comparison.
Cost competitiveness continued to improve in 2015. After a sharp decline in 2008–2010 the cost competitiveness of Slovenia’s economy has been on the rise since 2011. Positive trends were the result not only of the depreciation of the nominal rate, but also of the decline in the unit labour costs. In 2011–2013 this decline was mainly due to the adjustment of the labour market
47 Ratio between the share of high-technology products on the global market and the total share of goods on the global market.
(wages and employment) to the poor economic activity in the tradable sector, in particular in manufacturing. In 2014–2015 this downward trend continued, due to higher economic activity and poor growth of labour costs. Cost adjustment continued to be more intensive in the manufacturing industry. In 2015 unit labour costs in manufacturing fell far below the pre-crisis level (2007), while in the EU they were slightly higher, which shows a major increase of the cost competitiveness of goods exporters in this period.
The gap of productivity in manufacturing with EU average has been narrowing since 2012, but remains high in high-tech activities that are the main driver behind goods exports growth. Manufacturing industries have contributed the most to the improved productivity in the entire economy after 2009. Until 2012 its growth had primarily been due to technology-intensive and export-oriented activities, which was in turn the result of growth of productivity within the sector and the increase of their share in the structure of the sector. Later (2013–2014) the productivity growth in manufacturing was mainly due to the contribution of the medium-low tech and low-tech activities. In this period the productivity growth in manufacturing improved more than the EU average, attaining 65% of the EU average in 2014, after persevering in a state of stagnation of approx. 60% before 2013. Despite the improvement, the gap with the average EU productivity remains large, with technology-intensive activities lagging behind the most. The lagging behind the EU even increased in the two technology-intensive sectors (pharmaceuticals and vehicles) that are of utmost importance for Slovenia’s export. However, the productivity of manufacturing industries remains the highest among the new Member States, which have, with the exception of the Baltic States, progressed more slowly since the beginning of the crisis.
Figure 20: Real unit labour costs, Slovenia and the EU
90
92
94
96
98
100
102
104
106
108
110
Q1
08
Q1
09
Q1
10
Q1
11
Q1
12
Q1
13
Q1
14
Q1
15
4-qu
arte
r mov
ing
aver
age,
inde
x 20
07=
100
RULC SloveniaRULC EUProductivity of Slovenia*Productivity of the EU*Compensation per employee in Slovenia*Compensation per employee in EU*
96
98
100
102
104
106
108
110
112
Q1
08
Q1
09
Q1
10
Q1
11
Q1
12
Q1
13
Q1
14
Q1
15
4-qu
arte
r mov
ing
aver
age,
inde
x 20
07=
100
Tradable sector in Slovenia Tradable sector in EUManufacturing in Slovenia Manufacturing in EU
Source: Eurostat Portal Page – National accounts, 2016.Note: *Real, GDP deflator.

38 Development Report 2016Factors of competitiveness
In recent years, knowledge-intensive services gain importance within service exports, while the competitiveness of the service sector remains poor. Services, in particular knowledge-intensive ones,48 may decisively contribute to the competitiveness of the economy, both directly through exports and indirectly by their use in the manufacturing of products.49 In Slovenia the share of services in value added of the economy is considerably below the EU average, and the gap has even widened in the recent period.50 Only the share of traditional services (trade, transport, accommodation and food service activities) is higher than in the EU; while
48 Knowledge-intensive non-financial market services include information and communication (NACE J) and professional, scientific and technical activities (M).49 These services enable greater differentiation of products on the market, presentation of comprehensive offers to customers and introduction of new business models (European Service Innovation Centre, 2014). European Service Innovation Centre, 2014).50 To 7.2 pps in 2014 (the latest available data).
lately positive trends have been seen in knowledge-intensive services.51 This recovery is mainly due to their increased orientation to foreign markets, especially in 2013 and 2014. However, their share in the total exports of services is still small, below the EU average by more than 10 pps (see Indicator 2.6). Export competitiveness of the service sector is also poor, with its foreign market share lately more or less fixed at a level below the one before the beginning of the crisis. Unused potential also remains in the area of inclusion of services in manufacturing and exports of other services. Although the share of services in the manufacturing sector exports is relatively high by international comparison, the importance of domestic services in them remains low. It is rising, but the rise since 1995 has been modest and reflects the poor competitiveness of domestic services. This is partly due to the small volume of foreign direct investment (see Indicator 2.8), as analyses indicate that
51 The share of financial services (K) and of real estate activities (L) have diminished the most since the onset of the crisis. Financial services are analysed in detail in chapter 1.3.
Table 2: The market share of Slovenian exports of services in EU service imports
In %Share in service
exports, 2014
Market share
2010 2011 2012 2013 2014
Services 100.0 0.33 0.33 0.32 0.32 0.31
of which: Transportation 27.5 0.40 0.43 0.43 0.42 0.45
Travel 37.0 0.70 0.69 0.66 0.65 0.61
Knowledge-intensive services 22.3 0.16 0.16 0.15 0.16 0.16
telecom, computer, IT services 8.2 0.24 0.28 0.27 0.26 0.26
Other business services 14.0 0.14 0.13 0.11 0.12 0.12
Other services* 13.2 0.15 0.16 0.17 0.18 0.16Source: Eurostat portal page – Economy and Finance, 2016; calculations by IMADNote: *The “Other services” group comprises services of transformation, maintenance and repair of goods, construction services, insurance services, retirement and financial services, royalties and license fees, personal services, cultural and recreational services, and government services.
Figure 21: Productivity of manufacturing industries in comparison with the EU
Source: Eurostat Portal Page – National accounts, 2016; calculations by IMAD. Note: TZ – technology intensity.
0
10
20
30
40
50
60
70
80
90
Woo
d in
d.
Text
ile, l
eath
er in
d.
Prin
ting
Furn
iture
ind.
, oth
.
Pape
r ind
ustr
y
Food
indu
stry
Mfr
.non
-met
al. m
in. p
r.
Met
al p
rodu
ct m
fr.
Mfr
. rub
ber,
plas
tic p
r.
Basi
c m
etal
s mfr.
Repa
ir, in
stal
l.of m
ach.
,equ
ip.
Phar
mac
eutic
als i
nd.
Elec
tric
al m
ach.
, app
arat
.mfr
.
Oth
. veh
icle
s and
cra
fts m
fr.
Mfr
.of m
otor
veh
icl a
nd c
raft
s
Chem
ical
s ind
ustr
y
Mfr
. m
ach.
, equ
ipm
.
Mfr
. of I
CT,e
l. eq
uipm
.
Low-tech industries Medium-low-tech Medium-high and high-tech ind.
Inde
x, E
U=1
00
2008 2013
Figure 22: Services value added share in manufacturing industry exports, 2011
Source: OECD, 2016; calculations by IMAD.Note: Data are available for EU Member States that are members of OECD.
0
5
10
15
20
25
30
35
40
45
50Fr
ance
Italy
Net
herla
nds
Den
mar
kSw
eden
Ger
man
yBe
lgiu
mSp
ain
Port
ugal
Aus
tria
Pola
ndFi
nlan
dU
. Kin
gdom
Gre
ece
Slov
enia
Esto
nia
Slov
ak…
Czec
h Re
publ
icH
unga
ryIre
land
Luxe
mbo
urg
In %
Share of foreign servicesShare of domestic servicesShare of domestic services, 1995

39Development Report 2016Factors of competitiveness
barriers for FDI are the major hindrance for increasing the multifactor productivity in services.52 FDI in services are of major importance in view of acquisition of specific service marketing skills, introduction of innovative business models and increasing the use of digital services.
Further deregulation of services would have a positive impact on the competitiveness of the economy and the level of GDP. Analyses show that liberalisation has s positive impact on the efficiency of services and consequently, on the economy as a whole.53 Between 2010 and 2015 the number of regulated professions in Slovenia dropped considerably mainly due to deregulation in crafts, but continues to be considerably above the EU average. According to OECD, regulation is especially high in professional services, with high barriers that impede entry. Our simulation indicates that a reduction of barriers that discourage entry to markets of the most regulated professional services (according to OECD these are architectural, legal, accounting and technical services) to the OECD average would positively affect the economic growth in the mid- and long run.54
52 Van der Marel, 2012.53 Monitor on competitiveness and trade performance (EK), 2015.54 The simulation was carried out by using the dynamic stochastic general equilibrium model QUEST. The shock was defined on the basis of the OECD index of product market regulation (PMR) converted into an adequate reduction of the margin on intermediate products in the model. Reduction of major barriers to entry (mandatory membership in professional chambers, years of mandatory practical training and number of services requiring specific professional qualifications) to the average OECD level would lower the PMR index value by approx. 1 point, which would be equivalent to the reduction of the margin in the area of intermediate products by 0.36 pps; in the long run, the GDP would increase for almost 0.1% (for
In other often regulated services, such as retail trade and network industries, Slovenia does not have in place any particular legislative barriers to entry; however, in network industries the share of state ownership remains above average.55 Various indicators of competition that are improving show a satisfactory degree of competition on these markets.56
Slovenia as a small country belongs to more open economies, but lags behind some of the new Member States in terms of the level and pace of its integration in international trade flows. The rate of integration, measured in terms of the average share of foreign trade (exports and imports) in GDP has been on the increase since 2009 and was, in 2014 and 2015, higher than ever before (72.6%). However, according to this indicator Slovenia was still only in 11th place among the EU Member States, although as a rule the level of trade integration is higher for small countries. It performed even worse in terms of the pace of integration,57 ranking behind numerous new Member States, although many of them were more integrated in international trade flows already in the baseline year. Slovenia performs slightly better in terms of some indices that are being developed lately and measure participation in value added, but are not available for recent years. According to the latest
more, see Assessing the Effects of Some Structural Measures in Slovenia, IMAD, 2016).55 Koske et al., 2015.56 In retail trade, concerning mostly foodstuffs, concentration measured in terms of the Herfindahl-Hirschman Index dropped from the maximum value of 3,387 in 2006 to 2,117 in 2014 (the high concentration limit being the value of 1,800), while the share of the main provider dropped from 53% to 38%. For network industry see Indicator 2.7.57 In 21st place in terms of increase of participation in GVCs after the beginning of the crisis.
Figure 23: Degree of foreign trade integration in terms of value added
-20 30 80 130
LuxembourgIrelandEstonia
BulgariaHungarySlovakia
MaltaSloveniaCzech R.
LatviaCyprus
LithuaniaBelgium
AustriaPoland
SwedenCroatiaFinland
RomaniaDenmarkPortugal
GermanyU. KingdomNetherlands
SpainItaly
GreeceFrance
In % (change in percentage points)
2000
2000-2011
Sum of foreign value added in final domestic consumption and domestic valued added in foreign final consumption in comparison to value added
-20 0 20 40 60 80
LuxembourgSlovakiaHungaryCzech R.
IrelandSloveniaBelgiumFinland
DenmarkBulgaria
PolandEstonia
MaltaSweden
LatviaAustria
PortugalGermanyRomania
U. KingdomNetherlands
ItalyFrance
SpainLithuania
GreeceCyprusCroatia
In % (change in percentage points)
2000
2000-2011
Global value chains participation index
Source: Trade and value added (OECD), 2015; calculations by IMAD

40 Development Report 2016Factors of competitiveness
Box 5: Export-oriented Slovenian economy - comparison of gross exports and value added exports
Measuring export orientation of the economy in terms of the share of gross exports in GDP has several shortcomings, so lately additional criteria have been introduced. The first shortcoming is that gross exports also include foreign inputs. The higher the share of foreign inputs in gross exports, the worse criterion of export orientation is gross exports. In principle, the smaller the country, the higher the share of foreign inputs in gross exports. The second shortcoming is that gross and net values are being compared when using the share of gross exports in the GDP. For this reason, the analysis of export orientation of the economy resorts more and more to the use of the criterion of value added exports, which better reflects the actual exports orientation of the economy and the importance and effects of exports on economic growth. In terms of effects of exports on economic growth the most appropriate indicator of exports orientation is the share of export-related value added in the total value added.
According to the criterion of gross exports and of value added exports, Slovenia is among more export-oriented EU economies; however, quite some new Members States perform better. In 2011, Slovenia was, with the share of gross exports in total output1 of 28.3%, at the fifth place among EU Member States; while in terms of the increase in the period 2001-2011, it was somewhere in the middle. As Slovenia is a small country, a considerable part of gross exports is accounted for by foreign inputs, while the share of domestic value added in gross exports is commensurately lower. In 2011 gross exports contained 63.8% of domestic value added, which is the eight lowest share among the EU Member States. In 2000–2011 it decreased in most EU Member States, but remained almost unchanged in Slovenia. Despite the below-average share of domestic value added in gross exports, in 2011 the share of export-related domestic value added in total output of Slovenia’s economy was 18.1%, which is among the highest in the EU. The same is true for the share of export-related value added in the total value added, which in 2011 was 40.3%, the ninth highest in the EU. In terms of indicators of added value exports, Slovenia is a relatively highly export-oriented economy; on the other hand, it is evident that after a larger increase in 2000–2011 more and more new Member States show a better export-orientation performance.
Figure: Share of gross exports in gross output (left) and share of export-related value added in the total value added (right)
-20 0 20 40 60 80
FranceItaly
GreeceRomania
U. KingdomSpain
Netherlands Croatia
PortugalLatvia
FinlandPoland
GermanyBelgium
AustriaLithuaniaDenmark
SwedenCyprus
Czech R.Malta
EstoniaBulgariaSloveniaSlovakiaHungary
IrelandLuxembourg
2000
2011-2000
-20 0 20 40 60 80
GreeceFrance
ItalySpain
U. KingdomPortugalRomania
CroatiaFinland
NetherlandsPoland
DenmarkGermanyBelgiumSwedenAustria
LithuaniaCyprusLatvia
SloveniaBulgariaCzech R.Slovakia
MaltaEstonia
HungaryIreland
Luxembourg
2000
2011-2000
Source: Trade and value added (OECD and WTO), 2015; calculations by IMAD
1 Total gross production including intermediate consumption.
available data (2011), Slovenia ranked 8th in the EU in terms of the ratio of the sum of foreign value added in domestic final demand and domestic value added in foreign final demand to the total value added of the country, and 6th in terms of the GVC participation index.58 58 The so-called Koopman's participation index (Koopman et al., 2010) is composed of backward participation and forward participation in GVCs. Backward participation captures the import content of exports, forward participation captures the value of inputs produced domestically that are used in other
This shows that Slovenia’s economy is among the more open ones; however, the high participation in GVCs of some other new Member States indicates that Slovenia has a certain, yet unused, potential in this area. This is even more true considering the fact that the picture is almost the same as far as exports are concerned (see Box 5), which are the key factor of Slovenia’s recovery in recent years.
countries' exports.

41Development Report 2016Factors of competitiveness
The process of privatisation and restructuring of the corporate sector resulted in a major increase of inward FDI in Slovenia in 2014 and 2015. This increase which followed a period of poor growth was mainly due to extensive inflows of equity resulting primarily from the renewal of privatisation process and corporate restructuring (see Chapter 2.4) and generally increased sales of equity stakes in Slovenian companies. Expectations of foreign owned enterprises are also favourable. The SPIRIT survey shows an increase in sales and employment in a large number of these companies; approximately one-third of them are also expected to expand their activities in 2016. Because of modest FDI inflows in recent years, in 2014 (last available data) Slovenia was among the EU countries with the lowest stock of FDI as a share of GDP and the smallest increase of this ratio over a longer period. Unlike the inward FDI, in the last two years the outward FDI was below the level of the previous years, but in comparison with other Central European Member States, Slovenia’s outward FDI to GDP ratio is second only to Hungary and Estonia.
Indicators of entrepreneurial activity have shown no signs of recovery in recent years. After the increase since the beginning of the crisis due to large subsidising of self-employment, early-stage entrepreneurial activity (measuring the share of the population getting involved in entrepreneurship) has been decreasing since 2013. The share of early-stage entrepreneurs driven by identified business opportunities remains modest since the beginning of the crisis, while the share of necessity-driven entrepreneurs has increased considerably. This indicates that in the past period new enterprises were established mostly as a necessity-driven opportunity of self-employment and less as opportunities to put in practice innovative solutions with a potential of
expansion. Consequently, the number of high-growth enterprises that normally bring about investments and create employment has remained at an extremely low level, and their share is among the lowest in the EU (see Indicator 2.9). Data on start-ups are more encouraging, as in 2014 and in particular in 2015 the volume of investments in start-ups owned by Slovenians increased considerably. For the time being most investments have been collected by enterprises operating abroad, but improved support environment for entrepreneurship could result in a larger number of start-ups also in Slovenia (see Box 6).
2.2 Human Capital
An increased and more efficient investment in knowledge is one of the main levers for strengthening the potential of economic growth. In Slovenia, human capital, one of the key factors of competitiveness and long-term growth, is too low and insufficiently used. The share of population with tertiary education is, by international comparison, relatively high, but its distribution in terms of orientations and skills does not meet the demands of the corporate sector. In recent years Slovenia has also been experiencing an increased outward migration of highly educated persons. Taking into consideration the decline in the size of generations for enrolment in tertiary education (demographic changes) and the anticipated growing needs of the industry for highly educated workforce, the major future challenge will be to ensure a sufficient number of persons with appropriate qualifications and skills.
The share of the population with tertiary education has attained the EU level, but insuring a sufficient number of adequately educated workforce remains a challenge. The improvement to the education structure of the adult population (aged 25–64) and of the active working population in recent years (see Indicator 2.10) is the result of a long period of participation of the young in tertiary education and of the structural impact of retirement of the elderly and employment of the young which are, proportionally, better educated. Despite the increased share of highly educated workforce, enterprises still underexploit the opportunity to fully use the knowledge of tertiary educated persons to boost their value added. Since the beginning of the crisis the share of persons with tertiary education, as the public sector was hit by austerity measures, has mostly increased in the private sector but remains much lower than in the public sector and considerably below the EU average. Ensuring sufficient adequately educated workforce remains a challenge for the future, as Slovenia faces not only demographic changes (smaller young generations to enrol in tertiary education) but also a growing outward emigration of tertiary education persons. Demand for tertiary educated workforce is expected to grow in the future as according to Cedefop59
59 Slovenia Skills forecasts up to 2025, 2015.
Figure 24: High-growth enterprises*, Slovenia
Source: SURS. Note: *A high-growth enterprise is an enterprise with an average growth rate of employment of 10% per year over a three-year period, and which had 10 or more employees in the first year of the three-year period.
0
20,000
40,000
60,000
80,000
100,000
120,000
0
200
400
600
800
1,000
1,200
2008
2009
2010
2011
2012
2013
2014
Num
ber
Num
ber
High-growth companiesNumber of employees in high-growth companies, right axis

42 Development Report 2016Factors of competitiveness
forecast the greatest number of jobs is expected to be available in Slovenia for people with tertiary education.
Tertiary education also responds too slowly to the needs of the corporate sector. During the crisis it has become increasingly hard for people with tertiary education to find employment. Since the onset of the crisis, their unemployment rate has increased more than the EU average (see Indicator 3.5). Between 2010 and 2014 also sharply increased the share (in relation to the EU) of young persons with tertiary education (aged 25–34) who were employed in professions for which they are overeducated.60 One of the main reasons for this, besides the modest demand due to the crisis, is the lengthy period of insufficiently balanced structure of supply and demand for graduates from various programmes. The significant decrease of enrolment in social and administrative sciences and law in the past ten years has somewhat reduced the educational imbalances. In addition, major mismatch remains in terms of skills provided, which are due to insufficient consideration of long-term needs of businesses. Slovenia, unlike several Member States, does not systematically monitor the transition of tertiary-educated graduates from education to the labour market61. An upgrading of the records of students and graduates with a system of monitoring the employability of tertiary-educated graduates would be necessary. In 2014 and 2015 a measure to increase cooperation between the higher education sphere and the entrepreneurial sector was implemented to tackle the problem of employability of tertiary-educated graduates, yet it included a very limited number of participants.62 60 Education and Training Monitor 2015, 2015.61 Eurydice Brief. Modernisation of Higher Education in Europe, 2015.62 The purpose of the measure 'A creative path to practical
Tertiary education enrolment system anomalies are being eliminated, but progress in quality is slow. In post-secondary vocational education programmes, fictitious enrolments have, since the academic year 2014/2015, been prevented by the Post-Secondary Vocational Education Act, while in higher education programmes they were limited by means of online application, which makes it possible to control data from the records of students and graduates. As a consequence, this year’s enrolment figures are substantially lower, but this may not be attributed exclusively to demographic causes. The share of candidates for graduation and of students who had been granted terms of extension of time, has also dropped radically since the academic year 2012/2013 due to restrictions concerning student status extensions. There have been major advancements in this field, however, weaknesses remain in relation to transition of students from the first to the second year, and in relation to a systemic regulation of repeated enrolment in the second year of study in higher vocational colleges63, where there is ample room for implementing better solutions. A systematic monitoring of graduation and drop-out rates and implementation of measures to improve student achievement could have a positive impact on the efficiency of studies64. In the
knowledge' was to support the development of skills, the acquisition of practical knowledge and experience through projects implemented in partnership between higher education institutions and the entrepreneurial sector. 63 It amounted to 40.4% in the academic year 2014/2015 due to the standards applying to financing of higher vocational colleges that take into consideration students that are enrolled for the second time in the second year because of modifications of study obligations. 64 In several EU Member States higher education institutions carry out tutoring or mentoring programmes to help students to acquire learning and/or organisational skills (The European Higher Education Area in 2015, 2015).
Figure 25: The share of employed persons (aged 25–64) with tertiary education, 2014
Source: Eurostat; calculations by IMAD.Note: O, P and Q are public sector activities, A-N and R-S are private sector activities.
0
10
20
30
40
50
60
70
80
P - E
duca
tion
M -
Prof
ess.,
scie
ntifi
c, te
chn.
act.
O-Pu
blic
adm
in., d
efen
ce, c
ompu
l. soc
. sec
.K
- Fin
ancia
l and
insu
ranc
e act
ivitie
sR
- Arts
, ent
erta
inm
ent a
nd re
crea
tion
D - E
lect
ricity
, gas
, ste
am su
pply
J - In
form
atio
n, co
mm
unica
tion
L - R
eal e
state
activ
ities
Q - H
uman
hea
lth an
d so
cial w
ork a
ct.
Tota
lE -
Wat
er su
pply,
sew
erag
e, w
aste
man
ag.
G-W
hole
sale
,reta
il tra
de; r
epair
of m
ot. v
eh.
N - A
dmin
istr.
and
supp
ort s
ervic
e act
.S -
Oth
er ac
tiviti
esC
- Man
ufac
turin
gI -
Acc
omm
odat
ion
and
food
serv
ice ac
t.H
- Tra
nspo
rt an
d st
orag
eB
- Min
ing
and
quar
ryin
gF -
Con
struc
tion
A - A
gricu
lture
, fore
stry
, fish
ing
In %
Slovenia EU
Figure 26: Employed tertiary-educated graduates (aged 25–34) overqualified in their current job
Source: Education and Training Monitor 2015, 2015.
0
10
20
30
40
50
Cypr
usG
reec
eBu
lgar
iaIre
land
Spai
nPo
land
U. K
ingd
omRo
man
iaSl
ovak
iaIta
ly EUSl
oven
iaEs
toni
aN
ethe
rland
sA
ustr
iaLa
tvia
Fran
ceH
unga
ryLi
thua
nia
Croa
tiaFi
nlan
dBe
lgiu
mPo
rtug
alCz
ech
R.Sw
eden
Ger
man
yM
alta
Den
mar
kLu
xem
bour
g
In %
2014 2011

43Development Report 2016Factors of competitiveness
academic year 2014/2015, the ratio of the number of students to the number of teaching staff, which is one of the quality indicators, improved (16.8) and is now closer to the average of EU Member States that are also OECD members (16.0 in 2013). As this shift is mainly due to the reduction of fictitious enrolment, we consider that its actual impact in terms of higher quality will only be seen in a long term. In 2012–2015 two-thirds of the enrolled in tertiary education were satisfied with the quality of teaching, which places Slovenia in the lower half of participating EU Member States.65
The system of higher education financing does not sufficiently encourage higher quality and efficiency, and employability of graduates. The share of public expenditure for tertiary education in GDP has been decreasing since 2012 (to 1.06% of GDP in 2014, multi-annual average: 1.28%) as the adoption of new social legislation and fiscal balance measures resulted in a reduction of transfers to households or students. Public expenditure, like private expenditure, is comparable to the average of 21 EU OECD countries. As in Slovenia the number of students enrolled in tertiary education is above average, expenditure, although rising, remains low in terms of expenditure per participant in education (see Indicator 2.11), which reduces the possibility for increasing quality. Higher quality could be achieved mainly through a better use of public funds and higher private expenditure. This has partly been achieved by the limitation of fictitious enrolment, yet Slovenia, unlike some other Member States, lacks financial incentives for increasing the efficiency of studies (for instance partial recovery of the cost of study in cases of the non-completion of tertiary education, fees).66 The current system of higher education financing does little to encourage higher quality and efficiency, and to enhance employability of graduates.67 Higher efficiency of using public funds could be achieved, along with the reduction of the number of enrolled students also by rationalizing the network of higher education institutions and reducing the number of study programmes.
Vocational and technical upper-secondary education also responds insufficiently to the needs of the labour market. The problems are the following: shortage of certain occupational profiles,68 mismatch between educational programmes and the needs of the corporate
65 Results of the Eurostudent Survey V (Hauschildt et al., 2015).66 The European Higher Education Area in 2015, 2015.67 In compliance with the Decree on Budgetary Financing of Higher Education and Other Institutions (2011) universities and independent higher education institutions established by the Republic of Slovenia and concessionary higher education institutions that carry out state-approved study programmes would be partly publicly funded depending on their efficiency, international cooperation etc. (see the Decree); however, this was never applied due to austerity measures.68 According to the Employment Forecast 2015/1 (2015) survey professions that are in most demand are welders, toolmakers, masons, waiters, etc.
sector, and modest volume of sponsorship scholarships. These problems could be efficiently addressed, and students more motivated to enrol in vocational education by establishing a system of apprenticeship and providing more scholarships for shortage occupations,69 considering that in 2015 the number of applications was largely above the number of scholarships available.
Participation of employed persons in lifelong learning has declined since the onset of the crisis. As a result of the need to reduce expenditure during the crisis it declined in both in the public and private sectors. This unfavourable trend persevered in most sectors throughout 2014. In most private sector activities participation of employed persons in lifelong learning is lower than in the public sector. It is particularly low in sectors with a prevalence of low-skilled workers, as Slovenia does little to encourage their participation, unlike some other EU Member States.70 In recent years, adult participation has been encouraged by competence centres for staff development,71 which have also produced a number of other positive developments.72 Such mechanisms could be used also in the future to encourage participation of employed persons in lifelong learning.
69 The Scholarship Policy (2015–2019), adopted in 2015, provides for incentives in the form of scholarships for enrolment in vocational and technical upper secondary education programmes for shortage professions.70 Adult Education and Training in Europe. Widening Access to Learning Opportunities, 2015.71 In 2010–2015 there were 19 competence centres for staff developmentwhich were active in more than 300 enterprises.72 They developed competences relating to cooperation among enterprises within the industry, building confidence, learning from one another, enhancing competitiveness (Vidmar, 2015).
Figure 27: Participation of employed persons aged 25–64 in lifelong learning, Slovenia
Source: Eurostat, ADS Note: O, P and Q are public sector activities, A-N and R-S are private sector activities.
0
5
10
15
20
25
30
35
K Fi
nanc
ial a
nd in
sura
nce
activ
ities
P Ed
ucat
ion
O-P
ublic
adm
in., d
efen
ce, c
ompu
l. soc
.…
J Inf
orm
atio
n an
d co
mm
unic
atio
n
M P
rofe
ssio
nal, s
cient
ific,
tech
nic.
act.
Q H
uman
hea
lth a
nd so
cial
wor
k act
iv.
D El
ectr.
, gas
, ste
am, a
ir co
ndit.
supp
ly
R Ar
ts, e
nter
tain
men
t and
recr
eatio
n
Tota
l
H Tr
ansp
ort a
nd st
orag
e
S O
ther
act
iviti
es
G W
hole
sale
,reta
il tra
de; r
epai
r of m
ot.v
eh.
E W
ater
supp
ly, s
ewer
age,
was
te, r
emed
.
I Acc
omm
odat
ion
and
food
serv
ice a
ctiv
.
C M
anuf
actu
ring
N Ad
min
ist. a
nd su
ppor
t ser
vice
act
iviti
es
F Co
nstru
ctio
n
A Ag
ricul
ture
, for
estry
and
fish
ing
In %
2008 2014

44 Development Report 2016Factors of competitiveness
2.3 Innovation capacity
Investment in research, development, innovations, human capital, digital economy and in enhancing of various forms of intellectual property increase the efficiency and the competitiveness of the economy and ensure a high level of wellbeing. Stable financing and coordinating of policies measures in different fields, close cooperation between the R&D sector and companies and networking among companies of different sizes are necessary for investments to produce results. Since the beginning of the crisis, the volume of R&D investments of the business sector has steadily increased, as has the share of human capital in science and technology. Even though progress has been made in some areas, some important weak spots remain: insufficient transfer of knowledge from research institutions to the business sector, reduction of public funding to enhance innovative capacity, weak innovation activity of small enterprises, and slow reacting to the rapid development of new technologies and digitalisation in both private and public sectors which requires a sufficient number of adequately skilled staff.
Investment in R&D as a share of GDP is relatively high. Gross domestic expenditure for R&D accounted for 2.39% of GDP73 in 2014, and has remained, since 2010, above the EU average (see Indicator 2.13). After several years of growth, gross expenditures in R&D declined in
73 The reduction of the share of R&D expenditure is partly also due to the faster growth of GDP, which increased by 3.9% in nominal terms in 2014. If the GDP remained unchanged, the share of investments in R&D would be 2.48% in 2014.
2014, mainly due to lower public sector expenditure,74 which was lower by EUR 85 million in comparison to 2011, and only attained the pre-crisis level. However, the government succeeded to compensate the drop of investments in the business sector by higher tax reliefs for R&D75; consequently, the reduction of public expenditure mainly hit public research institutions and higher education institutions. As this trend has been present since 2011, the capacity of public institutions to keep up with the rapid development in various science fields has been declining, as well as their possibilities to participate in international research projects and to cooperate with companies where own participation is required. The situation is particularly difficult for young post-doctorate researches who are unable to apply the knowledge acquired.
The business sector continues to increase investment in R&D, supported also by R&D tax incentives in recent years. In 2014 business sector investments amounted to 1.63% of the GDP, placing Slovenia at the 5th place among the EU Member States; this is the result of the high growth between 2009 and 2014, which accounted for 47% in real terms. The increase in the tax relief for R&D to 100% in 2012 resulted in a rise of the volume of claimed tax reliefs and of the number of companies claiming them. It is important that this instruments remains stable, so as to attract foreign investments in research departments, create jobs with high value added and enhance the innovative capacity, as among the companies claiming tax reliefs particularly the number of micro companies is rising. Slovenia’s lagging behind the EU innovation rate is the greatest for small companies, which include most of the micro-companies that rarely claimed tax reliefs in the past. In 2014 the inflow of R&D funds from abroad slightly diminished due to the fact that projects under the financial perspective 2007–2013 were drawing to the close.
In 2014 the number of researchers76 decreased for the second year in a row. In the last two years this number decreased in all sectors, but the least in the business sector, which increased its share in the total number of researchers (2014: 54.1%). In the government and higher education sectors in 2014, there were 325 less researchers than in 2012. As companies are also beginning to shrink the number of researchers employed, it is highly unlikely that redundant researches from the government and higher education sectors were able to find work there. We assume that they took jobs that do not require a doctorate degree, are unemployed or went abroad (since 2011 the number of tertiary educated people who left the country has
74 Public sector expenditure includes government and higher education sectors’ expenditure. 75 In 2013 Slovenia ranked fourth among OECD countries in terms of direct and indirect (reliefs for R&D) financing of business sector expenditure for R&D (OECD STI Scoreboard 2015, 2015).76 Expressed as a full time equivalent (FTE).
Figure 28: Public expenditure for R&D performance in the business*and public sectors
Source: Eurostat Portal Page – Science and Technology – Research and Development, 2015; Ministry of Finance, 2015; calculations by IMAD.Note: *In accordance with the Frascati international methodology tax reliefs for R&D are not considered public expenditure for R&D (OECD, 2002), although they represent an incentive for companies to invest in R&D. The tax relief on investment in R&D was raised from 20% to 40% in 2010 and to 100% in 2012.
0
50
100
150
200
250
300
350
400
450
500
2009 2010 2011 2012 2013 2014
Nom
inal
inde
x, 2
008=
100
Business sector - direct financing
Business sector - R&D reliefs

45Development Report 2016Factors of competitiveness
for new high-tech companies could increase the innovative capacity of small companies. The latest data on innovation activity of companies in Slovenia for 2010-2012 point out two major weaknesses: a declining rate of innovation activity in comparison to the preceding period and low share of innovation-active small companies (Development report 2015, 2015). In addition to the Slovene Enterprise Fund which addresses the problem of low innovation activity of small enterprises with different measures, a series of mechanisms is being put in place to assist start-ups and young companies in getting funds and acquire entrepreneurial and marketing skills necessary for a successful access to markets and for expanding their operations (see Box 6). A gradual increase in innovation activity of small companies may be expected as most start-ups are involved in developing high-tech products and services. Alternative mechanisms are needed for other small companies, such as support in acquiring new knowledge and skills, the promotion of networking opportunities among small companies,78 the introduction of new business models and the establishment of a stimulating business environment. There is a very limited possibility of increasing the innovation capacity of small companies by the creation of spin-offs at the higher education institutions, where much of the new knowledge is produced, as the legislation does not allow for it.79 On the other hand, public procurement shows great potential for boosting the demand for innovative solutions, and examples from other EU Members States80 show that public procurement targeting innovative solutions yields extensive social and economic benefits. Two directives81 covering this field are applied in Slovenia as of April 2016.
Since the beginning of the crisis, Slovenia has achieved a major advancement in terms of registration of trademarks and designs, while in terms of patent applications it is still below the level of 2008. In 2015 Slovenia increased the gap with the EU average in terms of the number of applications filed with the European Patent Office per million population, but succeeded to narrow this gap for trademarks and designs (see Indicator 2.15). Developments in the field of patent protection are not favourable, and it should be noted that the structure of Slovenia’s manufacturing industry (branches and level of product processing) does not
78 In the field of tourism the web platform Bank of Tourism Potentials of Slovenia, an innovative instrument for connecting stakeholders, was acknowledged as an example of good practice for small companies by OECD in 2014.79 Applies to the University of Ljubljana. Centre for Technology Transfer (Center za Prenos Tehnologij), University of Ljubljana website. 80 In 2013 Austria established a competence centre for public procurement of innovative solutions which provides training and assistance to authorities launching tenders, and offers them the possibility to apply for a sum of EUR 80,000 to cover the costs of carrying out the public procurement process.81 The Classical Directive on public procurement and the Directive on public procurement in infrastructure.
been steadily increasing). Encouraging the employment of young doctors introduced in 2015 has a very limited reach, given the declining public expenditure on R&D. The reduction of jobs for young researchers lowers the efficiency of public funds invested in their education, and at the same time jeopardizes the future development of research institutions, their international competitiveness and transfer of knowledge to the business sector, and deepens the gap in the age structure of researchers. In the mid- to long term, the falling behind of basic and applicative research in Slovenia is expected, and a stronger move of companies to seek cooperation with foreign research institutions.
Human capital in natural sciences and technology must be more involved in innovative processes in companies. Considering the rapid technological development an adequate number of highly educated staff in science and technology is of utmost importance, as the application and transfer of knowledge from universities to the business sector increases the innovation capacity of companies and of the country in general. Since the beginning of the crisis the number of doctors of science in science and technology has considerably increased, and their share in the total number of doctors of science remains high. The share of science and technology graduates of the total number of tertiary education graduates is also increasing and exceeds the EU average (see Indicator 2.14). Due to the decline of generation for enrolment in tertiary education, their number has been decreasing in recent years. This trend is expected to continue also in the future, so it is necessary to embrace innovative approaches to enable adoption of good practices in promotion activities aimed to increase the enrolment in science and technology studies, and for better cooperation with companies from the local environment (also in the form of scholarships). Encouraging entrepreneurial activities of students and graduates contributes to a better use of acquired knowledge; certain measures have already been adopted in this context. At the Universities of Ljubljana and Maribor, the Demola project has been carried out since 2014, which strengthens cooperation among students of various disciplines and companies, thus increasing the possibility for students to be later employed by these companies. It is imperative that such projects receive support, as currently the education and research spheres give too little consideration to the need of combining the knowledge of social sciences and of natural sciences and engineering in addressing economic, social and environmental issues. Another possibility for transfer of knowledge from universities to the business sector is to employ academic staff in the business sector77.
Innovation activity of the business sector is modest, but the improvement of supportive environment
77 A survey shows that almost two-thirds of academic staff in science and technology are considering finding a job outside the academic sphere (Klemenčič et al., 2015).

46 Development Report 2016Factors of competitiveness
Box 6: Characteristics of Slovenia’s start-up entrepreneurship
After modest beginnings start-up entrepreneurship is gaining momentum in the last two years.1 In 2015, the start-ups in Slovenia2 collected EUR 114 million from various investors, which is twice as much as the year before and as much as in the previous seven years together3. Most investments went to companies with Slovene citizens as co-founders and are mostly located abroad. These companies obtained most of the funds from venture capital funds (94%), and the rest from government funds, crowdfunding, angel investors and start-up accelerators. The majority of start-up entrepreneurs (69%) provide and develop technology solutions for Internet contents and technologies, and a smaller number for education, media and health.
For further development and growth of start-ups need not only financial, but also intangible resources and a supportive and stimulating environment. In the start-up phase of development own financing sources provided by founders are of utmost importance, which is confirmed by the survey on the characteristics of entrepreneurship in Slovenia.4 The survey analysed 156 start-ups established between 2010 and 2015. Business networks, quality human resources and specialist knowledge are key intangible assets for a successful positioning of start-ups on the world market and producing high value added and new jobs. In parallel with the development of a product, start-ups build their trade or a service mark, where specialist skills in design, marketing and sales are vital. The State plays an important role in the financing of start-ups: through the Slovene Enterprise Fund it provides funds to start-ups at favourable rates, depending on their development phase (seed, start-up, growth). In 2007–2014 approx. EUR 60 million funds were granted, resulting in the creation of 1,624 new jobs. In 2016 further EUR 6 million are planned for investing in start-ups.5 In 2015 the first privately funded entrepreneurial accelerator was established in addition to the existing ones, and has already carried out two programmes (smart cities, smart living and health). It is aimed at supporting early-stage companies that have developed an innovative product or service but lack funds to be able to enter the world market. At the beginning of 2016, a first platform for crowd investing was established in Slovenia that supplements the support environment for companies lacking sufficient own funds to finance the realisation of their innovative business ideas. At the same time, the platform enables small investors (EUR 100 to 5,000) to invest in development and knowledge of Slovenian companies and thus contribute to the implementation of innovative projects.
1 Start-up entrepreneurship is based on innovations in products, processes, technology, services, business model or work organisation. These companies have a great potential for high growth, create high value added and new jobs. According to international studies, it is generally agreed that each year approx. 3% of start-ups are established in the total population of companies. For Slovenia, this would mean approx. 400 start-ups per year (Močnik in Rus, 2016).2 Considered are start-ups established in Slovenia and abroad by Slovenian citizens.3 Kupec, 2016.4 Močnik in Rus, 2016.5 Slovene Enterprise Fund -SPS, 2016.
provide for extensive patenting. In the context of rapid technology advancements and sharp international competition companies prefer to place new products on the market as soon as possible instead of engaging in long and expensive patent application proceedings, which represent, in particular for small companies, a huge burden. On the other hand, Slovenia’s companies are more and more aware of the importance of the protection of other aspects of intellectual property (such as trademarks and designs) which are relevant also for service activities.
Slovenia is slow to respond to trends of accelerated digitalisation with horizontal effect Although digital technologies are, because of their extensive use important for the business and public sectors, total investments in ICT are declining. According to latest available data,82 their share in GDP was only 1.8% in 2013, which is approx. 1 pp less than ten years earlier. Information and communication industry (equipment production and services) also invests too little in R&D,
82 OECD STI Scoreboard, 2015.
its share in the total expenditure for R&D of the business sector was only 14% in 2013 (OECD countries average: 25%).83 Internet access and use also fell behind the EU average in 2015, and the gap with the EU average is particularly evident in the usage of the Internet among less educated and older people. People in Slovenia use the Internet with the same frequency as other EU inhabitants for more simple services, while Slovenia legs behind the EU average in the more active use of e-services, such as e-banking, on-line shopping, submitting completed forms to government institutions, which is probably due to lack of appropriate ITC skills (see Indicator 2.16). According to the EU Digital Economy and Society Index Slovenia is ranked 18th among the EU Member States, which is largely attributable to the low share of Internet users that actively use e-government services.84 The shortage of ITC personnel is present throughout the EU, and has become even more acute between 2012 and 2015 in some of the Member States, among which is Slovenia, where more than half of companies have
83 OECD STI Scoreboard, 2015.84 Digital Economy and Society Index (DESI), 2016.
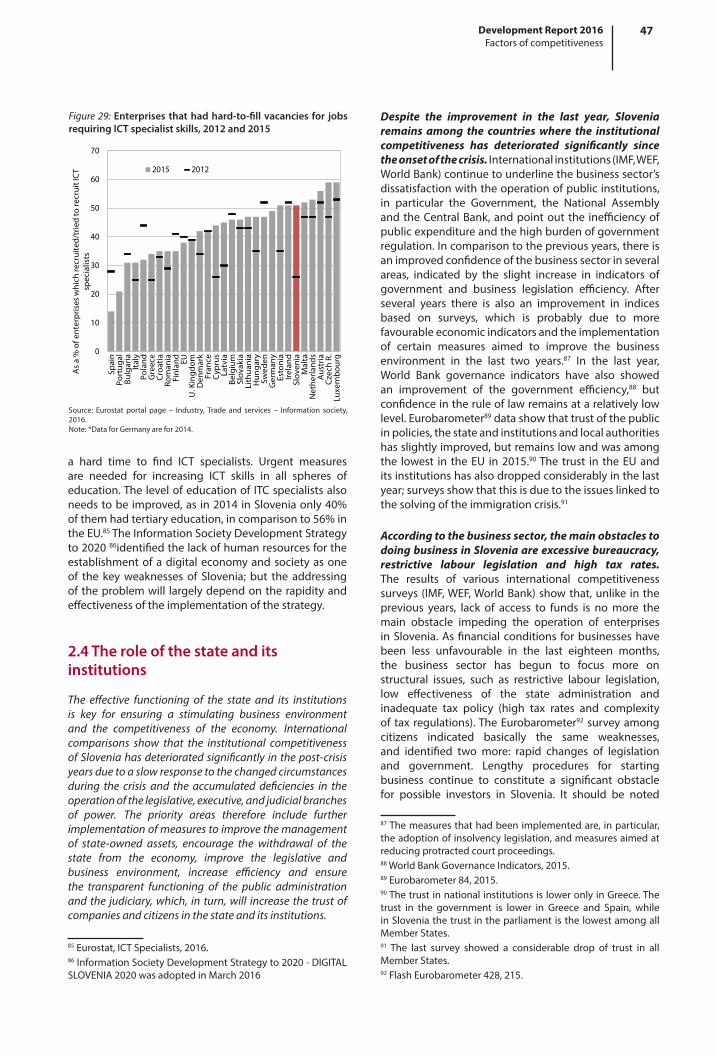
47Development Report 2016Factors of competitiveness
a hard time to find ICT specialists. Urgent measures are needed for increasing ICT skills in all spheres of education. The level of education of ITC specialists also needs to be improved, as in 2014 in Slovenia only 40% of them had tertiary education, in comparison to 56% in the EU.85 The Information Society Development Strategy to 2020 86identified the lack of human resources for the establishment of a digital economy and society as one of the key weaknesses of Slovenia; but the addressing of the problem will largely depend on the rapidity and effectiveness of the implementation of the strategy.
2.4 The role of the state and its institutions
The effective functioning of the state and its institutions is key for ensuring a stimulating business environment and the competitiveness of the economy. International comparisons show that the institutional competitiveness of Slovenia has deteriorated significantly in the post-crisis years due to a slow response to the changed circumstances during the crisis and the accumulated deficiencies in the operation of the legislative, executive, and judicial branches of power. The priority areas therefore include further implementation of measures to improve the management of state-owned assets, encourage the withdrawal of the state from the economy, improve the legislative and business environment, increase efficiency and ensure the transparent functioning of the public administration and the judiciary, which, in turn, will increase the trust of companies and citizens in the state and its institutions.
85 Eurostat, ICT Specialists, 2016.86 Information Society Development Strategy to 2020 - DIGITAL SLOVENIA 2020 was adopted in March 2016
Despite the improvement in the last year, Slovenia remains among the countries where the institutional competitiveness has deteriorated significantly since the onset of the crisis. International institutions (IMF, WEF, World Bank) continue to underline the business sector’s dissatisfaction with the operation of public institutions, in particular the Government, the National Assembly and the Central Bank, and point out the inefficiency of public expenditure and the high burden of government regulation. In comparison to the previous years, there is an improved confidence of the business sector in several areas, indicated by the slight increase in indicators of government and business legislation efficiency. After several years there is also an improvement in indices based on surveys, which is probably due to more favourable economic indicators and the implementation of certain measures aimed to improve the business environment in the last two years.87 In the last year, World Bank governance indicators have also showed an improvement of the government efficiency,88 but confidence in the rule of law remains at a relatively low level. Eurobarometer89 data show that trust of the public in policies, the state and institutions and local authorities has slightly improved, but remains low and was among the lowest in the EU in 2015.90 The trust in the EU and its institutions has also dropped considerably in the last year; surveys show that this is due to the issues linked to the solving of the immigration crisis.91
According to the business sector, the main obstacles to doing business in Slovenia are excessive bureaucracy, restrictive labour legislation and high tax rates. The results of various international competitiveness surveys (IMF, WEF, World Bank) show that, unlike in the previous years, lack of access to funds is no more the main obstacle impeding the operation of enterprises in Slovenia. As financial conditions for businesses have been less unfavourable in the last eighteen months, the business sector has begun to focus more on structural issues, such as restrictive labour legislation, low effectiveness of the state administration and inadequate tax policy (high tax rates and complexity of tax regulations). The Eurobarometer92 survey among citizens indicated basically the same weaknesses, and identified two more: rapid changes of legislation and government. Lengthy procedures for starting business continue to constitute a significant obstacle for possible investors in Slovenia. It should be noted
87 The measures that had been implemented are, in particular, the adoption of insolvency legislation, and measures aimed at reducing protracted court proceedings. 88 World Bank Governance Indicators, 2015.89 Eurobarometer 84, 2015.90 The trust in national institutions is lower only in Greece. The trust in the government is lower in Greece and Spain, while in Slovenia the trust in the parliament is the lowest among all Member States. 91 The last survey showed a considerable drop of trust in all Member States. 92 Flash Eurobarometer 428, 215.
Figure 29: Enterprises that had hard-to-fill vacancies for jobs requiring ICT specialist skills, 2012 and 2015
Source: Eurostat portal page – Industry, Trade and services – Information society, 2016.Note: *Data for Germany are for 2014.
0
10
20
30
40
50
60
70
Spai
nPo
rtug
alBu
lgar
iaIta
lyPo
land
Gre
ece
Cro
atia
Rom
ania
Finl
and EU
U. K
ingd
omD
enm
ark
Fran
ceC
ypru
sLa
tvia
Belg
ium
Slov
akia
Lith
uani
aH
unga
rySw
eden
Ger
man
yEs
toni
aIre
land
Slov
enia
Mal
taN
ethe
rland
sA
ustr
iaC
zech
R.
Luxe
mbo
urg
As
a %
of e
nter
pris
es w
hich
recr
uite
d/tr
ied
to re
crui
t IC
T sp
ecia
lists
2015 2012

48 Development Report 2016Factors of competitiveness
The amended insolvency legislation93 has restricted the protraction of bankruptcy proceedings and the depletion of insolvent debtors’ assets. One of the novelties introduced by this Act is a faster and easier entry into business ownership by creditors as economic owners and consequently gaining control of businesses, which enables the company to continue operating. After the implementation of the new legislation in mid-2013 the number of initiated bankruptcy proceedings instituted against legal entities has risen sharply and has almost doubled last year in comparison to previous years; also the number of bankruptcy proceedings against sole trades has increased.94 As a consequence, the number of non-payers and the volume of amounts due has decreased and payment delays were shortened; however, long-term outstanding liabilities,95 which account for 70% of all outstanding liabilities, remain a big problem. The amended act had also a positive impact on the ranking of Slovenia on the Doing Business scale96 (moving up 29 places to 12th place). The survey highlights a drastic shortening of insolvency proceedings (on average from two years to 0.8 years) and an increase in funds recovered in these proceedings (88.2%), which puts Slovenia among more effective countries. However, certain proceedings in connection with bankruptcy are still very lengthy (see Chapter 2.4.2).
93 The Amending Act to the Financial Operations, Insolvency Proceedings and Compulsory Winding-up Act (2013) which stipulates that no creditor is requested to deposit an advance to cover the initial costs of the bankruptcy proceedings.94 Sole traders and other physical persons performing registered activities and are entered in the Business Register of Slovenia.95 Unpaid obligations exceeding one year.96 The Doing Business survey was carried out in the first half of 2015, considered were data until June 2015.
that they were considerably shortened in the last year. Especially time-consuming are procedures concerning public services that need to go through various levels of decision-making (in particular getting different permits and documents from local authorities) and procedures where numerous stakeholders are involved and there is the possibility of appeal (protracted court proceedings). On the other hand, Slovenia is more successful in terms of the ease of starting a business, highly skilled and educated workforce; in the last year doing business was also simplified by the amended insolvency legislation.
Amended insolvency legislation had a major positive impact on the facility of doing business in Slovenia.
Slika 30: Government efficiency according to the IMD (left) and the WEF (right)
1
2
3
4
5
6
7
2007 2008 2009 2010 2011 2012 2013 2014 2015
Num
ber o
f poi
nts
Legal and regulatory frameworkImplementation of government decisionsTransparency of government policiesAdaptability of government policyBureaucracyBribery and corruptionCentral bank efficiency
1.5
2.0
2.5
3.0
3.5
4.0
4.5
5.0
5.5
2007 2008 2009 2010 2011 2012 2013 2014 2015
Num
ber o
f poi
nts
Property rightsIntellectual property protectionDiversion of public fundsBurden of government regulationPublic trust of politiciansFavouritism in decisions of government officialsWastefulness of government spendingAccess to information on regulations adopted
Source: IMD, WEF. Note: Higher scores are better; maximum score in IMD (left) is 10, and in WEF (right) 7.
Figure 31: Major obstacles to doing business in Slovenia (WEF survey)
Source: WEF.
34.8
0 4 8 12 16 20 24 28
Other
Inflation
Corruption
Policy uncertainty
Access to financing
Tax rates
Inefficient stateadministration
Restrictive labourregulations
% of answers
2015
2014
2008

49Development Report 2016Factors of competitiveness
The Strategy classifies state assets as strategic, significant and portfolio assets based on the pre-determined criteria. The 24 companies considered strategic are those that carry out important infrastructure tasks for the state and manage natural monopolies with the aim of their optimal economic exploitation. In these companies the state will retain or acquire at least 50% ownership, plus one share. The 21 companies considered significant are those that are relevant for broader economic development and play an important role in the integration of companies in supply chains and the internationalisation of the economy. In these companies the state retains a controlling share (25% ownership, plus one share). Additionally, there is a ban on ownership concentration for five important companies – Krka, NLB, Petrol, Pozavarovalnica Sava and Sava – a requirement for dispersed ownership by private owners up to the amount of the total state equity share. The European Commission has noted that strategic and significant assets include companies that in other countries are not usually subject to state ownership.102 The remaining 46 companies with state equity stakes are considered portfolio assets, where the state has no obligation to retain the controlling share. They are managed by the SSH with the sole aim to achieve economic objectives. However, the provision that strategic and significant companies require the SSH’s consent in order to manage their assets may pose a problem. In companies where the state is not the sole owner the SSH has no power to oblige the Supervisory Boards to act accordingly, as it is on equal level with other shareholders.
In 2015 continued the sale of equity stakes in the 15 capital assets of the state which was authorized by the National Assembly. The SSH sold equity stakes in three companies from this list (Adria Airways Tehnika, Elan, Žito) and sales procedures are under way for two more (Nova KBM, Paloma)103. The contract for the sale of 91.6% share of Adria Airways was concluded at the beginning of 2015. The time schedule for the sale of other companies from this list will have to be extended, while two procedures were closed without sale being finalized (Telekom Slovenije, Cinkarna Celje). By end October the SSH managed equity stakes (assets owned by the SSH and state assets managed by the SSH) in 130 companies, of which 100 were the so-called active assets. The annual plan of asset management for 2016 (SSH, 2015) provides for the sale of shares in 33 companies, mostly those considered portfolio assets.
The indirect withdrawal of the state from ownership also continued. The BAMC, which sold 11.7% of its assets in 2014, thus exceeding the statutory requirement of selling one tenth of assets per year, in 2015 completed the transfer and purchase of assets of companies in its portfolio and continued with the process of restructuring
102 European Commission, 2015. 103 The first three companies (Aerodrom Ljubljana, Fotona, and Helios) were sold in 2014.
In the last two years, the perceived level of corruption in Slovenia has dropped slightly. The corruption level assessment in individual countries reflects, in particular, the functioning (or non-functioning) of institutions of the rule of law, and the integrity of the public sector. The Commission for the Prevention of Corruption indicated that the crisis has revealed the long-term development of systemic corruption which allows benefits to be gained to the detriment of public funds and the public interest. This resulted in high perceived levels of corruption, and in a rise of reports of suspected corruption filed with the Commission for the Prevention of Corruption. In the last two years, the perceived level of corruption, according to the Corruption Perception Index97, in Slovenia has dropped but it remains higher than before the crisis. World Bank Governance Indicators which measure corruption show the same picture,98 while the share of companies that were unsuccessful bidders due to corruption99 has decreased in the last two years. This is mainly thanks to the adopted legislation100 which regulated the area and enabled investigative bodies (Commission for the Prevention of Corruption, National Bureau of Investigation) to act more rapidly and efficiently. In January 2015 the Government adopted the updated Programme of Anti-Corruption Measures for 2015-2016, which contains measures addressing corruption risks in the public sector, in particular public procurement, management of public functions and management of state-owned companies. In this context was initiated the audit of certain very large infrastructure projects (TEŠ 6 – Unit 6 of the Šoštanj Thermal Power Plant) and investigation into previous corrupt activities in banking transactions.
2.4.1 The withdrawal of the state from the economy
The adoption of the State Assets Management Strategy in 2015 provided a legal and institutional framework for the withdrawal of the state from company ownership. This should enable the Slovenian Sovereign Holding (SSH) and the Bank Asset Management Company (BAMC) to carry out privatisation. Furthermore, the Amending Act Regulating the Measures of the Republic of Slovenia to Strengthen the Stability of Banks Act101 was adopted, which enables the BAMC to participate more effectively in the procedures of restructuring of debtors and financing of companies in order to increase the economic value of claims. It also contains provisions for improving the management and supervision of the BAMC. The Amended Act has retained the provision that the BAMC must sell at least 10% of the assessed value of acquired assets each year; the life span of the DUTB has been extended by the end of 2022.
97 Transparency International, 2016.98 World Bank Governance, 2015.99 Flash Eurobarometer 428, 2015.100 Integrity and Prevention of Corruption Act (ZIntPK), 2010.101 Amending Act Regulating Measures to Strengthen the Stability of Banks (ZUKSB-A), 2015.

50 Development Report 2016Factors of competitiveness
of companies and debt to equity swaps104. By the year’s end the sale of equity stakes was concluded in four companies, for four more companies the sale is under way, and for other companies the BAMC is accepting offers from potential investors.105 Another channel of the state’s withdrawal from company ownership is the sale of equity stakes and claims against companies owned by banks and other companies directly (the SSH, the BAMC) or indirectly state-owned (NLB, state-owned companies); and the sale of unnecessary assets by indebted companies at their creditors’ request. The volume of transactions carried out in this context is not known, but a comparison between the values of annual FDI inflows106 and of the sale of equity stakes of the SSH and the BAMC leads to the conclusion that the largest part of the withdrawal of the state from company ownership is carried out in this way. Under compulsory settlement proceedings indebted companies sell unnecessary assets and this often results in the take-over of the company.
The future withdrawal of the state from company ownership will depend, among other factors, on the consensus of politics with regard to the divestment of state ownership in companies. The key factor will be, in addition to the sale of the companies remaining on the list of 15 state assets, the effectiveness of the SSH and the BAMC in implementing the annual plan of sale of equity stakes and claims against companies. Equity stakes and claims against the same companies are now owned by the SSH, the BAMC, state banks and companies directly and indirectly-owned by the state. Consequently, their effective management, restructuring and sale will largely depend on good cooperation and coordination among owners, that is the SSH, the BAMC, state banks and companies. Guidelines for restructuring of micro, small and medium-sized enterprises were adopted within the Bank Association of Slovenia in 2015 (see Chapter 1.3.) In compliance with these guidelines the SSH, the BAMC and banks have already coordinated their activities when selling certain companies (Pivovarna Laško, Trimo). In addition to the actual political will to continue the withdrawal of the state from company
104 BAMC's operative objective for 2015 was to conclude the stage of transfer of assets, to improve its strategies of maximising the value of assets by creating, managing and selling investment packages, and by accelerated restructuring of debtors. On 30 November 2015 BAMC owned assets in 26 companies (of which 4 bankrupt). 105 On 30 November 2015 BAMC owned the assets in 26 companies (of which 4 bankrupt); in 2015 it concluded the sale of assets in 4 companies (Pivovarna Laško, Aha Emmi, Sistemska Tehnika Armas, Sistemska Tehnika d.o.o.) and is involved in the sale proceedings of assets of four more companies (Aha Plastik, Litostroj Ravne, Cimos, Adria Airways, Eti).106 As in most transactions buyers are foreign investors, the increase of annual FDI inflows is a good indicator of the actual extent of privatisation in Slovenia. FDI inflows in Slovenia in 2014 amounted to EUR 1,447 million, which is approx. EUR 1,000 million more than the preceding year, and attained EUR 1,184.8 million between January and October 2015.
ownership, further privatisation depends on the interest of foreign investors, which has been expressed for certain companies in the last year.
2.4.2 The functioning of the public administration and the judiciary
The implementation of the programme of measures aimed at eliminating administrative barriers and drafting better regulations continued in 2015. For the last ten years, numerous programmes aimed at eliminating legislative barriers have been implemented and succeeded to considerably reduce administrative barriers. Based on the EMMS methodology 3,500 regulations were reviewed in the period 2009–2010 and administrative burdens in the amount of approx. EUR 1.5 b were identified; the objective of the programme was to reduce administrative burdens by 25% by the end of 2015 (EUR 362 m) and by 5% yearly by the end of 2020. According to available data more than 300 measures have been carried out since 2009, most of them in the areas of finance, statistics, justice and agriculture. The umbrella document in this field is the Single Document for Ensuring Better Regulatory and Business Environment adopted in 2013.107 Currently no estimates are available of the actual savings for businesses and households resulting from the implementation of these measures. Model simulations, however, show positive short and long term effects of reduced administrative barriers on the GDP. According to the IMAD simulation,108 a reduction of administrative barriers by 10% would have a positive impact on the GDP already in the first year of implementation, and after five years the GDP would increase by 0.45%.
Last year, the measure aimed at increasing the efficiency in collecting VAT was implemented under the programme for combating the shadow economy. According to different estimates and methods, the shadow economy in Slovenia in 2010 amounted to between 8.3% of GDP (SURS)109 and 24.3% (23.6% in 2012) of GDP (A. T. Kearney and Johannes Kepler University Linz). In comparison to other Member States Slovenia has good results concerning the tax gap, which shows the difference between the amount of VAT that should, 107 The programme is being consistently upgraded, and on 31 December 2015 there remained 224 measures to be implemented (fully or in part) for the period 2015-2016, while 157 measures were fully implemented (Sixth report on the implementation of measures under the single list of measures aimed at creating a more favourable environment for businesses and increasing competitiveness, 2016)108 The simulation was carried out by using the dynamic stochastic general equilibrium model QUEST developed by the European commission to assess the effects of structural reform measures and also a tool for evaluating the impact of individual structural measures from national reform programmes of EU Member States (Assessing the Effects of Some Structural Measures in Slovenia, 2016).109 Estimated according to exhaustiveness adjustments to GDP, about 80% are from shadow economy.

51Development Report 2016Factors of competitiveness
the programme for combating the shadow economy in 2016, certified cash registers were introduced,112 which will increase transparency of taxpayers’ operations and make concealment of actual turnover more difficult. It is estimated that in the first year after the introduction of this measure tax revenue will increase by EUR 50 to 100 million.113 In 2015 the Act Amending the Companies Act was also adopted with the objective to prevent unfair
VAT Gap in the EU Member States, TAXUD, 2015).112 In 2013 were introduced "virtual" certified cash registers and high penalties for those breaking the law. Following the coming into force of amendments to the Tax Procedure Act the Financial Authority of the Republic of Slovenia (FURS) obtained positive results in the fight against the shadow economy, in particular an increase of income from VAT and other taxes and enhanced voluntary payment of tax liabilities. 113 National Reform Programme 2015–2016, 2015.
in theory, be collected and the amount of VAT that actually is collected and is the indicator of the efficiency of VAT collection in the part revealed through VAT.110 According to the data provided by SURS, the estimated tax gap in Slovenia was 11.4% in 2012, which means that about 88.6% of theoretical VAT was collected.111 Under
110 The VAT theoretical liability represents the tax that would be collected in the tax period if all economic entities calculated and paid VAT in compliance with the applicable legislation. The amount of VAT actually received or paid differs from the theoretical VAT liability because of deliberate or non-deliberate errors in payments, which taken together constitute tax evasion an are a partial indicator of the scope of the shadow economy (SURS, 2015). 111 TAXUD data are internationally comparable; however, due to a different methodology used, the estimate differs slightly from the SURS estimate. According to these data the tax gap is among the lowest in the EU (Study to quantify and analyse the
Box 7: International comparison of public administration efficiency
Public administration effectiveness has a major impact on development and social welfare. Businesses, in order to be effective, need efficient, cost-effective and quality public services which are also a prerequisite to cater to the needs of the public in general. Public spending is efficient and effective when producing maximum possible benefits for citizens, businesses and the state. Following the example of OECD research, the nonparametric method Data Envelopment Analysis was used to measure the effectiveness and efficiency of the public administration. As input we used data on government expenditure for public administration and public order and safety per capita in PPS, minus expenditure for public debt transactions and foreign economic aid. The choice of indicators on direct benefits or results of the public sector was done on the basis of the study by Afonso et al. (2005) which identifies state bureaucracy and administrative barriers, quality of the judiciary, corruption and shadow economy rates as key outputs. Among outputs was also a composite indicator1
using data from product market regulation (OECD PMR indicator), independence and efficiency of the judiciary (WEF) and corruption perception index (Transparency International). Assessment of the tax gap (TAUD) was used as partial indicator of shadow economy. The sample covers 24 EU Member States for which all data are available.2
The empirical study showed that Slovenia could increase the efficiency of public spending in public administration. Results indicate that Slovenia could achieve, with the same level of expenditure per capita, approx. 25% better results, which would be the EU average. At the same time, it could attain the same results by a reduction of funds. A comparison of the expenditure per capita with the World Bank indicator of government efficiency3 shows that comparable Member States are more efficient, while Slovenia could, with the same level of expenditure, achieve results which are one-third better. The difference in results is the consequence of the composition of the indicator, which focuses on government efficiency and effectiveness of its policies that may be affected by the government performance (corruption, judiciary, shadow economy).
Figure: Comparison of government efficiency in relation to public spending for public administration and for public order and safety
Source: Eurostat, World Bank, own calculations. Note: Comparison of government efficiency in relation to public spending for public administration and for public order and safety
AUT
BEL
BGR
CZE
DEU DNK
ESPEST
FIN
FRA
GBR
GRC
HUN
IRL
ITA
LTU
LVA
NLD
POL
PRT
ROM
SVKSVN
SWE
0.0
0.5
1.0
1.5
2.0
2.5
500 1000 1500 2000 2500 3000
Valu
e of
gov
ernm
ent e
ffici
ency
indi
cato
r
Expenditure in PPS per capita
1 Composite indicator (without weights) in compliance with OECD methodology – Handbook on Constructing Composite Indicators (http://www.oecd.org/std/42495745.pdf).2 Excluding Cyprus, Croatia, Luxembourg and Malta, due to the small size of these countries and a lack of data.3 More information available at: http://info.worldbank.org/governance/wgi/pdf/ge.pdf.

52 Development Report 2016Factors of competitiveness
business practices when establishing new companies (such as chain creation of new businesses, establishing of companies by persons breaking the rules on payments for work and unregistered employment and similar).
Court Statistics indicate that the efficiency of courts is steadily rising, but the trust in the judiciary remains low. The number of unresolved cases dropped in almost all courts in 2015, and in general the number of resolved cases was greater than the number of incoming cases.114 The average time for the adjudication of cases also continued to shorten, and was 2.7 months in 2015.115 The length of proceedings for settling civil and economic litigations is similar to that in other EU Member States.116 However, also in courts where proceedings are generally rapid, bankruptcy proceedings continue to be lengthy.117 Bankruptcy-related cases are pending before the court as unresolved until the completion of the bankruptcy proceedings; the court has no direct influence on the course of the proceedings after the decision on initiating bankruptcy proceedings is issued.118 Bankruptcy proceedings against a legal person last 20.9 months on average and personal bankruptcy proceedings last 61.5 months on average, while compulsory liquidation proceedings and simplified compulsory liquidation proceedings are considerably shorter. In compliance with the set goals the number of judges was also reduced in the past two years (2015: 44.3 per 100,000 population), but remains among the highest in the EU119. Public trust in the judiciary is relatively low.120 Persons who are involved with the judiciary report that they have confidence in the system and are satisfied with the rapidity of solving cases, while certain survey-based international researches indicate that confidence in the judiciary is low. Particularly worrying, in comparison to other Member States, is the inefficiency of the legal framework in settling disputes. Good practices in the judiciary are also surveyed by the World Bank (Doing Business), Slovenia is within the EU average.
114 In 2015 the clearance rate indicator exceeded 100%, which means that courts resolved more cases than they received; it was 107% for all incoming cases and 105% for cases of major importance.115 In 2011 the average time needed to resolve cases was 4.6 months (2014: 3.3 months). Between 2011 and 2015 the average time needed to resolve cases of major importance dropped from 8.7 to 7.4 months. 116 EU Justice Scoreboard, 2015.117 In 2015 the procedure for issuing a decision on initiating bankruptcy proceedings (introduction of bankruptcy) lasted 49 days on average for bankruptcy proceedings against a legal person and 20 days for personal bankruptcy proceedings.118 Including realisation of a bankruptsy estate and repayment of creditors; or expiry of the period of suspension for write-off of debt for personal bankruptcy proceedings.119 The objective is to have 42 judges per 100,000 population by 2020. 120 Public satisfaction with Slovenia's judiciary (Zadovoljstvo javnosti z delovanjem slovenskih sodišč), 2014.
The Strategy for Development of Public Administration 2015–2020 could have a positive impact on the effectiveness of the public administration. The objective of the Strategy is to enhance the quality and efficiency, transparency and responsibility of the public administration, thus improving the business environment for the economy and encouraging competitiveness growth. The adoption of the Strategy was one of the conditions for Slovenia to be able to draw from EU structural funds.121 It should be noted that the setting up of a system of indicators for regular monitoring of progress will be of paramount importance. The European Commission has also underlined the need for better coordination among stakeholders.122
2.5 Challenges
The key competitiveness challenge to be addressed is productivity growth, assisted by enhanced long-term factors such as innovations, human capital and stimulating business environment. After a significant deterioration during the crisis, the cost and price indicators of competitiveness have recently much improved. Higher exports competitiveness resulted in better inclusion in international trade flows, and export structure is also improving. However, these positive changes are still insufficiently supported by the rise in productivity, which would provide for a more lasting improvement in the competitiveness and would enable a swifter converging towards more developed countries. Corporate deleveraging, growing profits, and restored stability of the banking system has recently much improved the environment for
121 Partnership Agreement between Slovenia and the European Commission for the period 2014–2020, October 2014.122 Slovenia – Review of progress on policy measures relevant to the correction of macroeconomic imbalances, December 2015.
Figure 32: WEF indicators of efficiency of the judiciary in Slovenia
Source: WEF. Note: A higher score is better; the maximum score is 7.
2.0
2.5
3.0
3.5
4.0
4.5
5.0
2008 2009 2010 2011 2012 2013 2014 2015N
umbe
r of p
oint
s
Independence of the judiciaryEfficiency of the legal framework in settling disputesEfficiency of the legal framework in challenging regulations

53Development Report 2016Factors of competitiveness
new investments; foreign direct investments have also increased and could boost productivity. Although Slovenia is witnessing a rise of these, mostly short-term, productivity growth factors, investments in long-term factors, such as innovation capacity, digital economy and human capital remain a challenge. It is essential to ensure that the government will play an effective role in supporting competitiveness.
Complementary, stable and systemic measures are needed to strengthen factors that have a bearing of innovation capacity. The present situation, in which public expenditure for R&D is decreasing and synergies between the scientific and research and the business sectors are underexploited, shows poor understanding of a long-term positive impact of investments on innovation capacity, which remains modest. Stopping the plunge of public sector expenditure for R&D is a must if we want to preserve the competitiveness of public research institutions, which through their basic and applicative research contribute to the transfer of knowledge in to the business sector and, consequently, to its increased value added. Support for employment of young researchers for whose education substantial funds have been invested is paramount for two reasons: use of their knowledge and addressing the issue of ageing research community. Another challenge to be tackled is strengthening cooperation among the research sphere and the business sector by greater inclusion of small companies and provision of a favourable business environment; this will enable a great number of high-technology companies a rapid growth in Slovenia, and also contribute to increase the share of products and services with greater value added. Rapid digitalisation trends demand higher investments in digital technologies; in this context providing an adequate number of ICT staff which would boost efficient use of these technologies and increase the information literacy competencies among the population remains a challenge. These issues could be effectively addressed also through the use of European funds earmarked for the implementation of Innovation Strategies for Smart Specialisation, which must start as soon as possible and be as effective as possible.
Better use of human capital is also needed for greater competitiveness. Efficient use of human capital remains an issue regardless of the fact that the educational structure of the population has largely improved in recent years. Not only there is a major imbalance of offer and demand of tertiary educated people, also the scope of their employment in the private sector is too modest; and the harsh conditions on the labour market resulted in a growing emigration of this population. Taking into consideration the decline in the size of generations for enrolment in tertiary education (demographic changes) and the anticipated growing needs of the industry for highly educated workforce, the major future challenge will be to ensure a sufficient number of persons with appropriate qualifications and skills. Addressing this
challenge will demand: (i) greater attention to be paid to the needs for qualifications and skills in the planning of study programmes, and enhance acquisition of practical skills; (ii) an improvement to the quality of the study, including by increasing private expenditure; and (iii) the establishment of a close connection between the amount of public funds received by higher education institutions and their achievements in the field of quality, employability of graduates and efficiency.
Further reduction of administrative barriers and consistent implementation of the agreed measures are important to ensure good performance of the economy and a stimulating business environment. In the past two years there were advancements in certain key areas, such as lowering of administrative barriers and reduction of the shadow economy, amendment of insolvency legislation and increased efficiency of the judiciary. Despite the progress, institutional competitiveness remains low. The public administration strategy, adopted in 2015, is the first step in the right direction; however, any improvement of government efficiency will depend on how consistently the strategy is implemented. This is also true for the programme of lowering administrative barriers, where lengthy proceedings in a number of areas continue to be the most important issue. Progress with regard to the deregulation of professional services also remains too slow. Moreover, competitiveness has been hindered by the state’s inadequate involvement in the economy. Establishing an effective state asset management system, including further privatisation of state-owned enterprises therefore remains an issue that urgently needs addressing.

54 Development Report 2016Demographic trends and the welfare state
3. Demographic trends and the welfare state
Preserving the welfare state, while taking into account demographic trends, is one of the important factors in terms of improving the quality of life and well-being of the population. Despite the crisis, which led to a deterioration in the material living conditions, Slovenia has been able to maintain, by international comparison, a relatively high level of social inclusion and access to public services and low income inequality. In 2014, when the economic recovery began to take hold, the situation in the labour market began to improve, and the material situation of the population stopped deteriorating. The major challenge is to adjust social protection systems to the ageing population, so that they would continue to provide social security, access to public services and social inclusion for all population groups. With a view to achieving higher employment and improving quality of life, it is crucial to improve flexicurity in the labour market to ensure an effective allocation of labour force and reduce labour market segmentation.
There has been a shift in the demographics of Slovenia towards a higher proportion of older people in the population, which requires society as a whole to adapt accordingly. Like other developed countries, Slovenia is facing the challenge of an ageing population, which requires it to adjust its social protection systems and many other policies that may affect quality of life. In Slovenia, the proportion of older people (aged 65+) is currently lower than the EU average; however, EUROPOP2013 population projections forecast it to exceed the EU average in 2021. According to the long-term projections123 of age-related expenditure (pension, health care and long-term expenditure), made under the assumption that social protection systems do not adapt
123 Ageing report, 2015.
to demographic changes, Slovenia is projected to see the largest increase in age-related expenditure by 2060 among the EU Member States. All of this points to the urgent need for a response to these changes, which, in addition to the adjustment of social protection systems, should include other relevant policies and systems, including the labour market policy, education policy and migration policy.
The proportion of older people (aged 65+) is increasing, while the number of working-age persons (aged 20–64), on the other hand, is decreasing – a trend that will increasingly affect the labour market in the future. This is the result of a large number of births in the post-war period, the low birth rate since the beginning of the 1990s and a longer life expectancy. Accordingly, the age-dependency ratio is increasing (see Indicator 3.3). Although it is currently lower than the EU average, EUROPOP2013 projections forecast that it will exceed the EU average in 2022. The number of working-age people (aged 20–64), which represent the potential of the economically active population, has been decreasing since 2012. By 2030, the number of older people in Slovenia is expected to increase by 10,000 on average each year, while the number of working-age people is expected to decrease by almost the same amount. Our estimates of the demographic effect show that, in the coming years, a decrease in the number of working-age people could slow down the growth of the number of persons in employment that is unrelated to the economic situation. Scenarios for demographic shifts in the population and the number of employed persons show that after 2020, despite an increase in activity rates, demographic effects will be an increasingly limiting
Figure 33: The number of working-age people and older people and the old-age dependency ratio, Slovenia
Source: SURS, EUROPOP2013, calculations by IMAD, 2015.
19.522.0
24.025.7
28.5
34.1
44.6
51.7
58.9 58.3
0
200
400
600
800
1,000
1,200
1,400
0
10
20
30
40
50
60
70
1995
2000
2005
2010
2015
2020
2030
2040
2050
2060
Num
ber
Ratio
Older people aged 65 and overWorking-age people aged 20-64Old-age dependency ratio (65+/20-64*100)
Figure 34: Scenario for an increase in the number of active and employed persons, Slovenia
Source: Eurostat, EUROPOP; calculations by IMAD.Note: *The simulation of labour market participation is based on the following scenario of an increase in the active population due to: (i) the continuation of the upward trend in the number of highly educated people; (ii) an increase in the (lower) activity rate of women so that it will reach the (higher) activity rate of men by 2030; and (iii) an increase in the activity rate of older people by 20 pp by 2030.
700
800
900
1,000
1,100
1,200
1,300
1,400
2000
2005
2010
2015
2020
2025
2030
Num
ber,
in th
ousa
nds
PopulationEmployed personsEconomically active population (employed + unemployed)
Scenario of an increase in the economically active population*
Scenario of an increase in the economically active population +1%/year

55Development Report 2016Demographic trends and the welfare state
factor in maintaining a moderate increase in the number of employed persons.
3.1 Labour market
The material living conditions have been improving and the welfare of the population has been increasing due to growth in employment and wages. A more effective allocation of labour force, together with the reduced age-based segmentation of the labour market can also contribute to this process. The situation on the labour market worsened during the crisis and somewhat improved in the last two years during the economic recovery. However, the segmentation of the labour market remains a problem despite changes relating to labour market regulation since new jobs are mainly due to the growth of temporary forms of employment. The challenge is establishing a system of flexicurity in the labour market which would contribute to an effective allocation of labour force and reduce segmentation.
After a decrease during the crisis, the number of employed persons again increased during the economic recovery in the last two years. In the period 2008–2013, the number of employed persons decreased the most in construction (by more than a third) and manufacturing (by a fourth), as these two sectors saw the largest decline in activity during the crisis. Following the improvement in economic conditions in 2014 and 2015, as in other countries in the EU, the number of employed persons increased particularly in medium-tech manufacturing industries, accommodation and food service activities, transport and trade. Employment through employment agencies increased significantly, with most labour being dispatched to manufacturing. The fact that in 2015 the employment activities sector, which includes employment agencies, still significantly contributed to the total growth in the number of employed persons indicates that there is still caution among employers when it comes to hiring workers and that there is a need for more flexible forms of employment.
After a decrease during the crisis, the employment rate is again on the increase, which may improve the material living conditions of the population. An increase in the employment rate is recorded in all age groups. A higher employment rate of people aged 55–64 was due to the pension reform and the demographic effect of employed people entering the group of older workers, thereby increasing the employment rate of
older people. However, the employment rate of older people continues to be among the lowest in the EU, thereby undermining the long-term sustainability of the pension system. After significantly decreasing during the crisis, the employment rate of low-skilled workers has been increasing most rapidly in recent years. This is due to the structure of the economic recovery, which is based mainly on the export of manufacturing, which employs a large proportion of low-skilled workers. Accordingly, the proportion of low-wage earners increased,124 slowing down the average wage growth in the private sector.
In line with the economic recovery, in 2015 the unemployment rate decreased for the second year in a row, although it remains twice as high as in 2008. The unemployment rate had increased considerably by 2013 due to a drop in economic activity (see Indicator 3.5). In response to the economic recovery in 2014 and 2015, unemployment decreased at a relatively fast rate, which was also characteristic of most other EU countries.125 The rapid response of the labour market to the improved economic conditions is attributed to the improvement in domestic and international economic conditions, the increased competitiveness and a slower increase in the number of hours worked compared to the increase
124 According to OECD methodology, these are employees earning an amount equal to or less than two-thirds of the median income. According to the latest comparable data of Eurostat, the share of low-wage earners employed with legal entities (17.5%) ranks Slovenia near the EU average (17.0%; 2010).125 According to the EC analysis (2015), most EU countries unemployment decreased relatively more rapidly and to a greater extent than anticipated based on the historical empirical relationship between the GDP and unemployment (Okun's law). In Slovenia, the extent of the response of unemployment was similar to that anticipated considering the level of economic growth.
Table 3: Changes in the number of employed persons (in %), Slovenia
2008 2009 2010 2011 2012 2013 2014 2015
Total 3.0 -2.4 -2.7 -1.3 -1.7 -2.0 0.5 0.9
Public services (O–Q) 1.8 2.0 2.1 0.8 0.8 -0.9 0.5 0.7
Private sector (A–N, R–T) 3.2 -3.4 -3.8 -1.9 -2.4 -2.3 0.5 0.9
Source: SURS.
Figure 35: Employment and unemployment flows
Source: Eurostat.
0
4
8
12
16
20
24
28
-4
-3
-2
-1
0
1
2
3
Q1
11
Q1
12
Q1
13
Q1
14
Q1
15
% o
f all
unem
ploy
ed
Num
ber o
f per
sons
, in
thou
sand
s, 4
-qua
rter
cum
ulat
ive
Net flows from employment to unemployment, left axisEmployment rate, right axis

56 Development Report 2016Demographic trends and the welfare state
young people in the last two years is attributed to the increased demand for student work, to the fact that the active labour market policy has focused more on young people,129 and to demographic trends.130 The persisting problem of young people struggling to enter the labour market is reflected in the still high unemployment rate and the proportion of people who are neither in employment nor in education, which remains higher than before the crisis (see Indicator 3.8).
Due to increased labour demand, the employment of long-term unemployed increased; however, the long-term unemployment rate still remains high. Due to the prolonged period of weak economic activity and modest demand for labour force, the long-term unemployment rate in Slovenia increased considerably after 2009, when it was at its lowest point, and remains considerably higher than before the crisis despite the decrease in 2015 (see Indicator 3.5). The share of long-term unemployed in total unemployment also remains high, with every second unemployed person being unemployed for at least one year. The rate of outflow
in public service activities. In the period 2013–2015, however, the volume of student work increased by 8.5% despite the introduction of social contributions, which made this form of work more expensive in 2015.129 IMAD simulations show that increasing the amount of funds for active labour market policies to the average of OECD countries could in five years increase the employment rate of young people by 0.5 pp, total employment by 0.4% and the level of potential GDP by 0.2% (for more, see Assessing the Effects of Some Structural Measures in Slovenia, 2016).130 According to the LFS, the number of young people has declined in recent years, which together with an increase in the number of employed young people resulted in an increase in the ratio of the number of employed people to the number of all young people in this age group, which represents the employment rate.
in the number of employed people. The higher rate of transition126 from unemployment to employment and the higher job-finding rate127 indicate that prospects for employment have increased in the last two years. Despite the decrease in the last two years, the unemployment rate last year remained considerably above the pre-crisis level.
Although the unemployment rate of young people has decreased in recent years, the issue of young people struggling to enter the labour market is a burning one. During the crisis, the increase in the unemployment rate of young people (aged 15–24) in Slovenia exceeded the EU average; the unemployment rate reached its peak in 2013 (21.6%, based on an LFS) and, although remaining high, is on the decrease ever since (see Indicator 3.5). The worsening of the situation of young people during the crisis was, in addition to the general low demand for labour and the mismatch between the education system and labour market needs, also due to fact that young people are more likely to be employed under temporary contracts (fixed-term employment contracts and student work128). The reduction in the unemployment of
126 The net flows of transition from employment to unemployment reflect the difference between the number of workers transitioning from employment to unemployment and the number of workers transitioning from unemployment to employment. The net flows are negative when the outflow from unemployment exceeds the inflow into unemployment, which is reflected in the reduction in the number of unemployed.127 The job-finding rate may be interpreted as the probability of transition from unemployment to employment in a particular quarter. It is expressed as a percentage of unemployed persons who were unemployed in the previous quarter and entered into employment in the next quarter.128 The volume of student work decreased by 35.7% in the period 2008–2013. In addition to reduced demand, the decrease in the volume of student work could be due to the increase in concession fees in mid-2012 and the restriction of student work
Figure 36: Unemployment outflow rate with regard to unemployment duration (left), and the Beveridge curve (right), Slovenia
3
4
5
6
7
8
9
10
11
12
Q1
08
Q1
09
Q1
10
Q1
11
Q1
12
Q1
13
Q1
14
Q1
15
Rate
of o
utflo
w fr
om u
nem
ploy
men
t, 4-
quar
ter m
ovin
g av
erag
e, in
%
Less than 3 months Between 3 and 6 monthsBetween 6 and 12 months From 12 to 48 monthsGroup average
Q1 08
Q1 09
Q1 10
Q1 11
Q1 12
Q1 13
Q1 14Q4 14
Q1 15 Q2 15
Q3 15
Q4 15
0
5
10
15
20
25
30
35
40
45
4 5 6 7 8 9 10 11
Lab
our s
hort
age
indi
cato
r
Survey unemployment rate, in %
Beveridge curve
Period Q1 2000 - Q4 2007
Period Q1 2008 - Q4 2015

57Development Report 2016Demographic trends and the welfare state
from unemployment131, which in the case of the long-term unemployed began to increase in mid-2014, indicates that the employment prospects for the long-term unemployed have improved. This is also confirmed by the movement of the Beveridge curve,132 which measures the mismatch between labour supply and demand. Since 2013, the Beveridge curve has shifted to the left and upwards, indicating no increase in the mismatch, but rather a pro-cyclical and positive turn with a decrease in unemployment and a slight increase in the labour shortage indicator due to increased aggregate demand. The estimate of the natural unemployment rate,133 which, besides the Beveridge curve, is most frequently used for estimating the structural component of unemployment, shows only a modest increase in the natural unemployment rate during the crisis.
Legislative changes in the labour market regulation had no substantial effect on reducing labour market segmentation.134 Labour market segmentation has been a persistent problem. The main factors in the frequent use of temporary employment are the possibilities for using temporary contracts, the rigid regulation of hiring and dismissal, and the uncertainty regarding demand. High segmentation may lead to a greater inequality among workers, a higher volatility of hiring and dismissal, and reduced incentives for investing in workers by companies.135 On the other hand, a segmented market
131 The rate of outflow from unemployment is calculated on the basis of the monthly probability that an unemployed person might exit unemployment and is expressed by the share of all unemployed persons. The calculation is made by way of aggregate data calculated from the number of unemployed persons with respect to the duration of unemployment; these data are obtained from the LFS. For methodology, see Elsby et al. (2011). The rate of outflow from unemployment is not the same as the job-finding rate, with the former being merely an indirect estimate of all outflows from unemployment, whereas the latter takes into account exclusively actual outflows to employment.132 The Beveridge curve shows a connection between the surveyed unemployment rate and the labour shortage indicator and represents labour demand and supply in consideration of the frictions in their matching. When economic activity declines, unemployment grows and reduces the labour shortage indicator, while the opposite happens in the event of recovery of economic activity. Such pro-cyclical movement is typical of movements along the Beveridge curve, with the curve shifting to the right and upwards, indicating greater supply and demand mismatch, and to the left and downwards, indicating that the mismatch has declined. In Slovenia, no significant movement in the Beveridge curve is evident in the long run.133 The natural rate of unemployment (NAWRU) is an unemployment rate which coincides with a stable inflation rate (stimulated by the growth in labour costs). It is estimated by using the New Keynesian Philips Curve method, which presumes a negative relationship between cyclical unemployment and the expected growth of real labour costs per unit of output. For a more detailed estimate of the cyclical and structural component, see Development Report 2014.134 Segmentation according to the type of employment (temporary employment or permanent employment).135 Lepage-Saucier, 2013.
is more susceptible to negative shocks. In 2013, new legislative amendments were adopted to reduce the segmentation of the labour market and enhance its flexibility.136 They reduced the level of employment protection, which, according to the OECD’s estimate, is reflected in the decrease in the employment protection legislation index for regular workers against individual dismissal (EPR) from 2.39 to 1.99, which is below the OECD average137. The share of temporary employment138 in total employment decreased after legislative amendments were adopted in 2013 and again increased in 2014 and 2015, particularly among young people. The volume of student work is increasing despite the fact that this form of work was made more expensive for employers, and is the main reason why the share of temporary employment is highest among young people (aged 15–24) and is the highest in the EU. In our view, the new increase in temporary employment was also due to companies exercising caution when it comes to employment, which reflects the need for flexible forms of work139 (see Indicator 3.6). Similarly, after decreasing in 2013, the share of new fixed-term contracts in the total number of employment contracts increased in the last two years.140
In 2015, the average wage was higher than before the crisis, which is favourable in terms of the material conditions of the population; its growth trend was influenced by certain legislative amendments and urgent austerity measures. The introduction of the renewed salary system in the public sector, which, by eliminating wage disparities, led to a significantly higher wage growth just before the crisis, contributed
136 In April 2013, the new Employment Relationship Act (ZDR-1) and amendments to the Labour Market Regulation Act (ZUTD-A) entered into force. 137 The employment protection legislation index runs from 0 to 6, with higher scores representing stricter regulation.138 In addition to fixed-term employment contracts, temporary employment includes student work and other forms of work (the source of data is the LFS).139 Employment through employment agencies and student work further increased.140 These are data on new employment contracts according to the Statistical Register of Employment.
Table 4: Share of fixed-term employment contracts in the total number of new employment contracts, Slovenia
Total aged 15–29 aged 30–54aged 55 years
and over
2008 73.2 81.1 66.7 64.8
2009 72.0 81.9 65.3 62.2
2010 74.9 84.0 68.9 68.5
2011 75.0 84.8 69.4 66.4
2012 72.1 85.7 65.6 62.3
2013 73.2 82.3 68.5 70.6
2014 72.7 78.1 69.5 75.5
2015 74.7 81.1 70.8 77.1
Source: SURS, SRDAP, calculations by IMAD.

58 Development Report 2016Demographic trends and the welfare state
minimum wage increase in 2010. After 2013, wage growth again lagged behind productivity growth. The outpacing of productivity growth at the beginning of the crisis indicates the inadequate wage flexibility, which is also the result of the wage setting and adjustment method, including the minimum wage. The challenge is therefore to create a wage system in the public sector that will provide for appropriate performance-related incentives and sufficient adjustment of wages to the changed economic situation. In the private sector, development towards a greater extent of negotiations on wages at the level of enterprises would be desirable.
3.2 Social protection systems and their long-term sustainability
At present, social protection systems still provide a high level of social security, the above-average availability of the health care system and reduce the risk of poverty. However, due to a slowdown in economic growth and the ageing of the population, there have been growing pressures on public funds for the financing of such systems. The 2013 pension reform temporarily slowed down the rise in the number of old-age pensioners, but failed to considerably improve the sustainability of the pension system in the long run. Needs in health care and long-term care have been rapidly growing, whereas the reforms of the respective systems have been in preparation for over a decade. The challenges facing social protection systems are linked mainly to the adjustment of their financing to the reduction in the share of economically active population and the ageing of the population, continuous improvement in the efficiency of the health care system and the strengthening of preventive activities, and the regulation of a comprehensive long-term care system.
After increasing at the beginning of the crisis, social protection expenditure declined in 2012 and 2013 as a result of changes to social legislation and intervention measures. After a significant decline in economic activity at the beginning of the crisis, social protection expenditure, as a % of GDP, increased from 21% in 2008 to 24.9% in 2013. The largest share is accounted for by
to maintaining the consumption level of the population during the first years of the crisis. In addition, growth in general government expenditure increased in the period when revenues were declining due to the worsening of the economic situation, thereby contributing to an increase in the general government deficit (see Chapter 1.2). Austerity measures that were urgently required to consolidate public finances were necessary in this area as well; however, they came into force relatively late (in mid-2012), terminating most of the stimulating wage system elements. These measures were then extended into the subsequent years, which poses a problem of a lack of an appropriate system for rewarding public sector employees. In recent years, private sector wage growth has been significantly influenced by the economic crisis and changes in employment structure,141 in addition to the legislative amendments to the minimum wage regulation. A significant increase in the minimum wage in 2010 improved the material conditions of minimum wage earners on the one hand, and significantly impeded the adjustment of wages to the crisis on the other, thereby worsening the cost competitiveness of the economy and reducing employment. A high increase in the minimum wage also significantly increased the ratio between the minimum and average wage (see Indicator 3.7). This is high compared to other countries, also due to a relatively low average wage, which reflects the generated value added of the economy. The definition of the minimum wage changed at the end of 2015 with the exclusion of three bonuses for unfavourable working time; however, it turned out that a major part of the gross wage increase was offset by a higher income tax.
In terms of competitiveness and development, it is important that wage growth is in line with labour productivity growth. In the 2008–2010 period, wage growth was higher than productivity growth, which was mainly the result of the public sector wage system review, the high private sector wage adjustment (to past productivity and inflation) in 2008 and the statutory
141 In the first years of the crisis, the dismissal of low-wage employees led to higher average-wage growth, while in 2014 and 2015 the average wage growth slowed down due to new employment of low-wage workers.
Table 5: Gross wage growth, private and public sector, Slovenia
YearNominal growth in gross wage per employee (in %) Real growth in gross wage per employee (in %)
TotalPrivate sector
Public sector
– of which the general government sector
TotalPrivate sector
Public sector
– of which the general government sector
2008 8.3 7.8 9.7 10.2 2.5 2.0 3.8 4.3
2009 3.4 1.6 5.3 7.0 2.5 0.7 4.4 6.0
2010 3.9 5.6 0.8 0.0 2.1 3.7 -1.0 -1.8
2011 2.0 2.6 1.0 0.0 0.2 0.8 -0.8 -1.8
2012 0.1 0.5 -0.9 -2.2 -2.4 -2.0 -3.4 -4.7
2013 -0.2 0.6 -1.3 -2.5 -2.0 -1.2 -3.0 -4.2
2014 1.1 1.4 0.9 0.6 0.9 1.2 0.7 0.4
2015 0.7 0.5 1.2 1.0 1.2 1.0 1.7 1.5
Source: SURS.

59Development Report 2016Demographic trends and the welfare state
expenditure on old age (42.3% or 10.3% of GDP), which increased significantly in the period 2008–2013 for demographic reasons and due to the increase in the number of pension recipients before the entry into force of the pension reform in 2013, with further increase being prevented by the restriction of pension indexation. The reduction in total expenditure in 2012 and 2013 was attributable to changes in social legislation and austerity measures to achieve fiscal balance.142 Slovenia is one of the countries whose social protection expenditure is lower than the EU average (see Indicator 3.9) but nevertheless ensure a high level of social security and above-average accessibility of the health care system.
The population ageing, along with unchanged policies and systems, exacerbates the problems in ensuring stable funding of social protection expenditure. The transfer from the state budget to the Pension and Disability Insurance Institute of Slovenia (PDII), which accounts for 30% of all the revenue of the PDII, indicates that there are already problems with financing the pension system.143 The projections of the European Commission generated in March 2015 (for more, see the 2015 Development Report) show that, without changes to the relevant policies, the effect of ageing on public expenditure would be very strong, because in 2013–2060 the share of age-related expenditure in GDP would increase the most among all EU Member States. Compared to other EU Member States, the increase in pension expenditure in Slovenia is significantly higher, and Slovenia also exceeds the EU average in the growth of expenditure on health care, long-term care and education. This is the result of Slovenia’s demographic trend, as approximately by 2050 larger generations will be retiring, and they will be living longer in retirement because of higher life expectancy (under the current retirement conditions). At the same time, smaller generations will enter the labour market, which will significantly increase the ratio of the number of pensioners to the number of ensured persons. The new pension legislation has not yet tied the retirement age to rising life expectancy144 and has not yet introduced
142 The Fiscal Balance Act and the Exercise of Rights from Public Funds Act, which entered into force in 2012. 143 In 2015, the total transfer from the budget to the PDII totalled EUR 1,461.4 million, of which EUR 298.6 million to cover the State's current obligations towards the PDII and EUR 1,162.8 million to cover additional obligations (mostly to cover the differences between the revenues of the Institute from contributions and from other sources and the expenditure of the Institute – Article 162 of the ZPIZ-2).144 IMAD simulations show that, compared to the current system, tying the retirement age to life expectancy (under the formula of increasing the retirement age and the years of pensionable service by 2/3 of the life expectancy gains every five years after 2020) would result in reduction in pension expenditure as a share of GDP by around 0.7 pp by 2060, and provided that pensions are indexed to 50%, by a good 4 pps (the simulation was made using the SURS microsimulation model). The aforementioned simulation shows that this measure could reduce expenditure, but is not sufficient to ensure the long-term sustainability of the system and should therefore be combined with other measures.
other major limits on expenditure as is the case in some other EU Member States. The relatively high increase in expenditure on health care and long-term care has not only been affected by the ageing population but also by other non-demographic factors.145
Pension expenditure146 has grown more slowly in recent years as a result of intervention measures; however, insufficient short-term and long-term sustainability of the pensions system remains a major problem. Pensions had not been indexed in accordance with the envisaged legislative provisions since 2012147, and the annual allowance remained limited in 2015, but expenditure increased as a result of the increase in the pension threshold for entitlement. However, the budgetary transfer to the PDII budget accounts for around 30% of the revenues of the PDII (see Indicator 3.12), which is becoming an increasingly serious problem in terms of reaching the budget deficit target. Long-term projections of pension expenditure show that the latest reform, which became applicable in 2013, has only postponed the increase in expenditure, because
145 Non-demographic factors in health care include, in particular, technological progress, institutional characteristics of health care systems, and the higher health expectations of the population. In addition to GDP growth per capita and changes in relative prices for long-term care services, non-demographic factors in long-term care include greater transition from informal to formal care and an increase in expenditure per long-term care recipient. 146 According to data from PDII balance sheet of the Ministry of Finance, which cover the following types of pensions: old-age, disability, survivor's, farmer's and military pensions, pensions received from former states of Yugoslavia, pensions remitted to former states of Yugoslavia, pensions remitted abroad, recreation allowances to pensioners, other pensions.147 With the exception of 2013, when they were indexed by 0.1%
Figure 37: Projections of public expenditure on pensions, health care and long-term care, Slovenia
Source: The 2015 Ageing Report, 2015. Note: It shows the AWG base scenario, which is taken into account in assessing fiscal sustainability as part of the surveillance of fiscal policies of EU Members States.
11.8 11.112.3
14.315.6 15.3
5.7 5.9 6.4 6.8 6.9 6.8
1.4 1.7 1.9 2.4 2.7 2.9
18.9 18.8
20.6
23.525.2 25.0
0
5
10
15
20
25
30
2013 2020 2030 2040 2050 2060
Shar
e in
GD
P, in
%
Pensions Health careLong-term care TOTAL

60 Development Report 2016Demographic trends and the welfare state
the expenditure as a share of GDP will start to increase after 2022. This will be mainly due to a rapid rise in the share of people aged 65 and over, which will exceed the average share of older people in the EU after 2020; at the same time, the working age population will decrease and the old-age dependency ratio (see Indicator 3.3) will significantly increase. This is why a new reform, one that will address the issue of long-term sustainability of the pension system to a greater extent, will have to prepared as soon as possible. In addition, it would be necessary to provide more comprehensive information to the Slovenian population about the consequences of the ageing populating and the rights arising from compulsory insurance, and encourage private saving for old age. From this point of view and in the light of providing decent pensions, the challenge that remains is the development of measures to encourage people to take greater personal responsibility for their own social status.
After the entry into force of the pension reform, the rise in the number of pensioners148 slowed down, and the average pension was again lower. The number of old-age pensioners began to increase at a slower rate, while the number of other categories of pensioners is decreasing.149 We estimate that the rise in the number of pensioners, which increased considerably before the adoption of the ZPIZ-2 and in the year following its adoption, slowed down due to the effect of (the adoption of ) the reform. However, in the following years, this effect is expected to decrease gradually as people who had to postpone their retirement due to stricter retirement conditions after the adoption of the new Act will began to retire. This is why the retirement age of new pensioners is expected to slowly increase. Average pensions continue to decline due to the restrictive pension indexation policy.
After four years of decline, in 2014 and 2015 public expenditure on health care increased in real terms and did not change significantly relative to GDP. The increase in revenues for compulsory health insurance (in real terms by 3.3%) in 2015 mostly resulted from stronger growth in employment and the increase in contributions for student work.150 In 2015 the Health Insurance Institute of Slovenia (HIIS) recorded a surplus of revenue over expenditure of EUR 5.2 million, which accounts for 0.2% of total expenditure in 2015.151 Most of the measures aimed at balancing the operations of the HIIS
148 On average, 615.1 thousand pensioners received pensions. The number of pensioners refers to the total number of recipients of old-age (432.3 thousand), disability, survivor's, widower's and military pensions, pension advances and farmer's pensions under the Farmers' Old Age Insurance Act (the SZK) (data obtained from the PDII). 149 The number of beneficiaries of survivor's, disability, military and farmer's pensions is decreasing.150 Under the ZZVZZ-M (revenue arising from contributions is higher by EUR 35 million annually).151 HIIS 2015 Financial Report, March 2016.
which were adopted in the years of the crisis152 remained in force; accordingly, higher revenues were allocated to the extension and improvement in the evaluation of certain priority programmes (model outpatient practices, oncology, homes for the elderly, biological pharmaceuticals) and the shortening of waiting times. At the end of the year, the expenditure of the HIIS was higher by 3.8% in real terms, and according to the first estimate, current public expenditure on health care (including the expenditure of the Ministry of Health, but excluding investments) in 2015 totalled 6.14% of GDP, which is the same as in 2014153 (see Indicator 3.10). After several years, problems in the operation of hospitals were reduced slightly in 2015. Several studies154 show that the efficiency of the Slovenian health care system is somewhere in the middle of the scale and that, in order to increase the long-term sustainability of the system, structural measures need to be adopted as soon as possible. According to the latest estimate of the European Commission155, which included a wide range of models, the Slovenian health care system is in the middle of the efficiency scale; pressures on the rise in the share of expenditure on health care in GDP156 could be reduced in the long-term through appropriate structural measures aimed at increasing efficiency. The Health Care System Analysis157 stressed that measures to increase the efficiency of the Slovenian health care system should be aimed, in particular, at establishing, as soon as possible, the system of Health Technology Assessment (HTA), overhauling payment models for service providers,
152 Austerity measures concerning wages in the public sector, the reduced prices of health care services, a reduction in the share of medical services covered by the compulsory health insurance (they were passed on to complementary health insurance), a reduction in expenditure on medicinal products and medical devices and sick leave compensation.153 HIIS 2014 Financial Report (proposal, March 2015). Data according to the SHA methodology are estimated in cooperation with SURS. Expenditure as a share of GDP for 2014 is calculated based on SURS’s First Release in February 2014.154 Medeiros and Schwierz, 2015; Joumard et al., 2008;, Hribernik, M. and Kierzenkowski R., 2013; Medeiros J. and Schwierz C., 2015; IMF: Slovenia Selected Issues Paper, 2015; EC: MACELI report, 2015. The MACELI report shows that differences in lifestyle in EU countries do not have a significant effect on the results of the comparative analysis of the efficiency of health care systems.155 Medeiros and Schwierz, (2015).156 According to the European Commission (Medeiros and Schwierz, 2015), more efficient health care systems could reduce the growth of the share of health care expenditure in GDP in the EU by an average of 0.5% per year. According to the IER (Majcen, 2015) and IMAD (Assessing the Effects of Some Structural Measures in Slovenia, 2016), a more efficient health system in Slovenia could result in slightly more than 20 percent savings in public expenditure on health care by 2060, thereby considerably reducing pressure on age-related expenditure in the long-term.157 Ministry of Health, WHO, European Observatory on Health Systems and Policies, 2016.

61Development Report 2016Demographic trends and the welfare state
introducing incentives to increase employee efficiency, strengthening the primary level and the ‘system of gatekeepers’158, investing in e-health, and establishing the long-term care system.
In order to increase the stability and long-term sustainability of the health care system, we need to reduce the dependence of public financing on employees’ contributions and maintain the funds paid for health care by the economically non-active population through complementary health insurance. In order to improve the long-term sustainability of the public financing of health care, we will need to increase the diversity of sources and, in addition to broadening contributions bases and equalising contribution rates, gradually increase the share of other sources, in particular, tax sources. The problem is the large dependence of the compulsory health insurance scheme on employees’ contributions, which account for 75% of all revenue from contributions for compulsory health insurance; however, in the next ten years, the structure of insured persons will change significantly due to a decrease in the number of working-age people. In the event of abolition of complementary insurance, the health care system should maintain the current volume of payments by the economically non-active population for complementary health insurance (see also Economic Issues 2014 and 2015; the 2014 and 2015 Development Reports). These findings were also confirmed by the Health Care System Analysis, which highlighted measures aimed at gradually increasing tax sources for financing health care, improving regulation and gradually reducing the role of complementary health insurance. At the end
158 The role of general practitioners as gatekeepers who limit the number of referrals to more expensive specialised outpatient clinics.
2015, the Resolution on the National Health Care Plan 2016–2025 was adopted as the basis for the reform of the health care legislation.159 The new Health Care and Health Insurance Act is to be prepared by the end of 2016.
Slovenia is increasingly lagging behind in terms of public resources for long-term care. According to the latest international comparison for 2013, public expenditure on long-term care in Slovenia is considerably lower than the OECD average160 (see Indicator 3.11). After a long period of increase, in 2013 private expenditure also decreased alongside public expenditure, mainly due to a decline in co-payments in institutions. On the other hand, the number of long-term care recipients slightly increased in 2013 (see Chapter 3.3.2).
The growing needs in long-term care require systemic regulation of long-term care. In the future, pressure on the growth of expenditure is expected to be even higher, since many needs still remain to be covered. The comprehensive regulation of long-term care, which has been in preparation for as long as ten years in Slovenia, will have to combine different sources of public financing into a uniform system to ensure better coordination in the provision of services and a more equal access to them and to promote, through an altered system of financing, the development and performance of services at home. The systemic strengthening of less expensive social services in long-term care could significantly reduce the pressure on the growth of public expenditure on long-term care and along with it the growth of public expenditure on health care. The revision of financing will need to take into account that, in Slovenia, as much as 47% of the total public expenditure on long-term care is being financed from compulsory health insurance, and that, therefore, changes in the financing cannot be enforced without simultaneously implementing the health care reform.
3.3. Quality of life and social inclusion
Quality of life and social inclusion are important factors of well-being,161 which is the principal objective of social development. Quality of life is affected by several factors, among them mainly material living conditions, health, access to public services, quality of the environment, social capital and social inclusion. The revival of economic activity and growing employment have halted the several year-long trend of a decline in the disposable income (material living conditions), indicating that there are prospects for a gradual improvement in the quality of life. The access
159 Ministry of Health, 2015.160 In 2013, Slovenia's public expenditure on long-term care was 0.95% of GDP, and the OECD average was 1.66% of GDP.161 IMAD, together with a consortium of other institutions, has set a system of indicators of well-being, covering material, social and environmental well-being (see: http://www.umar.gov.si/publikacije/kazalniki_blaginje).
Figure 38: Average efficiency estimates*of health care systems in the EU
Source: European Commission, 2015. Note: *The average estimates take into account 21 DEA (data envelopment analysis) model scores, using different indicators of population health
0.70
0.75
0.80
0.85
0.90
0.95
1.00
Slov
akia
Lith
uani
aCz
ech
R.H
unga
ryLa
tvia
Pola
ndEs
toni
aCr
oatia
Slov
enia
Rom
ania
Bulg
aria EU
Port
ugal
Aust
riaD
enm
ark
Finl
and
Gre
ece
Ger
man
yIre
land
Italy
U. K
ingd
omM
alta
Belg
ium
Luxe
mbo
urg
Swed
enCy
prus
Spai
nN
ethe
rland
sFr
ance
Aver
age
effic
ienc
y es
timat
es

62 Development Report 2016Demographic trends and the welfare state
to public services remains relatively good. The health status indicators have improved in recent years, whereas the indicators of non-medical health determinants have deteriorated. Despite increasing during the crisis, the social exclusion risk rate remains below the EU average. The challenge is to develop measures to reduce the number of socially excluded persons by improving material conditions, reducing the risk of poverty for certain groups (e.g. older people and children), and improving the lifestyle indicators.
3.3.1 Material living conditions and social inclusion
The disposable income of households, which importantly determines material living conditions, has stopped decreasing in the last two years, mainly due to the increase in the wage bill. After a period of decline (2008–2013), the wage bill increased in 2014 and 2015 as a result of the growth of employment and of wages, thereby halting the decline in the disposable income. The significant increase in social benefits at the beginning of the crisis was followed by the reduction of social benefits162 in mid-2012 due to the enforcement of austerity measures. The share of social benefits in the income structure remains higher than before the crisis, mainly as a result of the higher pension bill, which has increased despite the decrease in the average pension163. The decrease in the average pension was mainly influenced by a restrictive pension indexation policy in the period 2010–2015 (see Chapter 3.2) and partly probably also by early retirements (and therewith lower pensions) prior to the entry into force of the new Pension Act in 2013. Accordingly, the ratio of average pension to average wage decreased significantly in the period 2008–2015164. After slower growth and the decline in 2012 and 2013, the decline in the gross adjusted disposable income per capita165 came to a halt in 2014 (see Indicator 3.13).
In Slovenia, income and consumption are distributed considerably more evenly among the population than in other countries, which is why the inequalities measured are among the lowest in the EU. Although, in the period 2009–2014, the income inequality in Slovenia, measured by the Gini coefficient, increased more than the EU average, Slovenia is one of the
162 Social benefits as a share of the disposable income include: unemployment benefits, family benefits, social assistance benefits in cash, pensions, sickness benefits, disability benefits and benefit in respect of death of the breadwinner. Pensions account for the largest share.163 In 2015 the average pension was lower by around 9% in real terms compared to 2009, when it was at its highest.164 In 2008 the average old-age pension was 67.1% of the average wage (in 2015: 60.2%), and the ratio of average pension to average wage decreased from 61.6% in 2008 to 55.4% in 2015. 165 In addition to all disposable income of households and NPISH, the gross adjusted disposable income includes the value of the social transfers in kind, for example, education, health, housing, cultural and recreation services.
countries with the lowest degree of inequality (see Indicator 3.15). In Slovenia, as in other developed countries, there has been a trend of a rise in the income of the wealthiest (10th decile). Unemployment and the number of social assistance recipients increased during the crisis, along with the share of people with low income, resulting in an increase in income inequality, whereas wage inequality declined in the period 2008–2014. The decline in wage inequality was influenced by the following: (i) a rise in the minimum wage, which caused an increase in the lowest wages; (ii) the austerity measures in the public sector, which resulted in a relatively greater reduction of high wages; and (iii) a slowdown in wage growth during the crisis in activities where wages are highest. Pension distribution has not been changing significantly. One-fifth of pensioners received a pension of between EUR 400 and EUR 500, and a good half of pensioners received between EUR 400 and EUR 700. Since the at-risk-of-poverty rate of older people in Slovenia is above the EU average,166 Slovenia will have to ensure an adequate level of pensions in adopting measures on the pension system. Since the level of pension received also depends on the years of pensionable service, it is necessary make individuals aware of the effect of delaying retirement on the pension level and encourage them to save for old age. In Slovenia, as in other countries, consumption inequality declined during the crisis and does not differ considerably from disparities in other countries.167
In Slovenia, as in other countries, the estimated wealth inequality is higher than income inequality, but significantly lower than in other EU countries.
166 In 2014 there were 41 thousand women below the at-risk-of-poverty threshold, and the at-risk-of-poverty rate was 21.6% for older women and 10.8% for men. 167 Hassett and Mathur, 2012; Fisher, Johnson and Smeeding, 2012; Attanasio, Pistaferri, 2014.
Figure 39: Pension distribution and years of pensionable service in December 2015, Slovenia
Source: PDII.
0
5
10
15
20
25
30
35
40
45
0
25,000
50,000
75,000
100,000
125,000
150,000
175,000
200,000
225,000
100,
01-4
00
400,
01-7
00
700,
01-1
000
1000
,01-
1300
1300
,01-
1600
1600
,01<
Aver
age
year
s of p
ensi
onab
le se
rvic
e
Num
ber o
f old
-age
pen
sion
ers
No. of old-age pensioners, Oct. 2015 (left axis)Average years of pensionable service (right axis)
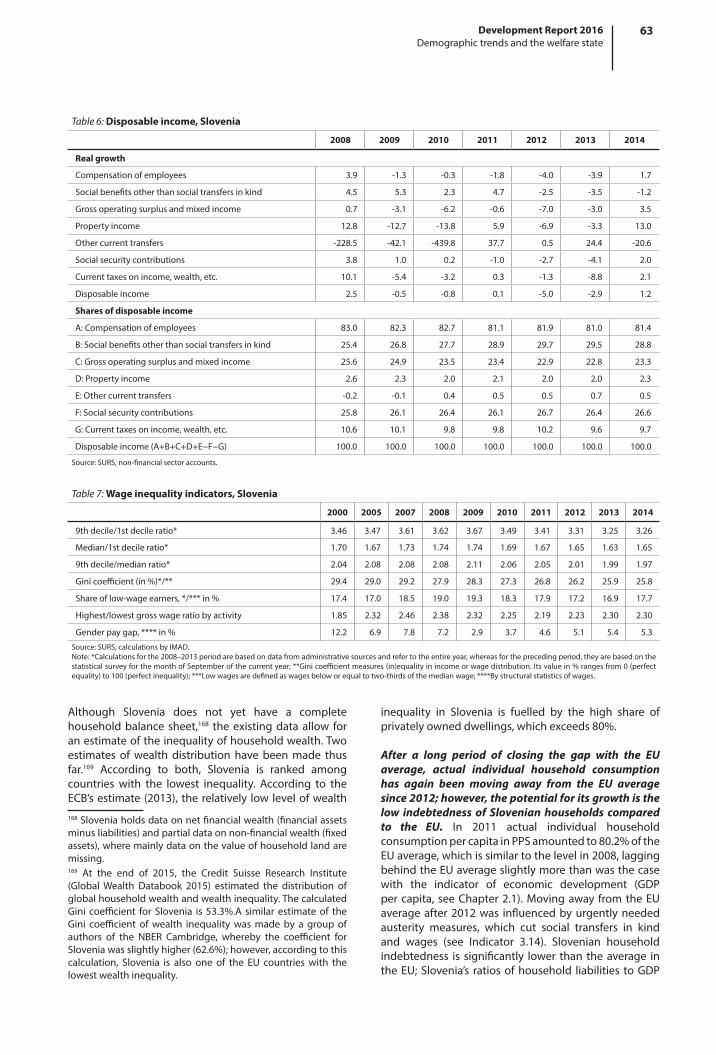
63Development Report 2016Demographic trends and the welfare state
Although Slovenia does not yet have a complete household balance sheet,168 the existing data allow for an estimate of the inequality of household wealth. Two estimates of wealth distribution have been made thus far.169 According to both, Slovenia is ranked among countries with the lowest inequality. According to the ECB’s estimate (2013), the relatively low level of wealth
168 Slovenia holds data on net financial wealth (financial assets minus liabilities) and partial data on non-financial wealth (fixed assets), where mainly data on the value of household land are missing.169 At the end of 2015, the Credit Suisse Research Institute (Global Wealth Databook 2015) estimated the distribution of global household wealth and wealth inequality. The calculated Gini coefficient for Slovenia is 53.3%.A similar estimate of the Gini coefficient of wealth inequality was made by a group of authors of the NBER Cambridge, whereby the coefficient for Slovenia was slightly higher (62.6%); however, according to this calculation, Slovenia is also one of the EU countries with the lowest wealth inequality.
inequality in Slovenia is fuelled by the high share of privately owned dwellings, which exceeds 80%.
After a long period of closing the gap with the EU average, actual individual household consumption has again been moving away from the EU average since 2012; however, the potential for its growth is the low indebtedness of Slovenian households compared to the EU. In 2011 actual individual household consumption per capita in PPS amounted to 80.2% of the EU average, which is similar to the level in 2008, lagging behind the EU average slightly more than was the case with the indicator of economic development (GDP per capita, see Chapter 2.1). Moving away from the EU average after 2012 was influenced by urgently needed austerity measures, which cut social transfers in kind and wages (see Indicator 3.14). Slovenian household indebtedness is significantly lower than the average in the EU; Slovenia’s ratios of household liabilities to GDP
Table 6: Disposable income, Slovenia
2008 2009 2010 2011 2012 2013 2014
Real growth
Compensation of employees 3.9 -1.3 -0.3 -1.8 -4.0 -3.9 1.7
Social benefits other than social transfers in kind 4.5 5.3 2.3 4.7 -2.5 -3.5 -1.2
Gross operating surplus and mixed income 0.7 -3.1 -6.2 -0.6 -7.0 -3.0 3.5
Property income 12.8 -12.7 -13.8 5.9 -6.9 -3.3 13.0
Other current transfers -228.5 -42.1 -439.8 37.7 0.5 24.4 -20.6
Social security contributions 3.8 1.0 0.2 -1.0 -2.7 -4.1 2.0
Current taxes on income, wealth, etc. 10.1 -5.4 -3.2 0.3 -1.3 -8.8 2.1
Disposable income 2.5 -0.5 -0.8 0.1 -5.0 -2.9 1.2
Shares of disposable income
A: Compensation of employees 83.0 82.3 82.7 81.1 81.9 81.0 81.4
B: Social benefits other than social transfers in kind 25.4 26.8 27.7 28.9 29.7 29.5 28.8
C: Gross operating surplus and mixed income 25.6 24.9 23.5 23.4 22.9 22.8 23.3
D: Property income 2.6 2.3 2.0 2.1 2.0 2.0 2.3
E: Other current transfers -0.2 -0.1 0.4 0.5 0.5 0.7 0.5
F: Social security contributions 25.8 26.1 26.4 26.1 26.7 26.4 26.6
G: Current taxes on income, wealth, etc. 10.6 10.1 9.8 9.8 10.2 9.6 9.7
Disposable income (A+B+C+D+E−F−G) 100.0 100.0 100.0 100.0 100.0 100.0 100.0
Source: SURS, non-financial sector accounts.
Table 7: Wage inequality indicators, Slovenia
2000 2005 2007 2008 2009 2010 2011 2012 2013 2014
9th decile/1st decile ratio* 3.46 3.47 3.61 3.62 3.67 3.49 3.41 3.31 3.25 3.26
Median/1st decile ratio* 1.70 1.67 1.73 1.74 1.74 1.69 1.67 1.65 1.63 1.65
9th decile/median ratio* 2.04 2.08 2.08 2.08 2.11 2.06 2.05 2.01 1.99 1.97
Gini coefficient (in %)*/** 29.4 29.0 29.2 27.9 28.3 27.3 26.8 26.2 25.9 25.8
Share of low-wage earners, */*** in % 17.4 17.0 18.5 19.0 19.3 18.3 17.9 17.2 16.9 17.7
Highest/lowest gross wage ratio by activity 1.85 2.32 2.46 2.38 2.32 2.25 2.19 2.23 2.30 2.30
Gender pay gap, **** in % 12.2 6.9 7.8 7.2 2.9 3.7 4.6 5.1 5.4 5.3
Source: SURS, calculations by IMAD. Note: *Calculations for the 2008–2013 period are based on data from administrative sources and refer to the entire year, whereas for the preceding period, they are based on the statistical survey for the month of September of the current year; **Gini coefficient measures (in)equality in income or wage distribution. Its value in % ranges from 0 (perfect equality) to 100 (perfect inequality); ***Low wages are defined as wages below or equal to two-thirds of the median wage; ****By structural statistics of wages.
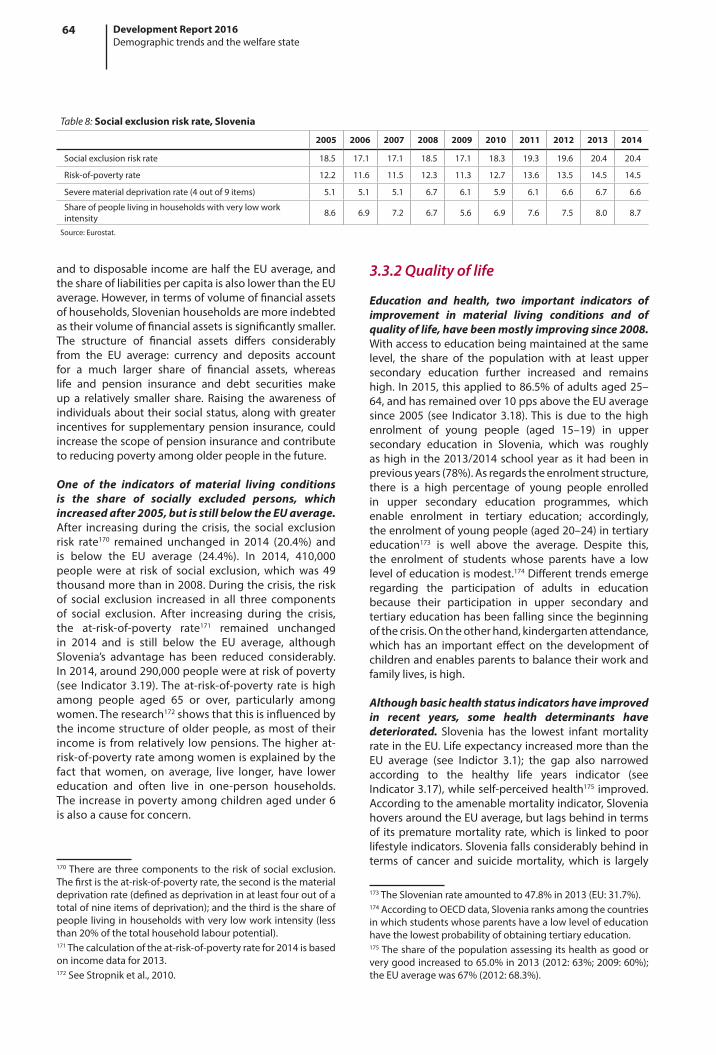
64 Development Report 2016Demographic trends and the welfare state
3.3.2 Quality of life
Education and health, two important indicators of improvement in material living conditions and of quality of life, have been mostly improving since 2008. With access to education being maintained at the same level, the share of the population with at least upper secondary education further increased and remains high. In 2015, this applied to 86.5% of adults aged 25–64, and has remained over 10 pps above the EU average since 2005 (see Indicator 3.18). This is due to the high enrolment of young people (aged 15–19) in upper secondary education in Slovenia, which was roughly as high in the 2013/2014 school year as it had been in previous years (78%). As regards the enrolment structure, there is a high percentage of young people enrolled in upper secondary education programmes, which enable enrolment in tertiary education; accordingly, the enrolment of young people (aged 20–24) in tertiary education173 is well above the average. Despite this, the enrolment of students whose parents have a low level of education is modest.174 Different trends emerge regarding the participation of adults in education because their participation in upper secondary and tertiary education has been falling since the beginning of the crisis. On the other hand, kindergarten attendance, which has an important effect on the development of children and enables parents to balance their work and family lives, is high.
Although basic health status indicators have improved in recent years, some health determinants have deteriorated. Slovenia has the lowest infant mortality rate in the EU. Life expectancy increased more than the EU average (see Indictor 3.1); the gap also narrowed according to the healthy life years indicator (see Indicator 3.17), while self-perceived health175 improved. According to the amenable mortality indicator, Slovenia hovers around the EU average, but lags behind in terms of its premature mortality rate, which is linked to poor lifestyle indicators. Slovenia falls considerably behind in terms of cancer and suicide mortality, which is largely
173 The Slovenian rate amounted to 47.8% in 2013 (EU: 31.7%).174 According to OECD data, Slovenia ranks among the countries in which students whose parents have a low level of education have the lowest probability of obtaining tertiary education. 175 The share of the population assessing its health as good or very good increased to 65.0% in 2013 (2012: 63%; 2009: 60%); the EU average was 67% (2012: 68.3%).
and to disposable income are half the EU average, and the share of liabilities per capita is also lower than the EU average. However, in terms of volume of financial assets of households, Slovenian households are more indebted as their volume of financial assets is significantly smaller. The structure of financial assets differs considerably from the EU average: currency and deposits account for a much larger share of financial assets, whereas life and pension insurance and debt securities make up a relatively smaller share. Raising the awareness of individuals about their social status, along with greater incentives for supplementary pension insurance, could increase the scope of pension insurance and contribute to reducing poverty among older people in the future.
One of the indicators of material living conditions is the share of socially excluded persons, which increased after 2005, but is still below the EU average. After increasing during the crisis, the social exclusion risk rate170 remained unchanged in 2014 (20.4%) and is below the EU average (24.4%). In 2014, 410,000 people were at risk of social exclusion, which was 49 thousand more than in 2008. During the crisis, the risk of social exclusion increased in all three components of social exclusion. After increasing during the crisis, the at-risk-of-poverty rate171 remained unchanged in 2014 and is still below the EU average, although Slovenia’s advantage has been reduced considerably. In 2014, around 290,000 people were at risk of poverty (see Indicator 3.19). The at-risk-of-poverty rate is high among people aged 65 or over, particularly among women. The research172 shows that this is influenced by the income structure of older people, as most of their income is from relatively low pensions. The higher at-risk-of-poverty rate among women is explained by the fact that women, on average, live longer, have lower education and often live in one-person households. The increase in poverty among children aged under 6 is also a cause for concern.
170 There are three components to the risk of social exclusion. The first is the at-risk-of-poverty rate, the second is the material deprivation rate (defined as deprivation in at least four out of a total of nine items of deprivation); and the third is the share of people living in households with very low work intensity (less than 20% of the total household labour potential).171 The calculation of the at-risk-of-poverty rate for 2014 is based on income data for 2013.172 See Stropnik et al., 2010.
Table 8: Social exclusion risk rate, Slovenia
2005 2006 2007 2008 2009 2010 2011 2012 2013 2014
Social exclusion risk rate 18.5 17.1 17.1 18.5 17.1 18.3 19.3 19.6 20.4 20.4
Risk-of-poverty rate 12.2 11.6 11.5 12.3 11.3 12.7 13.6 13.5 14.5 14.5
Severe material deprivation rate (4 out of 9 items) 5.1 5.1 5.1 6.7 6.1 5.9 6.1 6.6 6.7 6.6
Share of people living in households with very low work intensity 8.6 6.9 7.2 6.7 5.6 6.9 7.6 7.5 8.0 8.7
Source: Eurostat.

65Development Report 2016Demographic trends and the welfare state
attributable to a high-risk lifestyle (smoking, alcohol consumption, obesity); this is why it needs to adopt health prevention and protection measures.176 At the same time, coordinated inter-sectoral action is needed to enhance the health of socially weaker groups and reduce health inequalities. The latter would also help to reduce absenteeism177, which remains significantly above the OECD average.
Affordability of health care services remains relatively good, but waiting periods have lengthened. Direct out-of-pocket expenditure remained relatively low during the crisis, which is linked to the high level of participation in complementary health insurance schemes (see Indicator 3.10). In the period 2007–2012, the share of households that incurred out-of-pocket expenditure increased from 57% to 78% (the Household Budget Survey); however, expenditure was catastrophically high178 in only 1% of households, which is the lowest share among 22 EU countries. Good accessibility of healthcare is also confirmed by the indicator of unmet needs for these services, which is the lowest in the EU. The Health Care System Analysis179 found that Slovenia is one of the countries with good accessibility and high quality of primary-level health care. While the latter also contributed to a successful reduction in hospitalisation, it will be necessary to improve coordination between the primary and secondary health care levels in order to improve the quality of services. One of the problems is also long waiting periods, which lengthened further in 2015180.
The quality of life of older people is influenced by access to long-term care services, which is slightly below the OECD average in Slovenia. The number of long-term care recipients, which has been increasing for a number of years, exceeds 60,000 persons. A little over one-third of these persons are long-term care recipients in institutions, and the rest are long-term care
176 Various studies (Sassi, F. et al., 2013; Cecchini, M. et al., 2015, OECD, 2015) show the positive effects of the anti-alcohol policy and the measures to limit the use of tobacco products and unhealthy food on the number of healthy life years, life expectancy and health expenditure (for more, see Assessing the Effects of Some Structural Measures in Slovenia, IMAD, 2016). 177 IMAD estimates show that measures to reduce absenteeism to the OECD average (from 11.3 to 9 working days) could increase GDP by 0.7% in five years (Assessing the Effects of Some Structural Measures in Slovenia, IMAD, 2016). 178 Direct out-of-pocket expenditure on health care is catastrophic for households (catastrophic out-of-pocket expenditure) if it pushes households below the poverty threshold or exceeds 40% of their disposable annual income. (WHO, 2015). 179 Ministry of Health, WHO, European Observatory on Health Systems and Policies, 2016.180 In the period from 1 January 2015 to 1 January 2016, the number of all the patients waiting for health care services increased by 14% (from 182,498 to 208,428), while the number of patients waiting longer than the maximum waiting period rose from 24,805 to 28,392 (the National Institute of Public Health).
recipients at home.181 The proportion of the population in long-term care in Slovenia is approximately equal to the OECD average,182 but Slovenia slightly lags behind in terms of the proportion of people aged 65 and over in long-term care (SI: 11.9%; OECD 21: 12.9%). Long-term care at home is least developed, with Slovenia lagging significantly behind in terms of the proportion of people in long-term care at home183. According to the SHARE survey, there are almost 9,000 persons aged 50 and over in Slovenia who have limitations in at least one activity of daily living (ADL>=1), receive only informal care within their family and receive no assistance and nursing allowance; in addition, there are another 35,000 persons who have ADL limitations (ADL>=1) and receive no informal care (they have unmet needs); they together account for 5.5% of the population aged 50 and over that could potentially be included in one of the forms of formal long-term care. Inappropriately regulated long-term care increases the burden on families and pressures on the use of health care services, pointing to the need for immediate systemic regulation of long-term care.
181 These persons receive services in their home environment (20,744) or only cash benefits (17,000). The actual number of recipients of cash benefits is much higher (a little more than 40,000), but the final number of recipients follows the rule of double counting, i.e. if the recipient receives both a service and a cash benefit, he or she is counted only in the service (SURS, 2015).182 The Slovenian rate amounted to 2.9% in 2013 (OECD: 2.6%). At the end of 2014 and 2015, SURS published data on long-term care recipients in Slovenia according to the international OECD definition. For Slovenia, in addition to the recipients of long-term care, the estimate of community-nursing recipients was taken into account (for more, see Nagode et al., 2014). 183 The share of long-term care recipients at home in Slovenia is 6.9% (OECD 21: 8.9%).
Figure 40: Proportion of informal care recipients and unmet needs in the population aged 50 and older, 2013, in %
Source: SHARE survey, 4th wave, calculations by IER. Note: Basic activities of daily living (BADLs) include bathing, dressing, eating, getting in and out of bed, transferring and toileting. Usually this refers to personal care (Nagode et al., 2014).
0
2
4
6
8
10
12
Switz
erla
nd
Swed
en
Isra
el
Den
mar
k
Net
herla
nds
Aust
ria
Slov
enia
Spai
n
Luxe
mbo
urg
Ger
man
y
Aver
age
Fran
ce
Czec
h R.
Belg
ium
Italy
Esto
niaPr
opor
tion
of in
form
al c
are
reci
pien
ts a
nd u
nmet
nee
ds in
th
e po
pula
tion
aged
50
and
olde
r, in
%
Informal care (ADL>=1)
Unmet needs (ADL>=1)

66 Development Report 2016Demographic trends and the welfare state
Trust between people, which represents social capital, declined during the crisis, but the perceived level of personal threat remains low. In 2014, trust in other people and the share of those convinced that people are fair decreased in comparison with 2008. The share of those convinced that people try to be helpful increased. A total of 53.4% of the respondents said they had frequent contacts with relatives, friends and colleagues for social reasons, which is more than in 2008 but less than the average of countries included in the European Social Survey. In the period 2008–2014, general satisfaction with the present state of the economy, the government, education and the health system declined, and dissatisfaction with the way democracy works in Slovenia increased. The share of people satisfied with the way democracy works slightly increased in 2015, but Slovenia still remains one of the countries with the lowest satisfaction level with regard to the way democracy works in the EU.186 People’s trust in key state institutions remains low, with trust in EU institutions having declined as well. On the other hand, there has been no deterioration in personal security indicators during the crisis. In the period 2008–2014, the standardised death rate due to assault slightly increased in Slovenia. However, Slovenia continues to have low rates in terms of feeling threatened in one’s neighbourhood. Compared to 2008, more people felt safe when walking alone in their local area after dark in 2014. Burglary or physical assault was experienced by slightly fewer people. Compared to other EU countries, Slovenia is a fairly safe country, which positively affects its quality of life. In 2015, 96% of the respondents believed that their immediate neighbourhood is a secure place to live, and 93% that Slovenia is a secure place to live.187
Residents in Slovenia on average are more satisfied with their living environment and green areas188 than EU residents on average. The satisfaction of residents in Slovenia with their living environment is relatively high, the two issues sometimes highlighted being air pollution and excessive noise. As a result of dispersed settlement, a good tenth of the population expressed dissatisfaction with excessive noise. The major problem is air pollution by PM10, to which a quarter of the population is exposed.189 Air pollution varies under different weather conditions; however, in the long term, there has been improvement in air pollution levels (see Chapter 4.1).
186 Source: Eurobarometer no. 84, 2015.187 Eurobarometer no. 432, 2015.188 In 2013, 17.6% of the respondents were dissatisfied with their living environment (EU: 19.2%) and 14.7% with green areas (EU: 22.4%).189 Eurostat, Quality of life, 2015.
The quality of life in Slovenia, measured in terms of life satisfaction, is above the EU average, whereas satisfaction with the use of leisure time is at the same level as the EU average. Life satisfaction has slightly increased after 2013; in the autumn of 2015, 87% of the respondents were satisfied with their life, which, in addition to the increased level of satisfaction with the economic situation, can also be attributed to the increased flow of migrants and the perception of immigration as one of the major issues at the state level. In 2015, satisfaction levels increased in all four components;184 satisfaction is highest with the financial situation of the household (64%), exceeding the pre-crisis level. On the other hand, satisfaction is lowest with the employment situation in the country (7%). When asked to identify the two main issues facing the country, most of the respondents indicated that migration (48%) rather than unemployment (41%) and the economic situation (27%) is the most pressing issue. Key issues highlighted at the personal level are the rising costs of living, the financial situation of the household and pensions (see Indicator 3.16). Satisfaction with the use of leisure time is similar to the EU average185, whereas the availability of chargeable leisure activities is relatively low. Two-thirds of the respondents could not afford to engage in chargeable leisure activities (a good fifth for financial reasons and two-fifths for other reasons). One of significant leisure activities is attendance at cultural events, which is higher than at the beginning of the crisis. Voluntary work, an important part of which is the work of protection, rescue and relief force members, shows an increasing trend.
184 These are: the financial situation of the household, personal job situation, the employment situation in the country and the economic situation in the country.185 According to EU-SILC data, on a scale of 1 to 10, the average score for satisfaction with the use of leisure time for Slovenia is 6.8 (EU: 6,7).
Figure 41: Issues considered most important by respondents on a personal level, Slovenia
Source: Eurobarometer. Note: The respondents indicate two most important issues on a personal level.
0 10 20 30 40
Price growth/inflation
Financial situation of…
Pensions
Unemployment
Economic situation in…
Living conditions
Health and social security
Working conditions
Taxes
Educational system
Immigrants
Housing situation
Environment, climate,…
Crime
In %
Nov. 2015
Nov. 2012

67Development Report 2016Demographic trends and the welfare state
employment incentives and labour market mobility190. Improving flexicurity could increase employment, reduce segmentation and enable an effective allocation of labour force.
The challenge in the area of social development is to reduce the number of socially excluded persons and develop measures to promote healthy lifestyle. Although the share of persons at risk of social exclusion increased during the crisis, it is still below the EU average. However, the at-risk-of-poverty rate for certain population groups is above average (particularly women aged 65 or older); it is also worrying that the at-risk-of-poverty rate for children (aged 0–6) increased. In order to reduce the number of persons at risk of social exclusion and maintain favourable results in the area of quality of life, Slovenia should focus more on maintaining the balance between the direct effects of measures taken and their wider social implications. In this regard, it should be noted that such measures do not only include social policy measures, but also other policy measures, which can have an indirect impact on the material situation of individuals and their quality of life. For example, developing measures to promote healthy lifestyle could improve quality of life, while reducing expenditure on health care.
190 Common Principles of Flexicurity – Council Conclusions, 2007.
3.4. Challenges
Population ageing requires social protection systems, the labour market and society as a whole to adapt. In 2014, when the economic recovery began to take hold, the situation in the labour market began to improve; accordingly, the material situation of the population stopped deteriorating and the at-risk-of poverty rate stopped increasing. Despite the crisis, which led to deterioration in the material living conditions, Slovenia has been able to maintain, by international comparison, a relatively high level of social inclusion and access to public services and low income inequality. The major challenge is to adapt social protection systems to the ageing population so that they can continue to provide social security, access to public services and social inclusion for all population groups. With a view to achieving higher employment and improving quality of life, it is crucial to set up a flexicurity system in the labour market to ensure the effective allocation of the labour force and reduce labour market segmentation. Certain other policies which are important for ensuring quality of life also need to adapt to the ageing population.
Demographic trends require adjusting social protection systems to improve quality of life and fiscal sustainability. Population ageing is exerting pressure on public finances. This should be mitigated by a comprehensive reform of social protection systems, which should be adopted as soon as possible. The number of older people per one working-age person will be doubled by 2060. Long-term projections indicate that Slovenia is to see the largest increase in age-related expenditure by 2060 among the EU Member States. The pension system should therefore encourage longer activity, which could reduce the risk of poverty among older people. The challenges faced by social protection systems are mainly linked to the adjustment of their financing to the ageing population, continuous improvement in the efficiency of the health care system and the comprehensive regulation of the long-term care system, which would have to combine different sources of public financing into a uniform system to ensure a better use of resources and a more equal access to services and promote the development and performance of services at home.
Improving flexicurity represents a major challenge for the labour market. The concept of flexicurity consists of four components which are combined to create a dynamic labour market and provide security to individuals: (i) flexible contractual arrangements, which reduce labour market segmentation and undeclared work; (ii) effective labour market policy, which assists people in the event of unemployment and facilitates their transition to new jobs; (iii) a reliable and flexible system of lifelong learning which ensures workers’ ongoing capacity to adapt and increases their employability; (iv) modern social security systems which adequately combine the system of income support and
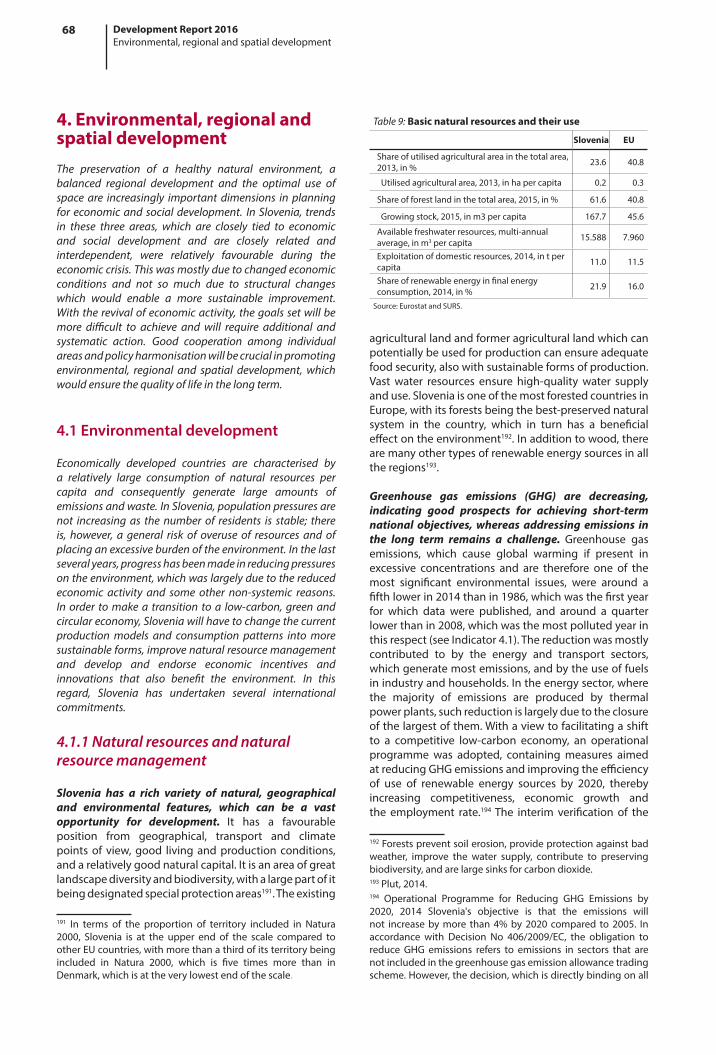
68 Development Report 2016Environmental, regional and spatial development
4. Environmental, regional and spatial developmentThe preservation of a healthy natural environment, a balanced regional development and the optimal use of space are increasingly important dimensions in planning for economic and social development. In Slovenia, trends in these three areas, which are closely tied to economic and social development and are closely related and interdependent, were relatively favourable during the economic crisis. This was mostly due to changed economic conditions and not so much due to structural changes which would enable a more sustainable improvement. With the revival of economic activity, the goals set will be more difficult to achieve and will require additional and systematic action. Good cooperation among individual areas and policy harmonisation will be crucial in promoting environmental, regional and spatial development, which would ensure the quality of life in the long term.
4.1 Environmental development
Economically developed countries are characterised by a relatively large consumption of natural resources per capita and consequently generate large amounts of emissions and waste. In Slovenia, population pressures are not increasing as the number of residents is stable; there is, however, a general risk of overuse of resources and of placing an excessive burden of the environment. In the last several years, progress has been made in reducing pressures on the environment, which was largely due to the reduced economic activity and some other non-systemic reasons. In order to make a transition to a low-carbon, green and circular economy, Slovenia will have to change the current production models and consumption patterns into more sustainable forms, improve natural resource management and develop and endorse economic incentives and innovations that also benefit the environment. In this regard, Slovenia has undertaken several international commitments.
4.1.1 Natural resources and natural resource management
Slovenia has a rich variety of natural, geographical and environmental features, which can be a vast opportunity for development. It has a favourable position from geographical, transport and climate points of view, good living and production conditions, and a relatively good natural capital. It is an area of great landscape diversity and biodiversity, with a large part of it being designated special protection areas191. The existing
191 In terms of the proportion of territory included in Natura 2000, Slovenia is at the upper end of the scale compared to other EU countries, with more than a third of its territory being included in Natura 2000, which is five times more than in Denmark, which is at the very lowest end of the scale.
agricultural land and former agricultural land which can potentially be used for production can ensure adequate food security, also with sustainable forms of production. Vast water resources ensure high-quality water supply and use. Slovenia is one of the most forested countries in Europe, with its forests being the best-preserved natural system in the country, which in turn has a beneficial effect on the environment192. In addition to wood, there are many other types of renewable energy sources in all the regions193.
Greenhouse gas emissions (GHG) are decreasing, indicating good prospects for achieving short-term national objectives, whereas addressing emissions in the long term remains a challenge. Greenhouse gas emissions, which cause global warming if present in excessive concentrations and are therefore one of the most significant environmental issues, were around a fifth lower in 2014 than in 1986, which was the first year for which data were published, and around a quarter lower than in 2008, which was the most polluted year in this respect (see Indicator 4.1). The reduction was mostly contributed to by the energy and transport sectors, which generate most emissions, and by the use of fuels in industry and households. In the energy sector, where the majority of emissions are produced by thermal power plants, such reduction is largely due to the closure of the largest of them. With a view to facilitating a shift to a competitive low-carbon economy, an operational programme was adopted, containing measures aimed at reducing GHG emissions and improving the efficiency of use of renewable energy sources by 2020, thereby increasing competitiveness, economic growth and the employment rate.194 The interim verification of the
192 Forests prevent soil erosion, provide protection against bad weather, improve the water supply, contribute to preserving biodiversity, and are large sinks for carbon dioxide.193 Plut, 2014.194 Operational Programme for Reducing GHG Emissions by 2020, 2014 Slovenia's objective is that the emissions will not increase by more than 4% by 2020 compared to 2005. In accordance with Decision No 406/2009/EC, the obligation to reduce GHG emissions refers to emissions in sectors that are not included in the greenhouse gas emission allowance trading scheme. However, the decision, which is directly binding on all
Table 9: Basic natural resources and their use
Slovenia EU
Share of utilised agricultural area in the total area, 2013, in % 23.6 40.8
Utilised agricultural area, 2013, in ha per capita 0.2 0.3
Share of forest land in the total area, 2015, in % 61.6 40.8
Growing stock, 2015, in m3 per capita 167.7 45.6
Available freshwater resources, multi-annual average, in m3 per capita 15.588 7.960
Exploitation of domestic resources, 2014, in t per capita 11.0 11.5
Share of renewable energy in final energy consumption, 2014, in % 21.9 16.0
Source: Eurostat and SURS.

69Development Report 2016Environmental, regional and spatial development
Box 8: Ecological footprint
Ecological footprint, which is measured by the Global Footprint Network, is an attempt to form an aggregate indicator of environmental development. It is expressed in a standardised unit of biologically productive area, a global hectare (gha). This is a fertile area needed to meet the needs of human beings for food and to support their lifestyle, and to dispose waste generated in this process. It includes agricultural land, forests, fishing grounds and the area taken up by infrastructure. It represents approximately one quarter of the Earth’s surface. Glaciers, deserts and open oceans, whose contribution in this regard is not significant due to the low concentration of renewable energy sources, are excluded. Ecological footprint is compared to the biological capacity of nature or biocapacity. This means biologically productive areas which have the capacity to regenerate. Each global hectare produces the same amount of biological value so that its productivity equals the average productivity of all the biologically productive area. The difference between the ecological footprint and biocapacity, which may also be understood as the difference between ecological demand and supply, is an ecological deficit when the footprint of a population exceeds the biocapacity of the area available to that population, and an ecological reserve when the biocapacity of an area exceeds its population’s footprint.
The results of the calculation of the global ecological footprint show that, given the global population’s current lifestyle, it takes the Earth more than a year and a half to regenerate the resources used by humanity in one year. The size of the ecological deficit and the rate at which it is increasing, which are both the result of a high and increasing level of energy consumption, is largely caused by (i) the carbon footprint, which is the amount of carbon dioxide emissions and other greenhouse gas emissions. Other factors include (ii) the biological footprint, which is the footprint of arable land, forests, pastures and other fertile areas, and (iii) the footprint of infrastructure, i.e. built-up areas. The global ecological footprint increased from 1.7 gha/capita in 1961, the year for which the first calculation was made, to 2.84 gha/capita in 2012. With the estimated biocapacity of the planet of 1.73 gha/capita, the ecological footprint was 1.1 gha/capita, exceeding the plant’s biocapacity by 60%. At the global level, we are consuming natural resources at a faster rate than they can regenerate, which means that, at current rates of consumption, the humanity uses the equivalent of 1.6 planet Earths.
Slovenia’s ecological footprint is twice the size of the national biocapacity to regenerate, which is worse than the EU average. After rapidly increasing during the period of economic growth and decreasing during the recession, the ecological footprint was approximately at the same level in 2012 as in 2009. In the last year of calculation, the ecological footprint was 5.8 gha/capita, while the biocapacity, which is much more stable and does not change significantly over years, was 2.4 gha/capita. The main share of Slovenia’s biocapacity comes from forests, but the large surface covered by forests is still not enough to absorb CO2, which contributes most to the ecological footprint. The results show that the demand for food, fuels, wood and fibres was twice the size of the biocapacity to regenerate. The difference between the former and the latter is mainly due to the use of non-renewable energy sources, i.e. fossil fuels. Since the use of available natural capital in Slovenia significantly exceeds Slovenia’s capacity to regenerate, Slovenia in this regard relies on imports from other parts of the world. The EU, on average, has a slightly lower ecological footprint; in 2012 it was 4.8 gha/capita. As the biocapacity is almost the same, the EU has a smaller ecological deficit. Out of 24 Mediterranean countries, for which the calculation was made, Slovenia ranks among the worst countries in terms of ecological footprint and among the best in terms of biocapacity.
Figure: Ecological footprint and ecological deficit or reserve, 2012
Source: Global Footprint Network, National Footprint Accounts, 2016 Edition.
-16
-12
-8
-4
0
4
8
12
16
Luxe
mbo
urg
Belg
ium
Swed
enEs
toni
aLa
tvia
Aust
riaFi
nlan
dLi
thua
nia
Slov
enia
Irela
ndD
enm
ark
Ger
man
yN
ethe
rland
sCz
ech
R.Fr
ance
U. K
ingd
omEU
-27
Italy
Pola
ndG
reec
eCy
prus
Slov
akia
Port
ugal
Spai
nBu
lgar
iaH
unga
ryW
orld
Rom
ania
In g
ha p
er p
erso
n
Ecological footprint
Ecological deficit or reserve
implementation of the programme195 showed that obligations were met in the first years of implementation, and the set targets were even exceeded. This trend
Member States, does not specify measures to meet a particular reduction obligation.195 The first annual report on the implementation of the Operational Programme for Reducing GHG Emissions by 2020, 2016.
could also be expected throughout the entire period up until 2020; however, the present positive trends do not necessarily mean that emissions are curbed in the long term and that Slovenia is transitioning to a low-carbon economy. Uncertainty is highest with regard to the transport sector, which produces a large share of emissions and is characterised by a high annual variability, and where even a short-term rapid rise in the

70 Development Report 2016Environmental, regional and spatial development
was faster in the period of economic growth, slowed down during the crisis. By international comparison, Slovenia ranks among the countries with the higher volume of emissions per unit of GDP, and the gap to the EU average further increased by 2013. The reduction in emission intensity, which was similar to the EU average in the period 2000–2007, slowed down during the crisis.
use of motor fuels may jeopardise the attainment of the target.
Although the emission intensity of the Slovenian economy is improving, it remains considerably higher than the EU average. The reduction in emission intensity, i.e. of GHG emissions per unit of GDP, which
Box 9: The United Nations Climate Change Conference in Paris1
In December 2015, a total of 195 countries parties to the United Nations Framework Convention on Climate Change, reached a global agreement on the reduction of climate change in the coming years. After the first meeting in Berlin in 1995, parties to the Convention met once a year. They stressed that their aim was not to find the ultimate solution, but rather to responsibly address climate change at the global level. The most recent agreement provides an opportunity for the sustainable strengthening of environmental protection measures. Parties to the Convention agreed to report on the progress made in the implementation of the agreement and to ensure transparency and supervision; however, in order to reach the set targets, the parties will need to take on stronger commitments. The Paris Agreement will replace the Kyoto Protocol and will come into force in 2021.
Limiting climate change will require a considerable and continuous reduction in greenhouse gas emissions. The target agreed is limiting global warming to two degrees Celsius: we must keep the average global temperature from rising more than two degrees Celsius over preindustrial levels if we are to avoid irreversible changes to the climate at the global level. There is a growing awareness that climate change in connection with changes in precipitation patterns, melting glaciers, and the rising sea level bring about considerably higher costs compared to the costs of their mitigation. One of the key elements of the Paris Agreement is transition to clean energy, which means that resources have to shift away from polluting fossil fuels to investment in clean energy sources. Policy makers and businesses have been sent a clear signal that they need to begin investing in adjustment measures. Countries undertook to: (i) gradually reduce emissions; (ii) assist vulnerable countries in limiting climate change and coping with unavoidable impacts; and (iii) shift from fossil fuels to renewable energy and sustainable land use by 2050. The agreement does not indicate the extent to which emissions must be reduced by 2050. The EU as a whole undertook to reduce emissions by 40% by 2030 compared to 1990 levels, with targets for individual Member States not being set yet. The transition to a low-carbon economy could provide new business opportunities for Slovenia such as stimulating new green investments and creating jobs, facilitating a more efficient use of renewable energy sources and other natural resources, and creating a healthier and more human-friendly environment.
1 Sources: The United Nations Organisation, the European Environment Agency, the European Commission, the Ministry of the Environment and Spatial Planning of the Republic of Slovenia.
Figure 42: GHG emissions and emission intensity
Source: Eurostat Portal Page – Environment, 2016; Eurostat Portal Page – Economy and Finance, 2016; calculations by IMAD. Note: Emission intensity is calculated as the ratio of GHG emissions to the GDP in purchasing power standards.
50
60
70
80
90
100
110
120
2000
2001
2002
2003
2004
2005
2006
2007
2008
2009
2010
2011
2012
2013
Inde
x, 2
000=
100
GHG emissionsGHG emissions, EU GHG emissions, Slovenia
Emission intensity, EU Emission intensity, Slovenia
0.00
0.05
0.10
0.15
0.20
0.25
0.30
0.35
0.40
0.45
0.50
2008 2013
GH
G/G
DP
Emission intensity
Slovenia EU

71Development Report 2016Environmental, regional and spatial development
Calculations for 2014 show that emission intensity improved significantly in 2014. Since this was also due to one-off reasons (the closure of the thermal power plant and lower energy consumption for heating in the mild winter), further permanent improvements will be needed to achieve a long-term reduction in emission intensity and to prevent a further increase in GHG emissions.
The quality of air in Slovenia is closely related to the excessive levels of ozone and dust particles, which have not been improving over a longer period. Air pollution is one of the major environment-related causes of health problems in the population. In this regard, Slovenia is facing two major issues. The first is related to ozone and its precursors, which are largely caused by road traffic. The ozone concentration in Slovenia is heavily influenced by transboundary transfer from the lowlands of northern Italy. Since ozone concentrations depend on weather conditions, particularly winds from the west, the multiannual series of data do not show a clear trend.196 Another issue is the concentration of solid, dust or PM particles, which are one of the most dangerous air pollutants.197 In Slovenia, the most problematic particles are the largest, PM10 particles, particularly in the colder half of the year and in continental areas. Two-thirds of emissions of PM10 are from residential combustion sources. Despite significant pollution from biomass burning, Slovenia should not reduce or abolish the use of wood as an energy product, but rather raise awareness and improve technology.198 The concentration of these particles is heavily influenced by meteorological conditions, mostly temperature inversions, wind speed and precipitation. In the past several years, conditions were favourable and contributed to lower pollution levels; however, no visible progress has been made since 2008 in this regard. Although the exposure of the urban population to particles declined, it still remained high and was above the EU average.199
Energy consumption is decreasing; during the crisis, this was mainly due to low economic activity, and in recent years, this has been due to lower energy consumption for heating in mild winters. One of the three targets of the EU climate and energy package for 2020 is a 20% reduction in energy consumption with regard to anticipated consumption. In most of EU countries, this means a reduction in primary energy consumption compared to the base year of 2005, while in Slovenia and several other Member States, where, in the catching-up process in terms of economic development,
196 Environmental Indicators in Slovenia, 2014197 The European Environment, 2015.198 Prebil, 2016. 199 From the health point of view, older people and children are the two most exposed groups. In Slovenia, the largest proportion of children, on average, is exposed to PM10 concentration values ranging from 31 to 40 µg/m3, which considerably exceeds the concentration level recommended by the WHO, which is 20 µg/m (Health Statistical Yearbook, 2013).
a larger increase in energy consumption was expected, this entails a restriction on growth. Considering that in most EU countries, including Slovenia, these targets will be easy to achieve, the European Commission has adopted more ambitious targets for energy savings by 2030. In most countries, savings were higher than originally planned, which was also due to the fact that the economic situation was worse than anticipated at the time scenarios were developed and to the mild winter in 2014 and 2015. In these two years Slovenia recorded the highest average annual temperatures since the beginning of systematic measurements. Energy consumption for household heating in Slovenia decreased by a fifth in 2014 (see Indicator 4.2). A 20% energy savings target was also set for final energy consumption in the EU Member States. In Slovenia, as in the EU, final energy consumption was below the target value in 2014. In final energy consumption, the share of fuel consumption in transport was more significant in Slovenia than in the EU (in 2014, Slovenia – 40%, the EU average – 33%), which was mostly due to increased transit traffic through Slovenia (see Indicator 4.5).
The key factor in the high energy intensity200 of the Slovenian economy remains the use of energy in transport. In the period 2005–2014, final energy consumption, on average, decreased by 11% in the EU and by only 6% in Slovenia. The reduction in energy consumption was more pronounced in Slovenia than in the EU in industry, while the decrease in the consumption of energy products by households was similar to that in the EU. Slovenia also experienced a significant increase in fuel consumption in transport (by 22%; in the EU it decreased by 5%), which was the result of increased transit traffic through Slovenia. This
200 Energy intensity is a primary energy consumption per unit of GDP.
Figure 43: PM10 pollution and the exposure of the population to PM10, Slovenia and the EU
Source: Eurostat Portal Page – Environment and Energy, 2016.
0
5
10
15
20
25
30
35
40
0
2500
5000
7500
10000
12500
15000
17500
20000
2006 2007 2008 2009 2010 2011 2012 2013
Expo
sure
of t
he u
rban
pop
ulat
ion
to p
artic
les,
in
mic
rogr
ams/
m3
In to
ns
Other transport Energy production and distributionIndustrial boilers Industrial energy consumptionRoad transport AgricultureResidential combustion sources Exposure, Slovenia, right axis

72 Development Report 2016Environmental, regional and spatial development
put pressure on the total energy consumption; as a result, the energy intensity of the Slovenian economy even increased slightly during the crisis and, in 2014, it was already by around a quarter higher than in the EU (in 2005, it exceeded the EU level by 15%).201 With the continuing trend of high energy intensity and the economic recovery, the energy savings targets will be harder to achieve.
Transport is a sector that has a significant negative impact on the environment; the volume of freight transport by all modes has increased considerably with the expansion of the EU due to Slovenia’s location at the crossroads of transit routes. The share of road freight transport reached its peak in 2009; since then and given the annual fluctuations, a slight downward trend can be noticed (see Indicator 4.5). In 2015 it had increased to well over 80% (the EU in 2014: 75.3%) due to a large increase in the volume of road transport and a modest increase in rail transport. In the period 2005–2014, the volume of road freight transport carried out by Slovenian hauliers increased by a half. This was due to the increase in transport operations abroad, while in Slovenia, an increase was seen in transport operations by foreign hauliers. The volume of rail transport increased much less, by a quarter. In the same period, contrary to the trend in Slovenia, the volume of freight transported by road and by rail decreased by 4% and 2% respectively on average in the EU. In terms of both road and rail freight transport per capita, Slovenia has already significantly exceeded the EU average; in 2014, by two and a half times. This is due to Slovenia’s position at the crossing of the V and X European corridors and to the
201 In the temporal comparison, the indicator of primary energy per unit of GDP in fixed prices is used; in the comparison between the countries in individual years we use GDP expressed in purchasing power standards (PPS) for higher methodological accuracy.
increase in foreign trade flows through Slovenia with the expansion of the EU. In terms of the density of the motorway network per capita, Slovenia ranks at the top of the EU Member States. However, some parts of the railway infrastructure, which is also extensive, do not allow a faster increase in rail freight transport, which is a more acceptable mode of transport from the point of view of the environment.
In recent years, the decline in energy intensity has been more pronounced in manufacturing than on average in the economy. The decomposition analysis of energy consumption shows that the decrease in 2014 was due to a more efficient use or a decline in energy intensity in most industries, particularly in the manufacture of metals. This effect is particularly important in terms of ensuring export competitiveness, particularly in industries where energy consumption represents a significant part of expenses. Since 2005, the decline in energy intensity has been more pronounced in manufacturing than on average in the economy. There has been a move towards the average energy intensity of manufacturing industries in the EU; however, in terms of energy intensity, Slovenia is still above the EU average. This can be partly attributed to the industry structure, which is, to a greater extent than in other countries, based on industries where more energy is used in production processes. To some extent, this is also confirmed by an above-average proportion of emission-intensive industries in Slovenia202, which increased during the crisis and has been around a quarter since 2010. With the exception of the paper industry, the share of emission-intensive industries (the chemical industry, the manufacture of metal and non-metal products) in the total value added of manufacturing industries is higher in Slovenia than in the EU on average (see Indicator 4.3).
202 Defined according to the World Bank methodology.
Figure 44: Energy intensity, Slovenia (left) and comparison between Slovenia and the EU (right)
Source: Eurostat Portal Page – Environment and Energy - Energy, Eurostat Portal Page – Economy and Finance – National Accounts, 2014; calculations by IMAD.
60
65
70
75
80
85
90
95
100
105
2005 2006 2007 2008 2009 2010 2011 2012 2013 2014
Inde
x, 2
005=
100
Energy intensity of the economy
Energy intensity in manufacturing
0
20
40
60
80
100
120
140
EU Slovenia EU Slovenia
2005 2014In
toe/
1000
EU
R PP
S
Other final energy use
Contribution of energy use in road transport

73Development Report 2016Environmental, regional and spatial development
The share of renewable energy sources (RES) is higher than the EU average as a result of favourable natural conditions, with its growth slowing down considerably since 2009. In 2014, it amounted to 21.9% in Slovenia and to 16.0% in the EU on average (see Indicator 4.4). Until 2009, the growth in the use of RES was mostly contributed to by the increased use of wood or solid biomass, and later by the use of solar and geothermal energy. In 2014, the use of energy for heating declined considerably due to warm weather during the heating season. Since wood is an important source of energy for heating, its use declined significantly that year. The record high hydroelectric power production due to extremely favourable hydrological conditions in 2014 did not compensate for the reduction in renewable energy in heating (because the production of hydropower is calculated as normalised production, as an average over a longer period). For 2015 we estimate that there were no major changes in the use of RES and total final energy use, which means that the share of RES probably remained unchanged. Compared to the EU average, Slovenia uses a large share of RES in meeting its energy demand; however, in the period 2005–2014, the increase in the use of all RES in Slovenia was only half the increase in the EU (by 30% in Slovenia; by around 60% in the EU). The use of RES depends, to a large extent, on natural conditions, which are rather favourable in Slovenia, particularly from the point of view of the use of wood for heating and the use of hydropower to generate electricity.203 On the other hand, Slovenia is lagging behind the EU average in terms of the share of RES that come from less conventional sources (solar, wind
203 In this regard, attention should be drawn to the fact that climate change may have, in the long term, adverse effects on the water level of rivers and, as a result, on a lower production of hydropower.
and geothermal power, and biogas). In 2014, the share of these RES was only 12% in Slovenia and 36% in the EU, a large part of the difference being due to a more widespread use of wind power in the EU. Incentives for energy production from RES have increased since 2005, but their structure has changed to favour more expensive solar energy. Slovenia’s targets to achieve by 2020204 are a 25% share of RES in gross final energy consumption (EU: 20%) and a 10% share of RES in transport.
The resource productivity of the Slovenian economy has improved since the beginning of the crisis, mainly due to a downturn in construction, whereas the cost of raw materials per product unit remains high in most industries. In the period 2007–2013, resource productivity, which is an indicator of sustainable consumption and is expressed as the ratio of GDP to raw material consumption, increased to a greater extent in Slovenia than in the EU. The improvement was related to the reduced consumption of non-metallic minerals205 due to a significant downturn in construction activity,206 which again gathered pace in 2014 as the volume of construction orders increased. Resource productivity decreased by 3% in 2014, falling to 84% of the EU average (in 2012, when it was at its highest, it was 88%). An analysis based on the tables of supply and
204 Directive 2012/27/EU of the European Parliament and of the Council of 25 October 2012.205 Due to their specific weight, non-metallic materials significantly influence the overall material consumption, thus accounting to two-thirds of the total consumption in 2007 and 55% in 2014. These are in particular sand, gravel and limestone.206 According to data obtained from the Geological Survey of Slovenia, in 2014 three-quarters of non-metallic minerals were used as raw materials in civil engineering, further 17% as raw materials for building material industry and only 7% in manufacturing.
Figure 45: Domestic material consumption and resource productivity*, Slovenia (left) and the cost of materials used per unit of output by sectors of industry and construction in 2012 (right)
Source: SI–STAT data portal – The Environment, 2015; Eurostat Portal Page – Environment, 2015; calculations by IMAD. Note: *Resource productivity is the relationship between GDP and the domestic material consumption (in EUR/PPS/kg), shown in the chart relative to the EU. Domestic consumption of materials is defined as the domestic extraction plus net imports of materials.
0
10
20
30
40
50
60
70
80
90
100
0
4
8
12
16
20
24
28
32
36
40
44
48
52
2000
2001
2002
2003
2004
2005
2006
2007
2008
2009
2010
2011
2012
2013
2014
EU=1
00
In m
illio
n to
nnes
Metal ores Biomass and otherFossil energy sources Non-metallic mineralsMass productivity (right axis)
0
10
20
30
40
50
60
70
80
Sew
age
man
ag.; w
aste
; rec
yclin
gW
ater
col
lect
ion,
trea
tmen
t, su
pply
Min
ing
Elec
tric
ity, g
as a
nd st
eam
supp
lyCo
nstr
uctio
nM
fr.of
pha
rmac
. raw
mat
er.a
nd…
Repa
ir&in
stal
latio
n of
mac
h. a
nd…
Mfr.
of c
ompu
ter,
elec
tr.a
nd o
ptic
al…
Mfr.
of m
etal
sM
fr. o
f fur
nitu
re,o
th. m
iscel
l. Bu
sin.…
Mfr.
of n
on-m
etal
lic m
iner
al p
rodu
cts
Mfr.
of m
etal
. pro
., misc
.…Pr
intin
g, re
prod
uct.
of re
cord
ed…
Mfr.
of r
ubbe
r and
pla
stic
pro
duct
sPr
oces
sing,
re-p
roc.
of w
ood;
furn
iture
Mfr.
of t
extil
es, c
loth
es, l
eath
erM
fr. o
f ele
ctric
al e
quip
men
tM
fr. o
f mac
hine
s and
equ
ipm
ent
Mfr.
of f
oods
, bev
. and
toba
cco
pro.
Mfr.
of o
ther
veh
icle
s and
ves
sels
Mfr.
of c
hem
ical
s and
che
mic
al p
ro.
Mfr.
of p
aper
and
pap
er p
rodu
cts
Mfr.
of m
ot. v
ehic
les,
trai
lers
, sem
i-…
Prod
uctio
n va
lue
%
Slovenia EU
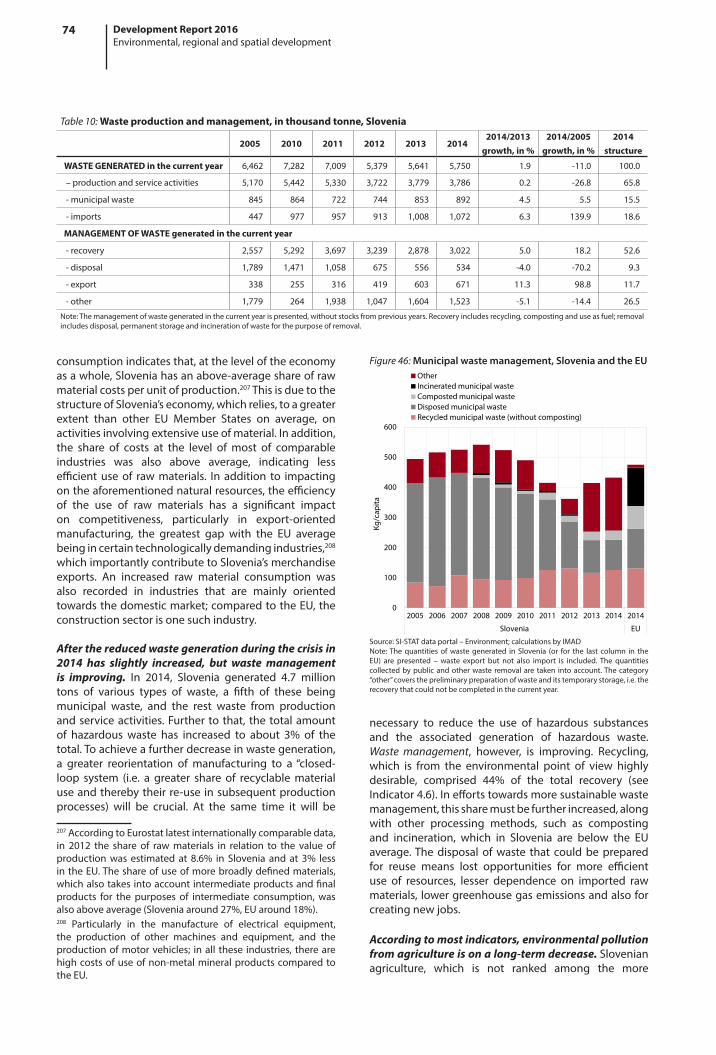
74 Development Report 2016Environmental, regional and spatial development
consumption indicates that, at the level of the economy as a whole, Slovenia has an above-average share of raw material costs per unit of production.207 This is due to the structure of Slovenia’s economy, which relies, to a greater extent than other EU Member States on average, on activities involving extensive use of material. In addition, the share of costs at the level of most of comparable industries was also above average, indicating less efficient use of raw materials. In addition to impacting on the aforementioned natural resources, the efficiency of the use of raw materials has a significant impact on competitiveness, particularly in export-oriented manufacturing, the greatest gap with the EU average being in certain technologically demanding industries,208 which importantly contribute to Slovenia’s merchandise exports. An increased raw material consumption was also recorded in industries that are mainly oriented towards the domestic market; compared to the EU, the construction sector is one such industry.
After the reduced waste generation during the crisis in 2014 has slightly increased, but waste management is improving. In 2014, Slovenia generated 4.7 million tons of various types of waste, a fifth of these being municipal waste, and the rest waste from production and service activities. Further to that, the total amount of hazardous waste has increased to about 3% of the total. To achieve a further decrease in waste generation, a greater reorientation of manufacturing to a “closed-loop system (i.e. a greater share of recyclable material use and thereby their re-use in subsequent production processes) will be crucial. At the same time it will be
207 According to Eurostat latest internationally comparable data, in 2012 the share of raw materials in relation to the value of production was estimated at 8.6% in Slovenia and at 3% less in the EU. The share of use of more broadly defined materials, which also takes into account intermediate products and final products for the purposes of intermediate consumption, was also above average (Slovenia around 27%, EU around 18%). 208 Particularly in the manufacture of electrical equipment, the production of other machines and equipment, and the production of motor vehicles; in all these industries, there are high costs of use of non-metal mineral products compared to the EU.
necessary to reduce the use of hazardous substances and the associated generation of hazardous waste. Waste management, however, is improving. Recycling, which is from the environmental point of view highly desirable, comprised 44% of the total recovery (see Indicator 4.6). In efforts towards more sustainable waste management, this share must be further increased, along with other processing methods, such as composting and incineration, which in Slovenia are below the EU average. The disposal of waste that could be prepared for reuse means lost opportunities for more efficient use of resources, lesser dependence on imported raw materials, lower greenhouse gas emissions and also for creating new jobs.
According to most indicators, environmental pollution from agriculture is on a long-term decrease. Slovenian agriculture, which is not ranked among the more
Table 10: Waste production and management, in thousand tonne, Slovenia
2005 2010 2011 2012 2013 20142014/2013
growth, in %2014/2005
growth, in %2014
structure
WASTE GENERATED in the current year 6,462 7,282 7,009 5,379 5,641 5,750 1.9 -11.0 100.0
– production and service activities 5,170 5,442 5,330 3,722 3,779 3,786 0.2 -26.8 65.8
- municipal waste 845 864 722 744 853 892 4.5 5.5 15.5
- imports 447 977 957 913 1,008 1,072 6.3 139.9 18.6
MANAGEMENT OF WASTE generated in the current year
- recovery 2,557 5,292 3,697 3,239 2,878 3,022 5.0 18.2 52.6
- disposal 1,789 1,471 1,058 675 556 534 -4.0 -70.2 9.3
- export 338 255 316 419 603 671 11.3 98.8 11.7
- other 1,779 264 1,938 1,047 1,604 1,523 -5.1 -14.4 26.5
Note: The management of waste generated in the current year is presented, without stocks from previous years. Recovery includes recycling, composting and use as fuel; removal includes disposal, permanent storage and incineration of waste for the purpose of removal.
Figure 46: Municipal waste management, Slovenia and the EU
Source: SI-STAT data portal – Environment; calculations by IMAD Note: The quantities of waste generated in Slovenia (or for the last column in the EU) are presented – waste export but not also import is included. The quantities collected by public and other waste removal are taken into account. The category “other” covers the preliminary preparation of waste and its temporary storage, i.e. the recovery that could not be completed in the current year.
0
100
200
300
400
500
600
2005 2006 2007 2008 2009 2010 2011 2012 2013 2014 2014
Slovenia EU
Kg/c
apita
OtherIncinerated municipal wasteComposted municipal wasteDisposed municipal wasteRecycled municipal waste (without composting)
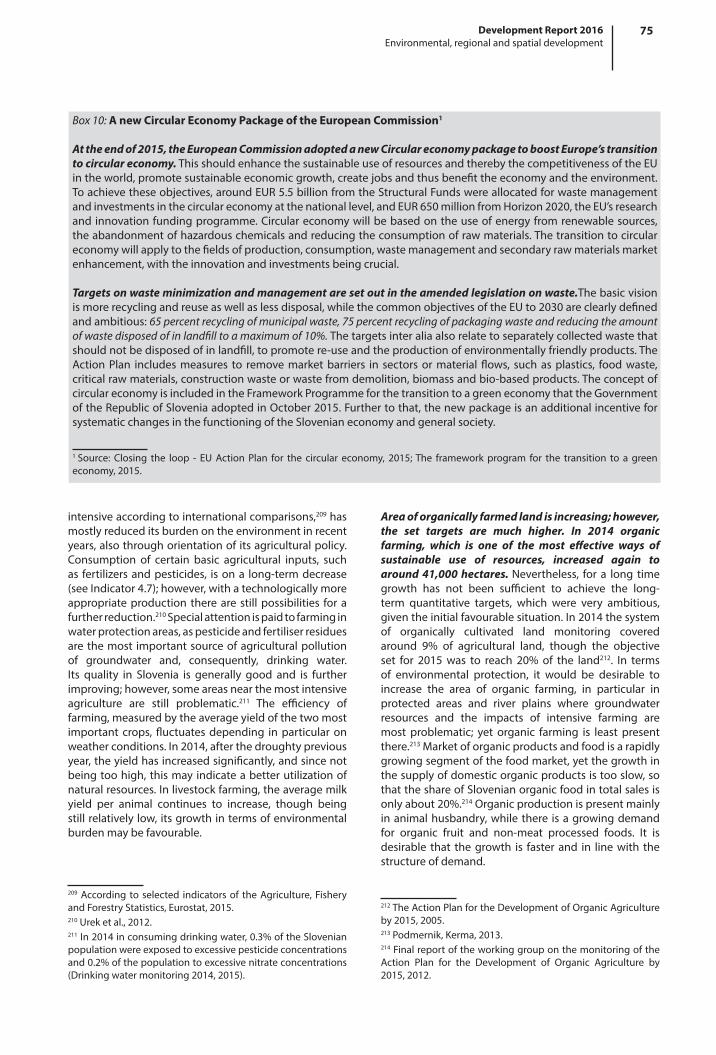
75Development Report 2016Environmental, regional and spatial development
intensive according to international comparisons,209 has mostly reduced its burden on the environment in recent years, also through orientation of its agricultural policy. Consumption of certain basic agricultural inputs, such as fertilizers and pesticides, is on a long-term decrease (see Indicator 4.7); however, with a technologically more appropriate production there are still possibilities for a further reduction.210 Special attention is paid to farming in water protection areas, as pesticide and fertiliser residues are the most important source of agricultural pollution of groundwater and, consequently, drinking water. Its quality in Slovenia is generally good and is further improving; however, some areas near the most intensive agriculture are still problematic.211 The efficiency of farming, measured by the average yield of the two most important crops, fluctuates depending in particular on weather conditions. In 2014, after the droughty previous year, the yield has increased significantly, and since not being too high, this may indicate a better utilization of natural resources. In livestock farming, the average milk yield per animal continues to increase, though being still relatively low, its growth in terms of environmental burden may be favourable.
209 According to selected indicators of the Agriculture, Fishery and Forestry Statistics, Eurostat, 2015.210 Urek et al., 2012.211 In 2014 in consuming drinking water, 0.3% of the Slovenian population were exposed to excessive pesticide concentrations and 0.2% of the population to excessive nitrate concentrations (Drinking water monitoring 2014, 2015).
Area of organically farmed land is increasing; however, the set targets are much higher. In 2014 organic farming, which is one of the most effective ways of sustainable use of resources, increased again to around 41,000 hectares. Nevertheless, for a long time growth has not been sufficient to achieve the long-term quantitative targets, which were very ambitious, given the initial favourable situation. In 2014 the system of organically cultivated land monitoring covered around 9% of agricultural land, though the objective set for 2015 was to reach 20% of the land212. In terms of environmental protection, it would be desirable to increase the area of organic farming, in particular in protected areas and river plains where groundwater resources and the impacts of intensive farming are most problematic; yet organic farming is least present there.213 Market of organic products and food is a rapidly growing segment of the food market, yet the growth in the supply of domestic organic products is too slow, so that the share of Slovenian organic food in total sales is only about 20%.214 Organic production is present mainly in animal husbandry, while there is a growing demand for organic fruit and non-meat processed foods. It is desirable that the growth is faster and in line with the structure of demand.
212 The Action Plan for the Development of Organic Agriculture by 2015, 2005. 213 Podmernik, Kerma, 2013.214 Final report of the working group on the monitoring of the Action Plan for the Development of Organic Agriculture by 2015, 2012.
Box 10: A new Circular Economy Package of the European Commission1
At the end of 2015, the European Commission adopted a new Circular economy package to boost Europe’s transition to circular economy. This should enhance the sustainable use of resources and thereby the competitiveness of the EU in the world, promote sustainable economic growth, create jobs and thus benefit the economy and the environment. To achieve these objectives, around EUR 5.5 billion from the Structural Funds were allocated for waste management and investments in the circular economy at the national level, and EUR 650 million from Horizon 2020, the EU’s research and innovation funding programme. Circular economy will be based on the use of energy from renewable sources, the abandonment of hazardous chemicals and reducing the consumption of raw materials. The transition to circular economy will apply to the fields of production, consumption, waste management and secondary raw materials market enhancement, with the innovation and investments being crucial.
Targets on waste minimization and management are set out in the amended legislation on waste.The basic vision is more recycling and reuse as well as less disposal, while the common objectives of the EU to 2030 are clearly defined and ambitious: 65 percent recycling of municipal waste, 75 percent recycling of packaging waste and reducing the amount of waste disposed of in landfill to a maximum of 10%. The targets inter alia also relate to separately collected waste that should not be disposed of in landfill, to promote re-use and the production of environmentally friendly products. The Action Plan includes measures to remove market barriers in sectors or material flows, such as plastics, food waste, critical raw materials, construction waste or waste from demolition, biomass and bio-based products. The concept of circular economy is included in the Framework Programme for the transition to a green economy that the Government of the Republic of Slovenia adopted in October 2015. Further to that, the new package is an additional incentive for systematic changes in the functioning of the Slovenian economy and general society.
1 Source: Closing the loop - EU Action Plan for the circular economy, 2015; The framework program for the transition to a green economy, 2015.

76 Development Report 2016Environmental, regional and spatial development
Felling, wood assortment production and export of unprocessed wood, which have been rising for quite some time, considerably increased in 2014 due to extensive glaze ice damage. In the last few decades, felling in relation to the growth of wood has been relatively low.215 In 2014, when half of the Slovenian forests were affected by strong glaze ice, tree felling was increased significantly, to almost twofold the average annual amount since 2000 (see Indicator 4.8). While the recorded tree felling in previous years represented only about two-thirds of the allowed value, in 2014, for the first time since its monitoring, it scored or slightly exceeded this value by quantity but not also by the desired structure. The production of unprocessed timber, which depends not only on felling, but also on the utilisation of felled trees, was half higher than in the previous year. About a half of the total annual increase in timber acquisition was export oriented. Further to that, the export of the highest quality unprocessed wood has increased considerably despite that its production has increased the least. Recent years have witnessed the extensive and rapidly increasing export of this timber, and this represents an unexploited potential to
215 Further to that, in state-owned forests trees were felled approximately in the volumes of the planned or permitted felling, whereas tree felling in privately-owned forests, which make a majority, it was considerably lagging behind.
achieve higher employment and higher added value in further stages of the forest-wood chain. Apart from the significant negative consequences of glaze ice, there are also some positive ones as a wider rejuvenation will lead to an increased biological and structural diversity and improved health status of forests.216
4.1.2 Selected environmental measures
The share of environmental taxes in GDP in Slovenia is above the EU average, their growth after 2008 being stimulated mainly with a view to reducing the public deficit. Total revenues from environmental taxes in 2014 amounted to EUR 1.43 billion and were by more than a quarter higher compared to 2008. Major part of the increase after 2008 is attributable to increases in rates of excise duties on energy products, particularly in the years 2009 and 2012, and the implementation of the CO2 tax on liquid fuels in 2012. Two-thirds of environmental taxes were borne by households. Since 2008, this share has slightly decreased, partly as a result of methodological simplification, whereby the majority of fuel consumption is attributable to households. Measured by the share of environmental taxes paid in the value of production (and added value), in 2014 the most burdened activity was energy supply with steam and electricity, followed 216 Breznikar, 2016.
Figure 47: Organic farming areas, Slovenia and the EU
Source: Eurostat Portal Page – Statistics – Agriculture and Fisheries, 2016; SURS, 2016.Note: The target for 2015 is set out in the Action Plan for Organic Farming; target area 20% of UAA is translated to the situation in year 2014.
0
5
10
15
20
25
0
20
40
60
80
100
2005 2006 2007 2008 2009 2010 2011 2012 2013 2014 2015…
Shar
e in
%
Area
in th
ousa
nd h
a
Areas in transition to eco farming, SloveniaEco farming areas with certificate, SloveniaShare of organic farming areas, Slovenia (right axis)Share of organic farming areas, EU-27 (right axis)
Table 11: Forest and commercial utilisation, Slovenia
2000 2005 2010 2011 2012 2013 20142014/2013
growth, in %1014/2000
growth, in %
Forest area (in thousand ha) 1,134 1,169 1,185 1,184 1,185 1,183 1,182 -0.1 4.2
Growing stock (in million m3) 263 301 331 334 338 342 346 1.1 31.7
Yearly increment of wood (in thousand m3) 6,872 7,569 8,117 8,266 8,420 8,492 8,582 1.1 24.9
Tree felling (in thousand m3) 2,609 3,253 3,374 3,896 3,911 3,924 6,350 61.8 143.4
Source: SURS, Slovenian Forest Service; calculations by IMAD.
Figure 48: Unprocessed timber production, its structure and net exports, Slovenia
Source: SURS.
-1
0
1
2
3
4
5
6
2000
2001
2002
2003
2004
2005
2006
2007
2008
2009
2010
2011
2012
2013
2014
mill
ion
m3
Firewood Industrial wood Net exports of wood

77Development Report 2016Environmental, regional and spatial development
by transport and storage activities.217 After 2008, the burden of both has increased, which applies also to less burdened processing industry. According to the share of revenue from environmental taxes in GDP, in 2014 (3.9%) Slovenia exceeded the weighted average of the EU by 1.4 pps. The latter is mainly attributable to the extensive use of motor fuels in road traffic resulting from the dispersed population settlement, a large volume of transit traffic and poorly developed railroad and general public passenger transport.218
Despite the increase in the taxation of energy products after 2008, the excise duty rates on individual products, likewise in the EU, still do not reflect their energy content and CO2 emissions. The implicit tax rate (ITR) on energy consumption in 2014 amounted to EUR 236.4 per tonne of petroleum oil equivalent, which was 42% more than in the pre-crisis year 2008.219 The increase inspired by the need to balance public finances exceeded the EU average. In this year, the ITR for energy consumption was by 17% higher than the unweighted average of the EU Member States220 and 8% higher than the average in the neighbouring countries. The excess results from a relatively high taxation of liquid fuels in Slovenia, which
217 Burden of transport and storage was otherwise moderate. With a rapid increase in rates of excise duties in 2009, there was the possibility of a partial refund of duties paid on diesel fuel for motor vehicles for the purpose of commercial use (up to the minimum level set out in the EU Energy Directive).218 In accordance with the index of global competitiveness (WEF, 2015–2016), in terms of railway infrastructure Slovenia ranked 47th among 140 countries (21st among EU Member States), and 44th as regards the quality of roads (16th among EU Member States).219 ITR for energy consumption measures the effective average tax load of 1 tonne of oil equivalent.220 For the EU we give normal or weighted arithmetic mean, which was much closer to the median than the weighted average (EUR 219.3 per tonne) published by Eurostat (2016).
– after being lower than in the neighbouring countries and the EU average in 2008 – has significantly increased. In 2014, public levies (environmental taxes, VAT and other public levies) per litre of 95-octane gasoline and diesel fuel were higher than in all neighbouring countries, except in Italy. In comparison with the weighted average of the EU, they were slightly lower for gasoline but were comparable for diesel fuel.221 The excise duty rates on gasoline were in Slovenia and in almost all other EU Member States (despite slightly lower CO2 emissions per litre of fuel) higher than for diesel fuel. Coal, an energy source with the highest CO2 content, has one of the lowest tax rates per unit of CO2 emissions in both Slovenia and the majority of developed countries.222 In recent years, the effectiveness of environmental taxes to protect the environment has been adversely affected by: (i) the ineffectiveness of the European ETS Allowances since the permissions for CO2 emissions in many companies exceeded their needs; (ii) environmentally harmful subsidies; and (iii) the plummeting oil prices since mid-2014, which reduce the dampening effect of higher taxes on oil consumption and incentives for the development of cleaner energy sources.223
At the end of 2015, the absorption of EU funds from the 2007–2013 programme period was completed, in which Slovenia achieved a high turnover within
221 Annual average for the EU is calculated from the weekly Oil Bulletin data (2016) for a weighted average of energy prices including duty and energy prices excluding duty. Calculations for a simple average, which (consistently with the lower ITR on energy use) was probably lower than in Slovenia, are not available. 222 OECD Taxing Energy Use 2013, p. 36.223 Fricke, 2016.
Figure 49: Revenues from environmental taxes, Slovenia
Source: SI-STAT – The environment and natural resources – environmental taxes, September 2015.
0.0
0.5
1.0
1.5
2.0
2.5
3.0
3.5
4.0
4.5
0.0
0.2
0.4
0.6
0.8
1.0
1.2
1.4
1.6
1.8
2008 2009 2010 2011 2012 2013 2014
In %
GD
P
In b
illio
n EU
R
Taxes on pollution and the use of natural resourcesTransport taxesEnergy taxesShare of revenues from environmental taxes in GDP, % (right axis)
Figure 50: Taxes and other public duties levied on gasoline and diesel fuel, Slovenija, neighbouring countries and the EU
Source: Oil Bulletin data (2015); calculations by IMAD.Notes: NMB – unleaded gasoline. *EU value applies to the weighted average of EU Member States; **Average values of public levies in an individual year are presented, calculated on the basis of a weekly published data on retail prices including taxes and other charges and retail prices excluding taxes and other charges.
0
200
400
600
800
1000
1200
Slov
enia
Aust
ria
Hun
gary
Italy
EU*
Slov
enia
Aust
ria
Croa
tia
Hun
gary
Italy
EU*
2008 2014
Taxe
s and
oth
er d
utie
s, EU
R / 1
000L
NMB gasoline, 95 Oct. Diesel fuel

78 Development Report 2016Environmental, regional and spatial development
the cohesion policy for transport and environmental infrastructure (OP ETID). By the end of 2015, EUR 1.6 billion was paid to beneficiaries from the state budget (106% of the funds available), and the budget was refunded EUR 1.5 billion (96% of the funds available).224 Most of the payments (approx. one-third) were made for environmental protection projects, about a quarter for railway infrastructure, and the least for municipal waste management.225 As in the new financial period only around EUR 1.1 billion are earmarked for infrastructure projects, in the event that the state will not provide additional sources of financing, the investment activities intended for transport and environmental infrastructure will be significantly reduced.226
Since 2011 the share of government budget appropriations on R&D for environmental and energy purposes in the overall funding for R&D has been decreasing, while the number of green patents remains modest. In 2014, the government budget appropriations for environmental and energy research amounted to EUR 10.3 million, i.e. by around 35% less for both purposes as compared to 2011, which was the most favourable year in this respect. The decrease reflects a general reduction of government investments in R&D in this period after several years of their high growth. Investments by the business sector, i.e. the private sector, also increased in real terms in the period 2011–2014. The total share of funds allocated for these purposes in the average of EU countries is higher than in Slovenia. According to
224 The highest turnover was recorded in 2014 and 2015 (60.5%). 225 Part of the funds for municipal waste management was transferred to other developmental priorities.226 In the new financial period, these projects were allocated EUR 1,055 million, of which EUR 895 million was earmarked for the cohesion fund and EUR 160 million for the CEF (Connecting European facility).
the relevant statistical data,227 no significant progress was made with regard to green patents, i.e. patents related to environmental technologies.228 The latest available statistics from the OECD show that in 2005–2011, the majority of first patent applications with the EPO were filed in the area of energy-related climate change mitigation technologies.229 The composite eco-innovation index230 for 2013231 shows a below-average value for Slovenia in comparison to the EU, while among the neighbouring countries Austria and Italy ranked much better. Thus, the low volume of green patents and in general modest exploitation of the potential of the dynamic global market of environmental technologies232 227 At the end of 2015, the OECD published new data on green growth indicators. The share of government budget appropriations for environmental research related R&D is monitored in terms of economic opportunities and policy responses. As regards green patents, there have also been changes in individual technology groups, which explains a break in the series of data (OECD Green Growth Indicators 2014, 2014).228 According to the new definition, green patents include the following environment-related technology groups: (i) environmental management (the reduction of air and water pollution, waste management, land restoration, environmental control); (ii) water-related adaptation technologies (technologies on the sides of demand and supply); (iii) technologies to mitigate the consequences of climate change in the areas of energy, transport and buildings; and (iv) the capture, storage, sequestration or removal of greenhouse gases (Haščič and Migotto, 2015).229 In the period 2005–2011, Slovenian applicants filed with the EPO 28 first patent applications under the former definition and 33 under the new one. As regards environmental technologies, where the majority of submitted patent applications belong to, nothing has changed – technology related to climate change mitigation in relation to energy remains the leading area of Slovenian patent applicants. 230 Eco-innovation Scoreboard, 2014.231 Composite index components measure eco-innovation related activities which yield positive environmental benefits either due to a decrease in the consumption of natural resources or reduced emission of harmful substances throughout the life cycle (Eco-innovation Observatory-Annual Report 2012, 2013).232 In the period 1980–2005, green patents based on environmental technologies falling under the new definition
Figure 51: The structure of payments from 2007–2013 ETID OP, 2015 year-end stock, Slovenia
Source: GODECP, 2016.
Railway infrastructure
Road and maritime
infrastructure
Transport infrastructureMunicipal
waste management
Environmental protection -…
Sustainable energy use
Technical assistance
Table 12: Government budget appropriations for environment and energy as a percentage* of total government R&D budget
In %* 2008 2009 2010 2011 2012 2013 2014
Slovenia
Environment 3.51 2.27 3.27 3.36 2.98 3.10 3.30
Energy 1.11 1.58 1.99 3.59 2.79 2.90 3.08
EU
Environment 2.87 2.80 2.70 2.62 2.62 2.55 2.46
Energy 3.73 3.61 3.86 3.85 3.82 4.25 4.20
Source: Eurostat Portal Page – Science and Technology – Research and Development, 2015; SURS, 2014.Note: *In accordance with the methodology of the Frascati Manual, this involves all appropriations of the state for the implementation of R&D within the state and abroad, regardless of the implementing sector (OECD, 2002).

79Development Report 2016Environmental, regional and spatial development
remain unexploited opportunities for Slovenian R&D activity and sustainable economic growth.
4.2 Regional development
The regional development policy aims to ensure that development among the regions is more balanced. The regional disparities in Slovenia, which are relatively low, underwent a further decrease during the crisis. This was mainly due to the advantages of more developed regions decreasing at a faster rate and, to a lesser extent, the measures associated with the balanced regional development policy. For areas where the economic situation has deteriorated significantly, policy measures for
represented approximately 5% of all the innovations patented in the world. After 2005 their share increased and had reached approximately 10% by 2015 (Haščič and Migotto, 2015).
temporary developmental support have been envisaged but, given the urgency of the fiscal consolidation required, are very limited. In recent years European cohesion funds, in particular, have been of paramount importance for regional development, and the drawdown of these funds in the last programme period has been significantly accelerated. These funds will also be an important development factor in the current period, and full attention will have to be paid to their drawing.
According to the development risk index (DRI), Osrednjeslovenska is the least and Pomurska the most developmentally disadvantaged region. The DRI is an aggregate indicator233 which has been implemented for the purpose of monitoring regional development in the 2014–2020 programming period. The calculation
233 It consists of 14 indicators of development, which are specified in the legend under Map 1. More about methodology in the Development Report 2015, p. 76.
Map 1: Development risk index (DRI), 2015
1 Gross domestic product per capita 6 % of population with tertiary education (aged 25–64) 11 Registered unemployment rate
2 Gross value added per employee 7 % of gross domestic expenditure on R&D in GDP 12 Ageing Index
3 % of gross fixed capital formation in GDP 8 % of at least secondary wastewater treatment 13 Disposable income per capita
4 Registered unemployment rate (aged 15–29) 9 % of protected area surface 14 Population density - km2/inhabitant
5 Employment rate (aged 20–64) 10 % of estimated damage caused by natural disasters in GDP
Source: SURS, ARSO, URSZR, MGRT, DRI upravljanje investicij d.o.o.; calculated by IMAD.Note: Diamond charts show standardised values of individual indicators that make up the DRI and range from 0 (worst value) to 1 (best value). According to the DRI, the Pomurska region is the worst with a number of indicators taking value 0, whereas in the Osrednjeslovenska region, which is the best, the indicators with value 1 prevail.

80 Development Report 2016Environmental, regional and spatial development
for 2015 shows that Osrednjeslovenska remains the least developmentally disadvantaged region, i.e. the most economically developed one. Its GDP per capita is approximately 40% higher than the Slovenian average and it has generated a third of Slovenian gross value added. It stands out in terms of the high education profile of its population, the high share of its gross domestic expenditure on R&D in terms of GDP and its above-average disposable income per capita. In recent years, it has been among the regions that were least affected by natural disasters. However, in the region, relatively poor care is taken of wastewater treatment with at least secondary wastewater treatment, but this too was improved in 2015. At the other end of the spectrum is Pomurska, the most developmentally disadvantaged region. With a GDP per capita which lags approximately one-third behind the Slovenian average, it is among the weakest regions economically. The standard of education of the population is low and its rate of registered unemployment is high, both the total and among 15–29 year olds. Its disposable income per capita also lags behind the Slovenian average. In recent years, it has been considerably more affected than other regions by natural disasters. The remaining regions234 can be classified into two groups. The first comprises regions
234 Regulation (EC) No. 1319/2013 adopted in 2013 implemented some changes at the NUTS 3 level regions: Notranjsko-kraška region was renamed Primorsko-Notranjska, with Spodnjesavska becoming the Posavska region. The borders of four NUTS 3 regions were changed as follows: the municipality of Litija was excluded from the Osrednjeslovenska region and included in Zasavska region; and the municipalities of Radeče and Bistrica ob Sotli were excluded from the Savinjska region and included in the Posavska region. The inclusion of the municipality of Litija into the Zasavska region resulted in the borders of the NUTS 2 regions being changed. The change was implemented in 2015. Since the data for previous years have not been adapted to the changes, according to the new NUTS regulation, they are shown only for this year.
with low development risk: Gorenjska, Obalno-kraška and Goriška, all belonging to the cohesion regions of Zahodna Slovenija, and Savinjska and Jugovzhodna Slovenija from the Vzhodna Slovenija cohesion region. In the second group are regions with higher development risk: formerly, these used to be strong industrial regions – Koroška, Podravska, Zasavska, Posavska and Primorsko-Notranjska, the latter two with a relatively high share of agriculture in the GVA; all of them belong to the Vzhodna Slovenija cohesion region.
During the crisis, the regional differences in economic development, which had been previously increasing, decreased due to a major decline in activity in the economically stronger regions. The increase in regional differences before the crisis was mainly due to the concentration of economic activity in the Osrednjeslovenska region, which generated more than a third of total GDP. Nevertheless, a large part of the added value is generated by the remaining regions, thus reducing regional differences, which have never been as big as in some other EU countries, and in particular in the East European ones. This was largely influenced by the longstanding policy of a balanced regional development. The increasing regional disparities in disposable income are mitigated by higher social transfers to poorer regions. Regional disparities are further diminished by increasing daily labour migrations, which allow the creation of income in developed regions and spending in poorer ones. During the crisis, regional disparities decreased further (see Indicators 4.10 and 4.11) and remained stable mainly due to an accelerated decrease in economic activities in economically more developed regions. At that time, economically weaker regions were less affected though they were still lagging behind in development. With revival of the economy, once again an increase in regional disparities may be expected. Supported by regional policy, in the regions with
Table 13: Development risk index
Statistical region (NUTS 3) 2014 2015Rank2014
Rank2015
Osrednjeslovenska 35.5 37.3 12 12
Jugovzhodna Slovenija 64.7 65.5 11 11
Gorenjska 66.6 75.2 10 10
Obalno-kraška 81.4 85.1 9 9
Savinjska 92.6 88.2 8 8
Goriška 100.4 97.3 7 7
Posavska 101.5 102.9 6 6
Koroška 121.6 112.9 5 5
Podravska 123.9 117.5 4 4
Zasavska 125.1 126.8 2 3
Primorsko-Notranjska 124.8 127.6 3 2
Pomurska 161.8 161.6 1 1
The ratio between the highest and lowest ranked region 4.6 4.3
The coefficient of variation 33.0 31.6
Source: SURS, ARSO, URSZR, MGRT, DRI upravljanje investicij d.o.o., calculated by IMAD.
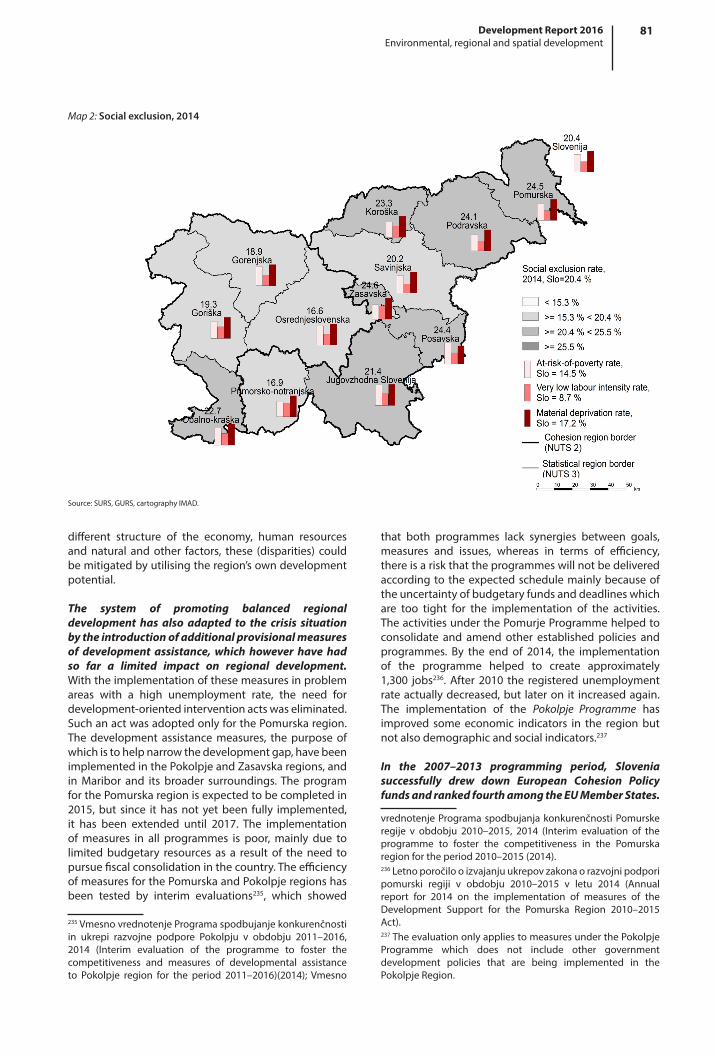
81Development Report 2016Environmental, regional and spatial development
different structure of the economy, human resources and natural and other factors, these (disparities) could be mitigated by utilising the region’s own development potential.
The system of promoting balanced regional development has also adapted to the crisis situation by the introduction of additional provisional measures of development assistance, which however have had so far a limited impact on regional development. With the implementation of these measures in problem areas with a high unemployment rate, the need for development-oriented intervention acts was eliminated. Such an act was adopted only for the Pomurska region. The development assistance measures, the purpose of which is to help narrow the development gap, have been implemented in the Pokolpje and Zasavska regions, and in Maribor and its broader surroundings. The program for the Pomurska region is expected to be completed in 2015, but since it has not yet been fully implemented, it has been extended until 2017. The implementation of measures in all programmes is poor, mainly due to limited budgetary resources as a result of the need to pursue fiscal consolidation in the country. The efficiency of measures for the Pomurska and Pokolpje regions has been tested by interim evaluations235, which showed
235 Vmesno vrednotenje Programa spodbujanje konkurenčnosti in ukrepi razvojne podpore Pokolpju v obdobju 2011–2016, 2014 (Interim evaluation of the programme to foster the competitiveness and measures of developmental assistance to Pokolpje region for the period 2011–2016)(2014); Vmesno
that both programmes lack synergies between goals, measures and issues, whereas in terms of efficiency, there is a risk that the programmes will not be delivered according to the expected schedule mainly because of the uncertainty of budgetary funds and deadlines which are too tight for the implementation of the activities. The activities under the Pomurje Programme helped to consolidate and amend other established policies and programmes. By the end of 2014, the implementation of the programme helped to create approximately 1,300 jobs236. After 2010 the registered unemployment rate actually decreased, but later on it increased again. The implementation of the Pokolpje Programme has improved some economic indicators in the region but not also demographic and social indicators.237
In the 2007–2013 programming period, Slovenia successfully drew down European Cohesion Policy funds and ranked fourth among the EU Member States.
vrednotenje Programa spodbujanja konkurenčnosti Pomurske regije v obdobju 2010–2015, 2014 (Interim evaluation of the programme to foster the competitiveness in the Pomurska region for the period 2010–2015 (2014). 236 Letno poročilo o izvajanju ukrepov zakona o razvojni podpori pomurski regiji v obdobju 2010–2015 v letu 2014 (Annual report for 2014 on the implementation of measures of the Development Support for the Pomurska Region 2010–2015 Act).237 The evaluation only applies to measures under the Pokolpje Programme which does not include other government development policies that are being implemented in the Pokolpje Region.
Map 2: Social exclusion, 2014
Source: SURS, GURS, cartography IMAD.

82 Development Report 2016Environmental, regional and spatial development
IPOP, which is also the basis for drafting the state budget, should be changing depending on the actual drawing of funds, but at least before the adoption or amendment of the state budget or after its revision.
4.3 Sustainable spatial development
Awareness of the significance of the spatial aspect of development has been increasing, but the system for its planning and monitoring is not efficient enough. Its drawbacks are in particular the lack of a strategic and long-term oriented approach to addressing developmental issues and the lack of coordination of public policies. This also affects the length of procedures and low feasibility of the adopted spatial plans. Settlement trends show a deviation from the established guidelines of the Spatial Development Strategy of Slovenia, since the development, rather than being spatially balanced, is strengthened along the motorway network. This is to a large extent affected by the mismatch between the location of jobs and housing. The real estate market is gradually reviving, but the problem of limited possibility of hiring a flat remains unresolved.
Comprehensive systemic reform of the spatial planning policy is continued with the aim to establish a more efficient spatial planning. Despite the numerous amendments in the last decade, the existing system is inefficient, which is reflected mainly in lengthy procedures. The main reason is the equivalence of sectoral policies in exercising their visions in space, which renders their mutual coordination difficult if not impossible. A new comprehensive upgrading of the umbrella and sectoral legislation244 is being prepared, which includes the preparation of a new spatial development strategy, a new Spatial Development Strategy, a new Spatial Planning Act, Building Construction and Civil Engineering Act, and Chartered Architects and Engineers Act. An important novelty is the reintegration of regional development and spatial planning, which has in practice already been successfully implemented in the preparation of regional development programmes 2014–2020. The gradual improvement of computerisation of operations (eSpace, eBuilding, ePlan) and the implementation of land policy instruments is also envisaged. The inefficiency of the system is also due to the lack of quality of spatial data, which are the basis for informed decision-making, management and monitoring of the planned spatial development. In its action part, new Spatial Development Strategy will include development guidelines for functional urban areas and measurable targets.
The problem of a lack of coordination of the planned spatial activities often reflects the absence of prior
244 Izhodišča normativnih sprememb na področju urejanja prostora in graditve objektov – predlog za obravnavo – novo gradivo št. 2 (Bases for regulatory changes in the area of spatial planning and construction of buildings – proposal for discussion – new materials, no. 2). MzIP, 2013.
With the aim of full and efficient utilisation of European funds, their absorption was accelerated in the period 2012–2015. Certain simplifications in the drawing process and additional spending rights for all thee operative programmes (OP) have been introduced.238 Throughout the 2007–2013 programming period, EUR 4.3 billion was paid from the state budget, and around EUR 4 billion reimbursed.239 Fund’s drawdown was most successful in OP SRDP,240 and, among the regions, in the Obalno-kraška region. With respect to the plan, about three times more enterprises were supported, one and a half times more broadband connections realised and a third more new jobs created. Expectations, however, have not been fulfilled as regards the integration of natural and cultural potentials, newly opened emergency centres, new and renovated sports and recreational areas and development projects in Natura 2000 sites.
The European funds, which will also be important development resources in the current 2014–2020 programming period, will be drawn within a single OP, and the area of regional development will be included into it as a horizontal priority.241 The OP is divided into 11 priority axes. Emphasis will be placed on enhancing the achievements of the past programming period and creating new added value in the economy, based on comprehensive projects. These are intended to integrate different stakeholders, potentials and needs, thus creating synergies between sectors and regions. Regional projects can be financed in the framework of the content-related priority axes and on the basis of the division to the Vzhodna Slovenija and Zahodna Slovenija cohesion regions.242 An additional novelty to support more efficient drawing is the OP implementation plan (IPOP),243 which is intended to provide a comprehensive overview of the implementation of the European cohesion policy and to foresee the dynamics of implementation to achieve specific objectives of the OP.
238 The Operational Programme for Strengthening Regional Development Potentials (OP SRDP), the Operational Programme for Human Resources Development (OP HRD) and the Operational Programme for Environmental and Transport Infrastructure (OP ETID). The first two were allocated 5% and the last one 15% of additional budgetary commitments.239 Stock on 31 December 2015. The funds paid by the end of 2015 will be restored to the state budget in 2016, in the event that no irregularities in drawing are detected. 5% of the deposit retained by the European Commission, will be returned to the state budget by the end of 2017.240 In the structure of total budgetary commitments, the share of OP SRDP funds represents 43%.241 In the 2014–2020 period the funds available to Slovenia from EU Cohesion and Structural Funds amount to about EUR 3.3 billion, where EUR 159.8 million is intended for the Connecting Europe Facility Instrument (transport) and EUR 64 million for the programmes of European Territorial Cooperation.242 West Cohesion Region will be entitled to EUR 855 million and east to 1.27 billion funds from the European Regional Development Fund (ERDF) and European Social Fund (ESF).243 Ordinance amending the Ordinance on the implementation plan for the Operational Programme for the Implementation of the EU Cohesion Policy in the Period 2014–2020, 2015.

83Development Report 2016Environmental, regional and spatial development
operating permits249 and records in the area of waters for the needs of spatial planning and construction. This has also reflected in the improved international comparative ranking for these areas by the World Bank’s Doing Business.250 According to the data from administrative statistics, in 2014, the average time to the issue of building permit was 21 days, which is within the statutory time limit of up to 60.251 The expert group reviewing the situation in the area of legislation concluded that further shortening of the statutory time limits for construction is not rational252. However, it is necessary to introduce mechanisms for more effective coordination of different interests in the area and improve the organization of the work of all stakeholders. By international comparison, the duration of the whole process for obtaining a building permit is still long, mainly due to long-lasting procedures for acquiring various permits and approvals that depend on other stakeholders in the process.253 The World Bank notes that for recording a real estate or property a company in Slovenia requires 50 days (in the EU 23 days), and for obtaining building permit, including approvals and other documents necessary for the submission of a complication, 225 days (in the EU 176 days). The number of procedures and related costs are comparable to the EU average.
The problem of spatial development is substantially influenced by a mismatch between the locations of jobs and housing. Spatial development trends in Slovenia are characterized by the diversity of settlement structures, the quality of the environment and good transport connections between rural areas and regional centres.254 This contributes to the dispersed construction of buildings, sub-urbanisation, increasing labour migrations and personal transport, and the neglecting of public passenger road and rail transport. The mismatch between the location of jobs and housing is relatively large. Approximately a quarter of the population lives in the Osrednjeslovenska region that provides more than a third of jobs. Moreover, among all the regions, the Osrednjeslovenska region has the largest population growth. Jobs and services of general interest are mainly
249 Within the spatial information system (eProstor). Sources: The Fourth Report on the Implementation of the Measures from the Single Document, June 2015, and the Fifth Report on the Implementation of the Measures from the Single Document, October 2015.250 According to the Doing Business 2016, with respect to the acquisition of building permits Slovenia ranks 18th among the EU Member States (the same as in the previous year, and 71st among 189 monitored countries), while with respect to real estate recording it ranks 13th (up by 3 positions, 36th place). In both indicators, the lag behind the best countries has declined. 251 Construction Act, 2014.252 The Fifth Report on the Implementation of the Measures from the Single Document, October 2015.253 There are difficulties in ensuring compliance with spatial planning documents, the drafting of which is the responsibility of local communities, and in obtaining consent, which is a prerequisite for the issue of building permits.254 Spatial Development Report, 2015.
strategic planning activities in the municipalities and a disregard of natural factors. The drafting of national spatial plans and municipal spatial plans are long-lasting. In nine years since the Spatial Planning Act entered into force, 156 national spatial plans have been adopted, of these 6 in 2015. Further to this, despite the adoption of the Act Regulating the Siting of Spatial Arrangements of National Significance (2010), which was intended to streamline and accelerate the procedures, more than half of national spatial plans have still not been implemented.245 The most burning issue is associated with the non-implementation and operation of the planned spatial arrangements in the field of transport infrastructure, which could substantially contribute to boosting some economic activities. Only about two-thirds of the municipalities have new municipal spatial plans, with as many as a third of them already having started procedures for their amendment. Namely, spatial planning in municipalities often takes place in the absence of prior strategic planning, which leads to a lack of coordination of the planned spatial activities and, consequently to changes in already adopted spatial planning documents. Due to the fragmentation of Slovenia into small municipalities, these are often too weak – both financially as well as in terms of human resources – to prepare such demanding materials.246 Great importance of strategic and operational planning and the need of taking into account natural factors often becomes apparent only in the event of natural disasters (floods, landslides, droughts).247
Property registration procedures and the granting of building permits are being reduced, though they still represent an important obstacle to pursuing business in Slovenia. In recent years, several measures have been taken in the field of spatial planning.248 A system for registering administrative acts in the field of construction has been established, which provides a single-point access to data on issued construction and
245 More about reasons in the Development Report 2014, Note no. 227, p. 83.246 More about the problems encountered in the preparation of municipal spatial plans in the Development Report 2014, Note no. 228, p. 84.247 The analysis of building land by land use in municipalities for 2014 (includes 19 municipalities with valid municipal spatial plans or municipal spatial order) revealed that approximately 1,800 ha of building land are situated within the flood-prone areas in spite of the prohibition of settlement development in flood-prone areas. The reasons lie in the present situation (works constructed in the past), illegally constructed buildings, buildings constructed without prior implementation of the envisaged flood protection measures, a lack of expert groundwork and changed hydrological conditions. About one-tenth of the land is defined as green areas, which in terms of the protection against floods is more acceptable, in particular, if these are planned as anticipated flooding areas.248 The implementation of a real estate register, the computerisation of the Land Register, and abolition of the requirement for project conditions from water and sewage service providers.

84 Development Report 2016Environmental, regional and spatial development
particularly among young people in the phase of their first residential independence, which would significantly increase the overall level of residential mobility. The Resolution also focuses on the housing problems of the elderly and particularly vulnerable population groups.
4.4. Challenges
Despite a slowdown in environmental pollution, mainly as a result of lower economic activity and a decline in regional disparities, the reactivation of economy requires that more attention should be paid to ensure sustained improvement. Under the impact of the economic crisis, environmental development trends were quite favourable and, due to a faster deterioration of the situation in more developed regions, regional development was more balanced. Despite the improvement, the absence of appropriate structural measures and their effective implementation will make it more difficult to achieve the set targets while reviving economic activity. More attention will have to be paid to the spatial development since the spatial potentials without a broader strategic planning are not adequately exploited.
The objectives in the key areas of environmental development are well framed; the challenge, however, is their implementation. The economic crisis eased the burden on the environment but results have been rather modest, regarding the intensity of pollution, i.e. emissions per unit of GDP. In Slovenia, the consumption of fossil fuels in the energy sector, households, industry and transport contributes more than three thirds of
to 40 thousand. The proportion of rental housing is projected to rise from 9% in 2011 to 16% in 2025 (in 2013 by 30% in EU average).
concentrated in urban areas, but demographically, urban settlements are stagnating.255 A wide motorway network and poorly developed and under-used public transport have a major impact on the environment and space. Suburbanisation has been increasing, being especially pronounced along the motorway cross and in the vicinity of major urban centres, which are well connected with road infrastructure. Low residential mobility is also a result of unregulated rental housing market.
The residential real estate market is gradually reviving, and in the coming years the rental housing market could follow the same trend. After three years of decline, in 2015 residential property prices256 remained similar to those in 2014, while sales257 underwent a further increase. In addition to the persistently low prices, the revival of the real estate market was also influenced by the relatively low effective interest rate on housing loans, the improved economic situation and the associated recovery of the labour market. With further strengthening in real estate trading and low levels of new residential real estate construction,258 in the following years there could be a shortage of these particularly in major employment centres. Inadequate structure of residential real estate supply could be improved by activating the unoccupied dwellings that the owners do not offer to rent because of the unregulated rental market. Tenancy arrangements, with greater security for tenants and landlords, and the establishment of public service for rental management is one of the basic objectives of the Resolution on the National Housing Programme 2015–2025. Furthermore, in the following years, more resources should be devoted to energy and functional renovation of older housing,259 while in the long run, the construction of public and private rental apartments, which are relatively scarce, should be increased as well.260 Renting will be promoted
255 In the 2003–2013 period, the number of inhabitants in urban settlements fell by 5% along with a slight decrease in the already low level of urbanisation, which fell to 50%.256 Calculated on the basis of residential real estate property indices, SURS, 2016.257 The number of sales of used residential properties has increased by about a quarter and is slightly higher than the top value before the crisis (2007). Sales of new dwellings, which increased mainly due to further sale of properties as a result of bankruptcy proceedings and apartments sold by Housing Fund of the Republic of Slovenia, are still lagging far behind the sales in 2007.258 The number of dwelling constructions begun in 2014 was the lowest since Slovenia's independence and was by 75% lower than in 2007. Although building permits issued in 2015 indicate a larger number of constructions than in 2014, but this is only attributable to an increased number of building permits issued to natural persons for the construction of one-dwelling buildings. 259 The Resolution also provides for further use of the financial instruments of the Eco Fund, in particular favourable loans and subsidies for investment in enhancing the energy efficiency of buildings.260 The Action Plan for the implementation of the Resolution by 2025 provides for a reduction in the number of unoccupied dwellings equipped with basic infrastructure, from 90 thousand
Figure 52: Transactions and prices of new and existing residential real estate properties, Slovenia
Source: SURS, 2016; calculated by IMAD.
30
40
50
60
70
80
90
100
110
120
2007 2008 2009 2010 2011 2012 2013 2014 2015
Inde
x, 2
007=
100
New real estate transactionsExisting real estate transactionsNew real estate pricesExisting real estate prices

85Development Report 2016Environmental, regional and spatial development
are clearly defined and measurable. In this context, harmonisation with the strategic and long-term oriented broader development framework and other public policies represents a special challenge. Thus, in coordinating the placement of activities and objects in space, partial interests of individual though equally important bodies responsible for spatial planning will be ruled out. This will contribute to the better welfare of inhabitants and improve their quality of life.
all GHG emissions. For climate change mitigation, it is therefore essential to reduce the consumption of fossil fuels, increase the share of RES and improve energy efficiency. All economic sectors will require further improvements, especially with regard to the saving of energy and its production. As final energy consumption is largely influenced by measures of general development policy and sustainable transport policy, especially the measures of tax policy, policies of sustainable production and consumption, it needs to be given more attention. A special challenge is to improve the competitiveness of the railway transport and, from the environmental aspect, decrease the volume of road freight transport. Furthermore, the development in the area of passenger transport is not favourable, which is also reflected in the development of motorisation, different settlement patterns, and low competitiveness of the public passenger transport.
The basic challenge for balanced regional development is to provide optimal support to the regions to exploit their own development potential. Regional disparities in Slovenia are small thanks to a long and successful tradition of promoting balanced regional development. During the crisis they decreased even further, which was mainly a result of stronger deterioration of the activity in economically more developed regions. In order to avoid increase in regional disparities, with the revival of the economy it will be necessary to implement a policy with the modern concept of promoting regional development. This is based on the exploitation of the regions’ own development potential, including their general and specific competences that facilitate optimal development specialization. Attention should be paid to a combination of different development factors, the capabilities of development institutions and enterprises as well as to adequate financial support. The cohesion policy funds should be used in such a manner as to enable the activities of sectoral policies to also support regional development. The latter should be aimed at providing the best possible level of accessibility of the population to services of general interest and thus good living conditions for the population in all regions.
To address the spatial development issues, an appropriate strategic framework for broader development will be required, but a challenge remains to find effective solutions on the basis of harmonised interests of all stakeholders responsible for spatial planning. The strategic framework of the current spatial planning has been in force for more than a decade, but the trends show a deviation from the outlined development. In addition, new challenges, such as climate and demographic changes, energy supply and globalisation have appeared. Therefore, it is necessary to prepare a long-term strategic framework of contemporary spatial development, as well as a short-term action-oriented strategy for current guidance and monitoring. The spatial planning system will be effective only if the objectives and priorities of development


App
endi
x:In
dica
tors
of S
love
nia’
s de
velo
pmen
t


1 Macroeconomic frameworkMacroeconomic stability and economic growth• 1.1RealGDPgrowth• 1.2Inflation• 1.3Currentaccountofthebalanceofpayments• 1.4Grossexternaldebt• 1.5Netfinancialposition
The stability and quality of public finances• 1.6Generalgovernmentbalance• 1.7Generalgovernmentdebt• 1.8Yieldon10-yeargovernmentbonds• 1.9Taxesandsocialsecuritycontributions• 1.10Taxburdenbyeconomicfunction• 1.11.Stateaid
Financial markets and corporate sector indebtedness• 1.12Developmentofthefinancialsector• 1.13Loan-to-depositratio• 1.14Non-performingclaims• 1.15Indebtednessofthecorporatesector

90 Development Report 2016Indicators of Slovenia’s development
-2 -1 0 1 2
Shareofnon-performingclaims,in%
Loan-to-depositratiofornon-bankingsectors
Totalassets,asa%ofGDP
Marketcapitalisation,asa%ofGDP
Insurancepremiums,asa%ofGDP
Generalgovernmentsubsidies,asa%ofGD
Stateaid,asa%ofGDP
Taxesandsocialprotectioncontributions,asa%ofGDP
Implicittaxrateonlabour,in%
Yieldon10-yeargovernmentbonds,in%
Generalgovernmentdebt,asa%ofGDP
Generalgovernmentsurplus/deficit,asa%ofGDP
Netinternationalinvestmentposition
Grossexternaldebt,asa%ofGDP
Balanceofpayments
Inflation,in%
RealGDPgrowth,in%
2014
2015
2014
2015
2014
2014
2014
2014
2012
2015
2014
2014
2015
2015
2015
2015
2015
Finan
cialm
arke
tsandcorp
orate
sectorindeb
tednes
sTh
equalityan
dsta
bilityofp
ublic
finan
ces
Mac
roec
onom
icsta
bilityand
econom
icgro
wth
Standarddeviation
2008 Theyearbeforelast LastyearIndicator
Overview of indicators – Macroeconomic framework
Note:ThetableshowsSlovenia’spositionrelativetotheunweightedarithmeticaverageoftheEUMemberStates.Itwascalculatedwithregardtothesetofcountriesforwhichdataforindividualindicatorswereavailable;Cyprus,Malta,LuxembourgandCroatiawereexcludedfromtheanalysisduetoalackofdata.Thedatainthetablearefor2008andthelastyearforwhichdataforEUMemberStateswereavailable(thelastyearisindicatedinthetable).Apositiveindicatorvaluemeansabove-averagedevelopmentrelativetotheEU,whileanegativevalueindicatesthatSlovenialagsbehindtheEUaverageonthatindicator.

91Development Report 2016Indicators of Slovenia’s development
The fall in government consumption gradually cametoahalt in2014and2015.EconomicgrowthintheEUstrengthenedfurtherlastyear(1.9%),largelyonthebackof rising private consumption. Despite its higher GDPgrowththantheEUaveragein2014and2015,Sloveniaremainsamongthegroupofcountrieswiththesteepestdeclines in economic activity during the crisis. WhileGDPfortheEUwasalreadyslightlyabovethe2008levelin2015,Slovenia’sGDPwas4.2%lowerthanbeforethecrisis.
Table:Contribution of expenditure components to GDP change, Slovenia
2005 2007 2008 2009 2010 2011 2012 2013 2014 2015
RealGDPgrowth,in% 4.0 6.9 3.3 -7.8 1.2 0.6 -2.7 -1.1 3.0 2.9
Contribution to GDP growth, in percentage pointsExternaltradebalance(export–importofgoodsandservices) 2.1 -2.0 0.2 1.9 2.1 1.3 3.0 1.1 1.6 0.9
-Exportsofgoodsandservices 6.2 8.8 2.8 -11.0 5.8 4.4 0.4 2.2 4.4 4.0
-Importsofgoodsandservices 4.1 10.9 2.7 -12.8 3.8 3.1 -2.5 1.2 2.8 3.0
Totaldomesticconsumption 1.9 9.0 3.1 -9.7 -0.8 -0.6 -5.7 -2.1 1.5 1.9
-Privateconsumption 1.2 3.3 1.2 0.5 0.7 0.0 -1.4 -2.3 0.4 0.9
-Governmentconsumption 0.5 0.4 0.9 0.4 -0.1 -0.1 -0.5 -0.3 0.0 0.1
-Grossfixedcapitalformation 0.9 3.3 2.0 -6.5 -3.2 -1.1 -1.8 0.3 0.6 0.1
-Changesininventories -0.7 2.0 -1.0 -4.0 1.9 0.6 -2.0 0.2 0.5 0.8
Source:SURS.
Figure: GDP in Slovenia and its main trading partners
Source:EurostatPortalPage–NationalAccounts;calculationsbyIMAD.
86
88
90
92
94
96
98
100
102
104
106
108
Q108
Q109
Q110
Q111
Q112
Q113
Q114
Q115
Seas
onallyadjus
tedinde
x20
08=1
00
Slovenia Italy Germany Austria Croatia France Euroarea
1.1 Real GDP growthGDP growth continued in 2015 (2.9%), again largely as a result of exports, amid stronger growth in private consumption. Export growth was boosted by risingforeigndemandandfurthercompetitivegains.Exportsremained the main driver of economic recovery, anddomestic consumption also continued to rebound.Strongeremploymentgrowthandhigheraveragegrossearnings translated into further growth in householddisposable income and, in turn, a further recovery inprivateconsumption.Thiswasalsoboostedbyconsumerconfidence,whichclimbedtooneofthehighestlevelsonrecord.Meanwhile,investmentgrowthslowedowingtoareneweddeclineinconstructioninvestment.Thishadotherwise increased significantly in 2014, particularlyowing to investment inpublic infrastructure related totheacceleratedabsorptionofEUfundsbeforetheexpiryofthepreviousfinancialperspective.Ontheotherhand,privateinvestmentinmachineryandequipmentwasuplast year, a trend that had already been suggested byhigherprofits in theprivate sector,an improvement inindebtedness indicators and better access to funding.

92 Development Report 2016Indicators of Slovenia’s development
endoftheyear,thecontributionofservicespriceswassignificantlylowerowingtothewaningeffectofaone-off factor.The impact of tax policymeasureswas alsolower than in2014.Weestimate that theycontributedaround 0.2 percentagepoints to deflation last year (in2014: 0.5 percentage points). The pricemovements intheeuroareawerealsocharacterisedbyexternalfactors,butmodestinflationwasrecordedlastyear(0.2%)aftera period of deflation in 2014, amid the strengtheningof private consumption, primarily on account of priceincreasesinservicesandnon-energygoods.
1In2015oilpricesineuroswere30%lowerthanin2014.
1.2 InflationAfter modest growth in 2013 and 2014, consumer prices were down year-on-year at the end of 2015 (−0.5%) for the first time thus far. Aswasthecasein2014,pricemovements last year were significantly affected bycommoditypricedevelopmentsontheglobalmarkets,especially the continued fall in oil prices.1 This wasmainlyreflectedinafurtherdeclineinenergyprices(acontributionof−0.9percentagepoints),whichwasevenmorepronouncedthanin2014.Amidmodestdomesticconsumption,theyear-on-yeardeflationwasalsopartlyduetothefallingpricesofdurablegoods,butthisdeclinewaslesspronouncedthaninpreviousyears.Bycontrast,thepricesofsemi-durableswereupagainlastyearaftermodestgrowthin2014.Higherpriceswerealsorecordedfor food (unprocessed) and services. However, at the
Table:Annual price growth in Slovenia (year end, in %)
Contribution to year-on-year inflation, in percentage points
2000 2005 2007 2008 2009 2010 2011 2012 2013 2014 2015
Food 1.2 0.1 2.1 0.6 -0.2 0.3 0.8 0.7 0.3 -0.2 0.2
Processedfood 0.9 -0.1 1.3 0.6 0.0 0.0 0.7 0.1 0.2 -0.1 0.1
Unprocessedfood 0.3 0.3 0.8 0.0 -0.2 0.3 0.1 0.6 0.2 -0.1 0.2
Energy 2.9 1.3 1.2 -0.9 1.6 1.5 0.9 0.7 0.4 -0.6 -0.9
Services 2.4 0.9 1.5 1.2 0.5 0.0 0.1 0.8 0.2 0.9 0.2
Other* 2.4 0.0 0.7 1.2 -0.1 0.1 0.2 0.5 -0.2 0.1 -0.1
Taximpact 0.6 -0.3 -0.2 0.2 1.0 0.3 0.2 0.9 0.8 0.4 -0.2
Growth, in %
Administeredprices,in% 16.0 7.7 7.2 -7.8 12.6 11.5 7.1 4.6 -0.1 -2.6 -9.8
Inflation**excludingenergyandunprocessedfood,in% 7.2 1.0 4.5 3.7 0.5 0.1 1.3 1.7 0.2 1.0 0.3
Inflation**, in % 8.9 2.3 5.6 2.1 1.8 1.9 2.0 2.7 0.7 0.2 -0.5
EU – HICP, in % 2.2 2.1 3.2 2.2 1.5 2.7 3.0 2.3 1.0 -0.1 0.2
Source:SURS,MinistryofEconomicDevelopmentandTechnology;calculationsbyIMAD.Notes:*Clothing,footwear,furniture,passengercars,alcoholicbeverages,tobacco,etc.;**measuredbyCPI.
Figure: Contributions to year-on-year growth in consumer prices in Slovenia
Source:SURS;calculationsbyIMAD.Note:*Clothing,footwear,furniture,passengercars,alcoholicbeverages,tobacco,etc.
-1.0
-0.5
0.0
0.5
1.0
1.5
2.0
2.5
3.0
-1.5
-1.0
-0.5
0.0
0.5
1.0
1.5
2.0
2.5
3.0
2009 2010 2011 2012 2013 2014 2015
Year-o
n-ye
arin
flatio
n,in
%
Cont
ribut
ionto
yea
r-on-
yearin
flatio
n,in
pe
rcen
tage
point
s
Other*
Services
Energy
Food
Inflation(rightaxis)

93Development Report 2016Indicators of Slovenia’s development
owing to stronger non-resident spending in Slovenia. Thelargertradesurplusintransportserviceswaschieflytheresultofalargersurplusinroadtransport.Thedeficitinprimary income widenedprimarilyasaconsequenceofalargernetoutflowofdirectinvestmentincomeandtotalledEUR370million,whichisEUR283millionmorethan in 2014. Subsidies from the EUbudgetwere alsolower.Netinterestpaymentsonexternaldebtremainedatasimilarlevel:thenetinterestpaymentsofthegeneralgovernmentsectorrosefurther,whiletheprivatesectorrecordednet interest receiptsdue to thedeleveragingof commercial banks and higher domestic investmentinforeigndebtsecurities.Incomefromtheworkofdailymigrants abroad continued to rise faster than incomefrom non-residents working in Slovenia. The deficit insecondary income washigherthaninthepreviousyear,mainly on account of a larger net outflow of variouscurrenttransfers.
1.3 Current account of the balance of paymentsThe current account, which recorded a significant deficit at the beginning of the crisis, has been in surplus since 2011; in 2015 the surplus widened further.Inthe2011–2014periodasawhole,thesurplus increasedbyEUR2.5billion;lastyearitsgrowtheasedandittotalledEUR2,828million(7.3%ofGDP).1In2015thesurplusingoods trade rosefurther,byEUR418milliontoEUR1,628million. In addition toquantity factors amid faster realgrowthinexportsthanimports,theincreasewasagaindue tobetter termsof tradeowing to the falling euroimportpricesforenergyandrawmaterials.Thesurplusinservices trade widenedbyEUR318millionlastyear,toEUR2,054million,whichwasmainlyattributabletothelargertradesurplusintravelandtransportservices. Despitethestronggrowthindomestichouseholdspendingontravelabroad, the trade surplus in travel services increased
1In2015thecurrentaccountsurplusexceededtheindicativethresholdoftheEUindicatorofexternalimbalance(thecurrentaccountbalanceexpressedasa%ofGDP–athree-yearaverage+6%/−4%).
Table:Current account and terms of trade, Slovenia
2000 2005 2007 2008 2009 2010 2011 2012 2013 2014 2015
Current account, as % of GDP -2.8 -1.8 -4.1 -5.3 -0.6 -0.1 0.2 2.6 5.6 7.0 7.3
Goods -6.0 -3.7 -4.0 -5.6 -1.2 -2.1 -2.6 -0.2 2.0 3.2 4.2
Services 2.6 3.2 2.8 3.7 3.1 3.3 3.8 4.2 4.9 4.7 5.3
Primaryincome 0.1 -0.9 -2.2 -2.7 -1.5 -1.0 -0.8 -0.8 -0.5 -0.2 -1.0
Secondaryincome 0.6 -0.5 -0.7 -0.8 -1.0 -0.4 -0.2 -0.6 -0.8 -0.7 -1.3
Terms of trade, chain index
Total 96.9 97.9 100.9 98.7 103.5 96.0 98.6 98.9 100.8 101.0 101.2
Goods 96.2 97.5 100.6 98.2 104.1 95.2 98.4 98.7 100.8 101.1 101.2
Services 101.9 99.7 102.6 100.5 99.1 100.3 100.3 100.0 100.3 99.9 100.7
Source:SI–STATpodatkovniportal–Nacionalniračuni,2016;BiltenbankeSlovenije,2016;preračuniUMAR.
Figure: Components of the current account of the balance of payments
Source:BoS;calculationsbyIMAD.
-4,000
-3,000
-2,000
-1,000
0
1,000
2,000
3,000
4,000
5,000
2000 2001 2002 2003 2004 2005 2006 2007 2008 2009 2010 2011 2012 2013 2014 2015
InEUR
m
Services Goods Primaryincome Secondaryincome Currentaccountbalance

94 Development Report 2016Indicators of Slovenia’s development
extensiveborrowingsincethebeginningofthecrisis,thegeneral government sectorincreaseditsdebtbyonlyEUR0.6billionlastyear,toEUR23.0billion.Thegovernmentrepaid a portion of its liabilities to foreign portfolioinvestors,butincreasedborrowingintheformofloansinordertohedgeagainstexchangeraterisk.Debtgrowthwas also underpinned by intercompany loans underdirect investment,3mostofwhichcomprisedthe loansofSlovenianaffiliatestotheirparentcompaniesabroad. Inthestructureofdebtwithregardtoguaranties,publicdebt has expanded since the beginning of the crisis,whereas non-guaranteed private debt has contracted.In 2015 public debt rose again,4 by EUR 0.6 billion toEUR 23.0 billion. Publicly guaranteed debt5 contractedby EUR 0.3 billion (to EUR 6.7 billion), owing to adeclineinthestockofguaranteestodomesticfinancialinstitutions.At theendof2015publicdebtaccountedfor51.4%oftotalgrossexternaldebt,anincreaseof42.1percentagepointsover2008,whilepubliclyguaranteeddebt represented 14.9%, down 1.2 percentage pointsfrom2008.Non-guaranteed private sector debt declinedby EUR 15.1billion relative to 2008, totalling EUR15.1billionattheendof2015.
1.4 Gross external debt Slovenia’s gross external debt declined in 2015 owing to a further reduction in the debts held by commercial banks and slower growth in general government debt. Attheend2015grossexternaldebtstoodatEUR44.8billion,whichwasdownEUR1.5billiononthefigureforDecember2014. Itdeclinedasaresultofareductioninlong-termdebt,whichaccountedforfour-fifthsoftotaldebt.1 In2015the commercial bankscontinuedtorepaytheir liabilities abroad, the volume of their debt thustotalling EUR 5.2 billion, which is EUR 12.7 billion lessthan in 2008. Commercial banks also repaid a portionof their liabilities to foreign portfolio investors, whilenon-residents startedwithdrawing their deposits fromSlovenian banks. The central bank’s debt expandedslightly last year, by EUR 0.1 billion to EUR 2.2 billion,mainly owing to the recording of euro banknotesin accordance with the EMU system.2 Other sectors(mostly non-financial corporations) also continued toreduce their debts last year; enterprises mainly maderepayments of their long-term loans abroad. After the
1Theshareoftotaldebt,excludingtheliabilitiesofaffiliatesforwhichthematurityhasnotbeenpublished.2ThedifferencebetweentheECB’scapitalkeyandtheestimateoftheamountofcurrencyincirculationinSlovenia.3Accordingtothenewmethodology(BPM6),debtinstrumentsareclassifiedaccordingtothetypeofcapitalaffiliation:(i)theliabilitiesofaSlovenianenterprisetoaforeigndirectinvestor;(ii)theliabilitiesofaSlovenianinvestortoforeigndirectinvestmententerprises;and(iii)theliabilitiesofresidentfellowenterprisestofellowenterprisesabroad.4 External public debt is generated by the institutional general government sector borrowing on foreign financial markets. Thegovernmentmayborrowfrominternationalfinancialinstitutions,foreigngovernmentsorgovernmentagencies,foreigncommercialbanksorevenfromprivatelendersintheeventofissuingtransferablesecuritiesonaforeignfinancialmarket.5Publiclyguaranteeddebtisaliabilityofaprivatelegalentity,therepaymentofwhichisguaranteedbythestate.PubliclyguaranteeddebtalsoincludesBankofSlovenialiabilitiestotheEurosystemincurredbythetransferofmonetarypolicyfromtheBankofSloveniatotheECB.
Table:Slovenia’s gross external debt position, end year, in EUR million
2000 2005 2007 2008 2009 2010 2011 2012 2013 2014 2015
Total gross external debt 9,526 20,579 35,678 40,388 41,667 42,123 41,669 42,872 41,658 46,314 44,765
Short-termdebt 1,881 3,625 9,973 10,900 10,683 9,592 9,591 11,752 7,491 7,120 8,215
Publicandpubliclyguaranteeddebt 0 194 4,397 4,685 4,625 3,454 4,185 6,011 2,558 2,426 3,449
Non-guaranteedprivatedebt 1,881 3,431 5,576 6,215 6,058 6,138 5,406 5,741 4,933 4,694 4,766
Long-termdebt 6,892 15,693 24,051 27,560 29,083 30,380 29,123 27,999 30,928 35,544 33,101
Publicandpubliclyguaranteeddebt 2,919 12,970 4,535 5,533 10,672 14,465 14,352 15,881 20,486 26,893 26,215
Non-guaranteedprivatedebt 3,973 2,723 19,516 22,027 18,411 15,915 14,771 12,118 10,442 8,651 6,886
Liabilitiestoaffiliates 752 1,261 1,652 1,929 1,901 2,152 2,955 3,120 3,240 3,649 3,450
Publicandpubliclyguaranteeddebt 0 0 0 0 0 0 0 0 0 0 0
Non-guaranteedprivatedebt 752 1,261 1,652 1,929 1,901 2,152 2,955 3,120 3,240 3,649 3,450
Source:BulletinoftheBankofSlovenia,2016.
Figure:Structure of Slovenia’s gross external debt by sector
Source:BulletinoftheBankofSlovenia,2016;calculationsbyIMAD.
0
5,000
10,000
15,000
20,000
25,000
30,000
35,000
40,000
45,000
50,000
1995 2000 2005 2006 2007 2008 2009 2010 2011 2012 2013 2014 2015
InEURm
Directinvestment:intercompanyloans OthersectorsDepositoryinstitutionsotherthantheBankofSlovenia BankofSloveniaGovernment

95Development Report 2016Indicators of Slovenia’s development
in total claims was mainly due to investment by theBoS, investment funds (except money market funds),insurance companies and pension funds in foreignsecurities,whichisrelatedtothehigheryieldsonforeignfinancial markets. Short-term trade credits used byenterprises to finance operations with non-residentsstrengthened, reflecting further growth in exports ofgoodsand services.Thegovernmentwaswithdrawingfunds deposited at the BoS, transferring them abroad.ThestockofoutwardFDIwassomewhat lower,mainlyowingtotheoutflowofequitycapital,whilethestockofloansgrantedbySloveniandirectinvestorswasup.Thedeclineintotalexternal liabilitieswasmainly impactedby further commercial bank deleveraging and theoutflowofnon-residentdepositsfromSlovenianbanks.Liabilities of Slovenian affiliates to parent companiesabroad also declined slightly, as did liabilities fromforeigninvestmentinsecurities,duetothegovernmentandcommercialbankshavingrepaidaportionoftheirliabilities to foreign portfolio investors.The amount ofinwardFDIincreased,primarilyonaccountoftheinflowofequitycapital,whichwasdueforthemostparttothedebt-to-equityswap.Since2008Sloveniahasexceededthe indicative thresholdof theEU indicatorofexternalimbalance(35%ofGDP),butcameveryclosetofallingbelow this figure with the improvement to its netfinancialpositionin2015,andissignificantlybelowthelevelofthemostindebtedcountriesintheeuroarea.1
1.5 Net financial positionDespite private sector deleveraging, Slovenia’s net financial position has deteriorated significantly since the onset of the crisis owing to increased borrowing by the general government; in 2015 it fell below the 2008 level for the first time in this period. In theearlyyearsofthecrisis(upto2012)ithaddeterioratedmainlydue to the accelerated borrowing of the government.It improved for the first time in 2013 as a result ofprivatesectordeleveraging,whichhadotherwisebeenin progress since 2009. Despite a significant increasein general government gross external debt, in 2014Slovenia’s net financial position improved furtherowing to theongoingprivate sectordeleveragingandadecline in liabilities to the Eurosystem,before fallingin 2015 to the lowest level since thebeginningof thecrisis. Slovenia’s net international investment positionwasnegative,atminusEUR14.8billion,or38.5%ofGDP(in 2014: 43.6% of GDP). The improvement reflectedan increase infinancial assetsheldabroad (byEUR0.9billion) and a decline in external liabilities (by EUR 0.5billion). The debt-to-GDP ratio was also favourablyimpacted by the higher nominal GDP. The increase
Table:Slovenia's international investment position, as a % of GDP
2000 2005 2007 2008 2009 2010 2011 2012 2013 2014 2015
1Debtclaims 39.4 67.3 77.3 71.9 74.5 72.3 72.0 73.1 73.0 85.0 84.8
2Equityclaims 2.4 12.5 22.1 17.3 20.2 20.6 19.1 20.1 20.0 20.5 19.8
3 Total claims (1+2) 41.8 79.8 99.4 89.2 94.8 92.9 91.0 93.2 92.9 105.5 104.6
4Grossexternaldebt 43.1 70.4 101.5 106.4 115.2 116.2 112.9 119.1 116.0 124.2 116.1
5Equityliabilities 10.4 20.2 23.4 22.1 23.2 23.8 23.3 24.0 23.0 25.0 26.9
6 Total liabilities (4+5) 53.5 90.6 124.9 128.5 138.4 140.0 136.2 143.1 139.1 149.1 143.1
7Netexternaldebt/claims(1–4) -3.7 -3.1 -24.2 -34.5 -40.7 -43.9 -41.0 -46.0 -43.0 -39.1 -31.4
8Netexternaldebt/claims(2–5) -8.0 -7.7 -1.3 -4.8 -2.9 -3.2 -4.2 -3.9 -3.1 -4.5 -7.1
9 Net financial position (7+8)* -11.7 -10.8 -25.5 -39.4 -43.6 -47.2 -45.2 -49.9 -46.1 -43.6 -38.5
Source:BankofSlovenia,owncalculations.Note:*Anegative(positive)signinthebalanceconcernedindicatesanetdebt(credit)externalfinancialposition.
Figure: Net financial position in EU Member States, as a % of GDP
Source:Eurostat.Note:SincethedataforBulgariaandSpainhaveonlybeenavailablesince2010and2012,respectively,acomparisonisnotpossible.
-150
-100
-50
0
50
100
Net
herla
nds
Belgium
Ger
man
y
Den
mark
Malta
Luxe
mbo
urg
Finlan
d
Aus
tria
Swed
en
U.K
ingd
om
Fran
ce
Italy
Czec
hR.
Esto
nia
Slov
enia
Lith
uania
Rom
ania
Latvia
Bulgar
ia
Poland
Hun
gary
Slov
akia
Ireland
Croa
tia
Spain
Portug
al
Gre
ece
Cypr
us
Asa%
ofG
DP
2008 Q22015
1Attheendof2015Greecerecordedanegativenetinternationalinvestmentpositionintheamountof126.2%ofGDP,Ireland81.0%,Portugal116.5%,Spain91.0%andCyprus138.1%ofGDP.

96 Development Report 2016Indicators of Slovenia’s development
1.6 General government balanceThe decline in the deficit to 2.9% of GDP in 2015 was attributable to a further strengthening of economic activity, measures to increase revenue and contain expenditure, and the diminishing effect of one-off factors. Similar to 2014, revenue increasedmore thanexpenditure in 2015 (excluding one-off factors). In2014and2015,revenuegrowth–whichuntil2014hadbeen almost entirely due to rises in various non-taxrevenues–alsostemmedfromtaxrevenuesandsocialcontributions, which was attributable to increases insome tax rates,1 the broadening of the base for socialcontributionsandtherecoveryineconomicactivity.Onexpenditureside,fiscalconsolidationwassupportedbysimilarmeasurestopreviousyears,whichlimitedgrowthincompensationofemployeesandsocialbenefitsandtransfers. These were temporary measures, most ofwhichwereextended2into2015,sothatafterdeclininginpreviousyears, theseexpenditurecategoriesalreadyrecorded growth in 2015. Last year total expendituregrowthalsostemmedfromhigherexpenditurenotonlyoninvestmentandintermediateconsumption,butalso
1Themainmeasures thatcontributed to the increase in tax revenues in2015 include increases in the ratesof taxesonfinancialandinsuranceservicesandCO2taxes.TheVATtaxratesthatwereraisedin2013andthefourthincomebracketalsoremainedinplacein2015.2Mostmeasuresrelatingtowagepolicythatwereineffectin2014wereextendedinto2015,exceptforthepaymentofthesuspendedpromotion raises for public servants; similar to 2014, pensionswerenot indexed for inflation, but expenditure on annual pensionallowanceswashigherthan in2014astheywerepaidtomorebeneficiariesowingtochanges ineligibilitycriteria; inAugust2015financialsocialassistancewasincreased.3Theneteffectofaone-offexpenditureforcompensationtoCroatiaforthenon-deliveryofelectricityandaone-offrevenuefromthesettlementofacorporateincometaxdebt.
Table:General government revenue, expenditure and balance* (ESA 2010), Slovenia, as a % of GDP
2008 2009 2010 2011 2012 2013 2014 2015
Revenue 42.5 42.3 43.6 43.3 44.5 45.2 44.9 45.1
Expenditure 43.9 48.2 49.3 50.0 48.6 60.3 49.9 48.0
Generalgovernmentdeficit -1.4 -5.9 -5.6 -6.7 -4.1 -15.0 -5.0 -2.9
Primarybalance -0.3 -4.6 -4.0 -4.7 -2.1 -12.5 -1.8 0.0
Source:SI-STATDataPortal–NationalAccounts–Generalgovernmentaccounts–Mainaggregatesofthegeneralgovernment,April2016.
Source:EurostatPortalPage–EconomyandFinance–Governmentstatistics,April2016.
Figure: General government balance in EU Member States, 2015
-8
-7
-6
-5
-4
-3
-2
-1
0
1
2
Luxe
mbou
rg
Ger
man
y
Esto
nia
Swed
en
Lith
uania
Cze
chR.
Rom
ania
Cyp
rus
Aus
tria
Latvia
Malta
Net
herla
nds
Hun
gary
EMU
Bulgar
ia
Den
mark
Ireland EU
Belgium
Italy
Poland
Finlan
d
Slov
enia
Slov
akia
Cro
atia
Fran
ce
Portug
al
U.K
ingd
om
Spain
Gre
ece
Asa%ofG
DP
current transfers,which expandedpartly as a result ofone-offfactors.Aswasthecasein2014,theincreaseininvestmentexpenditurewasboostedbyfundsfromtheEUbudgetunder the2007–2013financial perspective,theabsorptionofwhichexpiredlastyear.Afteritsdeclinein2012and2013,thestrongergrowthof intermediateconsumption largely arose from the increase in thisexpenditureinpublicinstitutesinthehealthcaresector;thiswasmadepossiblebyincreasedHIISrevenue,whichhadbeenboostedbythegrowthincontributionbases;attheendoftheyearintermediateconsumptiongrowthwas also underpinned by expenditure related to themanagement of refugee and migrant flows. Subsidiesagainnumberedamongtheexpendituresthatdroppedin2015.Theyarethusnotablylowerthaninthepre-crisisperiod,buttheirroleinsupportingthecorporatesectorisbeingreplacedbyotherinstruments(seeChapter1.2).Interest payments declined for the first time since theonsetof thecrisis,whichwasattributable to themorefavourable conditions for new borrowing. The largestdeclinewasrecordedforexpenditureoncapitaltransfers,but in 2014 these had been affected by a number ofone-off factors. In 2015 there were significantly fewerone-offfactorsandtheirtotalimpactonthedeficit(bothrevenueandexpenditure)wasnegligible(EUR20millionor0%ofGDP)3comparedwith2014(slightlymorethanEUR400millionor1.2%ofGDP).

97Development Report 2016Indicators of Slovenia’s development
borrowing terms,was earmarked for pre-financing theborrowingrequirementsinthefutureandincreasingthedepositasahedgeagainsttheforeignexchangeriskofbonds issued inUSD. In2015 theRepublicof Sloveniaissuedlong-termbondsintheamountofjustoverEUR2.9 billion. For the first time since independence, theyincludeda30-yearbond (in two issues) in theamountofEUR575millionwiththeaverageinterestrateofbothissuesat3.139%.Thehighliquidityofthemoneymarketin2015wasalsoreflectedintheextremelylowrequiredyieldsonshort-termdebtinstruments,whichfellbelow0%inFebruary2016.Thebulkofdebtisstillaccountedforbycentralgovernmentdebt(98%oftotaldebt).Thegrowthinlocalgovernmentdebtcametoahaltin2015.
1.7 General government debtIn 2015 general government debt increased further, once again primarily due to the government borrowing for pre-financing borrowing needs in the years to come; however, its maturity is being extended. GeneralgovernmentdebtexpandedbyEUR1.9billion in2015(2.3percentagepointsofGDP).This issignificantly lessthan in the previous two years, when a large portionof new borrowingwas used for the recapitalisation ofthebanks,butconsiderablymorethanbeforethecrisiswhenithadbeenrisingbyanaverageofEUR0.6billionperyear.Attheendof2015,generalgovernmentdebtreached83.0%ofGDP,whichranksSloveniainthemiddleamong EU Member States, but its growth dynamicshaveexceededtheEUaverageeversincethebeginningof the crisis. Almost half of the debt increase in 2015(EUR 0.8 billion)was used to cover the current deficit;the remainder,however,owing to the improvement in
Figure:Consolidated general government debt in EU Member States in 2015 and the change of debt relative to 2008
Source:EurostatPortalPage–EconomyandFinance–Governmentstatistics,April2016.
0
20
40
60
80
100
120
140
160
180
200
0
20
40
60
80
100
120
140
160
180
200
Gree
ce
Italy
Portu
gal
Cypr
us
Belgium
Spain
Fran
ce
Ireland
U.Kingd
om
Croa
tia
Austria EU
Slov
enia
Hung
ary
Germ
any
Neth
erland
s
Malta
Finlan
d
Slov
akia
Poland
Swed
en
Lith
uania
Czec
hR.
Den
mark
Rom
ania
Latvia
Bulgar
ia
Luxe
mbo
urg
Esto
nia
Inp
erce
ntag
epo
ints
Asa%
ofG
DP
Shareofdebt,leftaxis
Changeintheshareofdebt,rightaxis
Table:Consolidated general government debt by sub-sector, Slovenia
2008 2009 2010 2011 2012 2013 2014 2015
In EUR bn
General government, total 8.3 12.5 13.9 17.2 19.4 25.5 30.2 32.1
Centralgovernment 8.2 12.2 13.4 16.6 18.8 25.0 29.6 31.5
Localgovernment 0.4 0.5 0.6 0.7 0.7 0.7 0.8 0.8
Socialsecurityfunds 0.0 0.0 0.1 0.1 0.1 0.0 0.0 0.0
Consolidateddebtbetweensub-sectors -0.3 -0.2 -0.1 -0.1 -0.2 -0.2 -0.2 -0.2
As % of GDP
General government, total 21.8 34.6 38.4 46.6 53.9 71.0 81.0 83.2
Centralgovernment 21.6 33.7 36.9 45.0 52.3 69.5 79.3 81.7
Localgovernment 0.9 1.4 1.7 1.9 2.0 2.0 2.1 2.0
Socialsecurityfunds 0.0 0.0 0.1 0.1 0.1 0.0 0.0 0.0
Consolidateddebtbetweensub-sectors -0.7 -0.5 -0.4 -0.4 -0.5 -0.5 -0.5 -0.5
Source:SI-STATDataPortal–NationalAccounts–Generalgovernmentaccounts–Generalgovernmentdebt,April2016.Somecalculationsandsumsdonotmatchdue toroundings.

98 Development Report 2016Indicators of Slovenia’s development
lowerthanin2014(1.6%).Inthefirstmonthsof2016,itcontinuedtodecline,reaching1.3%attheendofMarch.
In 2015 the rating agency Moody’s returned Slovenia’s credit rating to investment grade and thus restored its ranking among the countries with low risk. TheratingagenciesS&PandFitchpreservedtheir lowriskratingsforSlovenia in2015.Despite the improvement in2014and 2015, these ratings remain lower than before thecrisis.Ontheotherhand,S&PandFitchimprovedtheiroutlooks for Slovenia from stable to positive in 2015,mainlyowingtotheimprovementindomesticeconomicactivity and a decline in political risks regarding theimplementationofeconomicandfiscalpolicymeasures.
1.8 Yield on 10-year government bondsWith the continued recovery of the Slovenian and euro area economies and further ECB measures, the yields of Slovenian government bonds dropped further in 2015. After a pronounced fall in 2014 (to 2.2%),the yields on 10-year Slovenian government bondscontinued todecline in2015,mostnotably in thefirstquarter. The decline in the yields on Slovenian bonds(aswellasthebondsofmosteuroareacountries)inthisperiod was attributable not only to the improvementin the economic situation and a general decline inuncertaintyintheEU,butalso,forthemostpart,totheECB’sannouncementofnewmeasures toenhance thefunctioning of the transmissionmechanism.1 InMarch2015 the yield to maturity of the 10-year SlovenianeurobondthusreacheditslowestlevelsinceSlovenia’sadmissiontotheeuroarea(0.8%).Laterintheyeartheyieldsrose,notonlyforSloveniabutalsoformostoftheother countries in the euro area,mainly owing to theuncertainty related to the agreement betweenGreeceand its biggest creditors. After the agreement wassigned in July 2015,2 the required yields ofmost euroareacountriesresumedtheirdecline.Attheendof2015theaverageyieldoftheSlovenianeurobondswasthus
1 InMarch2015 theECBstarted tocarryout theexpandedprogrammeofgovernmentandcorporatebondpurchases in the totalamountofEUR1,140billion.CombinedmonthlypurchaseswillamounttoEUR60billion.AfterthedecreaseinSeptember2014, inDecember2015theECBonceagain loweredtheinterestrateonthedeposit facility(to−0.30%)andextendedtheimplementationoftheexpandedassetpurchaseprogramme(March2017).In2015theBankofSloveniapurchasedEUR2.2billioninbondsundertheexpandedbondpurchaseprogramme;theECBboughtbondsinthetotalamountofaroundEUR495billion.2GreeceacceptedEUR86billion infinancialassistance fromthe IMFandtheESMunderanewprogramme,whichwill rununtilAugust2018.
Table:Credit ratings and changes in credit ratings
Country Agency Rating in 2015 Change 2015/2008 Change 2015/2014
SloveniaFitch
Moody’sS&P
BBB+Baa3A–
↓5↓6↓4
no change↑1
no changeSource:Standard&Poor’s,Moody’s,Fitch,2015.
Figure:Yields on 10-year government bonds denominated in euro, in %
Source:Bloomberg.
0
2
4
6
8
10
12
14
16
18
Jan12
Jul1
2
Jan13
Jul1
3
Jan14
Jul1
4
Jan15
Jul1
5
Jan16
Yields
on10
-yea
rgov
ernm
entb
onds
,in%
Slovenia Portugal Spain Italy Ireland Germany Austria

99Development Report 2016Indicators of Slovenia’s development
rates.Thebulkofthenominalincreaseinrevenuefromsocial contributionswasgenerated in thefirst yearsofthe crisis (owing to wage growth, despite the declineinemployment);aftertwoconsecutiveyearsofdecline,they increased again in 2014 but at a lower rate thanGDP(despitetheadoptionofmeasurestobroadenthecontributionbase).
In 2014 the share of taxes and contributions in GDP in Slovenia was comparable to the non-weighted average of the EU Member States,1 but the relative weight of social contributions, excise duties and VAT was higher than in the EU.Theburdenof taxesandcontributionswas3.9percentagepointslowerthantheaverageoftheold Member States and 4.3 percentage points higherthan the average of those countries that joined theEU in2004or thereafter.Sloveniastoodout frombothaverages with its high burden of social contributionsandexciseduties; theVATburden inSloveniawasalsohigher than the average for the old Member States.Thetaxburdenoncorporateincomeandproperty(realestate)waslowerthantheaveragesofthetwogroupsofcountries. In termsof thepersonal incometaxburden,SloveniarankedbetweenthelowerandhigheraveragesforthenewandoldEUMemberStatesrespectively.
1.9 Taxes and social security contributions Having increased in relation to GDP since the beginning of the economic crisis, the burden of taxes and social contributions declined slightly in 2014 and 2015 and was similar to the pre-crisis year; in nominal terms, it was still lower than before the crisis.Theshareof revenue from taxes and social contributions inGDPin2014 (37.0%)was similar to that in 2008,butbelowits2005peak (−1.3percentagepoints).Revenues fromtaxeswerelowerthanin2008,whilerevenuesfromsocialcontributionswere slightlyhigher,bothnominally andasashareofGDP.Thenominaldecline in tax revenuesarisesfrom:(i)adeclineincorporateincometaxrevenueasaresultofdeterioratedbusinessperformance,gradualreductionsinthetaxrateandincreasedtaxreliefs;and(ii) a decline in personal income tax revenue, mainlyas a consequenceof lower employment, increased taxallowances and a higher upper limit for the secondincomebracket.Despite the higherVAT rates, revenuefrom VAT was still slightly lower, while revenue fromexcisedutieswashigherowingtotheraisedexciseduty
Table:The burden of taxes and social contributions, Slovenia, as a % GDP (according to ESA 2010)
2000 2005 2008 2009 2010 2011 2012 2013 2014
TAXES AND SOCIAL CONTRIBUTIONS 36.9 38.3 36.9 36.8 37.5 37.0 37.4 37.3 37.0
Taxes, ofwhich 22.7 24.1 22.9 21.9 22.3 22.0 22.2 22.3 22.3
Valueaddedtax(VAT) 8.5 8.5 8.3 7.9 8.1 8.1 8.0 8.5 8.5
Exciseduties* 3.0 3.3 3.3 4.0 4.2 4.1 4.5 4.3 4.2
Personalincometax 5.5 5.4 5.7 5.7 5.6 5.6 5.7 5.1 5.0
Corporateincometax 1.1 2.7 2.5 1.8 1.8 1.7 1.2 1.2 1.4
Net social contributions 14.2 14.2 14.0 14.9 15.2 15.0 15.2 14.9 14.6Source:SI–STATDataPortal–NationalAccounts–Generalgovernmentaccounts–Fiscalburdenoftaxablepersonsbytaxesandsocialcontributions,September2015.Note:*includingexcisedutiesonimportsandallotherexciseduties.
Figure:The burden of taxes and social contributions, Slovenia, as a share of GDP, Slovenia and the EU, 2014
Source:EurostatPortalPage–EconomyandFinance–Governmentstatistics−Mainnationalaccountstaxaggregates(accordingtoESA2010),January2016.Note:ThefiguresfortheEU-28,EU-15(oldEUMemberStates)andNMS-13(newEUMemberStatessince2004orthereafter)showunweightedaverages.
0
5
10
15
20
25
30
35
40
45
EU-15 NMS-13 EU-28 Slovenia
Asa%
ofG
DP
Taxesonproductionandimports
Currenttaxesonincome,wealth,etc.
Netsocialcontributions
Capitaltaxes(inheritance,gifts,etc.)
TaxesandcontributionsassessedbutunlikelytobecollectedTaxesandsocialcontributionstogether
1TheaveragefortheEU-28istheunweightedaverage(37.2%),whichisclosertothemedian(36.8%)thantheweightedaverage(40.1%)andcanalsobecalculatedfornarrowergroupsofcountries.

100 Development Report 2016Indicators of Slovenia’s development
1.10 Tax burden by economic functionAmid higher rates of excise duty and VAT, the tax burden on consumption is higher than in the years before the crisis, while the effective taxation of labour and capital declined in the period up to 2014. Theeffectivetaxationof consumptionmeasured by the implicit tax rate (ITR) on consumption rose significantly after the increaseinVAT rates inmid-2013 and reached its highest levelin2014 (25.7%); the increases in exciseduty rates alsomadeasignificantcontributiontothe increaserelativetothepre-crisislevel.The implicit tax rate on labourwasrelatively stable after a period of decline (2006–2010);in2014(35.2%)itwas2.6percentagepointslowerthanthe highest figure in 2003. The effective tax burdenon capital continued to decline in 2014.Owing to thegradualreductioninthecorporateincometaxrateandthe increase in tax reliefs inpreviousyears, the implicit tax rate on capital in2014(21.9%)wasmuchlowerthanin2007,whenitreachedthehighest levelafterseveralyears of growth. In comparison with the unweightedEUaverage,1Sloveniahadhighereffective tax ratesonconsumptionand labouranda lowereffective tax rate
1ThecomparisonsoftheimplicittaxratesarebasedontheunweightedEUaverage,whichisclosertothemedianthantheweightedaverage.Itcanalsobecalculatedfortheimplicittaxrateoncapital,forwhichtheweightedEUaverageisnotavailable.2ThecomparisonisbasedontheunweightedaveragefortheEU-28,whichisclosertothemedianthantheweightedaverage.3Thelastyearforwhichdataareavailable(accordingtoESA1995).Morerecentdata(accordingtoESA2010)arenotyetavailable.
Figure:Implicit tax rates on consumption, labour and capital (as a % of the base), Slovenia (according to ESA 2010)
Source:SI-STATDataPortal–NationalAccounts–Generalgovernmentaccounts–Implicittaxrates,September2015.
15
20
25
30
35
40
2000
2001
2002
2003
2004
2005
2006
2007
2008
2009
2010
2011
2012
2013
2014
Implic
ittax
rate,in
%
ITRonconsumption
ITRonemployedlabour
ITRoncapital
oncapitalin2012accordingtothelatestinternationallycomparabledataavailable.
Revenues from consumption and labour taxes as a share of GDP exceed the unweighted EU average2 and have increased more since the beginning of the crisis than the EU average; for revenue from taxes on capital, however, the opposite holds true. In Sloveniataxes on consumption as a share of GDP roseduringtheperiodfromthebeginningofthecrisisupto20123dueto increases in excise duty rates.They rosemore thanthe EU average, which Slovenia had exceeded duringtheentireperiod.Theshare of taxes on labour in GDPwasmore stable owing to the smaller changes in their taxtreatment.Afteraperiodofdecline(2004–2007),ithadbeenrisinggraduallyandreturnedcloseto20%;thisishigher than theEUaverage,which is related tohighersocialcontributionsinrelationtoGDP.In2012theshare of taxes on capital in GDPcontinuedtofallevenfurtherbelowtheEUaverage,whichrecordedasmallerdeclineduring thecrisis.The fallingof this share inSlovenia isrelated to (i) the deterioration of companies’ businessperformance during the crisis; (ii) a decline in thecorporate incometax;and(iii)an increase intaxreliefsforfixedcapitalformationanddevelopment.
Table:Taxes and contributions by economic function, tax revenues as a % of GDP (according to ESA 1995)
2000 2005 2008 2009 2010 2011 2012
Taxes on consumptionSlovenia 13.8 13.4 13.4 13.6 14.0 13.9 14.2
EU* 12.0 12.5 12.1 11.9 12.1 12.2 12.3
Taxes on labourSlovenia 20.2 20.4 19.1 19.5 19.6 19.4 19.7
EU* 17.7 16.9 17.2 17.4 17.1 17.1 17.4
Taxes on capitalSlovenia 3.3 4.9 4.9 4.2 4.2 3.9 3.7
EU* 7.4 7.1 7.4 6.6 6.5 6.6 6.7Source:Eurostat:GovernmentFinanceStatistics,Structureoftaxesbyeconomicfunction.Note:*FortheEU,anunweightedaverageisused.Thedatafor2000arefortheEU-27,otherwisefortheEU-28.TheclassificationoftaxesisbasedontheESA1995classificationbyeconomicfunctionoftheirtaxbases(forexplanationsseeDevelopmentReport2014,p.148);thelatestdataaccordingtoESA2010arenotyetavailable.
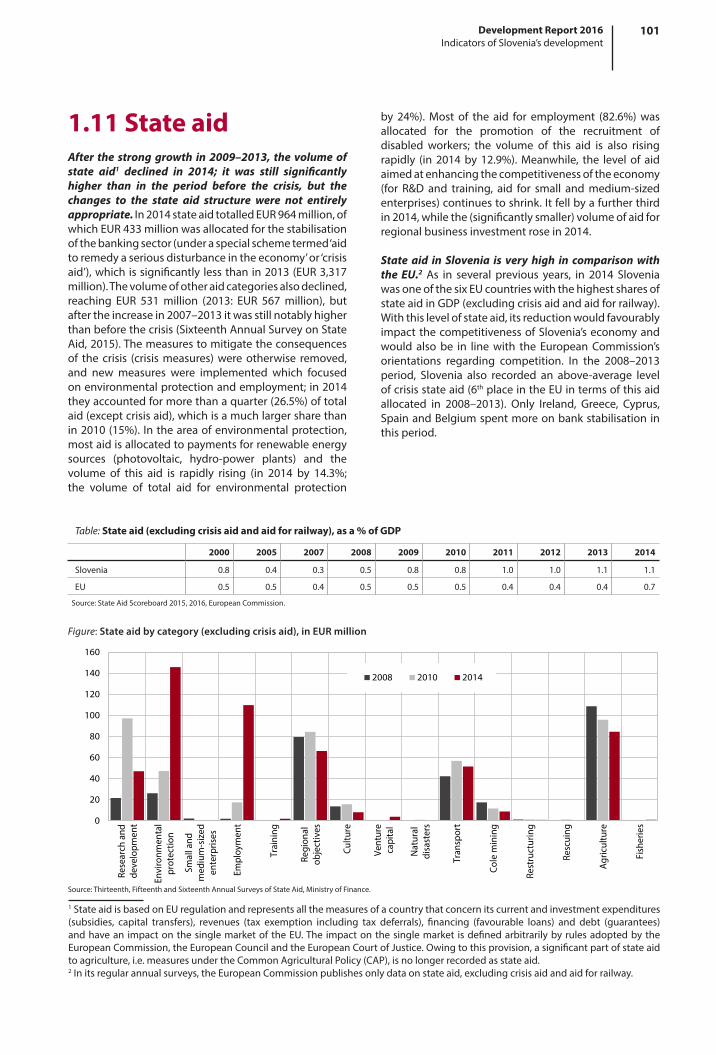
101Development Report 2016Indicators of Slovenia’s development
by 24%).Most of the aid for employment (82.6%)wasallocated for the promotion of the recruitment ofdisabled workers; the volume of this aid is also risingrapidly (in2014by12.9%).Meanwhile, the levelof aidaimedatenhancingthecompetitivenessoftheeconomy(for R&D and training, aid for small andmedium-sizedenterprises)continuestoshrink.Itfellbyafurtherthirdin2014,whilethe(significantlysmaller)volumeofaidforregionalbusinessinvestmentrosein2014.
State aid in Slovenia is very high in comparison with the EU.2 As in several previous years, in 2014 SloveniawasoneofthesixEUcountrieswiththehighestsharesofstateaidinGDP(excludingcrisisaidandaidforrailway).Withthislevelofstateaid,itsreductionwouldfavourablyimpactthecompetitivenessofSlovenia’seconomyandwould alsobe in linewith the EuropeanCommission’sorientations regarding competition. In the 2008–2013period, Slovenia also recorded an above-average levelofcrisisstateaid(6thplaceintheEUintermsofthisaidallocated in 2008–2013). Only Ireland, Greece, Cyprus,SpainandBelgiumspentmoreonbankstabilisationinthisperiod.
1.11 State aidAfter the strong growth in 2009–2013, the volume of state aid1 declined in 2014; it was still significantly higher than in the period before the crisis, but the changes to the state aid structure were not entirely appropriate. In2014stateaidtotalledEUR964million,ofwhichEUR433millionwasallocatedforthestabilisationofthebankingsector(underaspecialschemetermed‘aidtoremedyaseriousdisturbanceintheeconomy’or‘crisisaid’),whichissignificantlylessthanin2013(EUR3,317million).Thevolumeofotheraidcategoriesalsodeclined,reaching EUR 531million (2013: EUR 567million), butaftertheincreasein2007–2013itwasstillnotablyhigherthanbeforethecrisis(SixteenthAnnualSurveyonStateAid,2015).Themeasurestomitigatetheconsequencesof the crisis (crisismeasures)wereotherwise removed,and new measures were implemented which focusedonenvironmentalprotectionandemployment;in2014theyaccountedformorethanaquarter(26.5%)oftotalaid(exceptcrisisaid),whichisamuchlargersharethanin2010(15%). Intheareaofenvironmentalprotection,mostaidisallocatedtopaymentsforrenewableenergysources (photovoltaic, hydro-power plants) and thevolume of this aid is rapidly rising (in 2014 by 14.3%;the volume of total aid for environmental protection
1StateaidisbasedonEUregulationandrepresentsallthemeasuresofacountrythatconcernitscurrentandinvestmentexpenditures(subsidies, capital transfers), revenues (tax exemption including tax deferrals), financing (favourable loans) and debt (guarantees)andhavean impactonthesinglemarketof theEU.The impactonthesinglemarket isdefinedarbitrarilybyrulesadoptedbytheEuropeanCommission,theEuropeanCouncilandtheEuropeanCourtofJustice.Owingtothisprovision,asignificantpartofstateaidtoagriculture,i.e.measuresundertheCommonAgriculturalPolicy(CAP),isnolongerrecordedasstateaid.2Initsregularannualsurveys,theEuropeanCommissionpublishesonlydataonstateaid,excludingcrisisaidandaidforrailway.
Table:State aid (excluding crisis aid and aid for railway), as a % of GDP
2000 2005 2007 2008 2009 2010 2011 2012 2013 2014
Slovenia 0.8 0.4 0.3 0.5 0.8 0.8 1.0 1.0 1.1 1.1
EU 0.5 0.5 0.4 0.5 0.5 0.5 0.4 0.4 0.4 0.7
Source:StateAidScoreboard2015,2016,EuropeanCommission.
Figure:State aid by category (excluding crisis aid), in EUR million
Source:Thirteenth,FifteenthandSixteenthAnnualSurveysofStateAid,MinistryofFinance.
0
20
40
60
80
100
120
140
160
Rese
arch
and
deve
lopm
ent
Enviro
nmen
tal
prot
ectio
n
Smalla
ndm
edium
-sized
ente
rpris
es
Employ
men
t
Training
Region
alob
jectives
Cultu
re
Vent
ure
capita
l
Nat
ural
disa
ster
s
Tran
spor
t
Colem
ining
Restru
ctur
ing
Resc
uing
Agric
ultu
re
Fish
eries
2008 2010 2014

102 Development Report 2016Indicators of Slovenia’s development
valueinthisinsurancecategoryisalsoaconsequenceofthe insignificant levelofoldage savings.This impedesthe development of the capital market, which hascontracted considerably since the beginning of thefinancial crisis. After two years of growth, the valueof the indicator of market capitalisation of shares asa percentage of GDP rose again in 2015 and totalledapproximately20%ofthelevelintheEU.
1.12 Development of the financial systemThe gap between the level of financial system development in Slovenia and the EU average remains wide; since the onset of the crisis, this widening has been particularly noticeable in the banking sector. Thebanks’ total assets contracted further in 2015, but thedecline was slightly less pronounced than in previousyears. The main reason remained the falling volumeof loanstonon-bankingsectors,notonlyasaresultofdeleveraging(ofenterprisesandNFIsinparticular),butalso modest new lending. With regard to sources offinance, the banks continued to reduce their liabilitiesabroad,mainlytothemonetarysectorsand,toalesserextent,theECB.Intheareaofinsurance,asectorwherethe development gap has been the smallest for years,the indicatorvaluedeclined the leastduring thecrisis.However, Slovenia still lags significantlybehind theEUintheshareof life-insurancepremiums,which,at1.4%ofGDP,reacheslessthan30%oftheEUaverage.Thelow
Table:Indicators of financial system development
2000 2005 2010 2011 2012 2013 2014 2015
Banks’ total assets, as a % of GDP
Slovenia 68.9 100.2 138.8 132.1 128.2 112.4 103.8 97.1
EU 236.3 295.9 347.4 351.9 338.9 313.8 311.2
Insurance premiums, as a % of GDP
Slovenia 4.3 5.3 5.8 5.6 5.6 5.5 5.2
EU-27* 8.1 8.4 8.3 7.8 7.7 7.8 7.9
Market capitalisation of shares, as a % of GDP
Slovenia 15.2 22.9 19.4 13.2 13.6 14.4 16.7 14.3
EU 96.6 90.8 65.0 57.0 61.0 68.5 69.0 74.2
Source:FinancialStabilityReport(variousvolumes),AnnualStatisticalReport(LjubljanaStockExchange–variousvolumes).Statistical InsuranceBulletin(SlovenianInsuranceAssociation–variousvolumes), InsuranceData (InsuranceEurope),EuropeanBankingSectorFactsandFigures2015 (EBF),Companyfiles (LondonStockexchange–variousvolumes),EuropeanSecuritiesExchangeStatistics(FederationofEuropeanSecuritiesExchanges),NationalAccounts(EUROSTAT),NationalAccounts(SURS),2015.Note:*Theindicatorofinsurancepremiumsasa%ofGDPdoesnotincludedataforLithuania;thedatafor2000donotincludeRomania.
Figure:Total assets as a % of GDP in EU Member States, 2014
Source:BoS,EuropeanBankingFederation,SURS,Eurostat.
1969
0
100
200
300
400
500
600
700
800
900
1,000
Luxe
mbo
urg
Malta
Ireland
Cypr
us
Den
mark
U.Kingd
om
Fran
ce
Net
herla
nds
Swed
en
Spain
Finlan
d
Belgium
Portug
al
Germ
any
Austria
Italy
Gree
ce
Croa
tia
Latvia
Czec
hR.
Bulgar
ia
Hung
ary
Esto
nia
Slov
enia
Poland
Slov
akia
Lith
uania
Rom
ania
Asa%
ofG
DP
2014 EU

103Development Report 2016Indicators of Slovenia’s development
1.13 Loan-to-deposit ratio The loan-to-deposit ratio continued to decline in 2015, but at a slightly slower pace. It fell by almost half incomparisontothehighestlevelin2008.Throughouttheperiod,thedeclinewasprimarilyduetothecontractionof loans rather than growth in deposits. The ratio fellmostnotably in2014,owingto the transferofEUR1.7billion in non-performing claims to the BAMC and aconcomitantsignificant increase innon-bankingsectordeposits due to the higher confidence in the bankingsystem after its stabilisation. In 2014 the amount ofdeposits thus exceeded the amount of loans for thefirst time since comparable data1 have been available.Growth in deposits wasmoremodest throughout theentire period. In 2013 deposits even dropped, mainlyowing to the uncertainty regarding the method ofbankingsystemstabilisation.Thedeclineintheratioin2015stemmedfromboththecontractionof loansandgrowthindeposits.Thefallinthetotalamountofloanswas smaller than in 2014. Growth in deposits slowedappreciably,asonlyovernightdepositswerestillrising,the main reason for this being the very low depositinterest rates,whichno longercompensatedsavers forthereducedliquidityoftheirtieddeposits.
In the EU the indicator value has also declined since the beginning of the crisis, but from a lower pre-crisis level and to a lesser extent than in Slovenia. Duringthecrisis,theonlytwocountrieswhichrecordeda largerdecline
Table:Loan-to-deposit ratios of non-banking sectors in Slovenia and the EU
2005 2010 2011 2012 2013 2014 2015
Slovenia 1.03 1.48 1.40 1.38 1.22 0.98 0.89
EU 1.26 1.16 1.15 1.13 1.08 1.06 1.04
Source:EBF,ECB,BoS;calculationsbyIMAD.
Figure:Loan-to-deposit ratios in EU Member States, 2015
Source:BoS,ECB;calculationsbyIMAD.
0.0
0.5
1.0
1.5
2.0
2.5
3.0
3.5
Den
mark
Swed
en
Gree
ce
Cypr
us
Finlan
d
Esto
nia
Net
herla
nds
Italy
Fran
ce
Latvia
Austria
Poland
Portug
al
Croa
tia
Lith
uania
U.Kingd
om
Spain
Slov
akia
Germ
any
Slov
enia
Rom
ania
Ireland
Hung
ary
Bulgar
ia
Czec
hR.
Belgium
Malta
Luxe
mbo
urg
2015 EU
thanSloveniaintheirloan-to-depositratioswereEstoniaandIreland.Insomecountries,ithadalreadystartedtorisein2015.Thiswasmostlyduetothegrowthofloans,with the exception of Greece, where the otherwisestrongest growth in the ratio in the EU resulted froman approximately 25% decline in non-banking sectordeposits owing to the low confidence of savers in thebankingsystem.
1Since2005.

104 Development Report 2016Indicators of Slovenia’s development
performing claims (expressed in relative terms) werereducedalso reflected thecontraction inbank lendingactivity(in2014thetotalvolumeofloanscontractedby12.8%;excludingthetransferstotheBAMC,by7.0%andin2015by6.7%).Ifthebankingsystem’stotalexposurehad remained unchanged relative to 2014, the shareof non-performing claims would have fallen by 0.6percentagepointsmorein2015,andby1.5percentagepointsrelativeto2013.
The share of non-performing claims in Slovenia significantly exceeds the EU average, but the stabilisation of the banking system contributed to its relatively faster decline in 2014.3 The averageshare of non-performing claims in the EU as a wholehas increased since the beginning of the crisis, butmuch less than inSlovenia.TheexceptionsareCyprus,Greece,Ireland,Romania,Croatia,BulgariaandHungary,whichwere particularly affectedby the financial crisis.In 2014 the shares of non-performing claims eitherdeclinedor increasedonlyslightly inmostEUMemberStates.Cyprusstandsoutwith the largest increase (6.3percentagepoints),aswellasGreece, Italy,CroatiaandPortugal(between1and2percentagepoints).Sloveniaranked among the countrieswith large shares of non-performingclaims,despiteanabove-averagedeclineintheindicatorvaluein2014.
1Attheendof2015theEBApublishedananalysisofnon-performingexposuresin21EUMemberStatesandNorway.TheEBAusesabroaderdefinitionofnon-performingexposures,underwhichnon-performingexposuresincludenotonlyarrearsofmorethan90days,butalsoexposuresthatmeetthe“unlikelytopay”criterion.AstheEBAanalysiscoversonly105bankinggroupsanddoesnotincludedataonthetotalbankingsystemofEUMemberStates,noralongertimeseries,whichwouldenablecomparisonsoveralongertimeperiod,thetermnon-performingclaimsinourReportrefersonlytoclaimsthataremorethan90dayspastdue.2Allclassifiedclaims.3Thedatafor2013doesnotincludedataforFinland;thedatafor2014doesnotincludedataforFrance,FinlandandLuxembourg.
1.14 Non-performing claims1
In 2015 the amount and share of non-performing claims in the banking system’s total exposure2 continued to fall. Thisdecline,havingstartedattheendof2013withthecommencementofrepairstothebanks’balancesheets,wasalmostasintenseasin2014,whenthe largest share of non-performing claims had beentransferredtotheBAMC;inourestimation,thisisalsoaresultofthepositiveeffectsofthemasterrestructuringagreements (MRA). At the end of 2015 the volume ofnon-performing claims amounted to EUR 3.5 billion,whichwasEUR1billion less than in2014andEUR4.3billion less than before the beginning of the bankingsystemstabilisationinNovember2013. Ittotalled9.9%ofthebankingsystem’stotalexposure.Non-performingclaims against non-financial corporations continuedto contract. Unlike in previous years, a significantcontributingfactortothe2015declinewasareductioninnon-performingclaimsagainstnon-residents,whichhadnotbeensubjecttothetransferofnon-performingclaims to the BAMC within the process of bankingsystem stabilisation, and fell last year for thefirst timesince2010. In2014and2015,thespeedatwhichnon-
Figure:Comparison of the shares of non-performing claims in EU Member States, 2014
Source:IMF,WorldBank,BoS;calculationsbyIMAD.Note:*ThedatafortheEUistheaverageofEUMemberStatesweightedbythetotalassetsortheirbankingsystems.For2014dataforFrance,FinlandandLuxembourgarenotavailable.
Table:Share of non-performing claims in Slovenia and the EU, in %
2008 2009 2010 2011 2012 2013 2014 2015
Slovenia 3.8 5.4 7.4 11.2 14.4 13.4 11.9 9.9
EU* 2.6 4.3 4.5 5.0 5.7 6.2 5.1
Source:IMF,WorldBank,BoS;calculationsbyIMAD.Note:*ThedatafortheEUaretheaveragesofEUMemberStatesweightedbythetotalassetsoftheirbankingsystems.For2013,dataforFinlandarenotavailable,whilethedatafor2014donotincludedataforFrance,FinlandandLuxembourg.
0
5
10
15
20
25
30
35
40
45
50
Cypr
us
Gree
ce
Ireland Italy
Bulgar
ia
Croa
tia
Hung
ary
Rom
ania
Portug
al
Slov
enia
Malta
Spain
Lith
uania
Czec
hR.
Slov
akia
Poland
Latvia
Den
mark
Belgium
Austria
Net
herla
nds
Germ
any
U.Kingd
om
Esto
nia
Swed
en
In%
2014 EU
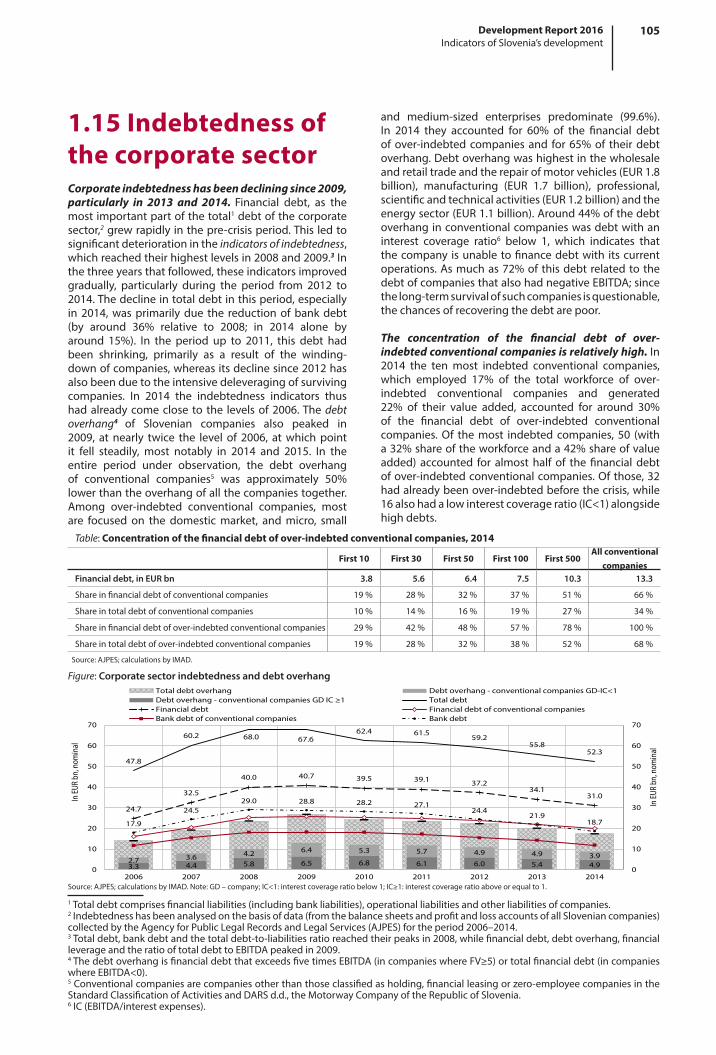
105Development Report 2016Indicators of Slovenia’s development
and medium-sized enterprises predominate (99.6%).In 2014 they accounted for 60% of the financial debtofover-indebtedcompaniesand for65%of theirdebtoverhang.Debtoverhangwashighestinthewholesaleandretailtradeandtherepairofmotorvehicles(EUR1.8billion), manufacturing (EUR 1.7 billion), professional,scientificandtechnicalactivities(EUR1.2billion)andtheenergysector(EUR1.1billion).Around44%ofthedebtoverhanginconventionalcompanieswasdebtwithaninterest coverage ratio6 below 1, which indicates thatthecompany isunabletofinancedebtwith itscurrentoperations.Asmuchas72%ofthisdebtrelatedtothedebtofcompaniesthatalsohadnegativeEBITDA;sincethelong-termsurvivalofsuchcompaniesisquestionable,thechancesofrecoveringthedebtarepoor.
The concentration of the financial debt of over-indebted conventional companies is relatively high. In2014 the ten most indebted conventional companies,which employed 17% of the total workforce of over-indebted conventional companies and generated22% of their value added, accounted for around 30%of the financial debt of over-indebted conventionalcompanies.Of themost indebtedcompanies, 50 (witha32%shareoftheworkforceanda42%shareofvalueadded) accounted for almosthalf of thefinancialdebtofover-indebtedconventionalcompanies.Ofthose,32hadalreadybeenover-indebtedbeforethecrisis,while16alsohadalowinterestcoverageratio(IC<1)alongsidehighdebts.
1.15 Indebtedness of the corporate sectorCorporate indebtedness has been declining since 2009, particularly in 2013 and 2014. Financial debt, as themostimportantpartofthetotal1debtofthecorporatesector,2grewrapidlyinthepre-crisisperiod.Thisledtosignificantdeteriorationintheindicators of indebtedness,whichreachedtheirhighestlevelsin2008and2009.3Inthethreeyearsthatfollowed,theseindicatorsimprovedgradually, particularly during the period from 2012 to2014.Thedeclineintotaldebtinthisperiod,especiallyin2014,wasprimarilydue the reductionofbankdebt(by around 36% relative to 2008; in 2014 alone byaround 15%). In the period up to 2011, this debt hadbeen shrinking, primarily as a result of the winding-downofcompanies,whereasitsdeclinesince2012hasalsobeenduetotheintensivedeleveragingofsurvivingcompanies. In 2014 the indebtedness indicators thushadalreadycomeclose to the levelsof2006.Thedebt overhang4 of Slovenian companies also peaked in2009, at nearly twice the level of 2006, atwhichpointit fell steadily, most notably in 2014 and 2015. In theentire period under observation, the debt overhangof conventional companies5 was approximately 50%lowerthantheoverhangofallthecompaniestogether.Among over-indebted conventional companies, mostare focused on the domesticmarket, andmicro, small
1Totaldebtcomprisesfinancialliabilities(includingbankliabilities),operationalliabilitiesandotherliabilitiesofcompanies.2Indebtednesshasbeenanalysedonthebasisofdata(fromthebalancesheetsandprofitandlossaccountsofallSloveniancompanies)collectedbytheAgencyforPublicLegalRecordsandLegalServices(AJPES)fortheperiod2006–2014.3Totaldebt,bankdebtandthetotaldebt-to-liabilitiesratioreachedtheirpeaksin2008,whilefinancialdebt,debtoverhang,financialleverageandtheratiooftotaldebttoEBITDApeakedin2009.4ThedebtoverhangisfinancialdebtthatexceedsfivetimesEBITDA(incompanieswhereFV≥5)ortotalfinancialdebt(incompanieswhereEBITDA<0).5Conventionalcompaniesarecompaniesotherthanthoseclassifiedasholding,financialleasingorzero-employeecompaniesintheStandardClassificationofActivitiesandDARSd.d.,theMotorwayCompanyoftheRepublicofSlovenia.6IC(EBITDA/interestexpenses).
Table:Concentration of the financial debt of over-indebted conventional companies, 2014
First 10 First 30 First 50 First 100 First 500All conventional
companiesFinancial debt, in EUR bn 3.8 5.6 6.4 7.5 10.3 13.3
Shareinfinancialdebtofconventionalcompanies 19% 28% 32% 37% 51% 66%
Shareintotaldebtofconventionalcompanies 10% 14% 16% 19% 27% 34%
Shareinfinancialdebtofover-indebtedconventionalcompanies 29% 42% 48% 57% 78% 100%
Shareintotaldebtofover-indebtedconventionalcompanies 19% 28% 32% 38% 52% 68%
Source:AJPES;calculationsbyIMAD.
Figure:Corporate sector indebtedness and debt overhang
Source:AJPES;calculationsbyIMAD.Note:GD–company;IC<1:interestcoverageratiobelow1;IC≥1:interestcoverageratioaboveorequalto1.
3.3 4.4 5.8 6.5 6.8 6.1 6.0 5.4 4.92.7 3.6 4.2 6.4 5.3 5.7 4.9 4.9 3.9
47.8
60.2 68.0 67.662.4 61.5
59.255.8
52.3
24.7
32.5
40.0 40.7 39.5 39.1 37.234.1
31.0
17.9
24.529.0 28.8 28.2 27.1
24.421.9
18.7
0
10
20
30
40
50
60
70
0
10
20
30
40
50
60
70
2006 2007 2008 2009 2010 2011 2012 2013 2014
InEU
Rbn
,nom
inal
InEU
Rbn
,nom
inal
Totaldebtoverhang Debtoverhang-conventionalcompaniesGD-IC<1Debtoverhang- conventionalcompaniesGDIC≥1 TotaldebtFinancialdebt FinancialdebtofconventionalcompaniesBankdebtofconventionalcompanies Bankdebt


2 Factors of competitiveness• 2.1GDPpercapitainpurchasingpowerstandards• 2.2Labourproductivity
Competitiveness of the corporate sector• 2.3Marketshare• 2.4Unitlabourcosts• 2.5Structureofmerchandiseexportsbyfactorintensity• 2.6Knowledge-intensivemarketservices• 2.7Networkindustries• 2.8Foreigndirectinvestment• 2.9Entrepreneurialactivity
Human capital• 2.10Shareofthepopulationwithtertiaryeducation• 2.11Educationexpenditure• 2.12Participationofadultsinlifelonglearning
Innovative capacity• 2.13Grossdomesticexpenditureonresearchanddevelopment• 2.14Scienceandtechnologygraduates• 2.15Intellectualproperty• 2.16UseofInternetande-services
The role of the state and its institutions• 2.17Trustininstitutions

108 Development Report 2016Indicators of Slovenia’s development
Overview of indicators – Factors of competitiveness
Source:CalculationsbyIMAD.Note:ThetableshowsSlovenia’spositionrelativetotheunweightedarithmeticaverageoftheEUMemberStates.Itwascalculatedwithregardtothesetofcountriesforwhichdataforindividualindicatorswereavailable;Cyprus,Malta,LuxembourgandCroatiawereexcludedfromtheanalysisduetoalackofdata.Thedatainthetablearefor2008andthelastyearforwhichdataforEUMemberStateswereavailable(thelastyearisindicatedinthetable).Apositiveindicatorvaluemeansabove-averagedevelopmentrelativetotheEU,whileanegativevalueindicatesthatSlovenialagsbehindtheEUaverageonthatindicator.
-2 -1 0 1 2
Trustinthemainpoliticalinstitutions,in%
Internetusers,in%
No.ofpatentapplicationsfiledwiththeEPO,permillionpopulation
Shareofscienceandtechnologygraduatesinthetotalnumberoftertiaryeducationgraduates,in%
GrossdomesticexpenditureonR&D,asa%ofGDP
Participationofadults(25-64years)inlifelonglearning,in%
Publicexpenditureoneducation,asa%ofGDP
Shareofthepopulationwithtertiaryeducation,in%
Earlyentrepreneurialactivity,asa%ofpopulation(18-64years)
Inwardforeigndirectinvestment,asa%ofGDP
Outwardforeigndirectinvestment,asa%ofGDP
Marketshareofthelargestelectricityproducer,in%
Marketshareofthelargestproviderofmobiletelephony,in%
Shareofknowledge-intensivenon-financialservicesintotalexportsofservices,in%
High-technologyproductsasashareofmerchandiseexports
Unitlabourcosts,growthin%
Marketshareofworldmerchandiseexports,growthin%
Labourproductivity,inPPS
GDPpercapita,inPPS
2015
2015
2015
2013
2014
2015
2012
2015
2015
2014
2014
2014
2014
2014
2014
2014
2014
2014
2014
Thero
leof
statean
dits
institutions
Innova
tive
cap
acity
Hum
ancap
ital
Com
pet
itiven
essoft
heco
rporate
sec
tor
Standarddeviation
2008 Theyearbeforelast LastyearIndicator
datanotavailable

109Development Report 2016Indicators of Slovenia’s development
2.1 Gross domestic product per capita in purchasing power standardsIn 2014, for the first time since the onset of the crisis, Slovenia converged slightly to the EU average in terms of GDP per capita in purchasing power standards (PPS), but the gap remained wide (17 percentage points). According to the most recent data,1 GDP per capitain purchasing power standards totalled 22,600 PPS in2014.2Beforethecrisis,Sloveniahadbeencatchingupwith the EU on this indicator, reaching 89% of the EUaverage in 2008. However, owing to a steeper declinein economic activity,3 the gap with the EU widenedby 8 percentage points over the next five years untilfastereconomicgrowthin2014(Slovenia3%;EU1.4%)reducedthegapby2percentagepoints.CurrentdataoneconomicactivitysuggestthatSloveniaalsocontinuedtoconvergetowardsmoredevelopedcountriesin2015.
Table:GDP per capita in purchasing power standards for selected countries (EU=100)
2000 2005 2007 2008 2009 2010 2011 2012 2013 2014
Slovenia 79 86 87 89 85 83 83 81 81 83
EU-15 116 113 112 111 111 110 110 109 109 109
NewEUMemberStates,excludingSlovenia 52 60 65 67 66 67 68 69 69 70
VulnerableEUMemberStates* 102 105 105 102 102 100 97 95 94 94Source:EurostatPortalPage–PurchasingPowerParities,2015;calculationsbyIMAD.Note:*VulnerableEUMemberStates(Greece,Ireland,Italy,Portugal,Spain).
1InDecember2015,EurostatreleaseddataonGDPpercapitainPPSbasedonthelatestdataonpopulationsize,therevisedpurchasingpowerparitiesandthelatestreviseddataonGDPinnationalcurrenciesforindividualcountries.ThedataarecompiledinaccordancewiththerevisedEuropeanmethodology–theEuropeanSystemofAccounts2010(ESA2010).TherevisionchangedtheGDPlevelsforindividualyearsinallMemberStatesand,inturn,thecountries’positionsrelativetotheEUaverage.ForSlovenia,thelevelofGDPatcurrentpricesinthe1997–2013periodrosebyanaverageof1.9%,whichislessthanfortheEUasawhole(3.4%).2 GDPper capita in purchasing power standards enables a comparison between countries by eliminating the effect of price leveldisparitiesacrosscountries.Thepurchasingpowerstandard(PPS)–theselectionofacurrencyinwhichtheresultsareexpressed–isaconvention.InEurostat’scomparison,theresultsareshownintheformofa“currency”calledPPS.PPSisanartificial,fictitiouscurrencythat,attheEUlevel,equalsoneeuro.ThePPSorthe“EU-28euro”isa“currency”thatreflectstheaveragepricelevelacrosstheEU-28.3SeealsoIndicator1.1.
Figure: GDP per capita in PPS, change in 2008–2014 (EU=100)
Source:EurostatPortalPage–PurchasingPowerParities,2015.
102
-86
28
-35
-10-5
1-9
-114
3-6
-23-1
58
12-21
514
4-4
73
Luxembourg256Ireland132
Netherlands139Austria124
Denmark123Germany116Sweden126Belgium114Finland120
U.Kingdom114France106
Italy105Spain102
CzechR.81Malta81
Slovenia89Cyprus105Portugal79Slovakia72Estonia68
Lithuania63Greece94
Hungary63Poland54Latvia60
Croatia63Romania48Bulgaria44
266Luxembourg134Ireland131Netherlands130Austria125Denmark124Germany123Sweden119Belgium110Finland109U.Kingd.107France96Italy91Spain85CzechR.84Malta83Slovenia82Cyprus78Portugal77Slovakia76Estonia75Lithuania73Greece68Hungary68Poland64Latvia59Croatia55Romania47Bulgaria
Changeinpercentagepoints2008 2014
Slovenia remains one of the countries whose relative positions in economic development in the EU have deteriorated the most since the beginning of the crisis.TheonlycountriesthathavedivergedmorefromtheEUaverage than Slovenia since 2008 are Cyprus, Greece,Spain,Finland,ItalyandtheNetherlands.In2008GreeceandtheCzechRepublicwereclosesttoSloveniaintermsofGDPpercapita inPPS(in2014thesecountrieswereCyprus,MaltaandtheCzechRepublic).TwoofthenewMemberStates,MaltaandtheCzechRepublic,outpacedSlovenia during this period, while some of the newMember States substantially narrowed their gapswithSlovenia, particularly Lithuania and Estonia. In 2014 atotalof15countriesnarrowedtheirdevelopmentgapswith the EU in comparison with the previous year, ofwhichSloveniamadethemostprogress(by2percentagepoints); two countries held their positions, but elevencountries fell away, Finland themost (by3percentagepoints).ThegapinGDPpercapitainPPSbetweentheEUMemberStates–at1:9.8(Romania/Luxembourg)atthebeginningofthepreviousdecade–hasbeennarrowingover the years, falling to only 1:5.7 in 2014 (Bulgaria/Luxembourg).

110 Development Report 2016Indicators of Slovenia’s development
2.2 Labour productivityOnly during stronger economic activity in 2014 and 2015 did labour productivity1 exceed pre-crisis levels. A sharp fall in economic activity at the beginning ofthe crisis caused labour productivity to decline by asmuch as 6.1% in 2009. Labour productivity growthin subsequent years (except 2012) mainly stemmedfrom the adjustment of employment to the reducedeconomicactivityandwas,intheabsenceofeconomicrecovery,muchmoremodestthanbeforethecrisisandinsufficienttoexpediteconvergencetopre-crisisfigures.Onlyin2014and2015didtheincreaseinGDPbecomethemaindriverofgrowth.However,withtheconcurrentincreaseinemployment,productivitygrowthremainedsignificantly below the long-term average seen priortothecrisis(beforethecrisis,theten-yearaveragewas3.8%).Modestgrowthsincethebeginningofthecrisis,amid weak intra-industry productivity growth inmostsectors,wasalsodue to the contraction in somepartsof the economy thatweremost affected by the crisis,particularly construction and manufacturing (after2009thesesectorswerecharacterisedbythesignificantnegative contributionof the inter-industry componenttoproductivitygrowth).Owingtostrongerintra-industrygrowth, manufacturing activities have neverthelessbeen a major factor in the recovery of productivitysince 2009 (see Figure). Alongside manufacturing,market services also made a substantial contribution
1Measuredas the ratiobetweenGDPatconstantpricesand thenumberofemployedpersonsaccording to thenationalaccountsmethodology.2Information-communicationactivities(J),professional,scientificandtechnicalactivities(M).
Table:Labour productivity, Slovenia
2005 2006 2007 2008 2009 2010 2011 2012 2013 2014 2015
Realproductivitygrowth,in% 4.5 4.0 3.5 0.7 -6.1 3.4 2.4 -1.8 0.3 2.5 1.3
LabourproductivityinPPS,EU=100 83 83 82 83 80 79 80 80 80 82 N/A
Source:SI-STAT–NationalAccounts,2015;EurostatPortalPage–EconomyandFinance,2015;calculationsbyIMAD.
Figure:Sectoral contributions to productivity growth, Slovenia
Source:calculationsbyIMADbasedondatafromSURS(NationalAccounts,2015).
-8
-6
-4
-2
0
2
4
6
2005-2008average
2009 2010 2011 2012 2013 2014 2015
Inper
cent
agepo
ints
Marketservices(G-TexcludingO-Q)
Publicserviceactivities(O-Q)
Construction(F)
Industry(B-E)
Agriculture(A)
Productivitygrowth
to productivity growth during this period, particularlyknowledge-intensive services2 and transportation. In2014theconstructionsectorhadmuchtodowith theimprovement, but in 2015 this sector’s contributionrevertedtonegative.
Productivity of Slovenia’s economy remains low by international standards. Before the crisis, productivity(expressedinpurchasingpowerstandards)wasat83%oftheEUaverage,buthadalreadystoppedconvergingto the EU average several years before the crisis. In2009and2010,Slovenia’sproductivitygapwidenedbyanother4percentagepointsamid less favourableGDPmovements,andpersistedataverysimilarleveloverthenext three years. It narrowedmore noticeably only in2014,butproductivityremainedlowcomparedwiththeEU(82%oftheEUaverage).

111Development Report 2016Indicators of Slovenia’s development
andthemarketsofthemaintradingpartners,Slovenia’smarketsharedeclinedslightly,mainlyowingtotheeffectsof the structure of Slovenia’s merchandise exports (seealsoChapter2.1).3
The growth of Slovenia’s world market share in 2013 and 2014 was a consequence of a general increase in the shares on its main regional and product markets, which were also some of the most dynamic. Morespecifically, the growth in import demand on thesemarketswas,forthemostpart,higherthanontheglobalmarket. Market share growthwas recorded not only inGermany, Italy, Austria, Croatia and France, but also inHungary,Poland,theUnitedKingdom,theUSandRussia.4Intermsoffactorintensity,themarketsharesofallproductgroups5expandedin2013–2014,themostimportantSITCsections beingmedicinal and pharmaceutical products,iron and steel, non-ferrous metals, manufactures ofmetals, machinery specialised for particular industries,road vehicles,miscellaneousmanufactured articles, andpetroleumandpetroleumproducts.6
2.3 Market share In 2014 the market share of merchandise continued to grow. Intheperiod2008–2012Sloveniaexperiencedoneofthe largestdeclines intheEUintermsoftheshare inglobal merchandise trade (−22%), which was partly aconsequence of the regional and product structures ofthe country’s exports (see Development Report 2013,2014).Thedeclineon themarketsof the14key tradingpartners inthisperiodwasapproximatelyhalf lower;ontheEUmarket,aroundtwothirdslower.In2013,however,thesenegativedynamics turnedpositive,and this trendcontinuedin2014.DuringthisperiodSloveniawasoneoftheEUcountrieswiththehighestgrowthinworldmarketshare.1Itsfallrelativeto2007was,consequently,aroundathirdsmaller:onthemarketsofitsmaintradingpartnersSlovenia has already achieved pre-crisis levels while ithasexceededthese intheEU.Theavailabledataforthefirstninemonthsof2015indicatefurthergrowthontheEUmarket, but at a slower pace.2 On theworldmarket
1Thirdplace (9%cumulativegrowth,EU2.4%). 2Owingtoadecline in itsmarketshare in Italy,AustriaandCroatia,butaftermorepronouncedgrowthinpreviousyears.3DifferencesinthestructureofSlovenia’sexportsandimportdemand,andthefactthatinthefirstninemonthsof2015,themovementofimportdemandintradingpartnersfromtheEU(whereSloveniaexportsasmuchasthreequartersofgoods)waslessdynamicthanintradingpartnersoutsidetheEU.4In2014Slovenia’smarketshareexceededpre-crisislevelsinGermany,Croatia,Austria,ItalyandtheUS.5Particularlynatural-resource-intensiveproducts,low-,medium-andhigh-technologyproducts(theformertwoproductgroupsby15%andthelattertwoby10%).6Accordingtofactorintensity,in2014,high-technologyproductsweretheonlygroupwherethemarketshareexceededthefigurerecordedfor2007;amongtheSITCsections,theseincludedmedicinalandpharmaceuticalproducts,power-generatingmachineryandequipment,andpetroleumandpetroleumproducts.
Figure:World merchandise market shares of EU Member States, growth rates in %
Source:UnitedNationsCommodityTradeStatisticsDatabase,2015;calculationsbyIMAD.
-50
-40
-30
-20
-10
0
10
20
30
40
50
Malta
Swed
en
Esto
nia
Ireland
Gre
ece
Fran
ce
Finlan
d
Net
herla
nds
Den
mark
Cyp
rus
Italy
Belgium
Ger
man
y
EU28
U.K
ingd
om
Aus
tria
Latvia
Luxe
mbou
rg
Slov
akia
Hun
gary
Lith
uania
Portug
al
Bulgar
ia
Cze
chR.
Spain
Cro
atia
Slov
enia
Poland
Rom
ania
Gro
wth
rate
,in%
2014/2012 2014/2007
Table :Slovenia’s market share of world merchandise exports and in main trading partners, in %
2000 2005 2009 2010 2011 2012 2013 2014
World market share*
Slovenia 0.125 0.156 0.163 0.147 0.146 0.136 0.140 0.148
EU-27 34.344 34.781 32.872 30.557 29.835 28.532 29.329 29.213
Slovenia’s market share in its main trading partners**
Germany 0.474 0.457 0.470 0.450 0.485 0.488 0.488 0.503
Italy 0.498 0.589 0.626 0.608 0.617 0.626 0.690 0.764
Austria 0.959 1.203 1.280 1.311 1.231 1.312 1.431 1.574
Croatia 8.724 8.729 8.154 8.176 8.613 8.368 8.994 10.292
France 0.204 0.311 0.351 0.328 0.279 0.225 0.225 0.235
Poland 0.470 0.446 0.437 0.480 0.432 0.421 0.416 0.456
RussianFederation 0.564 0.587 0.429 0.342 0.339 0.383 0.430 0.466
Serbia N/A N/A 5.587 5.381 4.932 5.047 4.820 4.817Source:UnitedNationsCommodityTradeStatisticsDatabase,2015;calculationsbyIMAD.Notes:*Theexportmarketshare,calculatedastheshareofthemerchandiseexportsofSloveniaortheEU(intraandextra)inworldmerchandiseexports.**Slovenia’smarketshareinitsmaintradingpartners,calculatedastheshareofSlovenia’smerchandiseexportsinthemerchandiseimportsofagiventradingpartner.

112 Development Report 2016Indicators of Slovenia’s development
2.4 Unit labour costs ln 2015 unit labour costs declined again. Afterincreasingforthreeconsecutiveyearsundertheimpactofstrongwagegrowth(2008and2010)1andadeclinein labour productivity (2009), real unit labour costsdropped in2011 for thefirst timesince thebeginningofthecrisisowingtotheslowergrowthofwages.Whenlabour productivity fell again in 2012 due to lowereconomicactivity, thegrowth in realunit labour costsresumeddespiteaconcomitantdeclineinwages.Withrenewed labourproductivitygrowth,unit labour costshave been declining without interruption since 2013,first as a result of falling employment and since 2014undertheimpactofrisingeconomicactivity.
In 2015 the unit labour costs in manufacturing were already lower than before the crisis, but were still higher in the economy as a whole. In 2008–2009, astrongcontractioninforeigndemandledtoanabove-average decline in value added and, consequently,labour productivity in manufacturing. Real growthin unit labour costs was therefore higher, despite the
1In2008wagegrowthwasaconsequenceoftheadjustmentofwagesforhighpastinflationandproductivityandtheeliminationofwagedisparitiesinthepublicsector;in2010itwasunderpinnedbytheincreaseintheminimumwage.
Table:Unit labour costs in Slovenia and the EU, growth in %
Real annual growth rates, in % 2001–2008 2009 2010 2011 2012 2013 2014 2015*
Unit labour costs**
Slovenia -0.3 5.0 1.6 -1.9 0.6 -0.6 -2.1 -1.0
EU -0.5 3.2 -1.3 -1.0 0.5 -0.5 -0.2 -0.5
EMU -0.3 3.4 -1.4 -0.5 0.7 -0.1 0.2 -0.6
Unit labour costs** – Slovenia
Total -0.4 5.0 2.0 -1.8 0.9 0.0 -2.2 -1.1
Manufacturing -0.4 7.6 -0.8 -3.3 0.4 -2.3 -3.0 -3.6Source:SI-STATDataPortal–Economy,2015;EurostatPortalPage–EconomyandFinance,2015.Notes: *SURS, EUROSTAT estimates basedonquarterly data for 2015.**Employee compensationper employee in current prices dividedby thegross domestic product peremployeeincurrentprices;***Employeecompensationperemployeeincurrentpricesdividedbythevalueaddedperemployeeincurrentprices.
Figure:Real unit labour costs in Slovenia and EU Member States
Source:EurostatPortalPage–EconomyandFinance,2015.
-20
-15
-10
-5
0
5
10
15
20
Rom
ania
Lith
uania
Hun
gary
Ireland
Croa
tia
Portug
al
U.K
ingd
om
Latvia
Gre
ece
Cypr
us
Spain
Poland
Den
mark
EU
Malta
Esto
nia
Czec
hR.
Italy EA
Slov
enia
Belgium
Luxe
mbo
urg
Aus
tria
Ger
man
y
Swed
en
Fran
ce
Net
herla
nds
Slov
akia
Finlan
d
Bulgar
ia
Gro
wth
rate
,in%
2014 2014/2007
more modest growth of wages. In manufacturing,realunit labour costshadalready started todecline in2010andhad fallenmuch furtherby2015 than in theeconomyasawhole.Morespecifically,withareboundin foreign demand, labour productivity growth in themanufacturingsectorwashigher than in theeconomyasawholeduetoalargerincreaseinvalueaddedandasteeperdeclineinemployment.Growthincompensationperemployeewasalsohigher(partlyduetotheimpactoftheincreaseintheminimumwage)butlowerthanthegrowthoflabourproductivity.
The manufacturing sector improved its position relative to the EU in comparison with 2007, but the relative position of the economy was worse than before the crisis. Upto2010,SloveniahadbeenamongtheEUMemberStateswithabove-averagegrowth inrealunitlabour costs in manufacturing; since 2010, however,the country has been experiencing an above-averagedecline. In2015realunit labourcostswere2.6% lowerthanin2007(2.2%higherintheEU).Intheeconomyasawhole,realunitcostswere3.2%higherinthisperiod(0.9%).

113Development Report 2016Indicators of Slovenia’s development
roseslightlyin2014afterfouryearsofdecline.
The share of products with low value added2 in merchandise exports has recently stopped falling.Theirsignificance had been declining for a number of years,primarily owing to the falling share of labour-intensiveproducts;theshareoflow-technologyproductshasalsofallen since the start of the economic crisis. Exports ofproductswith lowvalueaddedhaveproved tobeveryvulnerable to competition from countries with lowerlabourcosts,withtheshareoftextileproducts,furniture,paper and paperboard exported having contracted,particularly since Slovenia’s accession to the EU. Since2010onwards,thedeclineinthesesectorshasalsobeenreflected in the deterioration in cost competitivenessduetothesubstantialstatutoryincreaseintheminimumwage.Therelativeshareofproductswithlowvalueadded,whichhasotherwisebeenrelativelystableinthelasttwoyears,has thereforebeengraduallyapproaching theEUaverage(in2014itwasstill3.5percentagepointshigherthantheEUaverage).
The share of resource-intensive products3 rose notably after 2009, mainly on the back of higher volumes of trade in primary products. Theincreasesinthesharesofelectricity and petroleum product exports were mainlyunderpinnedbyhighervolumesoftradeintheseproductgroups (re-exports). Owing to lower electricity exports,the share of resource-intensive products otherwisedeclinedslightlyin2014afterseveralyearsofgrowth,butremainedsignificant.
2.5 Structure of merchandise exports by factor intensity The changes in the structure of merchandise exports towards increasing the share of exports of high-technology goods have been less pronounced recently than at the beginning of the crisis. The shareof high-technology products increased to a greaterextent particularly in the first years of the crisis (2008and 2009), when the shares of other, less competitive,industries started to contract. Since 2009, the share ofhigh-technology products has also been constantlystrengthening owing to the growth in the absolutevalues of their exports. This was mainly underpinnedby growth in pharmaceutical exports, which had beenaboveaverageuntil2013beforeslowingnotablyin2014.1The share of high-technology products inmerchandiseexports therefore also fell slightly. Although this figurewasoneof thehighest recordeduntil thatpoint, itwasstill below the EU average (by 4.3 percentage points).Relativetothebeginningofthecrisis,thegapwiththeEUaveragehashalvedand,inrecentyears,thesignificanceof these products in the structure of our exports hasalsobeenabovetheaveragefornewEUMemberStates.Medium-technologyproductsotherwisestillaccountforthe largest share in the merchandise export structure.Significantlyboostedbyroadvehicleexports,thisfigure
1Thelowergrowthinthevalueofsaleswas,amidfurtherstronggrowthinvolumes,mainlyaconsequenceofadeclineintheexchangerateoftherouble.2Thelow-technologyandlabour-intensiveproductgroupsincludeproductswiththelowestvalueaddedperemployeesuchas:clothing,textileproducts,footwear,furniture,glassandglassproducts,ironsteelsheetsandshapes,andbase-metalmanufactures.3 The main groups of exported resource-intensive products in Slovenia’s merchandise exports are as follows: aluminium, mineralmanufactures,electriccurrent,roughandworkedwood,veneerandotherwoodmanufactures,andnon-alcoholicandalcoholicbeverages.
Table:Structure of merchandise exports by factor intensity*, Slovenia and the EU
2000 2005 2006 2007 2008 2009 2010 2011 2012 2013 2014
Resource-intensive
Slovenia 15.3 15.4 16.1 15.5 15.8 15.9 17.5 19.0 19.4 19.8 19.4
EU 18.2 18.0 19.4 19.2 20.4 19.6 20.7 22.4 23.2 23.1 22.2
EU-15 18.0 17.8 19.4 19.3 20.5 19.6 20.7 22.4 23.2 23.1 22.3
EU-13 21.1 19.6 19.5 18.9 19.8 19.8 21.0 22.3 23.3 22.9 21.7
Labour-intensive
Slovenia 21.6 17.0 14.2 12.6 11.7 11.6 11.0 10.8 10.1 9.6 9.6
EU 10.6 9.1 8.6 8.5 8.2 8.7 8.2 8.1 7.1 7.9 8.2
EU-15 10.1 8.6 8.2 8.1 7.9 8.4 7.9 7.8 6.6 7.6 7.9
EU-13 18.6 14.0 12.3 11.4 10.3 10.9 10.2 10.0 9.8 10.1 10.5
Low-technology
Slovenia 9.9 8.8 10.2 10.4 11.1 9.8 8.6 9.0 8.7 8.7 8.8
EU 6.9 7.0 7.5 8.0 8.2 7.0 7.0 7.2 6.5 6.6 6.7
EU-15 6.7 6.6 7.1 7.6 7.8 6.7 6.7 6.9 6.1 6.3 6.4
EU-13 10.7 10.7 10.9 11.2 11.2 9.2 9.1 9.6 9.2 9.1 8.9
Medium-technology
Slovenia 36.2 40.2 39.1 40.9 39.3 39.9 39.6 37.9 36.9 36.5 37.1
EU 29.8 30.1 29.9 30.7 29.9 28.4 28.6 29.8 28.9 29.2 30.1
EU-15 29.8 29.8 29.5 30.2 29.5 27.8 28.0 29.2 28.1 28.4 29.1
EU-13 29.6 32.9 33.9 35.1 33.8 33.4 33.0 33.7 33.9 34.9 36.1
High-technology
Slovenia 15.5 16.0 17.1 17.4 18.8 21.1 20.3 20.1 21.5 22.3 21.9
EU 28.7 27.6 27.7 25.8 25.2 27.6 27.2 26.1 26.6 25.7 26.2
EU-15 29.4 28.6 28.6 26.5 25.8 28.3 27.7 26.7 27.6 26.5 27.1
EU-13 18.0 18.1 19.1 19.5 20.5 22.7 23.0 21.5 20.6 20.1 20.0Source:HandbookofStatistics2007–2008(UnitedNations),2007;UnitedNationsCommodityTradeStatisticsDatabase,2014;calculationsbyIMAD.Notes: *The classification of products into individual groups is based on the UNmethodology (Trade and Development Report, 2002), which does not include all products.Consequently,thesumofthefiveproductgroupsdoesnotnecessarilyequal100.TheEU-15meansthe15countriesthatjoinedtheEUbeforetheenlargementin2004;theEU-13referstothe13countriesthatjoinedtheEUintheenlargementsafter2004.
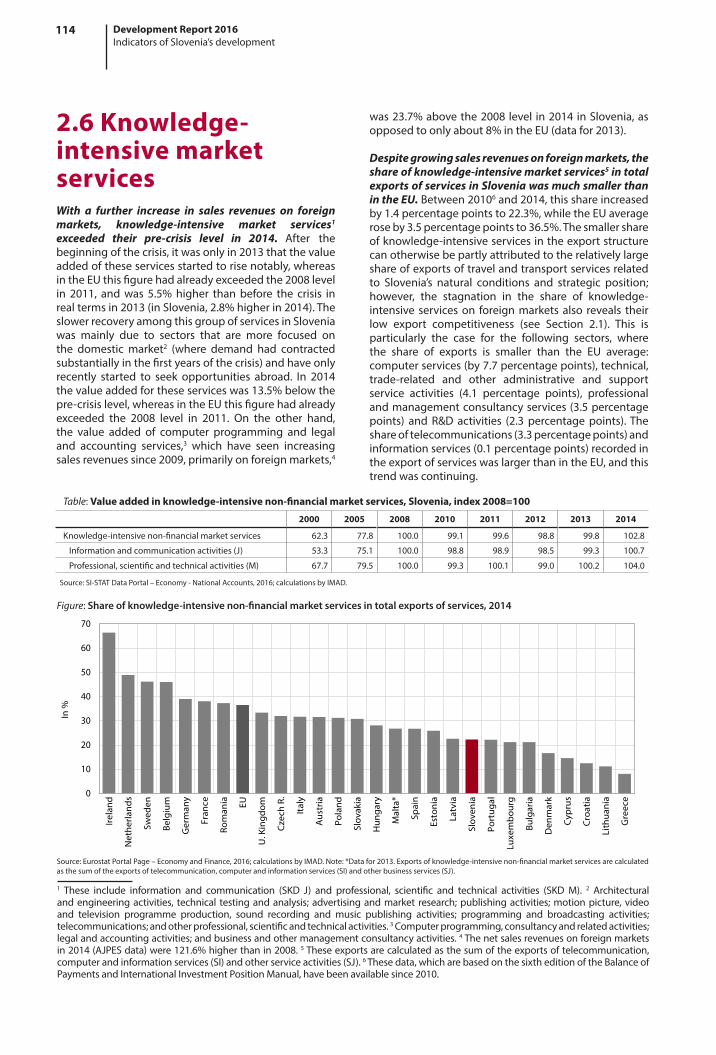
114 Development Report 2016Indicators of Slovenia’s development
was23.7%abovethe2008level in2014inSlovenia,asopposedtoonlyabout8%intheEU(datafor2013).
Despite growing sales revenues on foreign markets, the share of knowledge-intensive market services5 in total exports of services in Slovenia was much smaller than in the EU.Between20106and2014,thisshareincreasedby1.4percentagepointsto22.3%,whiletheEUaverageroseby3.5percentagepointsto36.5%.Thesmallershareofknowledge-intensiveservicesintheexportstructurecanotherwisebepartlyattributedtotherelativelylargeshareofexportsoftravelandtransportservicesrelatedto Slovenia’s natural conditions and strategic position;however, the stagnation in the share of knowledge-intensive serviceson foreignmarketsalso reveals theirlow export competitiveness (see Section 2.1). This isparticularly the case for the following sectors, wherethe share of exports is smaller than the EU average:computerservices(by7.7percentagepoints),technical,trade-related and other administrative and supportservice activities (4.1 percentage points), professionalandmanagementconsultancyservices(3.5percentagepoints) andR&Dactivities (2.3percentagepoints).Theshareoftelecommunications(3.3percentagepoints)andinformationservices(0.1percentagepoints)recordedintheexportofserviceswaslargerthanintheEU,andthistrendwascontinuing.
2.6 Knowledge-intensive market services With a further increase in sales revenues on foreign markets, knowledge-intensive market services1 exceeded their pre-crisis level in 2014. After thebeginningofthecrisis,itwasonlyin2013thatthevalueaddedoftheseservicesstartedtorisenotably,whereasintheEUthisfigurehadalreadyexceededthe2008levelin 2011, andwas 5.5%higher thanbefore the crisis inrealtermsin2013(inSlovenia,2.8%higherin2014).TheslowerrecoveryamongthisgroupofservicesinSloveniawas mainly due to sectors that are more focused onthe domestic market2 (where demand had contractedsubstantiallyinthefirstyearsofthecrisis)andhaveonlyrecently started to seek opportunities abroad. In 2014thevalueaddedfortheseserviceswas13.5%belowthepre-crisislevel,whereasintheEUthisfigurehadalreadyexceeded the 2008 level in 2011. On the other hand,the value added of computer programming and legaland accounting services,3 which have seen increasingsalesrevenuessince2009,primarilyonforeignmarkets,4
1 These include information and communication (SKD J) and professional, scientific and technical activities (SKDM). 2 Architecturalandengineeringactivities, technical testingandanalysis;advertisingandmarket research;publishingactivities;motionpicture,videoand television programme production, sound recording and music publishing activities; programming and broadcasting activities;telecommunications;andotherprofessional,scientificandtechnicalactivities.3Computerprogramming,consultancyandrelatedactivities;legalandaccountingactivities;andbusinessandothermanagementconsultancyactivities.4Thenetsalesrevenuesonforeignmarketsin2014(AJPESdata)were121.6%higherthanin2008.5Theseexportsarecalculatedasthesumoftheexportsoftelecommunication,computerandinformationservices(SI)andotherserviceactivities(SJ).6Thesedata,whicharebasedonthesixtheditionoftheBalanceofPaymentsandInternationalInvestmentPositionManual,havebeenavailablesince2010.
Table:Value added in knowledge-intensive non-financial market services, Slovenia, index 2008=100
2000 2005 2008 2010 2011 2012 2013 2014
Knowledge-intensivenon-financialmarketservices 62.3 77.8 100.0 99.1 99.6 98.8 99.8 102.8
Informationandcommunicationactivities(J) 53.3 75.1 100.0 98.8 98.9 98.5 99.3 100.7
Professional,scientificandtechnicalactivities(M) 67.7 79.5 100.0 99.3 100.1 99.0 100.2 104.0
Source:SI-STATDataPortal–Economy-NationalAccounts,2016;calculationsbyIMAD.
Figure:Share of knowledge-intensive non-financial market services in total exports of services, 2014
Source:EurostatPortalPage–EconomyandFinance,2016;calculationsbyIMAD.Note:*Datafor2013.Exportsofknowledge-intensivenon-financialmarketservicesarecalculatedasthesumoftheexportsoftelecommunication,computerandinformationservices(SI)andotherbusinessservices(SJ).
0
10
20
30
40
50
60
70
Ireland
Net
herla
nds
Swed
en
Belgium
Ger
man
y
Fran
ce
Rom
ania EU
U.K
ingd
om
Czec
hR.
Italy
Aus
tria
Poland
Slov
akia
Hun
gary
Malta
*
Spain
Esto
nia
Latvia
Slov
enia
Portug
al
Luxe
mbo
urg
Bulgar
ia
Den
mark
Cypr
us
Croa
tia
Lith
uania
Gre
ece
In%

115Development Report 2016Indicators of Slovenia’s development
at the end of the previous decade, peaking in 2012(over 55,000 or 5.9% of customers), before decreasingslightlyby2014 (32,000or3.5%of customers).On theelectricity generation market, the competition rate islow (in 2014 the Herfindahl-Hirschman Index (HHI), aconcentration index, was 4,569) but comparable withthe EU.4 Competition on the retail market is stronger.In the period from the deregulation of the electricitymarket up to 2014, the HHI for electricity supply tothe consumers on the distribution network droppedfrom2,032to1,773.Theconcentrationofthesupplierschanged to an even greater extent, with the share ofthe three principal providers falling from 70% in 2007to justabove50%in2014. Inthefirsthalfof2015, theretail price of electricity for households and industry,excludingtaxes,wasaround20%belowtheEUaverage.Onthenatural gas market,thearrivalofanewproviderled to sharp price falls in 2012; in the first half of lastyear,thegasprice(excludingtaxes)forhouseholdsandindustrialconsumerswas12%and4%lowerthantheEUaveragerespectively.Afteralmostnoinstancesrecordedof providers being switched in previous years, theswitchingratesurpassed11,000or8.6%ofcustomersin2012,beforefallingto3.6%by2014.
2.7 Network industriesIn electronic communications, competition is fairly strong in terms of broadband internet access, but competition in mobile telephony still lags behind the EU average. Fixed telephony (with the exceptionof the growing share of internet (VoIP) telephony)has been losing market share in recent years,1 and isincreasinglybeingreplacedbymobile telephony.Marketconcentration in this segment is relatively high, andapproaching the EU average only slowly. Broadband internetaccess isthemostcompetitivemarket,withthemarketshareoftheleadingprovideralreadybelowtheEUaverage.Accordingtothemostrecentdataavailable,2thepricesoffixedandmobiletelephonyservicesweregenerally lower in Slovenia than in the EU, but theydroppedtoalesserextentinSloveniathanintherestoftheEUforthewholeperiodof2010–2015.3
Regarding the supply of electricity and gas, competition is spurred by numerous provider switches.Afterthederegulationofthemarketin2007,thenumberof electricity supply switches increased markedly only
1Consequently,therearefewerandfewerinternationalcomparisonsofthemarketsharesofthemainprovidersoftheseservices.Themostrecentwasconductedin2012,whentheprincipalprovideroffixedtelephonyserviceshada65%marketshareinSloveniaandabove50%oftheaverageEUmarketshare.2ReportonTelecomsPriceDevelopments1998–2010(EC),2010.Packages(baskets)offixedandmobiletelephonyservicesarecompared.3ThedynamicsofpricegrowthareindicatedbytheHICPindicesfortelephonyserviceprices.4AccordingtoEurostat,itwas57.1%inSloveniain2012,whilethearithmeticalmeanofthesharesofEUcountries(excludingBulgariaandtheNetherlands)was55.4%.
Figure:Discrepancies in energy prices between Slovenia and the EU average
Source:Eurostat;calculationsbyIMAD.
-30
-20
-10
0
10
20
30
40
50
60
Secondhalf2007
Firsthalf2008
Secondhalf2008
Firsthalf2009
Secondhalf2009
Firsthalf2010
Secondhalf2010
Firsthalf2011
Secondhalf2011
Firsthalf2012
Secondhalf2012
Firsthalf2013
Secondhalf2013
Firsthalf2014
Secondhalf2014
Firsthalf2015
In%
Gasforhouseholds(20-200GJ) Gasforindustry(10-100TJ)Electricityforhouseholds(2.5-5.0MWh) Electricityforindustry(0.5-2.0GWh)
Table:Market share* of the largest electronic communications providers, in %
2009 2010 2011 2012 2013 2014
Mobiletelephony
Slovenia 56 55 53 50 49 48
EU-27 38 38 37 36 35 35
EU-3** 33 33 32 33 32 31
Broadbandinternet
Slovenia 46 43 42 39 36 35
EU-27 45 44 43 42 42 41
EU-3** 29 29 30 27 27 26
Source:DigitalAgendaScoreboardKeyIndicators(EuropeanCommission),2015;InformationSocietyStatistics(Eurostat),2015.Notes:*NumberofactiveSIMcards(inOctober)inmobiletelephony;numberofconnections(endofyear)inbroadbandinternet.**AverageofthethreeMemberStateswiththesmallestshares.

116 Development Report 2016Indicators of Slovenia’s development
2.8 Foreign direct investmentAfter very low inward FDI until 2013, inflows in 2014 and 2015 indicate a significant increase, while outward FDI remains modest. After a modest improvement in2010–2013,thestockof inwardFDI1rosemorenotablyinSloveniain2014forthefirsttimeinalongperiod(by13.9%).Outward FDI stock, having been decreasing in2010–2013,roseslightlyin2014(by2.6%),butwasstill13.5%belowits2009peak.TheequitycapitalinflowsofinwardFDIrosenotablyin2014and2015:in2014theyamounted to EUR 1,447.0 million and in the first tenmonthsof2015toEUR1,184.8million,comparedwithonlyEUR1,354.6millionreachedintheentirepreviousfive-yearperiod(2008–2012).Thisisprimarilyduetotherenewal of the privatisation process and the generallyhigher sales of equity stakes in Slovenian companies.The SPIRIT survey conducted among companies with
1IncalculatingthestockofFDIaccordingtothedirectionalprinciple,theBankofSloveniamovedfromtheoldBPM5methodologytothenewBPM6methodologyin2014.AccordingtotheBPM6methodology,thestocksdiffersignificantlyfromthosecalculatedaccordingtotheBPM5methodology,owingtochangesinthecategoriestakenintoaccountinthecalculation.InthecaseofSlovenia,thisholdstrueparticularlyforinwardFDI:thestockofinwardFDIattheendof2013amountedtoEUR10,728.6millionaccordingtothepreviousBPM5methodology,comparedwithonlyEUR8,926.0millionaccordingtothenewBPM6methodology;thestockofoutwardFDItotalledEUR5,121.3millionandEUR5,171.6millionfortheBPM5andBPM6methodologies,respectively(formore,seeBankofSlovenia.2014.DirectInvestment2013,pp.13–17).
Table:Flows and stocks of inward and outward FDI* in Slovenia, 2000–2014
In EUR m 2000 2005 2008 2009 2010 2011 2012 2013 2014 2015
INWARD FDI
Year-endstock** 2,567.4 5,981.0 8,598.0 7,827.8 7,982.9 8,880.1 9,248.6 8,896.5 10,129.9 N/A
Inflowofequitycapital 96.3 270.7 380.3 127.1 449.9 63.2 334.1 441.7 1,447.0 1,184.8(Jan-Oct)
Stockasa%ofGDP 11.9 20.5 22.7 21.6 22.0 24.1 25.7 24.8 27.2 N/A
OUTWARD FDI
Year-endstock** 829.3 2,777.0 6,085.1 6,143.3 6,097.4 6,048.8 5,709.9 5,178.5 5,314.9 N/A
Inflowofequitycapital 54.7 456.0 720.8 491.4 181.0 240.7 383.9 427.4 135.8 129.3(Jan-Oct)
Stockasa%ofGDP 3.8 9.5 16.0 17.0 16.8 16.4 15.9 14.4 14.2 N/A
Source:BoS.Notes:*Companiesinwhichaforeigninvestorhasa10%orhigherequityshare.**AccordingtothedirectionofinvestmentandBPM6methodology.
Figure:Stocks of inward and outward FDI, as a % of GDP
Source:UNCTAD,WorldInvestmentReport,2014.Note:ThefigureshowstheEUcountries,excludingMaltaandLuxembourg,whichhaveverylargeFDIstocksincomparisontoothercountries.
300
200
100
0
100
200
300
Cypr
us
Ireland
Belgium
Bulgar
ia
Neth
erland
s
Esto
nia
Hung
ary
Czec
hR.
U.Kingd
om
Swed
en
Slov
akia
Croa
tia
Spain
Finlan
d
Portu
gal
Latvia
Poland
Austria
Rom
ania
Lith
uania
Slov
enia
Fran
ce
Denm
ark
Germ
any
Italy
Gree
ce
Asa%
ofG
DP
InwardFDI2008 OutwardFDI2008
InwardFDI2014 OutwardFDI2014
foreign capital in Slovenia indicates increased sales(58% of companies surveyed) and employment (37%)for a significantportionof these companies,with32%of companies also planning to expand their activitiesin 2016.Outward FDI recordedequity capital outflowsfrom Slovenia in 2015 that were at approximately thesame levelas in2014,which issignificantly lower thanin2013.
Slovenia remains among the EU countries with the lowest inward FDI stock as a share of GDP. Despite aconsiderableincreasein2014(to27.2%ofGDP),SloveniaremainsamongtheEUcountrieswiththeloweststockofinwardFDI,andthesmallestincreaseininwardFDIstockasashareofGDPoverthelongterm.AsmallershareofinwardFDI relative toGDP is recordedonlybyGreece,Italy,Germany,DenmarkandFrance.IntermsofoutwardFDI relative toGDP,Slovenia–among thenewCentralEuropeanEUMemberStates–lagsbehindonlyHungaryandEstonia.

117Development Report 2016Indicators of Slovenia’s development
Newly established enterprises have accounted for only a modest share of total employment in recent years.Businessdemography statistics showslowergrowth inthenumberofactiveenterprises inthefirstyearsafterthe beginning of the crisis, but that this acceleratedin 2013, the year for which the most recent data areavailable.Thebulkofimprovementin2013arosefromasignificantincreaseinthenumberofnewlyestablishedenterprises(withoutapredecessor),ashadalreadybeenindicated by GEM data on early-stage entrepreneurialactivity, which peaked in 2013.Moreover, the numberof deaths of enterprises without a successor declinednoticeably in 2013 for thefirst time since theonsetofthecrisis.4Entrepreneurialdynamicswereattheirmostbeneficialinknowledge-intensiveservices(births2013:14.8%;deaths2013:6.7%),wherethenumberofnewlyestablishedenterprises roseby two-fifths,whereas thenumberofdeathsdeclinedbyone-tenth.However,thenumberofemployees innewlyestablishedenterprisesaccounted for only a modest share of all employedpersons (1.4% in 2013, slightly more in knowledge-intensive services). According to the GEM survey,one of the reasons for thismay be the large share ofnew enterprises established out of necessity, in alllikelihoodasa resultofunemployedpeoplebecomingself-employed. The share of high-growth enterprisesis therefore among the smallest in the EU, althoughSloveniahas a relativelyhighenterprisebirth rate andlowenterprisedeathratebyinternationalstandards.
2.9 Entrepreneurial activityEarly-stage entrepreneurial activity dropped for the second year in succession, falling below the level achieved just before the crisis. AccordingtodatafromtheGlobalEntrepreneurshipMonitor(GEM),therateoftotal early-stage entrepreneurial activity (TEA-index)1declined further in 20152 after peaking in 2013. Thiswas largely due to a decline in the share of nascententrepreneurs (entrepreneurs running businessesfor less than three months), with the share of newentrepreneurs(thosewhohavebeeninbusinessforlessthanthreeandahalfyears)remainingatthesamelevelfor the fourth consecutive year in 2015. Opportunity-driven early-stage entrepreneurial activity has beensteadily declining since 2012, thereby diverging fromthe level reached before the beginning of the crisis.Necessity-driven entrepreneurial activity remainsrelatively high, but dropped slightly in 2015. In 2015early-stage entrepreneurial activity also declined inthe EU,3 but is still higher than in 2008 (5.3%).Amid aconcomitantcontractioninestablishedbusinesses,totalentrepreneurialactivityinSloveniaalsodroppedfurtherin2015,fallingbelowthepre-crisislevel.
1ForamethodologicalexplanationoftheGEMindicatorsthatmeasureentrepreneurialactivity,seethenotesbelowthetable.2Thedataarefromthesurveycarriedoutinthefirsthalfoftheyear.321MemberStatesparticipatedinthesurvey(19ofwhichparticipatedinthesurveyin2014).4Thedatafor2013areprovisional.
Table:Selected GEM indicators of entrepreneurial activity, Slovenia, as a % of the population (aged 18–64)
2002 2005 2008 2009 2010 2011 2012 2013 2014 2015 EU 2015
TEA-index* 4.6 4.4 6.4 5.4 4.7 3.7 5.4 6.5 6.3 5.9 6.6
Establishedbusinessowners** - 6.3 5.6 5.7 4.9 4.8 5.8 5.7 4.8 4.2 6.0
Totalentrepreneurialactivity*** - 10.1 11.8 10.8 9.5 8.4 11.2 11.9 11.0 10.1 12.3
Sources:Reberniketal.,2003;Reberniketal.,2006;Reberniketal.,2009;Reberniketal.,2010;Reberniketal.,2011,Reberniketal.,2012;Reberniketal.,2013,Reberniketal.,2014,Reberniketal.,2015,Kelleyetal.,2016.Notes:*TheTEA-indexistherateoftotalearly-stageentrepreneurialactivitymeasuringtheshareofthepopulationengaginginentrepreneurship.Itincludesindividualswhohavejustsetupanewbusinessorareengaginginnewbusinessactivities,includingself-employment.Italsoincludesindividualswhoareowners/managersofabusinessthatislessthan42monthsold.**Theshareofthepopulationwhoownormanageabusinessthathasbeenoperatingformorethan42months.***TotalentrepreneurialactivityincludestheTEAindexandtheshareofestablishedbusinesses.
Figure:Share of high-growth enterprises in the total business economy (NACE activities B–N)*, 2013
Source:EurostatPortalPage–Industry,tradeandservices–Structuralbusinessstatistics–Businessdemography,2016.Note:*Enterprisesthathadatleast10%averageannualisedgrowthinemployeesperyearoverathree-yearperiodand10ormoreemployeesinthefirstyearofthethree-yearperiod.Theshareiscalculatedforenterpriseswithatleast10employees.
0
2
4
6
8
10
12
14
16
Swed
en
Latvia
Lith
uania
Finlan
d
U.K
ingd
om
Net
herla
nds
Hun
gary
Bulgar
ia
Ireland
Malta
Czec
hR.
Slov
akia
Luxe
mbo
urg
Esto
nia
Croa
tia
Den
mark
Belgium
Fran
ce
Slov
enia
Poland
Spain
Portug
al
Italy
Austria
Rom
ania
Cypr
us
In%

118 Development Report 2016Indicators of Slovenia’s development
38.6%),which ishigher than theEurope2020Strategytarget of 40%. Its rapid growth is the result of severalyears of highparticipationof youngpeople in tertiaryeducation. Cedefop2 projects the share of tertiaryeducatedpeople in thisagegroup to rise toover50%by2020andto59%by2025.3Theshareofthetertiaryeducatedpeopleinthe35–44agegroupisalsohigherthantheEUaverage. In termsofmeetingthebusinesssector’srequirements,theimprovementtotheeducationstructure of the population is a positive development;according to Cedefop forecasts for 2015–2025, mostjob opportunities will be for tertiary educated peopleandtheirshare in total jobopportunities inSlovenia isexpectedtobehigherthantheEUaverage.Nevertheless,thekeyfactorintermsoffillingjobvacanciesthatrequiretertiaryeducationisthestructureofgraduatesbyfieldofstudy,whichisnotsufficientlymatchedtothebusinesssector’sneeds.
2.10 Share of the population with tertiary educationThe share of adults with tertiary education is increasing, having kept pace with the EU average since 2014.This trend is a consequence of a longperiod ofhighparticipationofyoungpeopleintertiaryeducation,and the structural effect of the transition of younger,more educated generations into higher age groups.The share of womenwith tertiary education is higherthan the corresponding share ofmen1 and above theEU average, and the gap between the two groups iswidening.With the number of graduates falling since2013 owing to a decline in student enrolment due tothesmallergenerationsofyoungpeople,growthintheshareoftertiaryeducatedpeopleisexpectedtoslowintheyearstocome.
The share of tertiary educated people, which is generally above the EU average, is rising fastest in younger age groups. The only exception is the 25–29agegroup,wheretheshareoftertiaryeducatedpeoplelagsbehindtheEUaverageduetolowstudyefficiency(protracted studies). More favourable developmentsarerecordedforthe30–34agegroup,wheretheshareoftertiaryeducatedpeoplestoodat43.6%in2015(EU
Table:Share of the population aged 25–64 with tertiary education, 2nd quarter, in %
2002 2005 2008 2009 2010 2011 2012 2013 2014 2015
Slovenia 14.8 20.0 21.9 22.5 23.7 25.5 26.1 27.8 29.2 30.2
EU 19.9 22.3 24.1 25.0 25.8 26.6 27.5 28.5 29.1 30.0
Source:EurostatPortalpage—PopulationandSocialConditions–Educationandtraining,2015.
Figure:Share of the population aged 30–34 with tertiary education, 2nd quarter, in %
0
10
20
30
40
50
60
70
Lith
uania
Cypr
us
Ireland
Swed
en
Luxe
mbo
urg
U.K
ingd
om
Den
mark
Net
herla
nds
Esto
nia
Fran
ce
Finlan
d
Poland
Slov
enia
Belgium
Spain
Latvia
Gre
ece
Aus
tria EU
Hun
gary
Bulgar
ia
Ger
man
y
Croa
tia
Portug
al
Czec
hR.
Slov
akia
Malta
Rom
ania
Italy
In%
2015 EU2020target
Source:EurostatPortalPage-PopulationandSocialconditions,2016.
1In2015,thisfigurestoodat36.3%forwomen(EU:31.6%)andat24.6%formen(EU:28.3%).2EuropeanCentrefortheDevelopmentofVocationalTraining.3Slovenia:Skillsforecastsupto2025,2015.

119Development Report 2016Indicators of Slovenia’s development
oneducation stoodat 0.67%ofGDP in2014,which isclose to the long-termaverage and, according todatafor2012,higher thantheEU-21average.However, thisdoesnotholdtrueforexpenditureontertiaryeducation,which is the same as in the EU-21 andwas below thelong-termaveragein2014.
After increasing for several years, the expenditure (both public and private) per participant in education declined in 2012 but remained above the long-term average. Relative to the EU-21 average,3 it remainedhigherforpre-primaryandprimarylevelsofeducation.Expenditure on upper-secondary and tertiary levelsremainedsignificantlylower,whichisattributabletothehighparticipationofyoungpeopleineducation.In2012,expenditureoneducationperparticipantdeclinedatalllevelsofeducation(particularlyupper-secondary),withtheexceptionof tertiaryeducationwhereexpenditurealsoroseinthelongerterm.Thisisrelatedtoadeclineinenrolmentsince2010owingtosmallergenerationsofyoungpeopleandthefactthatthelevelofpublicfundsinthehighereducationfundingsystemisnotlinkedtothenumberofstudentsenrolled.
2.11 Education expenditurePublic and private expenditure on education (as a % of GDP) is similar to the international average. In2014publicexpenditure1accounted for4.99%2ofGDPand was significantly lower than Slovenia’s long-termaverage.Ithasbeendecliningsince2012,largelyowingtotheeffectsoffiscalconsolidationmeasures.Adeclinewas recorded in all levels of education except for pre-primary education. Expenditure on tertiary educationdropped the most, owing to a decline in transfers tostudents/households and expenditure on educationalinstitutions. In comparisonwith the long-year averagebefore 2012, public expenditure was thus lower at alllevelsexceptforpre-primaryeducation.Byinternationalcomparison, Sloveniahashigherpublicexpenditureattheprimary level (whichincludesthefirstsixgradesofelementary school in Slovenia), with expenditures atupper-secondary and tertiary levels comparable withtheEU-21average(OECDcountries).Privateexpenditure
1Publicexpendituredoesnotincludetransfersforstudents/households.2Excludingthefirstagegroupofthepre-primarylevelofeducation.AccordingtotheInternationalStandardClassificationofEducation(ISCED)2011,whichalsoincludesthisgroup,publicspendingoneducationtotalled5.34%ofGDPin2014.3In2012(thelatestinternationaldataavailable),ittotalledPPSUSD9,031inSlovenia(EU-21:PPSUSD10,361).
Figure:Expenditure on educational institutions per participant at the tertiary level of education, in PPS USD, 2012
Source:EducationataGlance2015,2015.
Table:Total public expenditure on education as a share of GDP, in %
2000 2005 2008 2009 2010 2011 2012 2013 2014
All levels of education
Slovenia 5.8 5.7 5.2 5.7 5.7 5.7 5.3 5.1 5.0
OECDaverage 5.2 5.3 5.4 5.8 5.7 5.6 5.3 N/A N/A
EU-21average* 5.1 5.4 5.3 5.8 5.8 5.6 5.2 N/A N/A
Tertiary education
Slovenia 1.3 1.3 1.2 1.4 1.4 1.4 1.2 1.1 1.1
POECDaverage 1.2 1.3 1.3 1.4 1.4 1.4 1.3 N/A N/A
EU-21average* N/A 1.3 1.3 1.4 1.4 1.4 1.2 N/A N/A
Source:Source:EducationataGlance(variousissues)(2003,2014,2015),SURS,calculationsbyIMAD,2016.Note:*TheEUMemberStatesthatareOECDmembers.
0
5,000
10,000
15,000
20,000
25,000
30,000
35,000
Luxe
mbo
urg
Unite
dSt
ates
Switz
erland
U.K
ingd
om
Swed
en
Cana
da
Nor
way
Net
herla
nds
Finlan
d
Ger
man
y
Japo
n
Aus
tralia
Aus
tria
Belgium
Fran
ce
OEC
D
EU-2
1
Ireland
N.Z
ealand
Spain
Israel
Slov
enia
Czec
hR.
Italy
S.Kor
ea
Poland
Icelan
d
Portug
al
Slov
akia
Hun
gary
Esto
nia
Mex
ico
Chile
Turkey
InE
URPP
S
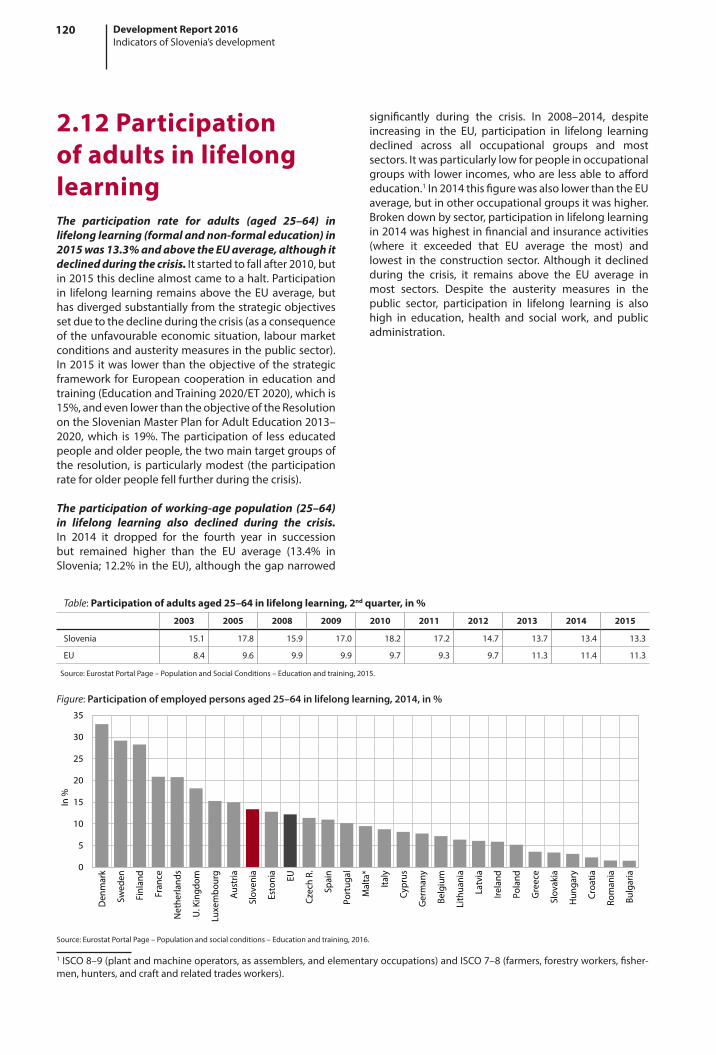
120 Development Report 2016Indicators of Slovenia’s development
significantly during the crisis. In 2008–2014, despiteincreasing in the EU, participation in lifelong learningdeclined across all occupational groups and mostsectors.Itwasparticularlylowforpeopleinoccupationalgroupswithlower incomes,whoarelessabletoaffordeducation.1In2014thisfigurewasalsolowerthantheEUaverage,butinotheroccupationalgroupsitwashigher.Brokendownbysector,participationinlifelonglearningin2014washighestinfinancialandinsuranceactivities(where it exceeded that EU average the most) andlowest in theconstruction sector.Although itdeclinedduring the crisis, it remains above the EU average inmost sectors. Despite the austerity measures in thepublic sector, participation in lifelong learning is alsohigh in education, health and social work, and publicadministration.
2.12 Participation of adults in lifelong learningThe participation rate for adults (aged 25–64) in lifelong learning (formal and non-formal education) in 2015 was 13.3% and above the EU average, although it declined during the crisis. Itstartedtofallafter2010,butin2015thisdeclinealmostcametoahalt.Participationin lifelong learning remainsabove theEUaverage,buthasdivergedsubstantiallyfromthestrategicobjectivessetduetothedeclineduringthecrisis(asaconsequenceof theunfavourableeconomicsituation, labourmarketconditionsandausteritymeasuresinthepublicsector).In2015itwaslowerthantheobjectiveofthestrategicframework forEuropeancooperation ineducationandtraining(EducationandTraining2020/ET2020),whichis15%,andevenlowerthantheobjectiveoftheResolutionontheSlovenianMasterPlanforAdultEducation2013–2020,which is 19%.Theparticipationof less educatedpeopleandolderpeople,thetwomaintargetgroupsofthe resolution, isparticularlymodest (theparticipationrateforolderpeoplefellfurtherduringthecrisis).
The participation of working-age population (25–64) in lifelong learning also declined during the crisis. In 2014 it dropped for the fourth year in successionbut remained higher than the EU average (13.4% inSlovenia;12.2%intheEU),althoughthegapnarrowed
1ISCO8–9(plantandmachineoperators,asassemblers,andelementaryoccupations)andISCO7–8(farmers,forestryworkers,fisher-men,hunters,andcraftandrelatedtradesworkers).
Table:Participation of adults aged 25–64 in lifelong learning, 2nd quarter, in %
2003 2005 2008 2009 2010 2011 2012 2013 2014 2015
Slovenia 15.1 17.8 15.9 17.0 18.2 17.2 14.7 13.7 13.4 13.3
EU 8.4 9.6 9.9 9.9 9.7 9.3 9.7 11.3 11.4 11.3
Source:EurostatPortalPage–PopulationandSocialConditions–Educationandtraining,2015.
Figure:Participation of employed persons aged 25–64 in lifelong learning, 2014, in %
Source:EurostatPortalPage–Populationandsocialconditions–Educationandtraining,2016.
0
5
10
15
20
25
30
35
Den
mark
Swed
en
Finlan
d
Fran
ce
Net
herla
nds
U.K
ingd
om
Luxe
mbo
urg
Austria
Slov
enia
Esto
nia
EU
Czec
hR.
Spain
Portug
al
Malta
*
Italy
Cypr
us
Ger
man
y
Belgium
Lith
uania
Latvia
Ireland
Poland
Gre
ece
Slov
akia
Hun
gary
Croa
tia
Rom
ania
Bulgar
ia
In%

121Development Report 2016Indicators of Slovenia’s development
atenthofallrelief.In2014thebusinesssectorincreasedR&D investmentby1.8% in real terms and its shareoftotalR&Dfundingto68.4%,whichissignificantlyabovetheEUaverage(2013:55.0%).Theshareofresearchers3in the business sector is also rising along with R&Dinvestment. In 2014 it rose to 54.1%,havingexceededtheEUaverage(48.8%)since2010.TheR&Dexpenditureof the public sector (the government and the highereducation sector) has been shrinking since 2012, andin2014 thisfigurewasnominally thesameas in2008.FundsfromabroadremainanimportantsourceofR&DfundinginSlovenia,buttheydeclinedforthefirsttimeinrealtermsinthe2009–2014perioduponthecompletionof projects from the previous financial perspective. In2013themajorityofforeignfundingforSlovenianR&Dcame from investment by the European Commissionandthebusinesssectorabroad.
2.13 Gross domestic expenditure on research and development After a long period of increases, gross domestic expenditure on R&D (GERD) declined in 2014, reaching 2.39% of GDP; this was higher than the EU average, which is stagnating. At−5.0%, the real growth rateofGERD was negative for the second consecutive year.In the 2009–2014 period, R&D investment rose in realterms, by 25.0%,whichwas significantlymore than intheEUasawhole.Thiswasmainlyduetothebusinesssector,whichincreasedR&Dinvestmentby47.4%inrealterms,andpartlyduetothehighertaxrelief.1In2014thetotalamountofR&DtaxreliefclaimedstoodatEUR228.6million;in2009–2014ittotalledEUR855.6million,almosta third of which was claimed by the pharmaceuticalindustry.In2012–2014around10%ofbeneficiariesfromlargecompanies2claimedaroundtwo-thirdsofthetotalamount of R&D tax relief, whereas around half of thebeneficiariesweremicrocompanies,whichclaimedonly
1ThetaxreliefonR&Dinvestment(20%)wasintroducedin2006.In2010thiswasraisedto40%andin2012to100%.2IncompliancewithArticle55oftheCompaniesAct(ZGD),companiesareclassifiedintosizeclassesbasedonanytwoofthefollowingcriteria:(i)theaveragenumberofemployeesinthefinancialyear;(ii)netrevenuesfromsales;and(iii)thevalueofassetsattheendofthefinancialyear.Accordingtothefirstcriterion,theaveragenumberofemployeesinmicrocompaniesislowerthan10;forlargecompanies,theaveragenumberofemployeesis250plus.3Expressedonafull-timeequivalentbasis.
Figure:R&D expenditure by sector, Slovenia
Source:SURS2015.
0
10
20
30
40
50
60
70
80
2008 2009 2010 2011 2012 2013 2014
Asa
%oft
otal
fund
ing
Businesssector Governmentsector Abroad
Table:Gross domestic expenditure on R&D, as a % of GDP
2000 2005 2007 2008 2009 2010 2011 2012 2013 2014
Slovenia 1.36 1.41 1.42 1.63* 1.82 2.06 2.42* 2.58 2.60 2.39
EU 1.79 1.76 1.78 1.85 1.94 1.93 1.97 2.01 2.03 2.03
Source:EurostatPortalPage–ScienceandTechnology–ResearchandDevelopment,2015;SURS,2015.Notes:DataforEU-28areEurostatestimates.*Thebreakinthetimeseriesin2008and2011isduetothehighernumberofreportingunitsinthebusinesssector.In2011thischangecontributedtoanincreaseinGERDofaround0.21%ofGDP(seeDevelopmentReport2013,p.132).

122 Development Report 2016Indicators of Slovenia’s development
encouragingtheparticipationofwomen,astheshareofwomenenrolledinscienceandtechnologyprogrammesinthe2014/15academicyearwasonly30%.
The share of doctors of science and technology is also significant in Slovenia. This figure has been abovethe EU average for the entire period. This has partlybeen attributable to government incentives (YoungResearchers,YoungResearchersintheEconomy),whichare mainly focused on science and technology (theshareofexpenditureonthisfieldhasaccountedforover60% of total expenditure on young researchers since2006;in2014,ittotalled64.5%).In2008–2014thetotalnumberofscienceandtechnologygraduatesrosefrom199 to1,882. In2014 thenumberof studentsenrolledin doctoral studies declined, as was the case in otherfields,whichcanbeattributedtocutsinpublicfundsforyoungresearchers,theexpiryoftheinnovativeschemefor co-financingdoctoral studiesandpoorerprospectsfor employment since the beginning of the crisis,particularlyaftertheintroductionofausteritymeasuresinthepublicsectorin2012.
2.14 Science and technology graduatesDespite a decline in the annual number of science and technology graduates, this figure is still higher than at the onset of the crisis; their share is also higher than the EU average. In 2014 the number of science andtechnologygraduatesdroppedforthesecondsuccessiveyearbecauseofdemographicfactors(thefallingnumberof young people available for enrolment in tertiaryeducation).Althoughtheirshareofthisdemographicisnolongergrowing,at26.1%itwasstillsignificantlyhigherthanin2008.Themovementsofthenumberofscienceand technology graduates per thousand populationaged20–29werealsomorefavourableduringthecrisis.These movements are a consequence of programmesaimed at the popularisation of these fields of studyamong young people; however in the past few yearstheyhavenolongerbeenabletocoverthedemographicdeficit. Given the declining generations available forenrolment in tertiary education, unfavourable trendscanalsobeexpected in thesefields in the future.Thiscould lead to a gap in the supply of graduates,whichin turncouldalsobeexacerbatedby tertiaryeducatedyoung people moving abroad. The developmentsin sponsorship scholarships are also unfavourable.1The potential for improving enrolment in scienceand technology programmes involves strengtheningcareer counselling for youngpeople and, in particular,
1In2014theshareoffull-timestudentsreceivingsponsorshipscholarshipstotalled5.8%(2008:10.8%).
Figure:Share of science and technology graduates in the total number of tertiary education graduates, 2013
Source:EurostatPortalPage-PopulationandSocialConditions,SI-STATDataPortal–Demographyandsocialstatistics–Education,2016.
0
5
10
15
20
25
30
35
40
Ger
man
y
Gre
ece
Aus
tria
Finlan
d
Slov
enia
Portug
al
Swed
en
Rom
ania
U.K
ingd
om
Spain
Esto
nia
Fran
ce
Italy
Malta
Czec
hR.
Ireland
Croa
tia
Lith
uania
EU
Slov
akia
Den
mark
Bulgar
ia
Cypr
us
Latvia
Belgium
Hun
gary
Luxe
mbo
urg
Net
herla
nds
In%
2013 Slovenia2014
Table:Share of doctors of science in technology in the total number of doctors of science, cumulatively*, in %
2003 2005 2008 2009 2010 2011 2012 2013 2014
Slovenia 47.7 48.9 47.5 47.7 48.5 47.4 47.1 48.1 48.6
EU 41.7 41.3 41.5 41.6 41.8 42.0 42.3 42.6 N/A
Source:EurostatPortalPage–PopulationandSocialConditions–Educationandtraining,2016;SI-STATDataPortal–Demographyandsocialstatistics–Education,calculationsbyIMAD.Note:*Thereferenceyearis2003,theyearsincedatafortheEUhavebeenavailable.
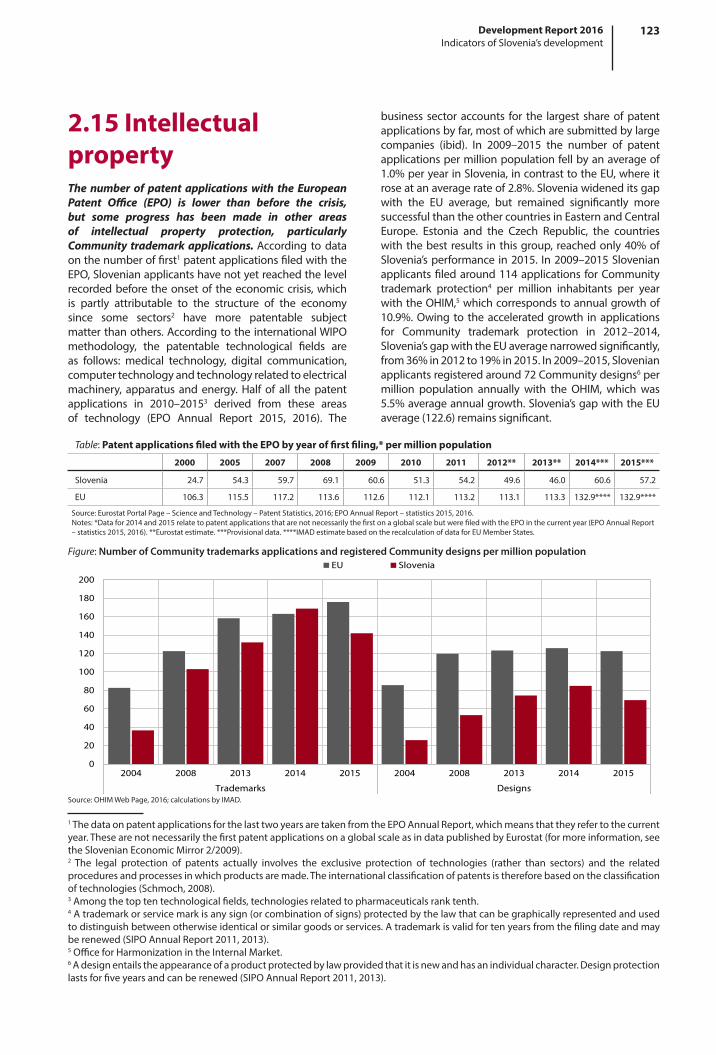
123Development Report 2016Indicators of Slovenia’s development
business sector accounts for the largest shareofpatentapplicationsbyfar,mostofwhicharesubmittedbylargecompanies (ibid). In 2009–2015 the number of patentapplicationspermillionpopulationfellbyanaverageof1.0%peryearinSlovenia,incontrasttotheEU,whereitroseatanaveragerateof2.8%.Sloveniawideneditsgapwith the EU average, but remained significantly moresuccessfulthantheothercountriesinEasternandCentralEurope. Estonia and the Czech Republic, the countrieswith thebest results in thisgroup, reachedonly40%ofSlovenia’sperformance in2015. In2009–2015Slovenianapplicantsfiledaround114applications forCommunitytrademark protection4 per million inhabitants per yearwiththeOHIM,5whichcorrespondstoannualgrowthof10.9%.Owing to theacceleratedgrowth inapplicationsfor Community trademark protection in 2012–2014,Slovenia’sgapwiththeEUaveragenarrowedsignificantly,from36%in2012to19%in2015.In2009–2015,Slovenianapplicantsregisteredaround72Communitydesigns6permillion population annually with the OHIM, which was5.5%averageannualgrowth.Slovenia’sgapwiththeEUaverage(122.6)remainssignificant.
2.15 Intellectual propertyThe number of patent applications with the European Patent Office (EPO) is lower than before the crisis, but some progress has been made in other areas of intellectual property protection, particularly Community trademark applications. According todataonthenumberoffirst1patentapplicationsfiledwiththeEPO,Slovenianapplicantshavenotyetreachedthelevelrecordedbeforetheonsetof theeconomiccrisis,whichis partly attributable to the structure of the economysince some sectors2 have more patentable subjectmatterthanothers.AccordingtotheinternationalWIPOmethodology, the patentable technological fields areas follows: medical technology, digital communication,computertechnologyandtechnologyrelatedtoelectricalmachinery, apparatus andenergy.Half of all thepatentapplications in 2010–20153 derived from these areasof technology (EPO Annual Report 2015, 2016). The
Figure:Number of Community trademarks applications and registered Community designs per million population
Source:OHIMWebPage,2016;calculationsbyIMAD.
0
20
40
60
80
100
120
140
160
180
200
2004 2008 2013 2014 2015 2004 2008 2013 2014 2015
Trademarks Designs
EU Slovenia
Table:Patent applications filed with the EPO by year of first filing,* per million population
2000 2005 2007 2008 2009 2010 2011 2012** 2013** 2014*** 2015***
Slovenia 24.7 54.3 59.7 69.1 60.6 51.3 54.2 49.6 46.0 60.6 57.2
EU 106.3 115.5 117.2 113.6 112.6 112.1 113.2 113.1 113.3 132.9**** 132.9****
Source:EurostatPortalPage–ScienceandTechnology–PatentStatistics,2016;EPOAnnualReport–statistics2015,2016.Notes:*Datafor2014and2015relatetopatentapplicationsthatarenotnecessarilythefirstonaglobalscalebutwerefiledwiththeEPOinthecurrentyear(EPOAnnualReport–statistics2015,2016).**Eurostatestimate.***Provisionaldata.****IMADestimatebasedontherecalculationofdataforEUMemberStates.
1ThedataonpatentapplicationsforthelasttwoyearsaretakenfromtheEPOAnnualReport,whichmeansthattheyrefertothecurrentyear.ThesearenotnecessarilythefirstpatentapplicationsonaglobalscaleasindatapublishedbyEurostat(formoreinformation,seetheSlovenianEconomicMirror2/2009).2 The legal protection of patents actually involves the exclusive protection of technologies (rather than sectors) and the relatedproceduresandprocessesinwhichproductsaremade.Theinternationalclassificationofpatentsisthereforebasedontheclassificationoftechnologies(Schmoch,2008).3Amongthetoptentechnologicalfields,technologiesrelatedtopharmaceuticalsranktenth.4Atrademarkorservicemarkisanysign(orcombinationofsigns)protectedbythelawthatcanbegraphicallyrepresentedandusedtodistinguishbetweenotherwiseidenticalorsimilargoodsorservices.Atrademarkisvalidfortenyearsfromthefilingdateandmayberenewed(SIPOAnnualReport2011,2013).5OfficeforHarmonizationintheInternalMarket.6Adesignentailstheappearanceofaproductprotectedbylawprovidedthatitisnewandhasanindividualcharacter.Designprotectionlastsforfiveyearsandcanberenewed(SIPOAnnualReport2011,2013).

124 Development Report 2016Indicators of Slovenia’s development
thepossibilitiesofusingawiderangeofe-servicesandmobileapplications,itisencouragingtonotethatalargeshareofhouseholdshaveaccess tomobilebroadbandInternet(54%;EU38%).
Slovenia also lags significantly behind the EU in the use of some advanced e-services. Internet users inSlovenia areon line to approximately the sameextentas their counterparts in the EU for simple servicessuch as searching for information, reading onlinenews or downloading official forms.However, the gapbetween the EU and Slovenia is wide, and shows nosigns of narrowing, not only in the use of somemoresophisticated e-services, particularly online banking,social and professional networking, online shoppingandthesubmissionofcompletedformstogovernmentinstitutions,butalso in termsofsendinge-mail.This ismainly attributable to Slovenian Internet users lackingthe appropriate skills to do so. Data show that basiccomputerskillsarefairlygood,butSlovenialagsbehindthe EU regarding the advanced skills required to usemoresophisticatede-services.Inotherfactorsthatcouldimpact theuseof theseservices, suchasaccess to thebroadbandInternetandtrustinthesafetyofe-services,therearenomajordivergencesfromtheEU.AccordingtotheEurostatsurveyonInternetsafety,onlytheshareof respondents who refrained from online purchasesforsecurity reasonswassomewhathigher thantheEUaverage in2015; the shareof thosewho, for the samereasons, did not use e-banking was equal to the EUaverage,whereastheuseofsocialnetworkingsitesande-government services was less of an Internet safetyconcerninSloveniathanintherestoftheEU.
2.16 Use of Internet and e-servicesIn terms of Internet usage and access to the Internet, the gap between Slovenia and the rest of the EU is gradually widening. Since 2010 the development oftheinformationsocietyhasslowedsignificantly,causingthegapbetweenSloveniaandtheEUaveragetowidenin terms of Internet users and householdswith onlineaccess. In recent years, Slovenia has also fallenbehindmanynewEUMemberStateson these two indicators.Suchdevelopmentscanbepartlyattributedtothecrisis,which made the Internet less accessible, particularlyfor more vulnerable population groups, but also tothe lack of appropriate e-skills, particularly in specificpopulation groups. Slovenia has therefore fallen evenfurtherbehindtheEUaverageinthisperiod,especiallywith regard to Internet use among people in the firstincomequartile.Analysisofdatabyageandeducationreveals less favourable developments compared withtheEU,particularlyfor lesseducatedandolderpeople,i.e.peoplewhoalsooftenbelongtomoreeconomicallyvulnerable population groups. Moreover, the data forthese two population groups also reveal a significantlackofe-skills(basicskillsforcomputerandInternetuse)in comparison to the correspondinggroups in the EU.Theshareofusersfromthehighestincomebrackethasalsostoppedincreasingintherecentperiod,butremainsrelatively high (over 90%) and slightly above the EUaverage.Regardingtheuseofnewer technologiesand
Table:Internet usage and access by households and individuals, Slovenia (16–74 years), in %
2005 2006 2007 2008 2009 2010 2011 2012 2013 2014 2015
InternetusersinthelastthreemonthsSlovenia 47 51 53 56 62 68 67 68 73 72 73
EU N/A N/A 57 61 65 68 71 73 75 78 79
HouseholdswithInternetaccessSlovenia 48 54 58 59 64 68 73 74 76 77 78
EU N/A N/A 55 60 66 70 73 76 79 81 83
HouseholdswithbroadbandInternetaccess
Slovenia 19 34 44 50 56 62 67 73 74 75 78
EU N/A N/A 42 48 56 61 67 72 76 78 80
Source:EurostatPortalPage–InformationSociety,2016.Note:Dataforindividualyearsrefertothefirstquarter,N/A–datanotavailable.
Figure:Internet users in the last three months, as a % of selected population, 2015*
Source:EurostatPortalPage–InformationSociety,2016.Note:*Datarefertothefirstquarteroftheyear.
0
20
40
60
80
100
120
Luxe
mbo
urg
Den
mark
Neth
erland
s
Finlan
d
U.Kingd
om
Swed
en
Germ
any
Esto
nia
Belgium
Fran
ce
Austria
Czec
hR.
Ireland EU
Spain
Latvia
Slov
akia
Malta
Hung
ary
Slov
enia
Cypr
us
Lith
uania
Croa
tia
Portu
gal
Poland
Gree
ce
Italy
Bulgar
ia
Rom
ania
In%
Total Older(55–74years) Low-skilledorunskilled

125Development Report 2016Indicators of Slovenia’s development
alltheseareas.Themajorityalsoexpectthingstoremaingenerallythesameoverthenextyear.
Trust in the EU and its institutions has also declined. Compared with the measurements taken in spring2015 (Eurobarometer 83) and the previous year, trustintheEUanditsmaininstitutionsdeclinedinthelatestmeasurement and is at its lowest point in 12 years. InNovember2015 the shareof respondentswho trustedthe EUwas 10percentagepoints lower thanone yearearlierandbelowtheEUaverageforthefirsttime.Intotal30%ofrespondentsinSloveniatrusttheEUparliamentand theEuropeanCommissionandslightly fewer trusttheEuropeanCentralBank(28%);thesefiguresarealsobelowtheEUaverage.The lower levelsof trustcanbeattributed to the increase in the proportion of peoplewho believe that things are heading in the wrongdirection in theEU.This ismainly relatedto theextentof the refugee crisis in Europe, given that asmany as74%ofrespondentsinSloveniaseeimmigrationasthemostimportantissuecurrentlyfacingtheEU.Incontrasttoprevious years, a smallerproportionof respondentsperceive the economic situation to be the EU’s mainconcern(19%),butmoreworryaboutterrorism(17%).
2.17 Trust in institutionsTrust in institutions1 remained low in Slovenia in 2015. Havingdeclinedsignificantlysincethebeginningofthecrisis, it isnowamongthe lowest in theEU.Accordingtothelatestsurvey,theproportionofrespondentswhotrust the parliament and the government rose slightlycompared with 2014, but is lower than the previousmeasurementtaken(StandardEurobarometer83).Trustinlocalauthoritiesdeclinedandtrustinpoliticalpartiesremained very low.Trust in the government and localauthorities remainsbelowtheEUaverage,and trust intheparliamentandpoliticalpartiesisamongthelowestintheEU.The lowtrust in institutions is largelyrelatedtodissatisfactionwiththecurrenteconomicandgeneralsituation in Slovenia. The most recent Eurobarometerdatashowthatrespondentsarestilldissatisfiedwiththeemployment situation in Slovenia (91%), the situationof Slovenia’s economy (80%) and the quality of lifein Slovenia (53%), but the share of respondents whoperceivethecurrentsituationtobebadhasdeclinedin
Table:Trust in institutions, in %
2005 2007 2008 2009 2010 2011 2012 2013 2014 2015
ParliamentSlovenia 33 31 34 19 23 10 12 6 9 11
EU 35 35 34 30 31 27 28 25 30 28
GovernmentSlovenia 39 32 36 29 27 12 15 10 13 16
EU 31 34 34 29 29 24 27 23 29 27
Political partiesSlovenia 14 13 17 9 11 7 9 6 6 6
EU 17 18 20 16 18 14 15 14 14 15
Local authoritiesSlovenia N/A N/A 39 40 39 36 34 29 31 27
EU N/A N/A 50 50 47 45 43 44 43 42
EUSlovenia 55 65 60 50 47 38 39 37 40 30
EU 45 48 47 48 42 34 33 31 37 32
Source:Eurobarometer.Note:Dataforindividualyearsarethelatestavailabledatainthegivenyear(autumnmeasurement).DatafortheEUfor2005arefortheEU-25,between2007and2012fortheEU-27andbetween2013and2015fortheEU-28;N/A–datanotavailable.
Figure:Trust in EU institutions, Slovenia, in %
20
30
40
50
60
70
80
Jun Oct Apr Sep May Oct Apr Oct Jun Nov Jun Nov May Nov May Nov May Nov Jun Nov May Nov
2005 2006 2007 2008 2009 2010 2011 2012 2013 2014 2015
In%
EuropeanCentralBank EuropeanCommission EuropeanParliament
1ThesourceofdataisEurobarometer,whichisbasedonapublicopinionpollontheleveloftrustinselectedinstitutions,thepossibleanswersbeing:“tendtotrust”,“tendnottotrust”and“don’tknow”.
Source:Eurobarometer.

3 Demographic changes and the welfare stateDemographic changes• 3.1Fertilityrateandlifeexpectancy• 3.2Netmigration• 3.3Age-dependencyratio
Labour market• 3.4Employmentrate• 3.5Unemploymentrateandlong-termunemploymentrate• 3.6Temporaryandpart-timeemployment• 3.7Minimumwage• 3.8Youngpeopleneitherinemploymentnorineducationortraining
Social security systems and their long-term sustainability• 3.9Socialprotectionexpenditure• 3.10Healthexpenditure• 3.11Expenditureonlong-termcare• 3.12Pensionexpenditure
Quality of life and social risks• 3.13Grossadjusteddisposableincomepercapita• 3.14Actualindividualconsumption• 3.15Incomeinequality• 3.16Lifesatisfaction• 3.17Healthylifeyears• 3.18Shareofpopulationwithatleastuppersecondaryeducation• 3.19At-risk-of-povertyrate• 3.20Materialdeprivationrate

128 Development Report 2016Indicators of Slovenia’s development
Overview of indicators – Demographic changes and the welfare state
Source:calculationsbyIMAD.Note:ThetableshowsSlovenia’spositionrelativetotheunweightedarithmeticaverageoftheEUMemberStates.Itwascalculatedwithregardtothesetofcountriesforwhichdataforindividualindicatorswereavailable;Cyprus,Malta,LuxembourgandCroatiawereexcludedfromtheanalysisduetoalackofdata.Thedatainthetablearefor2008andthelastyearforwhichdataforEUMemberStateswereavailable(thelastyearisindicatedinthetable).Apositiveindicatorvaluemeansabove-averagedevelopmentrelativetotheEU,whileanegativevalueindicatesthatSlovenialagsbehindtheEUaverageonthatindicator.
2014
2014
2014
2015
2013
2015
2014
2014
2014
2013
2013
2013
2013
2014
2015
2015
2015
2015
2015
2015
2014
2014
2014
2014
-2 -1 0 1 2
Materialdeprivationrate,in%
At-risk-ofpovertyrate,in%
Ginicoefficient,value
Shareofthepopul.withatleastuppersecond.educ.,%
Healthylifeyears,number
Lifesatisfaction,in%
Actualindividualconsumptionpercapita,inPPS
Incomeinequality-quintileshareratio20/80
Grossadj.disposableincomepercapitainPPS
Pensionexpend.,ESSPROSmethod.,asa%ofGDP
Expenditureonlong-termcare,asa%ofGDP
Healthexpenditure,asa%ofGDP
Socialprotectionexpenditure,asa%ofGDP
NEETrate,in%
Minimumgrosswage,inEUR
Shareoftemporaryemployment(15-64years)
Shareofpart-timeemployment(15-64years)
Long-termunemploymentrate(15-74years),in%
Unemploymentrate(15-74years),in%
Employmentrate(15-64years),in%
Old-agedependencyratio
Lifeexpectancyatbirth,numberofyears
Netmigration,per1,000population
Totalfertilityrate,in%
Qua
lityof
lifeand
soc
ialrisks
Socialpro
tection
system
san
dth
eir
long
-ter
mstability
Labo
urm
arke
tDem
ogra
phic
chan
ges
Standarddeviation
2008 Theyearbeforelast LastyearIndicator

129Development Report 2016Indicators of Slovenia’s development
comparison),wecaninferthatthenumberofbirthswillalsodeclineintheyearstocome.
In 2014 life expectancy3 in Slovenia increased more than in previous years and was at the EU average. Agirlbornin2014couldexpecttolive83.7years(7monthslongerthanagirlbornoneyearearlier)andaboy78.0years(oneyear longer). In the period 1987–2014 the gender gapnarrowedby2.3years; lifeexpectancy roseby9.8yearsformenandby7.6 forwomen,which is attributable toadvancesinmedicine,greateraccesstohealthservices,ahealthierlifestyleandbetterlivingconditions.4Inthelasttwoyears (2012and2013), life expectancyatbirthwasat the EU average5 (above the average for women andbelowformen);lifeexpectancyattheageof65(EU:19.8years)wassomewhatlower(attheEUaverageforwomenandbelowformen).Womenaged65canbeexpectedtoliveanother21.3yearsandmenanother17.2years.Thegapbetweenmen andwomen iswider than in the EUonboth indicators,whichmeans that there is room forimprovementinimprovingthelifestylesofmen.
3.1 Fertility rate and life expectancyThe fertility rate,1 which has hovered around 1.56 children per woman of childbearing age since 2008 (2014: 1.58), has been at the EU average for the last two years. NoEUcountryhasa fertility rate thatwouldensure even a simple replacement of the population(2.1), the countries coming closest to this figure beingFrance, Ireland and Sweden. In Slovenia around 1,000fewerchildrenhavebeenborninthelasttwoyearsthanthe average for 2008–2012, not only because womenarehavingchildrenlaterbutalsoduetoafasterdeclineinthenumberofwomenofchildbearingage(in2014by6,500).Meanwhile,themeanageofmothersatchildbirthcontinues to increase, by around onemonth per year.2Judging by the size of the generations and assumingthere is no change to current fertility rates or familypolicy (which is otherwise favourable by international
1Thetotalfertilityrateisthesumofage-specificbirthratesinacalendaryear.Itindicatesthenumberoflivebirthsperwomanif,duringherentirechildbearingage,theage-specificfertilityratesremainunchangedfromthegivencalendaryear.2In2014themeanageofmothersatbirthtotalled30.6forallbirthsand29.1forthefirstbirths(1.4and1.6yearsmore,respectively,thanin2004).3Lifeexpectancyistheaveragenumberofyearsthatapersonagedxyearscanexpecttolive,assumingthatage-specificmortalityratesremainunchangedduringtheirlifetime.4OECD(2014),HealthataGlance:Europe2014.5SURSdoesnotpublishdataontotallifeexpectancy.Moreover,itsdataonlifeexpectancybygenderdifferslightlyfromthosepublishedbyEurostatduetothedifferentmethodologiesused.
Figure:Mean age of women at childbirth (2000 and 2012) and fertility rate in EU countries (2012)
Source:EurostatPortalPage–PopulationandSocialConditions–Population–Demography–Fertility,2016.
0.0
0.5
1.0
1.5
2.0
2.5
20
23
26
29
32
35
Bulgar
ia
Rom
ania
Slov
akia
Poland
Latvia
Lith
uania
Hung
ary
Esto
nia
Croa
tia
Czec
hR.
Malta
Slov
enia
U.Kingd
om
Belgium
Fran
ce EU
Austria
Finlan
d
Portu
gal
Den
mark
Germ
any
Cypr
us
Swed
en
Gree
ce
Neth
erland
s
Luxe
mbo
urg
Italy
Ireland
Spain
Ferti
lityrate
Year
Meanageofwomenatchildbirth2000 Meanageofwomenatchildbirth2014 Fertilityrate,2014,rightaxis
Table:Total fertility rate and life expectancy at birth
2000 2005 2007 2008 2009 2010 2011 2012 2013
Life expectancy
Slovenia,bygender,together 76.2 77.5 78.4 79.1 79.4 79.8 80.1 80.3 80.5
Men 72.2 73.9 74.6 75.5 75.9 76.4 76.8 77.1 77.2
Women 79.9 80.9 82.0 82.6 82.7 83.1 83.3 83.3 83.6
EU,bygender,together N/A 78.5 79.1 79.4 79.6 79.9 80.3 80.3 80.6
Men N/A 75.4 76.0 76.3 76.6 76.9 77.4 77.5 77.8
Women N/A 81.5 82.2 82.3 82.6 82.8 83.1 83.1 83.3
Fertility rate
Slovenia 1.26 1.26 1.38 1.53 1.53 1.57 1.56 1.58 1.55
EU N/A 1.51 1.56 1.61 1.61 1.62 1.58 1.58 1.55Source:EurostatPortalPage–PopulationandSocialConditions–Population–Demography–Mortality,2014.Note:N/A–notavailable.

130 Development Report 2016Indicators of Slovenia’s development
(together 36.6%). Among the immigrated foreignersolderthan15years,onlyagoodtenthhadcompletedatleasthighereducationandjustoverhalfhadcompleteduppersecondaryeducation.Slightly lessthan5%ofallimmigratedforeignnationalscometoSloveniatostudy.Theaverageageofalltheimmigrantstogetherisaround33(offoreignnationals,32),whiletheaverageageoftheemigrantsis36(ofcitizens,37).
3.2 Net migrationIn the last few years total net migration has been low or negative in Slovenia, primarily owing to more Slovenian citizens emigrating from the country.Around8,000Sloveniancitizensperyearmovedabroadin2012–2014,resultinginanetmigrationfigureof-5,500.Inthelast fewyears,Sloveniancitizensalreadyaccounted forthe majority (57.3%, on average) of all emigrants, i.e.citizensand foreignnationals together,comparedwithonly27.6%peryearonaverageinthepast(theaveragefor theperiod1995–2011).Thenegativenetmigrationofcitizens,acontinuoustrendsince2000,hasthereforeincreased significantly in the last three years. ThemajoritymovetoAustriaandGermany(in2014almosthalfofallemigratedcitizens),witharoundatenthgoingoutside Europe. Among the foreign nationals movingtoSlovenia,themajority(approx.70%),stillcomefromthecountriesof the formerYugoslavia.Around45%offoreignersmove to Slovenia inorder to findwork, butfamily reunification has been almost as important areasonsince2011.
People emigrating from Slovenia are slightly older and better educated than those who immigrate. A totalof 28.2% of emigrated citizens over 15 years old hadcompletedatleasthighereducation,whichisthelargestshare in the four years since comparable data havebeen available; most settled in Germany and Austria
Figure: Emigration from and immigration to Slovenia
Source:SURS.
0
5,000
10,000
15,000
20,000
25,000
30,000
35,000
0
5,000
10,000
15,000
20,000
25,000
30,000
35,000
1995
1996
1997
1998
1999
2000
2001
2002
2003
2004
2005
2006
2007
2008
2009
2010
2011
2012
2013
2014
1995
1996
1997
1998
1999
2000
2001
2002
2003
2004
2005
2006
2007
2008
2009
2010
2011
2012
2013
2014
Immigrants-SloveniancitizensreturningtoSlovenia Immigrants-foreignnationals
Emigrants-Sloveniancitizens Emigrants-foreignnationals
Table:Net migration (with statistical corrections), per 1,000 population
2000 2005 2007 2008 2009 2010 2011 2012 2013 2014
Slovenia 1.4 3.2 7.1 9.2 5.6 -0.3 1.0 0.3 0.2 0.2
EU 2.1 3.1 3.1 2.4 1.4 1.5 1.5 1.7 3.3 1.8
Source:EurostatPortalPage-Populationandsocialconditions–Demography,2015.

131Development Report 2016Indicators of Slovenia’s development
fortheirfinancing.Theold-agedependencycoefficientin Slovenia is otherwise still below the EU average,but the gap is narrowing: according to EUROPOP2013demographicprojections,thiscoefficientwillexceedtheEU level by around 2022, which implies, among otherthings,increasingproblemsinfinancingageing-relatedexpenditure.
The ageing index5 for Slovenia shows that the number of older people has exceeded the number of children since 2004. Thenumberofolderpeople isrisingmuchfaster than the number of children. The number ofpeople aged 80 and above is increasing particularlyrapidly. In 2015 there were 21.4% more older peoplethan children in Slovenia,which is an increase of 18.4percentagepointsover2004.Thesharesofolderpeopleandchildren in thetotalpopulationroseto17.9%and14.8%,respectively,by2015(in2004:15.0%and14.6%).People older than 80 years accounted for as much as4.8%ofthetotalpopulation(in2004:2.9%).Theparentsupportratio,whichshowsthenumberofpersonsaged85yearsandover in relation to thosebetween50and64, is therefore also rising rapidly. In 2015, itwas 9.7,6comparedwith4.5in1990.Theincreaseintheshareoftheolderpopulationindicatestheurgentneedtoadjustsociety,theenvironmentandsocialsystemstothelargernumberofolderpeople.
3.3 Age-dependency ratioOwing to the declining number of working-age people and the growing number of older people, the age-dependency ratio1 has been rising more rapidly in recent years. Sloveniahad23.5childrenand28.5olderpeople(together52.1)per100working-agepopulation2at thebeginningof2015. Thenumberofolderpeople(65+)israpidlyrising,3notonlyasaresultofgainsinlifeexpectancy,butalsoduetolargepost-wargenerationsjoining the ranks of the older population (65+). Giventhatthenumberofbirthswasstillataround30,000peryearuptotheearly1980s,thistrendwillalsocontinuein thedecades tocome.At the same time, the smallercohortsofpeopleborninthe1990s(whenthenumberof births per year was below 20,000) are entering thegroup of 20-year-olds (the working-age population).Since 2012 thenumber ofworking-agepeople (20–64years old) has thusbeen falling.4Thismeans a declinein the potential active population, which will requirethesystemsforthefundingofsocialprotectionandthedemandonthe labourmarkettobeadapted.Withthecurrent organisation of social protection systems, thedeclining working-age population and the increasingage-dependency ratio represent a growing problem
1Thesituationasat1January2014(intheentiretext).2 The young-age-dependency ratio: (0–14 years)/(20–64 years). The old-age-dependency ratio: (65+)/(20–64 years). The total age-dependencyratio:((0–14years)+(65+))/(20–64years).3In2015itincreasedbymorethan9,000.4In2015itwasalmost24,000smallerthanin2011(−1.8%).5Theageingindexistheratioofthenumberofolderpeopletothenumberofchildren:(65+years)/(0–14years)*100.6By2030itisprojectedtoriseto15.8andby2060to43.
Table:Age-dependency ratio
2000 2005 2007 2008 2009 2010 2011 2012 2013 2014 2015
Slovenia 47.6 46.4 46.6 47.1 47.4 47.5 47.8 48.6 49.6 50.7 52.1
EU N/A 53.7 53.7 53.7 53.9 54.2 54.3 54.9 55.6 N/A 57.3
Source:EurostatPortalPage–PopulationandSocialConditions–Population,2015.Note:N/A–notavailable.
Figure:The young-age-dependency ratio, the old-age-dependency ratio and the ageing index, 2015
Source:EurostatPortalPage–PopulationandSocialConditions–Population2016;calculationsbyIMAD.
0
20
40
60
80
100
120
140
160
180
0
5
10
15
20
25
30
35
40
45
Slov
akia
Ireland
Luxe
mbo
urg
Cypr
us
Poland
Rom
ania
Czec
hR.
Slov
enia
Hung
ary
Neth
erland
s
Austria
Spain
Malta
U.Kingd
om
Belgium
Lith
uania
Esto
nia
Croa
tia EU
Latvia
Den
mark
Fran
ce
Bulgar
ia
Portu
gal
Swed
en
Finlan
d
Germ
any
Gree
ce
Italy
Ageing
inde
x
In%
Young-age-dependencyratio Old-age-dependencyratio Ageingindex,rightaxis
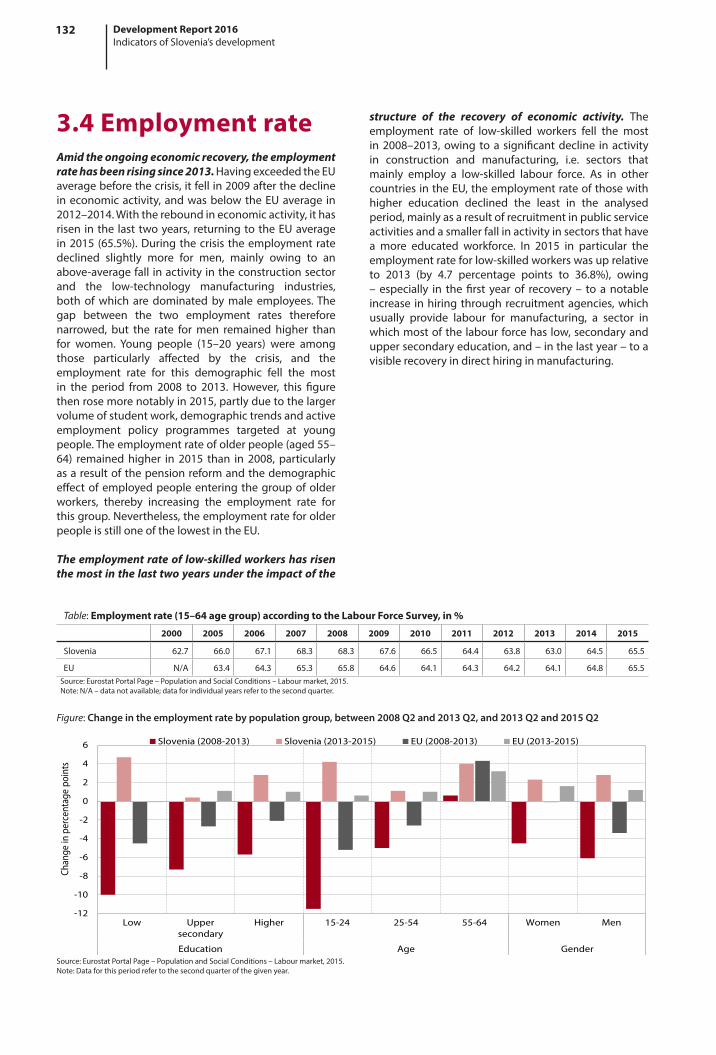
132 Development Report 2016Indicators of Slovenia’s development
3.4 Employment rateAmid the ongoing economic recovery, the employment rate has been rising since 2013. HavingexceededtheEUaveragebeforethecrisis,itfellin2009afterthedeclineineconomicactivity,andwasbelowtheEUaverage in2012–2014.Withthereboundineconomicactivity,ithasrisen inthe last twoyears, returningtotheEUaveragein2015(65.5%).Duringthecrisis theemploymentratedeclined slightly more for men, mainly owing to anabove-averagefall inactivityintheconstructionsectorand the low-technology manufacturing industries,bothofwhich aredominatedbymale employees.Thegap between the two employment rates thereforenarrowed, but the rate formen remained higher thanfor women. Young people (15–20 years) were amongthose particularly affected by the crisis, and theemployment rate for this demographic fell the mostin the period from 2008 to 2013. However, this figurethenrosemorenotablyin2015,partlyduetothelargervolumeofstudentwork,demographictrendsandactiveemployment policy programmes targeted at youngpeople.Theemploymentrateofolderpeople(aged55–64) remainedhigher in 2015 than in 2008, particularlyasaresultofthepensionreformandthedemographiceffectofemployedpeopleenteringthegroupofolderworkers, thereby increasing the employment rate forthisgroup.Nevertheless,theemploymentrateforolderpeopleisstilloneofthelowestintheEU.
The employment rate of low-skilled workers has risen the most in the last two years under the impact of the
Figure:Change in the employment rate by population group, between 2008 Q2 and 2013 Q2, and 2013 Q2 and 2015 Q2
Source:EurostatPortalPage–PopulationandSocialConditions–Labourmarket,2015.Note:Dataforthisperiodrefertothesecondquarterofthegivenyear.
-12
-10
-8
-6
-4
-2
0
2
4
6
Low Uppersecondary
Higher 15-24 25-54 55-64 Women Men
Education Age Gender
Chan
gein
per
cent
agepo
ints
Slovenia(2008-2013) Slovenia(2013-2015) EU(2008-2013) EU(2013-2015)
Table:Employment rate (15–64 age group) according to the Labour Force Survey, in %
2000 2005 2006 2007 2008 2009 2010 2011 2012 2013 2014 2015
Slovenia 62.7 66.0 67.1 68.3 68.3 67.6 66.5 64.4 63.8 63.0 64.5 65.5
EU N/A 63.4 64.3 65.3 65.8 64.6 64.1 64.3 64.2 64.1 64.8 65.5Source:EurostatPortalPage–PopulationandSocialConditions–Labourmarket,2015.Note:N/A–datanotavailable;dataforindividualyearsrefertothesecondquarter.
structure of the recovery of economic activity. Theemployment rate of low-skilled workers fell the mostin2008–2013,owing toa significantdecline inactivityin construction and manufacturing, i.e. sectors thatmainly employ a low-skilled labour force. As in othercountriesintheEU,theemploymentrateofthosewithhigher education declined the least in the analysedperiod,mainlyasaresultofrecruitmentinpublicserviceactivitiesandasmallerfallinactivityinsectorsthathavea more educated workforce. In 2015 in particular theemploymentrateforlow-skilledworkerswasuprelativeto 2013 (by 4.7 percentage points to 36.8%), owing– especially in thefirst yearof recovery – to anotableincrease inhiringthroughrecruitmentagencies,whichusually provide labour for manufacturing, a sector inwhichmostofthelabourforcehaslow,secondaryanduppersecondaryeducation,and–inthelastyear–toavisiblerecoveryindirecthiringinmanufacturing.

133Development Report 2016Indicators of Slovenia’s development
low-skilledpeopledeclinedthemost(by4.5percentagepoints to 13.7% in 2015), in line with the structure ofgrowth in employment through recruitment agencies,whichprovide labour to themanufacturingsector; theunemployment rate for people with upper secondaryandhighereducationremainedmoreorlessunchanged.Young people (aged 15–24)1 were hit hardest by thecrisis,theirunemploymentratehavingrisento24.1%in2008–2013,beforedroppingnotablyoverthenexttwoyearsandreaching15.5%in2015.2
The long-term3 unemployment rate fell last year for the first time since the onset of the crisis but remains over two times higher than its lowest level in 2009.Asa resultof aprolongedperiodofweak labourdemand,the long-termunemployment rate inSloveniahas risensharplysince2009.Afterthemodest increase in2014, itfellto4.7%in2015.In2009–2014theratesformenandwomenincreasedbyasimilarextent:whilethemalerateroseparticularlyatthebeginningofthisperiod,thefemalerateincreasedsteadilythroughouttheperiod.Duringthecrisisthelong-termunemploymentrateforyoungpeoplerose themost,but lastyear itdroppedsignificantlyandstoodat6.1%.Despitethe2015decline,theshareoflong-term unemployed in total employment remains large(51.5%)andslightlyabovetheEUaverage(49.4%).
3.5 Unemployment rate and long-term unemployment rateWith the continued economic recovery, the unemployment rate fell for the second year in succession, but remained twice as high as in 2008.Datafromthelabourforcesurveyshowthat,afterbottomingoutinthethirdquarterof2008(4.1%),theunemploymentrate had risen sharply by 2013 due to a decline ineconomicactivity.Withtherecoveryofeconomicactivity,it then started to fall in 2013 (seasonally adjusted). By2015ithaddroppedby1.2percentagepoints(to9.2%)andwas lower than theEUaverage (9.5%), towhich ithadcome fairly closeduring thecrisis.At theonsetofthe crisis, the adverse effects on manufacturing andconstruction caused the unemployment rate for mento risemore than the unemployment rate forwomen.However, in 2012 the unemployment rate for womenhadneverthelessexceededtherateformenagain,andby 2015 the gap between the two widened slightlymore. Inthelasttwoyears,theunemploymentratefor
1Thiswas a result of thehighprevalenceof temporary formsof employment in this group,whichwas causedby enterprisesnotrenewingfixed-termemploymentcontractsandreducingtheextentofstudentworkduringthecrisis.2Thismaybemainlytheresultoftheincreasedvolumeofstudentworkandspecificactiveemploymentpolicyprogrammestargetedatyoungpeople(e.g.theYouthGuaranteescheme).Thedeclineishoweveralsoduetodemographicfactors,withthenumberofyoungpeoplealreadyhavingfallenforalongperiod.3Unemploymentextendingforayearorlonger.
Figure:Change in the unemployment rate by population group, between 2008 Q2 and 2015 Q2
Source:EurostatPortalPage–PopulationandSocialConditions–Labourmarket,2015.
0
1
2
3
4
5
6
7
8
Low Uppersecondary
Higher 15-24 25-54 55-74 Women Men
Education Age Gender
Chan
gein
per
cent
agepo
ints
Slovenia EU
Table:Unemployment rate and long-term unemployment rate (15–74 age group)
2000 2005 2008 2009 2010 2011 2012 2013 2014 2015
Unemployment rate
Slovenia 6.9 5.8 4.1 5.6 7.1 7.7 8.2 10.4 9.3 9.2
EU N/A 8.9 6.8 8.8 9.5 9.3 10.3 10.8 10.1 9.5
Long-term unemployment rate
Slovenia 4.3 3.0 1.9 1.7 3.2 3.5 3.9 5.1 5.3 4.7
EU N/A 4.2 2.6 2.9 3.8 4.0 4.6 5.1 5.1 4.7
Source:EurostatPortalPage–PopulationandSocialConditions–Labourmarket,2015.Note:N/A–datanotavailable;dataforindividualyearsrefertothesecondquarter.

134 Development Report 2016Indicators of Slovenia’s development
second quarter of 2014. In 2008–2015 it rose slightlymorethanintheEUasawholewhich,inourview,wasprimarilya resultof thegreater significanceof studentworkfortotalyouthemployment.2Preciselyowingtotheprevalenceofstudentworkamongyoungpeople(aged15–24),theshareofpart-timeemploymentislargestinthisagegroup,whereitisalsosignificantlyabovetheEUaverage.
3.6 Temporary and part-time employmentIn 2015 the prevalence of temporary employment1 increased further. In the second quarter of 2015, theshare of temporary employment in total employmentstood at 17.8% (which is 1.3 percentage points morethaninthesecondquarterof2014)andwasstillhigherthantheEUaverage.The increase in theprevalenceoftemporary employment – despite the labour marketreformsin2013whichcauseditssharetodeclinein2013–ismainlyrelatedtoemployers’cautioninhiringandlastyear’sincreaseinstudentwork.Theshareoftemporaryemployment is still highest among young people (the15–24 age group), ranking among the highest in theEU.Similartoothercountries,temporaryemploymentismoreprevalentamongwomenthanmen.
In 2015 the share of part-time employment in total employment remained similar to 2014, but higher than before the crisis. In the second quarter of 2015,ittotalled10.7%,0.2percentagepointslessthaninthe
1 The term‘temporary employment’ refers to fixed-term employment and other forms of employment that are considered to betemporaryformsofworkinSlovenia.2Theshareofstudentworkinthetotalemploymentofyoungpeople(inthe15–24agegroup)totalled37.9%inthesecondquarterof2008and50.4%inthesecondquarterof2015.
Figure:Shares of temporary employment in total employment among young people aged 15–29 in Slovenia and the EU, and the share of student work in total youth employment
Source:EurostatPortalPage–PopulationandSocialConditions–Labourmarket–Employment,temporaryemploymentSURS;calculationsbyIMAD.
0
10
20
30
40
50
60
Q22005 Q22008 Q22009 Q22010 Q22011 Q22012 Q22013 Q22014 Q22015
Sharein%
EU Slovenia ShareofstudentworkinSlovenia
Table:Shares of temporary and part-time employment in total employment*, in %
2000 2005 2008 2009 2010 2011 2012 2013 2014 2015
Temporary employment
Slovenia 12.8 16.8 16.9 16.4 17.7 17.5 16.7 15.4 16.5 17.8
EU N/A 13.9 14.2 13.5 14.0 14.1 13.8 13.7 14.0 14.4
Part-time employment
Slovenia 5.3 7.8 8.1 9.7 10.5 9.1 8.5 9.3 10.9 10.7
EU N/A 17.3 17.6 18.1 18.7 18.8 19.3 19.7 19.7 19.7Source:EurostatPortalPage-PopulationandSocialConditions–Labourmarket–Employment,temporaryemployment,part-timeemployment.Note:*Datarefertothesecondquarteroftheyear.

135Development Report 2016Indicators of Slovenia’s development
3.7 Minimum wageAfter increasing strongly in 2010–2013, growth in the minimum gross wage slowed over the last two years; the ratio of the minimum gross wage to the average wage has nevertheless risen significantly since the onset of the crisis. Because the crisis coincidedwith changesin legislation,1 the ratio increased to50.8% (which is 10percentagepointsmore than in2008),puttingSloveniaat the top of the EU rankings.2 Throughout the crisis,minimum wage growth exceeded labour productivitygrowth inprivatesectoractivities,but laggedbehind inthelasttwoyears.Duringthecrisis,Sloveniarecordedoneofthelargestdeclinesineconomicactivity intheEU.Atthe same time, itwas also the countrywith the largestreal increase in theminimumwage (byalmost30%); insome countries, the minimum wage remained almostunchangedforseveralyearsandevendeclinedinothersin certain years. This increase impeded a more rapidadjustmentofwagestothecrisisin2010–2012,weakenedthecostcompetitivenessoftheeconomyandincreasedunemployment.Italsonarrowedwageinequality,anareainwhichSloveniahadotherwisenotdiverged from theEUaverage,evenbeforethecrisis.3Attheendof2015thedefinitionoftheminimumwagewaschanged,andsince1January2016theallowancesforunfavourableworkinghours have been exempted from the minimum wage
1In2010anewMinimumWageActwaspassed,whichdeterminedanew,significantlyhigherminimumwage,themethodoftransitiontothehigherminimumwagelevelandthemechanismforitsadjustment.2Luxembourg,witharatioof47.6%,istheclosesttoSlovenia;thelowestratioswererecordedfortheCzechRepublicandSpain(33.0%and34.2%,respectively).3Inboththe90/10inter-decileratio(2014:3.2;intheEUin2010:between2.1and4.7)andtheshareoflow-wageearners(2014:17.5%;EU2010:17.0%).4n2015thenumberofminimumwagerecipientsdroppedby22.0%onaverage,themostinthesectorsofmanufacturing,professionalactivities,constructionanddistributivetrades(byathird,orby8,000personscombined).
Figure: Minimum gross wage, July 2015, in PPS
Source:EurostatPortalPage,2015.Note:Dataforthe22EUMemberStateswhereaminimumwageisenforcedbylaw.
Table:Average gross minimum wage paid, average gross wage and the ratio between the two, SloveniaMinimum gross
wageNominal growth
in minimum wageReal growth in
minimum wageAverage gross
wageNominal growth
in gross wageReal growth in
gross wageRatio of minimum
wage to average wage2000 322 10.3 1.3 800 10.6 1.6 40.3
2005 499 4.9 2.4 1.157 4.8 2.2 43.1
2008 571 8.0 2.2 1.391 8.3 2.5 41.1
2009 593 3.7 2.8 1.439 3.4 2.5 41.2
2010 679 14.6 12.6 1.495 3.9 2.1 45.4
2011 718 5.7 3.8 1.525 2.0 0.2 47.1
2012 763 6.3 3.5 1.525 0.1 -2.4 50.0
2013 784 2.7 0.9 1.523 -0.2 -2.0 51.4
2014 789 0.7 0.5 1.540 1.1 0.9 51.2
2015 791 0.2 0.7 1.556 0.7 1.2 50.8
Source:SURS,SKD_2002until2008,SKD_2008from2009onwards,MinistryofLabour,FamilyandSocialAffairs,AJPES.
0
200
400
600
800
1,000
1,200
1,400
1,600
Bulgar
ia
Rom
ania
Esto
nia
Latvia
Lith
uania
Cze
chR.
Slov
akia
Hun
gary
Cro
atia
Portug
al
Poland
Gre
ece
Spain
Malta
Slov
enia
U.K
ingd
om
Ireland
Fran
ce
Net
herla
nds
Belgium
Ger
man
y
Luxe
mbo
urg
InPPS
per
mon
th
andpaidseparately.However, inordertoreally improvethematerialsituationofminimumwagerecipients,whooftenworkunfavourablehours,itwouldalsobenecessarytoadjustthetaxtreatmentofminimumwages.
The number of minimum wage earners declined significantly4 with the recovery of the economy in 2015 (to 37,159), but remained almost twice as high as in the year before the new minimum wage act was passed (2009). With the increase in employment, theshare of minimum-wage earners in total employmentalso dropped notably last year but remained at 6.2%,muchlargerthanin2009(3.0%).Themajorityofworkersreceiving the minimum wage were still recorded inprivate sector activities, although in the last two yearstheirnumberdeclinedbyathirdto28,259(2009:18,596).Intheperiod2009–2015theirshareincreasedfrom3.8%to6.3%ofallpersonsemployed.Meanwhile,theincreasein theotherwise small shareofminimumwageearnersin public service activities wasmuch larger (from 0.3%to 5.7%). The doubling of the number in the last fouryears(to8,900)wasmainlyduetocutsinpublicservants’wages.Relative to2009, thenumberofminimumwageearnersrosethemostinbothrelativeandabsolutetermsin education,where itwas 45-fold. In absolute terms, italsorosenotablyinthesectorsofdistributivetradesandhealthandsocialcare.

136 Development Report 2016Indicators of Slovenia’s development
to active employment policy programmes and labourmarket interventionmeasures being targeted at thoseyoungerthan30.Inthe20–24agegroup,thefemaleandmaleNEET ratesarealmostequal,but theNEET rate issignificantlyhigher forwomenthanmenamongthoseaged 25–29 and 30–34. It also increasedmore duringthe crisis.Women tend to face more problems in thetransition fromeducation into employment thanmen,which is attributable to worse employment prospectsforyoungpeoplegraduatingfromsocialsciences,wherewomenpredominate,andrestrictionsonemploymentinthepublicsector,wherewomenmakeupalargershareoftheworkforcethanmen.
3.8 Young people neither in employment nor in education or trainingIn 2008–2014 the share of young people neither in employment nor in education or training (the NEET rate) increased more in Slovenia than in the EU, but remained below the EU average. This is explained bythe significantly higher participation of young peopleinuppersecondaryandtertiaryeducationthantheEUaverage.TheNEETrateisthereforelowestinthe15–19age group.1 In the 20–24 age group,2 the NEET rate ismuch higher, which is linked to the modest demandforyoungpeople(withoutexperience)withcompletedupper secondaryand tertiaryeducation (thefirst cycleof Bologna study programmes), but is still lower thantheEUaverageduetotheirhighparticipationintertiaryeducation. In 2008–2014 the NEET rate for youngpeople aged 25–29 rose themost, which is related tothe increase in the number of tertiary graduates, thelackof jobs for thesegraduates and a skillsmismatch.Despite the implementation of the Youth Guaranteeschemes, the NEET rate in the 20–24 and 25–29 agegroupsdidnotchangesignificantlyin2014,buttheratefor the30–34agegroupcontinued to rise,whichwas,inadditiontothemodestdemandforlabour,partlydue
1In2014thesharewas4.3%inSlovenia(EU:6.4%).2In2014thesharewas13.8%inSlovenia(EU:17.8%).
Figure:Share of young people (25–29) neither in employment nor education or training, 2008 and 2014, in %
Source:EurostatPortalPage–Populationandsocialconditions–Educationandtraining,2016.
0
5
10
15
20
25
30
35
40
45
Gre
ece
Italy
Bulgar
ia
Slov
akia
Spain
Croa
tia
Rom
ania
Ireland
Cypr
us
Hun
gary
Poland EU
Latvia
Portug
al
Lith
uania
Fran
ce
Slov
enia
Czec
hR.
Belgium
Esto
nia
U.K
ingd
om
Finlan
d
Malta
Ger
man
y
Aus
tria
Net
herla
nds
Den
mark
Swed
en
Luxe
mbo
urg
In%
2014 2008
Table:Share of young people (20–34) neither in employment nor in education or training, in %
2002 2005 2008 2009 2010 2011 2012 2013 2014
Slovenia 10.9 10.4 8.4 10.5 11.1 11.1 13.5 15.4 15.9
EU 19.6 18.7 16.5 18.5 19.1 19.3 19.9 20.1 19.3
Source:EurostatPortalPage–Populationandsocialconditions–Educationandtraining,2016.

137Development Report 2016Indicators of Slovenia’s development
3.9 Social protection expenditure After a period of growth at the beginning of the crisis, social protection expenditure declined in 2012 and 2013. The decline was a consequence of changes tosocial legislation1 and fiscal consolidation measures,2which entered into force in 2012. Expenditure growthduringthecrisiswasattributabletodeterioratinglabourmarket conditions, mass retirements and the risingdemand for health care and long-term care services.Amongthemajorexpenditures,expenditurerelatedtooldage,thecategorythataccountsforthelargestshareof total social protection expenditure, expanded themost.Acceleratedretirementbeforetheimplementationofthenewpensionlegislationandthelargersizeoftheretiringgenerationmeanstheincreasewouldhavebeenevenlargerhadthegovernmentnotadoptedmeasuresto restrict the adjustment of pensions for inflation.Expenditure on sickness and health benefits also rosesignificantly.
In terms of social protection expenditure as a share of GDP, Slovenia lags behind the EU average, most notably in expenditure on unemployment benefits.Slovenia’ssocialprotectionsystemneverthelessprovidesrelatively good access to health services and reducesthe poverty risk. A comparison between expenditureon social protection in PPS in Slovenia and the EU
1Zakonouveljavljanjupravicizjavnihsredstev(ZUPJS)/ExerciseofRightstoPublicFundsAct.2Zakonzauravnoteženjejavnihfinance(ZUJF)/FiscalBalanceAct.
Figure:Social protection expenditure in PPS per capita, 2013
Source:EurostatPortalPage-Socialprotection,2015.
0
2,000
4,000
6,000
8,000
10,000
12,000
14,000
16,000
Rom
ania
Bulgar
ia
Latvia
Esto
nia
Lith
uania
Cro
atia
Slov
akia
Hun
gary
Malta
Cze
chR.
Cyp
rus
Slov
enia
Portug
al
Spain
Ireland
Italy
U.K
ingd
om
Belgium
Finlan
d
Swed
en
Fran
ce
Ger
man
y
Aus
tria
Den
mark
Net
herla
nds
Luxe
mbou
rg
InPPS
per
cap
ita
Table:Social protection expenditure in Slovenia and in the EU, as a % of GDP
2000 2005 2007 2008 2009 2010 2011 2012 2013
Slovenia 27.5 22.6 20.9 21.0 23.7 24.4 24.5 24.9 24.9
EU N/A N/A N/A 27.0 29.9 29.7 29.4 29.8 N/A
Source:EurostatPortalPage–SocialProtection,2015.Note:Socialprotectionexpenditureasa%ofGDPiscalculatedonthebasisofthemostrecentGDPdataavailable(Firstreleasefrom31August2015);N/A–datanotavailable.
averagerevealsthatSlovenialagsthemostbehindtheEUintermsofexpenditureonunemployment,whereitreachesonly just over half of the average expenditureintheEU.Thisisduetoasmallshareofunemploymentbenefitbeneficiaries,whichalsoappearstobethereasonwhytheat-risk-of-povertyrateofunemployedpeopleismuchclosertotheEUaveragethantheat-risk-of-povertyrate for theentirepopulation.SloveniaexceedstheEUaverageonlyinexpenditureonsocialexclusion,whichis–togetherwiththeeffectivetargetingofbeneficiaries–alsolikelytobethereasonwhysocialtransfersaremoreeffectiveatreducingthepovertyriskinSloveniathanintheEUas awhole.Theefficiencyofour system is alsocorroboratedbythefactthatSloveniaspendsmuchlesson its management (management and administrationcostsandotherexpenses).

138 Development Report 2016Indicators of Slovenia’s development
morethan in theEUasawhole,expenditureasashareof GDP rose at an above-average rate and was higherthantheEUaverage. In2013currenthealthexpenditureaccounted for 8.8% of GDP; total health expenditure,including capital formation, accounted for 9.1%ofGDP(EU:8.7%ofGDP). Intheperiod2009–2013currenthealthexpenditurepercapitainPPSUSDcontractedbyroughlythesameextentasintheEUasawhole(by0.3%peryearinrealterms).In2013ittotalledPPSUSD2,511(PPSEUR2,163),whichwas90.3%oftheEUaverage(2008:90.6%)or73%oftheOECDaverage(2008:77%).
The measures taken during the crisis have contributed to a more efficient health expenditure structure. Acomparison of the health expenditure movements byfunctionshowsasignificantturnduringthecrisis,whichwas positive from the perspective of recommendationsregarding the restructuring of health expendituretowards improving the efficiency of the system:growth in expenditure on out-patient ambulatory carestrengthened; expenditure on hospital care declined;investment inpreventionandpublichealthsurged;andexpenditureonsystemadministrationdeclinednotably.It is less encouraging to note that Slovenia is laggingfurtherandfurtherbehindintheshareofexpenditureonlong-termhealthcare (SI:10%;OECD:12%),particularlycommunitynursingandattendanceallowances.WhilethemajorityofmoreadvancedOECDcountrieshadalreadyintensified public funding for these services before thecrisis,Sloveniastillrecordedbelowaveragegrowthinthisexpenditureduringthecrisis.
3.10 Health expenditure After a significant decline during the crisis, health expenditure rose in real terms in 2014 and 2015. Accordingtothefirstestimate,currenthealthexpenditure(excludingcapital formation)amounted to8.5%ofGDPin 2015 and 8.6% of GDP in 2014.1 Health expenditureis closely linked to HIIS revenue, as theHIIS is requiredtohaveabalancedbudgetandmaynotborroworraisecontributionrates.Thehigherrevenuefromcontributionsforcompulsoryhealthinsurancein2015(by3.3%inrealterms) mainly stemmed from higher employment andearnings in the private sector and additional revenuefrom the increase in contributions levied on studentwork. Furthermore,most of themeasures for balancingtheHIISbudgetthathadbeenadoptedduringthecrisisremainedinforce.Afterseveralyearsofausterity,in2015,theHIISwas able to allocate these additional funds fortheexpansionandimprovedevaluationofsomepriorityprogrammes (e.g. model practices, oncology, nursinghomes, biological medicines), the reduction of waitingtimes and increased expenditure on sickness benefits.Accordingtothefirstestimate,currentpublicexpenditureaccounted for 6.1%ofGDP in 2014 and 2015,while itsshare in total expenditure rose from 71.4% in 2014 to71.9%in2015.
During the crisis, health expenditure in relation to GDP surged, while per capita expenditure remained around the pre-crisis level. As in 2009–2013 GDP contracted
1HIISBusinessReportfor2015.(Draft,March2016).DataaccordingtotheSHAmethodologyareestimatedincooperationwithSURS.ExpenditureasashareofGDPfor2015iscalculatedbasedonSURS’sFirstReleaseinFebruary2016.
Table: Health expenditure*
Health expenditure, as a % of GDP
Public health expenditure, as a % of GDP*
Private expenditure, share in current
expenditure, in %
Out-of-pocket expenditure, share in
current expenditure, in %2005 2013 2014 2015 2005 2013 2014 2015 2005 2013 2015 2005 2013 2015
Slovenia** 8.0 8.8 8.6 8.5 5.9 6.2 6.1 6.1 26.5 29.0 28.1 13.0 12.6 12.5
EU*** 7.7 8.3 N/A N/A 6.0 6.2 N/A N/A 25.0 26.7 N/A 21.5 20.7 N/ASource:OECDStat;Eurostat;WHOHFA-DB;SURS:Healthexpenditureandsourcesoffunding,June2015.Notes:*Excludingcapitalformation(in2013capitalformationamountedto0.4%ofGDP): incompliancewiththerevisedinternationalmethodologyoftheSystemofHealthAccounts (SHA2011), thebasic indicatorsonhealthno longer includecapital formation.**ForSloveniathecalculationof theshareofGDP isbasedontherevisionofGDPinSeptember2015(SURS,NationalAccounts),for2015,thefirstreleasebySURSinFebruary2016,andfor2014and2015,thefirstestimate(seeNote1).***TheEUaverageiscalculatedasanunweightedarithmeticmean–sources:OECDandEurostatforCyprus,Bulgaria,RomaniaandCroatia;WHOHFA-DBforMalta;N/A–datanotavailable.
Figure: Real growth rates of health expenditure by function, per capita, Slovenia and the OECD, 2005–2009 and 2009–2013
Source:OECDHealthStatistics2015.
-4
-2
0
2
4
6
8
10
Hospitalcare Out-patientambulatorycare
Long-termhealthcare
Medicinalproducts,medicaldevices
Prevention,publichealthservices
Healthadministrationandhealthinsurance
In%
OECD2005-09 OECD2009-13 Slovenia2005-09 Slovenia2009-13

139Development Report 2016Indicators of Slovenia’s development
3.11 Expenditure on long-term careAfter increasing during the crisis, total expenditure on long-term care (LTC)1 declined in real terms in 2013. Accordingtothelatestdataavailable,italsofellasashareof GDP and totalled 1.31%of GDP.Owing to austeritymeasures in the public sector, public expenditure onLTC declined by 2.9% in real terms in 2013; privateexpenditure on co-payments in institutions alsodecreased (−1.7%).Brokendownbysourceof funding,the share of private expenditure increased again, to27.5%; broken down by function of care, the share ofexpenditureonlong-termsocialcarewasupto33.3%.
Slovenia’s gap with the OECD average in terms of long-term care development is widening. In 2005–2013,public LTC expenditure rose by 2.2% per year in realtermsinSloveniaandbyanaverageof0.4%intheOECD
1Asdefinedby theOECD,Eurostatand theWHO (ASystemofHealthAccounts2011,pp.88–95andp.114).The reportof the inter-institutionalworkinggroupontheuseoftheinternationalmethodologytomonitorLTCspending,LTCbeneficiariesinSloveniaandfordataanalysiswaspublishedbyIMADintheWorkingPaper,2/2014http://www.umar.gov.si/fileadmin/user_upload/publikacije/dz/2014/DZ02_14_summary.pdf).2 In Slovenia institutional care is more expensive than care at home, as it includes integrated health and social services andaccommodationcosts.Thequalityofservicesininstitutionsisthereforemuchhigherthanathome.Theratioisthushighlyinfavourofinstitutionalcare.However,dataonthenumberofLTCrecipientsininstitutionsrelativetothenumberofthosereceivingLTCathomeshowareversedratio–approximatelyone-thirdarerecipientsofvariousformsofinstitutionalcare,whileclosetotwo-thirdsreceiveLTCathomeoronlyreceivecashbenefits(seeChapter3.3).
Table:LTC expenditure by source of funding and function, 2005–2013
In EUR million As a % of GDP Breakdown, in % Real growth, in %
Average annual real growth, in %
2005 2012 2013 2005 2012 2013 2005 2012 2013 2013/2012 2005–2013
Long-termcare 314 480 471 1.08 1.33 1.31 100.0 100.0 100.0 -2.6 3.2
By source of funding:
Publicexpenditure 245 349 342 0.84 0.94 0.95 77.8 72.7 72.5 -2.9 2.2
Privateexpenditure 70 131 130 0.24 0.33 0.36 22.2 27.3 27.5 -1.7 6.0
By function
Healthcare 230 327 314 0.79 0.87 0.90 73.3 68.5 67.9 0.5 2.9
Socialcare 84 153 157 0.29 0.40 0.44 26.7 32.1 33.3 1.5 6.1
Source:SURSLong-termcare(Release:December2015).Note:TheconversionintoconstantpriceswasmadeusingtheGDPimplicitpricedeflator.
Figure: Public expenditure on long-term (health and social) care as a share of GDP, 2013
Source:OECDHealthataGlance2015.Slovenia:SURS–Healthexpenditureandsourcesoffunding(June2015)andLong-termcare(December2015).
0
1
2
3
4
5
Net
herla
nds
Swed
en
Nor
way
Den
mark
Finlan
d
Japa
n
Fran
ce
Belgium
Switz
erland
Icelan
d
OEC
D-1
1
Luxe
mbo
urg
Austria
Cana
da
Ger
man
y
Slov
enia
Spain
Kore
a
U.S
tate
s
Portug
al
Israe
l
Poland
Czec
hR.
Hun
gary
Esto
nia
Gre
ece
Slov
akia
Asa%
ofG
DP
LTsocialcare LThealthcare
(OECDHealthataGlance2015). In termsofpublicLTCexpenditure(0.95%ofGDP),Sloveniaislaggingfurtherand further behind the OECD average (2013: 1.66%ofGDP).There is awidegap in the shareof long-termhealth care services (SI: 0.8% of GDP; OECD: 1.1% ofGDP;thesemainlyincludecommunitynursing,nursingallowances and institutional health care) and an evenwidergapinlong-termsocialservices(SI:0.1%ofGDP;OECD: 0.5% of GDP: particularly social care at home).WhilemoreadvancedOECDcountriesprimarilyincreasepublic fundingfor long-termcareathome,theratio inSlovenia is theopposite, as Slovenia increases fundingfor institutional care rather than care at home. As in2013asmuchas77.7%ofexpenditurewasallocatedforlong-termcareininstitutions(retirementhomes,specialsocialwelfareinstitutions,hospitals)andonly22.3%forlong-term care at home,2 the comprehensive systemicregulation of LTC fundingmust be devised as soon aspossible.

140 Development Report 2016Indicators of Slovenia’s development
stood at EUR 1.482 billion, which is less than in theprevious twoyears,but still accounts for29.3%ofPDIIrevenue.
Pension expenditure as a share of GDP in Slovenia is still below the EU average, but is rising faster than in the EU due to the rapid ageing of the population. According to the most recent data available, pensionexpenditure as a share of GDP3 remained belowthe EU average in 2012. While in the EU it was 1.2percentagepointshigher than in2008, itwasasmuchas 1.9 percentage points higher in Slovenia. Pensionexpenditure is expected to stabilise over themediumterm due to the ZPIZ-2 (The Pension and DisabilityInsuranceAct),beforestartingtoriseagainin2023andreaching the 2013 level by 2028.4Thismeans that thenew pension system does not ensure long-term fiscalsustainability; in contrast, pension expenditure for theEUasawholeisalsoprojectedtostayatthecurrentlevelinthelongterm.
3.12 Pension expenditurePension expenditure1 increased further in 2015 and the budget transfer to the pension fund2 also remains high. Pension expenditure, including the annualpension allowance, totalled EUR 4.305 billion andwasup 0.4% (expenditure excluding the annual allowancewasatthelevelof2014).In2015therewasonceagainno indexation of pensions. The number of old-agepensionersexpandedlessthaninpreviousyears(anetincreaseof5,800,which isnearly three times less thanthe average for 2010–2013) because the transitionperiods(thelastonewillexpirein2020)havecausedtheretirementconditionstobetightenedfromyeartoyearas the provisions of the pension reform become fullyapplicable. Expenditure on the annual allowance washigher,with the limit forannualallowanceentitlementraisedfromthepensionamountofEUR622toEUR750,this increase being financed by funds received fromKapitalskaDružba(EUR19million).Thebudgettransfer
1AccordingtothePDIIbalancesheets(source:MF),togetherwithannualpensionallowance.Whileitwaspreviouslyrecordedunderpensions,theannualpensionallowancewasincludedamongsocialsecuritytransfersin2015.Fordatacomparabilitypurposes,wehavetakenitintoaccountamongpensions.2TheRepublicofSloveniacoversthedifferencebetweenPDIIrevenues(fromcontributionsandothersources)andPDIIexpendituresbyfundsfromthestatebudgetandothersources.Theseincludeallfundsundertheitemof‘Transfersfromthestatebudget’ofthePDIIbalancesheets(MF).3AccordingtoESSPROSmethodology(theEuropeanSystemofIntegratedSocialProtectionStatistics).4The2015AgeingReport,2015.
Table:Share of the population aged 65 or more, employment rate of older workers, duration of working life and pension expenditure as a % of GDP
Share of the population aged 65+, in %
Employment rate of older workers (55–64 years) Duration of working life* Pension expenditure,
as a % of GDP**
2000 2008 2014 2000 2008 2014 2000 2008 2014 2000 2008 2013
Slovenia 13.9 16.3 17.5 24.0 34.2 38.4 31.8 34.0 34.1 11.0 9.5 11.7
EU N/A 17.1 18.5 N/A 47.9 55.9 32.9 34.3 35.3 N/A 11.3 N/A
Source:Eurostat,2015.Notes:N/A–datanotavailable;*Thenumberofyearsapersonaged15ormoreisexpectedtobeactiveonthelabourmarket;**AccordingtotheESSPROSmethodology.
Figure:Selected PDII revenues and expenditures, Slovenia
Source:BulletinofGovernmentFinance,PensionandDisabilityInsuranceInstituteoftheRepublicofSlovenia1992–2015,2016.
0
10
20
30
40
50
0
1000
2000
3000
4000
5000
2000 2001 2002 2003 2004 2005 2006 2007 2008 2009 2010 2011 2012 2013 2014 2015
Sharein%
InEURm
ShareoffundsfromthestatebudgetinPDIIrevenue PDIIrevenue:Socialsecuritycontributions PDIIexpenditure:Pensions

141Development Report 2016Indicators of Slovenia’s development
The structure of disposable income shows that Slovenian households earn more income from employment and less from property than the average EU household. Owing to the deterioration in labourmarket conditions, in 2008–2014 the share of incomefrom employment (compensation of employees)declinedslightlymoreinSloveniathantheEUaverage,butremained larger.1Theshareofsocial transfersdoesnotdiffersignificantlyfromtheEUaverage.ItsincreaseduringthecrisiswasalsosimilartothatintheEU.Ontheotherhand,SloveniadivergessignificantlyfromtheEUaverageintermsofitsshareofincomefromproperty(in2014thissharetotalled2.3%inSloveniaandanaverageof12.2%intheEU).
3.13 Gross adjusted disposable income per capitaGross adjusted disposable income per capita rose in 2014 after the slowdown in its growth at the onset of the crisis and a decline in 2012 and 2013.Atthebeginningof the crisis the growth of gross disposable incomeslowedasaconsequenceofalargerdeclineineconomicactivity and a steeper fall in employment than the EUaverage. In 2012 and 2013 gross adjusted disposableincomecontracted,notonlyowingtoloweremploymentand wages but also due to austerity measures in theareaofsocialtransfers.Withtheimprovementinlabourmarket conditions, gross adjusted disposable incomeincreasedin2014.InrelationtotheEU,Sloveniareachedthehighestlevelofgrossdisposableincomepercapitain PPS in 2008, 83.5%,whichwas awider gap than ineconomicdevelopmentasmeasuredbyGDPinPPS(89%of theEUaverage).With theeconomic crisis andfiscalconsolidation measures, Slovenia’s gap in disposableincomehadrisento22percentagepointsby2014(thelatest figure available), which is a 5-percentage-pointwider gap than that for economic development (seeindicator2.1).
Figure:Gross adjusted disposable income of households and NPISHs in PPS per capita in Slovenia and selected EU countries, in 2014
Source:EurostatPortalPage–Annualsectoraccounts.
0
5,000
10,000
15,000
20,000
25,000
30,000
Rom
ania
Latvia
Croa
tia
Esto
nia
Hun
gary
Gre
ece
Lith
uania
Slov
akia
Slov
enia
Cypr
us
Portug
al
Spain
Italy
U.K
ingd
om
Den
mark
Swed
en
Belgium
Fran
ce
Austria
Ger
man
y
InPPS
per
cap
ita
Table:Gross adjusted disposable income of households and NPISHs per capita, Slovenia and the EU average, year-on-year growth rates, in %
2000 2005 2007 2008 2009 2010 2011 2012 2013 2014 2015
Slovenia 5.5 6.5 7.7 8.9 0.3 0.5 1.8 -2.8 -1.3 1.1 0.3
EU 6.7 3.7 4.3 1.3 -1.4 2.5 1.6 1.9 0.3 2.0 N/ASource:SURSandEurostatPortalPage–AnnualSectorAccounts.Note:*accordingtothequarterlynon-financialsectoraccounts,N/A–datanotavailable.
1InSloveniaittotalled81.4%ofdisposableincomein2014;intheEUasawhole,76.5%.
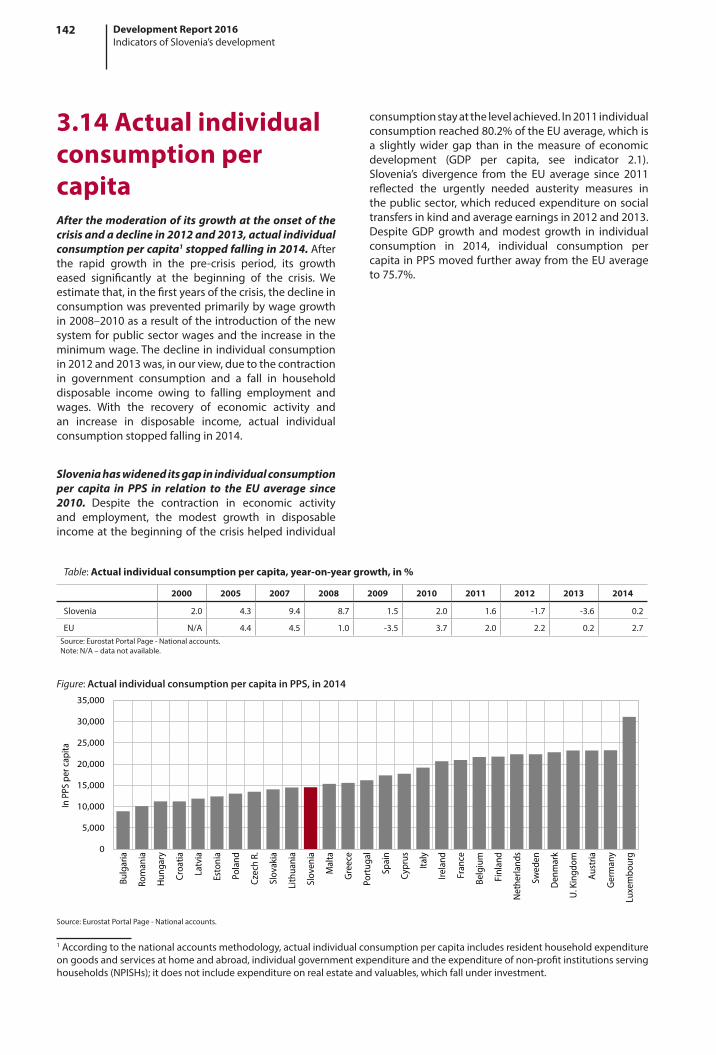
142 Development Report 2016Indicators of Slovenia’s development
consumptionstayatthelevelachieved.In2011individualconsumptionreached80.2%oftheEUaverage,whichisa slightlywider gap than in themeasure of economicdevelopment (GDP per capita, see indicator 2.1).Slovenia’s divergence from the EU average since 2011reflected the urgently needed austerity measures inthepublicsector,whichreducedexpenditureonsocialtransfersinkindandaverageearningsin2012and2013.Despite GDP growth andmodest growth in individualconsumption in 2014, individual consumption percapitainPPSmovedfurtherawayfromtheEUaverageto75.7%.
Figure: Actual individual consumption per capita in PPS, in 2014
Source:EurostatPortalPage-Nationalaccounts.
0
5,000
10,000
15,000
20,000
25,000
30,000
35,000
Bulgar
ia
Rom
ania
Hun
gary
Croa
tia
Latvia
Esto
nia
Poland
Czec
hR.
Slov
akia
Lith
uania
Slov
enia
Malta
Gre
ece
Portug
al
Spain
Cypr
us
Italy
Ireland
Fran
ce
Belgium
Finlan
d
Net
herla
nds
Swed
en
Den
mark
U.K
ingd
om
Austria
Ger
man
y
Luxe
mbo
urg
InPPS
per
cap
ita
3.14 Actual individual consumption per capita After the moderation of its growth at the onset of the crisis and a decline in 2012 and 2013, actual individual consumption per capita1 stopped falling in 2014. Afterthe rapid growth in the pre-crisis period, its growtheased significantly at the beginning of the crisis. Weestimatethat,inthefirstyearsofthecrisis,thedeclineinconsumptionwaspreventedprimarilybywagegrowthin2008–2010asaresultoftheintroductionofthenewsystemforpublicsectorwagesandthe increase in theminimumwage.Thedeclineinindividualconsumptionin2012and2013was,inourview,duetothecontractionin government consumption and a fall in householddisposable income owing to falling employment andwages. With the recovery of economic activity andan increase in disposable income, actual individualconsumptionstoppedfallingin2014.
Slovenia has widened its gap in individual consumption per capita in PPS in relation to the EU average since 2010. Despite the contraction in economic activityand employment, the modest growth in disposableincomeatthebeginningofthecrisishelpedindividual
Table:Actual individual consumption per capita, year-on-year growth, in %
2000 2005 2007 2008 2009 2010 2011 2012 2013 2014
Slovenia 2.0 4.3 9.4 8.7 1.5 2.0 1.6 -1.7 -3.6 0.2
EU N/A 4.4 4.5 1.0 -3.5 3.7 2.0 2.2 0.2 2.7Source:EurostatPortalPage-Nationalaccounts.Note:N/A–datanotavailable.
1Accordingtothenationalaccountsmethodology,actualindividualconsumptionpercapitaincludesresidenthouseholdexpenditureongoodsandservicesathomeandabroad,individualgovernmentexpenditureandtheexpenditureofnon-profitinstitutionsservinghouseholds(NPISHs);itdoesnotincludeexpenditureonrealestateandvaluables,whichfallunderinvestment.

143Development Report 2016Indicators of Slovenia’s development
3.15 Income inequalityDespite the increase in income inequality indictors in 2008–2014, Slovenia is one of the countries with the lowest income inequality rates in the EU. SloveniahasthesecondlowestrateofincomeinequalityinEuropeasmeasuredbytheGinicoefficient,andthethirdlowestrateasmeasuredbythequintileshareratio(80/20).In2014theGinicoefficientroseby0.6percentagepointsto 25% while income inequality as measured by theincome quintile share ratio (80/20) increased by 0.1percentagepointsto3.7.Intheperiod2008–2014theGinicoefficientwasup1.6percentagepointsandtheincomequintileratiowasup0.3percentagepoints.
The increase in income inequality during the crisis was attributable to a decline in income1 in lower income brackets. It reflectedtheeconomiccrisis,fiscalconsolidationmeasuresandchangestosociallegislation2implemented in2012.Since2007, theshareof incomeperfamilymemberinthelowestquintilehaddecreasedby0.8percentagepoints,whilethecorrespondingshareinthehighestquintilehadincreasedby1.0percentagepoints.Regardingthedeciles,thebottomincomedecilesexperienced the largest decline and the top incomedecilesthelargestincreaseinincomeduringthecrisis.
Figure: Income inequality indicators, Gini and 80/20, 2014
Source:Eurostat.
0
2
4
6
8
10
0
10
20
30
40
50
Slov
akia
Slov
enia
Czec
hR.
Swed
en
Neth
erland
s
Finlan
d
Belgium
Austria
Denm
ark
Malta
Hung
ary
Germ
any
Ireland
Fran
ce
U.Kingd
om
Luxe
mbo
urg EU
Poland
Croa
tia
Cypr
us
Italy
Esto
nia
Spain
Rom
ania
Portu
gal
Gree
ce
Lith
uania
Latvia
Bulgar
ia
80/2
0ratio
Ginico
effic
ient
Gini(leftaxis) 80/20(rightaxis)
Table:Income inequality indicators, 80/20 and Gini
2005 2006 2007 2008 2009 2010 2011 2012 2013 2014
80/20Slovenia 3.4 3.4 3.3 3.4 3.2 3.4 3.5 3.4 3.6 3.7
EU 5.0 5.0 5.0 5.0 4.9 4.9 5.0 5.0 5.0 5.2
GiniSlovenia 23.8 23.7 23.2 23.4 22.7 23.8 23.8 23.7 24.4 25.0
EU 30.6 30.3 30.6 30.9 30.5 30.4 30.8 30.4 30.5 31.0
Source:Eurostat.Note:Until2009,datafortheEU-27,since2010,datafortheEU-28.DataforIrelandandEstoniaarenotyetavailable.
1Theindicatorsofincomeinequalityfor2014arecalculatedonthebasisofincomedistributionin2013.2In2012theExerciseofRightstoPublicFundsActstartedtobeimplemented.

144 Development Report 2016Indicators of Slovenia’s development
3.16 Life satisfactionIn autumn 2015, life satisfaction1 in Slovenia exceeded the long-term average for the first time in six years, approaching the levels seen before the crisis. AccordingtotheStandardEurobarometersurvey,Slovenianshavebeenmoresatisfiedwith their lives thanpeople in theEUasawholeinalltheyearsofmeasurement;2however,the EU average had already exceeded its long-termaverage in spring 2014. General life satisfaction is stillhighest in thenorthernEUMemberStates.The resultsof the autumn 2015 measurement already reflect theconsequencesofmigrationpressures.
In autumn 2015 satisfaction increased in all four areas measured by the Eurobarometer: household financial situation, personal employment situation, and employment and economic situation in the country. Slovenian respondents are still themost satisfiedwiththefinancialsituationoftheirhouseholds(64%),whereinautumn2015satisfactionalsoexceededthelevelseenbefore the crisis. They are the least satisfied with theemploymentsituationinthecountry(7%).Ontheotherhand,theiroptimisticexpectations3droppedinallareasexceptthepersonalemploymentsituation.
Figure: Life satisfaction, in %
Source:Eurobarometer.
0
20
40
60
80
100
120
Den
mark
Swed
en
Finlan
d
Luxe
mbo
…
Net
herla
nds
Ireland
Belgium
Malta
U.K
ingd
om
Ger
man
y
Slov
enia
Fran
ce
Austria
Poland
Czec
hR.
Cypr
us EU
Esto
nia
Spain
Lith
uania
Croa
tia
Latvia
Slov
akia
Italy
Hun
gary
Rom
ania
Portug
al
Bulgar
ia
Gre
ece
Autu
mn20
15
Autumn2015 Autumn2008
Table:Life satisfaction, in %
Autumn 2008
Spring 2009
Autumn 2009
Spring 2010
Autumn 2010
Spring 2011
Autumn 2011
Spring 2012
Autumn 2012
Spring 2013
Autumn 2013
Spring 2014
Autumn 2014
Spring 2015
Autumn 2015
Slovenia 85 86 86 85 85 83 83 85 85 85 79 84 81 81 87
EU 76 77 78 78 78 79 75 77 76 75 75 80 79 80 81Source:Eurobarometer.Note:Inthecaseoftwoannualmeasurements,theannualaverageistakenintoaccount.
1TheEurobarometermeasureslifesatisfactionwiththefollowingquestion:Allthingsconsidered,howsatisfiedwouldyousayyouarewithyourlifethesedays?Thepossibleanswersare:verysatisfied,satisfied,dissatisfiedandverydissatisfied.Inouranalysis,thecategoryofsatisfiedpeopleincludesthosewhoareverysatisfiedandsatisfied.2AfterSlovenia’saccessiontotheEU,sinceOctober2004lifesatisfactionhasbeenmeasuredbytheStandardEurobarometersurveytwiceayear.3Theproportionofthoseexpectingthingstoimprove.
In the results of the autumn 2015 survey, the issue of migration stands out and has probably also affected evaluations of satisfaction. Migration may partlyexplain the relatively significant increase in the levelof life satisfaction in Slovenia: on the basis of theirown experiences with migration or seeing pictures ofmigrants,peoplemayhaveadjustedtheirexpectationsandcriteriaforevaluatinglifesatisfactionandaremoresatisfied with what that have (crisis adaptation), aswhatuntilrecentlyhasbeenseenasthemainproblemnow appears less acute. When asked about the twomost important issues currently facing the country,respondentsstressedimmigrationasthemainproblem(48% of respondents), which has therefore overtakenunemployment (41%) and the economic situation(27%), the issues thathadpreviouslybeenseenas themainconcerns. Inevaluationsofthemainissuesatthepersonal leveltherewerenosignificantchanges inthelastmeasurement.

145Development Report 2016Indicators of Slovenia’s development
futureand,inturn,tothesustainablefinancingofhealthandlong-termcareinthelongterm.
Slovenia is also narrowing its gap with the EU average as regards expected healthy life years at the age of 65.InSloveniaapersonaged65canexpecttoliveanother7.4years inahealthystate,comparedwith8.6years intheEU.Afewyearsagothegapwasmuchwider.Duringthe crisis the number of healthy life years at the ageof65 roseslightly inSloveniabutdeclinedonaveragein the EU. The favourable movement of this indicatorin Slovenia is in all likelihood the result of successfulpreventive health care programmes for elderly peopleandtherelativelyhighlevelofaccesstohealthservices,whichwasalsopreservedduringthecrisis (seesection3.2).
3.17 Healthy life yearsPeople in Slovenia can expect slightly more than 58 years of healthy life,1 which is significantly below the EU average, but the gap has been closing despite the crisis. Accordingtothelatestdataavailable,agirlbornin 2013 can expect 59.5 years of healthy life, whilea boy can expect 57.6 years. Despite the crisis, thenumberofexpectedhealthylifeyearsrosesignificantlyin Slovenia in 2013 and the gap in relation to the EUnarrowedslightly.However,thisindicatorisderivedfromsubjectiveperceptionsof limitations indaily livingandsotheresultsmayalsoreflect thegreatersensitivityofthepopulationinevaluatingtheirownsituation.
The ratio of life expectancy to the number of healthy life years has improved in the last years but remains one of the lowest in the EU. People in Slovenia spendonly 73% of their lives free from any limitation (inthe EU: 76%), which leads to early retirement andincreased expenditure on health and long-term care. Thenarrowingofthegapbetweenlifeexpectancyandthe number of healthy life years would significantlycontribute to slowergrowth inhealth spending in the
1Theindicatorofhealthylifeyearsmeasuresthenumberofremainingyearsthatapersonofaspecificageisexpectedtolivewithoutdisability or activity limitations. This is a composite indicator, which combines mortality and health status data. The estimate ofdisability/activitylimitationsisbasedontheGlobalActivityLimitationIndicator(GALI),which,withintheEU-SILCsurvey,measurestheself-perceivedlimitationspeoplehaveexperienced–becauseofhealthproblems–incarryingouttheireverydayactivitiesforatleastsixmonths.InMarch2012Eurostatrevisedthedataandrecalculatedtheseriesfrom2004to2010.ForSlovenia,thetranslationoftheEU-SILCsurveyquestiononlimitationswascorrectedin2010,sothatonlythetimeseriesfrom2010onwardsisinfactcomparable.
Table:Healthy life years at birth and at age 65
Healthy life years at birth Healthy life years at age 65
Women Men Women Men
2010 2011 2012 2013 2010 2011 2012 2013 2010 2013 2010 2013
Slovenia 54.6 53.8 55.6 59.5 53.4 54.0 56.5 57.6 7.2 7.6 6.6 7.2
EU 62.6 62.1 62.1 61.5 61.8 61.7 61.5 61.4 8.8 8.6 8.7 8.5
Source:EurostatDatabase;OECDHealthataGlance2014.
Figure: Ratio of life expectancy to the number of healthy life years, 2013, in %
Source:EurostatDatabase–PopulationandSocialConditions–Health–PublicHealth,2016;EurostatDatabase–PopulationandSocialConditions–Population–Demography–Mortality,2016.
50
55
60
65
70
75
80
85
90
95
Finlan
d
Ger
man
y
Slov
akia
Latvia
Esto
nia
Slov
enia
Net
herla
nds
Austria
Italy
Den
mark
Croa
tia EU
Spain
Fran
ce
Luxe
mbo
urg
Rom
ania
Portug
al
Cypr
us
Hun
gary
Poland
Belgium
U.K
ingd
om
Gre
ece
Lith
uania
Czec
hR.
Swed
en
Ireland
Nor
way
Bulgar
ia
Malta
Shareof
hea
lthylifeye
arsi
nlifeex
pectan
cy

146 Development Report 2016Indicators of Slovenia’s development
3.18 Share of population with at least upper secondary educationSlovenia has a relatively large share of adults aged 25–64 years with at least upper secondary education,1and this figure is rising further. According to the labourforcesurvey (for thesecondquarter), itstoodat86.5%in2015,whichishigherthantheEUaverage.Inthelasttenyears,itrosethemostinthemiddle-age(45–54yearolds)andtheoldestage(55–64yearolds)groups,whichis linked to the transition of younger, more educatedpopulations into higher age groups. The share ofadultsaged25–64yearswithat leastuppersecondaryeducationisabovetheEUaverageinallagegroups.Theshare of thepopulationwith at least upper secondaryeducationishigherformenthanwomen,althoughthegendergaphasnarrowedinthelastdecade.
The share of young people (20–24 years) with at least upper secondary education has remained more or less unchanged in the last ten years. In2015 itwasalmostthesameasoneyearpreviouslyandhigherthantheEUaverage(Slovenia:90.1%;EU:82.3%).Thislargeshareis
1Theterm'atleastuppersecondaryeducation'includesuppersecondaryandtertiaryeducation.2AccordingtotheScholarshipAct(Zakonoštipendiranju/ZŠtip-1),whichwasadoptedin2013andenteredintoforcein2014.3Youngpeopleaged18–24yearswithatmostlowersecondaryeducationwhoarenotengagedinfurthereducationortraining.4In2015ittotalled93.4%forwomenand86.8%formen.
Figure:Share of young people (20–24 years) with at least upper secondary education, 2nd quarter, 2015, in %
Source:EurostatPortalPage–PopulationandSocialConditions–Educationandtraining,2016.
0
10
20
30
40
50
60
70
80
90
100
Croa
tia
Cypr
us
Ireland
Poland
Slov
akia
Slov
enia
Lith
uania
Czec
hR.
Gre
ece
Aus
tria
Swed
en
Fran
ce
U.K
ingd
om
Bulgar
ia
Hun
gary
Latvia
Belgium
Finlan
d EU
Esto
nia
Italy
Rom
ania
Net
herla
nds
Ger
man
y
Malta
Portug
al
Den
mark
Spain
Luxe
mbo
urg
In%
Table:Share of adult population aged 25–64 with at least upper secondary education, 2nd quarter of the year, in %
2000 2005 2008 2009 2010 2011 2012 2013 2014 2015
Slovenia 74.8 80.5 81.6 83.1 83.5 84.8 85.1 85.6 85.7 86.5
EU N/A 68.9 71.1 71.7 72.4 73.1 74.0 74.9 75.6 76.1
Source:EurostatPortalPage–Populationandsocialconditions–Educationandtraining,2016.Note:N/A–datanotavailable.
related to thehighparticipationofyoungpeople (15–19) in upper secondary education,which has hoveredaround 78% for several years and is above the EUaverage.The financial accessibility of upper secondaryeducationincreasedin2014thankstothereintroductionof state scholarships for underage pupils.2 The shareof early school-leavers3 rose to 4.4% in 2015, but wasbelow both the EU average (11.1%) and the nationaltarget (5.0%).The share of youngpeoplewith at leastuppersecondaryeducationremainedroughlythesamethroughoutthecrisis,whichisalsoexpectedtocontinuein the future.There isnevertheless still some room forimprovement in theshareofmen,which is lower thanforthecorrespondingshareofwomen,4alsoowingtoamuchlargershareofearlyschool-leavers.

147Development Report 2016Indicators of Slovenia’s development
3.19 At-risk-of-poverty rate In 20141 the at-risk-of-poverty rate in Slovenia remained the highest in the last ten years, albeit still lower than the EU average. In2014 it remainedthesameas in theprevious year (14.5% or around 290,000 persons). Itdeclined slightly for the most vulnerable populationgroups(householdswithchildren,one-personhouseholdsolder than 65, unemployed people), in our estimationdue to changes to social2 and pension legislation.3 Theat-risk-ofpovertyrateincreasedthemostforone-personhouseholdsyounger than65. In termsofactivity status,the risk of poverty increased only in the‘other inactivepersons’ group,whichwe estimatewas also due to themorerestrictiveeligibilitycriteriaforsocialassistanceafterthesociallegislationreformenteredintoforce.
The relative at-risk-of-poverty gap4 thus rose from 20.2% to 22.0% in comparison with the previous year and was the widest since the beginning of the crisis.The
1Theat-risk-of-povertyratefor2014iscalculatedbasedonincomefrom2013.2Zakonouveljavljanjupravicizjavnihsredstev(ExerciseofRightstoPublicFundsAct/ZUPJS,OfficialGazetteoftheRS,No.62/2010),whichenteredintoforceon1January2012.3Zakonopokojninskemininvalidskemzavarovanju/PensionandDisabilityInsuranceAct(ZPIZ-2),OfficialGazetteoftheRS,No.96/2012,whichenteredintoforceon1January2013.4Therelativeat-risk-of-povertygapisthedifferencebetweentheat-risk-of-povertythresholdandthemedianequivaliseddisposableincomeofpeoplebelowtheat-risk-of-povertythreshold,expressedasapercentageoftheat-risk-ofpovertythreshold.Theat-risk-of-povertygapshowsthedepthofpoverty,i.e.thedistancefromtheat-risk-of-povertythreshold.5Theat-risk-of-povertythresholdisdefinedas60%ofmediandisposableincome.
Figure:At-risk-of-poverty rate, 2014
Source:Eurostat.
0
5
10
15
20
25
30
Czec
hR.
Neth
erland
s
Den
mark
Slov
akia
Finlan
d
Fran
ce
Austria
Cypr
us
Slov
enia
Hung
ary
Swed
en
Ireland
Belgium
Malta
Luxe
mbo
urg
Germ
any
U.Kingd
om
Poland EU
Lith
uania
Croa
tia
Italy
Portu
gal
Latvia
Bulgar
ia
Esto
nia
Gree
ce
Spain
Rom
ania
In%
Table:At-risk-of-poverty rate, in %
2005 2006 2007 2008 2009 2010 2011 2012 2013 2014
Slovenia 12.2 11.6 11.5 12.3 11.3 12.7 13.6 13.5 14.5 14.5
EU 16.5 16.5 16.5 16.5 16.4 16.4 16.8 16.8 16.6 17.2
Source:Eurostat.Note:EU-27until2009,since2010EU-28.
median income of people below the poverty thresholddeclined by another EUR 7. The at-risk-of-povertythreshold5 rose by EUR 3 per month owing to a slightincreaseintheaveragehouseholddisposableincome.

148 Development Report 2016Indicators of Slovenia’s development
3.20 Material deprivationThe material deprivation rate (i.e. deprivation in at least three of the nine items1 ) rose slightly in Slovenia in 2014. In2014itincreasedby0.2percentagepointsto17.2%,butwasstill lowerthantheEUaverage(18.6%).Theshareofmateriallydeprivedpeoplewassignificantlyhigheramongthoselivingbelowtheat-risk-of-povertythreshold (45%), up 1.8 percentage points over oneyear earlier. The severe material deprivation rate (i.e.deprivation in four of the nine items) in 2014 wassomewhatlowerthanin2013.
The shares of households that cannot afford a car (4.3%) and have difficulty paying housing-related bills (22.5%) were higher in 2014 than in 2013 and the highest in ten years. The shares of thosewho cannotkeeptheirhomeadequatelywarmoraffordaone-weekannualholidayawayfromhomewerealsohigherthanforthepreviousyear,buthadbeenevenhigherduringthecrisis.Theshareofthosewhocannotaffordamealwithmeat, or a vegetarian equivalent, was the lowest
1Thesearetheability(1)todealwithunexpectedexpenses; (2)toaffordaone-weekannualholidayawayfromhome;(3)toaffordadequatemeals;(4)topayforarrears(mortgageorrent,utilitybillsorhirepurchaseinstalments);(5)tokeepone’shomeadequatelywarm,(6)toaffordawashingmachine,(7)toaffordacolourTV;(8)toaffordatelephone/mobile;(9)toaffordapersonalcar.Severematerialdeprivationinatleastfouroutoftheninematerialdeprivationitems.2Theshareofhouseholdsabletohandle,fromtheirownresources,unexpectedfinancialexpensesintheamountofEUR440for2007andEUR600for2013or2014.
Figure:Material deprivation, 2014
Source:Eurostat.Note:EU-27until2009,since2010EU-28.
0
5
10
15
20
25
30
35
40
45
50
Swed
en
Luxe
mbo
urg
Denm
ark
Finlan
d
Neth
erland
s
Austria
Germ
any
Belgium
Fran
ce
U.Kingd
om
Esto
nia
Czec
hR.
Slov
enia
Spain EU
Malta
Poland
Slov
akia
Ireland Italy
Portu
gal
Lith
uania
Croa
tia
Latvia
Cypr
us
Gree
ce
Hung
ary
Rom
ania
Bulgar
ia
Table:Material-deprivation rate, in %
2005 2006 2007 2008 2009 2010 2011 2012 2013 2014
Material deprivation (in at least 3 items out of 9)
Slovenia 14.7 14.4 14.3 16.9 16.2 15.8 17.2 16.9 17.0 17.2
EU 20.0 19.2 18.1 17.5 17.4 17.8 18.5 19.8 19.6 18.6
Severe material deprivation (in at least 4 items out of 9)
Slovenia 5.1 5.1 5.1 6.7 6.1 5.9 6.1 6.6 6.7 6.6
EU 10.8 9.9 9.2 8.5 8.2 8.4 8.9 9.9 9.6 9.0Source:Eurostat.Note:EU-27until2009,since2010EU-28.
in ten years at 7.9%. The shares of people unable toafford durable goods of small value and to deal withunexpected expenses2 remain at the previous year’slevel(45.8%),whichis4.2percentagepointshigherthanin2007.Almostallhouseholdscanaffordatelephone,acolourTVandawashingmachine,theirsharesequallingthosein2008.

4 Environmental, regional and spatial developmentEnvironmental development• 4.1Greenhousegasemissions• 4.2Energyefficiency• 4.3Emission-intensiveindustries• 4.4Renewableenergysources• 4.5Shareofroadtransportintotalfreighttransport• 4.6Waste• 4.7Agriculturalintensity• 4.8Intensityoftreefelling• 4.9Environmentaltaxes
Regional development• 4.10RegionalvariationinGDPpercapita• 4.11Regionalvariationintheregisteredunemploymentrate
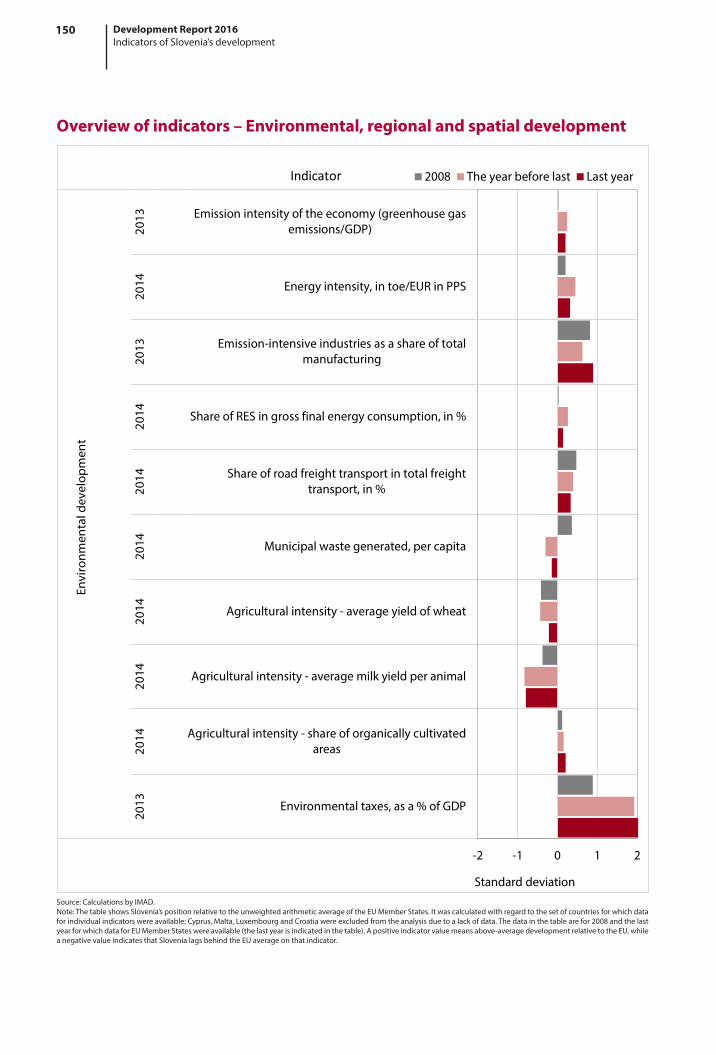
150 Development Report 2016Indicators of Slovenia’s development
-2 -1 0 1 2
Environmentaltaxes,asa%ofGDP
Agriculturalintensity-shareoforganicallycultivatedareas
Agriculturalintensity-averagemilkyieldperanimal
Agriculturalintensity-averageyieldofwheat
Municipalwastegenerated,percapita
Shareofroadfreighttransportintotalfreighttransport,in%
ShareofRESingrossfinalenergyconsumption,in%
Emission-intensiveindustriesasashareoftotalmanufacturing
Energyintensity,intoe/EURinPPS
Emissionintensityoftheeconomy(greenhousegasemissions/GDP)
2013
2014
2014
2014
2014
2014
2014
2013
2014
2013
Enviro
nmen
tald
evelop
men
t
Standarddeviation
2008 Theyearbeforelast LastyearIndicator
Overview of indicators – Environmental, regional and spatial development
Source:CalculationsbyIMAD.Note:ThetableshowsSlovenia’spositionrelativetotheunweightedarithmeticaverageoftheEUMemberStates.Itwascalculatedwithregardtothesetofcountriesforwhichdataforindividualindicatorswereavailable;Cyprus,Malta,LuxembourgandCroatiawereexcludedfromtheanalysisduetoalackofdata.Thedatainthetablearefor2008andthelastyearforwhichdataforEUMemberStateswereavailable(thelastyearisindicatedinthetable).Apositiveindicatorvaluemeansabove-averagedevelopmentrelativetotheEU,whileanegativevalueindicatesthatSlovenialagsbehindtheEUaverageonthatindicator.
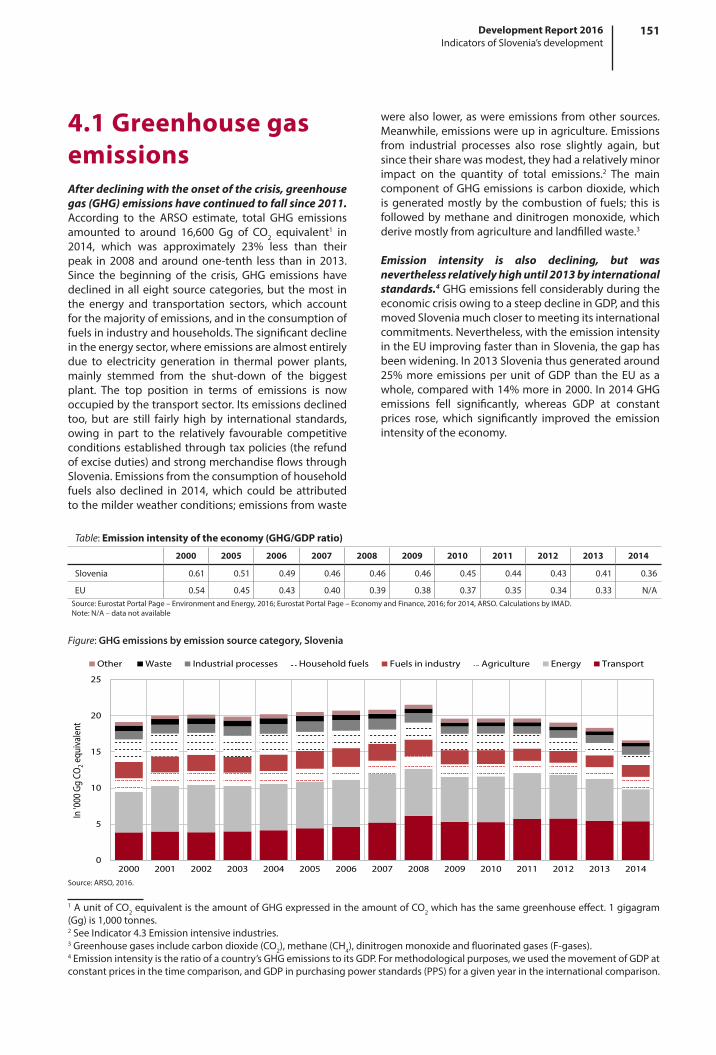
151Development Report 2016Indicators of Slovenia’s development
4.1 Greenhouse gas emissionsAfter declining with the onset of the crisis, greenhouse gas (GHG) emissions have continued to fall since 2011. According to the ARSO estimate, total GHG emissionsamounted to around 16,600 Gg of CO2 equivalent
1 in2014, which was approximately 23% less than theirpeak in 2008 and aroundone-tenth less than in 2013.Since the beginning of the crisis, GHG emissions havedeclined inalleightsourcecategories,butthemost inthe energy and transportation sectors, which accountforthemajorityofemissions,andintheconsumptionoffuelsinindustryandhouseholds.Thesignificantdeclineintheenergysector,whereemissionsarealmostentirelydue to electricity generation in thermal power plants,mainly stemmed from the shut-down of the biggestplant. The top position in terms of emissions is nowoccupiedbythetransportsector.Itsemissionsdeclinedtoo, but are still fairly high by international standards,owing in part to the relatively favourable competitiveconditionsestablishedthroughtaxpolicies (therefundofexciseduties)andstrongmerchandiseflowsthroughSlovenia.Emissionsfromtheconsumptionofhouseholdfuels also declined in 2014,which could be attributedtothemilderweatherconditions;emissionsfromwaste
1AunitofCO2equivalentistheamountofGHGexpressedintheamountofCO2whichhasthesamegreenhouseeffect.1gigagram(Gg)is1,000tonnes.2SeeIndicator4.3Emissionintensiveindustries.3Greenhousegasesincludecarbondioxide(CO2),methane(CH4),dinitrogenmonoxideandfluorinatedgases(F-gases).4Emissionintensityistheratioofacountry’sGHGemissionstoitsGDP.Formethodologicalpurposes,weusedthemovementofGDPatconstantpricesinthetimecomparison,andGDPinpurchasingpowerstandards(PPS)foragivenyearintheinternationalcomparison.
Figure:GHG emissions by emission source category, Slovenia
Source:ARSO,2016.
0
5
10
15
20
25
2000 2001 2002 2003 2004 2005 2006 2007 2008 2009 2010 2011 2012 2013 2014
In'0
00G
gCO
2eq
uiva
lent
Other Waste Industrialprocesses Householdfuels Fuelsinindustry Agriculture Energy Transport
Table:Emission intensity of the economy (GHG/GDP ratio)
2000 2005 2006 2007 2008 2009 2010 2011 2012 2013 2014
Slovenia 0.61 0.51 0.49 0.46 0.46 0.46 0.45 0.44 0.43 0.41 0.36
EU 0.54 0.45 0.43 0.40 0.39 0.38 0.37 0.35 0.34 0.33 N/ASource:EurostatPortalPage–EnvironmentandEnergy,2016;EurostatPortalPage–EconomyandFinance,2016;for2014,ARSO.CalculationsbyIMAD.Note:N/A–datanotavailable
werealso lower,aswereemissions fromothersources.Meanwhile,emissionswereupinagriculture.Emissionsfrom industrial processes also rose slightly again, butsincetheirsharewasmodest,theyhadarelativelyminorimpact on the quantity of total emissions.2 The maincomponentofGHGemissions iscarbondioxide,whichisgeneratedmostlyby thecombustionof fuels; this isfollowedbymethaneanddinitrogenmonoxide,whichderivemostlyfromagricultureandlandfilledwaste.3
Emission intensity is also declining, but was nevertheless relatively high until 2013 by international standards.4GHGemissionsfellconsiderablyduringtheeconomiccrisisowingtoasteepdeclineinGDP,andthismovedSloveniamuchclosertomeetingitsinternationalcommitments.Nevertheless,withtheemissionintensityintheEUimprovingfasterthaninSlovenia,thegaphasbeenwidening.In2013Sloveniathusgeneratedaround25%moreemissionsperunitofGDP than theEUasawhole,comparedwith14%morein2000.In2014GHGemissions fell significantly, whereas GDP at constantprices rose, which significantly improved the emissionintensityoftheeconomy.

152 Development Report 2016Indicators of Slovenia’s development
Final energy consumption2 in Slovenia is significantly affected by strong energy consumption in transport and, in recent years, lower consumption of energy for heating. In the period 2005–2014 final energyconsumptionfelltwiceasslowlyinSloveniathanintheEU. The energy consumed by industry fell faster,3 butthe improvementwas cancelled out by higher energyconsumptionintransport,4whichwasmainlyattributableto increasing freight transit through Slovenia.5 Annualfluctuationswere,inadditiontoeconomicactivity,alsoinfluenced by excise policy.6The decline in householdconsumptionofenergyforheatinginthepastfewyearshas been attributable primarily to the installation ofheatdistributionsystemsinmulti-dwellinghousesandincreasingly efficient heating appliances; the steep fallin 2014 was also due to the unusually warm weatherduringtheheatingseason.7
4.2 Energy efficiencyDespite the decline in primary energy consumption, energy intensity1 has remained relatively high in recent years. One of the targets of the EU climateand energy package for 2020 is a 20% reduction inenergy consumption with regard to the anticipatedconsumption according to the baseline scenario, withno additional measures. The Member States set theirnational unbinding targets according to their ownscenarios.ThreequartersofEUcountriesarerequiredtoreducetheirenergyconsumptionby2020,whilesome,includingSlovenia, are required to limit ananticipatedstrong increase. As EU Member States are well ontrack tomeet their2020targets,moreambitiousgoalshave already been set for 2030.The decline in energyconsumption in Slovenia mainly reflected the weakeconomicactivity,alongsidetheclimatechangesinthepast two years, with higher annual temperatures andlower consumption of energy for heating.The declineinenergyconsumption is impededbythehighenergyconsumption in transport. Having mostly convergedtowards theEUaverageuntil 2007, energy intensity inSlovenia has sincebeen fallingmore slowly. In 2014 itwasaquarterhigherthantheEUaverage.
1EnergyintensityistheratioofenergyconsumptiontoGDPinpurchasingpowerstandards(PPS).2Finalenergyconsumptionincludestheconsumptionofprimaryenergyreducedbyenergyfortransformations,ownuseandlosses.3ThereductioninSloveniawasmainlyduetothetransitiontoalessenergy-intenseprocessofaluminiumproduction.4LiquidfuelssoldinSloveniaareincludedintheSlovenianenergybalance,regardlessofwherethebuyerisfromorinwhichcountrythefuelisused.5Seealsoindicator4.6ShareofRoadTransportinTotalFreightTransport.6 In2009,2010andsince2013, thepriceof fuels inSloveniahasbeenhigherthan inneighbouringcountries,whichhasalsobeenreflectedinlowersalesinSlovenia.7AccordingtotheSlovenianEnvironmentAgency,2014wasthewarmestyearsince1850,whichiswhencontinuousmeteorologicalmeasurementsbegan.
Figure: Final energy consumption by consumer sector in Slovenia and the EU
Source:EurostatPortalPage–EnvironmentandEnergy,2015;calculationsbyIMAD.
70
80
90
100
110
120
130
140
2005 2006 2007 2008 2009 2010 2011 2012 2013 2014
Inde
x,20
05=1
00
FinalenergyconsumptionSlIndustrySITransportSIHouseholds,servicesSI
70
80
90
100
110
120
130
140
2005 2006 2007 2008 2009 2010 2011 2012 2013 2014
Inde
x,20
05=1
00
FinalenergyconsumptionEUIndustryEUTransportEUHouseholds,servicesEU
Table:Primary energy consumption, fixed-base index 2005=100
2005 2008 2009 2010 2011 2012 2013 2014 2020 target*
Slovenia 100.0 106.5 97.3 101.7 102.8 98.8 96.3 93.1 104.2
EU 100.0 98.8 93.4 96.7 93.0 92.5 91.6 88.0 86.6
Source:EurostatPortalPage–Europe2020indicators,2014;ECEnergyEfficiency,Reportingtargets;calculationsbyIMAD.Note:*Oneofthethree20-20-20environmentaltargetsoftheEU.

153Development Report 2016Indicators of Slovenia’s development
in the EU.2 Given the greater significance of emission-intensive industries and thehigher energy intensity inmanufacturinginSloveniathanintheEUasawhole,3theimpact of emissions trading on production costs and,consequently, business results and competitiveness isalsogreaterthanintheEU.4Inordertoreduceexposureto higher costs, it is therefore crucial that Sloveniacontinues to reduce its energy intensity and proceedwith technological restructuring in its emission- andenergy-intensiveindustries.
4.3 Emission-intensive industriesIn the last few years, the total output in emission-intensive industries1 in Slovenia mostly grew faster on average than in other manufacturing industries. Thistrendwas interrupted in2008and2009,primarilyasaresult of the loweroutput in themanufactureofbasicmetals, and then in 2014, mainly owing to the moremodestoutputinthechemicalindustry.Inthelastfiveyears under observation, emission-intensive industriesgenerated around a quarter of the total value addedin manufacturing, which is one of the largest shares
1According to theWorld Bankmethodology, these include the followingNACE subsections: themanufacture of paper andpaperproducts;themanufactureofchemicalsandchemicalproducts;themanufactureofcement,limeandplaster;themanufactureofothernon-metallicmineralproducts;andthemanufactureofbasicmetals.2InSlovenia,theseindustriesgenerated26.6%ofthetotalgrossvalueaddedinmanufacturingin2013(comparedwith18.6%intheEU).Moreover,manufacturingalsoaccountsforalargershareinthetotalvalueaddedoftheeconomy(22.5%;intheEU,15.3%).Thesharesofthechemicalindustryandbasicmetals,inparticular,arehigherthantheEUaverage.3Energyintensityistheratiooftheconsumptionofenergy(fuels,electricityandheat)tovalueadded,expressedatconstantprices.4Theclimateandenergypackageadoptedin2010andtheemissionstradingsystemarelikelytohaveadoubleeffectonthecostsforbusinesses:directcostsforthepurchaseofemissionallowancesandindirectcostspaidthroughhigherelectricityprices.
Table:Production in emission-intensive industries and energy intensity in manufacturing
2005 2006 2007 2008 2009 2010 2011 2012 2013 2014
Productioninemission-intensiveindustries(annualrealgrowthrateindex) 104.2 112.1 114.3 93.7 81.2 108.9 102.3 102.0 102.7 101.9
Manufactureofpulp,paperandpaperproducts 102.5 99.0 98.5 89.8 89.8 101.3 100.7 97.0 100.3 102.3
Manufactureofchemicals,chemicalproductsandan-madefibres 107.6 113.0 121.7 101.0 85.8 114.7 102.4 104.6 103.9 99.2
Manufactureofothernon-metallicmineralproducts 93.1 106.2 105.8 102.5 72.4 98.7 90.7 95.9 98.3 105.0
Manufactureofbasicmetals 103.2 119.6 106.7 68.6 70.3 109.5 111.0 101.1 103.4 107.1
Productioninmanufacturing,excludingemission-intensiveindustries(annualrealgrowthrateindex) 103.9 104.8 107.1 104.7 81.3 106.1 102.0 98.3 98.0 104.7
Energyintensityinmanufacturing(index2005=100) 100.0 95.8 86.6 78.9 77.2 75.2 71.1 71.3 71.2 69.2
GHGemissionsfromindustry(index2005=100) 100.0 103.9 98.1 93.7 76.0 75.2 70.5 68.8 70.0 71.2
Source:SI-STATDataPortal–NationalAccountsandMiningandManufacturing(SURS),2015;calculationsbyIMAD.
Figure:The share of emission-intensive industries in manufacturing and the share of manufacturing in the value added of the economy, 2013
Source:Eurostat,NationalAccounts,2015.
-5
0
5
10
15
20
25
30
35
40
45
Ireland
Belgium
Denm
ark
Slov
enia
Finlan
d
Swed
en
Neth
erland
s
Spain
Gree
ce
U.Kingd
om EU
Austria
Fran
ce
Bulgar
ia
Cypr
us
Germ
any
Croa
tia
Hung
ary
Poland Italy
Lith
uania
Portu
gal
Slov
akia
Czec
hR.
Rom
ania
Latvia
Esto
nia
Shareinvalue
adde
d,in
%
Mfr.ofbasicmetals Mfr.ofnon-metallicmineralproducts Chemicalindustry Paperindustry Manufacturing
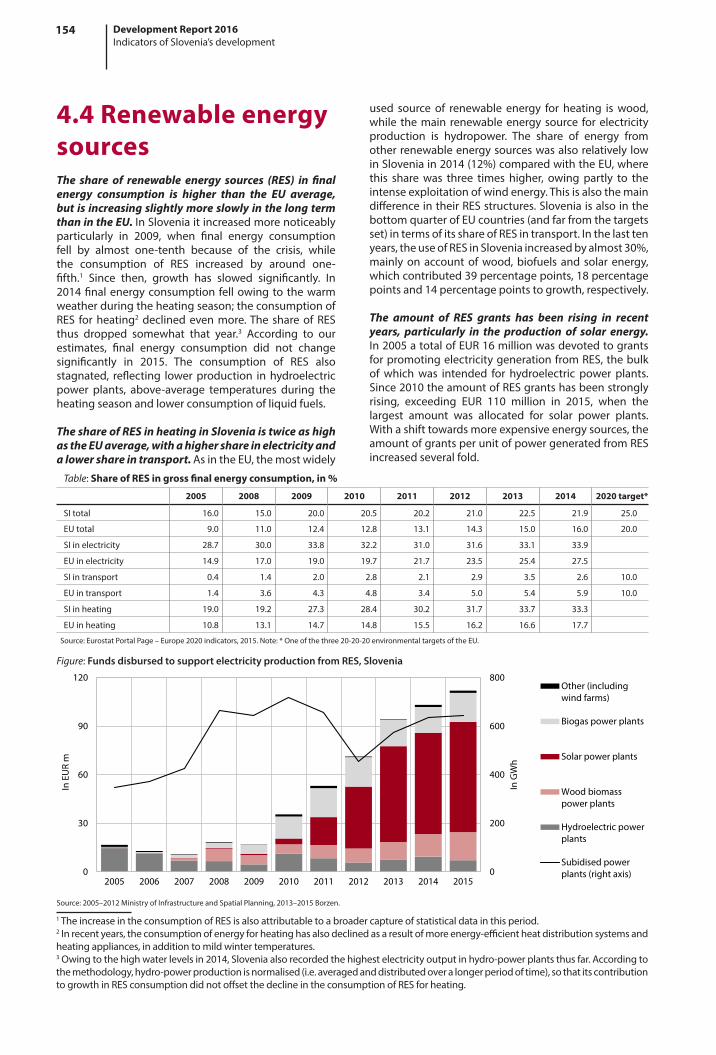
154 Development Report 2016Indicators of Slovenia’s development
4.4 Renewable energy sourcesThe share of renewable energy sources (RES) in final energy consumption is higher than the EU average, but is increasing slightly more slowly in the long term than in the EU. InSloveniaitincreasedmorenoticeablyparticularly in 2009, when final energy consumptionfell by almost one-tenth because of the crisis, whilethe consumption of RES increased by around one-fifth.1 Since then, growth has slowed significantly. In2014finalenergyconsumptionfellowingtothewarmweatherduringtheheatingseason;theconsumptionofRES forheating2declinedevenmore.The shareofRESthus dropped somewhat that year.3 According to ourestimates, final energy consumption did not changesignificantly in 2015. The consumption of RES alsostagnated, reflecting lowerproduction inhydroelectricpower plants, above-average temperatures during theheatingseasonandlowerconsumptionofliquidfuels.
The share of RES in heating in Slovenia is twice as high as the EU average, with a higher share in electricity and a lower share in transport. AsintheEU,themostwidely
1TheincreaseintheconsumptionofRESisalsoattributabletoabroadercaptureofstatisticaldatainthisperiod.2Inrecentyears,theconsumptionofenergyforheatinghasalsodeclinedasaresultofmoreenergy-efficientheatdistributionsystemsandheatingappliances,inadditiontomildwintertemperatures.3Owingtothehighwaterlevelsin2014,Sloveniaalsorecordedthehighestelectricityoutputinhydro-powerplantsthusfar.Accordingtothemethodology,hydro-powerproductionisnormalised(i.e.averagedanddistributedoveralongerperiodoftime),sothatitscontributiontogrowthinRESconsumptiondidnotoffsetthedeclineintheconsumptionofRESforheating.
Figure:Funds disbursed to support electricity production from RES, Slovenia
Source:2005–2012MinistryofInfrastructureandSpatialPlanning,2013–2015Borzen.
0
200
400
600
800
0
30
60
90
120
2005 2006 2007 2008 2009 2010 2011 2012 2013 2014 2015
InG
Wh
InEURm
Other(includingwindfarms)
Biogaspowerplants
Solarpowerplants
Woodbiomasspowerplants
Hydroelectricpowerplants
Subidisedpowerplants(rightaxis)
Table:Share of RES in gross final energy consumption, in %
2005 2008 2009 2010 2011 2012 2013 2014 2020 target*
SItotal 16.0 15.0 20.0 20.5 20.2 21.0 22.5 21.9 25.0
EUtotal 9.0 11.0 12.4 12.8 13.1 14.3 15.0 16.0 20.0
SIinelectricity 28.7 30.0 33.8 32.2 31.0 31.6 33.1 33.9
EUinelectricity 14.9 17.0 19.0 19.7 21.7 23.5 25.4 27.5
SIintransport 0.4 1.4 2.0 2.8 2.1 2.9 3.5 2.6 10.0
EUintransport 1.4 3.6 4.3 4.8 3.4 5.0 5.4 5.9 10.0
SIinheating 19.0 19.2 27.3 28.4 30.2 31.7 33.7 33.3
EUinheating 10.8 13.1 14.7 14.8 15.5 16.2 16.6 17.7
Source:EurostatPortalPage–Europe2020indicators,2015.Note:*Oneofthethree20-20-20environmentaltargetsoftheEU.
used source of renewable energy for heating iswood,while themain renewableenergysource forelectricityproduction is hydropower. The share of energy fromotherrenewableenergysourceswasalsorelativelylowinSloveniain2014(12%)comparedwiththeEU,wherethis sharewas three times higher, owing partly to theintenseexploitationofwindenergy.ThisisalsothemaindifferenceintheirRESstructures.SloveniaisalsointhebottomquarterofEUcountries(andfarfromthetargetsset)intermsofitsshareofRESintransport.Inthelasttenyears,theuseofRESinSloveniaincreasedbyalmost30%,mainlyonaccountofwood,biofuelsand solarenergy,whichcontributed39percentagepoints,18percentagepointsand14percentagepointstogrowth,respectively.
The amount of RES grants has been rising in recent years, particularly in the production of solar energy. In2005atotalofEUR16millionwasdevotedtograntsforpromotingelectricitygenerationfromRES,thebulkofwhichwas intended for hydroelectric power plants.Since2010theamountofRESgrantshasbeenstronglyrising, exceeding EUR 110 million in 2015, when thelargest amount was allocated for solar power plants.Withashifttowardsmoreexpensiveenergysources,theamountofgrantsperunitofpowergeneratedfromRESincreasedseveralfold.
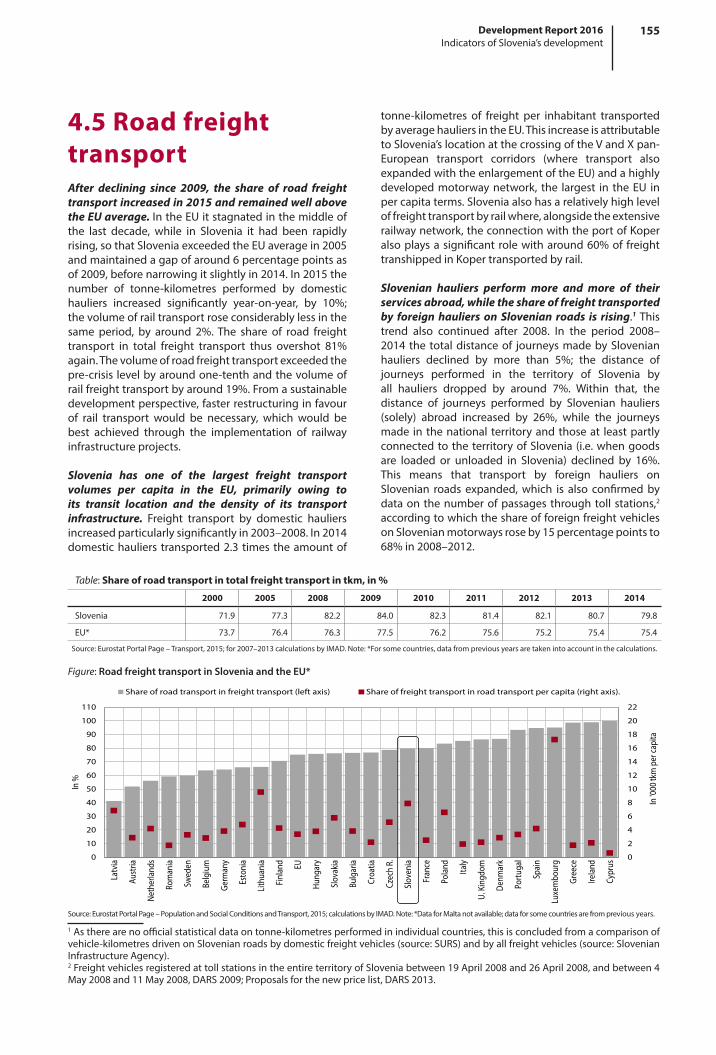
155Development Report 2016Indicators of Slovenia’s development
tonne-kilometres of freight per inhabitant transportedbyaveragehauliersintheEU.ThisincreaseisattributabletoSlovenia’slocationatthecrossingoftheVandXpan-European transport corridors (where transport alsoexpandedwiththeenlargementoftheEU)andahighlydevelopedmotorwaynetwork, the largest in theEU inpercapitaterms.Sloveniaalsohasarelativelyhighleveloffreighttransportbyrailwhere,alongsidetheextensiverailwaynetwork,theconnectionwiththeportofKoperalsoplaysasignificant rolewitharound60%of freighttranshippedinKopertransportedbyrail.
Slovenian hauliers perform more and more of their services abroad, while the share of freight transported by foreign hauliers on Slovenian roads is rising.1 Thistrend also continued after 2008. In the period 2008–2014 the totaldistanceof journeysmadebySlovenianhauliers declined by more than 5%; the distance ofjourneys performed in the territory of Slovenia byall hauliers dropped by around 7%. Within that, thedistance of journeys performed by Slovenian hauliers(solely) abroad increased by 26%, while the journeysmade inthenational territoryandthoseat leastpartlyconnectedtotheterritoryofSlovenia (i.e.whengoodsare loaded or unloaded in Slovenia) declined by 16%.This means that transport by foreign hauliers onSlovenian roads expanded,which is also confirmedbydataonthenumberofpassagesthroughtollstations,2accordingtowhichtheshareofforeignfreightvehiclesonSlovenianmotorwaysroseby15percentagepointsto68%in2008–2012.
4.5 Road freight transportAfter declining since 2009, the share of road freight transport increased in 2015 and remained well above the EU average. IntheEUitstagnatedinthemiddleofthe last decade, while in Slovenia it had been rapidlyrising,sothatSloveniaexceededtheEUaveragein2005andmaintainedagapofaround6percentagepointsasof2009,beforenarrowingitslightlyin2014.In2015thenumber of tonne-kilometres performed by domestichauliers increased significantly year-on-year, by 10%;thevolumeofrailtransportroseconsiderablylessinthesame period, by around 2%.The share of road freighttransport in total freight transport thus overshot 81%again.Thevolumeofroadfreighttransportexceededthepre-crisis levelbyaroundone-tenthandthevolumeofrailfreighttransportbyaround19%.Fromasustainabledevelopmentperspective,fasterrestructuringinfavourof rail transport would be necessary, which would bebest achieved through the implementation of railwayinfrastructureprojects.
Slovenia has one of the largest freight transport volumes per capita in the EU, primarily owing to its transit location and the density of its transport infrastructure. Freight transport by domestic hauliersincreasedparticularlysignificantlyin2003–2008.In2014domestichauliers transported2.3 timestheamountof
1Astherearenoofficialstatisticaldataontonne-kilometresperformedinindividualcountries,thisisconcludedfromacomparisonofvehicle-kilometresdrivenonSlovenianroadsbydomesticfreightvehicles(source:SURS)andbyallfreightvehicles(source:SlovenianInfrastructureAgency).2FreightvehiclesregisteredattollstationsintheentireterritoryofSloveniabetween19April2008and26April2008,andbetween4May2008and11May2008,DARS2009;Proposalsforthenewpricelist,DARS2013.
Figure:Road freight transport in Slovenia and the EU*
Source:EurostatPortalPage–PopulationandSocialConditionsandTransport,2015;calculationsbyIMAD.Note:*DataforMaltanotavailable;dataforsomecountriesarefrompreviousyears.
0
2
4
6
8
10
12
14
16
18
20
22
Latvia
Austria
Neth
erland
s
Rom
ania
Swed
en
Belgium
Germ
any
Esto
nia
Lith
uania
Finlan
d EU
Hung
ary
Slov
akia
Bulgar
ia
Croa
tia
Czec
hR.
Slov
enia
Fran
ce
Poland Italy
U.Kingd
om
Denm
ark
Portu
gal
Spain
Luxe
mbo
urg
Gree
ce
Ireland
Cypr
us
0
10
20
30
40
50
60
70
80
90
100
110
In'0
00tk
mper
capita
In%
Shareofroadtransportinfreighttransport(leftaxis) Shareoffreighttransportinroadtransportpercapita(rightaxis).
Table:Share of road transport in total freight transport in tkm, in %
2000 2005 2008 2009 2010 2011 2012 2013 2014
Slovenia 71.9 77.3 82.2 84.0 82.3 81.4 82.1 80.7 79.8
EU* 73.7 76.4 76.3 77.5 76.2 75.6 75.2 75.4 75.4
Source:EurostatPortalPage–Transport,2015;for2007–2013calculationsbyIMAD.Note:*Forsomecountries,datafrompreviousyearsaretakenintoaccountinthecalculations.

156 Development Report 2016Indicators of Slovenia’s development
4.6 WasteHaving declined during the crisis, waste generation increased in 2013 and 2014. In 2014 approximately4.7 million tonnes of different types of waste wasgenerated in Slovenia, around 5% more than in2012.1 One fifth was municipal waste, i.e. waste fromhouseholdsandotherwasteofsimilaroriginmanagedbytheprovidersofmandatory localpublicservices forenvironmentalprotection.Afterrisingbyabout15%in2013,municipalwasteincreasedbyanother5%in2014.The quantity of separately collected municipal waste,which is rising in the long term, increased to 65% oftotalwaste generated.The other four-fifthswaswastefrom production and service activities. After decliningsignificantlyattheonsetofthecrisis,thequantityofthiswastehasincreasedslightlysince2012.Thevastmajorityof waste, around nine-tenths, was generated in foursectors: (i) manufacturing; (ii) construction; (iii) watersupply,sewerage,wastemanagementandremediationactivities;and(iv)electricity,gasandsteamsupply.
Waste management continues to improve. The total quantity of waste recovered in 2014 amounted closeto 6.1 million tonnes; after two years of decline, thiswas roughly the sameas in2010and2011.Theactualamountrecovered(excludingpre-treatmentorremovalandbackfilling)wasapproximately50%lower.Recycling, averydesirableformofrecoveryfromanenvironmental
1In2012themethodologywaschanged(certainwastetypeswerereclassifiedasby-products).
Source:EurostatPortalPage–EnvironmentandEnergy,2016.Note:DataforRomania,IrelandandGreecearefor2013.
Figure:Municipal waste generated and landfilled, 2014
0
10
20
30
40
50
60
70
80
90
100
Poland
Rom
ania
Latvia
Czec
hR.
Slov
akia
Esto
nia
Hung
ary
Croa
tia
Slov
enia
Lith
uania
Belgium
Spain
Swed
en
Bulgar
ia
Portu
gal
EU
Finlan
d
U.Kingd
om Italy
Gree
ce
Fran
ce
Neth
erland
s
Austria
Ireland
Malta
Luxe
mbo
urg
Germ
any
Cypr
us
Denm
ark
0
100
200
300
400
500
600
700
800
900
1000
In%
Kg/in
habitant
Wastegenerated Theshareofwastelandfilled(rightaxis)
Table:Municipal waste generation and treatment, 2014
Generation, kg/capita
Type of municipal waste treatment, in %
Recycling (without composting)
Composting Incineration Landfill Other*
Slovenia 432 29.2 6.9 0.2 23.4 40.5
EU 475 27.6 15.8 26.7 27.8 2.1
Source:EurostatPortalPage–EnvironmentandEnergy,2016;calculationsbyIMAD.Note:The'other’categoryincludesthepre-treatmentandtemporarystorageofwaste(wastetreatmentthatremainedunfinishedinagivenyear).
perspective, amounted to nearly 2.7 million tonnes,which is 44% of total recovery. Landfilling is the leastfavoured option in the waste management hierarchy.The quantity of landfilled waste amounted to around283,000tonnes,almostone-tenthlessthanin2013andaround5%ofthetotalamountrecovered.Theshareoflandfilled municipal waste decreased again, totallingaroundone-quarterin2014,astwo-thirdsofmunicipalwastewas already collected separately andas residualmixedmunicipalwastemustbetreatedbeforegoingtolandfill.
In terms of municipal waste generation, Slovenia performs better than the EU.In2014atotalof43kgofmunicipalwasteperpersonwasgeneratedinSlovenia,whichis9%lessthantheEUaverage.ComparedwiththeEU,alargershareofmunicipalwastewasrecycledandasmallersharewaslandfilled;however,atthesametime,arelativelylargeamountofwasteremainedintreatment(the“other treatment” category). In theEU,asmanyassixEUMemberStateshavealreadyreducedtheirshareoflandfilledmunicipalwastetobelow5%oftotalwastegenerated.
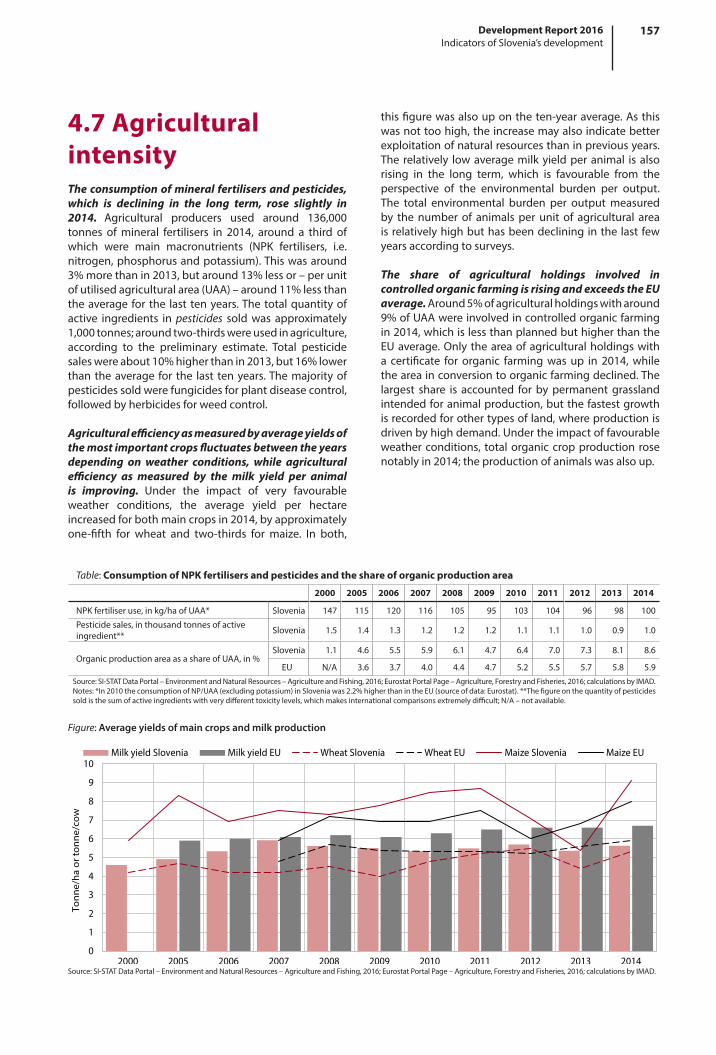
157Development Report 2016Indicators of Slovenia’s development
thisfigurewasalsoupontheten-yearaverage.Asthiswasnottoohigh,theincreasemayalsoindicatebetterexploitationofnaturalresourcesthaninpreviousyears.The relatively lowaveragemilkyieldperanimal isalsorising in the long term, which is favourable from theperspective of the environmental burden per output.The total environmental burden per outputmeasuredby thenumberof animalsperunit of agricultural areaisrelativelyhighbuthasbeendeclininginthelastfewyearsaccordingtosurveys.
The share of agricultural holdings involved in controlled organic farming is rising and exceeds the EU average.Around5%ofagriculturalholdingswitharound9%ofUAAwereinvolvedincontrolledorganicfarmingin2014,whichislessthanplannedbuthigherthantheEUaverage.Onlytheareaofagriculturalholdingswitha certificate for organic farmingwasup in 2014,whiletheareainconversiontoorganicfarmingdeclined.Thelargest share is accounted forbypermanentgrasslandintendedforanimalproduction,butthefastestgrowthisrecordedforothertypesofland,whereproductionisdrivenbyhighdemand.Undertheimpactoffavourableweatherconditions, totalorganiccropproduction rosenotablyin2014;theproductionofanimalswasalsoup.
4.7 Agricultural intensityThe consumption of mineral fertilisers and pesticides, which is declining in the long term, rose slightly in 2014. Agricultural producers used around 136,000tonnes ofmineral fertilisers in 2014, around a third ofwhich were main macronutrients (NPK fertilisers, i.e.nitrogen,phosphorusandpotassium).Thiswasaround3%morethanin2013,butaround13%lessor–perunitofutilisedagriculturalarea(UAA)–around11%lessthantheaveragefor the last tenyears.Thetotalquantityofactive ingredients inpesticides soldwas approximately1,000tonnes;aroundtwo-thirdswereusedinagriculture,according to the preliminary estimate. Total pesticidesaleswereabout10%higherthanin2013,but16%lowerthantheaverage for the last tenyears.Themajorityofpesticidessoldwerefungicidesforplantdiseasecontrol,followedbyherbicidesforweedcontrol.
Agricultural efficiency as measured by average yields of the most important crops fluctuates between the years depending on weather conditions, while agricultural efficiency as measured by the milk yield per animal is improving. Under the impact of very favourableweather conditions, the average yield per hectareincreasedforbothmaincropsin2014,byapproximatelyone-fifth for wheat and two-thirds for maize. In both,
Figure: Average yields of main crops and milk production
Source:SI-STATDataPortal–EnvironmentandNaturalResources–AgricultureandFishing,2016;EurostatPortalPage–Agriculture,ForestryandFisheries,2016;calculationsbyIMAD.
0
1
2
3
4
5
6
7
8
9
10
2000 2005 2006 2007 2008 2009 2010 2011 2012 2013 2014
Tonn
e/ha
ort
onne
/cow
MilkyieldSlovenia MilkyieldEU WheatSlovenia WheatEU MaizeSlovenia MaizeEU
Table:Consumption of NPK fertilisers and pesticides and the share of organic production area
2000 2005 2006 2007 2008 2009 2010 2011 2012 2013 2014
NPKfertiliseruse,inkg/haofUAA* Slovenia 147 115 120 116 105 95 103 104 96 98 100
Pesticidesales,inthousandtonnesofactiveingredient** Slovenia 1.5 1.4 1.3 1.2 1.2 1.2 1.1 1.1 1.0 0.9 1.0
OrganicproductionareaasashareofUAA,in%Slovenia 1.1 4.6 5.5 5.9 6.1 4.7 6.4 7.0 7.3 8.1 8.6
EU N/A 3.6 3.7 4.0 4.4 4.7 5.2 5.5 5.7 5.8 5.9Source:SI-STATDataPortal–EnvironmentandNaturalResources–AgricultureandFishing,2016;EurostatPortalPage–Agriculture,ForestryandFisheries,2016;calculationsbyIMAD.Notes:*In2010theconsumptionofNP/UAA(excludingpotassium)inSloveniawas2.2%higherthanintheEU(sourceofdata:Eurostat).**Thefigureonthequantityofpesticidessoldisthesumofactiveingredientswithverydifferenttoxicitylevels,whichmakesinternationalcomparisonsextremelydifficult;N/A–notavailable.

158 Development Report 2016Indicators of Slovenia’s development
4.8 Intensity of tree fellingTree-felling is increasing in the long term, but in 2014 it was particularly pronounced as a result of emergency removals in the aftermath of the severe ice storm that year. Around 6.4millionm3 ofwoodwas cut in 2014,which is62%more than in2013andalmost twice theaverage annual removal since 2000. For the first timesince measurements began, tree felling reached (andslightlyexceeded)thepotentialforfellingdeterminedintheforestrymanagementplans,1incontrasttopreviousyearswhenonlytwo-thirdsofthefellingpermittedwascarried out. As a consequence of severe ice damage,most of the removal (two-thirds) was for sanitation purposes,whereasfelling for tree-tending purposes,whichnormallyaccountsforthelargestshare,declined.Amidarenewedslightincreaseintheannualwoodincrement,the tree-felling intensity rose significantly in 2014, by28percentagepoints,to74%.2Intermsofvolume(butnotstructure),thisfigureisveryclosetothatenvisagedin theactionplan,3 according towhich the tree-fellingintensitycouldbeincreasedto75%,and6.5millionm3of wood could be cut per year without jeopardisingsustainabledevelopment.
1Thepotential (orallowable) felling isdetermined in the forestrymanagementplansof theSloveniaForestServicewithaview toensuringsustainabledevelopment,i.e.thelong-termstabilityofallforestsandtheirhabitatsirrespectiveofownership.2Theintensityoftreefellingiscalculatedastheratioofannualfellingtoannualwoodincrement.3Akcijskinačrtzapovečanjekonkurenčnostigozdno-lesneverigevSlovenijidoleta2020(ActionPlantoIncreasetheCompetitivenessoftheForest-WoodChaininSloveniaby2020).4Thequantityobtainedisdependentonthequantityoffelledwoodanditsutilisationrate,whichinturndependsonthetypeoftreesandthestructureofwoodcategories.
Figure:Tree felling and the structure of wood by category, Slovenia
Source:SI-STATDataPortal–EnvironmentandNaturalResources–AgricultureandFishing,2016;SloveniaForestService;calculationsbyIMAD.
0
1
2
3
4
5
6
7
2000 2001 2002 2003 2004 2005 2006 2007 2008 2009 2010 2011 2012 2013 2014
Inm
illionm
3
Otherremoval Forestclearance Removalforinfrastructure Sanitationremoval Tree-tendingremoval
Table:Intensity of tree felling, ratio
2000 2005 2006 2007 2008 2009 2010 2011 2012 2013 2014
Slovenia 38.0 43.0 48.6 41.4 43.6 42.3 41.6 47.1 46.4 46.2 74.0
EU 61.0 65.0 N/A N/A N/A N/A 62.7 N/A N/A N/A N/ASource:EurostatPortalPage–Agriculture,ForestryandFisheries,2016;SI-STATDataPortal–EnvironmentandNaturalResources–ForestryandHunting,2016;calculationsbyIMAD.Note:N/A–notavailable.
The increased felling is reflected in the higher production of raw wood categories and, in turn, higher net exports; the untapped potential in the forest-wood chain remains relatively large. In 2014around 5.3millionm3of roundwood (i.e. unprocessedwood)wasobtained, approximately50%more than in2013and85%more thantheaveragesince2000.4Theconsequencesof the ice stormwere strongly reflectedin the structure of industrial wood: the volume ofpulpwood, which is low-quality wood that generateslowvalueadded,rosethemost,whilethevolumeofthehighestqualitywood,sawlogs and veneer logs,increasedtheleast.Witharoundhalfoftheyear-on-yearincreaseinunprocessedwoodproductionbeingexported,totalannualwoodexports –whichhadbeengrowing for alongperiod–roseby54%.Astotal importscontractedbyaroundone-fifth,netwoodexportsalmostdoubled,reaching1.9millionm3.Withinthose,netexportsofthehighest-qualitywoodalsoexpandednotably(by60%oralmost 400,000m3), although its production increasedtheleast(by25%or420,000m3).

159Development Report 2016Indicators of Slovenia’s development
4.9 Environmental taxesIn 2014 revenue from environmental taxes as a share of GDP declined slightly after several years of almost uninterrupted growth, but was still significantly higher than before the crisis due to the high excise duties on energy.Asa resultofhigherexciseduty rates1 andhigherornewother taxes (the introductionof theCO2taxonmotorfuels,thesaleofemissionallowances,theincrease in annual road user charges), revenue fromenvironmentaltaxesrelativetoGDPwas0.9percentagepointshigher in2014than in2008and0.7percentagepoints higher than in 2005. In 2014 this figure fellslightly owing to the growth of revenue from excisedutiesonliquidfuels2 laggingbehindGDPgrowthandasmalldeclineintheinflowsoftaxesonenvironmentalpollution(partlyduetoareductioninthetaxontheuseoffluorinatedgreenhousegases).
More than three-quarters of environmental taxes are accounted for by energy taxes, with taxes on pollution and transport gaining importance in recent years. Revenue from taxes on energy accounted for 77% ofenvironmental taxes collected in 2014, the bulk beingfrom excise duties on liquid fuels. Their consumptionis relatively high in Slovenia, given the large volumeof transit and other road transport, which is related,amongotherthings,toitsdispersedsettlementpatternand poorly developed public transport infrastructure.
1In2014theaverageexcisedutyrate(calculatedastheaverageofdailyrates)forpetrolwas45%higherthanin2008,andfordieselfuel38%higherthanin2008.Withthesharpincreaseinexcisedutyratesin2009,theoptiontoobtainapartialrefundofexcisedutiespaidondieselfuelusedforcommercialpurposeswasintroduced(uptotheminimumamountsetintheEUenergydirective).2In2014theaverageexcisedutyratefordieselfuelwasaround2%higheryear-on-yearandforpetrolaround1%lower.
Figure:Revenue from environmental taxes, Slovenia and the EU, 2014
Source:EurostatPortalPage–EnvironmentandEnergy.
0.0
0.5
1.0
1.5
2.0
2.5
3.0
3.5
4.0
4.5
Den
mark
Slov
enia
Croa
tia
Gree
ce
Italy
Net
herla
nds
Cypr
us
Malta
Finlan
d
Bulgar
ia
Esto
nia
Latvia
Hung
ary
Poland
U.Kingd
om EU
Ireland
Austria
Rom
ania
Portug
al
Swed
en
Czec
hR.
Belgium
Fran
ce
Germ
any
Luxe
mbo
urg
Spain
Slov
akia
Lith
uania
Asa%
ofG
DP
TaxesonpollutionandtheuseofnaturalresourcesTransporttaxesEnergytaxes
Table:Environmental tax revenues, as a % of GDP, Slovenia and the EU
2000 2005 2008 2009 2010 2011 2012 2013 2014
Slovenia 2.88 3.15 2.95 3.49 3.62 3.46 3.83 3.97 3.89
EU(weightedaverage) N/A 2.51 2.29 2.36 2.37 2.40 2.44 2.45 2.46Source:EurostatPortalPage–EnvironmentandEnergy,March2016).Note:N/A–notavailable.
In the past few years, a somewhat higher share ofenvironmentaltaxrevenueswasraisedfrom:(i)taxes on transport,whichreacheda12%sharein2014,thebulkarisingfromannual roadusercharges;and(ii) taxes on pollution,whichaccounted fora9%share in2014asaresultofthemorebroadlybasedtaxonCO2emissions.Theshareoftaxes on the use of natural resources,whichislow,wasstable.Mostoftheenvironmentaltaxburden,aroundtwo-thirds,wasbornebyhouseholds,whichcanbe attributed in part tomethodological simplification,according to which most of motor fuel consumption,andhenceenergytaxes,isascribedtohouseholds.
Among EU Member States, only Denmark outpaces Slovenia in terms of its environmental tax burden relative to GDP. In 2014 revenue from environmentaltaxesasashareofGDPwas1.4percentagepointshigherinSloveniathantheEUaverage.Thehighshareismainlyduetotheextensiveuseofmotorfuelsinroadtransport,with the tax rate on energy also being relatively high.TotallingEUR236.4per tonneofoil equivalentoffinalenergyconsumption,the implicit taxrateonenergy in2014wasonlyslightlyabovetheweightedEUaverageand17%abovetheunweightedEUaverage.
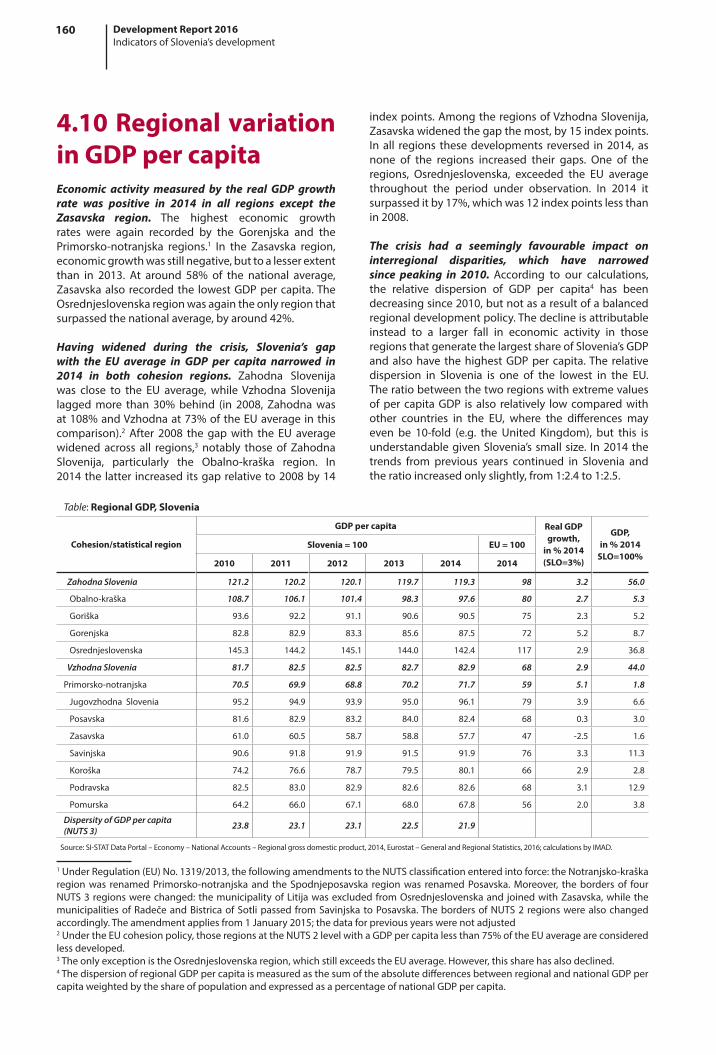
160 Development Report 2016Indicators of Slovenia’s development
indexpoints.AmongtheregionsofVzhodnaSlovenija,Zasavskawidenedthegapthemost,by15indexpoints.In all regions thesedevelopments reversed in2014, asnone of the regions increased their gaps. One of theregions, Osrednjeslovenska, exceeded the EU averagethroughout the period under observation. In 2014 itsurpasseditby17%,whichwas12indexpointslessthanin2008.
The crisis had a seemingly favourable impact on interregional disparities, which have narrowed since peaking in 2010. According to our calculations,the relative dispersion of GDP per capita4 has beendecreasingsince2010,butnotasaresultofabalancedregionaldevelopmentpolicy.Thedeclineisattributableinstead to a larger fall in economic activity in thoseregionsthatgeneratethelargestshareofSlovenia’sGDPandalsohave thehighestGDPper capita.The relativedispersion in Slovenia is one of the lowest in the EU.Theratiobetweenthetworegionswithextremevaluesofper capitaGDP is also relatively lowcomparedwithother countries in the EU, where the differences mayeven be 10-fold (e.g. the United Kingdom), but this isunderstandablegivenSlovenia’ssmall size. In2014thetrends from previous years continued in Slovenia andtheratioincreasedonlyslightly,from1:2.4to1:2.5.
4.10 Regional variation in GDP per capita Economic activity measured by the real GDP growth rate was positive in 2014 in all regions except the Zasavska region. The highest economic growthrates were again recorded by the Gorenjska and thePrimorsko-notranjska regions.1 In the Zasavska region,economicgrowthwasstillnegative,buttoalesserextentthan in 2013. At around 58% of the national average,Zasavskaalso recordedthe lowestGDPpercapita.TheOsrednjeslovenskaregionwasagaintheonlyregionthatsurpassedthenationalaverage,byaround42%.
Having widened during the crisis, Slovenia’s gap with the EU average in GDP per capita narrowed in 2014 in both cohesion regions. Zahodna Slovenijawas close to the EU average, whileVzhodna Slovenijalaggedmore than 30%behind (in 2008, Zahodnawasat108%andVzhodnaat73%oftheEUaverageinthiscomparison).2 After 2008 thegapwith the EU averagewidened across all regions,3 notably thoseof ZahodnaSlovenija, particularly the Obalno-kraška region. In2014the latter increased itsgaprelativeto2008by14
Table:Regional GDP, Slovenia
Cohesion/statistical region
GDP per capita Real GDP growth,
in % 2014 (SLO=3%)
GDP, in % 2014
SLO=100%Slovenia = 100 EU = 100
2010 2011 2012 2013 2014 2014
Zahodna Slovenia 121.2 120.2 120.1 119.7 119.3 98 3.2 56.0
Obalno-kraška 108.7 106.1 101.4 98.3 97.6 80 2.7 5.3
Goriška 93.6 92.2 91.1 90.6 90.5 75 2.3 5.2
Gorenjska 82.8 82.9 83.3 85.6 87.5 72 5.2 8.7
Osrednjeslovenska 145.3 144.2 145.1 144.0 142.4 117 2.9 36.8
Vzhodna Slovenia 81.7 82.5 82.5 82.7 82.9 68 2.9 44.0
Primorsko-notranjska 70.5 69.9 68.8 70.2 71.7 59 5.1 1.8
JugovzhodnaSlovenia 95.2 94.9 93.9 95.0 96.1 79 3.9 6.6
Posavska 81.6 82.9 83.2 84.0 82.4 68 0.3 3.0
Zasavska 61.0 60.5 58.7 58.8 57.7 47 -2.5 1.6
Savinjska 90.6 91.8 91.9 91.5 91.9 76 3.3 11.3
Koroška 74.2 76.6 78.7 79.5 80.1 66 2.9 2.8
Podravska 82.5 83.0 82.9 82.6 82.6 68 3.1 12.9
Pomurska 64.2 66.0 67.1 68.0 67.8 56 2.0 3.8
Dispersity of GDP per capita (NUTS 3) 23.8 23.1 23.1 22.5 21.9
Source:SI-STATDataPortal–Economy–NationalAccounts–Regionalgrossdomesticproduct,2014,Eurostat–GeneralandRegionalStatistics,2016;calculationsbyIMAD.
1UnderRegulation(EU)No.1319/2013,thefollowingamendmentstotheNUTSclassificationenteredintoforce:theNotranjsko-kraškaregionwas renamedPrimorsko-notranjskaand theSpodnjeposavska regionwas renamedPosavska.Moreover, thebordersof fourNUTS3regionswerechanged:themunicipalityofLitijawasexcludedfromOsrednjeslovenskaandjoinedwithZasavska,whilethemunicipalitiesofRadečeandBistricaofSotlipassedfromSavinjskatoPosavska.ThebordersofNUTS2regionswerealsochangedaccordingly.Theamendmentappliesfrom1January2015;thedataforpreviousyearswerenotadjusted2UndertheEUcohesionpolicy,thoseregionsattheNUTS2levelwithaGDPpercapitalessthan75%oftheEUaverageareconsideredlessdeveloped.3TheonlyexceptionistheOsrednjeslovenskaregion,whichstillexceedstheEUaverage.However,thissharehasalsodeclined.4ThedispersionofregionalGDPpercapitaismeasuredasthesumoftheabsolutedifferencesbetweenregionalandnationalGDPpercapitaweightedbytheshareofpopulationandexpressedasapercentageofnationalGDPpercapita.

161Development Report 2016Indicators of Slovenia’s development
Source:SMARS,SURS,mappingbyIMAD.
4.11 Regional variation in the registered unemployment rate In 2015 the registered unemployment rate continued to fall in all regions, except Pomurska. The largestdeclinewasrecordedbytheZasavskaregion;however,this was mainly a statistical effect because, under thenew NUTS 3 regulation,1 Zasavska now also includesLitija, a municipality with a below-average registeredunemploymentrate,whiletheotherthreemunicipalitiesofthisregionstillhaveabove-averagerates.TheregisteredunemploymentrateintheZasavskaregiondeclinedby2.5percentagepoints (butbyonly1percentagepointexcluding these changes). Not including the statisticaleffect, the registeredunemployment ratedropped themost in the Koroška region, by 1.5 percentage points.Above-averagerateswererecordedbythesameregionsasinthepreviousyear,allofwhich,withtheexceptionofPrimorsko-notranjska,arelocatedinthecohesionregionof Vzhodna Slovenija. The highest rate was posted bythe Pomurska region,where it rose by 0.5 percentagepointsto18.9%andsurpassedthenationalaveragebymore than half. The lowest rate, almost a third belowthe national average, was once again recorded in theGorenjskaregion(at8.6%).
Map:Registered unemployment rates by region, 2015
Interregional disparities in the registered unemployment rate measured by absolute dispersion2 have been stable in the last four years. Intheearlyyearsof the crisis, interregional disparities had been rising,reaching their peak in 2010, when the dispersion ratewas2.4%.After2010,however,theydeclined,owingtoa faster increase inunemployment in those regionsofZahodnaSlovenijawithbelow-averagerates;inthelastfour years, they remained relatively stable, with smallyear-on-year fluctuations. In 2015 they amounted to1.8%ofGDP,whichis0.1percentagepointsmorethana year earlier. On the other hand, the ratio betweenthe two regions with extreme values increased from1:1.9 to 1:2.2, reflecting the higher rate of registeredunemployment in the Pomurska and the lower rate intheGorenjskaregion.
In all regions, young people were the group of unemployed that was disproportionately affected by the contraction of the labour market during the crisis. After 2013, when the total registered unemploymentrate had already started to fall across the regions, theregistered unemployment rate for young people aged15–29 had still been rapidly rising, especially in theZasavska,Primorsko-notranjskaandOsrednjeslovenskaregions, and reached its peak in 2014. In 2015 itotherwisedeclined inall regions, themost inZasavska(by5.5percentagepoints),butwasstillatleast1.5timesashighasthetotalrate.ItwashighestinthePomurskaregion, at 29.8%,which is 2.2 times asmuch as in theGorenjskaregion,whichhasthelowestrate.
1Seenote1intheindicator4.10RegionaldisparitiesinGDPpercapita.2Absolutedispersion:
���� � ���������|���� � ����|�
where=year,=theactivepopulationoftheregion,=theactivepopulationofSlovenia,
=theregisteredunemploymentrateoftheregion,=theregisteredunemploymentrateofSlovenia.

162 Development Report 2016Bibliography and sources
Bibliography and sources
Adult Education and Training in Europe. Widening Access to Learning Opportunities. (2015). Brussels: EuropeanCommission,Education,AudiovisualandCultureExecutiveAgency,Eurydice.
Afonsa,A.,Schuknecht,L&Tanzi,V.(2006).PublicSectorefficiency:EvidenceforNewEUMemberStatesandEmergingMarkets.ECBWorkingPaperSeries,No.581.
Agriculture,fisheryandforestrystatistics.(2015).2014Edition.Luxembourg:Eurostat.Obtainedat:http://ec.europa.eu/eurostat/web/ess/-/agriculture-forestry-and-fishery-statistics-2014-edition.
AkcijskinačrtrazvojaekološkegakmetijstvavSlovenijidoleta2015(ActionplanforthedevelopmentoforganicfarminginSloveniauntil2015).(2005).Ljubljana:MinistryofAgriculture,ForestryandFood.
Akcijskinačrtzapovečanjekonkurenčnostigozdno-lesneverigevSlovenijido leta2020(Actionplanto increasethecompetitivenessoftheforest-woodchaininSloveniabytheyear2020).(2012).Ljubljana:MinistryofAgricultureandtheEnvironmentandMinistryofEconomicDevelopmentandTechnology.
AmendedActRegulatingMeasuresoftheRepublicofSloveniatoStrengthentheStabilityofBanks(ZUKSB-A).(2015).Ljubljana:UradnilistRS,No.104/2015.
AmendedFinancialOperations, InsolvencyProceedingsandCompulsoryWinding-upAct(ZFPPIPP).(2013).Ljubljana:UradnilistRS,No.47/2013.
Analiza zdravstvenega sistema v Sloveniji (Slovenian health care system analysis). (2016). Ministry of Health,WHO,EuropeanObservatoryonHealthSystemsandPolicies.Obtainedat:
Analysisofthe2016DraftbudgetaryplanofSlovenia.(2015).Brussels:EuropeanCommission.CommissionstaffworkingdocumentSWD(2015)612final.Obtainedat:http://ec.europa.eu/economy_finance/.
Andreja Jaklič, Iris Koleša andMatija Rojec. (2015). Slovenija kot lokacija za neposredne tuje investicije v očeh tujihinvestitorjev– raziskavamedpodjetji s tujimkapitalom2015 (Foreign investors’perceptionofSloveniaasa suitablelocationforFDI–researchoncompanieswithforeigncapital2015).Ljubljana:SPIRITandCentreofInternationalRelationsattheFacultyofSocialSciences.
Annualreport–2015.(2016).Ljubljana:LjubljanaStockExchange.
Aronson,J.R.(1985).PublicFinance.NewYork:McGraw-HillBookCompany.
AssessingtheEffectsofSomeStructuralMeasuresinSlovenia.(2016).Ljubljana:IMAD.
Attanasio,O.,Pistaferri,L.(2014).ConsumptionInequalityovertheLastHalfCentury.SomeEvidenceUsingtheNewPSIDConsumptionMeasure.Obtainedat:http://web.stanford.edu/~pista/AP_P_final.pdf.
B.BanerjeeandM.Jesenko.(2015).EconomicGrowthandRegionalDisparitiesinSlovenia.RegionalStudiesAssociation,Volume49Number10.Routledge.,Abingdon.
Biltenmineralnesurovine,Mineralnesurovinevletu2014(MineralResourcesBulletin,MineralResourcesin2014).(2015).Ljubljana:GeologicalSurveyofSlovenia.
Breznikar,A.(2016).Časpreizkušenjzaslovenskigozd(TestingtimesforSlovenianforest).Publishedin:Spodeželja.si,January2016.
Brutodomačiproizvod,temeljniagregatinacionalnihračunovinzaposlenost,1995–2015(Grossdomesticproduct,mainaggregatesofnationalaccountsandemployment,1995–2015). (2015).Ljubljana:StatisticalOfficeof theRepublicofSlovenia.Obtainedat:http://www.stat.si/.
BulletinoftheBankofSlovenia.Variousissues.(2015,2016).Ljubljana:BankofSlovenia.
Burger,A.andcontributors. (2012).Učinekvladnihprotikriznihukrepovnadelovanjepodjetijvpogojihgospodarskekrize(CRPV5-1005)(Impactofgovernmentanti-crisismeasuresoncompanies’performanceinconditionsofeconomiccrisis(CRPV5-1005).Ljubljana:FacultyofSocialSciences.
Businessreportfor2015.(2016).DraftmaterialsfortheGeneralAssemblyMeetingofZZZSon30March2016.Ljubljana:HealthInsuranceInstituteofSlovenia.
Call for proposals: “Spodbujanje zaposlovanja mladih doktorjev znanosti (Encouraging the employment of youngdoctorsofscience)”.(2015).Ljubljana:SlovenianResearchAgency.
Cecchini,M.,M.DevauxandF.Sassi.(2015).Assessingtheimpactsofalcoholpolicies:Amicrosimulationapproach.OECDHealthWorkingPapers,No.80,OECDPublishing,Paris:OECD.Obtainedat:http://dx.doi.org/10.1787/5js1qwkvx36d-en.
CentreforRES/CHP,ReportJanuary–December2015.(2016).Ljubljana:Borzen.
CommissionRegulation (EC)No.1319/2013. (2013).Brussels:Official Journalof theEuropeanUnionof18December2013.Obtainedat:http://www.stat.si/dokument/5433/NUTS_1319_2013_SI.pdf.
CompaniesAct.(2006).Ljubljana:UradnilistRS,No.42/06.

163Development Report 2016Bibliography and sources
Corporateincometaxcalculation,2005–2014.(2015).Ljubljana:MinistryofFinance.
Corrigendumof theFinancialOperations, InsolvencyProceedingsandCompulsoryWinding-upAct. (UPB8-ZFPPIPP).UradnilistRS,No.10/15.
Četrto poročilo o realizaciji ukrepov Enotnega dokumenta za boljše zakonodajno in poslovno okolje ter dvigkonkurenčnosti (Fourth report on the implementation of the measures from the Single document for ensuringbetter regulatory and business environment and increasing competitiveness). (2015). Ljubljana: Ministry of PublicAdministration.
DatabytheMinistryofFinanceonR&Dtaxallowancesin2014.(2015).Ljubljana:MinistryofFinance.
Davis, J.B., Sandström,S., Shorrocks,A.B.,Wolff,E.N. (2009).The levelanddistributionofglobalhouseholdwealth.Cambridge:NationalBureauofEconomicResearch.
Decreeonbudgetaryfinancingofhighereducationinstitutionsandotherinstitutions(2011).Ljubljana:UradnilistRS,No.7/2011.
Decreeon the implementationofendogenous regionalpolicymeasures. (2011,2013). Ljubljana:Uradni listRS,Nos.24/11and16/13.
DesetoporočiloodržavnihpomočehvSloveniji(TenthsurveyonstateaidinSlovenia(for2005,2006and2007).(2008).Ljubljana:MinistryofFinance.
DevelopmentReport2013.(2013).Ljubljana:InstituteofMacroeconomicAnalysisandDevelopment.
DevelopmentReport2014.(2014).Ljubljana.InstituteofMacroeconomicAnalysisandDevelopment.
DevelopmentReport2015.(2015).Ljubljana.InstituteofMacroeconomicAnalysisandDevelopment.
Digital Agenda for Europe, Electronic communication market indicators. (2016). Brussels: European Commission.Obtainedat:http://ec.europa.eu/digital-agenda/scoreboard.
DigitalEconomyandSocietyIndex(DESI).(2015).Brussels:EuropeanCommission.Obtainedat:http://ec.europa.eu/.
DoingBusiness2016.(2015).Washington:TheInternationalBankforReconstructionandDevelopment,TheWorldBank.Obtainedat:http://www.doingbusiness.org.
Dominkuš,D.etal. (2016).GlobalEntrepreneurshipMonitor:2015/16GlobalReport.BabsonCollege,UniversidaddelDesarrollo,UniversitiTunAbdulRazakandTecnologicodeMonterrey.Obtainedat:http://www.gemconsortium.org/.
EconomicMirror.(2009).No.2,Vol.XV,February2009.Ljubljana:IMAD.Obtainedat:http://www.umar.gov.si.
EducationandTrainingMonitor2015.(2015).Brussels:EuropeanCommission.
EducationataGlance(variousissues(2003,2014,2015).Paris:OECD.
Elsby,M.W.L.,Hobijn,B.,Sahin,A.(2011).UnemploymentdynamicsintheOECD.FederalReserveBankofSanFranciscoWorkingPaper2009-04.
EmploymentandSocialDevelopmentsinEurope2015.(2015).Brussels:EuropeanCommission.
Enotnidokumentzazagotovitevboljšegazakonodajnegainposlovnegaokoljaterdvigkonkurenčnosti(Singledocumentforensuringabetterregulatoryandbusinessenvironmentandincreasingcompetitiveness).(2013).Ljubljana:MinistryofPublicAdministration.Obtainedat:http://www.enotnazbirkaukrepov.gov.si.
EnvironmentalindicatorsinSlovenia.(2014).Ljubljana:SlovenianEnvironmentAgency,MinistryofAgricultureandtheEnvironment.
EPOAnnualReport–Statistics2015.(2016).Munich:EuropeanPatentOffice.Obtainedat:http://www.epo.org/.
EPOAnnualReport2015.(2016).Munich:EuropeanPatentOffice.Obtainedat:http://www.epo.org/.
EUJusticeScoreboard2015.(2015).Brussels:EuropeanCommission.Obtainedat:http://ec.europa.eu/.
Eurobarometer Survey, various volumes. Brussels: European Commission. Obtained at: http://ec.europa.eu/public_opinion.
Europe2020targets.Brussels:EuropeanCommission.Obtainedat:http://ec.europa.eu/europe2020/europe-2020-in-a-nutshell/targets/index_sl.htm.
Europe 2020: A strategy for smart, sustainable and inclusive growth. (2010). Communication from the Commission,COM(2010)2020,final.Brussels:EuropeanCommission.
EuropeanBankingSectorFactsandFigures. (2015).Brussels:EuropeanBankingFederation.Obtainedat:http://www.ebf-fbe.eu/publications/statistics/.
EuropeanCommissionandEconomicPolicyCommittee,2015AgeingReport.Economicandbudgetaryprojectionsforthe27EUMemberStates.(2013–2060).Brussels:EuropeanCommission.Obtainedat:http://europa.eu/epc/pdf/ageing_report_2015_en.pdf.
European Securities Exchange Statistics. (2015). Brussels: Federationof European Securities Exchanges.Obtained at:http://www.fese.eu/statistics-market-research/historical-data.

164 Development Report 2016Bibliography and sources
EuropeanSocialSurvey2014.(2014).Ljubljana:PublicOpinionandMassCommunicationsResearchCentre,FacultyofSocialSciences,UniversityofLjubljana.
Europeans’attitudestowardssecurity.(2015).SpecialEurobarometer432.Brussels:EuropeanCommission.Obtainedat:http://ec.europa.eu/COMMFrontOffice/PublicOpinion/index.cfm/Survey/index#p=1&instruments=SPECIAL.
Eurostat Portal Page – Economy and Finance – Government Finance Statistics (2016). Main national accounts taxaggregates(gov_10a_taxag,ESA-2010).Obtainedat:http://ec.europa.eu/eurostat/data.
EurostatPortalPage–EconomyandFinance–GovernmentStatistics,historicalESA-95data(2016a).Obtainedat:http://ec.europa.eu/eurostat/data.
EurostatPortalPage–EconomyandFinance–NationalAccounts.(2015).Luxembourg:Eurostat.Obtainedat:http://epp.eurostat.ec.europa.eu/.
EurostatPortalPage–Environmentandenergy–Energy.(2015).Luxembourg:Eurostat.Obtainedat:http://epp.eurostat.ec.europa.eu/.
Eurostat Portal Page – Environment and Energy – Environment (2016). Luxembourg: Eurostat. Obtained at: http://ec.europa.eu/eurostat/data.
EurostatPortalPage–Generalandregionalstatistics–Regionaleconomicaccounts.(2016).Obtainedat:http://ec.europa.eu/eurostat/data/database.
EurostatPortalPage–Populationandsocialcondition–Educationandtraining.(2016).Luxembourg:Eurostat.Obtainedat:http://epp.eurostat.ec.europa.eu.
EurostatPortalPage–Populationandsocialcondition–Health.(2016).Luxembourg:Eurostat.Obtainedat:http://epp.eurostat.ec.europa.eu.
Eurostat Portal Page – Population and social conditions – Income, Social Inclusion and Living Conditions. (2016).Luxembourg:Eurostat.Obtainedat:http://epp.eurostat.ec.europa.eu.
EurostatPortalPage–Populationandsocialconditions–Population.(2016).Luxembourg:Eurostat.Obtainedat:http://epp.eurostat.ec.europa.eu.
Eurydice Brief. Modernisation of Higher Education in Europe. (2015). Brussels: European Commission, Education,AudiovisualandCultureExecutiveAgency.
Evidentiranatovornavozilavobdobjuod19.4.2008do26.4.2008inod4.5.2008do11.5.2008skozicestninskepostajenaobmočjucelotneSlovenije(FreightvehiclesrecordedattollstationsintheentireterritoryofSloveniabetween19April2008and26April2008andbetween4May2008and11May2008).(2009).Celje:DARS.
Evropskasredstvapovezujejoslovenskapodjetja(EuropeanfundsconnectSloveniancompanies).(2015).PublishedinA.Vidmar(Ur.),pp.40–45.Ljubljana:SloveneHumanResourcesDevelopmentandScholarshipFund.
Financial Soundness Indicators. (2015, 2016).Washington: IMF.Obtained at: http://data.imf.org/?sk=9F855EAE-C765-405E-9C9A-A9DC2C1FEE47.
FinancialStabilityReport.Variousvolumes.Ljubljana:BankofSlovenia.
Fiscalburdenbytaxesandsocialcontributions,Slovenia,2014,FirstRelease,30September2015(2015).Ljubljana:SURS.Obtainedat:http://pxweb.stat.si/pxweb/Dialog/statfile2.asp.
Fisher,J.D.,Johnson,D.S.,SmeedingT.M.(2012).MeasuringtheTrendsinInequalityofindividualsandfamilies:IncomeandConsumption.Obtainedat:http://MeasuringTheTrendsInInequalityOfIn-preview.pdf.
Fournier,J.andFallF.(2015).Limitstogovernmentdebtsustainability,OECDEconomicsDepartmentWorkingPapers,No.1229.Paris:OECD.
Frameworkprogrammeforthetransitiontoagreeneconomy-OPZGtogetherwiththeOPZGActionplan(AniOPZG)and Lineministries’ operational plan (NAR) for years 2015–2016. (2015). Ljubljana:Ministry of the Environment andSpatialPlanning.
Fricke, T. (2016). The Right Incentives for a Low-Carbon Future. Obtained at: http://www.project-syndicate.org/commentary/incentives-for-a-low-carbon-future-by-thomas-fricke-2016-01.
GDPexhaustivenessadjustmentsandshadoweconomy,Slovenia,2010.(2013).Ljubljana:SURS.
Global Wealth Databook 2015. (2015). Credit Suisse Research Institute. Obtained at: http://www.protothema.gr/files/1/2015/10/14/ekthsi_0.pdf.
GreenGrowthIndicators.(2014).Ljubljana:StatisticalOfficeoftheRepublicofSlovenia.
Greenhousegasemissions,internalpreliminarydata.(2016).Ljubljana:SlovenianEnvironmentAgency.
Hassett,K.A.,Mathur,A.(2012).ANewmeasureofConsumptionInequality.Washington:AmericanEnterpriseInstitute.
Hauschildt,H.etal.(2015).SocialandeconomicConditionsofStudentLifeinEurope.SynopsisofIndicators.EurostudentV.2012–2015.Bielefeld:W.BertelsmannVerlagGmbH&Co.KG.
165Development Report 2016Bibliography and sources
Health at a Glance 2015. (2015). Paris: OECD. Obtained at: http://www.oecd.org/els/health-systems/Health-at-a-Glance-2015.pdf.
HealthataGlance:Europe2014:(2014).Paris:OECD.
HealthExpendituresandSourcesofFunding.(2015).Ljubljana:SURS.Obtainedat:http://www.stat.si/StatWeb/prikazi-novico?id=5306&idp=10&headerbar=8.
Healthforalldatabase2015.(2015).Geneva:WorldHealthOrganization(WHO).Obtainedat:http://www.google.si/webhp?nord=1#nord=1&q=health+for+all+database.
High-growthenterprises,Slovenia,2014–FirstRelease.(2015).Ljubljana:SURS.Obtainedat:http://www.stat.si.
http://www.mz.gov.si/si/pogoste_vsebine_za_javnost/analiza_zdravstvenega_sistema/.
Hyman, D. N. (1993). Public Finance. A Contemporary Application of Theory to Policy. Fourth Edition. Philadelphia:HarcourtBraceJovanovichCollegePublishers.
ICTspecialists,Newsrelease,No.15/2016.(2016).Luxembourg:Eurostat.
Indeksiindustrijskeproizvodnjepodejavnostih(Industrialproductionindicesbyactivity).(2015).Ljubljana:StatisticalOfficeoftheRepublicofSlovenia.Obtainedat:http://www.stat.si/.
Informacijaoizvajanjuukrepovzasistemskorazdolžitevmikroinmajhnihpodjetij(Informationontheimplementationof themeasures for systemicdeleveragingofmicro and small enterprises).Governmentmaterials. (2015). Ljubljana:MinistryofFinance.
Informacijskiportalenergetika,Statistika,Subvencijevenergetiki(Energysectorinformationportal,Statistics,Subsidiesinenergysector).(2014).Ljubljana:MinistryofInfrastructureandSpatialPlanning.
InnovativeTechnologiesFestival. (2015).Ljubljana:FacultyofElectricalEngineering.Availableat:http://www.ltfe.org/aktualno/festival-inovativnih-tehnologij-2/.
Insurancedata.(2015).Brussels:InsuranceEurope.
Internipodatkiomladihraziskovalcih(Internaldataonyoungresearchers).(2015).Ljubljana:SlovenianResearchAgency.
Izhodiščanormativnihspremembnapodročjuurejanjaprostora ingraditveobjektov–predlogzaobravnavo–novogradivošt.2(Basesforregulatorychangesintheareaofspatialplanningandconstructionofbuildings–proposalfordiscussion–newmaterials,no.2).Governmentmaterialsof13November2013.(2013).Ljubljana:MinistryofInfrastructureandSpatialPlanning.
Izzivimladim (Challenges foryoungpeople). Ljubljana:PublicAgencyof theRepublicofSlovenia for thePromotionofEntrepreneurship,Innovation,Development,InvestmentandTourism.Availableat:http://www.podjetniski-portal.si/.
Jamstvozamlade (Youthguarantee).Ukrepi za zaposlovanje inusposabljanje (Employmentand trainingmeasures).Ljubljana:TheMinistryofLabour,Family,SocialAffairsandEqualOpportunities.Obtainedat:http://www.mddsz.gov.si/.
Javnirazpiszadodelitevštipendijzadeficitarnepoklicezašolskoleto2015/2016(198.javnirazpis)(Callforproposalsforshortageprofessionscholarshipsforthe2015/2016schoolyear(Callforproposal198)).(2015).Ljubljana:SloveneHumanResourcesDevelopmentandScholarshipFund.Obtainedat:http://www.sklad-kadri.si/.
Joumard,I.,André,C.,Nicq,C.(2010).Healthcaresystems:efficiencyandpolicysettings.Paris:OECD.Obtainedat:http://www.oecd.org/eco/healthcaresystemsefficiencyandpolicysettings.htm.
Kavaš,D.(2014).RegionalnapolitikavSlovenijipovključitvivEvropskounijo(SloveneregionalpolicyafterEUaccession).DoctoralThesis,Ljubljana:FacultyofEconomics,UniversityofLjubljana.
Klemenčič,M. et al (2015). Academic profession and the conditions of academicwork in Slovenia. Findings of the2013EUROACsurvey.Ljubljana:CentreoftheRepublicofSloveniaforMobilityandEuropeanEducationalandTrainingProgrammes.
Klemm,A.(2009).Causes,benefitsandRisksofbusinesstaxincentives.Washington:InternationalMonetaryFund.
KljučnielementiUkrepafinančnegainženiringazaspodbujanjenaložb,poslovanjainkapitalskegautrjevanjaMSPpriSID–Slovenskiizvozniinrazvojnibanki–predlogzaobravnavo(KeyelementsoftheMeasureoffinancialengineeringforencouraginginvestments,operationandcapitalstrengtheningofSMEsbySID–SlovenianExportandDevelopmentBank-proposalfordiscussion).Governmentmaterials.(2015).Ljubljana:MinistryofEconomicDevelopmentandTechnology.
Koopmanetal.(2010).GiveCreditWhereCreditIsDue:TracingValueAddedinGlobalProductionChains.Massachusetts:NationalBureauofEconomicResearch.BERWorkingPaperNo.16426.
Koskeetal.(2015).The2013updateoftheOECDproductmarketregulation:PolicyinsightsforOECDandnon-OECDcountries.Paris:OECD.Obtainedat:http://www.oecd-ilibrary.org/.
KPKVestnik newsletter, various issues. (2015). Ljubljana: Commission for the Prevention of Corruption.Obtained at:http://www.kpk-rs.si.
Kumar, M.S. andWoo, J. (2010). Public debt and growth. IMFWorking PaperWP/10/174.Washington: InternationalMonetaryFund.

166 Development Report 2016Bibliography and sources
Kupec,B.(2016).Slovenskistart-upilanizbralitolikokotvprejšnjihsedmihletihskupaj!(Inthelastyearalone,Slovenianstart-upscollectedthesameamountas for theprevioussevenyears!) Ljubljana:Financeportal.Obtainedat:http://startaj.finance.si/.
Lepage-Saucier,N.,Schleich,J.andWasmer,E.(2013).MovingtowardsaSingleLabourContract:Pros,ConsandMixedFeelings.OECDEconomicsDepartmentWorkingPapers,No.1026.Paris:OECD.
Letnoporočilooizvajanjuukrepovzakonaorazvojnipodporipomurskiregijivobdobju2010–2015vletu2014(Annualreportfor2014ontheimplementationofmeasuresoftheDevelopmentSupportforthePomurjeRegion2010–2015Act).(2014).Ljubljana:GovernmentoftheRepublicofSlovenia.
Long-termcare.Slovenia2013.(2015).Ljubljana:SURS.Obtainedat:http://www.stat.si/StatWeb/prikazi-novico?id=4933&idp=21&headerbar=18.
Lušina,U.,Kušar, J. (2015).Zadolženostgospodarskih službvSloveniji (IndebtednessofSloveniancompanies). IMADWorkingPaper,No.5/2015.Ljubljana:InstituteofMacroeconomicAnalysisandDevelopment.Availableat:http://www.umar.gov.si/.
MACELIFinalReport.Comparativeefficiencyofhealthsystems,correctedforselectedlifestylefactors.(2014).WrittenbyRijksinstituutvoorVolksgezondheidenMilieu,ErasmusUniversistatRotterdam.ErasumusMedicalCenterRotterdam.Brussels:EuropeanCommission.
MainAggregatesoftheGeneralGovernment(AprilEDPreporting),Slovenia,2012–2015,FirstRelease,31March2016.(2016).Ljubljana:SURS.
Majcen,B. (2015).Ocenadolgoročnihprojekcij izdatkov inprejemkovzdravstva indolgotrajneoskrbe (Evaluationoflong-termprojectionsofexpenditureandrevenuesforhealthcareandlong-termcare).Ljubljana:InstituteforEconomicResearch.Posvetofinanciranjuinoptimizacijiplačilnihmodelovvzdravstvu(Paneldiscussiononfundingandoptimisingthehealthcarepaymentmodels).
Measuring financial protection in health systems: a new approach fort heWHO European Region. (2015).Technicalworkshop.Barcelona,21–22October2015.
Medeiros,J.andSchwierz,C.(2015).Efficiencyestimatesofhealthcaresystems.EuropeanEconomy.EconomicPaper549.Brussels:EuropeanCommission.Obtainedat:http://ec.europa.eu/economy_finance/publications.
Mervic,H.(2015).JavnofinanciranidenarniprejemkiprebivalcevSlovenijevobdobju2008–2013(PubliclyfundedcashbenefitsreceivedbySloveneresidentsintheperiod2008–2013,IMADWorkingPaper,Ljubljana:IMAD.
Močnik, D. and Rus,M. (2016). Slovenska podjetja in zančilnosti start-up ekosistema (Slovenian companies and thecharacteristicsofthestart-upecosystem).SlovenianEntrepreneurshipObservatory2015.Maribor:FacultyofEconomicsandBusinesses,UniversityofMaribor.
Monitoroncompetitivenessandtradeperformance.(2015).Brussels:Evropskakomisija,DGECFIN.MaterialsforLIMEworkinggroupmeetingwithEPC,November2015.
Monitoringpitnevode2014(Drinkingwatermonitoring2014).(2015).Annualreportonthequalityofdrinkingwaterin2014.Ljubljana:MinistryofHealth.Obtainedat:http://www.mpv.si/uploads/PR14MonitPV_zakljucno_porocilo.pdf.
Murn,A.(2015).Development-orientedstateaidtothemanufacturingsector.IBRevijaXLIX(1),5–20.Ljubljana:IMAD.
Nagode,M.,Zver,E.,Jacovič,A.,Marn,S.,Dominukuš,D.(2014).Long-termcare–useoftheinternationaldefinitioninSlovenia.IMADWorkingPaper,No.2/2014Ljubljana:InstituteofMacroeconomicAnalysisandDevelopment.Obtainedat:http://www.umar.gov.si/fileadmin/user_upload/publikacije/dz/2014/DZ02_14_summary.pdf.
NationalFootprintAccounts,2016Edition. (2016).Oakland,Geneva,Brussels:GlobalFootprintNetwork.Obtainedat:http://www.footprintnetwork.org/en/index.php/GFN/.
Neto položaj državnega proračuna RS do proračuna EU v letu 2015 (Slovenia’s net budgetary position against theEU budget in 2015). (2015). Ljubljana: Ministry of Finance. Obtained at: http://www.mf.gov.si/si/delovna_podrocja/proracun/neto_polozaj_drzavnega_proracuna_rs_do_proracuna_eu/.
Newsandmedia.(2016).NewYork:UnitedNations.Obtainedat:http://www.un.org/en/index.html.
Nitsche,R.,Heidhues,P.(2006).Studyonmethodstoanalysetheimpactofstateaidoncompetition.Brussels:EuropeanCommission.
Non-financialsectoraccounts.SI-STAT:Economy.Ljubljana:SURS.Obtainedat:http:pxweb.stat.si.
NUTSRegulationamended.(2013).RapidReports.StatisticalOfficeoftheRepublicofSlovenia.Obtainedat:http://www.stat.si/StatWeb/en/mainnavigation/data/show-first-release-old?IdNovice=5983.
Ocena stanja korupcije 2013 (Evaluation of the Corruption Situation 2013). (2013). Ljubljana: Commission for thePreventionofCorruption.Obtainedat:http://www.kpk-rs.si/.
OECDFrascatiManual. ProposedStandardPractice for SurveysonResearch andExperimentalDevelopment. (2002).Paris:OECD.

167Development Report 2016Bibliography and sources
OECDHealthData2015.(2016).Paris:OECD.Obtainedat:http://www.oecd.org/health/health-systems/oecdhealthdata.htm.
OECD Innovation Strategy andAgenda for PolicyAction 2015. (2015). Paris:OECD.Meetingof theOECDCouncil atMinisterialLevel.Paris,June3-4,2015.
OECDPatentStatisticsManual.(2009).Paris:OECD.
OECDProductMarketRegulationDatabase.(2013).Paris:OECD.Obtainedathttp://www.oecd.org/economy/pmr.
OECDScience,TechnologyandIndustryScoreboard2015.InnovationforGrowthandSociety.(2015).Paris:OECD.
OECDStat.(2015).Health.Long-termcareresourcesandUtilisation.Long-termcarerecipients.Paris:OECD.
OECDTowardsGreenGrowth:MonitoringProgress.(2011).Paris:OECD.
OHIMWebPage.(2016).Alicante:OHIM.Obtainedat:https://oami.europa.eu.
Openingofthejudicialyear2016.(2016).Ljubljana:SupremeCourtoftheRepublicofSlovenia.
OperationalProgrammeforReducingGHGEmissionsby2020.(2014).Ljubljana:GovernmentoftheRepublicofSlovenia.
OperationalProgrammefortheImplementationoftheEUCohesionPolicyinthePeriod2014–2020.(2015).Ljubljana:GovernmentOfficeforDevelopmentandEuropeanCohesionPolicy.Obtainedat:http://www.eu-skladi.si/.
Opravljenoprometnodelo2002–2014nadržavnihcestahvRS(TrafficworkperformedonSlovenianstateroadsin2002–2014period).(2014).Ljubljana:InfrastructureDirectorate.
OrdinanceamendingtheOrdinanceontheimplementationplanfortheOperationalProgrammefortheImplementationoftheEUCohesionPolicyinthePeriod2014–2020(2015).Ljubljana:UradnilistRS,No.76/15.
Ordinanceonstate-ownedassetsmanagementstrategy.(2015).Ljubljana:UradnilistRS,No.53/15.
PartnershipAgreementbetweenSloveniaandtheEuropeanCommissionfortheperiod2014–2020.(2014).Obtainedat: http://www.svrk.gov.si/fileadmin/svrk.gov.si/pageuploads/Dokumenti_za_objavo_na_vstopni_strani/PS__koncna_potrjena_141028.pdf.
Pescatori,A.,Sandri,DandSimon,J. (2014).DebtandGrowth: IsThereaMagicThreshold?IMFWorkingPaper14/34.Washington:InternationalMonetaryFund.
Peschner,J.andFotakis,C.(2013).GrowthpotentialofEUhumanresourcesandpolicyimplicationsforfutureeconomicgrowth.EuropeanCommissionWorkingPaper3/2013.Brussels:EuropeanCommission.
PetnajstoporočiloododeljenihdržavnihpomočehvSlovenijizaleta2010,2011in2012(FifteenthsurveyonstateaidgrantedinSloveniain2010,2011and2012).(2013).Ljubljana:MinistryofFinance.
PetoporočiloorealizacijiukrepovEnotnegadokumentazaboljšezakonodajnoinposlovnookoljeterdvigkonkurenčnosti(Fifth report on the implementation of themeasures from the Single document for ensuring better regulatory andbusinessenvironmentandincreasingcompetitiveness).(2015).Ljubljana:MinistryofPublicAdministration.
Plut, D. (2014). Sustainable Development of Slovenia - opportunities and pitfalls. Ljubljana: University of Ljubljana,FacultyofArts,GeographySection.
Pokreativnipotidopraktičnegaznanja (CreativePath toPracticalKnowledge).Ljubljana:SloveneHumanResourcesDevelopment and Scholarship Fund. Available at: http://www.sklad-kadri.si/si/razvoj-kadrov/po-kreativni-poti-do-prakticnega-znanja/.
Podatki o čakalnih dobah v letu 2015 (PatientWaitingTimes in 2015). (2016). Internalmaterials. Ljubljana:NationalInstituteofPublicHealth.
Podatkioštevilusmrtizaradinapadovna100.000prebivalcevvobdobju1996–2014(Numberofdeathsfromassaultper100,000inhabitantsintheperiod1996–2014)-internaldata.(2015).Ljubljana:StatisticalOfficeoftheRepublicofSlovenia.
Podmernik.,D.,andKerma,S.(2013).Thechallengesoforganicfarmingandtourismonorganicfarms.Koper:UniversityofPrimorska,FacultyofTourismStudies.
Poročiloočrpanjusredstevevropskekohezijskepolitike2007-2013(ReportonabsorptionofEUcohesionpolicyfundsin2007–2013).(2015).Ljubljana:GovernmentOfficeforDevelopmentandEuropeanCohesionPolicy.Obtainedat:http://www.svrk.gov.si/.
Prebil,R. (2016).Strdnimidelcionesnaženzrak(AirPollutionbyParticulateMatter).Publishedin:GEA,January2016.Ljubljana:Mladinskaknjiga
Predlog Resolucije o nacionalnem planu zdravstvenega varstva 2015-2025 ‘Skupaj za družbo zdravja’ (ProposedResolutiononResolutiononNationalHealthCarePlan2015–2025“Togetherforasocietyofhealth”).(2015).Ljubljana:MinistryofHealth.Obtainedathttp://www.mz.gov.si/si/zakonodaja_in_dokumenti/.
Predloginovecenovnepolitikenapodročjucestninjenja,Obrazložitevkpredlogunovegacenikacestnine(Proposalsforanewroadtollingpolicy,Explanationoftheproposednewtollpricing).(2013).Celje:DARS.
Pressreleases.(2015and2016).Ljubljana:MinistryofAgriculture,ForestryandFood.Obtainedat:http://www.mko.gov.si/.

168 Development Report 2016Bibliography and sources
Pressreleases.(2016).Ljubljana:MinistryoftheEnvironmentandSpatialPlanning.Obtainedat:http://www.mop.gov.si/.
Pressroom.(2016).Copenhagen:EuropeanEnvironmentAgency.Obtainedat:http://www.eea.europa.eu/sl.
Pricesovertime–2005onwards.(2015).OilBulletin.Brussels:EuropeanCommission.Obtainedat:https://ec.europa.eu/energy/en/statistics/weekly-oil-bulletin.
Progressmadeon2020energyefficiencytarget,Progressreport.(2016).Brussels:EuropeanCommission.
Prvo letnoporočiloo izvajanjuOperativnegaprogramaukrepovzmanjšanjaemisij toplogrednihplinovdo leta2020(FirstannualreportontheimplementationoftheOperationalProgrammeforReducingGHGEmissionsby2020).(2016).Ljubljana:MinistryoftheEnvironmentandSpatialPlanning.
Public administration development strategy 2015–2020. (2015). Ljubljana: Government of the Republic of Slovenia.Obtainedat:http://www.mju.gov.si/si/.
PublicopinionintheEuropeanUnion.(2015).StandardEurobarometer84.Brussels:EuropeanCommission.Obtainedat:http://ec.europa.eu/COMMFrontOffice/PublicOpinion/index.cfm/Survey/index#p=1&instruments=STANDARD.
Public Procurement as a Driver of Innovation in SMEs and Public Services. (2014). Brussels: European Commission.EnterpriseandIndustry.
Qualityoflife.Factsandviews(2015).StatisticalBooks.Luxembourg:Eurostat.
Rebernik,M. et al. (2014). Spregledan podjetniški potencialmladih (Overlooked entrepreneurial potential of youngpeople).GEMSlovenija2013.Maribor:UniversityofMaribor,FacultyofEconomicsandBusinesses.
Rebernik,M.etal.(2015).Pomanjkanjevitalnostislovenskegapodjetništva(LackofvitalityofSlovenianentrepreneurship):GEMSlovenija2014.Maribor:UniversityofMaribor,FacultyofEconomicsandBusinesses.
ReportonTelecomsPriceDevelopments1998–2010.(2010).Brussels:EuropeanCommission.
ReportonthesituationintheenergysectorinSloveniain2014.(2015).Ljubljana:AGEN-RS.
ResearchandDevelopmentActivity,Slovenia,2014–finaldata.(2016).Ljubljana:SURS.Obtainedat:http://www.stat.si.
Resolucijaonacionalnemgozdnemprogramu(Resolutiononthenationalforestprogramme).(2007).Ljubljana:UradnilistRS,No.111/07.
ResolucijaonacionalnemprogramuizobraževanjaodraslihvRSzaobdobje2013–2020(ResolutionontheMasterPlanforAdultEducationintheRepublicofSloveniafor2012–2020).UradnilistRS,No.90/2013.
Resolucijaonacionalnemstanovanjskemprogramu2015–2025(ResolutionontheNationalHousingProgramme2015–2025)(2015).Ljubljana:UradnilistRS,No.92/2015.
Reševanjeinprestrukturiranjepodjetijvtežavah(Rescueandrestructuringofcompaniesindifficulty).(s.a.).Ljubljana:MGRT. Obtained at: http://www.mgrt.gov.si/si/delovna_podrocja/podjetnistvo_konkurencnost_in_tehnologija/resevanje_in_prestrukturiranje_podjetij_v_tezavah/
Rojec,M. andcontributors (2008).Kakodovečjeučinkovitosti javnofinančnih sredstev zapovečanjekonkurenčnostigospodarstva:Analizaučinkovitostidržavnihpomočiinpredlogizanjenoizboljšanje(Howtoimprovetheefficiencyoftheallocationoffiscalresourcesearmarkedforincreasingeconomiccompetitiveness:Analysisoftheefficiencyofstateaidsandproposalsforimprovement)(CRPV5-0201)(2008).Ljubljana:FacultyofSocialSciencesandNovomesto:SchoolofBusinessandManagement.
Rojec,M. and contributors (2008). Kakodo večjeučinkovitosti razporejanja javnofinančnih sredstev: analizaučinkovdržavnihpomočinaomejevanjekonkurence(Howtoachievemoreefficientallocationoffiscalresources:Analysisoftheimpactofstateaidsonrestrictingofcompetition)(CRPV5-0408)(2010).Ljubljana:FacultyofSocialSciences.
Sassi, F.,A.Belloni andC.Capobianco. (2013).TheRoleof FiscalPolicies inHealthPromotion.OECDHealthWorkingPapers,No.66,Paris:OECD.Obtainedat:http://dx.doi.org/10.1787/5k3twr94kvzx-en.
Schmoch,U.(2008).ConceptofaTechnologyClassificationforCountryComparisons.FinalReporttotheWIPO.Karlsruhe:FraunhoferInstituteforSystemsandInnovationResearch.
SHARE Survey. Wave 4. Interna obdelava podatkov o prejemnikih formalne in neformalne dolgotrajne oskrbe innezadovoljenihpotrebah(Internallyprocesseddataonrecipientsofformalandinformallong-termcareandonunmetneeds).(2015).Ljubljana:InstituteforEconomicResearch.
SIPOAnnualreport2011.(2013).Ljubljana:SlovenianIntellectualPropertyOffice.Obtainedat:http://www.uil-sipo.si.
SI-StatDataPortal–Demographyandsocialstatistics–Education.(2016).Ljubljana:StatisticalOfficeoftheRepublicofSlovenia.Obtainedat:http://www.stat.si/.
SI-StatDataPortal–Demographyandsocialstatistics–LabourMarket.(2016).Ljubljana:StatisticalOfficeoftheRepublicofSlovenia.Obtainedat:http://www.stat.si/.
SI-StatDataPortal–Demographyandsocialstatistics–LevelofLiving(2015).Ljubljana:StatisticalOfficeoftheRepublicofSlovenia.Obtainedat:http://www.stat.si/.

169Development Report 2016Bibliography and sources
SI-StatDataPortal–Demographyandsocialstatistics–Population.(2016).Ljubljana:StatisticalOfficeoftheRepublicofSlovenia.Obtainedat:http://www.stat.si/.
SI–Stat Data Portal – Development andTechnology. (2016). Ljubljana: Statistical Office of the Republic of Slovenia.Obtainedat:http://www.stat.si/.
SI–StatDataPortal–Economy–Construction.(2016).Ljubljana:StatisticalOfficeoftheRepublicofSlovenia.Obtainedat:http://www.stat.si/.
SI–Stat Data Portal – Economy – National Accounts. (2015). Ljubljana: Statistical Office of the Republic of Slovenia.Obtainedat:http://www.stat.si/.
SI–StatDataPortal–Environmentandnaturalresources.(2015).Ljubljana:StatisticalOfficeoftheRepublicofSlovenia.Obtainedat:http://www.stat.si/.
SI–StatDataPortal–Prices.(2016).Ljubljana:StatisticalOfficeoftheRepublicofSlovenia.Obtainedat:http://www.stat.si/.
SkupnoporočilooprostovoljstvuvRepubliki Sloveniji za leto2014 (Joint reportonvolunteering in theRepublicofSloveniafor2014).(2015).Ljubljana:MinistryofPublicAdministration.Obtainedathttp://www.mju.gov.si/si/delovna_podrocja/nevladne_organizacije/.
Slovene Enterprise Fund – key results. (2016). Maribor: Slovenian Enterprise Fund Obtained at: http://www.podjetniskisklad.si/.
Slovenia – Review of progress on policymeasures relevant to the correction ofmacroeconomic imbalances (2015).Brussels:EuropeanCommission.Obtainedat:http://ec.europa.eu/.
Slovenia:Skillsforecastsupto2025.(2015).Solun:Cedefop.
SlovenianEnterpriseFund.(s.a.).DirectloansforSMEs5+.Obtainedat:http://www.podjetniskisklad.si/en/sef-s-products/programme-sme5/microcredits.
SlovenianEnterpriseFund.(s.a.).Directloansforyoungenterprises.Obtainedat:http://www.podjetniskisklad.si/en/sef-s-products/programme-young-enterprises/microcredits.
SlovenianEnterpriseFund.(s.a.).GuaranteesforSMEs5+.Obtainedat:http://www.podjetniskisklad.si/en/sef-s-products/programme-sme5.
SlovenianEnterpriseFund.(s.a.).Guaranteesforyoungenterprises.Obtainedat:http://www.podjetniskisklad.si/en/sef-s-products/programme-young-enterprises/guarantees.
SlovenianForestServiceReportonSlovenianforestsfor2014.(2015).Ljubljana:SlovenianForestService.
Spatial Development Report. (2015). Ljubljana: Ministry of the Environment and Spatial Planning. Spatial Planning,ConstructionandHousingDirectorate.
SpatialDevelopmentStrategyofSlovenia.(2004).Ljubljana:MinistryoftheEnvironmentandSpatialPlanning.
SpremembeključnihelementovUkrepafinančnegainženiringazaspodbujanjerazvojamalihinsrednjevelikihpodjetijpri SID– Slovenski izvozni in razvojnibanki –predlog zaobravnavo (Amendments to key elementsof themeasureoffinancialengineeringforpromotingthedevelopmentofSMEsbySID–SlovenianExportandDevelopmentBank–proposalfordiscussion).Governmentmaterials.(2015).Ljubljana:MinistryofEconomicDevelopmentandTechnology.
Spremembe ključnih elementov Ukrepa finančnega inženiringa za spodbujanje tehnološko-razvojnih projektov2011–2013priSID–Slovenskiizvozniinrazvojnibanki–predlogzaobravnavo(Amendmentstokeyelementsofthemeasure of financial engineering for promoting technological development projects 2011–2013by SID – SlovenianExportandDevelopmentBank–proposalfordiscussion).Governmentmaterials.(2015).Ljubljana:MinistryofEconomicDevelopmentandTechnology.
Stateaidinventory.(2015).Ljubljana:MinistryofFinance.
Stateaidscoreboard2014(2014).Brussels:EuropeanCommission.Obtainedat:http://ec.europa/eu/competition/.
Stateaidscoreboard2015(2016).Brussels:EuropeanCommission.Obtainedat:http://ec.europa/eu/competition/.
Stateofexecutionof interimpaymentsandsubmissionofpaymentapplicationsforHeading1b(programmes2007–2013),Stateofadoptionof2014–2020ESIFOperationalProgrammes(Statusasof30November2015).(2015).Brussels:EuropeanCommission.
State-owned assetsmanagement strategy. (2015). Ljubljana: Government of the Republic of Slovenia. Obtained at:http://www.vlada.si/fileadmin/dokumenti/si/projekti/2015/.
StatisticalDataWarehouse.(2014,2015).Frankfurt:EuropeanCentralBank.
StatisticalInsuranceBulletin.(2015).Ljubljana:SlovenianInsuranceAssociation.
Statističnipodatki izbilancestanja in izkazaposlovnega izidagospodarskihdružbza leta1995–2014(Statisticaldatafromcompanies’balancesheetsandprofitandlossstatementsfor1995–2014).(1996-2015).Ljubljana:AgencyoftheRepublicofSloveniaforPublicLegalRecordsandRelatedServices.

170 Development Report 2016Bibliography and sources
Stat’o’book.(2015).StatisticaloverviewofSlovenia2015.Ljubljana:StatisticalOfficeoftheRepublicofSlovenia.
Strategic framework for European cooperation in education and training“ET 2020”.Official Journal of the EuropeanUnionC119/2.
Stropniketal.(2010).Povertyandmaterialdeprivationoftheelderly.Obtainedat:http://www.mddsz.gov.si/fileadmin/mddsz.gov.si/pageuploads/dokumenti__pdf/revscina_IER.pdf.
StudytoquantifyandanalysetheVATGapintheEUMemberStates.(2015).CommissionedbyEuropeanCommission(TAXUD).Obtainedat:http://ec.europa.eu/.
ŠestnajstoletnoporočiloododeljenihdržavnihpomočehvSlovenijizaleta2012,2013in2014(SixteenthannualsurveyonstateaidgrantedinSloveniain2012,2013and2014)(2015).Ljubljana:MinistryofFinance.
ŠestoporočiloorealizacijiukrepovEnotnegadokumentazaboljšezakonodajnoinposlovnookoljeterdvigkonkurenčnosti(Sixth reporton the implementationof themeasures from theSingledocument for ensuringbetter regulatory andbusinessenvironmentandincreasingcompetitiveness).(2016).Ljubljana:MinistryofPublicAdministration.Obtainedat:http://www.stopbirokraciji.si/.
Tackling Harmful Alcohol Use: Economics and Public Health Policy. (2015). Paris: OECD. Obtained at: http//dx.doi.org/10.1787/9789264181069-en.
Taxing Energy Use: A Graphical Analysis, OECD Publishing. (2013). Paris: OECD. Obtained at: http://dx.doi.org/10.1787/9789264183933-en.
TheEuropeanenvironment—stateandoutlook2015.Synthesisreport.(2015).Copenhagen:EuropeanEnvironmentAgency.
The European Higher Education Area in 2015. (2015). Brussels: European Commission, Education, Audiovisual andCultureExecutiveAgency,Eurydice.
Theeurosystemhouseholdfinanceandconsumptionsurvey.Resultsfromthefirstwave.(2013).StatisticspaperseriesNo2.Frankfurt:EuropeanCentralBank.
The Global Competitiveness Report (various volumes). Geneva: World Economic Forum. Obtained at: http://www.weforum.org.
Thenon-observedeconomyinthesystemofnationalaccounts.(2014).Paris:OECD.Obtainedat:http://www.oecd.org/.
TheShadowEconomyinEurope,2013.(2013).ATKearney,VISAandJohannesKeplerInstituteLinz.
TheTerritorial State and Perspectives of the EuropeanUnion. 2011 update. (2011). Brussels: European Commission.BackgrounddocumentfortheTerritorialAgendaoftheEuropeanUnion2020.
TheWorldCompetitivenessYearbook.(variousvolumes).Lausanne:InstituteforManagementDevelopment.Obtainedat:https://www.worldcompetitiveness.com/.
TheoreticalvalueaddedtaxandVATgapfor2009–2011.(2013).Ljubljana:SURS.
Tradeinvalueadded:Slovenia.(2015).Paris:OECDandWTO.
TrinajstoporočiloododeljenihdržavnihpomočehvSloveniji(zaleta2005,2006in2007)(ThirteenthsurveyonstateaidgrantedinSlovenia(in2005,2006and2007).(2008).Ljubljana:MinistryofFinance.
Urek,G.,Knapič,M.,ZemljičUrbančič,M.,Škerlavaj,V., Simončič,A.,Persolja, J.,RakCizelj,M.,Radišek,S.andLešnik,M.(2012).TheuseofpesticidesandtheidentificationofpossiblesolutionsfortheirrationaluseinSlovenia.Ljubljana:AgriculturalInstituteofSlovenia.
Utemeljitevopredelitveključnihprioritet inokvirnega razreza sredstevzaprogramskoobdobje2014–2020 (Reasonsforidentifyingkeyprioritiesandtheframeworkforallocationoffundsintheprogrammingperiod2014–2020).(2015).Ljubljana:MinistryofEconomicDevelopmentandTechnology.
VanderMarel,E.(2012).TradeinServicesandTFP:TheRoleofRegulation.TheWorldEconomy,Vol.35,No11,pp.1530–1558.doi:10.1111/twec.12004.
VmesnovrednotenjeProgramaspodbujanjakonkurenčnostiPomurskeregijevobdobju2010–2015(Interimevaluationof the Programme to foster the competitiveness of the Pomurje region in theperiod 2010–2015). (2014). Ljubljana:MGRT.Obtainedat:http://www.mgrt.gov.si/.
WorldBankGovernanceIndicators.(2015).Washington:WorldBank.Obtainedat:http://info.worldbank.org/governance/wgi/.
WorldUniversityRankings2015–2016.London:ThomsonReuters.Availableat:https://www.timeshighereducation.com/.
Zadovoljstvo javnosti zdelovanjemslovenskih sodišč (Public satisfactionwith theperformanceofSloveniancourts).(2014).Ljubljana:SupremeCourtoftheRepublicofSlovenia.
Zaključnoporočilodelovneskupineza spremljanje izvajanjaakcijskeganačrta razvojaekološkegakmetijstvado leta2015(FinalreportoftheworkinggrouponthemonitoringofimplementationoftheActionplanforthedevelopmentoforganicfarminguntil2015).(2012).Ljubljana:MinistryofAgricultureandtheEnvironment.

171Development Report 2016Bibliography and sources
Zakonodavkuoddohodkovpravnihoseb(CorporateIncomeTaxAct).(2006,2008,2009,2010,2012).Ljubljana:UradnilistRS.Nos117/06,56/08,76/08,5/09,96/09,43/10,30/12.
Zakonofinančnemposlovanju,postopkihzaradiinsolventnostiinprisilnemprenehanju(FinancialOperations,InsolvencyProceedingsandCompulsoryWinding-upAct)(UPB8-ZFPPIPP).(2014).Ljubljana:UradnilistRS,No.13/14.
Zakon o pomoči za reševanje in prestrukturiranje gospodarskih družb v težavah (Act Governing the Rescue andRestructuringAidforCompaniesinDifficulty)(ZPRPGDT).(2007).Ljubljana:UradnilistRS,No.44/07.
Zakonospodbujanjuskladnegaregionalnegarazvoja(PromotionofBalancedRegionalDevelopmentAct).(2011,2012).Ljubljana:UradnilistRS,Nos20/11and57/12.
Zakon o spremembah in dopolnitvah Zakona o finančnemposlovanju, postopkih zaradi insolventnosti in prisilnemprenehanju (Act Amending the Financial Operations, Insolvency Proceedings and Compulsory Winding-up Act)(ZFPPIPP-F).(2013).Ljubljana:UradnilistRS,No.100/2013.
ZakonospremembahindopolnitvahZakonaopomočizareševanjeinprestrukturiranjegospodarskihdružbvtežavah(ActAmendingtheActGoverningtheRescueandRestructuringAidforCompaniesinDifficulty)(ZPRPGDT-E).(2013).Ljubljana:UradnilistRS,No.56/13.
ZakonospremembahindopolnitvahZakonaoukrepihRepublikeSlovenijezakrepitevstabilnostibank(ActAmendingtheActRegulatingMeasuresoftheRepublicofSloveniatoStrengthentheStabilityofBanks)(ZUKSB-A).(2015).Ljubljana:UradnilistRS,No.104/15.
ZakonospremembahindopolnitvahZakonaovišjemstrokovnemizobraževanju(ActAmendingthePost-SecondaryVocationalEducationAct)(ZVSI-A).Ljubljana:UradnilistRS,No.100/2013.
ZakonoukrepihRepublikeSlovenijezakrepitevstabilnostibank(ActRegulatingMeasuresoftheRepublicofSloveniatoStrengthentheStabilityofBanks)(ZUKSB).(2012).Ljubljana:UradnilistRS,No.105/12.
ZakonRSointegritetiinpreprečevanjukorupcije(IntegrityandPreventionofCorruptionAct)(ZIntPK).(2010).Ljubljana:UradnilistRS,No.45/2010.
Zakonzauravnoteženjejavnihfinanc(FiscalBalanceAct)(ZUJF).(2012).Ljubljana:UradnilistRS,No.40/2012.
Zdravstvenistatističniletopis(HealthStatisticalYearbook).(2013).Ljubljana:NationalInstituteofPublicHealth.Obtainedat:http://www.nijz.si/sl
ZhongXiangZhang.(2001).TheRelativeImportanceofStructuralChangeandIntensityChange.WhyDidtheEnergyIntensity Fall inChina’s Industrial Sector in the1990? (2000). JointMeetingof theEnergyModellingForumand theInternationalEnergyWorkshop,StanfordUniversity.
Žnidarič, H. et al. (2015). Improving theVocational Competences ofTeachers. Ljubljana: Institute of the Republic ofSloveniaforVocationalEducationandTraining.
2030 climate and energy framework, European Council conclusions of 24October 2014. (2014). Brussels: EuropeanCommission.

172 Development Report 2016Acronyms
List of acronyms and abbreviations used
ARSO=SlovenianEnvironmentAgency
BAMC=BankAssetsManagementCompany
Cedefop=EuropeanCentrefortheDevelopmentofVocationalTraining
CH4=methane
CIT=corporateincometax
CMMAC=commonmethodologyformeasuringadministrativecosts
CO2=carbondioxide
CPC=CommissionforthePreventionofCorruption
CPI=consumerpriceindex
DARS=MotorwayCompanyoftheRepublicofSlovenia
DRSI=SlovenianInfrastructureAgency
EBITDA=earningsbeforeinterest,taxes,depreciationandamortization
EC=EuropeanCommission
ECB=EuropeanCentralBank
EMU=EconomicandMonetaryUnion
EPO=EuropeanPatentOffice
ESA=EuropeanSystemofAccounts
ET2020=EducationandTraining2020
EU=EuropeanUnion
EUR=euro
EUROAC=AcademicProfessioninEurope:ResponsestoSocietalChallenges
EUROSTAT=StatisticalOfficeoftheEuropeanUnion
FDI=foreigndirectinvestment
FURS=FinancialAdministrationoftheRepublicofSlovenia
GDP=grossdomesticproduct
GEM=GlobalEntrepreneurshipMonitor
GERD=grossdomesticexpenditureonresearchanddevelopment
Gg=gigagram(1000tonnes)
gha=globalhectare
GHG=greenhousegases
GURS=SurveyingandMappingAuthorityoftheRepublicofSlovenia
ha=hectare
HIIS=HealthInsuranceInstituteofSlovenia
ICT=informationandcommunicationtechnology
IER=InstituteforEconomicResearch
IMAD=InstituteofMacroeconomicAnalysisandDevelopment
IMD=InstituteforManagementDevelopment
IMF=InternationalMonetaryFund
ISCO=InternationalStandardClassificationofOccupations
ITR=implicittaxrate(onlabour,capital,consumption,andenergy)
LFS=labourforcesurvey
MGRT=MinistryofEconomicDevelopmentandTechnology
MRA=masterrestructuringagreement
N2O=nitrousoxide
NKBM=NovaKreditnaBankaMaribor
NLB=NovaLjubljanskaBanka

173Development Report 2016Acronyms
NMS(newmemberstates)=countriesthathavejoinedtheEUsince2004
NPPfertilisers=mineralfertiliserscontainingnitrogen,phosphorusandpotassium
NUTSclassification=nomenclatureofterritorialunitsforstatistics
OECD=OrganisationforEconomicCooperationandDevelopment
OHIM=OfficeforHarmonizationintheInternalMarket
OPROPI=OperationalProgrammeforEnvironmentalandTransportInfrastructureDevelopment
PDII=PensionandDisabilityInsuranceInstituteofSlovenia
PM=particulatematter
PMR=productmarketregulation
pp=percentagepoint
PPS=purchasingpowerstandard
R&D=researchanddevelopment
RES=renewableenergysources
RS=RepublicofSlovenia
SEF=SloveneEnterpriseFund
SHARE=SurveyofHealth,AgeingandRetirementinEurope
SIDBank=SlovenianExportandDevelopmentBank
SIPO=SlovenianIntellectualPropertyOffice
SKD=StandardClassificationofActivities
SME=smallandmedium-sizedenterprises
SPIRIT=PublicAgencyforEntrepreneurship,Internationalization,ForeignInvestmentsandTechnology
SSH=SlovenianSovereignHolding
SURS=StatisticalOfficeoftheRepublicofSlovenia
TAXUD=TaxationandCustomsUnionDirectorate
TEA=totalearly-stageentrepreneurialactivity
TEŠ=ŠoštanjThermalPowerPlant
tkm=tonne-kilometre
UAA=utilisedagriculturalarea
USD=USdollar
VAT=valueaddedtax
WEF=WorldEconomicForum
WIPO=WorldIntellectualPropertyOrganization
ZGD=CompaniesAct
ZPIZ-2=PensionandDisabilityInsuranceAct,December2014
ZUJF=FiscalBalanceAct

deve
lopm
ent r
epor
t 201
0
dev
elop
men
t re
por
t 20
10
development report 2016