dgc 16 09_08 - baml conference
TRANSCRIPT

1
CANADA’S INTERMEDIATE GOLD PRODUCER
Bank of America Merrill Lynch
Canada Mining Fireside Chat Event Toronto – September 8, 2016

2
Forward Looking Information This presentation contains certain forward-looking information and statements as defined in applicable securities law (referred to herein as
“forward-looking statements”). Forward-looking statements include, but are not limited to, statements with respect to strategic focus; 2016
guidance (gold production, total cash costs, all-in sustaining costs, and sustaining capital); refinancing <$300 million of the Convertible
Notes before due date; expected future production and mining activities, including development plan for West Detour; life of mine plan;
decision to proceed with underground exploration program for Zone 58N in Q4 2016; and continuation of exploration activities.
Forward-looking statements involve known and unknown risks, uncertainties and other factors which may cause actual results, performance
or achievements to be materially different from any of its future results, performance or achievements expressed or implied by forward-
looking statements. These risks, uncertainties and other factors include, but are not limited to, assumptions and parameters underlying the
life of mine plan not being realized, a decrease in the future gold price, discrepancies between actual and estimated production, changes in
costs (including labour, supplies, fuel and equipment), changes to tax rates; environmental compliance and changes in environmental
legislation and regulation, exchange rate fluctuations, general economic conditions and other risks involved in the gold exploration and
development industry, as well as those risk factors discussed in the section entitled “Description of Business - Risk Factors” in Detour
Gold’s 2015 AIF and in the continuous disclosure documents filed by Detour Gold on and available on SEDAR at www.sedar.com.
Such forward-looking statements are also based on a number of assumptions which may prove to be incorrect, including, but not limited to,
assumptions about the following: the availability of financing for exploration and development activities; operating and sustaining capital
costs; the Company’s ability to attract and retain skilled staff; sensitivity to metal prices and other sensitivities; the supply and demand for,
and the level and volatility of the price of, gold; the supply and availability of consumables and services; the exchange rates of the Canadian
dollar to the U.S. dollar; energy and fuel costs; the accuracy of reserve and resource estimates and the assumptions on which the reserve
and resource estimates are based; market competition; ongoing relations with employees and impacted communities and general business
and economic conditions. Accordingly, readers should not place undue reliance on forward-looking statements. The forward-looking
statements contained herein are made as of the date hereof, or such other date or dates specified in such statements.
All forward-looking statements in this presentation are necessarily based on opinions and estimates made as of the date such statements
are made and are subject to important risk factors and uncertainties, many of which cannot be controlled or predicted. Detour Gold
undertakes no obligation to update publicly or otherwise revise any forward-looking statements contained herein whether as a result of new
information or future events or otherwise, except as may be required by law.
All amounts are in US dollars except as noted.
3
Notes to Investors
Qualified Persons
The scientific and technical content of this presentation was reviewed, verified and approved by Drew Anwyll, P.Eng., Senior Vice President Technical
Services, and exploration results was reviewed, verified and approved by Guy MacGillivray, P.Geo., Exploration Manager , both Qualified Person as
defined by Canadian Securities Administrators National Instrument 43-101 “Standards of Disclosure for Mineral Projects”.
Information Containing Estimates of Mineral Reserves and Resources The mineral reserve and resource estimates reported in this presentation were prepared in accordance with Canadian National Instrument 43-
101Standards of Disclosure for Mineral Projects (“NI 43-101”), as required by Canadian securities regulatory authorities. For United States reporting
purposes, the United States Securities and Exchange Commission (“SEC”) applies different standards in order to classify mineralization as a reserve. In
particular, while the terms “measured,” “indicated” and “inferred” mineral resources are required pursuant to NI 43-101, the SEC does not recognize such
terms. Canadian standards differ significantly from the requirements of the SEC. Investors are cautioned not to assume that any part or all of the mineral
deposits in these categories constitute or will ever be converted into reserves. In addition, “inferred” mineral resources have a great amount of uncertainty
as to their existence and great uncertainty as to their economic and legal feasibility. It cannot be assumed that all or any part of an inferred mineral
resource will ever be upgraded to a higher category. Under Canadian securities laws, issuers must not make any disclosure of results of an economic
analysis that includes inferred mineral resources, except in rare cases.
Non-IFRS Financial Performance Measures The Company has included non-IFRS measures in this presentation: total cash costs and all-in sustaining costs. The Company believes that these
measures, in addition to conventional measures prepared in accordance with IFRS, provide investors an improved ability to evaluate the underlying
performance of the Company. The non-IFRS measures are intended to provide additional information and should not be considered in isolation or as a
substitute for measures of performance prepared in accordance with IFRS. These measures do not have any standardized meaning prescribed under
IFRS, and therefore may not be comparable to other issuers. Other companies may calculate these measure differently.
Detour Gold reports total cash costs on a sales basis. Total cash costs include production costs such as mining, processing, refining and site
administration, agreements with Aboriginal communities, less non-cash share-based compensation and net of silver sales divided by gold ounces sold to
arrive at total cash costs per gold ounce sold. The measure also includes other mine related costs incurred such as mine standby costs and current
inventory write downs. Production costs are exclusive of depreciation and depletion. Production costs include the costs associated with providing the
royalty in kind ounces.
The Company believes the measure all-in sustaining costs more fully defines the total costs associated with producing gold. The Company calculates all-in
sustaining costs as the sum of total cash costs (as described above), share-based compensation, corporate general and administrative expense,
exploration and evaluation expenses that are sustaining in nature, reclamation cost accretion, sustaining capital including deferred stripping, and realized
gains and losses on hedges due to operating and capital costs, all divided by the gold ounces sold to arrive at a per ounce figure.
Costs excluded from all-in sustaining costs are non-sustaining capital expenditures and exploration costs that are expected to materially increase
production, financing costs and tax expense. Consequently, this measure is not representative of all of the Company’s cash expenditures. In addition, the
calculation of all-in sustaining costs does not include depreciation and depletion expense as it does not reflect the impact of expenditures incurred in prior
periods.

4
OPERATIONS GROWTH BALANCE SHEET
Mine and mill optimization
Organic growth valuation
Debt reduction
Realize on economies of scale
Add value with: Maintain capital discipline
Satellite deposit development
Early-stage project acquisition
Shareholder returns
Strategic Focus
4
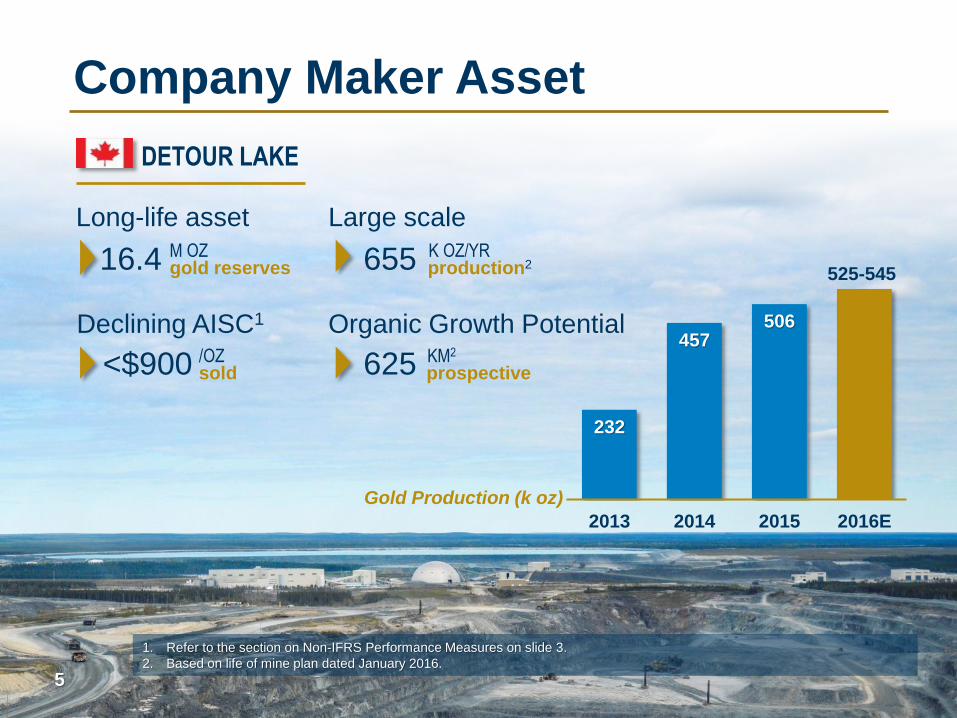
5
DETOUR LAKE
16.4 M OZ gold reserves
Company Maker Asset
<$900 /OZ sold
Long-life asset
Declining AISC1
232
457 506
2013 2014 2015 2016E
Gold Production (k oz)
525-545 655 K OZ/YR
production2
Large scale
Organic Growth Potential
625 KM2
prospective
5
1. Refer to the section on Non-IFRS Performance Measures on slide 3.
2. Based on life of mine plan dated January 2016.

6
AEM/YRICanadianMalartic
GRed Lake
AEMMeadowbank
#1 Large scale/Long Life Mine
16.4
7.8
2.1 0.9
DGCDetour Lake
AEM/YRICanadianMalartic
GRedlake
AEMMeadowbank
525-
545
560
300-
330 305
100% ownership in Quality Asset
DGC
Detour Lake
DGC
Detour Lake
2015YE Reserves (M oz) 2016 Production Guidance (K oz)

7
PRODUCTION
266 K OZ gold
H1 2016 Highlights
7
COSTS FINANCIALS
$664
$925
TCC1
/oz sold
AISC1
/oz sold
$65 OPERATING PROFIT million
$154 CASH BALANCE million
DEBT REDUCTION $82
Positive infill drilling results from prospective Zone 58N
million
42.9 MT mined
10.0 MT milled
1. Refer to the section on Non-IFRS Performance Measures on slide 3. Reconciliation of these measures is described in the
MD&A for Q2’16.

8
$681
$623
$500
$358
2013 2014 2015 YTD 2016
$800
$1,000
$1,200
$1,400
$1,600
$1,800
Debt Reduction Plan
Refinancing
Goal
Nov 2017
US$1,329
C$1,724
47% DEBT REDUCTION SINCE 2013
<$300
Note: Cash and short-term investments as at year-end. Gold price as at September 7.
YTD 2016
Gold price
$/oz
YTD repaid $142 M from surplus cash

9
H2 2016 Operational Focus
MINE
Accelerate progress around
Campbell pit area
Complete dewatering to access
Calcite Zone at end of September
Focus on dilution control
MILL
Sustain throughput of >60,000 tpd
Process MG fines starting in September
Fast track implementation of oxygen
control with lead nitrate for 2017 to
improve recovery

10
2016 Revised Guidance (Sept 6, 2016)
10
1. Refer to the section on Non-IFRS Performance Measures on slide 3. Revised guidance at US$/C$ exchange rate of 1.28
(prior at 1.33).
$700-750 /oz sold
K OZ
gold
TCC1
$970-1,020 AISC1
/oz sold
$100-110 million No change
Prior 540-570k oz; Access to higher grade Calcite Zone
delayed to Q4 due to flooding in pit caused by heavy
rainfalls in mid-August
Q3: ~120,000 oz / Q4: 138,000-158,000 oz
Prior TCC
$640-700/oz sold
Prior AISC
$920-980/oz sold
525-545
Additional non-cash charge of
C$10 M to account for stockpile
drawdown; Additional C$12 M charge
for the cost of processing the fines
PRODUCTION
COSTS
SUSTAINING CAPITAL

11
WEST DETOUR
DEVELOPMENT
Organic Growth Pipeline
ZONE 58N
LOWER DETOUR
REGIONAL
EXPLORATION
~10,000 m completed
on Lower Detour
trend
~6,500 m
underway on TMA
targets
Economic
analysis
underway Pre-stripping 2018
Permitting and
FN consultation
underway
Gold production
2019
Infill drilling
program underway
11

12
Zone 58N – Lower Detour
ZONE 58 N: 2016 DRILLING TO DATE
Completed 36,830 m in 119
holes
Results confirm good
continuity in upper 250 m
where drilled at 25 m intervals
NEXT STEPS
Initial environmental baseline
work started
Surface and UG infrastructure
work started; cost estimated to
be completed in Q4
Decision to proceed with UG
exploration program expected
in Q4
Looking West - Surface
- 250 m
- 500 m
- 750 m
- 1000 m

13
Regional Exploration
Zone 58N
Detour Lake Mine
West Detour
H1 REGIONAL PROGRAM
Completed 9,977 m in
36 holes on Lower Detour
trend
Anomalous to up to 5 g/t
intersected over narrow
widths
IP surveys completed
DRILLING PROGRAM
UNDERWAY
~6,500 m of drilling east
of current tailings facility

14
LONG-LIFE ASSET WITH LARGE
PRODUCTION PROFILE
PRODUCTION GROWTH
DECLINING AISC
GROWING FREE CASH FLOW
ORGANIC GROWTH POTENTIAL
INTERMEDIATE GOLD PRODUCER
STRONG FUNDAMENTALS

15
ADDITIONAL information
Safety Performance
Quarterly Operational
Statistics
H1 2016 AISC
Gold & Currency Contracts
at June 30, 2016
LOM Production Plan
Year-end 2015 Reserves &
Resources
Shareholder Information
Analyst Coverage
Management & Directors
Contact Information

16
2.5 2.3
1.6 1.3
0.0
0.5
1.0
1.5
2.0
2.5
2014 2015 Q1'16 Q2'16
Total Recordable Injury
Frequency Rate (TRIFR)1
Safety Performance
1. TRIFR: Total recordable injuries x 200,000 hours divided by total man hours worked.
12 Month Rolling
Avg: 1.8
COMMITTED TO ZERO-HARM:
Initiatives implemented to improve safety
culture and performance:
› Visible Felt Leadership (VFL)
› Life Saving Rules
› Leading Indicators:
Workplace inspections PPE audits
Job observations Safety equipment inspections
Housekeeping audits VFL interactions
At corporate and site, SAFETY performance is
part of the KPIs
› In 2017, Leading Indicators performance
will also be included in KPIs at corporate
Q2’16

17
Quarterly Operational Statistics
Q2’15 Q3’15 Q4’15 Q1’16 Q2’16
Ore mined (Mt) 6.4 6.5 6.3 5.8 5.5
Waste mined (Mt) 19.1 17.0 15.7 15.2 16.4
Total mined (Mt) 25.5 23.5 22.0 21.0 21.9
Strip ratio (waste:ore) 3.0 2.6 2.5 2.6 3.0
Mining rate (tpd) 280,000 255,000 239,000 231,000 241,000
Ore milled (Mt) 5.2 5.2 5.1 4.7 5.3
Mill grade (g/t Au) 0.82 0.86 0.98 0.91 0.92
Recovery (%) 91 90 91 91 89
Mill throughput (tpd) 57,015 56,015 55,522 52,165 58,466
Mill availability (%) 88 85 86 88 87
Ounces produced (oz) 125,348 128,222 146,417 127,136 139,359
Ounces sold (oz) 123,296 126,241 132,209 137,608 131,606
TCC (US$/oz sold) $734 $766 $694 $637 $691
AISC (US$/oz sold) $1,030 $1,071 $858 $824 $1,030

18
1. Refer to the section on Non-IFRS Performance Measures on slide 3. Reconciliation of these measures is described in the MD&A for Q2’16.
2. For the 2016 guidance, these costs were included in opex and have no impact on reported AISC1.
H1 2016 AISC1
MAJOR VARIANCES QΔQ
Sustaining capital spending of $27.6 M in Q2: epuipment rebuilds and
overhauls2, addition of 1 CAT795 truck and April scheduled shutdown
FX rate:1.29 in Q2 vs. 1.37 in Q1
Share-based compensation (SBC): share price +58% in Q2
= +$4.4 M in G&A expenses
$824
$1,030 $95
$45 $36
$25 $5
Sustaining
Capital
Q2’16
Other
Opex
SBC
FX Rate
AISC1 YTD $925/oz SOLD Q1’16
QΔQ RECONCILAITION OF AISC1 ($/oz sold)

19
Prudent Financial Management
FOR H2’16:
Maintain a <40% gold hedge coverage
ratio
All gold hedge positions expire in 2016
Contracts at June 30, 2016 Amount Rate/Price
Gold Forwards 65,000 oz $1,190/oz
Zero cost collars 40,000 oz $1,243-$1,359/oz
Currency Zero cost collars $65 M 1.26-1.34
20
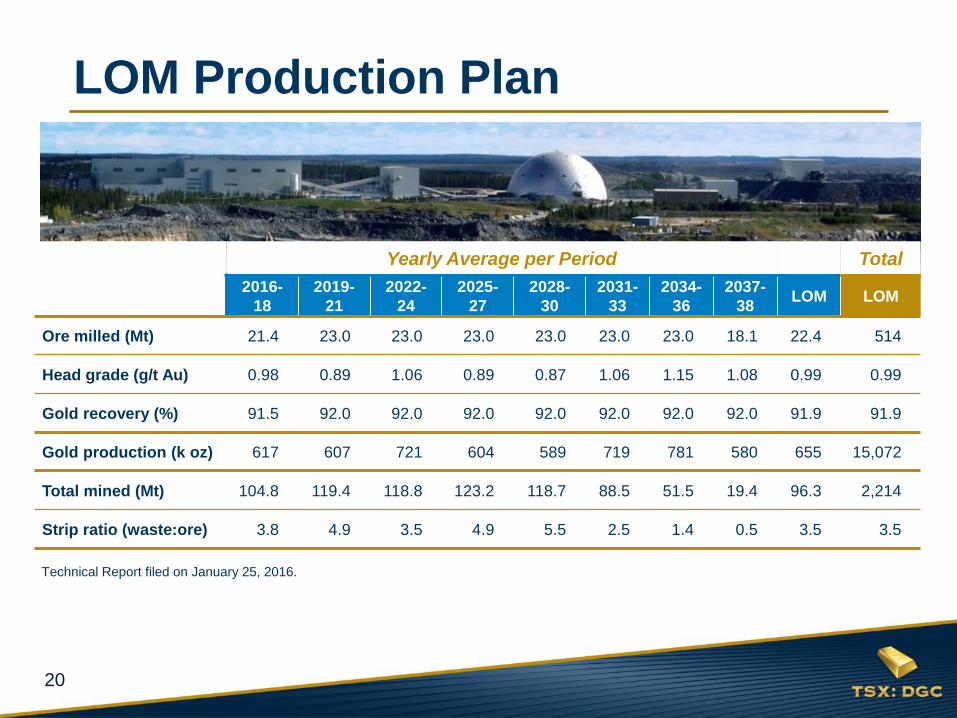
LOM Production Plan
Yearly Average per Period Total
2016-
18
2019-
21
2022-
24
2025-
27
2028-
30
2031-
33
2034-
36
2037-
38 LOM LOM
Ore milled (Mt) 21.4 23.0 23.0 23.0 23.0 23.0 23.0 18.1 22.4 514
Head grade (g/t Au) 0.98 0.89 1.06 0.89 0.87 1.06 1.15 1.08 0.99 0.99
Gold recovery (%) 91.5 92.0 92.0 92.0 92.0 92.0 92.0 92.0 91.9 91.9
Gold production (k oz) 617 607 721 604 589 719 781 580 655 15,072
Total mined (Mt) 104.8 119.4 118.8 123.2 118.7 88.5 51.5 19.4 96.3 2,214
Strip ratio (waste:ore) 3.8 4.9 3.5 4.9 5.5 2.5 1.4 0.5 3.5 3.5
Technical Report filed on January 25, 2016.

21
Year-end 2015 Reserves & Resources Notes:
1. Mineral resources and reserves were
completed by Detour Gold in conformity
with generally accepted definitions and
guidelines given in the Canadian Institute
of Mining, Metallurgy and Petroleum (CIM)
Standards on Mineral Resources and
Mineral Reserves as required by NI 43-
101.
2. Mineral reserves were estimated using a
gold price of $1,000/oz and mineral
resources were estimated using a gold
price of $1,200/oz at a US$/C$ exchange
rate of 1.10.
3. Mineral reserves and resources were
based on a cut-off grade of 0.50 g/t Au.
4. Mineral reserves included an average
mining dilution of 5.3% from 2016 to 2018
and 4% for 2018+, at a diluting grade of
0.20g/t Au. Mining ore loss of 5% also
included.
5. Only Probable LG Fines scheduled in the
mine plan were reported as mineral
reserves. The LG fines reserves were
based on a cut-off grade of 0.40 g/t Au.
6. Mineral resources are reported exclusive
of mineral reserves. Mineral resources
that are not mineral reserves do not have
demonstrated economic viability.
7. Totals may not add due to rounding.
At Dec. 31, 2015
RESERVES
Tonnes
(millions)
Grade
(g/t Au)
Contained
Gold Ounces
(000’s oz)
Detour Lake Mine Proven 89.2 1.26 3,603
Probable 351.6 0.95 10,779
Stockpiles 4.8 0.64 98
Total P&P 445.5 1.01 14,480
West Detour Proven 1.8 0.99 56
Probable 47.0 0.97 1,473
Total P&P 48.8 0.98 1,529
LG Fines Probable 20.0 0.60 386
Total P&P 514.3 0.99 16,395
RESOURCES Detour Lake Mine Measured 17.4 1.33 746
Indicated 66.2 1.00 2,125
M+I 83.6 1.07 2,871
West Detour Measured 0.4 0.85 10
Indicated 36.5 0.86 1,005
M+I 36.9 0.86 1,015
Total M+I 120.5 1.00 3,886
Detour Lake Mine Inferred 33.7 0.81 875
West Detour Inferred 8.6 0.89 246
Total Inferred 42.3 0.82 1,121

22
1. Conversion price for the Notes is $38.50.
2. Cash and short-term investments at June 30, 2016.
Shareholder Information
>80% INSTITUTIONS TOTAL
5.2 M Share options
9.3 M Convertible notes 1
189.0 M FULLY DILUTED
174.5 M Issued & outstanding
Share Structure (03/31/2014) Top Shareholders
12%
C$5.8 BILLION market cap $154 MILLION
cash position2
Share Structure (August 23, 2016) Top Shareholders
BlackRock
5% Van Eck Associates
4% Tocqueville
23
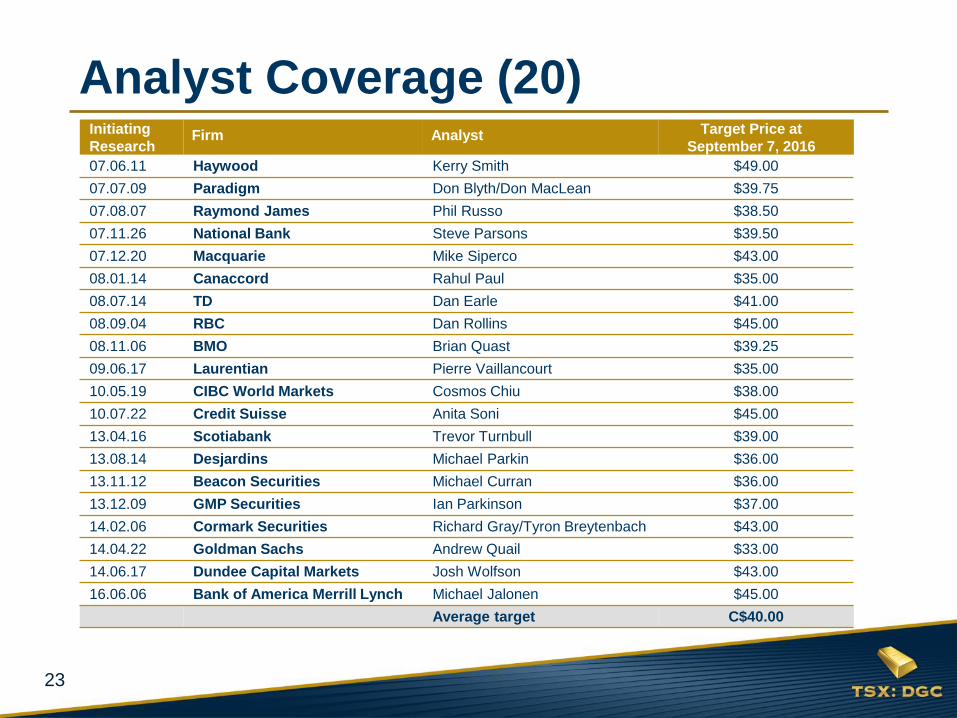
Initiating
Research Firm Analyst Target Price at
September 7, 2016
07.06.11 Haywood Kerry Smith $49.00
07.07.09 Paradigm Don Blyth/Don MacLean $39.75
07.08.07 Raymond James Phil Russo $38.50
07.11.26 National Bank Steve Parsons $39.50
07.12.20 Macquarie Mike Siperco $43.00
08.01.14 Canaccord Rahul Paul $35.00
08.07.14 TD Dan Earle $41.00
08.09.04 RBC Dan Rollins $45.00
08.11.06 BMO Brian Quast $39.25
09.06.17 Laurentian Pierre Vaillancourt $35.00
10.05.19 CIBC World Markets Cosmos Chiu $38.00
10.07.22 Credit Suisse Anita Soni $45.00
13.04.16 Scotiabank Trevor Turnbull $39.00
13.08.14 Desjardins Michael Parkin $36.00
13.11.12 Beacon Securities Michael Curran $36.00
13.12.09 GMP Securities Ian Parkinson $37.00
14.02.06 Cormark Securities Richard Gray/Tyron Breytenbach $43.00
14.04.22 Goldman Sachs Andrew Quail $33.00
14.06.17 Dundee Capital Markets Josh Wolfson $43.00
16.06.06 Bank of America Merrill Lynch Michael Jalonen $45.00
Average target C$40.00
Analyst Coverage (20)

24
Paul Martin President and CEO
Pierre Beaudoin COO
James Mavor CFO
Julie Galloway General Counsel &
Corporate Secretary
Drew Anwyll Sr VP Technical Services
Derek Teevan Sr VP Corporate &
Aboriginal Affairs
Jean-François Métail VP Mineral Resource
Management
Ruben Wallin VP Environment & Sustainability
Charles Hennessey Mine General Manager
Laurie Gaborit Director Investor Relations
Alberto Heredia Controller
Lisa Colnett
Edward C. Dowling
Robert E. Doyle
André Falzon
Alex G. Morrison
Jonathan Rubenstein
Graham Wozniak
Ingrid Hibbard
Michael Kenyon
Paul Martin
Management & Directors
MANAGEMENT
DIRECTORS

25
Laurie Gaborit Director Investor Relations
Email: [email protected]
Phone: 416.304.0581
Paul Martin President and Chief Executive Officer
Email: [email protected]
Phone: 416.304.0800
www.detourgold.com
Contact Information