dickinson bayou supporting data #2 cive 4312 spring 2010
TRANSCRIPT

Dickinson BayouSupporting Data #2
CIVE 4312Spring 2010
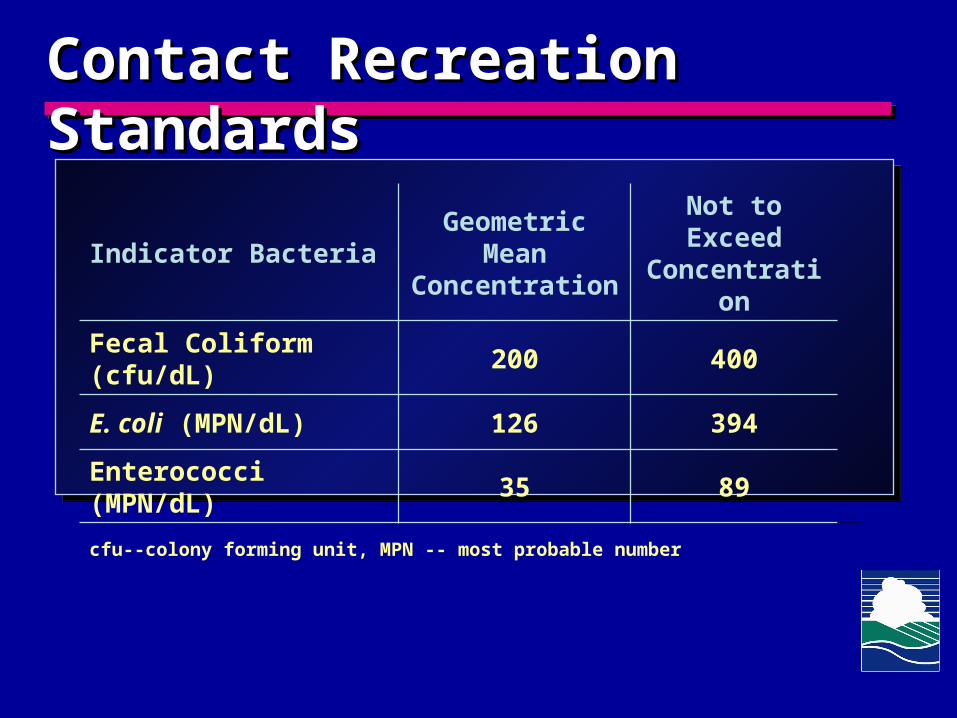
Contact Recreation StandardsContact Recreation Standards
Indicator BacteriaGeometric Mean Concentration
Not to Exceed Concentration
Fecal Coliform (cfu/dL) 200 400
E. coli (MPN/dL) 126 394
Enterococci (MPN/dL) 35 89
cfu--colony forming unit, MPN -- most probable number

Dickinson Dickinson BayouBayou Map Map

Dickinson Dickinson BayouBayou, Segments, Segments
Segment Segment 11041104
Segment Segment 11031103
Segment Segment 1103B1103B
Segment Segment 1103C1103C
Segment Segment 1103A1103A
Segment Segment 1103D1103DSegment Stream Name
1103 Dickinson Bayou Tidal
1104 Dickinson Bayou Above Tidal
1103A Bensons Bayou
1103B Bordens Gully
1103C Geislers Bayou
1103D Gum Bayou

Summary of Land Use in WatershedSummary of Land Use in Watershed
Data source: HGAC, 2002
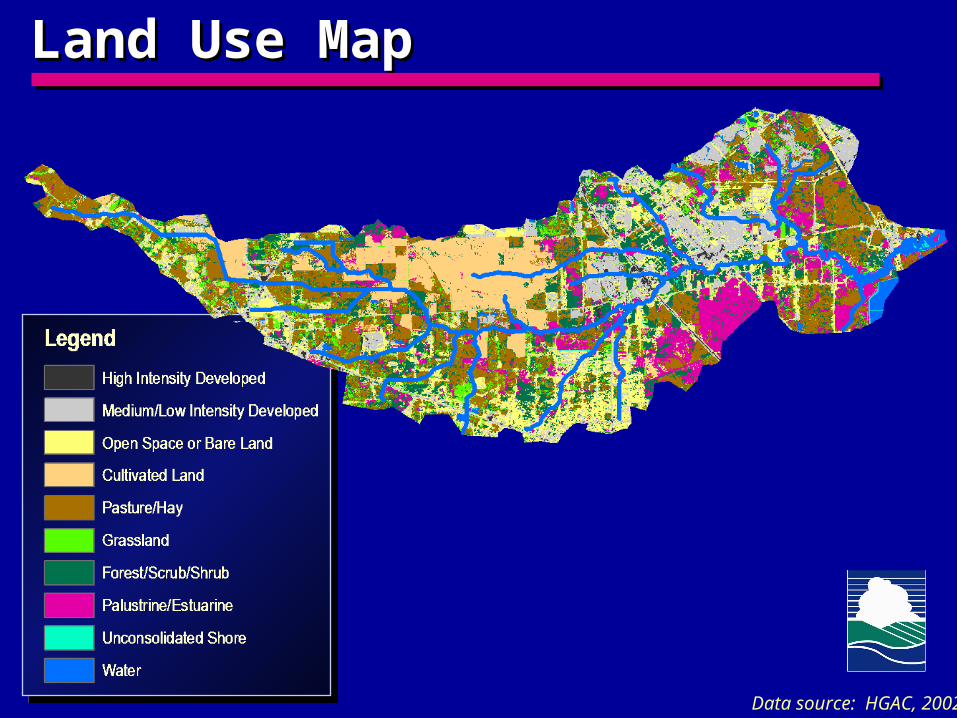
Land Use MapLand Use Map
Data source: HGAC, 2002

Exceedances of the Single Sample StandardExceedances of the Single Sample Standard
* Data from GCHD could not be fully validated because of insufficient QA/QC data
Criteria used for TCEQ’s WQ assessment:: 1104 = E. coli 1103 = Enterococci
Blank histograms indicate compliance with the Geometric Mean Standard

Exceedances of the Geometric Mean StandardExceedances of the Geometric Mean Standard
* Data from GCHD could not be fully validated because of insufficient QA/QC data
Criteria used for TCEQ’s WQ assessment:: 1104 = E. coli 1103 = Enterococci
Blank histograms indicate compliance with the Geometric Mean Standard
1
10
100
1000
10000
100000
1/1/1999 2/5/2000 3/11/2001 4/15/2002 5/20/2003 6/23/2004 7/28/2005 9/1/2006Date
E. c
oli
(M
PN
/100
mL
)
FO
GC
UI
Geometric mean standard
Single sample standard
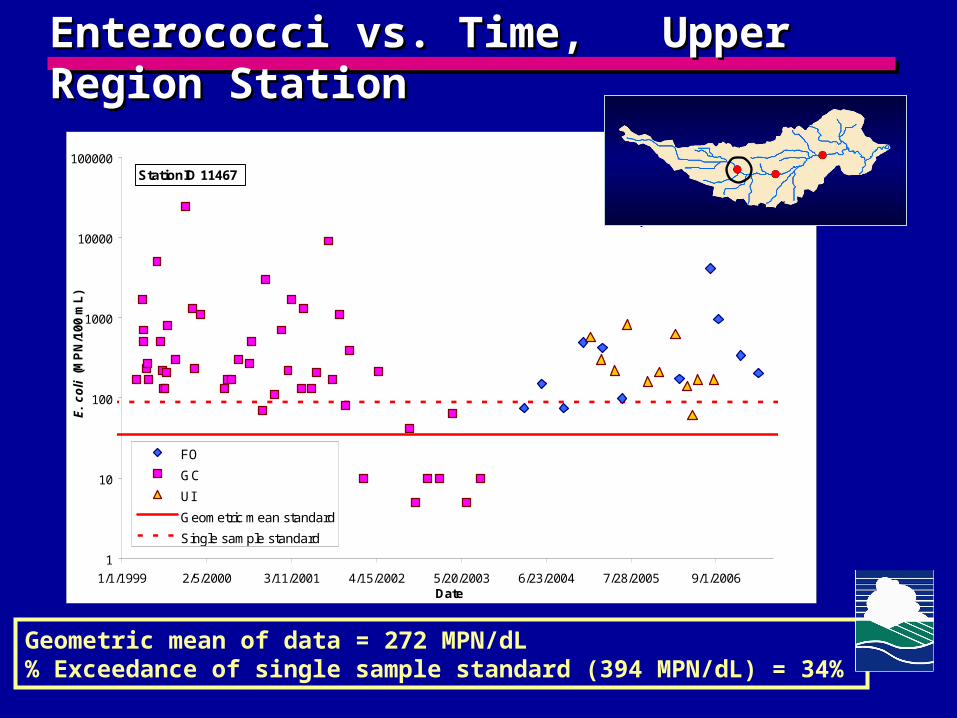
StationID 11467
Enterococci vs. Time, Upper Region StationEnterococci vs. Time, Upper Region Station
Geometric mean of data = 272 MPN/dL% Exceedance of single sample standard (394 MPN/dL) = 34%
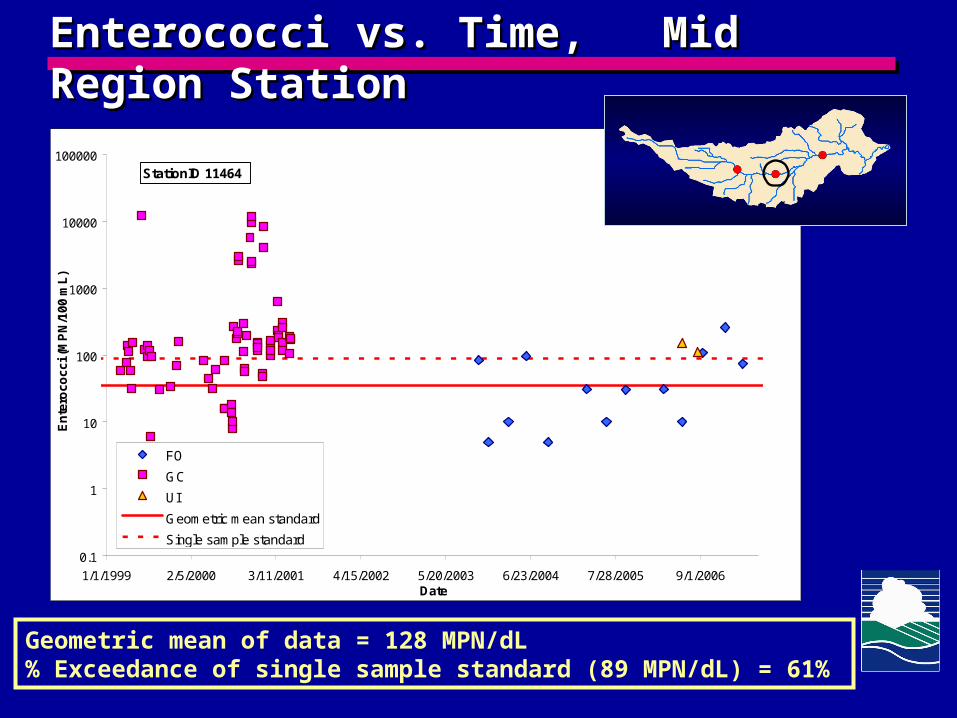
Enterococci vs. Time, Mid Region StationEnterococci vs. Time, Mid Region Station
0.1
1
10
100
1000
10000
100000
1/1/1999 2/5/2000 3/11/2001 4/15/2002 5/20/2003 6/23/2004 7/28/2005 9/1/2006Date
En
tero
cocc
i (M
PN
/100
mL
)
FO
GC
UI
Geometric mean standard
Single sample standard
StationID 11464
Geometric mean of data = 128 MPN/dL% Exceedance of single sample standard (89 MPN/dL) = 61%

Enterococci vs. Time, Lower Region StationEnterococci vs. Time, Lower Region Station
0.01
0.1
1
10
100
1000
10000
100000
1/1/1999 2/5/2000 3/11/2001 4/15/2002 5/20/2003 6/23/2004 7/28/2005 9/1/2006Date
En
tero
cocc
i (M
PN
/100
mL
)
FO
GC
UI
Geometric mean standard
Single sample standard
StationID 11460
Geometric mean of data = 272 MPN/dL% Exceedance of single sample standard (89 MPN/dL) = 34%

E. ColiE. Coli Geometric Mean Concentrations Geometric Mean Concentrations
1
10
100
1000
0 5 10 15 20 25
Distance from mouth of Dickinson Bayou (miles)
E.c
oli
(MP
N/1
00 M
or
#/10
0 m
L)
Main stem
Tributary
GCHD Data*
Segment ID 1103
* Data from GCHD could not be fully validated because of insufficient QA/QC data
Segment ID 1104
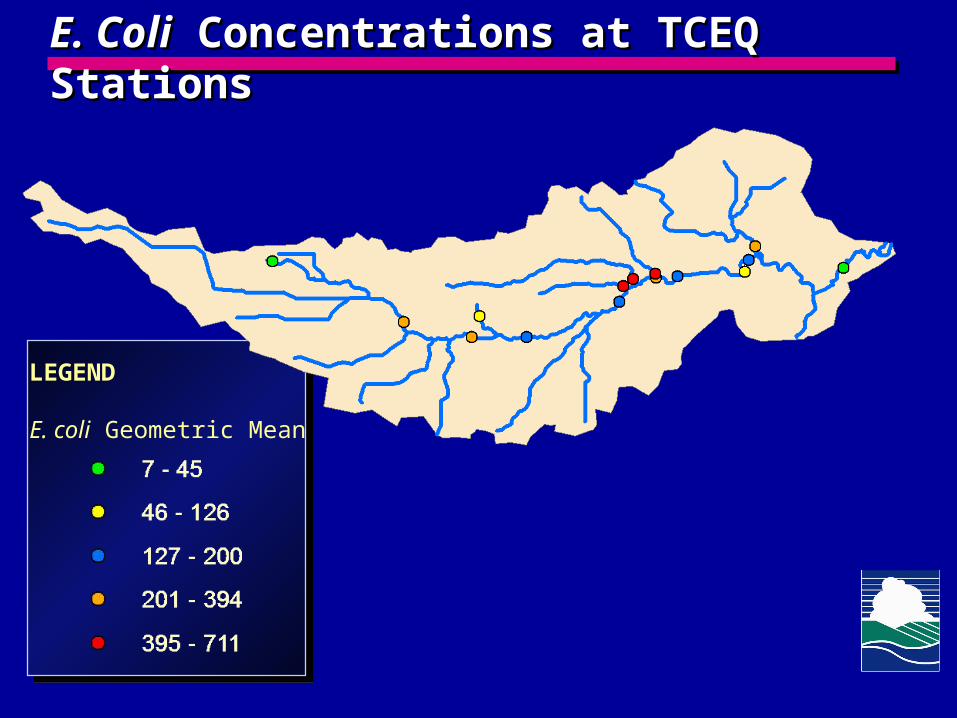
E. ColiE. Coli Concentrations at TCEQ Stations Concentrations at TCEQ Stations
LEGEND
E. coli Geometric Mean

Enterococci Geometric Mean ConcentrationsEnterococci Geometric Mean Concentrations
1
10
100
1000
0 5 10 15 20 25
Distance from mouth of Dickinson Bayou (miles)
En
tero
cocc
i (M
PN
/100
mL
or
#/10
0mL
)
Main stem
Tributary
GCHD Data*
Segment ID 1103 Segment ID 1104
* Data from GCHD could not be fully validated because of insufficient QA/QC data
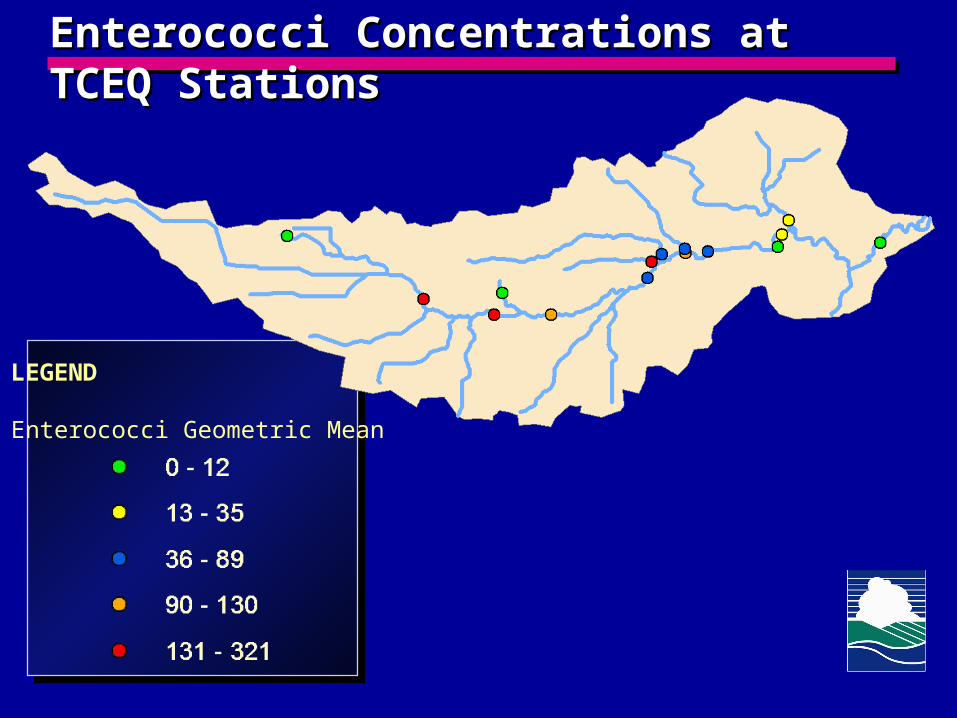
Enterococci Concentrations at TCEQ StationsEnterococci Concentrations at TCEQ Stations
LEGEND
Enterococci Geometric Mean
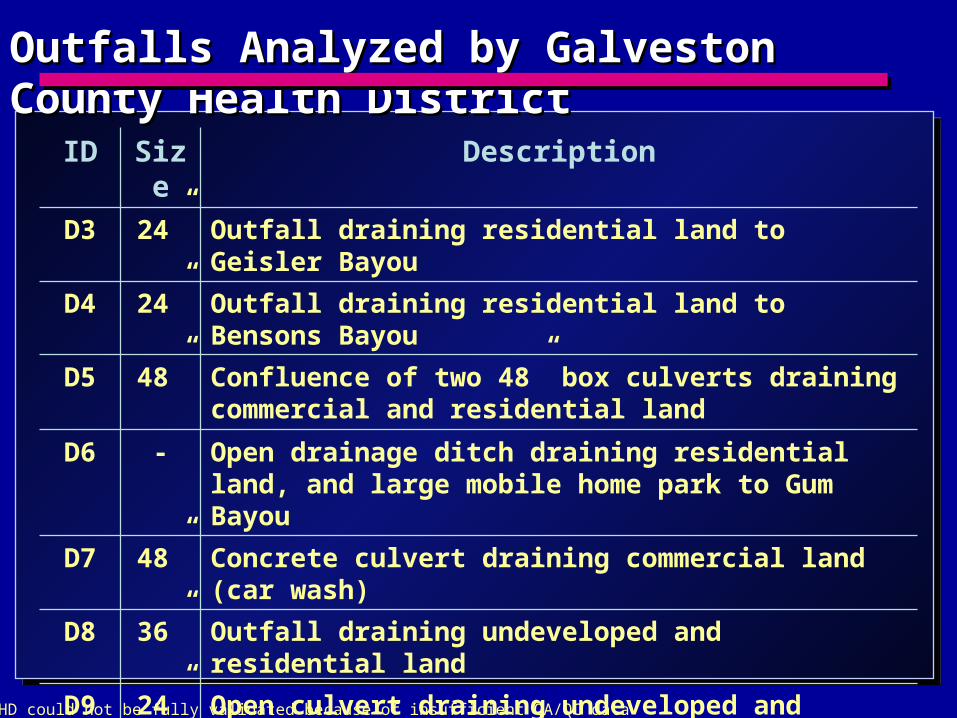
Outfalls Analyzed by Galveston County Health DistrictOutfalls Analyzed by Galveston County Health District
ID Size Description
D3 24” Outfall draining residential land to Geisler Bayou
D4 24” Outfall draining residential land to Bensons Bayou
D5 48” Confluence of two 48” box culverts draining commercial and residential land
D6 - Open drainage ditch draining residential land, and large mobile home park to Gum Bayou
D7 48” Concrete culvert draining commercial land (car wash)
D8 36” Outfall draining undeveloped and residential land
D9 24” Open culvert draining undeveloped and residential land to Bensons Bayou
D10 - Open drainage ditch draining residential land
* Data from GCHD could not be fully validated because of insufficient QA/QC data

Summary Outfall Data from GCHDSummary Outfall Data from GCHD
Station ID
Land Use# of
Samples% >394 MPN/dL
Date RangeGeometric
Mean (cfu/dL)
D3* Residential 18 83% Dec 2003 - Apr 2007 522
D4* Residential 22 41% Dec 2003 - Apr 2007 369
D5*Comm/
Residential18 56% Dec 2003 - Apr 2007 383
D6* Residential 21 14% Dec 2003 - Apr 2007 134
D7* Commercial 15 40% Dec 2003 - Apr 2007 267
D8*Undev/
Residential21 38% Dec 2003 - Apr 2007 260
D9*Undev/
Residential22 23% Dec 2003 - Apr 2007 145
D10* Residential 18 67% Dec 2003 - Apr 2007 498
* Data from GCHD could not be fully validated because of insufficient QA/QC data
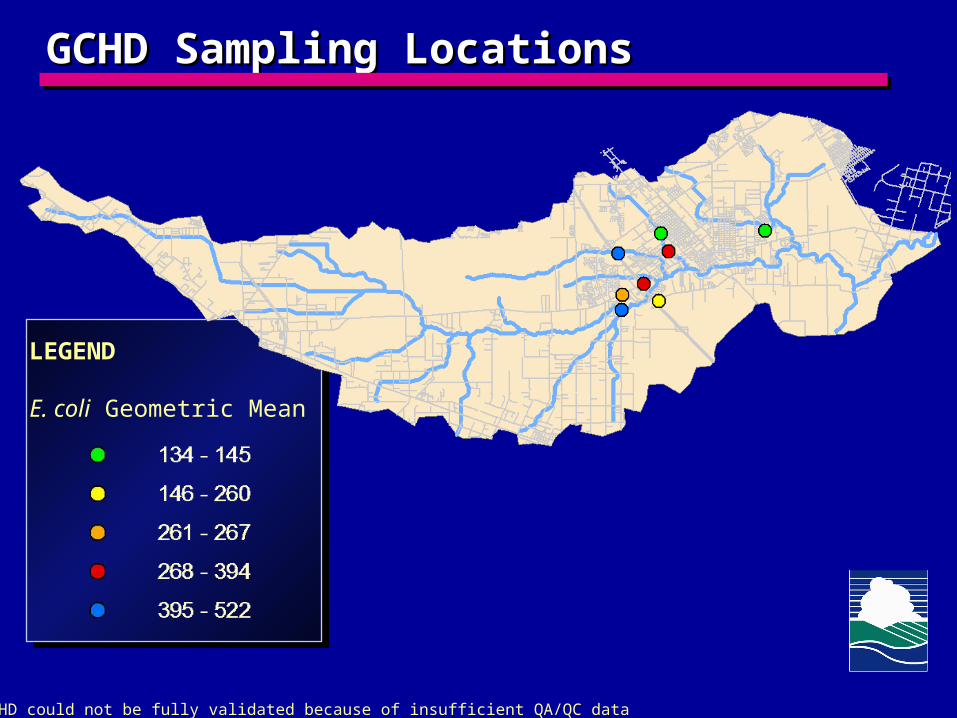
GCHD Sampling LocationsGCHD Sampling Locations
LEGEND
E. coli Geometric Mean
* Data from GCHD could not be fully validated because of insufficient QA/QC data
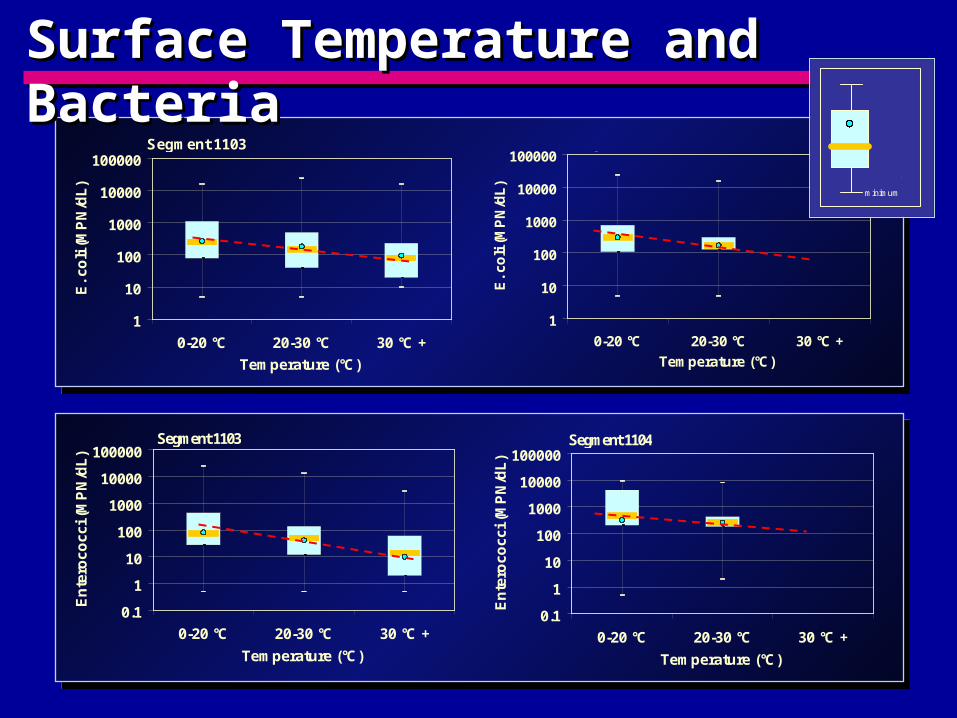
Surface Temperature and BacteriaSurface Temperature and Bacteria
1
10
100
1000
10000
100000
0-20 °C 20-30 °C 30 °C +
Temperature (°C)
E. c
oli
(MP
N/d
L)
Segment 1104
1
10
100
1000
10000
100000
0-20 °C 20-30 °C 30 °C +
minimum
75th pct
maximum
25th pct
geomean
median
1
10
100
1000
10000
100000
0-20 °C 20-30 °C 30 °C +
Temperature (°C)
E. c
oli
(MP
N/d
L)
75th pct
maximum25th pctgeomeanmedian
Segment 1103
0.1
1
10
100
1000
10000
100000
0-20 °C 20-30 °C 30 °C +
Temperature (°C)
En
tero
cocc
i (M
PN
/dL
)
75th pct
maximum
25th pct
geomean
median
Segment 1103
0.1
1
10
100
1000
10000
100000
0-20 °C 20-30 °C 30 °C +
Temperature (°C)
En
tero
co
cc
i (M
PN
/dL
)75th pct
maximum
25th pct
geomean
median
Segment 1104

Surface Salinity and BacteriaSurface Salinity and Bacteria
0.1
1
10
100
1000
10000
100000
<3 ppt(freshwater)
3 to 16 ppt(brackish)
> 16 ppt (seawater)
Salinity (µS/cm)
En
tero
cocc
i (M
PN
/dL
)
75th pct
maximum
25th pct
geomean
median
Segment 1103
0.1
1
10
100
1000
10000
<3 ppt(freshwater)
3 to 16 ppt(brackish)
> 16 ppt (seawater)
En
tero
co
cc
i (M
PN
/dL
)75th pct
maximum
25th pct
geomean
median
(n=2)
Segment 1104
1
10
100
1000
10000
100000
<3 ppt(freshwater)
3 to 16 ppt(brackish)
> 16 ppt (seawater)
E. c
oli
(MP
N/d
L)
75th pct
maximum
25th pct
geomean
median
Segment 1103
1
10
100
1000
10000
100000
<3 ppt(freshwater)
3 to 16 ppt(brackish)
> 16 ppt (seawater)
E. c
oli
(MP
N/d
L)
75th pct
maximum
25th pct
geomean
median
(n=2)
Segment 1104
1
10
100
1000
10000
100000
0-20 °C 20-30 °C 30 °C +
minimum
75th pct
maximum
25th pct
geomean
median

NPDES Discharge InformationNPDES Discharge Information
TCEQ Permit ID PermitteePermitted Flow
(MGD)
WQ0000377-000 Penreco 0.075
WQ0003416-000Waste Management of Texas,
Inc.2.23
WQ0003749-000 Hillman Shrimp & Oyster Co. 0.07
WQ0004086-000 Duratherm, Inc. n/a
WQ0003479-000 Sea Lion Technology 0.02
WQ0010173-001 Galveston County WCID 1 4.8
WQ0012935-001 Pine Colony WWTF 0.05
WQ0013632-001 Meadowland Utility Corp 0.023
WQ0014326-001 Via Bayou Inc 0.02
WQ0014440-001 R West Development Co., Inc. 0.24

WWTP Map, Permitted FlowsWWTP Map, Permitted Flows
0.02 MGD
0.03 – 0.08 MGD
0.09 – 0.24 MGD
0.25 – 2.23 MGD
2.24 – 4.80 MGD
LEGEND
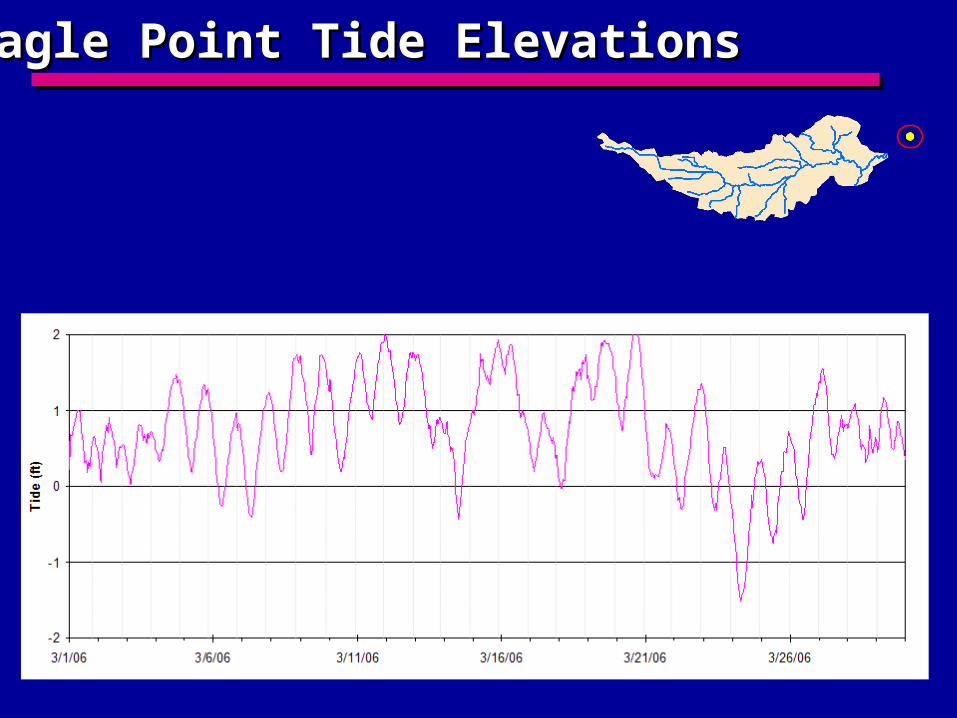
Eagle Point Tide ElevationsEagle Point Tide Elevations
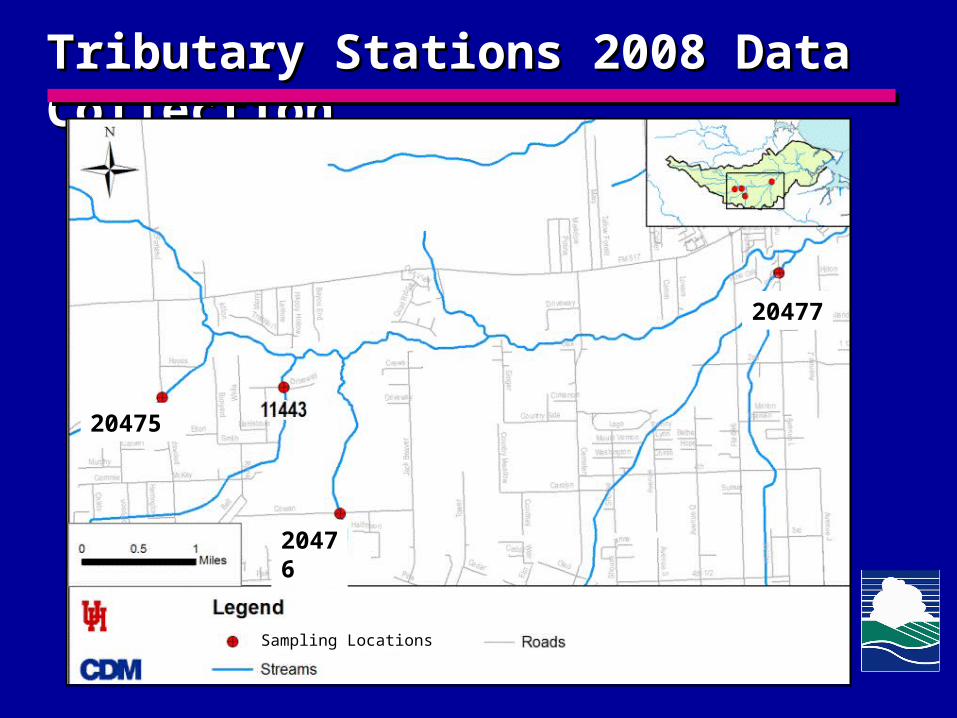
Tributary Stations 2008 Data CollectionTributary Stations 2008 Data Collection
20475
20476
20477
Sampling Locations
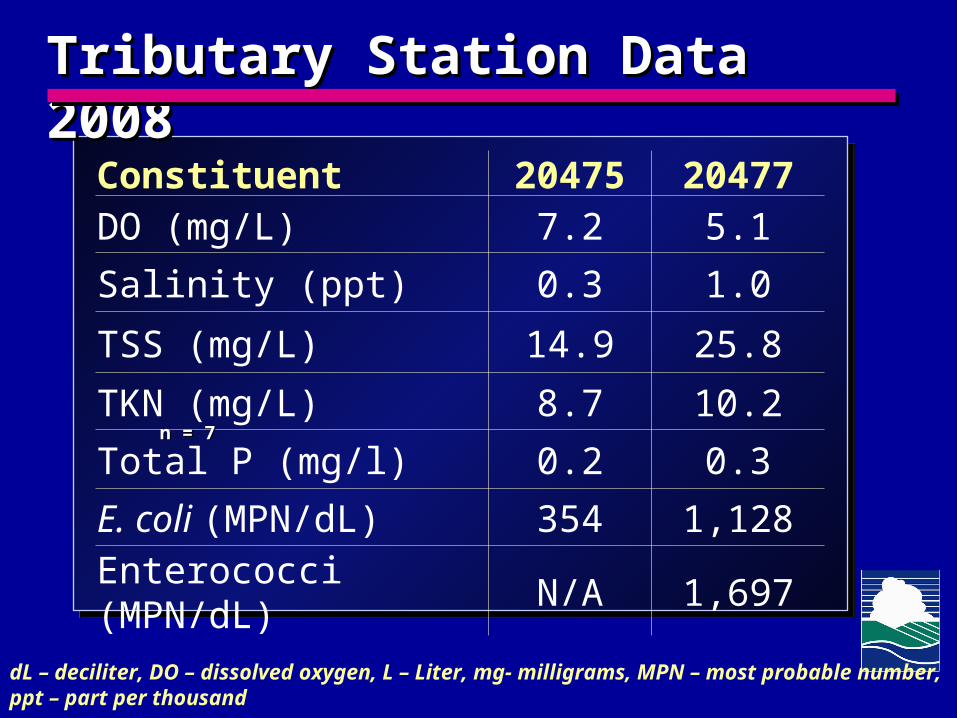
Tributary Station Data 2008Tributary Station Data 2008
Constituent 20475 20477DO (mg/L) 7.2 5.1
Salinity (ppt) 0.3 1.0
TSS (mg/L) 14.9 25.8
TKN (mg/L) 8.7 10.2
Total P (mg/l) 0.2 0.3
E. coli (MPN/dL) 354 1,128Enterococci (MPN/dL) N/A 1,697
dL – deciliter, DO – dissolved oxygen, L – Liter, mg- milligrams, MPN – most probable number, ppt – part per thousand
n = 7n = 7
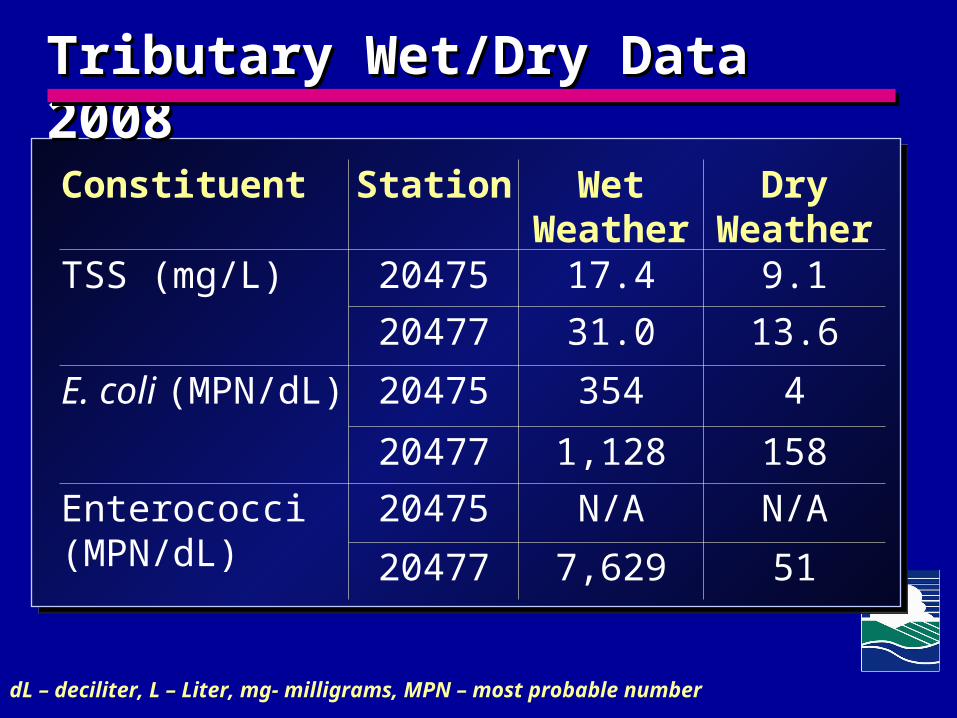
Tributary Wet/Dry Data 2008Tributary Wet/Dry Data 2008
Constituent Station Wet Weather
Dry Weather
TSS (mg/L) 20475 17.4 9.1
20477 31.0 13.6
E. coli (MPN/dL) 20475 354 4
20477 1,128 158
Enterococci (MPN/dL)
20475 N/A N/A
20477 7,629 51
dL – deciliter, L – Liter, mg- milligrams, MPN – most probable number

Bayou Wildlife ParkBayou Wildlife Park
Bayou Wildlife ParkBayou Wildlife Park

Wildlife Park CharacteristicsWildlife Park Characteristics
• 81-acre wildlife park with more 35,000 visitors/year houses 400 exotic animals
• Most on-site drainage controlled by small ponds, vegetated drainage swales, and berms around some pastures
• Some denuded areas present near tributary running through facility and near Dickinson Bayou

Data Near Wildlife Park 2008Data Near Wildlife Park 2008
Constituent 11466 11467DO (mg/L) 8.7 9.5
Salinity (ppt) 0.25 0.25
TSS (mg/L) 33.5 42.1
TKN (mg/L) 12.9 15.6
Total P (mg/l) 0.43 0.33
E. coli (MPN/dL) 4,606 1,498Enterococci (MPN/dL) N/A 6.501
dL – deciliter, DO – dissolved oxygen, L – Liter, mg- milligrams, MPN – most probable number, ppt – part per thousand

Wildlife Park Wet/Dry Data 2008Wildlife Park Wet/Dry Data 2008
Station 11467Station 11467
Station 11466Station 11466
n = 7n = 7 n = 3n = 3
n = 7, 2n = 7, 2 n = 3,1n = 3,1
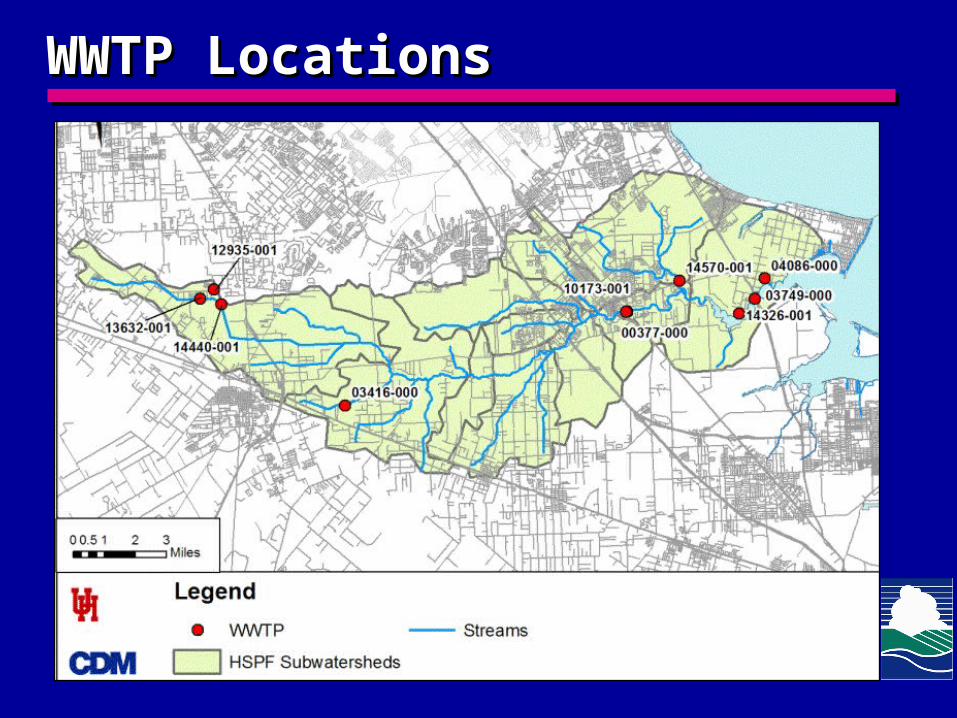
WWTP LocationsWWTP Locations
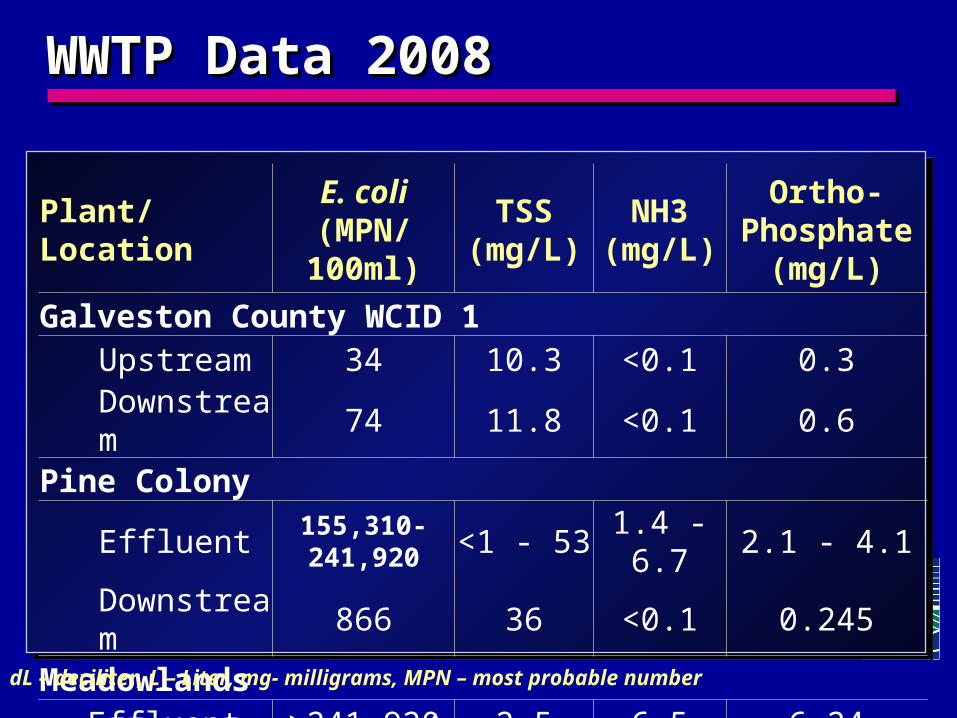
WWTP Data 2008WWTP Data 2008
Plant/LocationE. coli
(MPN/ 100ml)TSS
(mg/L)NH3
(mg/L)
Ortho- Phosphate
(mg/L)
Galveston County WCID 1Upstream 34 10.3 <0.1 0.3Downstream 74 11.8 <0.1 0.6
Pine ColonyEffluent 155,310-241,920 <1 - 53 1.4 - 6.7 2.1 - 4.1Downstream 866 36 <0.1 0.245
MeadowlandsEffluent >241,920 2.5 6.5 6.24
dL – deciliter, L – Liter, mg- milligrams, MPN – most probable number