diderot’s rule - uni-muenchen.de · mpra paper no. 17404, posted 19 sep 2009 18:06 utc....
TRANSCRIPT

Munich Personal RePEc Archive
Diderot’s rule
Beck, Jonathan
Ludwig-Maximilians-Universität München
19 September 2009
Online at https://mpra.ub.uni-muenchen.de/17404/
MPRA Paper No. 17404, posted 19 Sep 2009 18:06 UTC
Diderot’s rule
Jonathan Beck∗
Ludwig-Maximilians-Universität München
September 2009
Abstract
The odds of success in creative industries like the book, music or movie industry are
often said to be particularly low. A 1763 rule by Denis Diderot, for example, says
that only one out of ten published books is a commercial success. Yet, representative
evidence on new-product success rates and their development over time is scarce.
Furthermore, the standard approach to use sales as success measure can be mislead-
ing from the producer’s perspective. This paper presents a novel approach to em-
pirically identify producer success by incorporating the standard terms of contract
between creator and producer into a parsimonious model of information diffusion
(word-of-mouth). The model is applied to a random sample of novels. Parametric
and semiparametric estimates imply a success rate between 10 and 15% for this mar-
ket. Set against Diderot’s rule, these results suggest that new-product success in the
book industry has been fairly constant over time.
Keywords: New-product success; word-of-mouth; creative industries; technologi-
cal change.
∗E-mail: [email protected]. Mail: Institute for Communication Economics, Ludwig-Maximilians-Universität (LMU), Schackstr. 4/III, 80539 Munich. I thank Joe Clougherty, Michal Grajek, Ulrich Kamecke,Tobias Kretschmer, Lars-Hendrik Röller and seminar participants at the Warwick Royal Economic SocietyConference, DIW, London Business School, Wissenschaftszentrum Berlin (WZB) and LMU for helpful com-ments. I also benefitted from various discussions with book publishing professionals in the U.S. and Ger-many. All remaining errors are mine. I am grateful to Media Control GfK International and Uwe Maisch fordata provision, to the Börsenverein des Deutschen Buchhandels for permission to use it, and to the GermanFederal Ministry of Education and Research for financial support (project 01AK702A). A part of this paperwas written during a visit at London Business School, which I thank for its hospitality.
1 New-product success in creative industries
The commercial success of a new creative good such as a theatrical movie, a music record
or a novel is extremely difficult to foresee. According to screenwriter William Goldman
(1983), not even industry experts are able to predict a particular movie’s box office perfor-
mance. As a result, box office ‘flops’ are an empirical regularity. Similarly, the market for
music albums has been said to be dominated by a “stiff ratio” – the share of loss-making
albums – of around 90% (Caves, 2000, p. 79; Denisoff and Schurk, 1986, p. 4). The title of
this paper refers to an old quantification of new-product success in the book industry: in
1763, Denis Diderot (1713-1784) – French philosopher, writer and editor-in-chief of one of
the world’s first encyclopedias – estimates in an article on book publishing that at most
one out of ten published books is a success, while four recover costs in the long run, and
five end up with losses.1
Rules of this kind are often circulated in the respective industries.2 The odds of suc-
cess are clearly important for the economic agents in these industries, such as authors,
actors, producers and publishers – but why should anyone with a more general research
perspective care? First of all, these rules of thumb suggest that patterns of new-product
success resemble each other across different creative industries, but differ from the 80/20
rule commonly claimed for other, more ‘industrial’ industries.3 If there is stronger em-
pirical support for such a structural difference, this will have implications for industrial
policy. And the perspective of producers is crucial in these industries, as they decide
which creative project will be realized and brought to the market, and which not.
Another open question is whether patterns of new-product success may change over
time, in particular as information technologies change. Hendricks and Sorensen (2009)
find that the release of a new music album significantly increases sales of the artist’s
previous album, which implies that incomplete information and consumer learning are
major determinants of success in this industry. Hendricks and Sorensen (2009) show that
1“Ajoutez que, de compte fait, sur dix entreprises, il y en a une, et c’est beaucoup, qui réussit, quatre dont onrecouvre ses frais à la longue, et cinq où l’on reste en perte” (Diderot, 1763/2003, p. 61). See Turnovsky (2003) fora review of the general reception of Diderot’s article.
2Diderot’s rule is cited, for example, by Escarpit (1969, p. 123), Tietzel (1995, p. 38) and von Lucius (2005,p. 66).
3For example, the Food Marketing Institute (2002) reports failure rate estimates for new grocery productsbetween 25% and 80%. To the best of my knowledge, there are no estimates for other markets. The vastmanagement literature on the subject of course focuses on the determinants of new product success, not onthe aggregate success rate (see Henard and Szymanski, 2001, for a meta analysis).
1

if consumers were more fully informed, the distribution of sales across titles would be
substantially less skewed. The authors conclude that with the rise of the internet, con-
sumers will overcome “information bottlenecks” of the analog world, and the distribu-
tion of sales and profits will become more equal. In contrast, the results presented in this
paper suggest that it is unlikely that new-product success in creative industries changes
significantly with changes in information technology. Similarly, Prince and Simon (to ap-
pear) find that although the internet has increased new-product diffusion by improving
shopping convenience and product research, it has not increased consumer awareness
for new products. In other words, the internet facilitates assessment and purchase of
products of which consumers are already aware, but it does lead consumers to discover
significantly more or other new products.
The odds of new-product success in creative industries are rarely subject to a direct
empirical evaluation, except for the movie industry, which is well-studied empirically
(see Elberse, Eliashberg and Leenders, 2006, for a recent review of the literature). With
respect to new-product success, De Vany and Walls (2004) find that in the U.S. market,
6.3% of all movies earn 80% of all profits. The reason for the lack of direct results for
other industries, next to the difficulty of obtaining a representative set of products, is
that profits are unobservable. The data available to researchers usually contain product
sales, but accounting data such as costs or profits are typically unobservable or unreliable.
Therefore, studies revert to sales or bestseller status as measure of a product’s success,
and concentrate on studying the distribution of sales. For example, Sorensen (2007) and
Gaffeo, Scorcu and Vici (2008) show that the distribution of sales across book titles is
highly unequal (skewed) in the U.S. and Italian book industry.
Yet, the concentration on sales as profit measure can misrepresent the perspective
of producers, because potent creators (ie. ‘star’ actors or authors) often demand a large
share of the revenues that can be expected from the presence of predetermined success
factors such as the star herself. For example, Elberse (2007) finds that the involvement
of star actors increases expected revenue of movie producers (film studios), but it does
not increase their company valuation (expected profits). In other words, the fraction of
new products that were profitable for the producer does not equal the fraction of its new
products whose sales exceeded some threshold.
2
The first contribution of this paper is a novel approach to empirically identify new-
product success, which combines the standard terms of contract between creator and
producer with a parsimonious model of new-product diffusion. The resulting empirical
identification strategy does not rely on a product’s absolute level of sales, but on sales
dynamics, and is based on the common observation that word-of-mouth – or, more gen-
erally, social influence – is a crucial success factor.4 Recent experimental evidence by
Salganik, Dodds and Watts (2006) shows that new-product success is basically unpre-
dictable when consumption is subject to word-of-mouth. Participants in their study were
offered to sample and then download previously unknown music. In some experiment
groups, participants also received ‘top downloads’ information about the number of a
song’s previous downloads. In a significant number of cases, the same songs that were
sampled but rarely downloaded in a group where participants did not receive ‘top down-
loads’ information became ‘top downloads’ in groups where participants did receive this
information. Vice versa, songs that were popular in groups with ‘top downloads’ infor-
mation were unpopular in groups without this information. Salganik, Dodds and Watts
(2006) conclude that “experts fail to predict successes not because they are incompetent
[...] but because when individual decisions are subject to social influence, markets do not
simply aggregate pre-existing individual preferences.”
In this paper, I show that measures of word-of-mouth approximate producer success
better than nominal sales because the effects of word-of-mouth are hard to appropriate
by creators in ex ante bargaining. In that case, the products that are profitable for the
producer are those products that received unpredictable positive word-of-mouth. The
theoretical model directly leads to a parametric approach to identify the occurrence and
effect of word-of-mouth in week-to-week variation in unit sales. In order to allow for
more general models of word-of-mouth, I also propose a semiparametric method of iden-
tification.
The second contribution of this paper is an empirical application to a representative
sample of novels released on the German book market (section 3). Results indicate that
between 10 and 15% of titles enjoy positive word-of-mouth. On average, titles that are es-
timated to enjoy positive word-of-mouth perform better in terms of total sales, however,
4In the context of this paper, ‘word-of-mouth’ is a catch-all phrase for the diffusion of consumer aware-ness for a product and information about its quality. This includes person-to-person communication, butalso online and offline product reviews (Chevalier and Mayzlin, 2006; Sorensen and Rasmussen, 2004) andless direct forms of communication such as blogs, bestseller lists and Oprah’s Book Club.
3

some of these titles have relatively low sales whereas some of the sample’s best sellers
are not estimated to enjoy positive word-of-mouth. It is therefore possible that a success
measure based on word-of-mouth leads to a different result than a standard measure
based on nominal sales.
Moreover, my estimates of word-of-mouth and new-product success in the book
market are in line with Diderot’s rule of thumb. As such, they suggest that, in spite
of changes in information and communication technology since 1763 – amongst other
revolutions – the odds of success in the book market have stayed largely the same. In the
conclusion, I therefore extrapolate that the internet revolution will not make a significant
difference for new-product success in creative industries, but I suggest that the internet
will significantly change their channels and costs of production and distribution.
2 Identifying word-of-mouth and new-product success
This paper’s strategy to empirically identify new-product success is based on a parsimo-
nious formal model of new-product diffusion with word-of-mouth. The model features
two ingredients that are essential for word-of-mouth to have an effect on sales: hetero-
geneous buyers and intertemporal dynamics. In contrast, most studies in the extensive
theoretical and empirical literature on new-product diffusion follow Bass (1969) in as-
suming that consumers are homogeneous regarding their propensity to buy and differ
only in the timing of their purchase5. Yet, in a model with homogeneous buyers, word-
of-mouth among these buyers can only affect the distribution of sales over time, not their
overall level. To have an effect on overall sales, word-of-mouth needs to take place be-
tween consumers that are heterogeneous in their propensity to buy.
I consider the simplest case of heterogeneity: a two-segment structure, where the
population of M potential buyers of a newly released creative good – henceforth “title”
– consists of two types: Nb buffs and Nc casuals (title subscripts omitted).6 Buffs buy the
title in any case. Casuals only buy if they are exposed to positive word-of-mouth. If there
5See Van den Bulte and Joshi (2007) for a review. Variants and extensions of the Bass model have alsobeen used in a related literature on the diffusion of technological and organizational innovations across firms(Clerides and Kassinis, 2009).
6Caves (2000, p. 173) observes that the “distribution of consumers between ‘buffs’ and ‘casuals’ stronglyinfluences the organization of an art realm”.
4

is no positive word-of-mouth about a certain title, its long-run sales are restricted to Nb.
The case of negative (sales-destructive) word-of-mouth is discussed in section 2.3.
Heterogeneity-driven word-of-mouth has implications for the ex ante as well as the
ex post view on title performance. First, it affects ex ante bargaining over contract terms
between creator (henceforth “author”) and producer (henceforth “publisher”). Second,
the heterogeneity implies that ex post studies of aggregate product-level sales need to
address an identification problem: the extent of word-of-mouth needs to be inferred by
decomposing observed sales into unobserved sales to buffs and casuals. In section 2.2,
I therefore consider a parametric specification for intertemporal sales dynamics that can
be used to identify the effect of word-of-mouth. In section 2.3, I discuss semiparametric
identification in the context of more general models.
2.1 Ex ante bargaining and Diderot’s rule
The typical contract between author and publisher grants the publisher the exclusive
right to market the author’s title. This publishing contract consists of a royalty scheme
through which publisher and author share revenues from sold copies. Royalty schemes
are a commonplace in creative industries, where the creator of a good typically lacks the
funds to produce and market it, so that the producer takes over the investment risk in
return for a share of the revenues.7
The advance. An additional – and in our context more important – aspect of author-
publisher contracts is the fact that authors (or their agents) require a nonrefundable ad-
vance payment on the expected royalties before a title is released. The advance is often
interpreted as a device to increase the publisher’s incentives to market a title, which re-
lates to one of the problems associated with the difficulty of profit-sharing (Caves, 2003),
but the advance may serve other means as well.8 Hansmann and Kraakman (1992) con-
sider the context of an early contracting stage, before the author has written the book,
and study a ‘hands-tying’ contract where the advance helps publishers to commit to pro-
ducing the title without detailed knowledge of its contents. Here, it is simply taken as
7Horvitz (1966) and a subsequent literature discuss in more detail why the seemingly more natural alter-native of profit-sharing is rarely observed in academic (textbook) publishing. Dana and Spier (2001) showthat revenue sharing is valuable in manufacturer-retailer contracts, when demand uncertainty realizes onlyafter inventory decisions have been made.
8For example, the advance insures the author against publisher insolvency, and the publisher may save ontransaction costs after release, when a potentially large number of small royalty payments can be accountedagainst the advance.
5

given that each contract between author and publisher includes a nonrefundable advance
royalty that is contracted upon under common knowledge of some forecast for a title’s
sales.
To be more precise, let r be the author’s revenue share (0<r≤1) and A the advance
on this share. Assuming fixed production costs of C and normalizing the title’s wholesale
price to one, the publisher’s expected gross profits at the time of bargaining are
E[Q] − A − rE[max{0; Q − A/r}] − C, (1)
where E[Q] are expected sales. Since A is nonrefundable, it implicitly defines a threshold
value for sales (A/r) below which the author’s factual ex post revenue share exceeds r.
For any value of r, the author may use A to appropriate the remaining expected publisher
profits. In practice, royalty rates indeed vary little across different contracts, whereas
advance payments tend to vary strongly, even in relation to the number of copies finally
sold (Caves, 2000, pp. 56ff). Book authors are frequently represented by literary agents
who receive up to 20% of their client’s remuneration and who thus have a direct incentive
to achieve a high advance. In fact, agents often attempt to maximize the author’s share
of expected profits by auctioning publishing rights.9
The combination of royalty and advance implies that publisher profits are not mono-
tone increasing in sales Q, but rather in their relation to expectations E[Q].10 In particular,
this is true for titles whose authors have a strong bargaining position and are thus able
to pocket much of the expected profits – presumably titles with high E[Q]. In the auction
case with sufficiently many competing publishers, A will be close to E[Q]-C, such that
the winning publisher’s profits are close to zero in expected terms and positive ex post
only if sales exceed their expectation.
From the publisher perspective, title success therefore depends on the accuracy of
sales predictions. In a recent interview, Jonathan Galassi, the president of New York pub-
lisher Farrar, Straus, and Giroux nicely illustrates this point: “With regard to big advances,
I’ll tell you a dirty little secret. I think that very often the big advances you pay, at least for
9An auction is the optimal selling format from the author viewpoint (Bulow and Klemperer, 1996) and hasa long tradition in the book industry: see Moldovanu and Tietzel (1998) for an analysis of ‘Goethe’s second-price auction’ and Hansmann and Kraakman (1992) and De Vany and Walls (2004) for further anecdotalevidence.
10For authors, in contrast, total sales remain important ex post because they are associated with auxiliaryrevenues, for example from live performances or movie deals.
6
a company like ours, don’t end up having the result you want. Sometimes you just have
to pay them. But the real successes, which make the difference in our business, don’t
come from the books for which we pay big money. When we pay a big advance our job is
to earn back what we gave the author so that we come out clean – basically break even or
make a small profit. Whereas a book where we start much lower, and go a big distance,
is much more mutually profitable.” (Galassi and Ferrari-Adler, 2009)
Forecasting sales. The accuracy of sales predictions, in turn, is related to word-of-
mouth. Suppose a title’s potential market has the two-segment buyer structure discussed
above. Since buffs buy the title in any case but casuals buy only if there is positive word-
of-mouth, expected sales consist of
E[Q] = E[Nb] + Pr(word)E[Nc|word], (2)
where Pr(word) is the ex ante probability that a title receives positive word-of-mouth and
E[Nc|word] are expected sales to casuals in that case. The key question is whether it is
possible, at the time of bargaining, to predict sales in all consumer segments. Some pre-
determined observable characteristics – like sales of previous titles by the author or the
size of the author’s fan club – are certainly informative regarding expected sales to buffs
(Nb). Author-publisher bargaining is thus likely to operate under common knowledge
of E[Nb]. In contrast, the findings by Salganik, Dodds and Watts (2006) and Hendricks
and Sorensen (2009) indicate that predetermined characteristics are unlikely to contain
information on the title-specific propensity to receive word-of-mouth (Pr(word)) and the
corresponding additional sales (E[Nc|word]). In that case, parties can at best work with
market-level statistics or general principles such as Diderot’s rule.
For example, suppose the average probability for the occurrence of word-of-mouth
(Pr(word)) is δ and the average value for the resulting additional sales E[Nc|word] is k
times Nb. The maximum advance a publisher is willing to pay is then A = E[Nb](1 +
δk) − C. It follows immediately that, with titles whose authors have strong bargaining
power (hence A→A), publishers end up making profits only in case of word-of-mouth,
that is, only with probability δ. With titles whose authors have weak bargaining power –
presumably titles with low E[Nb] – publishers may bargain down the advance payment.
7

For these titles, however, production costs are relatively more important, which can also
lead to negative ex post profits in case there is no word-of-mouth.11
Empirical implication. In either case, given that data on advances, royalty rates and
production costs are typically not available or unreliable, differences in ex ante expecta-
tions and advance payments across titles cannot be accounted for empirically. In conse-
quence, observed total sales are not an appropriate success measure from the publisher
perspective. But we can utilize the fact that the more appropriate success measure, the
difference between ex ante expectations and ex post sales, is particularly affected by the ex
post extent of word-of-mouth. We can thus empirically estimate new-product success by
estimating the distribution of positive word-of-mouth across titles. The corresponding
interpretation of Diderot’s rule, for example, holds that δ= 110 : one out of ten titles enjoys
positive word-of-mouth.
An implementation of this empirical approach requires (i) a method to identify the
presence of positive word-of-mouth in sales and (ii) data on a representative sample of
titles. With respect to (i), the following model of new-product diffusion illustrates that
– with reasonable assumptions on how sales to buffs and eventually casuals distribute
over time – it is possible to not only identify the existence of positive word-of-mouth but
also to quantify its effect on a title’s overall sales (that is, to estimate Nc).12 In section 2.3,
I discuss more general models and semiparametric identification.
2.2 Intertemporal sales dynamics
As a matter of notation, it is more convenient to consider the total number of potential
buyers of a title M = Nb + Nc and its share of buffs θ = NbM . Time-invariant predetermined
variables that may affect Nb and thus M, such as a title’s characteristics and price, can be
omitted in this section.13 Operating within a continuous-time framework, denote by Fb(t)
the c.d.f. of a title’s sales to buffs, that is, cumulative sales to this group at time t divided
11If the negotiated advance payment is ρA, where 0<ρ≤1, publisher profits are negative ex post if there isno word-of-mouth and C > E[Nb](1 − ρ
1−ρ δk).12Moul (2007), who quantifies the average effect of word-of-mouth in motion picture revenues, also iden-
tifies word-of-mouth through intertemporal dynamics of weekly unit sales. However, the specific demandmodel underlying his analysis (nested logit) is very different from the new-product diffusion model pre-sented here, variants of which are widely applied in the marketing literature.
13In most European countries, book prices are by law subject to resale price maintenance and thus in-variant over time. Even in the unregulated U.S. market, intertemporal price variation is virtually inexistent(Clerides, 2002).
8
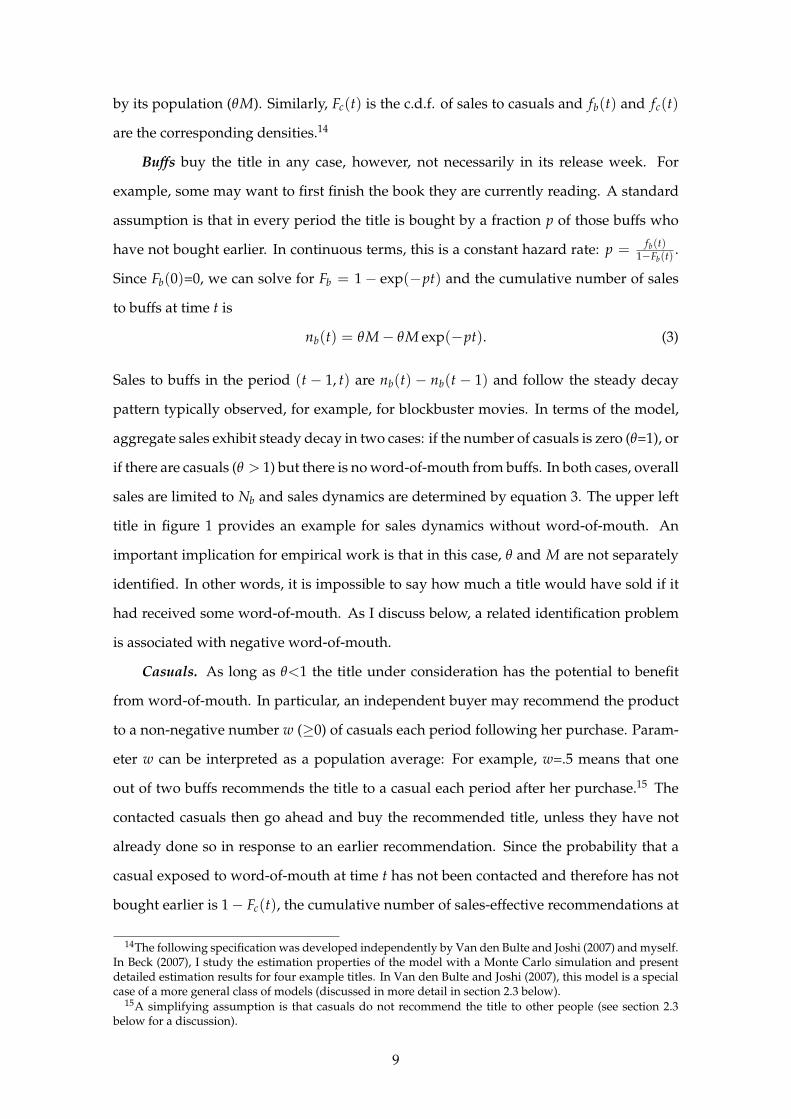
by its population (θM). Similarly, Fc(t) is the c.d.f. of sales to casuals and fb(t) and fc(t)
are the corresponding densities.14
Buffs buy the title in any case, however, not necessarily in its release week. For
example, some may want to first finish the book they are currently reading. A standard
assumption is that in every period the title is bought by a fraction p of those buffs who
have not bought earlier. In continuous terms, this is a constant hazard rate: p = fb(t)1−Fb(t)
.
Since Fb(0)=0, we can solve for Fb = 1 − exp(−pt) and the cumulative number of sales
to buffs at time t is
nb(t) = θM − θM exp(−pt). (3)
Sales to buffs in the period (t − 1, t) are nb(t) − nb(t − 1) and follow the steady decay
pattern typically observed, for example, for blockbuster movies. In terms of the model,
aggregate sales exhibit steady decay in two cases: if the number of casuals is zero (θ=1), or
if there are casuals (θ > 1) but there is no word-of-mouth from buffs. In both cases, overall
sales are limited to Nb and sales dynamics are determined by equation 3. The upper left
title in figure 1 provides an example for sales dynamics without word-of-mouth. An
important implication for empirical work is that in this case, θ and M are not separately
identified. In other words, it is impossible to say how much a title would have sold if it
had received some word-of-mouth. As I discuss below, a related identification problem
is associated with negative word-of-mouth.
Casuals. As long as θ<1 the title under consideration has the potential to benefit
from word-of-mouth. In particular, an independent buyer may recommend the product
to a non-negative number w (≥0) of casuals each period following her purchase. Param-
eter w can be interpreted as a population average: For example, w=.5 means that one
out of two buffs recommends the title to a casual each period after her purchase.15 The
contacted casuals then go ahead and buy the recommended title, unless they have not
already done so in response to an earlier recommendation. Since the probability that a
casual exposed to word-of-mouth at time t has not been contacted and therefore has not
bought earlier is 1 − Fc(t), the cumulative number of sales-effective recommendations at
14The following specification was developed independently by Van den Bulte and Joshi (2007) and myself.In Beck (2007), I study the estimation properties of the model with a Monte Carlo simulation and presentdetailed estimation results for four example titles. In Van den Bulte and Joshi (2007), this model is a specialcase of a more general class of models (discussed in more detail in section 2.3 below).
15A simplifying assumption is that casuals do not recommend the title to other people (see section 2.3below for a discussion).
9
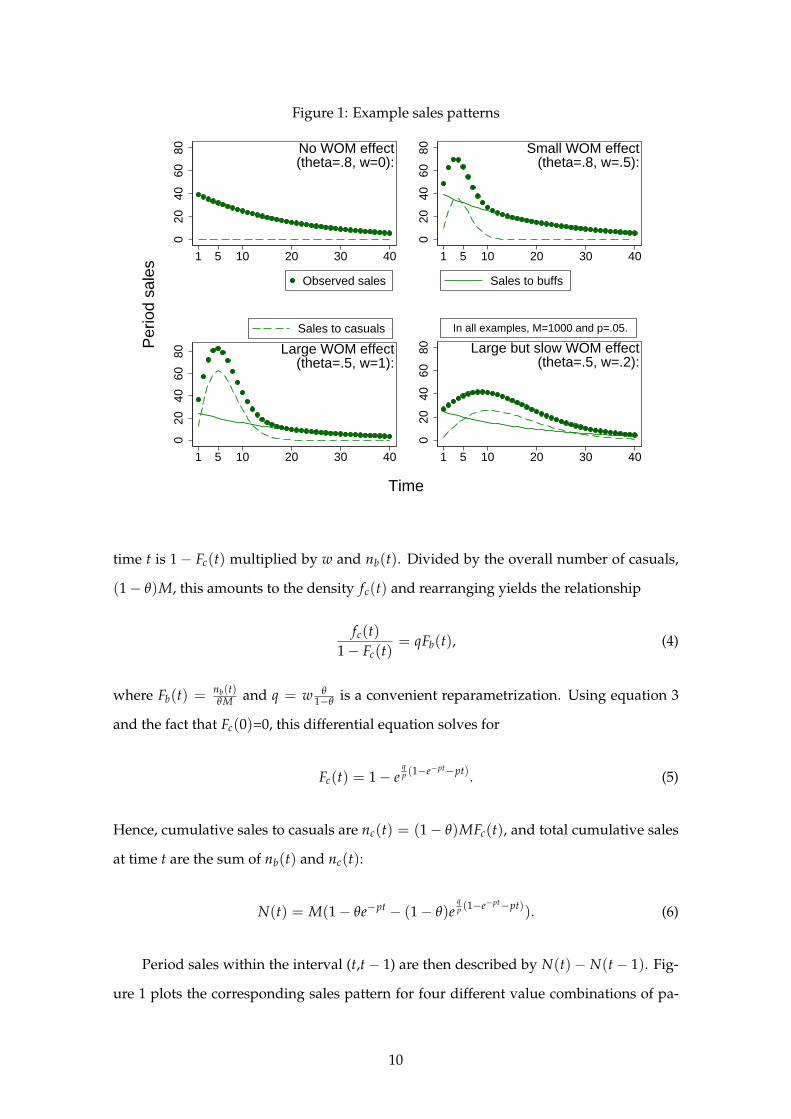
Figure 1: Example sales patterns
020
4060
80
1 5 10 20 30 40
Observed sales
No WOM effect(theta=.8, w=0):
020
4060
80
1 5 10 20 30 40
Sales to buffs
Small WOM effect(theta=.8, w=.5):
020
4060
80
1 5 10 20 30 40
Sales to casuals
Large WOM effect(theta=.5, w=1):
020
4060
80
1 5 10 20 30 40
In all examples, M=1000 and p=.05.
Large but slow WOM effect(theta=.5, w=.2):
Per
iod
sale
s
Time
time t is 1 − Fc(t) multiplied by w and nb(t). Divided by the overall number of casuals,
(1 − θ)M, this amounts to the density fc(t) and rearranging yields the relationship
fc(t)
1 − Fc(t)= qFb(t), (4)
where Fb(t) = nb(t)θM and q = w θ
1−θ is a convenient reparametrization. Using equation 3
and the fact that Fc(0)=0, this differential equation solves for
Fc(t) = 1 − eqp (1−e−pt−pt). (5)
Hence, cumulative sales to casuals are nc(t) = (1 − θ)MFc(t), and total cumulative sales
at time t are the sum of nb(t) and nc(t):
N(t) = M(1 − θe−pt − (1 − θ)eqp (1−e−pt−pt)). (6)
Period sales within the interval (t,t − 1) are then described by N(t) − N(t − 1). Fig-
ure 1 plots the corresponding sales pattern for four different value combinations of pa-
10
rameters θ and w. Most notably, sales without word-of-mouth follow a convex pattern,
whereas with word-of-mouth they are concave (hump-shaped) in early sales weeks: due
to an increasing number of buff buyers engaging in word-of-mouth, sales to casuals rise
initially. The size and width of the resulting sales hump depends on the intensity of
word-of-mouth and on the relative number of casuals.
2.3 Generalizations
Equation 6 provides a functional form that can be used to structurally identify the extent
of word-of-mouth in title-specific time series of sales. As usual in structural modeling,
the corresponding results depend on the viability of the model. It is therefore important
to discuss the potential limitations of the above model.
First, it only considers positive word-of-mouth, although anecdotal evidence from
the movie industry suggests that negative word-of-mouth can also be important. In terms
of the model, negative word-of-mouth would not only imply that w=0, but in addition
that buffs engage in sales-destructive communication among each other. Negative word-
of-mouth aggravates the identification problem already present when w=0; for example,
among buff buyers it implies that their overall number (θM) is subject to decay over
time: first-week buff buyers dissuade other buffs from their initially planned purchase.
As evident from equation 3, it is impossible to distinguish this effect from the hazard rate
p. For example, consider the upper left title in figure 1, whose observed sales decline
steadily after release. Based on such data, it is impossible to say whether the particular
pattern is driven by negative word-of-mouth (decreasing θM over time) or merely by the
decay parameter p. This is unproblematic in the context of this paper, which focuses on
identifying positive word-of-mouth. However, if we wanted to identify negative word-
of-mouth among buffs separately from the usual intertemporal sales decay, we would
need to place more restrictions on parameter p, for example by assuming it to be equal
across titles.
A second, more important restriction in the above model is that casuals care exclu-
sively for recommendations from buffs. In general, however, positive word-of-mouth
within segments – for example among casuals – may also be sales-effective. Van den
Bulte and Joshi (2007) analyze a more general class of models, which allows for positive
word-of-mouth within both segments. These more general cases have the property that
11
period sales exhibit a ‘dip’ or are convex for early sales periods, when decreasing sales to
buffs are not yet over-compensated by increasing sales due to word-of-mouth. In other
words, a hump-shaped sales curve driven by word-of-mouth can have more than one
stationary point and only one of these is the global maximum. Van den Bulte and Joshi
(2007) present evidence on sales of music CDs that seem to exhibit such a ‘dip’ in early
sales weeks. Since models of new-product diffusion are inherently nonlinear, model com-
plexity increases exponentially for these more general cases. Indeed, estimation based on
standard methods can be troublesome, which complicates comparison between model
variants. Nevertheless, all cases share the property that word-of-mouth leads to a con-
cave (hump-shaped) pattern around the global maximum of a title’s sales curve. The
semiparametric identification of word-of-mouth proposed in the next section relies on
this property.
Alternative explanations for hump-shaped sales patterns. A related literature stud-
ies the diffusion of new technologies across firms, typically over a longer time period.
Next to imitation effects, which are similar to effects of word-of-mouth in the diffusion of
consumer goods, this literature generally explains a hump-shaped pattern in adoptions
by decreasing costs or increasing benefits of adoption over time (Hall and Khan, 2003;
Clerides and Kassinis, 2009). For a new creative good, however, both material product
characteristics and price are constant within its short selling period. This is certainly the
case in the data studied here, as prices in the German book market are governed by a law
on retail price maintenance that prevents retailer discounts. Therefore, the only possible
kind of increase in benefit is one associated with immaterial characteristics: for example,
consumers may change their perception of the intellectual value of a title. This view is
consistent with the occurrence of positive word-of-mouth.
Other, ‘behavioral’ explanations for hump-shaped sales often assume some form of
suboptimal behavior by producers or retailers, which is outside the scope of this paper.
For example, a publisher may gradually increase marketing efforts for some titles, al-
though the logic of bestseller lists and return of investment implies that all marketing
should be concentrated at the release date. At least in the book industry, in any case, tra-
ditional instruments such as advertising seem to have modest effects. Instead, industry
12
sources emphasize the effects of public performances by a title’s author, which are often
out of direct publisher control.16
2.4 Parametric identification
The standard approach to estimating parametric models of new-product diffusion with
aggregate sales data is based on first differences of the cumulative sales function (Putsis
and Srinivasan, 2000) :
S(t) = N(t; φ) − N(t − 1; φ) + εt, (7)
where S(t) denotes observed sales of a given title during the period (t − 1,t). N(.) is the
cumulative sales function defined by the particular model, φ is the set of model param-
eters and t=1,...,T. Here, N(.) is defined by equation 6 and φ consists of M, θ, p and q.
Assuming that the error term ε has the usual least squares properties, parameters may be
estimated by nonlinear least squares (NLS). A grid search procedure yields proper initial
values for iterative estimation. Through log-transformations, I impose that all parame-
ters are non-negative and that θ, p≤1.
Neither asymptotic nor small-sample properties of such estimators are known (Bos-
wijk and Franses, 2005), but bias and consistency can be studied by means of a a Monte
Carlo simulation. For the present model, NLS estimates are reliable if observations cover
a sufficiently large part of a title’s life cycle and are not too volatile. Furthermore, residual
autocorrelation may be present: for example, a television appearance by a title’s author
may boost sales not only in that but also in the following weeks. The procedure to test
and account for residual autocorrelation is straightforward (see Beck, 2007, for more de-
tails on these issues).
Applied to a title with hump-shaped sales, the model provides estimates for all four
parameters and thus identifies both the existence of word-of-mouth (w) and its relative
sales effect (1 − θ). Based on a representative sample of titles, this approach therefore
yields an estimate of the distribution of positive word-of-mouth – the share of titles with
a positive w – and thus yields a measure of new-product success in this market.
Yet, such a parametric approach is associated with two main problems. First, equa-
tion 3 indicates that the parameters of the model are not identified when sales of a ti-
16“Booksellers say author tours, Oprah most effective for marketing books”, Book Publishing Report, vol. 24,iss. 38; “Suche nach Öffentlichkeit”, Handelsblatt, iss. 54, 16 March 2006.
13
tle decrease steadily over time. Effectively, estimates for such titles tend to converge at
boundary values (p or θ equal to zero or one, w equal to zero). Results of this kind may
indicate that the respective title did not enjoy positive word-of-mouth and hence that
w=0, but they may also be driven by data volatility (Beck, 2007). Second, as discussed
in the previous section, parametric estimates are meaningful only if the imposed model
is a good approximation of the data generating process. If more general forms of word-
of-mouth cannot be excluded or if data volatility complicates estimation, semiparametric
methods provide useful alternatives to test for the existence of positive word-of-mouth.
2.5 Semiparametric identification
A more general empirical specification for intertemporal sales dynamics is
S(t) = g(t) + εt, (8)
where g(t) denotes the unknown function according to which period sales distribute
over time. Various methods are available to semiparametrically estimate g(t) in order
to obtain a smoothed time series S(t). In principle, these methods can be viewed as
variants of kernel density estimation that differ mainly in the employed kernel and the
degree of smoothing. Results are typically invariant to the researcher’s choice of kernel
but highly sensitive to the chosen bandwidth (Cameron and Trivedi, 2005). Further, a
crucial distinction is between global estimators that search for a function that fits best
over all available data, and local estimators that smooth over a moving data window
(Ruppert, Wand and Carroll, 2003). Estimators also differ in their treatment of extreme
observations (‘outliers’).
For the purposes of this paper, the locally weighted regression approach (loess, fol-
lowing Cleveland, 1979) seems most appropriate. First, as a local estimator it does not
exhibit irregularities at the beginning or end of the sample that have been found with
global estimators. This is important for the present application because sales humps
driven by word-of-mouth tend to occur in early sales weeks. Second, the loess approach
has a high degree of automation, which facilitates application to a large number of titles:
only one smoothing parameter has to be chosen, and procedures exist to automate even
this decision (I will use the improved Akaike information criterion developed by Hur-
14
vich, Simonoff and Tsai, 1998)). Finally, by iterative reweighting of observations the loess
estimate is robust to extreme observations, which due to events like a television appear-
ances of authors are likely to occur in sales data of creative goods.
3 Application to a representative sample of novels
The data used in this study is a sample of 229 novels randomly drawn from the set of all
novels released 2003 as hardcover in Germany. The data come from a marketing research
firm that aggregates scanner data from over 750 physical points of sale and all main
internet retailers in Germany. In the appendix, I discuss data characteristics and sampling
procedure in more detail.
I focus on novels because this segment is most important for the book trade – both
in economic and cultural terms – and on hardcover editions because only newly released
titles are of interest. German paperback editions of a title are delayed by one to two
years.17 Therefore, the sales data analyzed in this paper cover all sales of the respective
new product and are not affected by other competing editions of the same title. The
data proprietor was obliged to give me anonymized data, where all title-, author- and
publisher-specific information had been removed, leaving as sample variables a title and
publisher code, sales (by week) and price (constant). The release date of each title is
inferred from the sales data (see the appendix for more details). The sample period ends
in summer 2004, providing between 41 and 81 weekly sales observations per title.
3.1 Sample characteristics
Figure 2 presents a histogram of total sales observed across titles. It does not account for
the fact that titles are observed for differently long time periods, however, this turns out
to be inessential: most sales take place within the first 26 weeks after release, which are
observed for all titles.18 The result is a well-known picture: most titles have very low
overall sales – about 43% of titles sell less than 500 copies – and only few titles get to
five- or six-digit sales figures. In effect the distribution of total sales is skewed: whereas
17This release strategy is a textbook example of intertemporal price discrimination (Clerides, 2002).18Figure 6 in the appendix gives standard kernel density estimates for the distribution of cumulated sales:
one including the first 26 sales weeks only and one including all observed weeks for each title. The distribu-tion for sales including all observed weeks is quite similar and only slightly broader than the one includingthe first 26 weeks only.
15
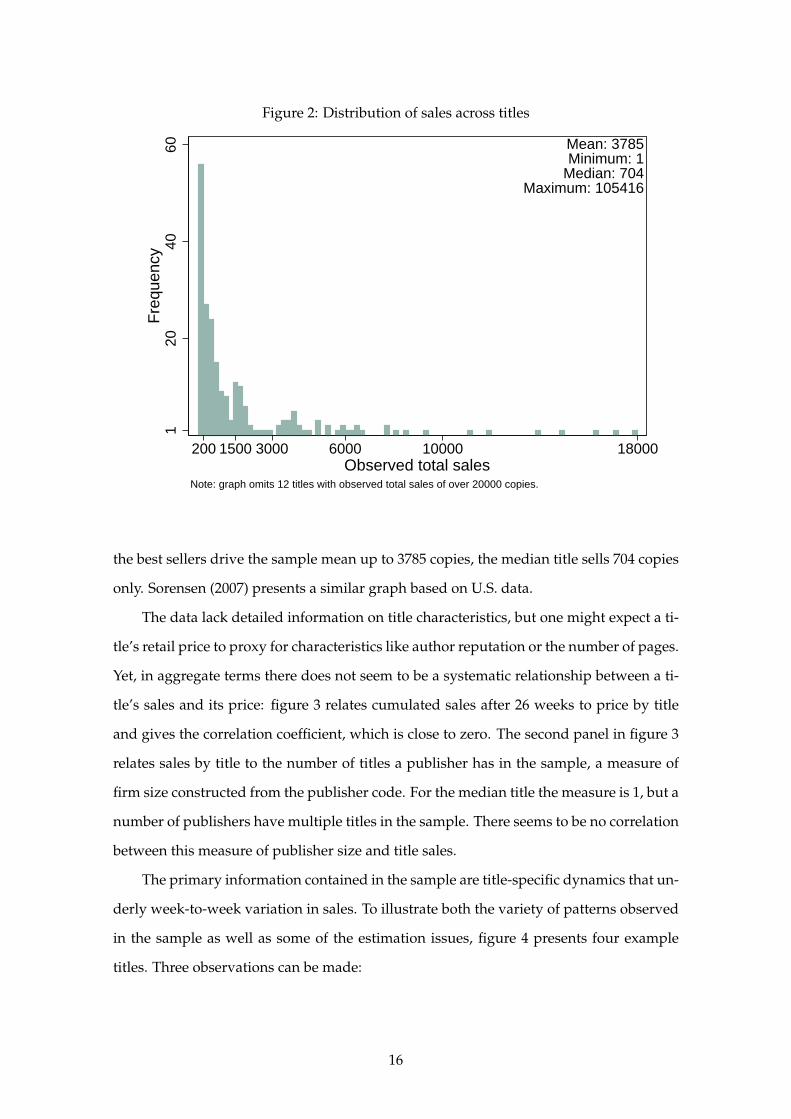
Figure 2: Distribution of sales across titles
120
4060
Fre
quen
cy
200 1500 3000 6000 10000 18000Observed total sales
Note: graph omits 12 titles with observed total sales of over 20000 copies.
Mean: 3785Minimum: 1
Median: 704Maximum: 105416
the best sellers drive the sample mean up to 3785 copies, the median title sells 704 copies
only. Sorensen (2007) presents a similar graph based on U.S. data.
The data lack detailed information on title characteristics, but one might expect a ti-
tle’s retail price to proxy for characteristics like author reputation or the number of pages.
Yet, in aggregate terms there does not seem to be a systematic relationship between a ti-
tle’s sales and its price: figure 3 relates cumulated sales after 26 weeks to price by title
and gives the correlation coefficient, which is close to zero. The second panel in figure 3
relates sales by title to the number of titles a publisher has in the sample, a measure of
firm size constructed from the publisher code. For the median title the measure is 1, but a
number of publishers have multiple titles in the sample. There seems to be no correlation
between this measure of publisher size and title sales.
The primary information contained in the sample are title-specific dynamics that un-
derly week-to-week variation in sales. To illustrate both the variety of patterns observed
in the sample as well as some of the estimation issues, figure 4 presents four example
titles. Three observations can be made:
16
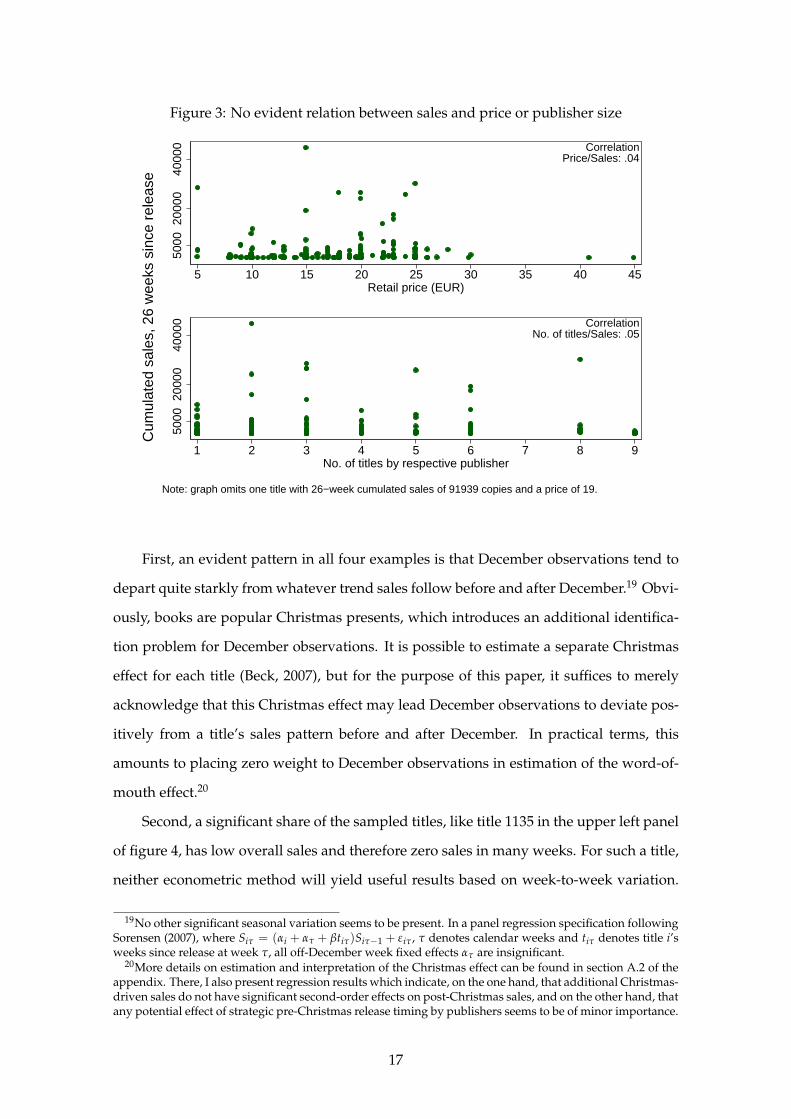
Figure 3: No evident relation between sales and price or publisher size
5000
2000
040
000
5 10 15 20 25 30 35 40 45Retail price (EUR)
CorrelationPrice/Sales: .04
5000
2000
040
000
1 2 3 4 5 6 7 8 9No. of titles by respective publisher
CorrelationNo. of titles/Sales: .05
Cum
ulat
ed s
ales
, 26
wee
ks s
ince
rel
ease
Note: graph omits one title with 26−week cumulated sales of 91939 copies and a price of 19.
First, an evident pattern in all four examples is that December observations tend to
depart quite starkly from whatever trend sales follow before and after December.19 Obvi-
ously, books are popular Christmas presents, which introduces an additional identifica-
tion problem for December observations. It is possible to estimate a separate Christmas
effect for each title (Beck, 2007), but for the purpose of this paper, it suffices to merely
acknowledge that this Christmas effect may lead December observations to deviate pos-
itively from a title’s sales pattern before and after December. In practical terms, this
amounts to placing zero weight to December observations in estimation of the word-of-
mouth effect.20
Second, a significant share of the sampled titles, like title 1135 in the upper left panel
of figure 4, has low overall sales and therefore zero sales in many weeks. For such a title,
neither econometric method will yield useful results based on week-to-week variation.
19No other significant seasonal variation seems to be present. In a panel regression specification followingSorensen (2007), where Siτ = (αi + ατ + βtiτ)Siτ−1 + εiτ , τ denotes calendar weeks and tiτ denotes title i’sweeks since release at week τ, all off-December week fixed effects ατ are insignificant.
20More details on estimation and interpretation of the Christmas effect can be found in section A.2 of theappendix. There, I also present regression results which indicate, on the one hand, that additional Christmas-driven sales do not have significant second-order effects on post-Christmas sales, and on the other hand, thatany potential effect of strategic pre-Christmas release timing by publishers seems to be of minor importance.
17

Figure 4: Example titles
330
60
1 10 20 30
Off−December sales
December sales
Title 1135
Cumulatedsales: 142
1050
100
1 10 20 30 40
Parametric fit
Semiparametric fit
Title 1164
Cumulatedsales: 566
630
060
0
1 10 20 30 40 50 60 70 80
Title 1295
Cumulatedsales: 8544
650
0010
000
1 10 20 30 40 50
Title 1179
Cumulatedsales: 105416
Weeks since release
Altogether, 51 titles (22.2% of the sample) have less than 13 positive off-December sales
observations before they reach 95% of cumulative sales. I assume that these titles, whose
cumulative sales range between 1 and 796 with an average of 116, have not received pos-
itive word-of-mouth; I do not attempt to estimate any other parameter econometrically
for these titles.
Third, for a number of titles, hump-shaped sales patterns such as those in the lower
two panels of figure 4 suggest the existence of word-of-mouth effects. For other titles,
such as title 1164 in in the upper right panel, sales variance is relatively high and it is dif-
ficult to infer a particular pattern merely by visual inspection. Therefore, figure 4 already
includes predicted values from parametric and semiparametric estimations. These pre-
dictions turn out similar for titles 1164 (upper right) and 1295 (lower left): the smoothed
series of title 1164 decrease quite constantly over time, while both methods indicate an
early hump in sales for title 1295. In contrast, sales of title 1179 – which has the highest
overall sales in the sample – remain at low levels initially and are hump-shaped only in
later weeks. This is a case where parametric estimation is troublesome because, in the un-
derlying model of positive word-of-mouth, the sales curve increases right from the start
18
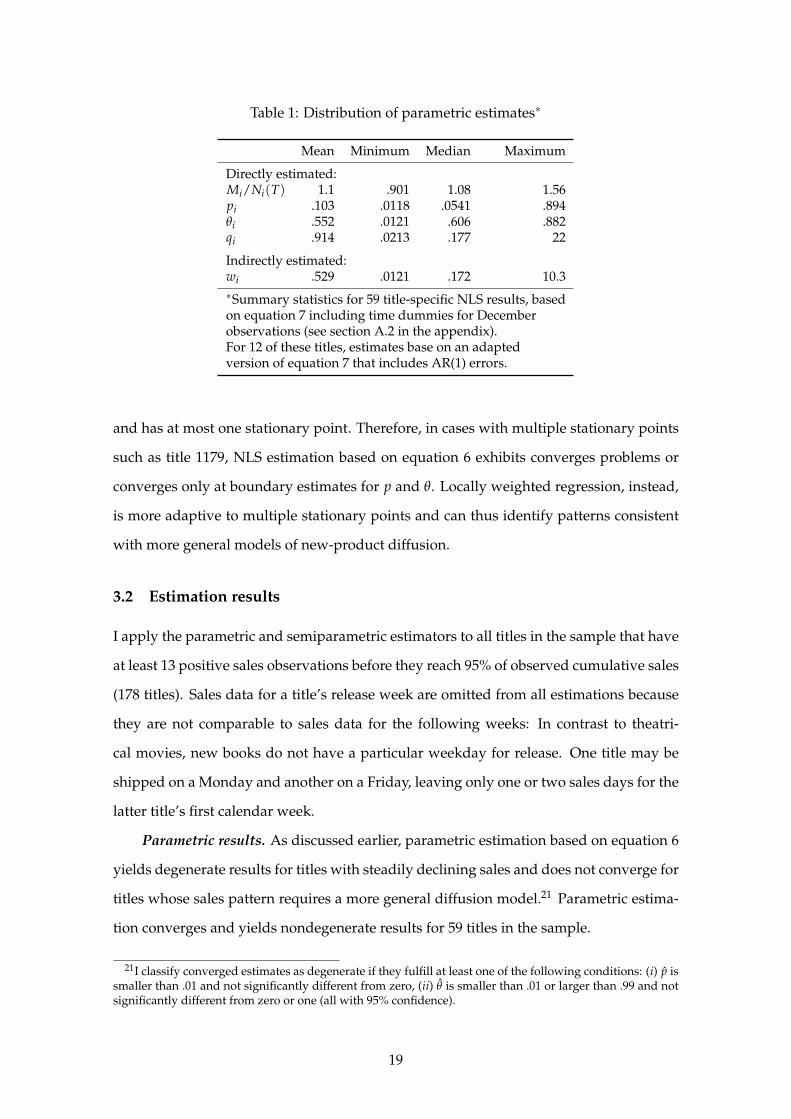
Table 1: Distribution of parametric estimates∗
Mean Minimum Median Maximum
Directly estimated:Mi/Ni(T) 1.1 .901 1.08 1.56pi .103 .0118 .0541 .894θi .552 .0121 .606 .882qi .914 .0213 .177 22
Indirectly estimated:wi .529 .0121 .172 10.3∗Summary statistics for 59 title-specific NLS results, basedon equation 7 including time dummies for Decemberobservations (see section A.2 in the appendix).For 12 of these titles, estimates base on an adaptedversion of equation 7 that includes AR(1) errors.
and has at most one stationary point. Therefore, in cases with multiple stationary points
such as title 1179, NLS estimation based on equation 6 exhibits converges problems or
converges only at boundary estimates for p and θ. Locally weighted regression, instead,
is more adaptive to multiple stationary points and can thus identify patterns consistent
with more general models of new-product diffusion.
3.2 Estimation results
I apply the parametric and semiparametric estimators to all titles in the sample that have
at least 13 positive sales observations before they reach 95% of observed cumulative sales
(178 titles). Sales data for a title’s release week are omitted from all estimations because
they are not comparable to sales data for the following weeks: In contrast to theatri-
cal movies, new books do not have a particular weekday for release. One title may be
shipped on a Monday and another on a Friday, leaving only one or two sales days for the
latter title’s first calendar week.
Parametric results. As discussed earlier, parametric estimation based on equation 6
yields degenerate results for titles with steadily declining sales and does not converge for
titles whose sales pattern requires a more general diffusion model.21 Parametric estima-
tion converges and yields nondegenerate results for 59 titles in the sample.
21I classify converged estimates as degenerate if they fulfill at least one of the following conditions: (i) p issmaller than .01 and not significantly different from zero, (ii) θ is smaller than .01 or larger than .99 and notsignificantly different from zero or one (all with 95% confidence).
19
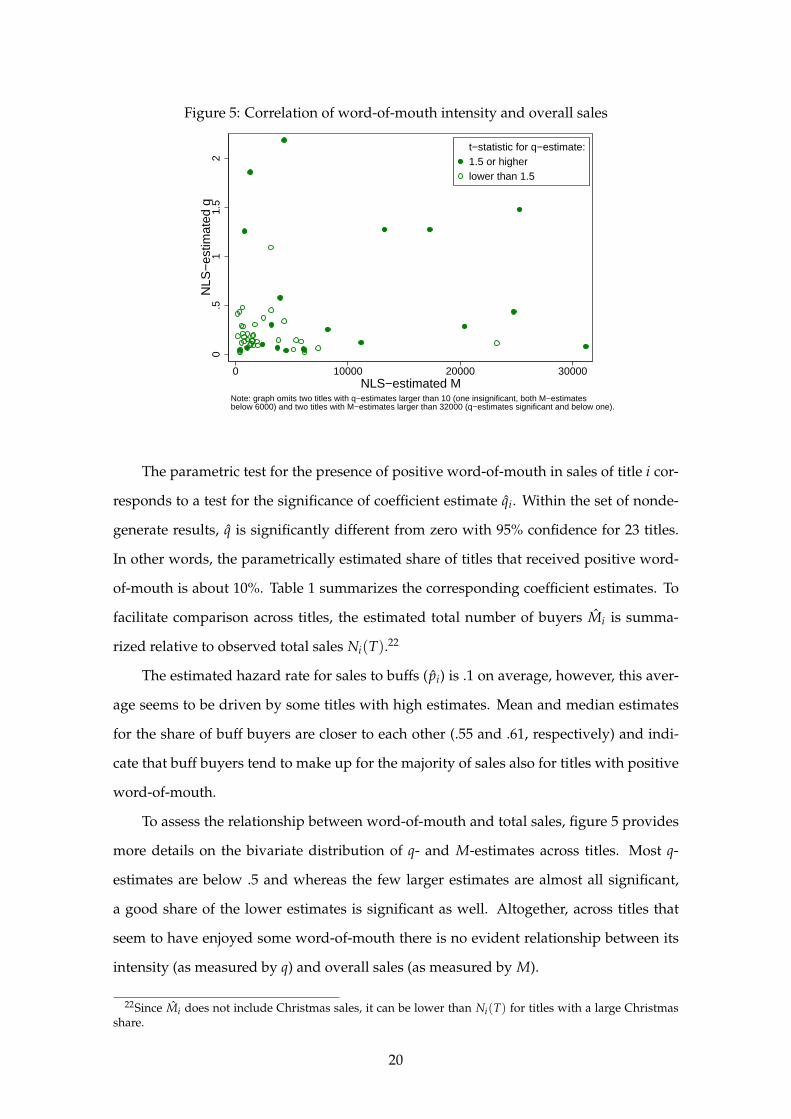
Figure 5: Correlation of word-of-mouth intensity and overall sales
0.5
11.
52
NLS
−es
timat
ed q
0 10000 20000 30000NLS−estimated M
t−statistic for q−estimate:1.5 or higherlower than 1.5
Note: graph omits two titles with q−estimates larger than 10 (one insignificant, both M−estimatesbelow 6000) and two titles with M−estimates larger than 32000 (q−estimates significant and below one).
The parametric test for the presence of positive word-of-mouth in sales of title i cor-
responds to a test for the significance of coefficient estimate qi. Within the set of nonde-
generate results, q is significantly different from zero with 95% confidence for 23 titles.
In other words, the parametrically estimated share of titles that received positive word-
of-mouth is about 10%. Table 1 summarizes the corresponding coefficient estimates. To
facilitate comparison across titles, the estimated total number of buyers Mi is summa-
rized relative to observed total sales Ni(T).22
The estimated hazard rate for sales to buffs (pi) is .1 on average, however, this aver-
age seems to be driven by some titles with high estimates. Mean and median estimates
for the share of buff buyers are closer to each other (.55 and .61, respectively) and indi-
cate that buff buyers tend to make up for the majority of sales also for titles with positive
word-of-mouth.
To assess the relationship between word-of-mouth and total sales, figure 5 provides
more details on the bivariate distribution of q- and M-estimates across titles. Most q-
estimates are below .5 and whereas the few larger estimates are almost all significant,
a good share of the lower estimates is significant as well. Altogether, across titles that
seem to have enjoyed some word-of-mouth there is no evident relationship between its
intensity (as measured by q) and overall sales (as measured by M).
22Since Mi does not include Christmas sales, it can be lower than Ni(T) for titles with a large Christmasshare.
20
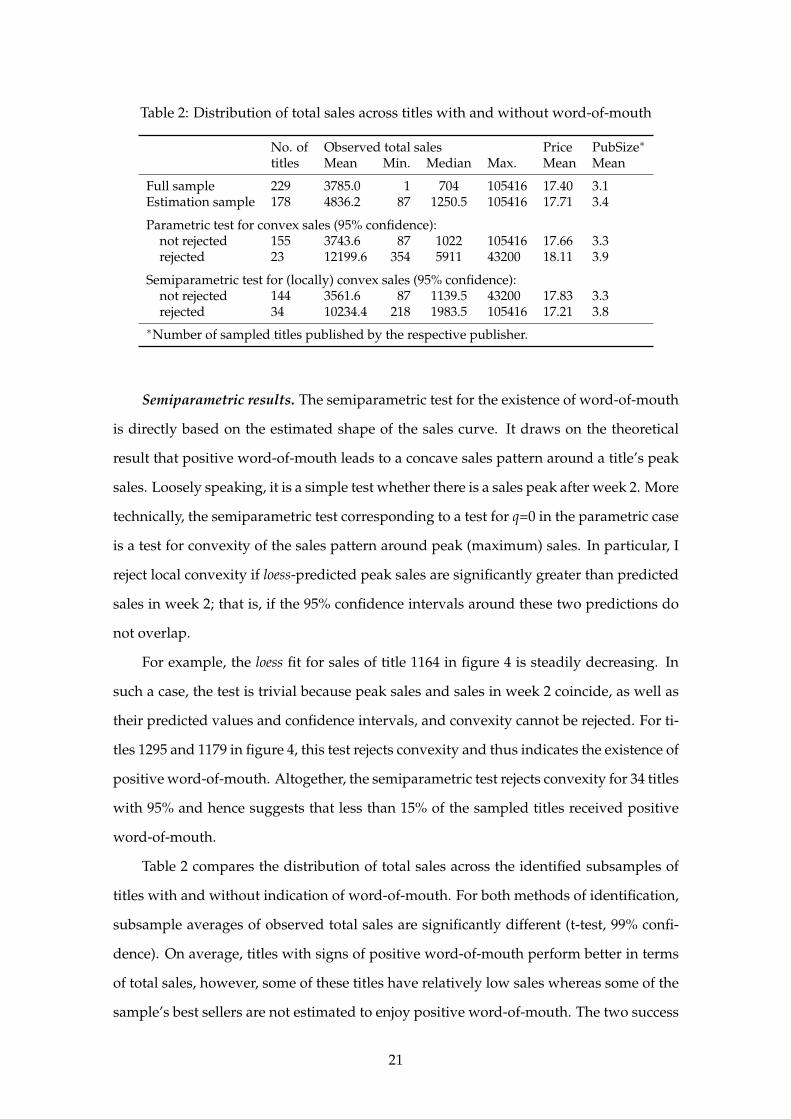
Table 2: Distribution of total sales across titles with and without word-of-mouth
No. of Observed total sales Price PubSize∗
titles Mean Min. Median Max. Mean Mean
Full sample 229 3785.0 1 704 105416 17.40 3.1Estimation sample 178 4836.2 87 1250.5 105416 17.71 3.4
Parametric test for convex sales (95% confidence):not rejected 155 3743.6 87 1022 105416 17.66 3.3rejected 23 12199.6 354 5911 43200 18.11 3.9
Semiparametric test for (locally) convex sales (95% confidence):not rejected 144 3561.6 87 1139.5 43200 17.83 3.3rejected 34 10234.4 218 1983.5 105416 17.21 3.8
∗Number of sampled titles published by the respective publisher.
Semiparametric results. The semiparametric test for the existence of word-of-mouth
is directly based on the estimated shape of the sales curve. It draws on the theoretical
result that positive word-of-mouth leads to a concave sales pattern around a title’s peak
sales. Loosely speaking, it is a simple test whether there is a sales peak after week 2. More
technically, the semiparametric test corresponding to a test for q=0 in the parametric case
is a test for convexity of the sales pattern around peak (maximum) sales. In particular, I
reject local convexity if loess-predicted peak sales are significantly greater than predicted
sales in week 2; that is, if the 95% confidence intervals around these two predictions do
not overlap.
For example, the loess fit for sales of title 1164 in figure 4 is steadily decreasing. In
such a case, the test is trivial because peak sales and sales in week 2 coincide, as well as
their predicted values and confidence intervals, and convexity cannot be rejected. For ti-
tles 1295 and 1179 in figure 4, this test rejects convexity and thus indicates the existence of
positive word-of-mouth. Altogether, the semiparametric test rejects convexity for 34 titles
with 95% and hence suggests that less than 15% of the sampled titles received positive
word-of-mouth.
Table 2 compares the distribution of total sales across the identified subsamples of
titles with and without indication of word-of-mouth. For both methods of identification,
subsample averages of observed total sales are significantly different (t-test, 99% confi-
dence). On average, titles with signs of positive word-of-mouth perform better in terms
of total sales, however, some of these titles have relatively low sales whereas some of the
sample’s best sellers are not estimated to enjoy positive word-of-mouth. The two success
21
measures nominal sales and word-of-mouth can therefore lead to contrasting findings. In
other words, a success measure based on word of mouth can lead to a different result than
a measure based on sales alone, although the two measures are somewhat correlated.
Table 2 also summarizes retail prices (in Euro) and a measure of publisher size (the
number of sampled titles published by the respective publisher) for each subsample. For
both methods of identification, both average retail prices and publisher size do not differ
significantly across titles with and without identified positive word-of-mouth (t-test, 95%
confidence). These results suggest that predetermined title or publisher characteristics
are of little help in predicting the occurrence of word-of-mouth.
4 Conclusion
In this paper, I propose a novel approach to study new-product success in creative in-
dustries. The empirical strategy to identify a profitable product is based on the standard
terms of contract between creator (author) and producer (publisher), combined with a
parsimonious model of new-product diffusion. In this context, measures of positive
word-of-mouth are better indicators of publisher profits than measures based on absolute
sales, because prominent authors can appropriate a large share of a product’s expected
revenues in ex ante bargaining. The existence and extent of positive word-of-mouth can
be identified from a products’s intertemporal variation in sales by either parametric or
semiparametric estimation methods.
In an application to a random sample of novels, estimation results indicate that be-
tween 10 and 15% of titles enjoy positive word-of-mouth. Estimates of positive word-
of-mouth are imperfectly correlated with a title’s total sales and are not correlated with
predetermined title characteristics such as a title’s retail price. These findings support the
view that the title-specific extent of word-of-mouth is extremely difficult to foresee and
that choice of measure is important in studying new-product success.
The results are in line with Diderot’s (1763) rule of thumb that one out of ten pub-
lished books is a commercial success. If Diderot’s rule is an appropriate description of
market conditions in 1763, then changes in information technology since then do not
seem to have much affected the odds of success in the book industry. I therefore sus-
22

pect that current and future technological changes such as the internet revolution will
not significantly improve its new-product success rate.
It is likely, however, that new technologies decrease costs of production and distribu-
tion. Even with constant or slightly decreasing sales by product, this will have a positive
effect on the number of new books and thus variety in the market as predicted by Ander-
son (2006) and Hendricks and Sorensen (2009), because the investment requirements to
produce a book decrease.
In the medium and long term, new technologies may also change the relationship
between creators and producers. One possibility is that creators simply turn to producing
and marketing their product themselves, as it becomes easier and less expensive to do so.
For example, the number of self-published authors, who typically produce their books
by print-on-demand, has risen over the last years. Another possibility is that creators
and producers work more closely and concentrate on developing the content together,
leaving physical production and distribution to service providers. In either case, the
terms of contract and the distribution of revenues and profits across the value chain are
likely to change.
23
A Appendix
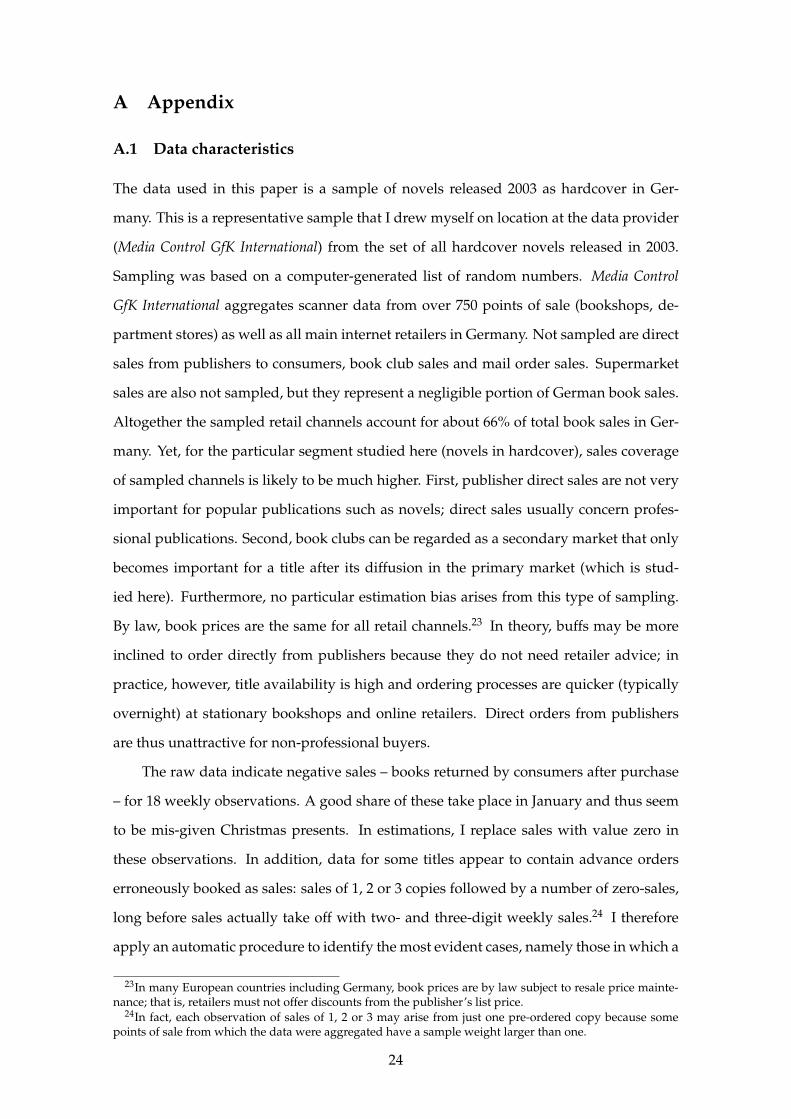
A.1 Data characteristics
The data used in this paper is a sample of novels released 2003 as hardcover in Ger-
many. This is a representative sample that I drew myself on location at the data provider
(Media Control GfK International) from the set of all hardcover novels released in 2003.
Sampling was based on a computer-generated list of random numbers. Media Control
GfK International aggregates scanner data from over 750 points of sale (bookshops, de-
partment stores) as well as all main internet retailers in Germany. Not sampled are direct
sales from publishers to consumers, book club sales and mail order sales. Supermarket
sales are also not sampled, but they represent a negligible portion of German book sales.
Altogether the sampled retail channels account for about 66% of total book sales in Ger-
many. Yet, for the particular segment studied here (novels in hardcover), sales coverage
of sampled channels is likely to be much higher. First, publisher direct sales are not very
important for popular publications such as novels; direct sales usually concern profes-
sional publications. Second, book clubs can be regarded as a secondary market that only
becomes important for a title after its diffusion in the primary market (which is stud-
ied here). Furthermore, no particular estimation bias arises from this type of sampling.
By law, book prices are the same for all retail channels.23 In theory, buffs may be more
inclined to order directly from publishers because they do not need retailer advice; in
practice, however, title availability is high and ordering processes are quicker (typically
overnight) at stationary bookshops and online retailers. Direct orders from publishers
are thus unattractive for non-professional buyers.
The raw data indicate negative sales – books returned by consumers after purchase
– for 18 weekly observations. A good share of these take place in January and thus seem
to be mis-given Christmas presents. In estimations, I replace sales with value zero in
these observations. In addition, data for some titles appear to contain advance orders
erroneously booked as sales: sales of 1, 2 or 3 copies followed by a number of zero-sales,
long before sales actually take off with two- and three-digit weekly sales.24 I therefore
apply an automatic procedure to identify the most evident cases, namely those in which a
23In many European countries including Germany, book prices are by law subject to resale price mainte-nance; that is, retailers must not offer discounts from the publisher’s list price.
24In fact, each observation of sales of 1, 2 or 3 may arise from just one pre-ordered copy because somepoints of sale from which the data were aggregated have a sample weight larger than one.
24

first sales observation of 1, 2 or 3 copies is below the respective title’s average weekly sales
(based on weeks with nonzero sales) and is followed by a zero-sale week. I assume that
such an observation represents an advance order and add the amount to the following
observation of positive sales, which I assume to be the effective release week. Since a few
titles seem to exhibit multiple weeks with such advance orders, I repeat the procedure
four times. In a similar exercise, I also interpret all first-week sales observations of sales of
1 to 3 copies as advance orders whenever they were below 10% of the title’s average sales
(based on weeks with nonzero sales). The main goal of these procedures is to identify
a title’s effective first sales week. They leave all other aspects of estimation essentially
unaffected because first-week sales observations are omitted from estimations.
The initial sample consisted of 307 titles, but many of those were actually not sold
before 2004 or very late in 2003. This is not unusual because a title’s release year is deter-
mined with publication of the publisher’s season catalogue, long before the start of the
season. For many titles the production process is not yet finalized at that point. There-
fore, a late start of observed sales is a sign of delayed release rather than weak demand.
In order to ensure a sufficient number of observations per title, I restrict attention to the
229 titles in the sample that began selling before mid-October (week 43 of 2003).
Figure 6: Distribution of cumulated sales across titles
0.0
002
.000
4.0
006
.000
8D
ensi
ty e
stim
ate
500 1000 2000 3000 4000 5000
Total observed salesCumulated sales after 26 weeks
25
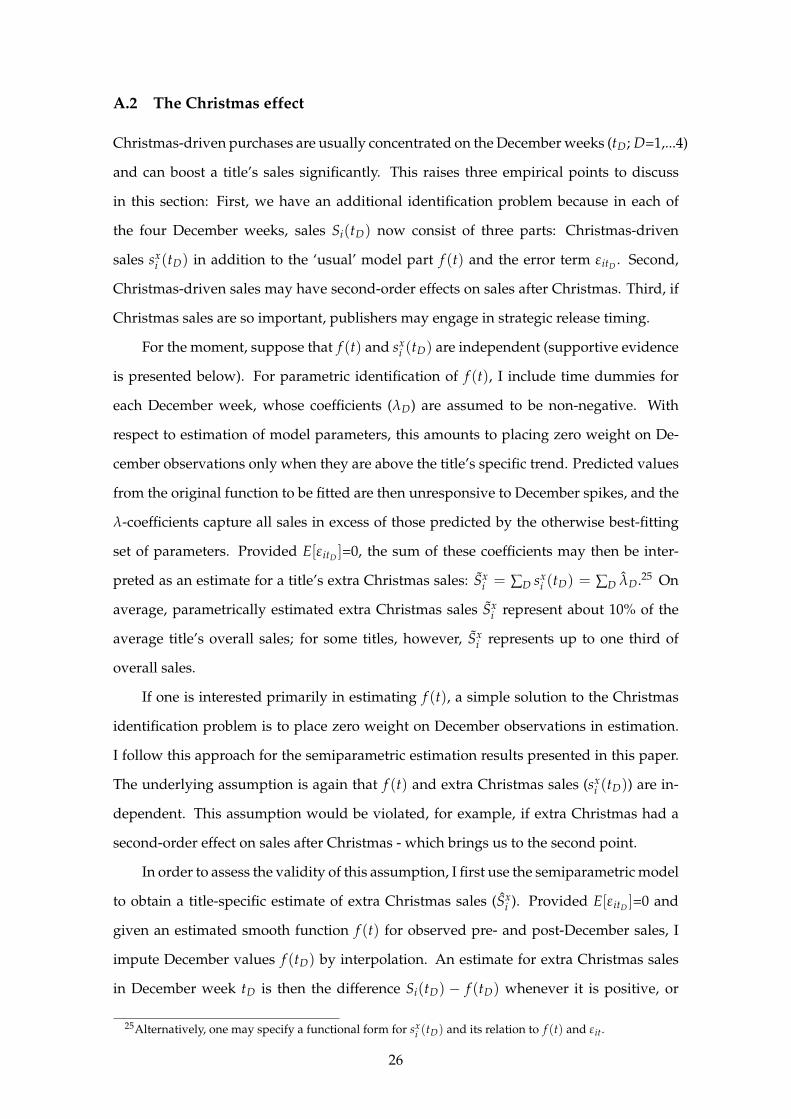
A.2 The Christmas effect
Christmas-driven purchases are usually concentrated on the December weeks (tD; D=1,...4)
and can boost a title’s sales significantly. This raises three empirical points to discuss
in this section: First, we have an additional identification problem because in each of
the four December weeks, sales Si(tD) now consist of three parts: Christmas-driven
sales sxi (tD) in addition to the ‘usual’ model part f (t) and the error term ε itD
. Second,
Christmas-driven sales may have second-order effects on sales after Christmas. Third, if
Christmas sales are so important, publishers may engage in strategic release timing.
For the moment, suppose that f (t) and sxi (tD) are independent (supportive evidence
is presented below). For parametric identification of f (t), I include time dummies for
each December week, whose coefficients (λD) are assumed to be non-negative. With
respect to estimation of model parameters, this amounts to placing zero weight on De-
cember observations only when they are above the title’s specific trend. Predicted values
from the original function to be fitted are then unresponsive to December spikes, and the
λ-coefficients capture all sales in excess of those predicted by the otherwise best-fitting
set of parameters. Provided E[ε itD]=0, the sum of these coefficients may then be inter-
preted as an estimate for a title’s extra Christmas sales: Sxi = ∑D sx
i (tD) = ∑D λD.25 On
average, parametrically estimated extra Christmas sales Sxi represent about 10% of the
average title’s overall sales; for some titles, however, Sxi represents up to one third of
overall sales.
If one is interested primarily in estimating f (t), a simple solution to the Christmas
identification problem is to place zero weight on December observations in estimation.
I follow this approach for the semiparametric estimation results presented in this paper.
The underlying assumption is again that f (t) and extra Christmas sales (sxi (tD)) are in-
dependent. This assumption would be violated, for example, if extra Christmas had a
second-order effect on sales after Christmas - which brings us to the second point.
In order to assess the validity of this assumption, I first use the semiparametric model
to obtain a title-specific estimate of extra Christmas sales (Sxi ). Provided E[ε itD
]=0 and
given an estimated smooth function f (t) for observed pre- and post-December sales, I
impute December values f (tD) by interpolation. An estimate for extra Christmas sales
in December week tD is then the difference Si(tD) − f (tD) whenever it is positive, or
25Alternatively, one may specify a functional form for sxi (tD) and its relation to f (t) and εit.
26
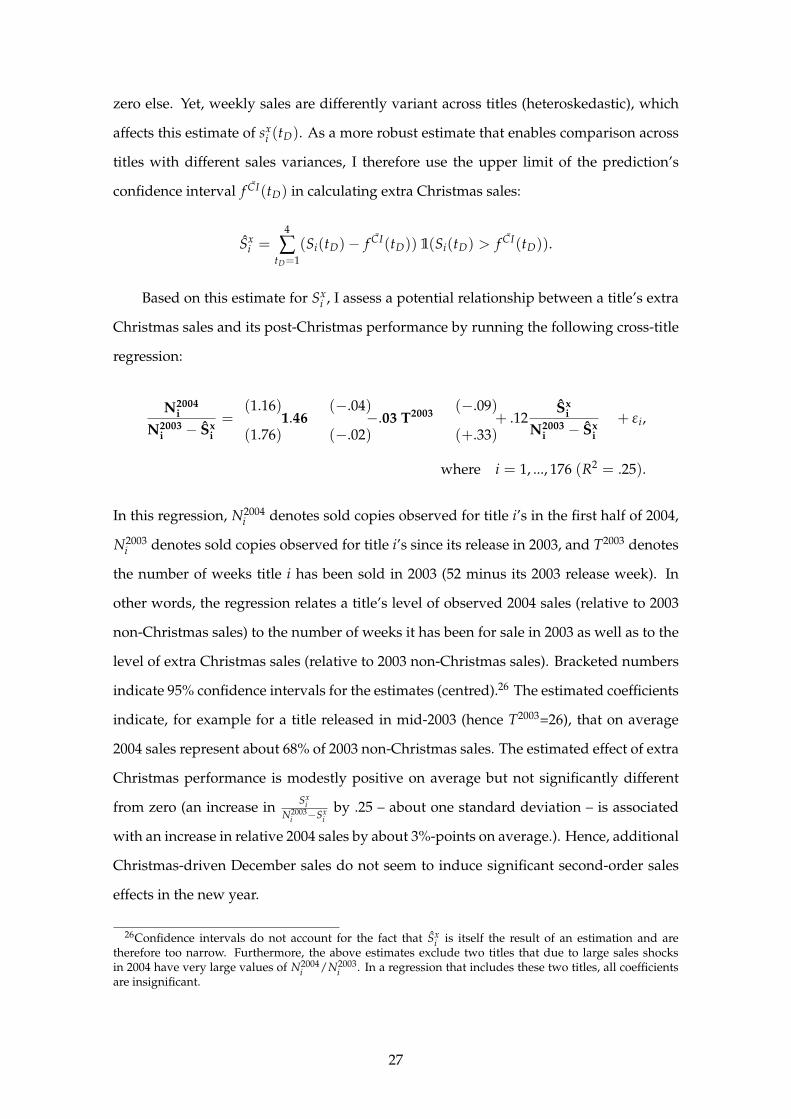
zero else. Yet, weekly sales are differently variant across titles (heteroskedastic), which
affects this estimate of sxi (tD). As a more robust estimate that enables comparison across
titles with different sales variances, I therefore use the upper limit of the prediction’s
confidence interval f CI(tD) in calculating extra Christmas sales:
Sxi =
4
∑tD=1
(Si(tD) − f CI(tD)) 1(Si(tD) > f CI(tD)).
Based on this estimate for Sxi , I assess a potential relationship between a title’s extra
Christmas sales and its post-Christmas performance by running the following cross-title
regression:
N2004i
N2003i − Sx
i
=(1.16)
(1.76)1.46
(−.04)
(−.02)−.03 T2003
(−.09)
(+.33)+ .12
Sxi
N2003i − Sx
i
+ ε i,
where i = 1, ..., 176 (R2 = .25).
In this regression, N2004i denotes sold copies observed for title i’s in the first half of 2004,
N2003i denotes sold copies observed for title i’s since its release in 2003, and T2003 denotes
the number of weeks title i has been sold in 2003 (52 minus its 2003 release week). In
other words, the regression relates a title’s level of observed 2004 sales (relative to 2003
non-Christmas sales) to the number of weeks it has been for sale in 2003 as well as to the
level of extra Christmas sales (relative to 2003 non-Christmas sales). Bracketed numbers
indicate 95% confidence intervals for the estimates (centred).26 The estimated coefficients
indicate, for example for a title released in mid-2003 (hence T2003=26), that on average
2004 sales represent about 68% of 2003 non-Christmas sales. The estimated effect of extra
Christmas performance is modestly positive on average but not significantly different
from zero (an increase in Sxi
N2003i −Sx
i
by .25 – about one standard deviation – is associated
with an increase in relative 2004 sales by about 3%-points on average.). Hence, additional
Christmas-driven December sales do not seem to induce significant second-order sales
effects in the new year.
26Confidence intervals do not account for the fact that Sxi is itself the result of an estimation and are
therefore too narrow. Furthermore, the above estimates exclude two titles that due to large sales shocksin 2004 have very large values of N2004
i /N2003i . In a regression that includes these two titles, all coefficients
are insignificant.
27
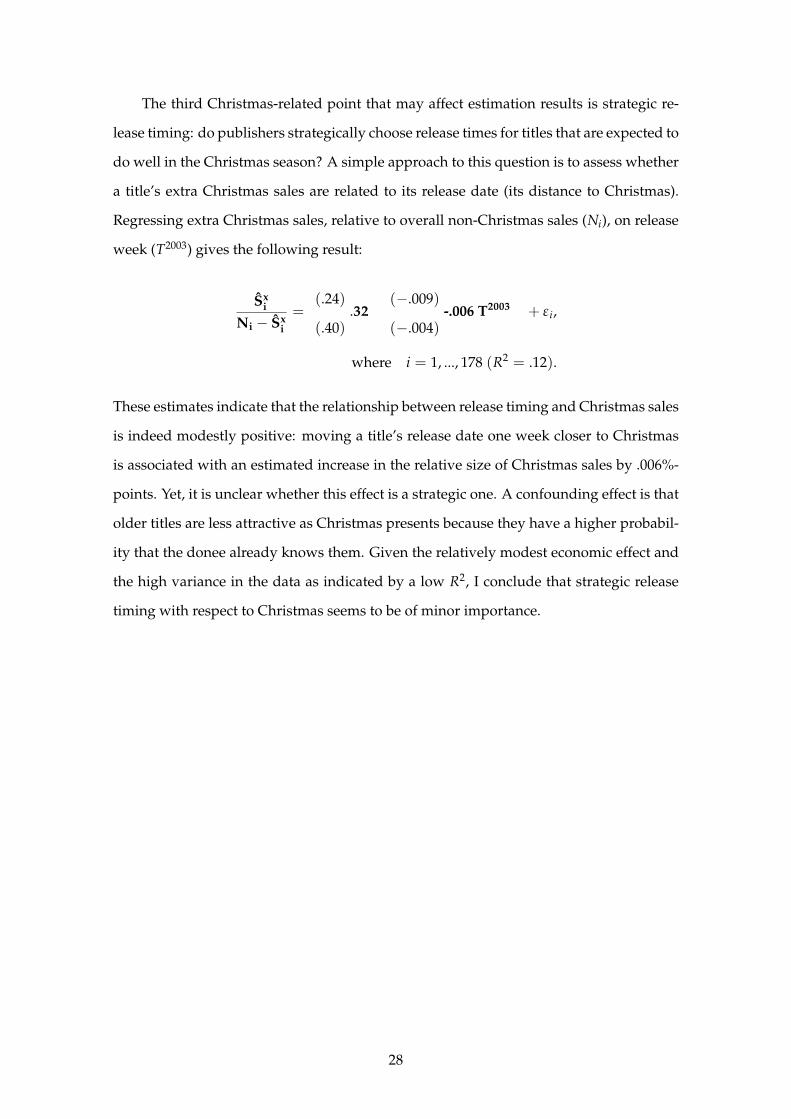
The third Christmas-related point that may affect estimation results is strategic re-
lease timing: do publishers strategically choose release times for titles that are expected to
do well in the Christmas season? A simple approach to this question is to assess whether
a title’s extra Christmas sales are related to its release date (its distance to Christmas).
Regressing extra Christmas sales, relative to overall non-Christmas sales (Ni), on release
week (T2003) gives the following result:
Sxi
Ni − Sxi
=(.24)
(.40).32
(−.009)
(−.004)-.006 T2003 + ε i,
where i = 1, ..., 178 (R2 = .12).
These estimates indicate that the relationship between release timing and Christmas sales
is indeed modestly positive: moving a title’s release date one week closer to Christmas
is associated with an estimated increase in the relative size of Christmas sales by .006%-
points. Yet, it is unclear whether this effect is a strategic one. A confounding effect is that
older titles are less attractive as Christmas presents because they have a higher probabil-
ity that the donee already knows them. Given the relatively modest economic effect and
the high variance in the data as indicated by a low R2, I conclude that strategic release
timing with respect to Christmas seems to be of minor importance.
28
References
Anderson, Chris (2006), The Long Tail: Why the Future of Business is Selling Less of More,
Hyperion, New York, NY.
Bass, Frank M. (1969), A new product growth model for consumer durables, Management
Science, 15(5): 215–227.
Beck, Jonathan (2007), The sales effect of word of mouth: A model for creative goods and
estimates for novels, Journal of Cultural Economics, 31(1): 5–23.
Boswijk, H. Peter and Philip Hans Franses (2005), On the econometrics of the Bass diffu-
sion model, Journal of Business & Economic Statistics, 23(3): 255–268.
Bulow, Jeremy and Paul Klemperer (1996), Auctions versus negotiations, American Eco-
nomic Review, 86(1): 180–94.
Cameron, A. Colin and Pravin K. Trivedi (2005), Microeconometrics: Methods and Applica-
tions, Cambridge University Press, New York, NY.
Caves, Richard E. (2000), Creative Industries, Harvard University Press, Cambridge, MA.
— (2003), Contracts between art and commerce, Journal of Economic Perspectives, 17(2):
73–83.
Chevalier, Judith A. and Dina Mayzlin (2006), The effect of word of mouth on sales: On-
line book reviews, Journal of Marketing Research, 43(3): 345–354.
Clerides, Sofronis and George Kassinis (2009), Modeling the diffusion of strategies: an
application to exporting, Industrial and Corporate Change, 18(3): 415–434.
Clerides, Sofronis K. (2002), Book value: Intertemporal pricing and quality discrimina-
tion in the U.S. market for books, International Journal of Industrial Organization, 20(10):
1385–1408.
Cleveland, William S. (1979), Robust locally weighted regression and smoothing scatter-
plots, Journal of the American Statistical Association, 74(368): 829–836.
Dana, James D. and Kathryn E. Spier (2001), Revenue sharing and vertical control in the
video rental industry, Journal of Industrial Economics, 49(3): 223–245.
De Vany, Arthur S. and W. David Walls (2004), Motion picture profit, the stable paretian
hypothesis, and the curse of the superstar, Journal of Economic Dynamics and Control,
28(6): 1035–1057.
29

Denisoff, Serge and William L. Schurk (1986), Tarnished Gold: The Record Industry Revisited,
Transaction Publishers, New Brunswick, NJ.
Diderot, Denis (1763/2003), Lettre sur le commerce de la librairie, in: Oeuvres complètes,
vol. 18, Garnier-Frères, Paris 1876, 2003 edition published by Mille et une nuits, Paris.
Elberse, Anita (2007), The power of stars: Do star actors drive the success of movies?,
Journal of Marketing, 71(4): 102–120.
Elberse, Anita, Jehoshua Eliashberg and Mark Leenders (2006), The motion picture indus-
try: Critical issues in practice, current research and new research directions, Marketing
Science, 25(6): 638–661.
Escarpit, Robert (1969), La révolution du livre, Unesco/Presses Universitaires de France,
Paris, 2nd ed.
Food Marketing Institute (2002), Slotting allowances in the supermarket industry, FMI
Backgrounder available at fmi.org/media/bg/.
Gaffeo, Edoardo, Antonello E. Scorcu and Laura Vici (2008), Demand distribution dy-
namics in creative industries: The market for books in Italy, Information Economics and
Policy, 20: 257–268.
Galassi, Jonathan and Jofie Ferrari-Adler (2009), Agents & editors: A Q&A with Jonathan
Galassi, Poets & Writers Magazine, 23(4).
Goldman, William (1983), Adventures in the Screen Trade: A Personal View of Hollywood and
Screenwriting, Warner Books.
Hall, Bronwyn H. and Beethika Khan (2003), Adoption of new technology, in: Jones,
Derek C. (ed.), New Economy Handbook, Academic Press.
Hansmann, Henry and Reinier Kraakman (1992), Hands-tying contracts: Book publish-
ing, venture capital financing, and secured debt, Journal of Law, Economics and Organi-
zation, 8(3): 628–55.
Henard, David H. and David M. Szymanski (2001), Why some new products are more
successful than others, Journal of Marketing Research, 38(3): 362–375.
Hendricks, Ken and Alan Sorensen (2009), Information and the skewness of music sales,
Journal of Political Economy, 117(2): 324–369.
Horvitz, Paul M. (1966), The pricing of textbooks and the remuneration of authors, Amer-
ican Economic Review, 56(1/2): 412–420.
30

Hurvich, Clifford M., Jeffrey S. Simonoff and Chih-Ling Tsai (1998), Smoothing parameter
selection in nonparametric regression using an improved Akaike information criterion,
Journal of the Royal Statistical Society Series B, 60(2): 271–293.
Mahajan, Vijay, Eitan Muller and Yoram Wind (eds.) (2000), New-product diffusion models,
Springer, New York, NY.
Moldovanu, Benny and Manfred Tietzel (1998), Goethe’s second-price auction, Journal of
Political Economy, 106(4): 854–859.
Moul, Charles C. (2007), Measuring word of mouth’s impact on theatrical movie admis-
sions, Journal of Economics and Management Strategy, 16(4): 859–892.
Prince, Jeffrey T. and Daniel H. Simon (to appear), Has the internet accelerated the diffu-
sion of newproducts?, Research Policy, doi:10.1016/j.respol.2009.06.008.
Putsis, William P. Jr. and V. Srinivasan (2000), Estimation techniques for macro diffusion
models, in: Mahajan et al. (2000), 263–294.
Ruppert, David, Matthew P. Wand and Raymond J. Carroll (2003), Semiparametric regres-
sion, Cambridge University Press, New York, NY.
Salganik, Matthew J., Peter S. Dodds and Duncan J. Watts (2006), Experimental study
of inequality and unpredictability in an artificial cultural market, Science, 311(5762):
854–856.
Sorensen, Alan T. (2007), Bestseller lists and product variety, Journal of Industrial Eco-
nomics, 55(4): 715–738.
Sorensen, Alan T. and Scott Rasmussen (2004), Is any publicity good publicity? A note
on the impact of book reviews, working paper.
Tietzel, Manfred (1995), Literaturökonomik, J.C.B. Mohr (Paul Siebeck), Tübingen.
Turnovsky, Geoffrey (2003), Conceptualising the literary market: Diderot and the lettre
sur le commerce de la librairie, Studies on Voltaire and the Eighteenth Century, 2003(1):
135–170.
Van den Bulte, Christophe and Yogesh V. Joshi (2007), New product diffusion with influ-
entials and imitators, Marketing Science, 26(3): 400–421.
von Lucius, Wulf D. (2005), Verlagswirtschaft, UTB, Konstanz.
31