differential absorption lidar monitoring of atmospheric...
TRANSCRIPT
LUND UNIVERSITY
PO Box 117221 00 Lund+46 46-222 00 00
Differential absorption lidar monitoring of atmospheric atomic mercury
Edner, Hans; Ragnarsson, Paer; Svanberg, Sune; Wallinder, Eva
Published in:Lidar for Remote Sensing
DOI:10.1117/12.138537
Published: 1992-01-01
Link to publication
Citation for published version (APA):Edner, H., Ragnarsson, P., Svanberg, S., & Wallinder, E. (1992). Differential absorption lidar monitoring ofatmospheric atomic mercury. In I. J. RBecherer, & C. Werner (Eds.), Lidar for Remote Sensing (Vol. 1714, pp.32-38). SPIE. DOI: 10.1117/12.138537
General rightsCopyright and moral rights for the publications made accessible in the public portal are retained by the authorsand/or other copyright owners and it is a condition of accessing publications that users recognise and abide by thelegal requirements associated with these rights.
• Users may download and print one copy of any publication from the public portal for the purpose of privatestudy or research. • You may not further distribute the material or use it for any profit-making activity or commercial gain • You may freely distribute the URL identifying the publication in the public portalTake down policyIf you believe that this document breaches copyright please contact us providing details, and we will removeaccess to the work immediately and investigate your claim.
Differential absorption lidar monitoring of atmospheric atomic mercury
Hans Edner, Par Ragnarson, Sune Svanberg and Eva Wallinder
Department of Physics, Lund institute of TechnologyP.O. Box 118, S-221 00 Lund, Sweden
ABSTRACT
The application of a mobile differential absorption lidar (DIAL) system in monitoring the atmospheric distribution ofatomic mercury is discussed. The DIAL technique using the 253.65nm Hg resonance line has been employed in studies ofindustrial emissions as well as geophysical manifestations. Hg concentrations down to the background value 2 ng/m3 canbe measured.
1. iNTRODUCTION
There is a considerable interest to obtain a better understanding of the magnitude and the distribution of differentnatural and anthropogenic sources of atmospheric mercury, and to study the fluxes between different systems in the
irnm1'2 Mercury is released e.g. from chlorine-alkali industries, refuse incineration plants coal-fired power plantsand crematoria. Mineralizations, geothermal reservoirs and volcanism are also known to be associated with elevatedmercury concentrations. It has been suggested that geothermal energy and ore deposits might be located focusing onassociated atmospheric mercury anomalies.3'4 Mercury is present in the atmosphere mainly in its atomic form and can thusbe detected with the differential absorption lidar (DIAL) techniques using the mercury resonance line at 253.65 nm. Duringthe last years the mobile DIAL system has been used in several measurements of aimosphenc mercury in different areas. ANd:YAG-pumped dye laser with subsequent frequency doubling is used to reach the resonance line with enough pulseenergy to enable range resolved measurements up till a range of about 1 km.
2. SYSTEM DESCRIPTION
The mobile DIAL is a flexible system which is constructed for measurements of various species.5'6 An overview ofthe system is given in Fig. 1. The laser, telescope and all electronics are contained in a Volvo F610 truck with a speciallydesigned cargo compartment of size 6.0*2.3*2. 1 m3. The truck is equipped with four sturdy supporting legs that can behydraulically lowered to achieve high stability during measurements requiring high directional accuracy in the opticalsystem. The important characteristics of the DIAL system are summarised in Table I. The laser transmitter is a Nd:YAGpumped dye laser with frequency doubling in beta barium borate (BBO) crystal. The dye laser is equipped with a dualwavelength option, enabling the laser to alternately be fired at two different pre-set wavelengths. The dye laser wavelengthscale is calibrated using the absorption in a cell filled with Hg vapour, transluminated with a small part of the laser beam.
The outgoing laser beam is directed coaxially with a vertically mounted telescope and transmitted into the atmospherevia a large flat mirror in a retractable transmitting/receiving dome on the roof. A quartz window seals off the dome.Stepping motors are used to turn the dome and to tilt the mirror. Thus it is possible to steer the measurement direction 360degrees horizontally and within an angle of 45 degrees vertically. In order to protect the mirror coating, the exiting laserbeam is expanded with a 6* beam expander. Servo motors and micrometer screws offer remote control of the fmal turningprism, through which the overlap between the laser transmission lobe and the telescope field of view is controlled. Twovideo cameras are used to control and supervise the measurement direction. A mechanical chopper can block the beam ifdesired. The computer-controlled chopper is automatically used during a lidar measurement to obtain the signal due tobackground light and preamplifier offset.
An adjustable field stop is placed in the focus of the receiving Newtonian telescope, by means of which the field ofview can be varied from 2 to 5 mrad. After passing through an interference filter the light is detected by a photo multipliertube. Due to the fact that the beam is emitted coaxially with the telescope, the near field back scattered light is very strong.To prevent detector overload and to reduce the dynamic range of the signal, the gain of the PMT is modulated. This isperformed by changing the voltage difference in the dynode chain. The gain is very low in the beginning and does not
32 / SPIE Vol. 1714 Lidar for Remote Sensing (1992) 0-81 94-0879-4/92/$4.00
Downloaded from SPIE Digital Library on 11 Jul 2011 to 130.235.188.104. Terms of Use: http://spiedl.org/terms

reach its full value until after 2-10 jis (the rise time is variable).
The signal from the PMT is preamplified arid captured with a 8-bit 100-MHz transient digitizer. Normally 2000channels, each iOns wide, are recorded, corresponding to a lidar measuring range of 3 km. After the recording, the data aretransferred via a GPIB interface to the computer where they are added into a 32-bit data array at a repetition rate of 20Hz.A DIAL measurement cycle consists of 8 shots on each wavelength, fired alternately, and finally two shots with thechopper closed. Several cycles are then averaged and stored on disk after background subiraction. During a measurementnormally 100 to 200 cycles are averaged, corresponding to a measurement time of 1 .5 to 3 minutes. When vertical orhorizontal scanning were performed the measurement time for each direction can be divided in several repetitions.
While system control and on-line data handling are controlled by the system computer, data processing and evaluationcan be performed on a separate computer. A typical evaluation consists of three phases. First a Gaussian smoothingfunction of a few channels width is applied on the raw lidar signals. Then the ratio of the lidar signal at the differentwavelengths is calculated. A running average function of adjustable width is fmally used to evaluate the concentration as afunction of distance. Data from horizontal or vertical scans are presented as a 2D-plot with the concentration valueindicated with a grey scale. The thta from a vertical scan can also be transferred to a single vertical or horizontal profilewith a vertical/horizontal projection.
3. MEASUREMENTS
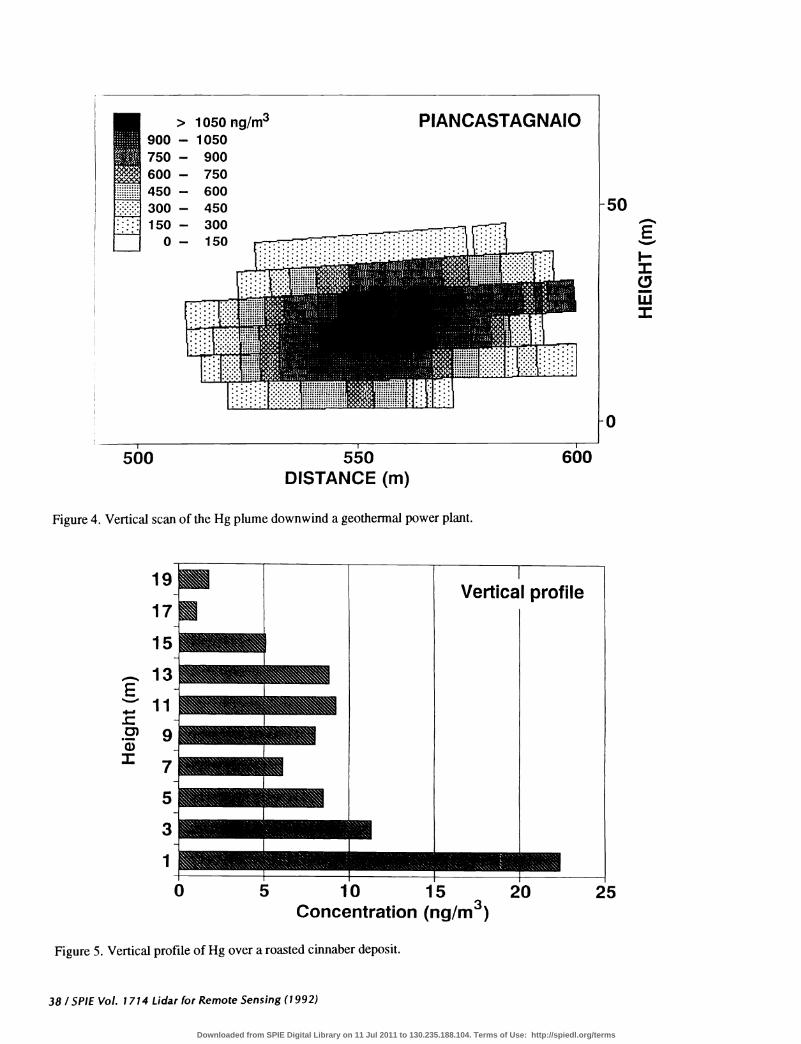
Many field campaigns have been performed with the mobile system to measure atmospheric atomic mercury fromindustrial and natural sources.79 Fig. 2 shows a vertical scan through the plumes from a chlorine-alkali plant. The twoplumes from the two cell rooms are clearly separated and the flux from the two sourses can be individualy evaluated. Theflux is evaluated by multiplying the integrated concentration over the plume cross section area with the wind speed normalto the scan. The total flux was in this example found to be 40 g/h of atomic Hg vapour. In Fig. 3 the distribution ofHg nearthe cooling towers of a geothermal power plant (30 MW) is shown, Hg concentrations are given in ng/m3 •8 The figure ismade from horizontal and vertical scans as indicated by the dots. It is interesting to see that the main part of the atomicmercury do not emerge from the top of the cooling tower but rather from the lower part. Fig. 4 shows the vertical scan ofan other geothermal power plant (20 MW).8 The total flux from this plant was evaluated to 20 g/h of atomic mercury.Concentrations down to the background value of about 2 ng/m3 can be measured. In Fig. 5 the vertical concentrationprofile over a roasted cinnaber (HgS) deposit at an abandoned mercury mine.9
4. CONCLUSION
As demonstrated by the examples the differential absorption lidar method is a powerful technique for mapping ofimportant atmospheric pollutants. The atomic mercury measurements were supported with gold trap point monitors and theagreements between the two methods were very good.1° For the future we plan to extent our investigations of atmosphericatomic mercury to seismic and vulcanological processes, which are also known to produce mercury anomalies.
5. ACKNOWLEDGEMENTS
The authors would like to thank R. Ferrara and E. B. Maserti (CNR-IBF, Pisa), and R. Bargagli (University of Siena)for collaboration in the projects and thank P. Olsson and M. Morelli for assistance in the measurements. This work wassupported by the Swedish Natural Science Research Council and the Swedish Board for Space Activities.
SPIE Vol. 1714 Lidar for Remote Sensing (1992) / 33
Downloaded from SPIE Digital Library on 11 Jul 2011 to 130.235.188.104. Terms of Use: http://spiedl.org/terms
(Z66 1) SU!SUa aowj Joj JePfl friL I 7°A 3IdS I ti
ssoid
1_El "IIW°H pirn £rJSTuIoq0009 j11UOU[UOJ1AU 'SOipfl1S j11UOU1UOJIAUO UI SJOUUOUI Uliod pirn .mpq q suoiwuiuuoop cjnojoui ouoqdsourty
,, 'iopuqp '[ pin? JOqLmA S 'UOSJ1U)J d 'JOUN H 'UOS1} '1.rnllOj j 01 ssojd ui 'AUg j1Oj p 'iam uiuuu ioqiurno i u uiddiui
cjnojui ouoqdsouii j Pu BJOS1s fJ 'JI.uoJ 'opup 'JoquA s 'uOsJui d 'up H 6 (z661) 98L
6LL dd '(xi)L6 10A 'S0)J sMidoo I 1'SjOIJ f1UOIflOO Urnjl?1J m Ainoiow oiwop Duoqdsouiw jo rnddui spij uouthosqi pUUOJOJJIJ '!UY .1 .I PU 1J1JJOJ J 'OSOQ 'JOpUijjE 'JqU1?A S 'UOS1U)J d 'Up H 8
ssoid ui 'AUg uuy 'onbiuqooi 'ri otn Iim pornsow xo!duioo !pp-Jopp i woij oioqdsourn O1 OWL SUOISS!UIO AJflOJOJS4 'JopmJp [ JUI 1XLU1AS S 'UOSJ1U)J d '10UP H '!U°V1 EI '"'°d I L
6861 'O6-JZ6 dd '(ç)g bA ',dO iddy 1'sonbwqooi J1P uouthosqi pmuoiojjip utsn uuouuow £moioui otuiop ouoqdsouny1 'iquA s pw uossouns y 'suij H 9
L86T '-oi' dd '(61)9z iA '1d0 jddy 1uuouuoui ouoqdsourn ioj wsAs uisuos oowoi oj!qoy '1puo/ M pui snou ' 'iquiA s 'uossun y 'uossjupoJj TX '.oup -j ç
ZL61 'Z9IbI d' ' i°A 'JOjdX uioqooo f 1'siisodop aio oi sopin si oqi UI siuouoduioo OjflIjøA ioqio pu JodiA £InoJo, 'f 'rIoi H 1
b861 'Lt-6Z dd 'j i°A 'SMUUOq1OOD 'S1OJ1 UU0qiO0 .ioj uouiuoidxo oiwoqooo y :sjios in soiwuIou J-i 'joosn j 1U1 dufloJIA D '1 b
1661 'qooJpio 'sJoqSqqn !UIOPV JOML1DI '9c bOA 'UOUflhIOd I!OS PU W 'UAt 'Uflflflll0d pnuowuoJ!Au u si Ainoio '(po) isinbpuv o z
6L61 'U1IP10SU1V 'PUTIIOH q1JOJJOIAS '1UOUJUO.RAU oip in £inoio jo nsrwoqooooi U '(po) rnuti 0 f J
S3DN3II3d3I 9
Downloaded from SPIE Digital Library on 11 Jul 2011 to 130.235.188.104. Terms of Use: http://spiedl.org/terms

Figure 1. Overview of the mobile DIAL system.
Table I Data for the mobile DIAL system
Emitter Reciver
Laser Continuum, YG682-20, Nd:YAGrep. rate 20 Hz, 6-9 ns pulse lengthl200mJ 1064nm
Dye laser Continuum, TDL6Ofrequency doubling253.65 nm, 5 mJ, 0.5 mraddual wavelength, alternate switching
Telescope Newtonian telescope, 40 cm diameter, ff2.5computer controlled steering mirror
Thorn-EMIl 9816QA, S20 cathodegain iO , ramped 2-10 psLeCroy units 6102, 2*TR 88182*NIM81O3A, 8013. 8-bit, 100-MHz
Computers 2*IBM compatible PC, 386
SPIE Vol. 1714 Lidar for Remote Sensing (1992)! 35
I I I
0 1 2 3 4 5 m
Photo detector
Digitizer
Downloaded from SPIE Digital Library on 11 Jul 2011 to 130.235.188.104. Terms of Use: http://spiedl.org/terms
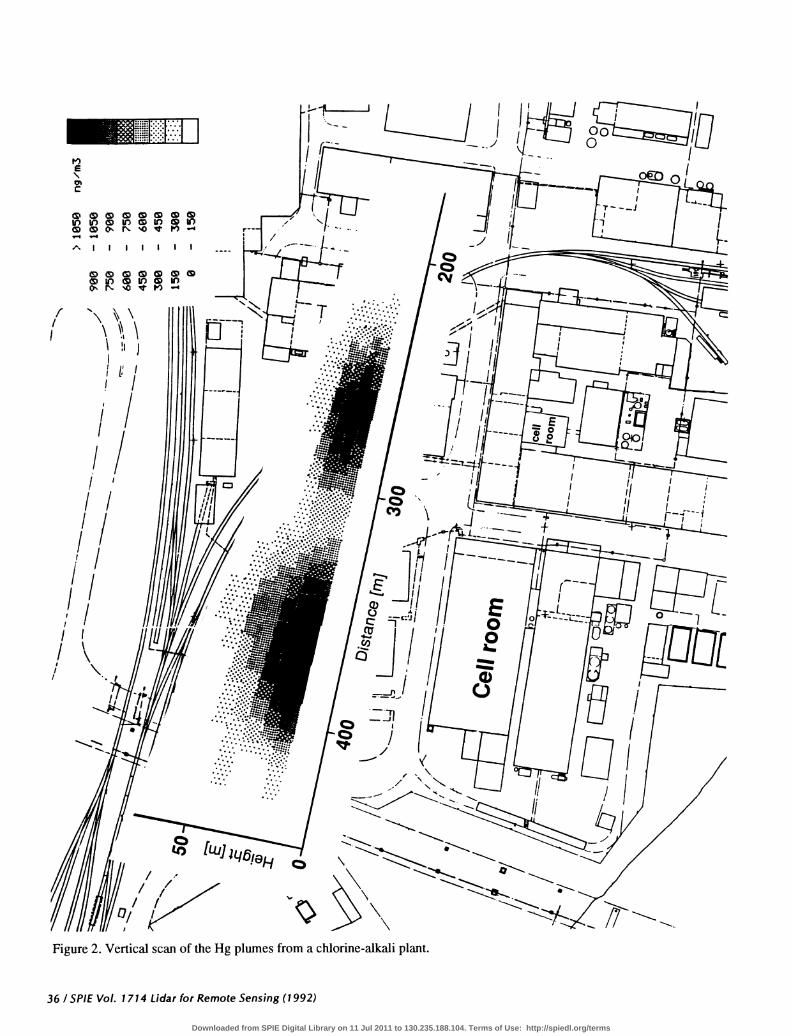
Figure 2. Vertical scan of the Hg plumes from a chlorine-alkali plant.
36 / SP1E Vol. 1714 Lidar for Remote Sensing (1992)
IiIE
C
I liii
I/ i: /II1/.1/
If //1/ '\I ..
Downloaded from SPIE Digital Library on 11 Jul 2011 to 130.235.188.104. Terms of Use: http://spiedl.org/terms
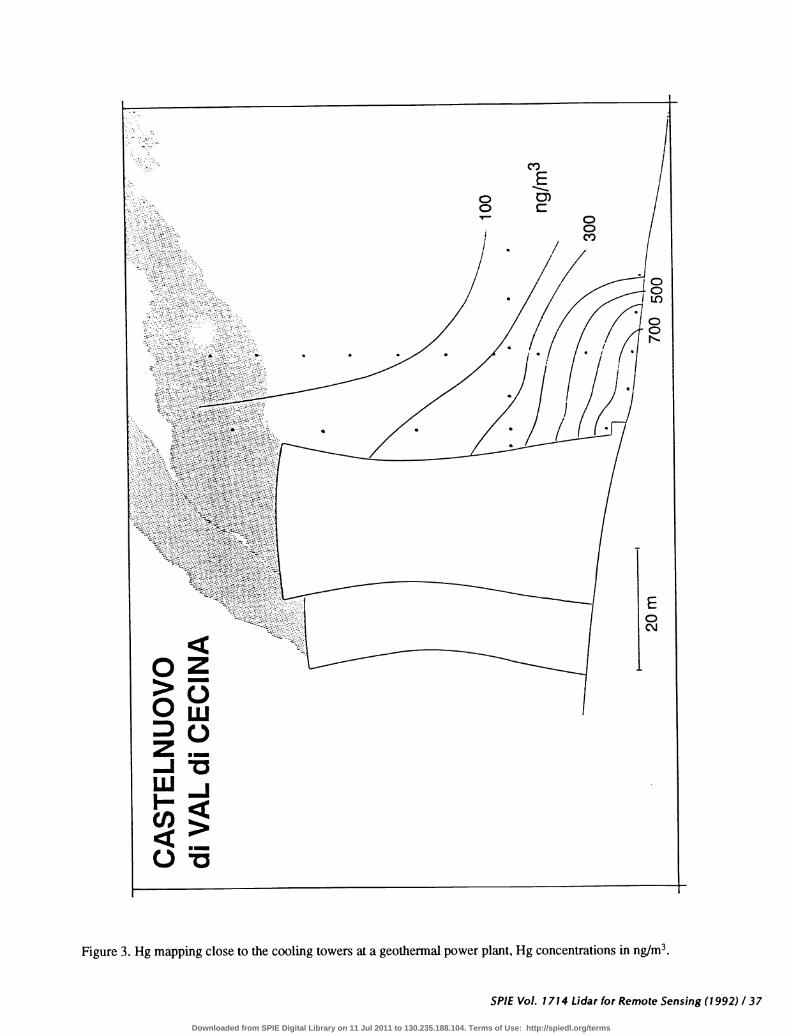
Figure 3. Hg mapping close to the cooling towers at a geothermal power plant, Hg concentrations in ng/m3.
SPIE Vol. 1714 Lidar for Remote Sensing (1992)137
Downloaded from SPIE Digital Library on 11 Jul 2011 to 130.235.188.104. Terms of Use: http://spiedl.org/terms
900>—
1050 ng/m3 PIANCASTAGNAIO1050
750 — 900600 — 750450 600300 — 450150
0—
—300150
500 550 600
DISTANCE (m)
Figure 4. Vertical scan of the Hg plume downwind a geothermal power plant.
0
•50
I
Vertical profile
I
19
17
15
13
11
9
7
5
3
1
— ——
— —
0 5 10 15 20Concentration (ng/m3)
Figure 5. Vertical profile of Hg over a roasted cinnaber deposit.
38 / SPIE Vol. 1714 Lidar for Remote Sensing (1992)
25
Downloaded from SPIE Digital Library on 11 Jul 2011 to 130.235.188.104. Terms of Use: http://spiedl.org/terms