digesting public opinion: a meta-analysis of attitudes toward food
TRANSCRIPT

Digesting Public Opinion: A meta-Analysis of Attitudes Toward Food, Health and Farms
Prepared for the Frameworks Institute By
Meg Bostrom Public Knowledge, LLC
July 2005
Copyright © 2005 – Frameworks Institute

2
Introduction The W.K. Kellogg Foundation developed the Food and Society Initiative to “support the creation and expansion of community-based food systems that are locally owned and controlled, environmentally sound and health-promoting.” To build public support for this effort, the Kellogg Foundation asked the FrameWorks Institute to analyze existing public perceptions and develop a communications frame that will engage the public in a dialogue about relevant policy options, such as support for small locally-owned farms, support for locally-grown organic food, and information leading to wise consumer choices, among other options. The objective for this phase of research is to review existing public opinion data to determine what is already known about public opinion in relevant issue areas before exploring new avenues for communications. To that end, this researcher synthesized more than 250 documents into the following strategic overview. The overview is organized into three primary sections: Food and Health, which discusses public perceptions of health and the role that food plays in human health; Food Processing, which reviews public understanding of the dangers, benefits, and innovations in processing that affect food quality; and, Farming, which discusses public perceptions of a range of farm-specific issues. Americans are generally satisfied with various actors in the nation’s food system. The positive consequence of strong satisfaction with grocers, farmers, and so on, is that the public trusts these actors and is likely to listen to their views. However, the high level of public satisfaction also means that there is no groundswell of public support for government intervention in the nation's food system. In fact, this research indicates that the public finds it difficult to think systemically about food. The connection between food and health promotion or disease prevention is a consistent theme in the news media. This frame has some benefits since Americans are concerned about physical health and have come to understand the components of a nutritious diet. In fact, a majority of people reports that they are consuming at least one specific food for functional health benefits. In recent years, health-related news coverage of food has increasingly emphasized obesity. In many ways, the obesity conversation is not about a healthy diet, because people are willing to engage in unhealthy eating patterns to lose weight. More importantly, a public conversation about obesity is not conducive to building support for public policies. While people understand that obesity is a serious health problem, they also view it as a matter of individual consumer choice. An individual is responsible for his or her diet, not the food system. The main policy result of communications about obesity is public support to provide more information for individuals to make wiser choices, not an improved food system.

3
A second approach, and one that begins to move the public toward a systemic conversation, is to connect human health with the qualities of food that are influenced by food production and processing. Surveys indicate that the public is aware of some dangers in food production, such as mad cow disease (bovine spongiform encephalopathy) and pesticides, but people have little understanding of other dangers, such as antibiotic use, hormones, and genetic modification. Opinion on all these topics is largely unformed and malleable. Few view any of these as serious concerns and even fewer are taking any action to address these threats. At the same time, majorities hold positive views of food processing that avoids dangers in food production and promotes healthy products. The public believes that organic products and locally grown foods are healthier, supportive of small farmers and their communities, and more environmentally friendly. While positive perceptions are widespread, loyal, consistent use of organic and locally grown foods continues to be rare. There may be an opportunity to build support for public policies by linking food production (both the dangers and the benefits) with its impact on human health. Finally, a third approach to a public conversation about the food system is to focus on farms, particularly smaller farms and farms that employ environmental practices. Americans value farms and are concerned that the number of farms in the United States is in decline. People believe small family farms produce safer, more nutritious food and are more likely to protect the environment. Therefore, while they support farm subsidies across the board, the public, when allowed to distinguish between small and large farms, strongly supports subsidies for small family farms and opposes them for large industrial farms. Importantly, most members of the public do not understand how farming practices can harm the environment. Therefore, farming is not currently an "environmental problem," though farmers can be enlisted in environmental solutions. The interpretation offered in this review is the author’s alone. Other analysts may provide a different interpretation of the data.

4
Method A framing meta-analysis entails a review and interpretation of existing public opinion research. The analysis that follows is a synthesis of available data, not a catalog. The objective of this analysis is to illuminate patterns in public opinion that lead to strategic insights, not to list every question asked. Approximately 250 documents comprising thousands of survey questions were reviewed in the course of this research, of which more than 40 research studies are specifically cited in this report. Frequently, separate research efforts ask similar questions and obtain similar results. Therefore, the author attempted to cite the most recent results available. Furthermore, the author attempted to include only research that was conducted by credible sources using sound research methods. In most instances, survey results are cited only when the entire survey was available for analysis. In a few instances, however, results were only available through a written analysis or news article. These instances are noted in the research references. The research was constrained by the need to reference only publicly-available sources of information. Proprietary research, including research that can be obtained for a fee, is not included in this review, due to restrictions on disseminating such information. Any findings from proprietary research that are included in this report are available to the public through news articles, websites, and so on. Finally, this is a review of opinions held by the general public in the United States. Surveys from other countries and surveys of elite audiences, such as food producers, elected officials, and so on, are not included in this analysis. Of course, these views are important, but they are outside the scope of this report.

5
Summary of Findings
Industry Perceptions Americans have strongly positive perceptions of various actors in the food system. Supermarkets and packaged food companies rank first and third in doing a good job serving consumers, and the restaurant industry, grocery industry, and farming and agriculture rank in the top five industries in positive public perceptions. Unlike other major infrastructures in the country, such as energy and healthcare, there is no groundswell of public dissatisfaction calling for government intervention in the food system. In rating several industries, the public gives supermarkets and packaged food companies exceptionally high ratings. In fact, supermarkets receive the highest rating of 21 industries reviewed. Fully 92% say that supermarkets “generally do a good job of serving their consumers” (an increase of five percentage points over the prior year’s ratings), 2 and 42% believe that supermarkets are generally honest and trustworthy – the highest rating among 15 industries. In addition, only 8% believe supermarkets should be more regulated by government, while 17% believe supermarkets should be less regulated.3 Packaged food companies are also rated highly, with 83% reporting that packaged food companies generally do a good job of serving their consumers (third highest of 21 industries and an increase of five percentage points over the prior year),4 and 23% saying that packaged food companies are generally honest and trustworthy (ranked sixth of 15 industries). Only 24% would like to see more government regulation of packaged food companies, and 8% would like less government regulation.5 (Table 1)
Table 1: Do a Good Job of Serving Consumers1 In Percent
Supermarkets 92 Computer hardware companies 84 Packaged food companies 83 Computer software companies 81 Airlines 80 Hospitals 79 Online search engines 79 Banks 78 Electric and gas utilities 75 Internet service providers 72 Life insurance companies 70 Online retailers 70 Telephone companies 70 Car manufacturers 66 Investment and brokerage firms 65 Cable companies 63 Pharmaceutical and drug companies 56 Managed care companies, such as HMOs 41 Health insurance companies 40 Tobacco companies 35 Oil companies 31

6
In a 2004 review of industry attitudes conducted by the Gallup Organization, all actors in the food system placed in the top five of 25 industries tested. The restaurant industry received positive ratings from the greatest number of survey respondents (58% positive), followed by the grocery industry (52%), and farming and agriculture (50%).7 (Table 2)
Food and Health One of the most common associations with food is its connection to human health. In fact, the connection between food and disease prevention or health promotion is a consistent theme for the news media. According to the Center for Media and Public Affairs, which has conducted several years of analysis of food-related news coverage: “The most enduring aspect of coverage has been the attention to disease prevention or, more accurately, risk reduction or health promotion, as a goal of sound nutrition. In each Food for Thought study, disease prevention or risk reduction has placed among the top three topics.” 8 Compared to other personal considerations, physical health is a moderate-to-strong concern. Many people think about physical health fairly often, are not as satisfied with their health as other areas of their life, and believe they can do better. This suggests that people pay attention to and are interested in improving health. At the same time, health also competes for attention with other daily concerns, particularly work and finances. A significant percentage (44%) thinks “a great deal” about physical health, but only 35% are “very satisfied” with their health. On a scale of 1-10, survey respondents rate their health a moderately high 7.14 on average, but believe they can do better in the next five years (8.11 on a 1-10 scale). Most (54%) believe they are very likely to achieve this goal of improved health in five years. This pattern of response is similar to survey participants’ ratings on their career and financial situation. In each instance, it is an area about which many people think a great deal, are less satisfied than with other areas of life, and believe they can improve.
Table 2: Positive View6 % “Very” or “Somewhat Positive”
Computer industry 60 Restaurant industry 58 Retail industry 54 Grocery industry 52 Farming and agriculture 50 Travel industry 50 Real estate industry 47 Banking 46 Internet industry 45 Education 45 Automobile industry 44 Publishing industry 41 Sports industry 39 Telephone industry 38 Airline industry 38 Television and radio industry 37 Movie industry 37 Accounting 35 The federal government 34 Healthcare industry 33 Advertising and public relations industry
33
Electric and gas utilities 32 Pharmaceutical industry 31 The legal field 27 Oil and gas industry 21

7
In contrast, majorities are satisfied with their personal relationships (66% very satisfied, 8.28 average rating on a one to 10 scale), spiritual life (51% very satisfied, but only a 6.82 average rating on a one to 10 scale), and mental health (63% very satisfied, 8.37 average rating on a one to 10 scale). Fewer are satisfied with their leisure activities (37% very satisfied, 6.17 on a one to 10 scale), but it is also an area few spend a lot of time considering (27% a great deal). (Table 3)
Table 3: Ratings of Personal Concerns9 Thought a
Great Deal % Very
Satisfied % 1-10 Rating
Avg. Best in 5
Years Avg. Very Likely
Achieve Your personal relationships with family and friends
57 66 8.28 8.79 71
Your work or career 52 40 7.25 8.6 65 Your religious or spiritual life 47 51 6.82 8.15 61 Your personal financial situation 47 24 6.21 7.96 59 Your physical health 44 35 7.14 8.11 54 Your leisure activities 27 37 6.17 7.7 52 Your mental health 24 63 8.37 8.76 69 Most report that they are in good health and very high percentages of the public exercise each week. However, most say they do not exercise often enough. A majority (52%) describes their own health as “excellent” (18%) or “very good” (34%). An additional 29% describe their own health as “good”, while only 14% say “fair” and 4% “poor.”10 More than three-quarters (77%) report that they get physical exercise within the average week, but nearly as many (71%) say they should be getting more physical exercise.11 Americans know that a healthy diet consists of vegetables, fruits and chicken. However, food choices are not based on health considerations alone. Nearly half the public eats at fast food restaurants at least once per week, even though three-quarters believe fast food is not healthy. Survey respondents report that they actively try to include healthful foods in their diet, including vegetables, fruit, and chicken, among others. Majorities try to avoid fat, sugar and soda. (Table 4) Seventy percent (70%) of Americans eat at a restaurant at least once in the average week, and 45% eat at a fast food restaurant at least once in the average week.13 They frequent fast food restaurants even though they know that most of the food served is "not too good for you" or "not good at all for you" (53% and 23% respectively).14
Table 4: Food Choices12 % Actively Include in Diet % Actively Try to Avoid
Include Avoid Vegetables 90 2 Fruits 89 2 Chicken and other poultry 85 3 Fish and other seafood 71 11 Grains such as bread, cereal, pasta and rice
70 14
Dairy products 67 14 Beef and other red meat 59 20 Carbohydrates 33 27 Soda or pop 25 51 Salt 23 47 Sugar 21 51 Fat 14 64

8
In recent years, health-related food coverage has increasingly centered upon weight management as a health issue. However, some consumer research suggests that people do not necessarily see eating for weight loss as eating for health. Dieters are willing to employ unhealthy eating behaviors to lose weight. Media coverage of food increasingly revolves around obesity. According to the Center for Media and Public Affairs: "Concerns about weight management and obesity accounted for 15% of all the health discussions tracked in the Food for Thought V research in 2003. That is up from 5% in 2001 and shows how the topic has come to dominate food news."15 However, eating for health and eating for weight loss are not necessarily the same. A report on qualitative research for the International Food Information Council Foundation finds that, “Consumers talk about a distinction between eating for health and eating for weight loss. Most believe that restricting foods or food groups is not the answer for better health. This is noted among all audiences, including those who have tried, or continue to be on, restrictive diets. Interestingly, dieters claim they are willing to employ “unhealthy” eating behaviors for as long as it takes to put weight ‘balance’ back into their lives.” 16 Weight loss is a common objective. One in four is currently trying to lose weight and a majority would like to. A majority of the public has seriously tried to lose weight at some point, and a significant percentage feels they are currently overweight. Americans say they are willing to diet to live longer. While most Americans (54%) describe their weight as “about right,” fully 40% say that they are “very” or “somewhat overweight”. More than one in four (27%) reports that they are currently trying to lose weight and 58% say they would like to lose weight.17 A majority of Americans (56%) say that at some point in their life they have made a serious effort to lose weight, with 17% reporting that they have tried to lose weight six or more times. People undertake a variety of actions when they attempt to lose weight. While exercise tops the list (44%), dieting is broken into several distinct categories (counting calories, counting carbohydrates, etc.) that would pass exercise in frequency if combined. 19 (Table 5) Most say they are willing to change their eating habits to promote long life. Three quarters (73%) would "rather live longer, even if it means having to watch your diet,"
Table 5: Made a Serious Effort18 (Adds to more than 100% due to multiple responses)
Maintained an exercise routine 44 Weighed yourself frequently 38 Had strong peer or family support 36 Counted calories 24 Followed a diet where you counted carbs 19 Used nutritional supplements 18 Kept a food journal 14 Participated in a weight loss program you paid for 12 Participated in a program where you purchased their food 4 Used a personal nutritionist 4 Used a personal trainer 3

9
while 23% would rather "eat what you feel like, even if it means you would not live as long as you might otherwise." 20 The connection between child health and food has also gotten significant attention in recent years. Most parents see nutrition and physical fitness as essential. They believe child obesity is a serious problem, even though very few have had a health professional voice concerns about their own child's weight. Most believe their child gets enough physical activity, but fewer are confident that their child has a very nutritious diet. When people consider all the things that children need to be taught, a majority states that nutrition and physical fitness is absolutely essential (68% and 51% respectively). This is an impressive rating, but it ranks lower than other areas, such as honesty, discipline, independence, and money management. (Table 6) News coverage of child obesity has gotten public attention. Fully 87% believe that children and teenagers are more overweight today than when they were young, and 68% believe that child obesity is a “major health problem.”22 Nearly all Americans (93%) say overweight children and teens is a serious problem (61% very serious), even though only 19% of parents are very concerned about their own child’s weight, and just 9% of parents say that a health professional has stated that their child is overweight.23 One in ten (10%) parents states that their child is underweight. 24 Most children participate in physical education at school and a majority is regularly involved in after-school sports. Fully 83% of parents report that their school-age child has a physical education class at school and 58% say their child participates regularly in after-school sports activities. While most parents are satisfied with their child's level of activity, a significant percentage believes their child needs more physical activity. A slight majority (57%) of parents with schoolchildren believe their child gets as much physical exercise as he or she should, while 42% believe their child should be getting more exercise. 25 While most parents believe their child is getting enough physical activity, fewer are confident that their child has a nutritious diet. Only 26% of mothers describe their child’s overall diet as “very balanced and nutritious,” while an additional 68% say it is “somewhat balanced and nutritious.”26 Another survey found that, while 61% say their child’s diet is healthy, only 18% described it as “very healthy.” 27 Finally, a majority (51%) reports that "my children eat some nutritious, healthy foods, but not nearly enough," while nearly as many (47%) say "my children eat mostly nutritious, healthy foods." 28
Table 6: Important to Teach Children % Absolutely Essential21
To be honest and truthful 91 To be courteous and polite 84 To have self-control and self-discipline 83 To always do their very best in school 82 To be independent and to do for themselves 74 To save money and spend it carefully 70 To have good nutrition and eating habits 68 To help those who are less fortunate 62 To have strong religious faith 61 To exercise and to be physically fit 51 To enjoy art and literature 33

10
The public is convinced that obesity is a serious public health issue. However, the obesity frame is not conducive to building support for public policies, because people view food as a matter of consumer choice. Individuals are responsible for their diet, not the food system. People believe that obesity is a serious problem. Fully 93% say obesity among adults is a serious health problem (58% very serious) and just as many (93%) say overweight children and teens is a serious problem (61% very serious). 29 However, it is very difficult to build support for public policies when the frame is obesity because the public sees obesity as caused by individual habits. In rating a series of causes of obesity, lack of exercise and poor eating habits top the list (86% and 85% respectively). A majority points to just one systemic problem, which undoubtedly rates highly because adults are reluctant to hold children responsible. Two thirds (65%) believe marketing sweets to children is an important cause of obesity. (Table 7) Food is a matter of consumer choice, according to survey participants. Presented with two statements, only 29% say snack food “is junk food, is costing Americans billions of dollars in healthcare costs due to child obesity, diabetes, heart disease, and high blood pressure, and should be discouraged by the government through labeling laws, warnings and taxes,” while 67% “say that snack food is a matter of consumer choice and that a small group of Americans should not impose their eating habits on the rest of the country.”32 Furthermore, fully 83% say that obese individuals are responsible (51% very responsible), while far fewer hold food manufacturers responsible, even when given a reason – “because of the serving size and fat and sugar content of their products” (52% responsible, 14% very responsible). When forced to choose whether food manufacturers or consumers are responsible, the public overwhelming sides with consumer choice. Only 14% think “food manufacturers should be required by law to reduce serving sizes and fat and sugar content to make their products healthier,” while 83% say “it is up to individual consumers to choose healthy food products.” 33 Finally, in rating a variety of actors, a majority of the public finds just one as having a great deal of responsibility for the obesity problem -- individual Americans’ choices (67%). Importantly, the fewest find government policies responsible (20% a great deal of responsibility). This suggests that, at least as far as obesity is concerned, it is difficult to make a case for government policy
Table 7: Causes of Obesity30 % Most or Very Important
Not getting enough physical exercise 86 Poor eating habits 85 The marketing of sweets and other high-calorie foods to children
65
Watching too much television 59 Genetics, or a family history 50 Lack of information on good eating habits 45 The cost of buying healthy food 45 Restaurant portions that are too large 44 Lack of information about food content 37
Table 8: Responsibility for Obesity Problem31 % Great Deal
Individual Americans in their choice of diet and lack of exercise 67 Fast-food restaurants 43 Schools that allow high-calorie snacks and sweets 40 Manufacturers of high-calorie packaged and processed foods 36 Marketers and advertisers of high-calorie and processed foods 35 Government policies and laws on food content and marketing 20

11
addressing the food system. However, 43% and 40%, respectively, attribute responsibility to fast food restaurants and schools that allow high calorie snacks, suggesting some possible openings for a systemic conversation. (Table 8) People demonstrate support for two categories of policies: policies to provide more information to individuals and policies directed at child health. Because they see addressing obesity as the responsibility of individuals, the public is most enthusiastic about policies that allow individuals to make better choices. They support warning labels on food, nutritional content at restaurants, and public service advertising campaigns on nutrition and exercise. In addition, the public is willing to act to protect children by regulating advertising directed at children. Fewer support taxes on junk food or limiting portion sizes in restaurants. (Table 9 and Table 10)
Table 9: Support for Government Policies34 %
Support %
Strongly Support
Warning labels on high-fat and high-sugar foods about the health risks of being overweight
75 49
A law requiring restaurants to list the calorie count and fat content of all items on their menus
61 38
A ban on advertising high-fat and high-sugar food on children’s television shows and in children’s magazines
56 36
A tax on high-fat and high-sugar foods, with the money used for advertising and programs to fight obesity
41 21
A law setting a legal limit on portion sizes in restaurants 23 11
Table 10: Support for Government Policies35 %
Support %
Strongly Support
Government-funded advertising campaigns that promote eating right and exercising
74 44
Making a law requiring fast food restaurants to list nutrition information – such as calorie count – for all items on their menus
70 44
Warning labels on packaged food about the health risks of being overweight, just like there are warning labels on cigarettes about the health risks of smoking
67 40
The federal government regulating television ads for junk food and fast food that are aimed at children and teens the way they do for cigarettes and alcohol
53 29
Putting a special tax on junk food – that is, things like soda, chips, and candy – and using the money for programs to fight obesity
40 18
One policy that most Americans stand behind is protecting individuals from losing health insurance. Fully 92% say that “health insurance companies should not be permitted to drop people from coverage because they’re overweight” and 72% say “health insurance companies should not be permitted to charge higher premiums for people who are overweight.” 36

12
Importantly, support for policies to protect child health can be easily undermined by triggering other powerful frames, such as freedom of speech and parental responsibility. While majorities support regulating junk food ads when they are thinking in the context of health, support for this measure drops when placed in a different context. In a survey about communications policy, a majority of the public stated opposition for restricting ads for junk food on children’s television. After hearing that "some people say it is time to restrict ads for junk food on children's television shows; others oppose such restrictions, saying companies should be free to advertise whatever they want,” 56% oppose and 37% favor restricting ads for junk food on children's television shows. 37 In addition, the public overwhelmingly opposes allowing parents to sue for their child’s obesity. Only 6% think “parents should be able to sue major soft-drink and snack food companies if they believe their child became obese from eating junk food and drinking soft drinks,” while 84% think “the government should pass laws to prevent these kinds of lawsuits.” 38 While the public says schools should teach children about nutrition, most would not sacrifice other educational priorities to put more emphasis on nutrition or physical education. The public does not believe that schools should be responsible for monitoring children’s weight, but does believe that schools have a responsibility to teach children about healthy foods. Nearly eight in ten (79%) believe that it is “not a school’s responsibility to monitor children and teens’ weight,” but three-quarters (74%) say that it is “a school’s responsibility to teach children and teens about healthy foods to eat.” 39 However, even in the context of a survey about health, most Americans would not place more emphasis on physical education and nutrition in the schools if it meant sacrificing other priorities. Only 29% would "increase the number of physical education classes even if it means cutting back on electives such as foreign languages and social studies," while a majority (57%) would keep things as they are now, and 5% would cut back on physical education to expand electives. Only 31% would "increase the number of nutrition and food science classes even if it means cutting back on electives such as foreign languages and social studies,” while a majority (55%) would keep things as they are now and 4% would cut back on nutrition classes. 40 Most believe that the food provided by schools is healthy, so there is little public support for reforming school nutrition. A slight majority opposes soda machines in schools until they learn the financial reason for installing machines, which causes many more to oppose their use. When only considering child health and obesity, members of the public divide concerning whether or not soda and vending machines should be allowed in schools. A slight majority (55%) says that soda machines should not be allowed in schools, while

13
41% would allow them. Concerning vending machines, just as many would allow them as would not (48% each).41 However, when the financial reasons for the use of vending machines in schools become apparent, the public strongly opposes allowing these machines in schools: 69% say that schools “should not be allowed to raise money for their budgets by allowing soda and candy vending machines in school,” while 30% say they should be allowed to do this.42 The lack of concern about vending machines may be due to parents’ belief that schools provide healthy food. Most parents believe that the lunch provided by their child's school is healthy (67% healthy, 13% very healthy), while only 18% think it is unhealthy (6% very unhealthy). A majority (58%) thinks there is no difference in their child's diet during the calendar year, while 25% believe their child has a healthier diet during the summer and 15% say it is healthier during the school year. 43 Since there is little concern about the nutrition in school food, the public shows little enthusiasm for efforts to correct lunch programs. By a narrow 49% to 47% margin, people say they are willing to pay higher federal taxes to cover the cost of more nutritious school lunch programs in the public schools.44
Food Processing: Dangers, Benefits, and Innovations Many Americans are aware of dangers in the nation’s food system, such as mad cow disease, pesticides, antibiotic overuse, and so on, but few see these as serious concerns and few are taking any action to address these threats. They strongly support labeling to provide consumers with information about product qualities. Many are aware of mad cow disease, but few are concerned. Roughly two-thirds of the public (67%) have been following news reports about mad cow disease either very closely (22%) or somewhat closely (45%). While they are aware of mad cow disease, few believe it likely that they or someone in their family will become infected (9% likely, 4% very likely)45 and most believe it is not a significant problem: 6% say it is a crisis, 28% a major problem, 53% a minor problem, and 12% not a problem.46 Furthermore, fewer than one in five has taken any action to avoid getting mad cow disease, including: stopped ordering beef at fast food restaurants (16% have taken this action), stopped ordering beef at other restaurants besides fast food restaurants (13%), stopped eating hamburger or ground beef (13%), stopped buying beef at the grocery store (14%), stopped eating beef completely (7%), or started buying and eating only organic or grass fed beef (4%).47 Even though they think it is not a significant problem and few have taken action to avoid getting mad cow disease, few have a lot of confidence in the protective ability of the nation’s meat inspection system. Only 19% have a great deal of confidence in the US meat inspection system to protect Americans from mad cow disease, while an additional

14
37% have “a good amount” of confidence, and 41% have “only some” or “very little” confidence.48 Only about one in four knows of the debate concerning antibiotic overuse. Many say they are willing to spend more to avoid food produced with antibiotics, pesticides, and hormones. Only 45% of Americans are aware that fresh meat and poultry can be raised with antibiotics in animal feed and only 28% have heard about the debate concerning the overuse of antibiotics in animals raised for food. However, once they hear of the consequences of antibiotic use, a majority (57%) wants to avoid these products. 49 While few see pesticides, hormones and antibiotics as a high risk, many are willing to pay more to avoid these chemicals. One-quarter (28%) note that food produced with pesticides, hormones, or antibiotics, pose a "high risk" to human health, 42% say "moderate risk” and only 20% say "minor risk." At the same time, two-thirds report that they are willing to spend more for food produced without the use of pesticides, hormones, and antibiotics, and nearly half are willing to pay 10% or more in higher food prices. One in five (19%) is willing to pay 5% more, one-third (33%) are willing to pay 10% more, and 15% of survey respondents are willing to spend 20% more for food produced without pesticides, hormones, and antibiotics.50 Finally, the public is less likely to buy food with a label saying it is from animals fed with antibiotics or hormones (47% less, 4% more, and 45% no difference), and slightly more likely to buy food with a label saying it is from animals that have not been fed antibiotics or hormones (46% more likely, 7% less, and 43% no difference). About one-third (32%) currently try to avoid food from farm animals that have been fed antibiotics or hormones, while 60% say it is not that important to them.52 No matter their level of concern about a specific product danger, high percentages of survey respondents support more food information. They believe that labels should identify chemical use, organic properties, country of origin, and so on. (Table 11) Organic products have a very positive image. A majority has tried organic products, particularly produce, and many see a variety of benefits to these products, including health, environment, and support for small farmers. Loyal use continues to be rare, however. The only downside of organics is cost, according to survey respondents. A majority (54%) has tried organic foods and beverages, but just one in 10 uses organic products regularly.53 Few organic produce purchasers are loyal to organic produce. Among those who have purchased organic fresh produce, just 2% only buy organic fresh produce and an additional 5% buy it if it is available. One-quarter (26%) prefer it but
Table 11: Fresh Produce Items Should be Labeled to Identify:51
(In Percent) Chemicals used in 90.7 Organically grown 86.0 Country of origin 85.9 Use of waxes 84.5 Use of biotechnology 78.4 Irradiated 77.8 Nutritional value 77.1

15
also consider other factors, while 35% sometimes purchase it but don’t necessarily prefer it. Finally, 24% of those who have purchased organic produce don’t usually purchase organic. 54 Those who have purchased organic mostly choose fruits and vegetables (68%), followed by bread or baked goods (26%), non-dairy beverages (26%), eggs (26%), dairy products (24%), packaged goods, such as soup or pasta (19%), meat (22%), frozen foods (18%), prepared foods or ready-to-go meals (14%) and baby food (7%). The most frequent complaint about organic products is that they are too expensive (73%).55 The public sees a variety of benefits in organic products: organic foods are better for the environment (58%), support small and local farmers (57%), are better for health (54%), are better quality (42%) and taste better (32%).56 In addition, a certain set of considerations come to mind when people think about an appropriate definition for "natural meat," including: no antibiotics in the feed (79%), no growth hormones (79%), no animal byproducts in the feed (68%), humane treatment of animals (48%), and humane slaughtering methods (44%).57 When forced to choose between health and environment, most say health concerns are the driving reason to purchase organics. Two-thirds (66%) of those who purchase organics do so out of concern for their health, while 26% do so for environmental reasons.58 According to research by the National Marketing Institute, the U.S. population can be divided into five segments based on attitudes toward organic and natural foods and nutritional supplements. One-quarter (23%) of the population consistently uses organic food and an additional 26% include organic food in their diet. As noted in an article in the Santa Cruz Sentinel, the National Marketing Institute has developed the following five segments of organic consumers:
“WELL BEINGS, 23 PERCENT: Consistently use organic and natural food, vitamin/mineral, herbal and homeopathic formulas to support, treat, and enhance personal and planetary health. Strong preference for environmental [sic] friendly products, such as toxic-free household cleaners, energy efficient appliances, and recyclable materials. FOOD ACTIVES, 26 PERCENT: Attain health primarily through food, including both natural and organic food and beverages, along with fortified packaged goods. Believe supplements support health but are overwhelmed by choices. Prefer alternative healthcare to traditional medicine. MAGIC BULLETS, 12 PERCENT: Focus on vitamins, minerals, herbs and ‘miracle foods’ to support health, less concerned with nutritional value of food. Preoccupied with weight loss and discounts. Preference for self-treating, using over-the-counter remedies. FENCE SITTERS, 18 PERCENT: Neutral about the nutritional content of the food they eat. Little faith in the value of supplements. Price-sensitive when grocery shopping; splurge when they eat out. Seek RX prescriptions to fix health problems.

16
EAT, DRINK AND BE MERRYS, 21 PERCENT: Choose taste over nutritional or health value. Know they should eat healthier and take supplements but don¹t. Highly price sensitive. Preference for over-the-counter remedies followed by RX prescriptions to treat health conditions.”59
As noted earlier, news coverage has emphasized risk reduction or health promotion as a goal of sound nutrition. Research indicates that, while the public is aware of some functional benefits of food and actively includes certain foods for a specific function, most have, at best, just a shallow understanding of many nutrients. The terms “functional foods” and “nutraceuticals” are sometimes used to describe foods that have a particular health function or a perceived pharmaceutical benefit based on the nutritional properties of certain foods, such as the functional benefit of oatmeal in reducing cholesterol. Consumers prefer the term "functional foods” (62%) over “nutraceuticals” (31%), but Cogent Research makes the point that neither term improves understanding since all foods have some function.60 Many act to improve their health by incorporating certain foods into their diet. A strong majority (62%) says they are consuming 1-3 specific foods for functional health benefits, which is 10 percentage points higher than reported in 1998.61 There is some indication that the level of public awareness of specific food-health relationships is determined by the length of time the public has been hearing about a particular association. According to Cogent Research, one of the more recent associations, between soy protein and heart disease, has a lower level of awareness (23%), than the association between antioxidants and cancer (34%), and the most people are familiar with the relationship between calcium and osteoporosis (64% “have heard a lot”).62 However, some researchers caution that public awareness does not necessarily indicate public understanding. In an analysis of qualitative research, Strategy One writes, “Although respondents could list many nutrients by name, this does not mean they understand what they are or why they should be consumed.”63 Strategy One lists several quotes that demonstrate this consumer confusion:
Lycopene. I don’t know what it is, but I think I’m supposed to have more of it. I don’t know what Omega-3s are, but I know they are good for you. There are too many fats. We don’t know them. It’s too confusing. I feel like I’ll die from ignorance. What’s good and what’s bad for you keeps changing.
Few have heard much about genetically modified food, and awareness has declined in recent years. Few Americans report that they have heard very much about genetically modified foods. Whether phrased as "the use of biotechnology in the production of food" or "genetically

17
modified food" only about one-third of Americans have heard "a great deal" or "some" about those topics (35% biotechnology, 32% genetically modified food).64 There is some indication that awareness of this topic has declined slightly in recent years. According to a trend question by the International Food Information Council, the percentage of Americans that have heard or read about biotechnology has dropped from a high of 47% in January 2001 (15% heard or read "a lot," 32% "some"), to 36% by March 2005 (12% "a lot," 23% "some").65 Public opinion about genetically modified food is largely unformed and malleable. Generally, the public is cautious and uncomfortable with genetically modified food. When given the chance, significant percentages express no opinion about this topic, and opinion moves back and forth between support and opposition, depending upon language choices. Impressions of biotechnology and genetically modified foods lean negative, with more having an unfavorable than favorable view of biotechnology (30% unfavorable, 25% favorable) and genetically modified foods (44% unfavorable, 21% favorable). This compares with strongly positive views of organic foods (64% favorable, 15% unfavorable). (Table 12) Furthermore, the public moderately opposes the introduction of genetically modified foods. A plurality (43%) say the “risks outweigh the benefits” of genetically modified foods, while 38% say the benefits outweigh the risks, and 19% are unsure.67 In addition, 47% "oppose the introduction of genetically modified foods into the US food supply," while 27% support it and 26% have no opinion. While close to half the public opposes the introduction of genetically modified foods, this represents an 11 percentage point decline (from 58% opposition) in 2001.68 The public is unfamiliar with the extent to which genetically modified foods exist in supermarkets, and knowledge has not increased since 2001. Most believe they have not eaten genetically modified goods, but an increasing percentage report that they have. Finally, while a majority is unlikely to eat genetically modified foods, willingness to eat genetically modified foods has increased slightly since 2001. The public does not know whether or not foods produced by biotechnology are currently available in the supermarket. One third believes they are available (34%), one-third thinks they are not (37%) and one-third is unsure (30%). This response has been fairly consistent since 2001. 69 People are increasingly likely to report that they have eaten genetically modified foods, even though a majority continues to believe they have not. A slight majority (54%)
Table 12: Impression of: 66 (In Percent)
Favorable Unfavorable Organic foods 64 15 Biotechnology used in food production
25 30
Genetically modified foods 21 44 Irradiated foods 17 25

18
thinks they have not eaten genetically modified foods, while 30% reports that they have. This represents a change from 2001, when 62% said they had not eaten genetically modified foods and 19% said they had.70 Roughly four in ten say they are likely to eat genetically modified foods (42% likely, 13% "very likely"), while a slim majority says they are unlikely (52% unlikely, 30% "not at all likely"). The percentage reporting they are likely to eat genetically modified foods has increased from 38% in 2001. 71 The public is unsure about the safety of genetically modified foods, but when people hear how common genetically modified foods are, many quickly shift to assuming these products must be safe. Initially, 30% believe genetically modified foods are safe, 27% believe they are unsafe, and 42% have no opinion. Once they hear that "more than half of products at the grocery store are produced using some form of biotechnology or genetic modification," opinion shifts toward believing these products are safe (48% safe, 25% unsafe, and 27% no opinion). This response has been fairly constant since 2001. 72 Very few people admit to knowing much of anything concerning government regulation of genetically modified foods. They tend to believe that there is too little regulation, but many have no opinion on this. However, when asked to evaluate a series of goals for regulating these products, the public overwhelmingly supports a cautious approach, emphasizing consumer awareness and safety. The labeling that the public supports is likely to lead to reduced consumer acceptance, as most say that they would be less likely to buy products labeled as genetically modified. Very small percentages of the public say they know something about government regulation of genetically modified food. Only 12% say they know something (1% "a great deal," 11% "some") while 28% say they know "not too much," and a majority (55%) know "nothing at all." Among the 40% who say they have at least some minimal knowledge of government regulation of genetically modified food, 40% believe there is too little government regulation, 8% believe there is too much, 19% say it is about right, and 33% have no opinion. The percentage believing there is too little government regulation increased 5 percentage points from 2003 to 2004.73

19
In evaluating a series of goals for the regulation of genetically modified foods, survey respondents clearly indicate that they want to be cautious and prioritize consumer awareness and safety. Very high percentages strongly favor labeling products and removing from the market products deemed to be unsafe. Fully 71% strongly favor ensuring that these foods are safe before they are allowed to come to market, and 65% strongly favor requiring FDA approval even if it means substantial delay. Only 17% strongly favor streamlining to allow genetically modified food to come to market faster. At the same time, only 19% strongly favor prohibiting genetically modified food from being sold in the US.75 (Table 13) Labeling is likely to influence consumer behavior, as people say they are less likely to buy foods with a label saying it had been genetically modified (55% less likely, 6% more, 37% no difference), and more likely to buy food with a label saying it had not been genetically modified (51% more likely, 9% less, 39% no difference). At the same time, only 34% say they try to avoid genetically modified food now, and 61% say it is not that important to them.76 While the public wants a cautious approach to genetically modified foods, it is not opposed to them. In fact, when some of the benefits of genetic modification are explained to survey participants, they can see a variety of good reasons for genetic modification. Americans are open to the idea of genetically modified food. Half (50%) say they are likely (50% likely, 15% very likely) to buy “produce, like tomatoes or potatoes, if it had been modified by biotechnology to taste better or fresher,” while 45% are not likely to buy such produce (25% not at all likely). Response to this question has been fairly consistent; however, purchase resistance is increasing. Likeliness to purchase is at its lowest point since the question was first asked in 1997 (response is usually in the mid-50s, though it has been as high as 62%), and unwillingness to purchase is at its highest point (with 37% the lowest measure in 1999 and 2003).77 Higher percentages are willing to buy produce that has been modified, so as to not need pesticide. Nearly two-thirds say they are likely (64% likely, 28% very likely) to buy
Table 13: Goals for Regulating Genetically Modified Foods % Strongly Favor74
Labeling all food that is genetically modified 80 Labeling all processed food that contains genetically modified ingredients
78
Removing any genetically modified food deemed to be unsafe after it has come to market
75
Genetically modified foods should be subject to the same rules as new conventional foods
71
Ensuring that all genetically modified foods are safe before they come to market
71
Balancing the interests of consumers and food producers to provide the best and safest food
69
Requiring the FDA to approve any genetically modified food as safe before it goes to market, even if it causes substantial delays
65
Genetically modified foods should be regulated more stringently than new conventional foods
54
Prohibiting any genetically modified food from being sold in the United States, even if the FDA believes it is safe
19
Streamlining the process so that new advances in genetically modified food are brought to market as soon as possible
17

20
“produce, like tomatoes or potatoes, if it had been modified by biotechnology to be protected from insect damage and required fewer pesticide applications,” while 32% are not likely to buy such produce (19% not at all likely). Again, likeliness to purchase such a product is at its lowest point and unwillingness to purchase is at its highest point since February 1999 when survey respondents indicated they would be likely to purchase this type of product by a 77% to 21% margin. 78 When exposed to a variety of reasons for genetic modification, the public sees good reasons to support modification, especially for human health, world hunger, and science. (Table 14)
Table 14: Reasons to Genetically Modify Plants or Animals
Percent Good or Bad Reason79 Very
Good Somewhat
Good Somewhat
Bad Very Bad
To produce more affordable pharmaceutical drugs by using plants to produce pharmaceutical compounds
54 23 6 8
To produce less expensive food to reduce hunger around the world
52 24 8 12
To expand our understanding of science and nature 46 30 8 10 To reduce the need to use pesticides on crops 43 30 10 12 To create peanuts that won’t cause allergic reactions 42 29 11 15 To develop vegetable oil with heart healthy fats 41 29 8 18 To produce less expensive food 40 26 12 19 To create new types of grass that don’t need to be mowed as often
39 22 11 22
To provide organs for transplant to humans 36 20 9 24 To develop better tasting fruits and vegetables 33 25 14 24 To produce more affordable industrial compounds in plants, including the material used to make plastic
32 32 11 17
To increase the variety of available foods 32 29 14 19 To create fruits and vegetables that last longer on the store shelves
27 23 14 30
To produce beef with less fat 27 23 13 32 To produce more affordable pharmaceutical drugs by using animals to produce pharmaceutical compounds
23 22 17 29
To reduce the cost of fish, like salmon 21 25 19 27 To make it possible to transplant animal organs to humans
19 22 14 38
Discomfort with genetic modification is particularly pronounced when survey respondents consider modifying animals. As indicated in Table 14, each time animals were included in the reason for genetic modification, public support dropped. For example, 77% say a good reason for genetic modification is "to produce more affordable pharmaceutical drugs by using plants to produce pharmaceutical compounds" (77% good reason, 54% very good reason). Support drops dramatically when people consider the reason "to produce more affordable pharmaceutical drugs by using animals to produce pharmaceutical compounds" (45% good reason, 23% very good reason). Similarly, the public gives higher ratings for

21
providing "organs for transplant to humans" (56% good reason, 36% very good reason) than for transplanting "animal organs to humans" (41% good reason, 19% very good reason). In fact, the four reasons with the highest opposition are the only four reasons that mention something specific about animals. 80 In addition, when rating their comfort level with genetic modification, people are least comfortable with any kind of animal use. On average, survey respondents are neutral about genetic modification of plants (5.94 average on a 10 point comfort scale), and they become increasingly uncomfortable as they consider other life forms: microbes, such as bacteria or algae (4.14), animals used for food sources, including cattle, fish and shrimp (3.73), insects (3.56), animals used for other purposes, including cats, dogs and race horses (2.29), and humans (1.35). 81 However, there is some indication that the public reacts differently to animal biotechnology done for different purposes. A majority has a favorable view of genetics to improve animal care and nutrition (53% favorable, 17% very favorable), but tends to have an unfavorable view of genetic engineering that adjusts animal traits (47% unfavorable, 30% not at all favorable). The public clearly has an unfavorable view of cloning animals (depending on question wording, 64% unfavorable, 51% not at all favorable; or, 74% unfavorable, 58% not at all favorable).82 (Table 15)
Table 15: Overall Impression of Three Areas of Animal Biotechnology83 In Percent
Favorable Unfavorable Genomics is a form of animal biotechnology that uses knowledge about genetics to improve overall animal care and nutrition.
53 27
Genetic engineering is a form of animal biotechnology that allows us to move beneficial traits from one animal to another in a precise way.
39 47
SPLIT SAMPLE Cloning is a form of animal biotechnology that retains desirable traits by producing animals that are biologically identical to the parent.
15 74
SPLIT SAMPLE Cloning is a form of animal biotechnology that retains desirable traits by producing animals that are identical to the parent.
24 64
Even the public’s strong opposition to genetic modification of animals may be open to influence, though attitudes toward cloning are more solidly negative. The public may be open to influence on genetic modification of animals as well. When given different scenarios, people say that some scenarios would have a positive effect on their impression: “animal biotechnology can improve the quality and safety of food, for example, through improved animal health or improved nutritional quality of the food produced” (60% positive effect), and “animal biotechnology can reduce the environmental impact of animal waste” (52% positive effect). Far fewer find compelling the idea that “animal biotechnology can increase farm efficiency by increasing the amount of food produced or decreasing the amount of feed needed by the animals” (37% positive effect). 84

22
Opinion of genetic engineering appears to be more open to influence than opinion of cloning. A majority (53%) says they would be likely to buy meat, milk and eggs from animals enhanced through genetic engineering if the FDA determined it was safe (21% very likely), but 63% would be unlikely to buy products from cloned animals even if the FDA said they were safe (43% “not at all likely”). 85 Since public opinion on genetic modification continues to be largely unformed, there is an opportunity to shape how the public understands this issue. Trusted spokespeople will be central to effective communications, and most say that farmers, the FDA, friends/family and scientists will matter most. Most members of the public say that their view of genetic modification is determined by their understanding of the impact genetic modification will have on their family (71%) and the trust they have in communications messengers (66%). Religious beliefs are the least important consideration (37%). (Table 16) Of a series of spokespeople, the most trusted on this topic are farmers (81% trust, 38% trust a great deal), the FDA (83%, 37%), friends and family (81%, 36%), and scientists and academics (81%, 31%). The news media (41%, 8%), biotechnology companies (51%, 12%), and food manufacturers (54%, 12%) are the least trusted. (Table 17)
Table 16: Importance in View of Genetic Modification86
% Very Important The impact it might have on you and your family
71
The trust you have in the people providing information
66
Your ethical beliefs 49 The science involved 40 Your religious beliefs 37
Table 17: Trust About Genetically Modified Foods87
In Percent Great
Deal Trust
Farmers 38 81 The Food and Drug Administration, or FDA
37 83
Friends and family 36 81 Scientists and academics 31 81 Environmental groups 21 67 Consumer groups 17 68 Government regulators 17 63 Religious leaders 16 50 Food manufacturers 12 54 Biotechnology companies 12 51 The news media 8 41

23
Farming National issue priority lists rarely include detailed listings of farm concerns. In one such list from June 2001, just as many registered voters rated farm issues as a concern as worker lay-offs, and more rated farm issues as a concern than did worries about nuclear attack. In the post-911 world, these ratings would undoubtedly be much different. However, this list serves as an indication that people have concerns about a variety of farm issues, when they are given the chance to express them. All of the tested farm concerns were rated at similar levels by the public. (Table 18)
Table 18: Issue Concern88 June 2001
Very Concerned
Somewhat Concerned
Public schools may not be educating children in your community adequately 60 24 Gasoline prices being too high for your family's budget 57 26 Too much farmland in your state may be converted to houses, stores, and other nonagricultural developments
40 29
Meat or poultry sold in your community's stores might be unsafe to eat 39 28 Agricultural pesticides or livestock manure may contaminate drinking water in your community
38 25
Members of your family or friends being laid off from work 38 20 Unhealthy levels of residues from agricultural pesticides may remain on fruit or vegetables sold in your community's grocery stores
37 33
Eating genetically modified food sold at stores may harm members of your family
37 27
Nuclear missiles may attack United States cities 24 21 Americans value farms and are concerned that the number of farms in the United States is in decline. They hold far more favorable impressions of small scale family farms than large industrial farms and believe small family farms are better than large farms at producing safe, nutritious food and protecting the environment. Survey respondents are concerned about the decline in the number of US farms (82% concerned, 46% very concerned) when they hear that "the number of U.S. farms have dropped from seven million in the 1930s to about two million today, and 330 farmers leave the land every week."89 It may be relatively easy to make the case that government policy is doing little to address family farm loss, since Americans believe that the US government farm policy currently favors large farming businesses (80%), not small farmers (6%).90 The public holds far more favorable perceptions of small family farms than large industrial farms. When asked to consider the production of safe, nutritious food, a higher percentage of the public trusts smaller-scale family farming practices (85% trust, 45% “place a lot of trust” in this type of farm) than trusts large-scale industrial farming practices (69% trust, 24% place “a lot of trust” in this type of farm). Forced to choose between the two, 71% think smaller-scale family farms care more about the safety of

24
food than large-scale industrial farms (15%). Similarly, more than two-thirds (69%) believe that smaller-scale family farms are more likely to use techniques that will not harm the environment, while 22% choose large-scale industrial farms.91 Americans strongly and consistently voice support for a strong agriculture system in the United States. They do not want to rely on food from other countries, even if it would be less expensive. Even before the terrorist attacks on the United States, fully 81% stated that it is important that the food they eat “comes from farms and ranches in the United States rather than from foreign countries” (81% important, 52% very important).92 Three-quarters (74%) disagree with the statement, "if the US could buy all its food from other countries cheaper than it can be produced and sold here, we should."93 In fact, more than two-thirds (68%) would pay more for food grown in the U.S. rather than abroad and 71% agree with the statement "I would be willing to pay more for food that is grown locally, near where I live, rather than far away."94 One reason they support agriculture in the United States is that most believe that food grown in the U.S. is fresher and safer (80% and 79% respectively) than imported food, and half (51%) perceive that food grown in the U.S. actually costs less. 95 Furthermore, the public prioritizes locally grown food. They believe locally grown food is fresher and that, by purchasing it, they are supporting their community and local farmers. Three-quarters say that it is important (73% important, 38% very important) to know whether their food is produced or grown locally or regionally,96 and half (52%) say it is important that the food they eat "comes from farms and ranches in your own state rather than outside your state" (52% important, 23% very important).97 In a survey of four regions with buy local campaigns, more than half (58%) of people in the regions said it was very or somewhat important to them that food come from farms and ranches in their area. The researchers noted that those who considered it important to buy local prioritized certain criteria at higher levels than those who did not think it was important to buy local. As noted in the table below, those who consider it important to buy local place more importance on nutrition, chemicals, and organic properties.98 (Table 19)
Table 19: Reasons to Buy Locally Produced Food99 % Very Important
Consider Buying Local Important Not Important Freshness 89 84 Nutritious or healthy 73 58 Chemicals/pesticides 64 46 Cost 62 55 Convenience 40 40

25
Organic 27 11 Most indicate that they have acted to buy locally produced food. More than two-thirds (70%) have purchased something directly from a farmer in the prior year. A majority (54%) report that they have purchased from a farmers’ market and 40% have bought from a farm stand.100 In response to an open-ended question about the benefits of locally grown food, survey respondents in regions with buy local campaigns report that they buy locally produced food because it is fresher (44%), to support their community and local farmers (40%) and because it tastes better (12%). Most often, people report that they prefer to buy locally grown vegetables (70%) and fruit (59%), while fewer prefer locally grown meat (18%), dairy (13%), and poultry (10%). Only 13% say that it is not important to buy local.101 The challenge for buy local efforts is to offer people easy opportunities to purchase locally grown food on a regular basis. The public needs little convincing that locally grown food has benefits, however, exposing the public to locally grown food may be a challenge. Most weekly shopping occurs in locations that are unlikely to have a large amount of locally grown food, such as large grocery stores (73% shop on a weekly basis), small independent stores (37%), convenience stores (36%), and warehouse stores (9%). Fewer frequently shop at locations that specialize in locally grown foods: farmers’ markets (11%), roadside stands (5%), and community supported farms (4%).102 Furthermore, even if a grocery store carries locally grown food, noticeable signage would be needed to draw shoppers’ attention, because few frequently look at labels to determine place of origin (39% frequently, 21% sometimes).103 Americans support farm subsidies by wide margins. They are particularly likely to support subsidies for small farms, for those farms that have been damaged by weather, and for farmers who are willing to incorporate environmental practices. There is near universal support for providing federal payments to help farmers stay in business when drought or floods damage farmer's crops (88% approve) and three-quarters approve of providing federal payments to help farmers stay in business when they face low market prices for their farm products (77%).104 Members of the public divide in their understanding of the existing subsidy process. Half of Americans (50%) believe that farmers receive subsidies on a regular annual basis, while nearly as many (46%) believe they only receive subsidies in bad years.105 When they take farm size into account, survey respondents support subsidies to small scale farms and oppose subsidies to large-scale farms. By a 77% to 19% margin, Americans favor providing subsidies to farms of less than 500 acres. Forced to choose between conditions, 44% favor giving subsidies to small farmers only in bad years while 34% favor giving subsidies on a regular, annual basis. The public is less enthusiastic

26
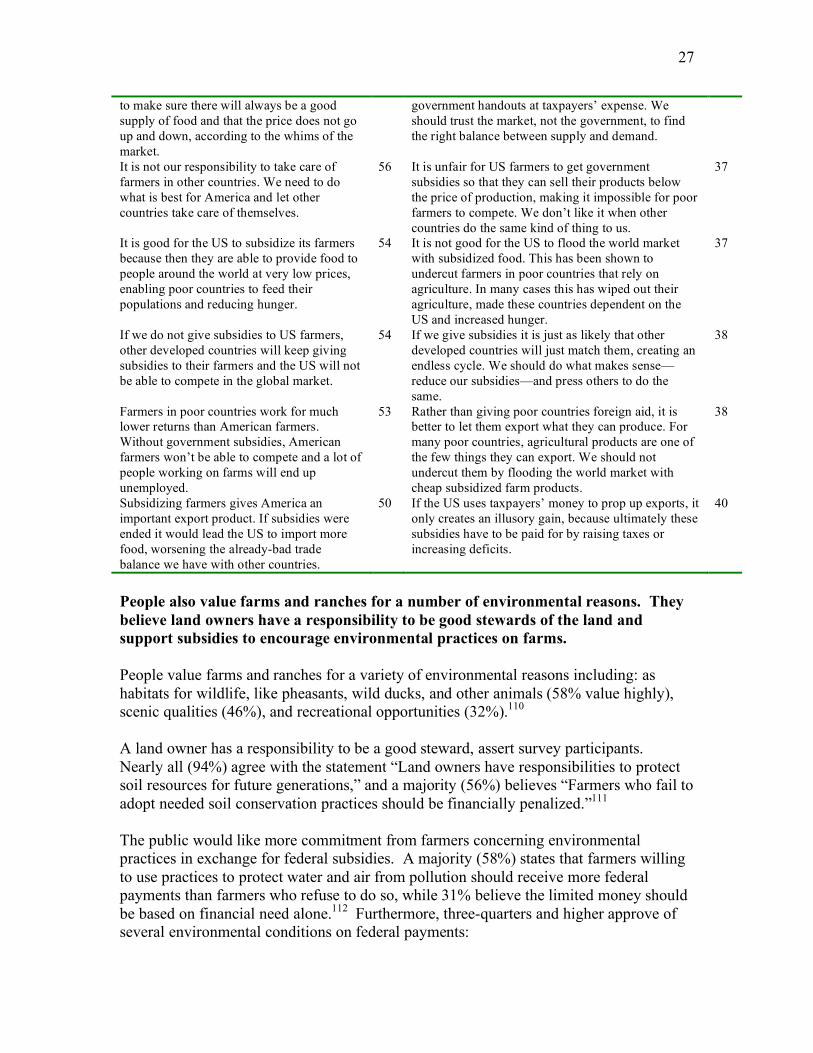
about subsidies for large farming businesses. In fact, only 31% favor and 65% oppose giving subsidies to large farming businesses. Those who favor subsidies would provide them in bad years (24%) while few (9%) would give subsidies on a regular, annual basis. Similarly, a majority (57%) opposes providing subsidies to businesses that provide farmers with equipment and services, while only 36% favor providing them subsidies. 106 Americans believe that the US government farm policy currently favors large farming businesses (80%), not small farmers (6%).107 In fact, the public assumes that more than half of subsidies (58% of subsidies on average) go to large agricultural businesses, while 42% of subsidies go to small farmers. However, they want subsidies to favor small businesses (63% of subsidies should go to small farmers, 36% to large agricultural businesses). 108 The public consistently lands on the side of subsidizing farmers. In a series of two-sided debates, a majority of the public always chose the pro-subsidy stance. The most compelling reasons to support subsidies include controlling food cost, protecting family farms from economic competition, the benefits of locally grown foods, food safety and food supply. (Table 20)
Table 20: Choosing Between Two Sides of a Farm Subsidy Argument109 In Percent
Preferred Statement % Rejected Statement % It is up to individuals to decide how much food they eat. Removing subsidies and driving up the cost of food is not the way to address the problem of obesity and would be hard on the pocketbooks of low-income Americans.
79 Subsidies have prompted US agribusiness to produce far more food than the US people can eat, driving down the cost of food. This has led retailers to serve larger portions of food and played a major role in the epidemic of obesity, which is threatening the health of many Americans and driving up healthcare costs.
16
Family farming is an American way of life that should be maintained. Subsidies are the only way that small family farms can compete with large agribusiness and imports from low-wage countries.
70 There are many ways of making a living that are part of the American way of life. It is unfair to subsidize farmers and not subsidize other equally American ways of making a living.
25
People should have food available to them that was locally grown. Locally grown foods taste better and lead people to have a larger share of fresh foods in their diet. Without subsidies, most of our food would be grown far away, even in foreign countries.
70 Having locally grown food is nice, but the people who want it should be willing to pay the extra cost of producing it, rather than expecting the government to subsidize their preferences for certain kinds of food.
26
Farming is a risky business. Depending on the weather, farmers have good years and bad years. The government needs to help farmers have a minimum income so that they can be sure they will get through the bad years.
62 Farmers should not be given preferential treatment. Just like any business, they should have capital reserves and insurance protection, so they can take care of themselves if they have a bad year. They should not expect the government to bail them out.
34
When food is grown in the USA we can be more confident that it meets the proper food safety standards. Subsidies ensure that American farmers can keep producing safe food for the American people.
61 The US government monitors the safety of all food sold in the US, so there is no reason to believe that imported food is less safe. Subsidizing American agribusiness based on such unfounded fears is a waste of taxpayers’ money.
36
There is nothing more important than food. The government needs to subsidize farming
58 It is not consistent with the American way to have a whole sector of the economy dependent on
37
27
to make sure there will always be a good supply of food and that the price does not go up and down, according to the whims of the market.
government handouts at taxpayers’ expense. We should trust the market, not the government, to find the right balance between supply and demand.
It is not our responsibility to take care of farmers in other countries. We need to do what is best for America and let other countries take care of themselves.
56 It is unfair for US farmers to get government subsidies so that they can sell their products below the price of production, making it impossible for poor farmers to compete. We don’t like it when other countries do the same kind of thing to us.
37
It is good for the US to subsidize its farmers because then they are able to provide food to people around the world at very low prices, enabling poor countries to feed their populations and reducing hunger.
54 It is not good for the US to flood the world market with subsidized food. This has been shown to undercut farmers in poor countries that rely on agriculture. In many cases this has wiped out their agriculture, made these countries dependent on the US and increased hunger.
37
If we do not give subsidies to US farmers, other developed countries will keep giving subsidies to their farmers and the US will not be able to compete in the global market.
54 If we give subsidies it is just as likely that other developed countries will just match them, creating an endless cycle. We should do what makes sense—reduce our subsidies—and press others to do the same.
38
Farmers in poor countries work for much lower returns than American farmers. Without government subsidies, American farmers won’t be able to compete and a lot of people working on farms will end up unemployed.
53 Rather than giving poor countries foreign aid, it is better to let them export what they can produce. For many poor countries, agricultural products are one of the few things they can export. We should not undercut them by flooding the world market with cheap subsidized farm products.
38
Subsidizing farmers gives America an important export product. If subsidies were ended it would lead the US to import more food, worsening the already-bad trade balance we have with other countries.
50 If the US uses taxpayers’ money to prop up exports, it only creates an illusory gain, because ultimately these subsidies have to be paid for by raising taxes or increasing deficits.
40
People also value farms and ranches for a number of environmental reasons. They believe land owners have a responsibility to be good stewards of the land and support subsidies to encourage environmental practices on farms. People value farms and ranches for a variety of environmental reasons including: as habitats for wildlife, like pheasants, wild ducks, and other animals (58% value highly), scenic qualities (46%), and recreational opportunities (32%).110 A land owner has a responsibility to be a good steward, assert survey participants. Nearly all (94%) agree with the statement “Land owners have responsibilities to protect soil resources for future generations,” and a majority (56%) believes “Farmers who fail to adopt needed soil conservation practices should be financially penalized.”111 The public would like more commitment from farmers concerning environmental practices in exchange for federal subsidies. A majority (58%) states that farmers willing to use practices to protect water and air from pollution should receive more federal payments than farmers who refuse to do so, while 31% believe the limited money should be based on financial need alone.112 Furthermore, three-quarters and higher approve of several environmental conditions on federal payments:

28
Adopt university tested practices to prevent pollution of streams
or other bodies of water 88% approve
Protect wetlands on their farm or ranch 83% Apply some conservation practices, such as protecting
waterways, wetlands, and wildlife 75%
Adopt university tested practices for providing wildlife habitat on their land
73% 113
Importantly, the public supports subsidies to encourage environmental practices, but does not see that farms harm the environment. Therefore, farming is not currently an “environmental problem,” though farmers can be enlisted in environmental solutions. A majority (54%) disagrees that "farming is a major source of pollution in our nation today" and only 20% agree. Furthermore, survey participants select “undecided” at high levels when confronted with statements about environmental damage by farming. A plurality (45%) is undecided whether, “Present farming methods are polluting our water supplies,” while just 34% agree and 21% disagree. Similarly, 43% are undecided whether, “American farmers use more chemicals than are necessary to produce food,” though just as many (43%) agree that farmers use more chemicals than necessary.114 Americans are more likely to worry about the environmental impact by farming in other countries than in the United States. Three quarters worry (74% worry, 42% worry a great deal) about farming’s impact on the environments of other countries, while fewer (61% worry, 27% worry a great deal) worry about the environmental problems that are caused by U.S. farming methods. 115 Once again, the public assumes that small family farms are more responsible than large scale farms. More than two-thirds (69%) believe that smaller-scale family farms are more likely to use techniques that will not harm the environment, while 22% choose large-scale industrial farms.116 While they want animals to be treated humanely, most Americans do not support significant reforms to protect animal rights. Nearly three-quarters (71%) believe that “animals deserve some protection from harm and exploitation,” while 25% believe that “animals deserve the exact same rights as people to be free from harm and exploitation.” Furthermore, a majority favors passing strict laws concerning the treatment of farm animals (62% support, 35% oppose). At the same time, the public opposes several proposals concerning the treatment of non-farm animals, such as: banning all types of hunting (22% support, 76% oppose), banning all medical research on laboratory animals (35% support, 64% oppose), and banning all product testing on laboratory animals (38% support, 61% oppose).117

29
However, concern about the humane treatment of animals may be on the rise. One survey showed increases in support for humane treatment standards (48% in 2004, up from 37% in 2003) and humane slaughter (44% in 2004 compared to 30% in 2003). 118 Majorities are willing to pay for environmentally-friendly farming, but fewer are willing to pay for food production practices that treat animals humanely. Finally, strong majorities report that they are willing to pay more for farming practices that are environmentally friendly:
81% agree “I would be willing to pay more for food grown on farms using good environmental practices.”
71% agree “I would be willing to pay more for food if it meant that it could be produced in ways that protect the environment.”
60% agree “I would be willing to pay more for food produced without using chemicals.”119
Fewer are willing to pay more for the humane treatment of animals. A slim majority (51%) reports that they are willing to spend more for humanely-produced food. One in seven (14%) is willing to pay 5% more, one in five (21%) is willing to pay 10% more, and 16% of survey respondents are willing to spend 20% more for food produced with the humane treatment of animals. 120
Summary Points Americans are generally satisfied with various actors in the nation’s food system and see them as trusted spokespeople. At the same time, this high level of public satisfaction indicates there is little support for government intervention in the nation's food system. People are concerned about physical health and have some understanding of the link between food and health. However, they are frequently confused about conflicting health information. Most importantly, the current food-health conversation emphasizes food choices and individual responsibility. The food system is invisible in this conversation. The public is more open to shared responsibility for children’s health and nutrition. Even here, however, support for policies can be easily undermined with more powerful frames, such as parental responsibility. School-based nutrition provides an opening for a conversation about child health, but since most believe school lunches are nutritious, this may be a challenging approach. Currently, people do not think very much about food processing and production. While they are aware of some dangers and benefits that occur due to food production practices, opinion in this area is largely unformed and malleable. There may be an opportunity to shape opinion by linking human health with food production in ways that make the food system more visible.

30
The public holds very positive perceptions of farms, particularly small family farms. People believe small family farms produce safer, more nutritious food and are more likely to protect the environment. There may be an opportunity build on these understandings to lead to support for policy. The challenge will be in moving people from just positive feelings toward a more sophisticated understanding that will promote long-term change.
About the Author Meg Bostrom, President of Public Knowledge LLC, is a frequent FrameWorks collaborator and a veteran communications strategist with a unique perspective resulting from her experiences as communicator, opinion analyst, advertising executive, and political consultant. Meg started her career as a political pollster, consulting for nonprofit groups, political candidates, foundations, and national associations. She then served as Executive Vice President of Strategic Planning at the advertising agency Trahan, Burden and Charles, where she was responsible for determining communications strategy for corporate and non-profit clients. Meg founded Public Knowledge to serve as a bridge between public opinion research and communications strategy. Public Knowledge uses public opinion data to develop communications strategy that will advance public understanding of, and support for, public policies to address social issues, including the environment, children, foreign policy, healthcare, and the working poor. A Chicago native, she received her bachelor’s degree from the University of Illinois, and holds a master’s degree from the University of Connecticut. 1 Harris Interactive, The Harris Poll® 1,010 adults 18+ nationally, April 5-10, 2005. 2 Harris Interactive, April 5-10, 2005. 3 Harris Interactive, The Harris Poll® 2,204 adults 18+ nationally, February 16-20, 2004. 4 Harris Interactive, April 5-10, 2005. 5 Harris Interactive, February 16-20, 2004. 6 The Gallup Organization, 1,017 adults nationally, August 9-11, 2004. Data provided by The Roper Center for Public Opinion Research, University of Connecticut. 7 The Gallup Organization, August 9-11, 2004. 8 Center for Media and Public Affairs, Food for Thought V, sponsored by the International Food Information Council Foundation, written report by the Center for Media and Public Affairs, media content analysis of 40 local and national news outlets, May – July 2003. 9 Princeton Survey Research Associates International, Boomers at Midlife: The AARP Life Stage Survey, by AARP, 3,850 adults nationally, April 5-May 31, 2004. Interviews were conducted by Princeton Survey Research Associates International. Data provided by the Roper Center for Public Opinion Research, University of Connecticut. 10 Princeton Survey Research Associates International, April 5-May 31, 2004. 11 TNS Intersearch, The ABC News/Time Magazine Poll, interviews conducted by TNS Intersearch, 1,202 adults nationally, May 10-16, 2004. Data provided by The Roper Center for Public Opinion Research, University of Connecticut.

31
12 The Gallup Organization, 1,005 adults nationally, July 8-11, 2004. Data provided by The Roper Center for Public Opinion Research, University of Connecticut. 13 TNS Intersearch, May 10-16, 2004. 14 The Gallup Organization, 1,006 adults nationally, July 7-9, 2003. Data provided by The Roper Center for Public Opinion Research, University of Connecticut. 15 Center for Media and Public Affairs, May – July 2003. 16 Strategy One, Fitting Dietary Fats Into A Healthful Diet, a Report to: IFIC Foundation, written by Strategy One, based on four focus groups, September 16, 2004. 17 TNS Intersearch, May 10-16, 2004. 18 Harris Interactive, 1,012 adults nationally, February 8-13, 2005. Data provided by The Roper Center for Public Opinion Research, University of Connecticut. 19 Harris Interactive, February 8-13, 2005. 20 Stony Brook University Center for Survey Research, Health Pulse of America Survey, 814 adults nationally, November 5-November 25, 2003. Data provided by The Roper Center for Public Opinion Research, University of Connecticut. 21 Public Agenda, “A Lot Easier Said Than Done,” 1607 parents or guardians of children age 5 to 17, July 31 – August 15, 2002. 22 CBS News/New York Times Poll, 642 adults nationally, May 9-11, 2003. 23 Stony Brook University Center for Survey Research, November 5-25, 2003. 24 TNS Intersearch, May 10-16, 2004. 25 TNS Intersearch, May 10-16, 2004. 26 Greenberg Quinlan Rosner Research, sponsored by Club Mom, 1,207 women nationally with children under 19, March 8-March 11, 2004. Data provided by The Roper Center for Public Opinion Research, University of Connecticut. 27 Stony Brook University Center for Survey Research, November 5-25, 2003. 28 The Polling Company, sponsored by KidsPeace, Boys & Girls Clubs of America, 1,000 national adult parents of children under 18, June 2-June 8, 2003. Data provided by The Roper Center for Public Opinion Research, University of Connecticut. 29 Stony Brook University Center for Survey Research, November 5-25, 2003. 30 TNS Intersearch, May 10-16, 2004. 31 TNS Intersearch, May 10-16, 2004. 32 Fabrizio, McLaughlin & Associates, 1,200 adults nationally, June 11-June 14, 2002. Data provided by The Roper Center for Public Opinion Research, University of Connecticut. 33 Stony Brook University Center for Survey Research, November 5-November 25, 2003. 34 TNS Intersearch, May 10-16, 2004. 35 ICR International Communications Research, Childhood Obesity Survey, sponsored by the Henry J. Kaiser Family Foundation and San Jose Mercury News, 1,017 adults nationally, February 4-8, 2004. 36 TNS Intersearch, May 10-16, 2004. 37 Conducted by Princeton Survey Research Associates International, sponsored by Henry J. Kaiser Family Foundation, 1,001 parents of children ages 2-17, July 12-August 13, 2004. Interviews were conducted by Braun Research. Data provided by The Roper Center for Public Opinion Research, University of Connecticut. 38 Conducted by Stony Brook University Center for Survey Research, 865 adults nationally, July 22 – August 12, 2003. Data provided by The Roper Center for Public Opinion Research, University of Connecticut. 39 ICR International Communications Research, February 4-8, 2004. 40 Stony Brook University Center for Survey Research, November 5-November 25, 2003. 41 ICR International Communications Research, February 4-8, 2004. 42 TNS Intersearch, May 10-16, 2004. 43 Stony Brook University Center for Survey Research, November 5-November 25, 2003. Question asked of those with schoolchildren (28% of sample). 44 Stony Brook University Center for Survey Research, July 22 – August 12, 2003.

32
45 ICR International Communications Research, Mad Cow Survey sponsored by the Harvard School of Public Health Project on the Public & Biological Security, 1,015 adults nationally, January 7-11, 2004. Data provided by The Roper Center for Public Opinion Research, University of Connecticut. 46 CNN/USA Today/Gallup Poll, 1,029 adults nationally, Jan. 2-5, 2004. 47 ICR International Communications Research, January 7-11, 2004. 48 ICR International Communications Research, January 7-11, 2004. 49 Synovate, The E-Nation Online Survey commissioned by Whole Foods Market, 1,000 Americans 18+ selected from the online segment of Synovate's Consumer Opinion Panel and balanced to be representative of the general population, May 2003. Findings are from company press release. 50 Roper Public Affairs & Media, Food and Farming 2004, 1,000 adults 18+ nationally, March 26 to April 10, 2004. 51 Dr. Roberta Cook, Fresh Trends 2002, as reported in “Consumer Attitudes about Organic Foods,” by Dr. Roberta Cook, University of California Davis, January 2004. 52 TNS Intersearch, sponsored by ABC News, 1,024 adults nationally, July 9-13, 2003. 53 Synovate, The 2004 Whole Foods Market Organic Foods Trend Tracker* survey, commissioned by Whole Foods Market, 1,000 adults, August 2004. Findings are from company press release. 54 Dr. Roberta Cook, Fresh Trends 2003, as reported in “Consumer Attitudes about Organic Foods,” by Dr. Roberta Cook, University of California Davis, January 2004. 55 Synovate, August 2004. 56 Synovate, August 2004. 57 Synovate, May 2003. 58 Dr. Roberta Cook, Food and the Environment Update 2001, by the Hartman Group, as reported in “Consumer Attitudes about Organic Foods,” by Dr. Roberta Cook, University of California Davis, January 2004. 59 Sally Blodgett, “New Research Shows U.S. Health Habits Changing,” written by reporter Sally Blodgett, Santa Cruz Sentinel. The article reports on proprietary research by the National Marketing Institute based on research conducted with a panel of 64,000 consumers. 60 Cogent Research, sponsored by the International Food Information Council, 1,004 adults nationally 18+, March 2002. Written analysis on company website. 61 Cogent Research, March 2002. 62 Cogent Research, March 2002. 63 Strategy One, September 16, 2004. 64 The Mellman Group and Public Opinion Strategies, sponsored by the Pew Initiative on Food and Biotechnology, 1000 adults nationally, September 22-26, 2004. 65 Cogent Research, US Consumer Attitudes Toward Biotechnology, sponsored by the International Food Information Council, trend questions conducted by the Wirthlin Group (March 1997, February 1999, October 1999, May 2000, and January 2001), and Cogent Research (September 2001, August 2002, April 2003, January 2004, and March 2005), each approximately 1,000 adults 18+ nationally. 66 The Mellman Group and Public Opinion Strategies, sponsored by Pew Initiative on Food and Biotechnology, 1,001 adults nationally, January 22-26, 2001. Data provided by The Roper Center for Public Opinion Research, University of Connecticut. 67 Harris Interactive, The Harris Poll, 991 adults age 18+ nationally, June 8-15, 2004. 68 The Mellman Group and Public Opinion Strategies, September 22-26, 2004. 69 Cogent Research/Wirthlin Group, trend questions for IFIC. 70 The Mellman Group and Public Opinion Strategies, September 22-26, 2004. 71 The Mellman Group and Public Opinion Strategies, September 22-26, 2004. 72 The Mellman Group and Public Opinion Strategies, September 22-26, 2004. 73 The Mellman Group and Public Opinion Strategies, September 22-26, 2004. 74 The Mellman Group and Public Opinion Strategies, September 22-26, 2004. 75 The Mellman Group and Public Opinion Strategies, September 22-26, 2004. 76 TNS Intersearch, July 9-13, 2003. 77 Cogent Research/Wirthlin Group, trend questions for IFIC. 78 Cogent Research/Wirthlin Group, trend questions for IFIC. 79 The Mellman Group and Public Opinion Strategies, September 22-26, 2004.

33
80 The Mellman Group and Public Opinion Strategies, September 22-26, 2004. 81 The Mellman Group and Public Opinion Strategies, September 22-26, 2004. 82 Cogent Research/Wirthlin Group, trend questions for IFIC. 83 Cogent Research/Wirthlin Group, trend questions for IFIC. 84 Cogent Research/Wirthlin Group, trend questions for IFIC. 85 Cogent Research/Wirthlin Group, trend questions for IFIC. 86 The Mellman Group, sponsored by the Pew Initiative on Food and Biotechnology, 1000 adults nationally, August 5-10, 2003. 87 The Mellman Group, August 5-10, 2003. 88 Tarrance Group, sponsored by American Farmland Trust and the Joyce Foundation, 1,024 registered voters nationally, June 2-June 21, 2001. The Public Opinion Research Laboratory of Northern Illinois University conducted the poll under the direction of Dr. Dixon Essex. The Tarrance Group provided consulting and analytical services. Data provided by The Roper Center for Public Opinion Research, University of Connecticut. 89 Roper Public Affairs & Media, March 26 to April 10, 2004. 90 PIPA and Knowledge Networks, Americans on Farm Subsidies, 1,896 adults nationally, drawn from Knowledge Networks’ “large-scale nationwide research panel which is randomly selected from the national population of households having telephones and is subsequently provided internet access for the completion of surveys (and thus is not limited to those who already have internet access).” Interviews were completed December 19, 2003 – January 5, 2004. 91 Roper Public Affairs & Media, March 26 to April 10, 2004. 92 Tarrance Group, June 2-June 21, 2001. 93 Ronald C. Wimberley, “Food from our Changing World: The Globalization of Food and How Americans Feel about it,” a report based on research conducted by Ronald C. Wimberley and North Carolina State University, 819 mailed survey responses, weighted to be representative of the US population, 2001-2002. 94 Ronald C. Wimberley 2001-2002. 95 Ronald C. Wimberley 2001-2002. 96 Roper Public Affairs & Media, March 26 to April 10, 2004. 97 Tarrance Group, June 2-June 21, 2001. 98 Greenberg Quinlan Rosner Research, sponsored by Foodroutes Network,from a report by Greenberg Quinlan Rosner Research, 4 surveys of 400 each, conducted in areas with buy local campaigns (Santa Cruz County, California; Blackhawk County, Iowa; the Greater Philadelphia Metro region; and Baton Rouge, Louisiana), March 12-21, 2002. Due to the continuity of response the research combined survey results from all four regions. 99 Greenberg Quinlan Rosner Research, March 12-21, 2002. 100 Tarrance Group, June 2-June 21, 2001. 101 Greenberg Quinlan Rosner Research, March 12-21, 2002. 102 Greenberg Quinlan Rosner Research, March 12-21, 2002. 103 Tarrance Group, June 2-June 21, 2001. 104 Tarrance Group, June 2-June 21, 2001. 105 PIPA and Knowledge Networks, December 19, 2003 – January 5, 2004. 106 PIPA and Knowledge Networks, December 19, 2003 – January 5, 2004. 107 PIPA and Knowledge Networks, December 19, 2003 – January 5, 2004. 108 PIPA and Knowledge Networks, December 19, 2003 – January 5, 2004. 109 PIPA and Knowledge Networks, December 19, 2003 – January 5, 2004. 110 Tarrance Group, June 2-June 21, 2001. 111 Ronald C. Wimberley, 2001-2002. 112 Tarrance Group, June 2-June 21, 2001. 113 Tarrance Group, June 2-June 21, 2001. 114 Ronald C. Wimberley, 2001-2002. 115 Ronald C. Wimberley, 2001-2002. 116 Roper Public Affairs & Media, March 26 to April 10, 2004. 117 The Gallup Organization, 1,005 adults nationally, May 5-May 7, 2003. Data provided by The Roper Center for Public Opinion Research, University of Connecticut.

34
118 Synovate, May 2003. 119 “Ronald C. Wimberley, 2001-2002. 120 Roper Public Affairs & Media, March 26 to April 10, 2004.