digital analytics lecture3
TRANSCRIPT
Information Technology Program
Aalto University, 2015
Dr. Joni Salminen
[email protected], tel. +358 44 06 36 468
DIGITAL ANALYTICS
1
Report sections of Google Analytics
1. Audience – tells about characteristics of visitors
2. Acquisition – tells about sources of visitors (e.g.,
marketing channels)
3. Behavior – tells how the visitors acted on the site
4. Conversion – tells how goals defined by the
organization are met.
2

Traffic sources à la Google Analytics
(Google, 2015)
3

About ’source’ and ’medium’ (Google, 2015)
4
How to track ANY digital campaign?
1. UTM builder: [hands-on]
2. annotations [Joni shows]
5
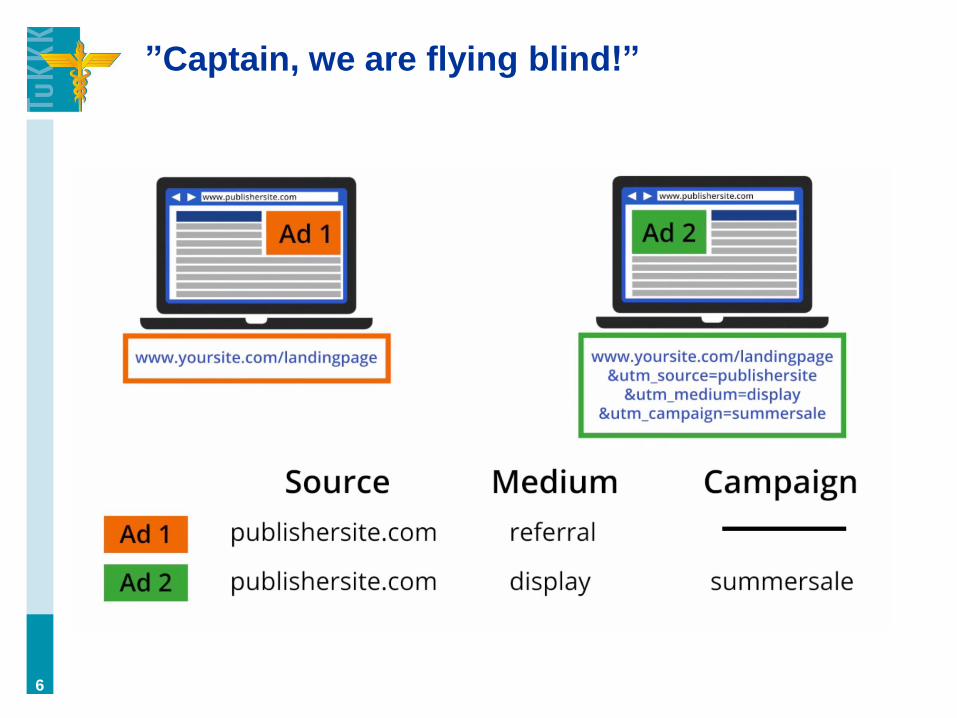
”Captain, we are flying blind!”
6

How does campaign tracking appear in GA
reports?
• [JONI SHOWS]
7

Standard values for UTM parameters
• Medium:
– cpc
– display
– social
• Content:
– (name of ad version 1)
– (name of ad version 2)
• (Remember, they are case-sensitive.)
8

Custom channel groupings (Google, 2015)
9
EXAMPLES OF ANALYTICAL
DECISION-MAKING: BUDGET
ALLOCATION & SALES
ATTRIBUTION
10
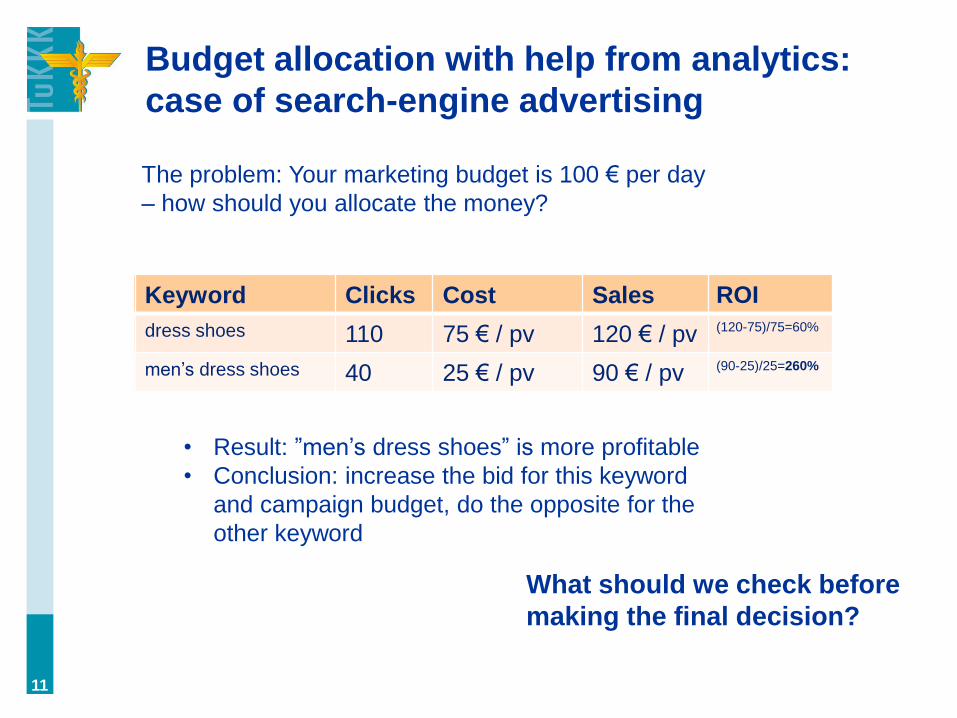
Budget allocation with help from analytics:
case of search-engine advertising
Avainsana Klikit Kustannus Myynnit ROI
lahja naiselle 110 75 € / pv 120 € / pv (120-75)/75=60%
lahja miehelle 40 25 € / pv 90 € / pv (90-25)/25=260%
11
• Result: ”men’s dress shoes” is more profitable
• Conclusion: increase the bid for this keyword
and campaign budget, do the opposite for the
other keyword
The problem: Your marketing budget is 100 € per day
– how should you allocate the money?
Keyword Clicks Cost Sales
dress shoes 110 75 € / pv 120 € / pv
men’s dress shoes 40 25 € / pv 90 € / pv
What should we check before
making the final decision?

Attributing sales value
• You are the manager of an ecommerce site
• You have one sales conversion worth 1000€
• From analytics, you can see that four clicks have
preceded the conversion
• The last click came from a search-engine with a
specific keyword.
How do you allocate the value of
the sales conversion?
12

”Last click fallacy”
a. our analytics tool can only identify the last interaction
leading to conversion (i.e., we are blind to the
previous interactions)
b. based on this information, we conclude that a certain
campaign or channel resulted in the conversion,
even though, when there are other touch-points, at
least some value should justifiably be attributed to
them as well.
• why does it matter?
– the result is an attribution error, due to which we are
potentially making bad decisions. (think of funnel!)
13

The conversion path
• Some channels tend to have bad direct conversions,
therefore it’s important to see assisted conversions
(you can find them in Google Analytics)
• [JONI SHOWS]
14
1st touch Conversion
Assisting effect
Last touch 2nd touch
What’s the length of the
conversion path?
For example, analytics categorically shows
me that…
• Google converts much better than Facebook
15

Direct ROI of social media is oftentimes bad
16
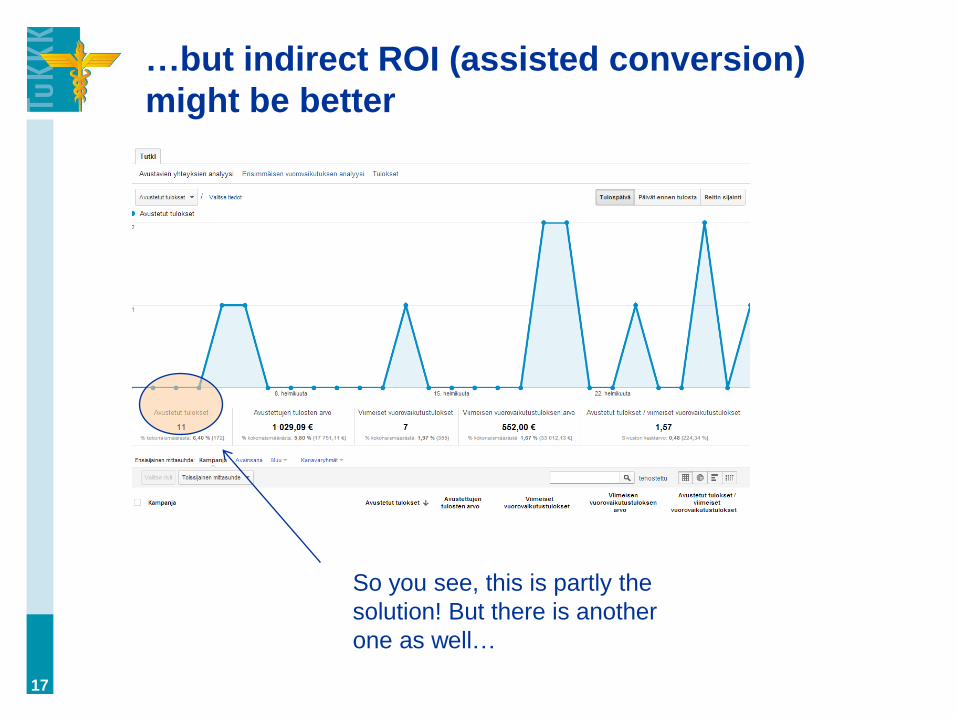
…but indirect ROI (assisted conversion)
might be better
17
So you see, this is partly the
solution! But there is another
one as well…
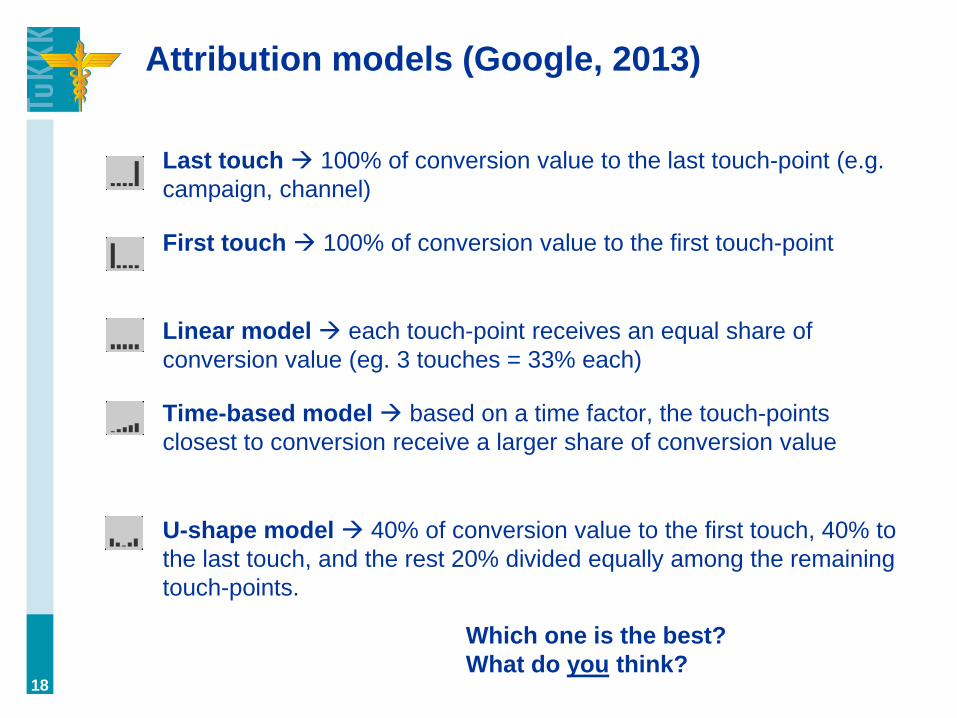
Attribution models (Google, 2013)
Last touch 100% of conversion value to the last touch-point (e.g.
campaign, channel)
First touch 100% of conversion value to the first touch-point
Linear model each touch-point receives an equal share of
conversion value (eg. 3 touches = 33% each)
Time-based model based on a time factor, the touch-points
closest to conversion receive a larger share of conversion value
U-shape model 40% of conversion value to the first touch, 40% to
the last touch, and the rest 20% divided equally among the remaining
touch-points.
18
Which one is the best?
What do you think?

Attribution models: an example
First touch
model
Last touch
model
Linear
model
1 Facebook
2 Google organic
3 Google CPC
4 Blog article
19
• one conversion = 1000 €
• the conversion path includes four
touch-points in the following order
• how to attribute conversion value?

Attribution models: an example
First touch
model
Last touch
model
Linear
model
1 Facebook 1000€ 250€
2 Google organic 250€
3 Google CPC 250€
4 Blog article 1000€ 250€
20
• one conversion = 1000 €
• the conversion path includes four
touch-points in the following order
• how to attribute conversion value?
Attribution modeling in practice
• [Joni shows]
21

METRICS
22

Definition
“A business metric is any type of measurement
used to gauge some quantifiable component of
a company's performance, such as return on
investment (ROI), employee and customer churn
rates, revenues, EBITDA, and so on.” (Rouse,
2007)
23

Objective → Goal → Metric
• Objective: a broader goal, i.e. capture market share
from competitors
• Goal: a specific goal, like gain 30% of market share
by the end of 2015
• Metrics: market share, market growth, generated
leads, sent quotes, closed sales
24
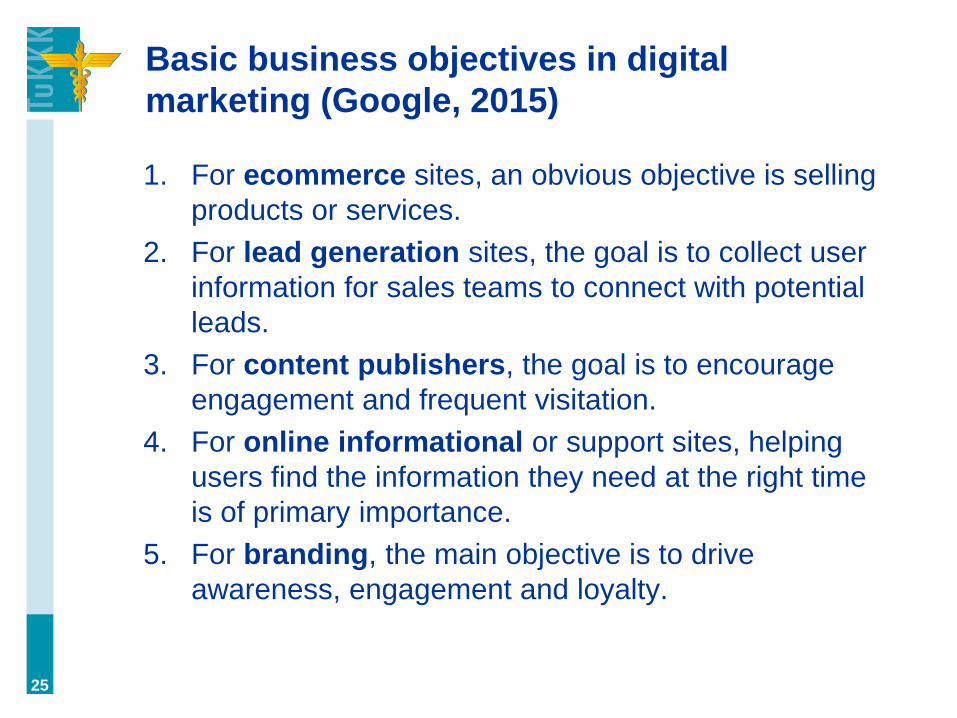
Basic business objectives in digital
marketing (Google, 2015)
1. For ecommerce sites, an obvious objective is selling
products or services.
2. For lead generation sites, the goal is to collect user
information for sales teams to connect with potential
leads.
3. For content publishers, the goal is to encourage
engagement and frequent visitation.
4. For online informational or support sites, helping
users find the information they need at the right time
is of primary importance.
5. For branding, the main objective is to drive
awareness, engagement and loyalty.
25

There are many ways to classify metrics…
Let’s look at some!
26

Google’s classification
1. Audience metrics – e.g. number of visitors, new
users, returning visitors
2. Behavioural metrics – e.g. pages/visit
3. Conversion metrics – how many times visitor
completed a goal on the website
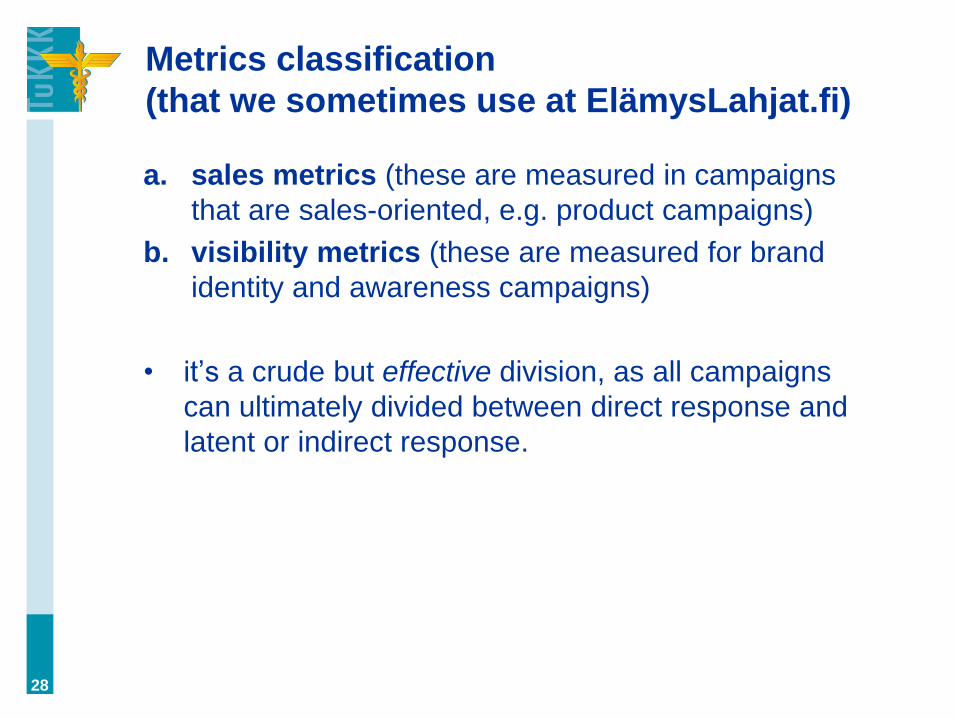
Metrics classification
(that we sometimes use at ElämysLahjat.fi)
a. sales metrics (these are measured in campaigns
that are sales-oriented, e.g. product campaigns)
b. visibility metrics (these are measured for brand
identity and awareness campaigns)
• it’s a crude but effective division, as all campaigns
can ultimately divided between direct response and
latent or indirect response.
28
• Platform specific:
– PageRank, Quality Score (Google)
– EdgeRank (engagement), Relevance Score (FB)
• Website (before click): – CPM (cost per mille)
– CPC (cost per click)
– CTR (click-through rate)
• Website (after click): – BR (bounce rate)
– CVR (conversion rate)
– CPA (cost per action)
– CAC (customer acquisition cost)
– ROI (return on investment)
– CLV (customer lifetime value)
Basic digital marketing metrics
29

Let’s look at the most common digital
marketing metrics. In addition to showing
performance, some of them are used as
pricing models for online advertising.
30
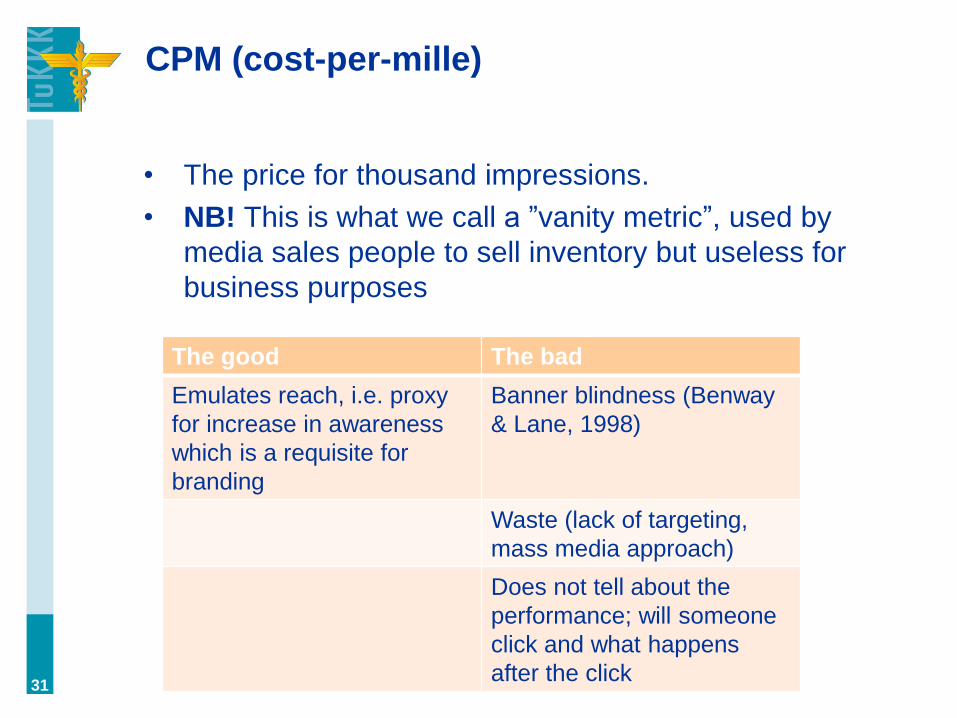
CPM (cost-per-mille)
• The price for thousand impressions.
• NB! This is what we call a ”vanity metric”, used by
media sales people to sell inventory but useless for
business purposes
31
The good The bad
Emulates reach, i.e. proxy
for increase in awareness
which is a requisite for
branding
Banner blindness (Benway
& Lane, 1998)
Waste (lack of targeting,
mass media approach)
Does not tell about the
performance; will someone
click and what happens
after the click

CPC (cost-per-clikc)
• The price of a click, i.e. visitor (€)
32
The good The bad
Bypasses banner blindness
(the user first need to
process to click)
Click fraud (even up to 50%
of clicks can be fraudulent)
As a metric, you see
performance. As a payment
method, you pay for
performance.
A click does not contain
information about
conversion
A skillful traffic-oriented
marketer can drive
irrelevant traffic, in which
case the company ”pays for
nothing”

CTR (click-through-rate)
• Ratio (%)
• CTR = users who clicked / all who saw the ad
33
The good The bad
Tells how well an ad
performs
Does not tell how qualified
the traffic is, or how good of
a match the landing page
and the ad has
Indicates relevance &
quality
Does not correlate with
sales, ad recall, awareness
or purchase intent (Nielsen,
2011)
CTR can be artificially
manipulated by over-
promising ads

CPA (cost-per-action)
• The cost of a desired action, e.g. sales conversion or
acquired lead (€)
34
The good The bad
Bypasses click fraud by
showing after-click
performance
As a pricing method it’s rare
– in practice only affiliates
As a pricing method it’s
great – you only pay for
conversions
As a measure it doesn’t tell
what happens after 1st
purchase (relationship)
Also, does not tell about
revenue, how many
converted, or how good
relative performance was
Misses externality effects,
such as latent conversions
and word-of-mouth
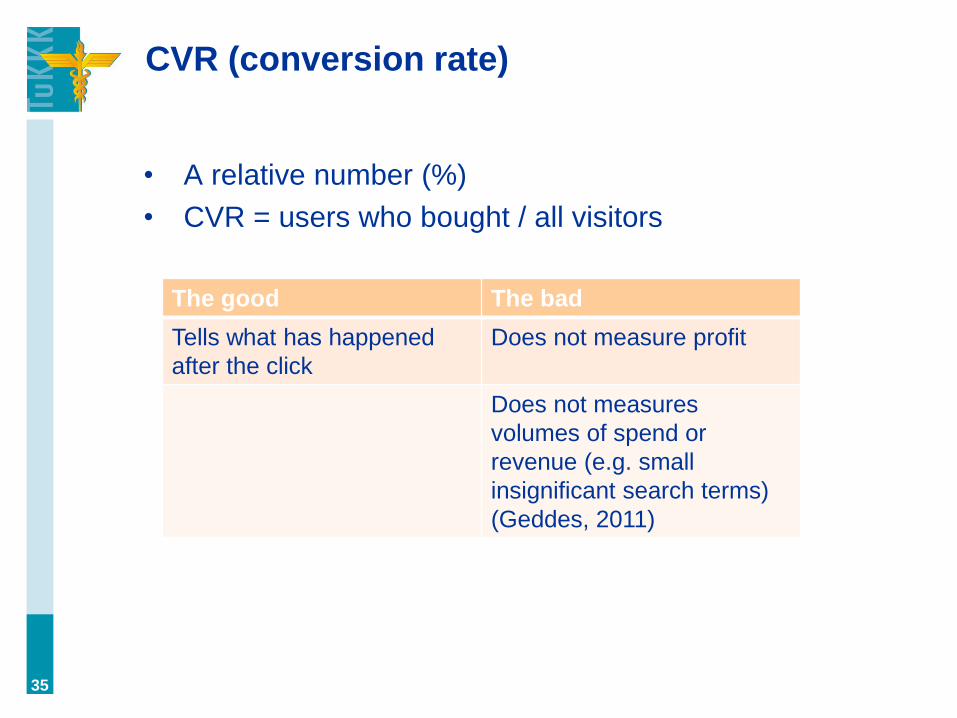
CVR (conversion rate)
• A relative number (%)
• CVR = users who bought / all visitors
35
The good The bad
Tells what has happened
after the click
Does not measure profit
Does not measures
volumes of spend or
revenue (e.g. small
insignificant search terms)
(Geddes, 2011)

ROI (return on investment)
• ROI = (P – C) / C * 100% ,
• where
– P = the revenue from an investment (e.g. campaign)
– C = cost
36
The good The bad
Tells what happened after
click
Does not consider margin
(a good ROI can still mean
unprofitable marketing)
Considers sales revenue Does not consider lifetime
revenue

CLV (customer lifetime value)
• All the revenue a customer brings during the his or
her period of patronage (€)
• In general, the goal is CAC < CLV, in which CAC is
customer acquisition cost
37
The good The bad
Takes into account what
happens after purchase
(customer loyalty, churn)
Hard to measure
The exact figure is known
only afterwards
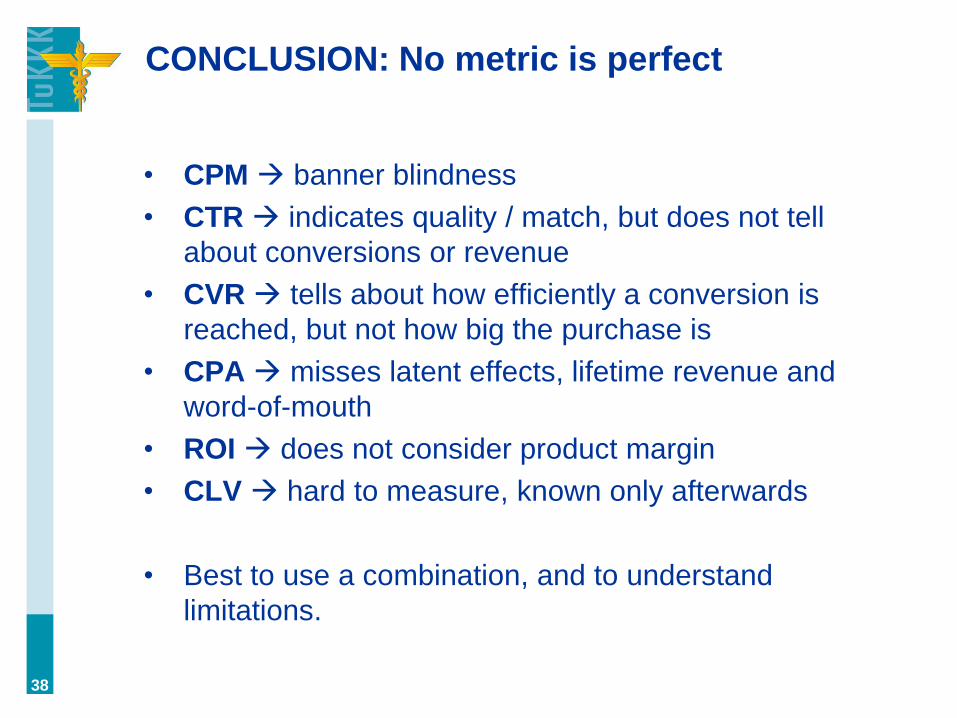
CONCLUSION: No metric is perfect
• CPM banner blindness
• CTR indicates quality / match, but does not tell
about conversions or revenue
• CVR tells about how efficiently a conversion is
reached, but not how big the purchase is
• CPA misses latent effects, lifetime revenue and
word-of-mouth
• ROI does not consider product margin
• CLV hard to measure, known only afterwards
• Best to use a combination, and to understand
limitations.
38
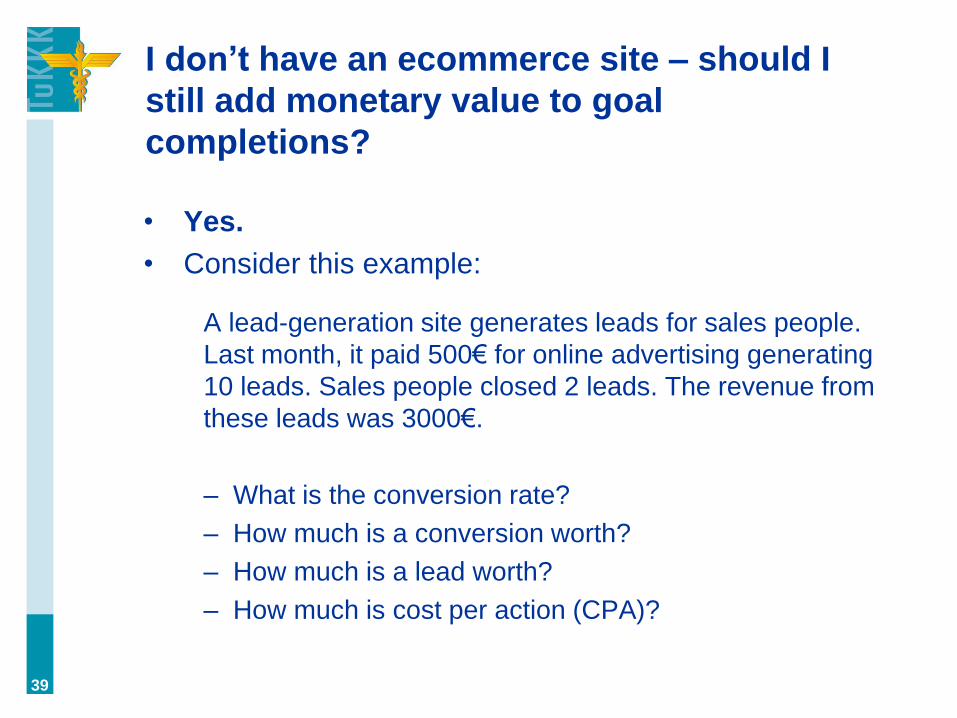
I don’t have an ecommerce site – should I
still add monetary value to goal
completions?
• Yes.
• Consider this example:
A lead-generation site generates leads for sales people.
Last month, it paid 500€ for online advertising generating
10 leads. Sales people closed 2 leads. The revenue from
these leads was 3000€.
– What is the conversion rate?
– How much is a conversion worth?
– How much is a lead worth?
– How much is cost per action (CPA)?
39
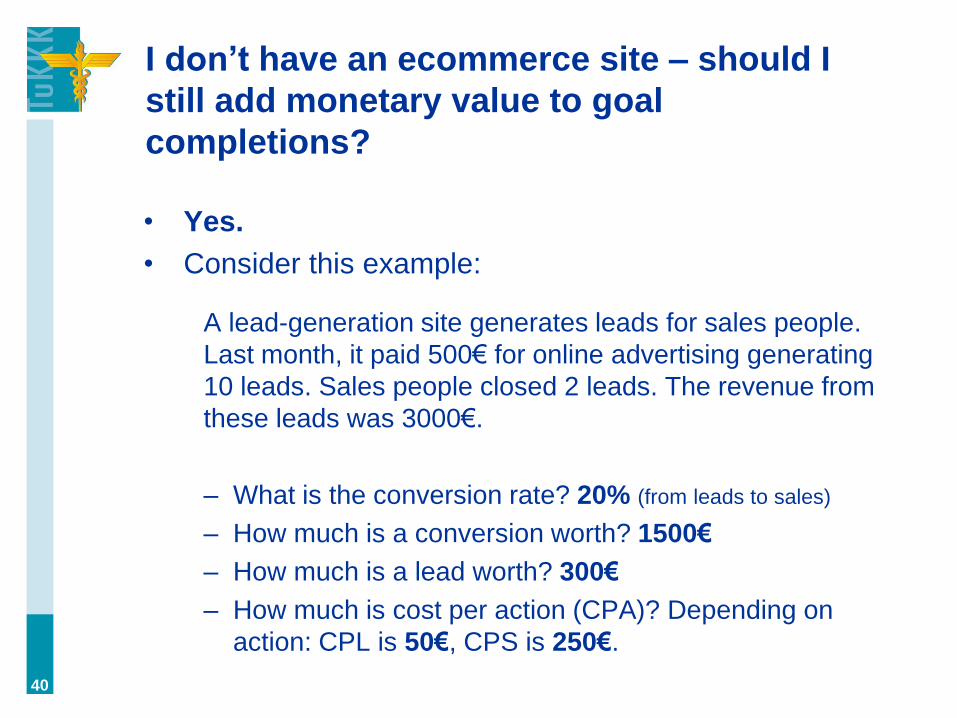
I don’t have an ecommerce site – should I
still add monetary value to goal
completions?
• Yes.
• Consider this example:
A lead-generation site generates leads for sales people.
Last month, it paid 500€ for online advertising generating
10 leads. Sales people closed 2 leads. The revenue from
these leads was 3000€.
– What is the conversion rate? 20% (from leads to sales)
– How much is a conversion worth? 1500€
– How much is a lead worth? 300€
– How much is cost per action (CPA)? Depending on
action: CPL is 50€, CPS is 250€.
40