digital dashboard for operations management€¦ · operational, or kpi dashboards tell you if...
TRANSCRIPT

Digital Dashboards In Terminal
Operations Management
AAPA Marine Terminal Management Training
Sept. 12, 2013- Long Beach CA
Frank J. Mazzella, APL Ltd.

Page 2
What are Dashboards?
Real-Time Visualization of
Critical Business Indicators to
Help in Decision Making
– Provide a Visual “Snapshot" of Key Performance Indicators
– Gain total visibility of multiple systems or measures instantly
Benefits of Digital Dashboards include:
– Ability to make more informed decisions
– Align strategies and organizational goals
– Ability to identify and correct negative trends
– Measure efficiencies/inefficiencies
– Ability to drill down into underlying causal indicators and details
– Saves time compared to running multiple reports

Page 3
Operational vs. Analytical Dashboards
Operational
Identifies potential operational
issues as they occur
View of current activities and
frequently changing performance
metrics
Provides alerts on exception
issues, and drill-through to
facilitate real-time response
Require less training than
analytical dashboards
Analytical
Gains insights from a volume of
data collected over time
Understand what happened, why,
and what changes should be
made in the future
Sophisticated models, what-if
analysis and pivots to identify
patterns and opportunities
Often used by analysts and
highly trained staff
Operational, or KPI dashboards tell you if you’re on target today.
Analytical dashboards set targets for tomorrow.

Page 4
Characteristics of Operational Dashboards
Visual Indicators and Alerts – Graphics convey information “At-a-Glance“
Real-time Data – Enables Right-Time Decision Making
– Aggregates Multiple Data Sources into Composite Views
Alert System – Visual Indicators and Alerts (Including Email, SMS, etc.)
– Event-based or Scheduled Reports with Data
Actionable – Identify in real time that action needs to be taken.
– Drill-down and Causal Analysis to identify what action is needed
User-customizable (highly desirable) – Operational dashboards are both “top-down” and “bottom-up” tools.
“Operational dashboards track core operational processes and emphasize
monitoring more than analysis or management.“
- Performance Dashboards, Wayne Eckerson

Page 5
Operational Dashboards in Terminal Operations
Volumes
Productivity
S/T Demand forecasting
Exception Event Alerts
Technology

Page 6
Case Study APL / Eagle Marine Services
Business Need
– Operations Management
Fast and Accurate Decision Tools,
with Real-time access to:
Equipment and productivity measures
Yard inventory conditions
Gate conditions
Current State
– Current systems do not provide this
information in an immediate and
visible manner.
– Inefficiencies in production and avoidable expenses are
incurred as a result.
Page 7
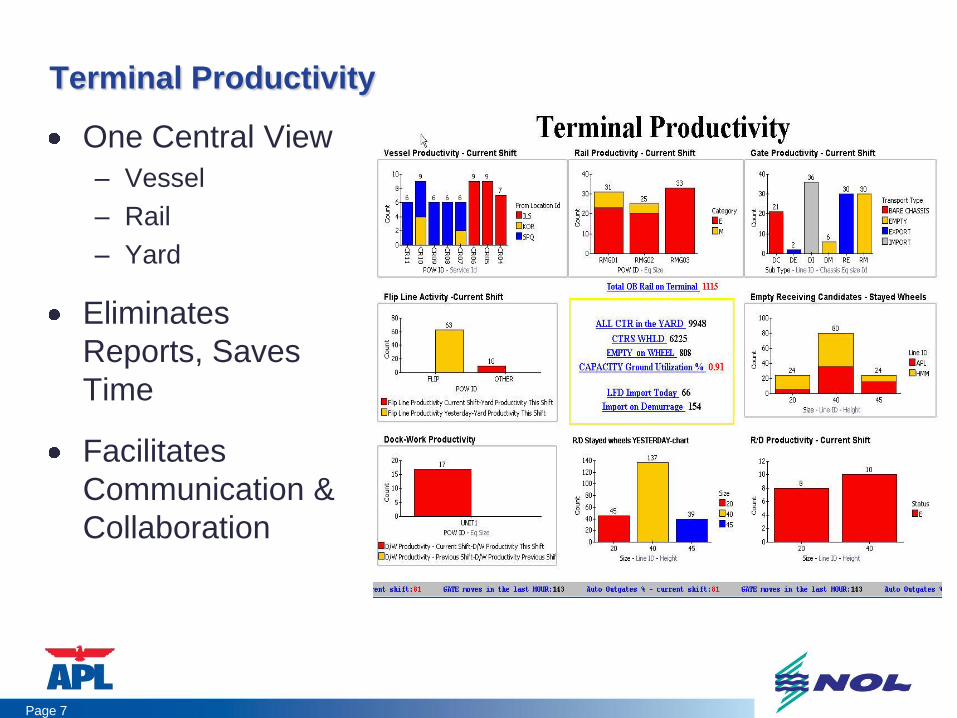
Terminal Productivity
One Central View
– Vessel
– Rail
– Yard
Eliminates
Reports, Saves
Time
Facilitates
Communication &
Collaboration

Page 8
Gate Conditions
Staffing Needs
Problem / Trouble Alerts
Rapid Operations
Response to Changes in
Volume or Patterns, i.e.
Load/Empty, Truck
Queue, etc.

Page 9
Short Term Demand – Last Free Day
Measures Import Containers at or Approaching
Demurrage, for:
Gate Manning
Yard Manning
Equipment Need

Page 10
Technology
Automation Technology
How is it Performing?
Rapid Response to
Exceptions
Minimize Operational
Impact

Page 11
Value of IT Goes Beyond Providing Tools
Users Often Do Not Know Exactly What they Want
IT Provides
– Visibility to Wealth of Data Repositories
– Institutional Knowledge of Data Relationships
Business Provides
– Business Context of Data Value
– Insight into Business Drivers
Better Overall Value Added, More Rewarding
– Less Structured, but not Necessarily Longer
Page 12
A Few Words About Implementation
Executive leadership
– A dashboard project must have direction from the leadership.
Information Technology
– Unless all the data for the dashboard comes from non-IT
administered systems, it is imperative to have IT support.
Viewers
– There are few if any successful ROI stories for dashboards that
do not have viewers for whom an integral part of their
professional success is supported by the dashboard.
Choosing Metrics – The goal is to uncover the metrics and KPIs that lead the user to
a specific decision or action.

Page 13
13
Thank You