digital data acquisition -...
TRANSCRIPT

ME 244L – Prof. R.G. LongoriaDynamic Systems and Controls Laboratory
Department of Mechanical EngineeringThe University of Texas at Austin
Digital Measurement Interfaces and Computer-Aided Data Acquisition
Prof. R.G. LongoriaFall 2006
ME 244L – Prof. R.G. LongoriaDynamic Systems and Controls Laboratory
Department of Mechanical EngineeringThe University of Texas at Austin
Motivation• Why do we need to involve computers in
measurement (and control)?• When do we need to involve computers in
measurement (and control)?• What do we need to know to effectively involve
computers in our measurement (and control) application?
ME 244L – Prof. R.G. LongoriaDynamic Systems and Controls Laboratory
Department of Mechanical EngineeringThe University of Texas at Austin
Overview• Review concepts that help make valid
measurements of signals using computer-based instruments.
• Review components that make up a computer-based data acquisition system.
• Introduce the role of software computer-based measurement applications.
ME 244L – Prof. R.G. LongoriaDynamic Systems and Controls Laboratory
Department of Mechanical EngineeringThe University of Texas at Austin
Topics• A Look at Analog Measurement Devices• Sampling Concepts and the Sampling Theorem • Digital-to-Analog (D/A) Conversion • Analog-to-Digital (A/D) Conversion • Data Acquisition System Components • Data Acquisition Software

ME 244L – Prof. R.G. LongoriaDynamic Systems and Controls Laboratory
Department of Mechanical EngineeringThe University of Texas at Austin
1
I:Lg
R:RgGalvanometer Model
iG 1
I:J
R:B
C:1/Kr..
θ.
..λ h
θNeedlePosition
v
Concept of Analog Sensing
From Figliola and Beasley, “Theory and Design for Mechanical Measurements”, John Wiley and Sons, 1995.
The D’Arsonval meter movement isa basic EM device that responds toelectrical voltage or current signals.
Still in use, but digital measurement prevails.

ME 244L – Prof. R.G. LongoriaDynamic Systems and Controls Laboratory
Department of Mechanical EngineeringThe University of Texas at Austin
Digital Measurement Interface• The advent of the computer, and potential for very
broad application of digital analysis of data has made digital measurement of electrical signals very common.
• Some limitations of analog measurement also makes the digitizing of signals more attractive.
• Digitizing signals also has certain disadvantages that should be understood when specifying equipment for an application, and in using the equipment.
ME 244L – Prof. R.G. LongoriaDynamic Systems and Controls Laboratory
Department of Mechanical EngineeringThe University of Texas at Austin
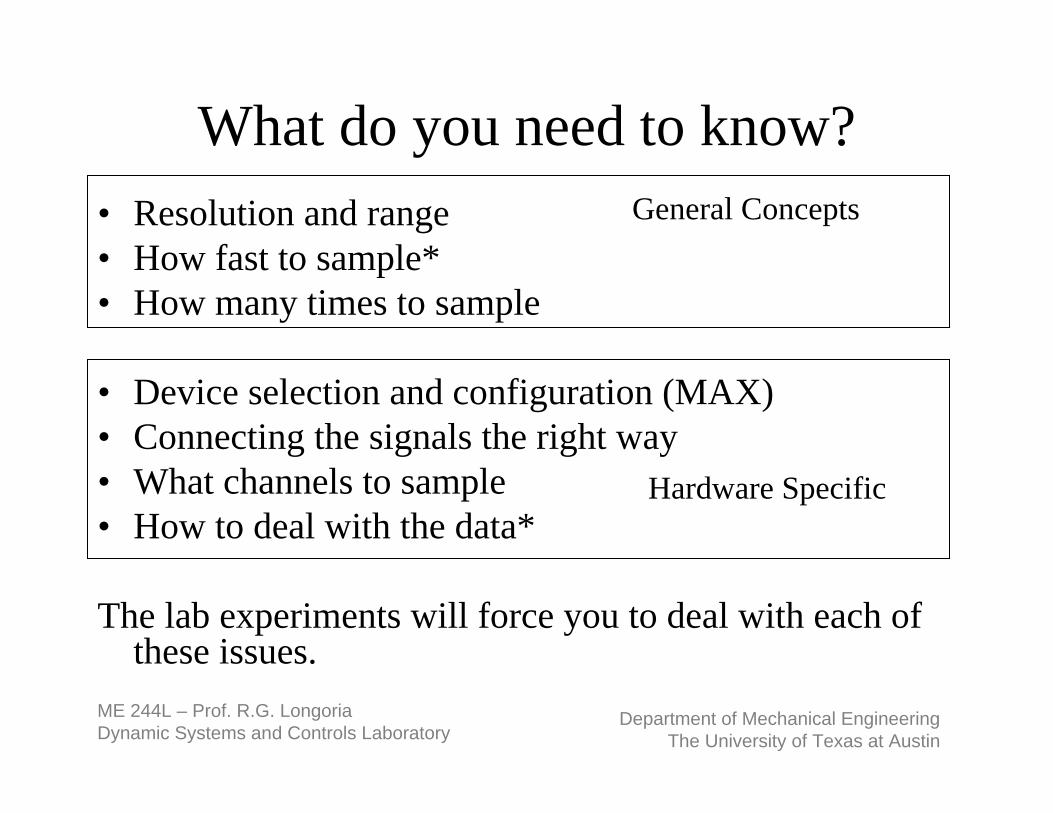
What do you need to know?• Resolution and range• How fast to sample*• How many times to sample
• Device selection and configuration (MAX)• Connecting the signals the right way• What channels to sample• How to deal with the data*
The lab experiments will force you to deal with each of these issues.
General Concepts
Hardware Specific
ME 244L – Prof. R.G. LongoriaDynamic Systems and Controls Laboratory
Department of Mechanical EngineeringThe University of Texas at Austin
General Concepts

ME 244L – Prof. R.G. LongoriaDynamic Systems and Controls Laboratory
Department of Mechanical EngineeringThe University of Texas at Austin
Sampling• Sampling - the act of acquiring data from an analog signal,
usually at discrete intervals of time
• Digital sampling requires that you specify how often in time, Δt, you measure a signal. We call this the sample rate, fs, where fs= 1/ Δt (units of samples/sec or Hertz, Hz).
• The sample rate must be selected by balancing two very basic objectives: 1) to minimize the amount of data you have to store,and 2) to retain sufficient information in the signal. Obviously, these requirements can vary considerably from one application to the next.

ME 244L – Prof. R.G. LongoriaDynamic Systems and Controls Laboratory
Department of Mechanical EngineeringThe University of Texas at Austin
Signal Quantization• Signal representation in the digital world is not only
discrete in time but also in amplitude. • The quantization of a sampled signal refers to how it
must take on a value dictated by the Q quantum levels 0, 1, 2, ..., Q-1.
• The spacing width or quantization interval is dictated by the maximum and minimum values and by then number of widths, ΔV = (max-min)/(Q-1).
• These quantities can be very important when you are trying to establish the error contributed by the sampling process.

ME 244L – Prof. R.G. LongoriaDynamic Systems and Controls Laboratory
Department of Mechanical EngineeringThe University of Texas at Austin
Signal Measurement Objectives• One of the most basic objectives is to be able to reproduce the
signal you sampled. • By “reproduce”, we mean that we want to retain in the digital
representation the parts of the signal that contain the information we need. It is convenient to think of those ‘parts’as frequency-based components.
• If you performed a Fourier series on a sampled signal, for example, you would hope to compute coefficients that would allow you to reconstruct a waveform that is a “good”representation of the original signal.
• It turns out that you can achieve this objective if you follow awell-known sampling theorem attributed to Nyquist.
ME 244L – Prof. R.G. LongoriaDynamic Systems and Controls Laboratory
Department of Mechanical EngineeringThe University of Texas at Austin
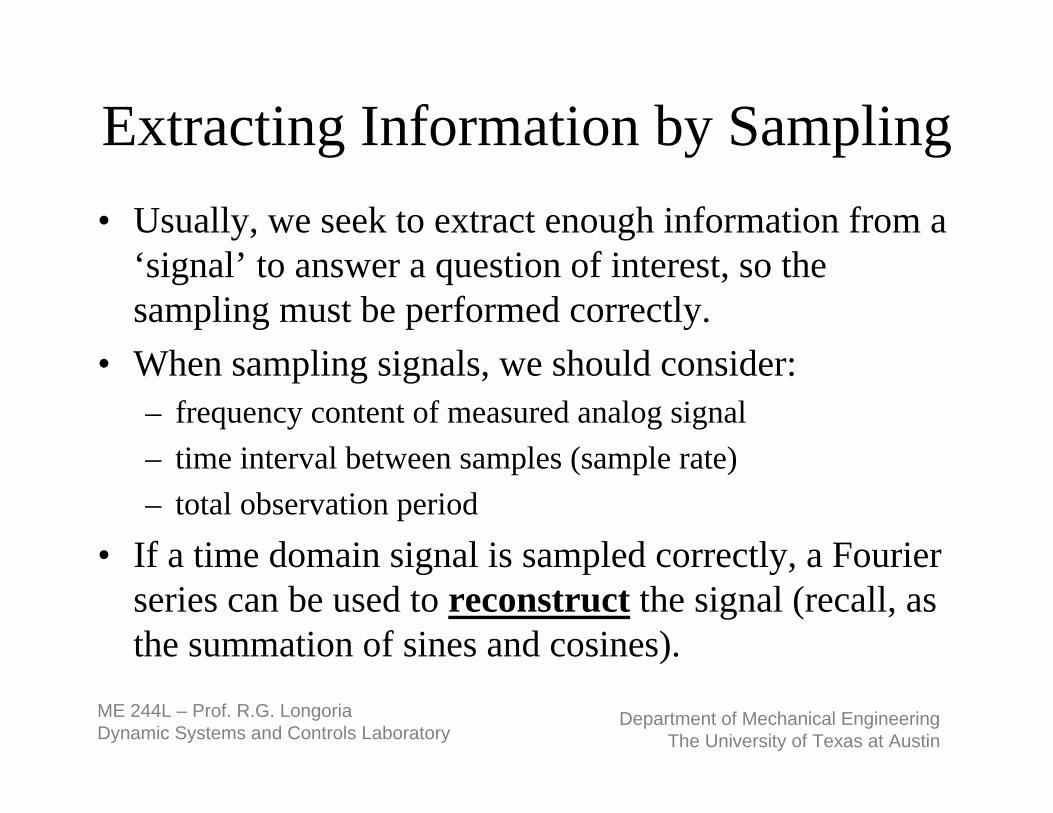
Extracting Information by Sampling• Usually, we seek to extract enough information from a
‘signal’ to answer a question of interest, so the sampling must be performed correctly.
• When sampling signals, we should consider:– frequency content of measured analog signal– time interval between samples (sample rate)– total observation period
• If a time domain signal is sampled correctly, a Fourier series can be used to reconstruct the signal (recall, as the summation of sines and cosines).

ME 244L – Prof. R.G. LongoriaDynamic Systems and Controls Laboratory
Department of Mechanical EngineeringThe University of Texas at Austin
Frequency Analysis Example6 (open) strings of a classical acoustic
guitar vibrate at the following frequencies: E2 string = 82.407 Hz, A2 string = 110. Hz, D3 string = 145.832 Hz, G3 string = 195.998 Hz, B3 string = 246.942 Hz, and E4 string = 329.628 Hz
(The number refers to the octave. Reference: H.F. Olson, "Music, Physics, and Engineering", Dover Publications, 1967).
The A string was plucked and the sound was monitored using a microphone.
The signal was fed directly into a National Instruments DAQCard-1200 and analyzed using an example spectrum analyzer virtual instrument in LabVIEW. (sample rate was 1000 samples/second): 109 Hz (slightly "flat"!)
ME 244L – Prof. R.G. LongoriaDynamic Systems and Controls Laboratory
Department of Mechanical EngineeringThe University of Texas at Austin
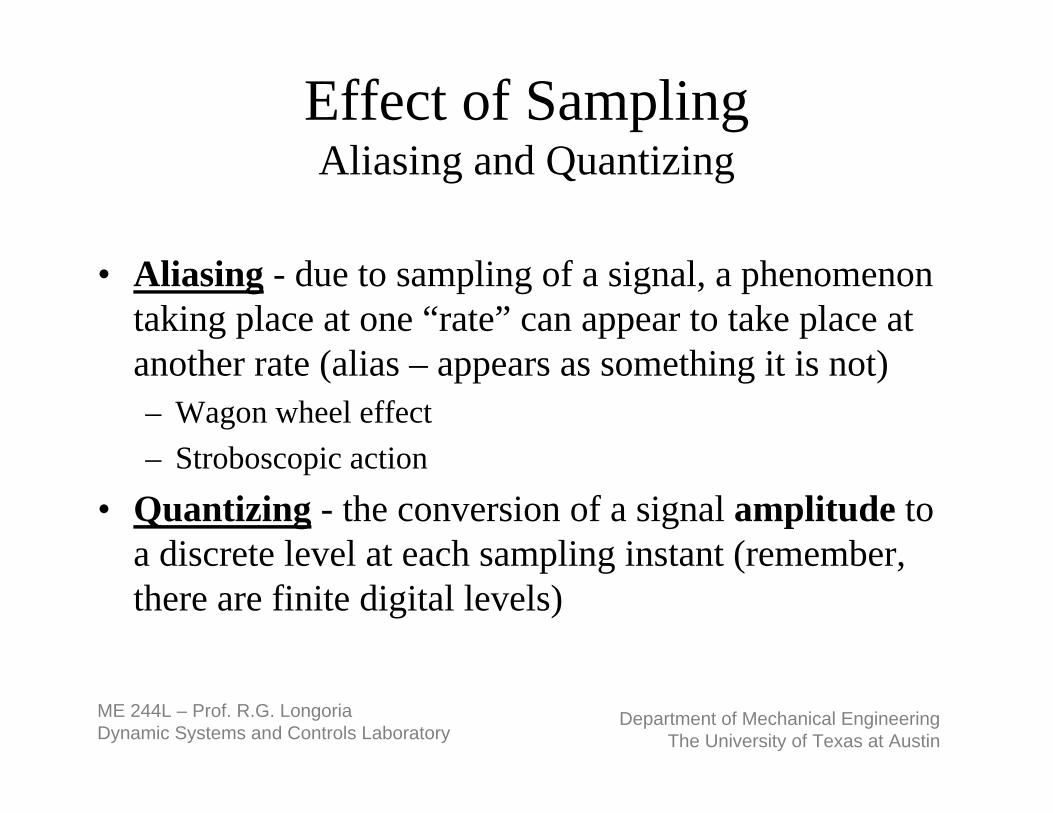
Effect of SamplingAliasing and Quantizing
• Aliasing - due to sampling of a signal, a phenomenon taking place at one “rate” can appear to take place at another rate (alias – appears as something it is not)– Wagon wheel effect– Stroboscopic action
• Quantizing - the conversion of a signal amplitude to a discrete level at each sampling instant (remember, there are finite digital levels)

ME 244L – Prof. R.G. LongoriaDynamic Systems and Controls Laboratory
Department of Mechanical EngineeringThe University of Texas at Austin
Selecting a Sample Rate (1)• We can “faithfully” reconstruct the signal if the
sampling frequency is at least two times the highest frequency present in the signal. This would be the Nyquist sampling rate, or
• Why not just sample as fast as possible all the time?– Too much information; have to store it all– Computer may need to do other things
2s mf f≥ ×

ME 244L – Prof. R.G. LongoriaDynamic Systems and Controls Laboratory
Department of Mechanical EngineeringThe University of Texas at Austin
Selecting a Sample Rate (2)
• Note, the sampling theorem dictates that you pay attention to the highest frequencies that might be present, not just those that are of interest.
• High frequencies that you don’t see can “creep” into the data. It is a common practice to low-pass filter(anti-aliasing filters) to reduce the effect, and to keep the sampling frequency low. This should be done using analog filters before you sample.
• Sometimes you want to over-sample. When?
ME 244L – Prof. R.G. LongoriaDynamic Systems and Controls Laboratory
Department of Mechanical EngineeringThe University of Texas at Austin
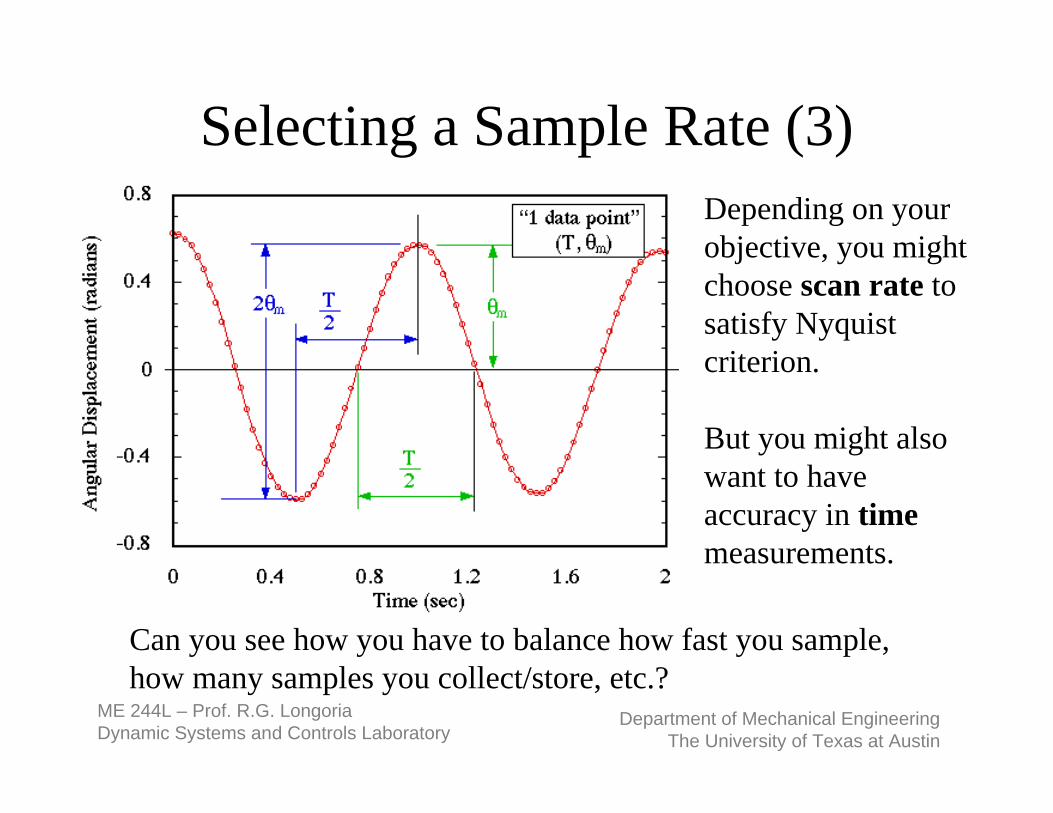
Selecting a Sample Rate (3)Depending on your objective, you might choose scan rate to satisfy Nyquistcriterion.
But you might also want to have accuracy in timemeasurements.
Can you see how you have to balance how fast you sample, how many samples you collect/store, etc.?
ME 244L – Prof. R.G. LongoriaDynamic Systems and Controls Laboratory
Department of Mechanical EngineeringThe University of Texas at Austin
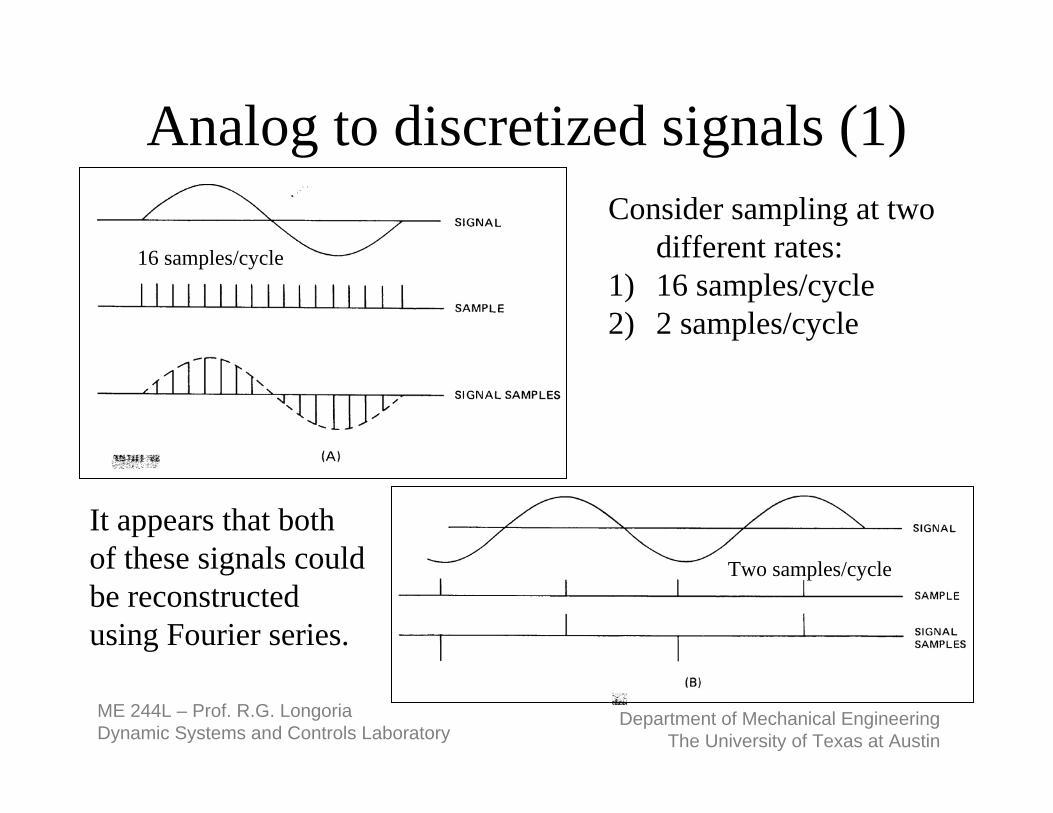
Analog to discretized signals (1)
16 samples/cycle
Two samples/cycle
Consider sampling at two different rates:
1) 16 samples/cycle2) 2 samples/cycle
It appears that both of these signals could be reconstructed using Fourier series.

ME 244L – Prof. R.G. LongoriaDynamic Systems and Controls Laboratory
Department of Mechanical EngineeringThe University of Texas at Austin
Analog to discretized signals (2)
1 sample per1.5 cycles
This sampling would not satisfy the Nyquist sampling theorem.
There are many illustrative examples (animations, etc.) of aliasing on the web.
Consider an alternate case:

ME 244L – Prof. R.G. LongoriaDynamic Systems and Controls Laboratory
Department of Mechanical EngineeringThe University of Texas at Austin
Analog-to-Digital Conversion• An A/D converter (ADC) converts an analog voltage
into a binary number through the process of quantization.
• ADCs have a full-scale voltage range (e.g., 10 V)• The number of bits dictates how many discrete levels
will be used to represent measured voltages.• For example, an 8-bit converter with a full-scale
voltage of 10 V will give you a resolution of 10V/256 which is 39.1 mV.

ME 244L – Prof. R.G. LongoriaDynamic Systems and Controls Laboratory
Department of Mechanical EngineeringThe University of Texas at Austin
A/D ConversionSignal entering the computer must be discretized in amplitude as well as time (sampling).Contrast n = 3 versus n = 16
3
16
102
102
1.25
0.152
VFSn V
VVmV
=⎧⎪Δ = = ⎨ =⎪⎩
Resolution:

ME 244L – Prof. R.G. LongoriaDynamic Systems and Controls Laboratory
Department of Mechanical EngineeringThe University of Texas at Austin
Summary on Sampling• The sampling theorem has a strict mathematical basis, but is
easy to understand and apply.• Don't just sample at the minimum rate, or Nyquist
frequency. This gives the minimum data to satisfy Nyquist. Sample at higher rates, limiting based on resources.
• Aliasing disables your ability to faithfully represent an observed signal using a digitized form. For example, if a sampled signallacks the correct frequency content, it becomes useless for further analysis.
• Quantization directly influences measurement uncertainty because of resolution.

ME 244L – Prof. R.G. LongoriaDynamic Systems and Controls Laboratory
Department of Mechanical EngineeringThe University of Texas at Austin
Hardware Concepts
ME 244L – Prof. R.G. LongoriaDynamic Systems and Controls Laboratory
Department of Mechanical EngineeringThe University of Texas at Austin
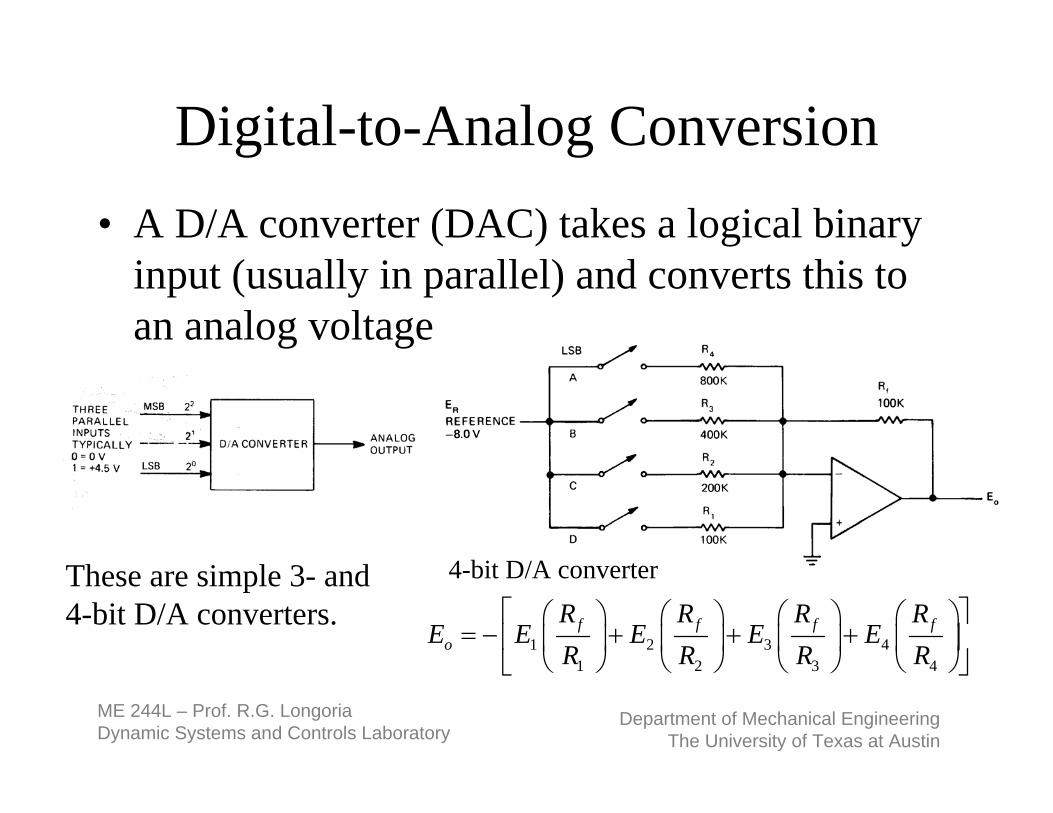
Digital-to-Analog Conversion• A D/A converter (DAC) takes a logical binary
input (usually in parallel) and converts this to an analog voltage
These are simple 3- and 4-bit D/A converters.
1 2 3 41 2 3 4
f f f fo
R R R RE E E E E
R R R R⎡ ⎤⎛ ⎞⎛ ⎞ ⎛ ⎞ ⎛ ⎞
= − + + +⎢ ⎥⎜ ⎟⎜ ⎟ ⎜ ⎟ ⎜ ⎟⎝ ⎠ ⎝ ⎠ ⎝ ⎠⎝ ⎠⎣ ⎦
4-bit D/A converter

ME 244L – Prof. R.G. LongoriaDynamic Systems and Controls Laboratory
Department of Mechanical EngineeringThe University of Texas at Austin
DAC Performance Specifications (1)
• The output voltage can only take on a discrete number of values = 2n.
• Common DACs have n = 8, 10, or 12-bit.• The resolution will be based on the reference voltage.
– Example 1: 4-bit DAC can take on 16 levels. If Vref = 5 volts, then the resolution is 5/16 volts, or 0.3125 volts.
– Example 2: 8-bit DAC having a 10 V reference has a resolution of 39.06 mV.

ME 244L – Prof. R.G. LongoriaDynamic Systems and Controls Laboratory
Department of Mechanical EngineeringThe University of Texas at Austin
DAC Performance Specifications (2)
• DACs will have a settling time (time to reach final value)
• Slew rate is the maximum rate of change a DAC can produce (e.g.,
• No of channels• Voltage range

ME 244L – Prof. R.G. LongoriaDynamic Systems and Controls Laboratory
Department of Mechanical EngineeringThe University of Texas at Austin
Analog-to-Digital Conversion• The A/D converter (ADC) converts an analog voltage into a
binary number through the process of quantization.
• The ADC will have a full-scale voltage range over which it can operate.
• The number of bits will dictate how many discrete levels will be used to represent measured voltages.
• For example, an 8-bit converter with a full-scale voltage of 10 V will give you a resolution of 10V/256 which is 39.1 mV.
ME 244L – Prof. R.G. LongoriaDynamic Systems and Controls Laboratory
Department of Mechanical EngineeringThe University of Texas at Austin
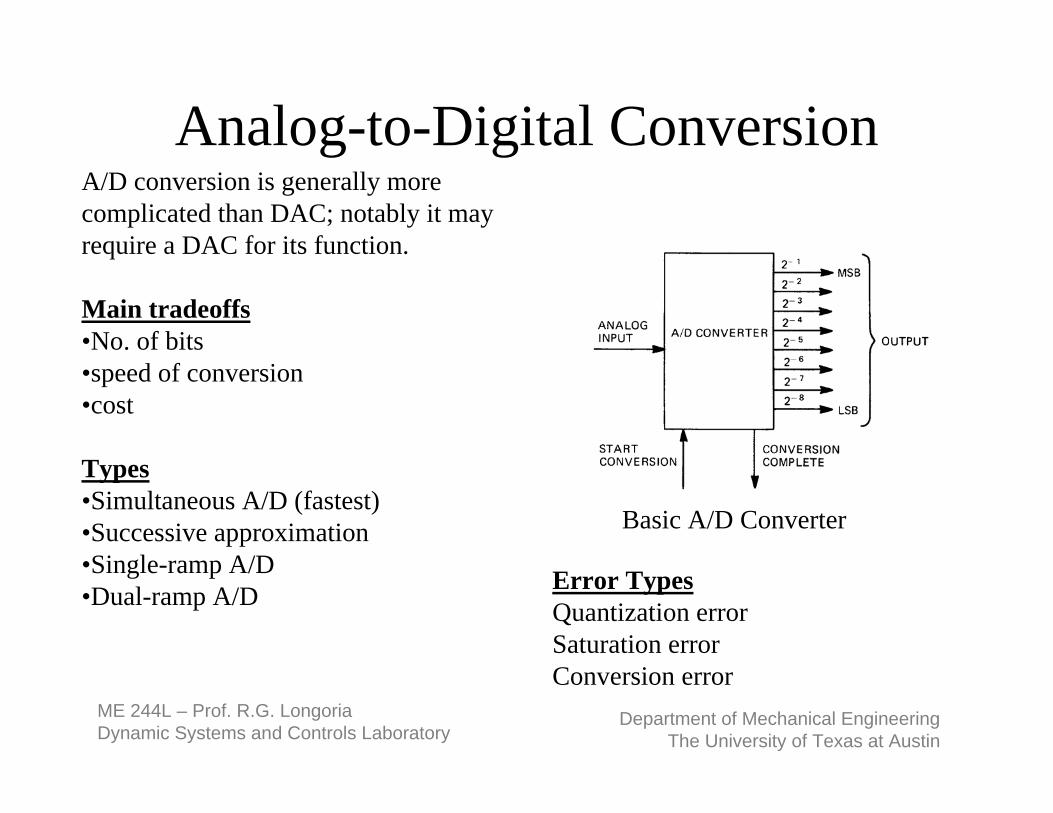
Analog-to-Digital Conversion
Basic A/D Converter
A/D conversion is generally more complicated than DAC; notably it may require a DAC for its function.
Main tradeoffs•No. of bits•speed of conversion•cost
Types•Simultaneous A/D (fastest)•Successive approximation•Single-ramp A/D•Dual-ramp A/D Error Types
Quantization error Saturation error Conversion error

ME 244L – Prof. R.G. LongoriaDynamic Systems and Controls Laboratory
Department of Mechanical EngineeringThe University of Texas at Austin
Analog-to-Digital Conversion
Successive Approximation Type
•Most common•Relatively little hardware to make.•Predictable conversion rate (2 to 100 microseconds)

ME 244L – Prof. R.G. LongoriaDynamic Systems and Controls Laboratory
Department of Mechanical EngineeringThe University of Texas at Austin
Basic Ramp Type of ADC
“Counter-ramp” type
•For slowly varying signals•Used in DMMs.•Long conversion times (100 milliseconds)•Also called “integrating type”.
The analog input is converted to a time interval by a very linear ramp generator, and this time interval ismeasured by a digital counter. The final counter numberis the output.

ME 244L – Prof. R.G. LongoriaDynamic Systems and Controls Laboratory
Department of Mechanical EngineeringThe University of Texas at Austin
A/D Converter in DMM
From “Using Your Meter”by A.J. Evans, Master Publishing, Inc., 1994.
Although it is nothard to find an analogmultitester, digitaldevices are much morecommon.
In a DMM, signalconditioners convert the quantity under measure into a voltage to be read by an A/D converter.

ME 244L – Prof. R.G. LongoriaDynamic Systems and Controls Laboratory
Department of Mechanical EngineeringThe University of Texas at Austin
Sample and Hold
A sample and hold circuitwill assure that the ADChas a constant voltage to“convert”.
This can improve the performance (of ramp typeADCs), but there arelimitations.
The circuit can have some“droop”.

ME 244L – Prof. R.G. LongoriaDynamic Systems and Controls Laboratory
Department of Mechanical EngineeringThe University of Texas at Austin
Sample and Hold in Multiplexing
It can be less expensive tohave several SAH circuitsthat feed a multiplexer, whichin turn switches the inputs toa single ADC.

ME 244L – Prof. R.G. LongoriaDynamic Systems and Controls Laboratory
Department of Mechanical EngineeringThe University of Texas at Austin
ADC Specifications• Conversion time.• The quantizing effect will always introduce some
error, so no. of bits can be critical and determines resolution.
• No. of channels• Range• Acquisition time applies to a sample and hold (time to
come within certain % of final value)• Holding time (for sample and hold)

ME 244L – Prof. R.G. LongoriaDynamic Systems and Controls Laboratory
Department of Mechanical EngineeringThe University of Texas at Austin
Data Acquisition (DAQ) Systems• Generalized concept of a data collection
scheme

ME 244L – Prof. R.G. LongoriaDynamic Systems and Controls Laboratory
Department of Mechanical EngineeringThe University of Texas at Austin
Data Acquisition (DAQ) Systems
National Instrumentsconcept drawing
Modern DAQ systems integrate software and hardware.
Signal conditioning provides a buffer between real world signals and computer-based circuits.
ME 244L – Prof. R.G. LongoriaDynamic Systems and Controls Laboratory
Department of Mechanical EngineeringThe University of Texas at Austin
Data Acquisition Components• Signal Conditioning • Filters• Amplifiers• Multiplexers A/D and D/A • CPU/Controller • Memory/Bus/Buffers/etc.. • Refer to any book on basic measurements,
which usually feature discussion on DAQ.
ME 244L – Prof. R.G. LongoriaDynamic Systems and Controls Laboratory
Department of Mechanical EngineeringThe University of Texas at Austin
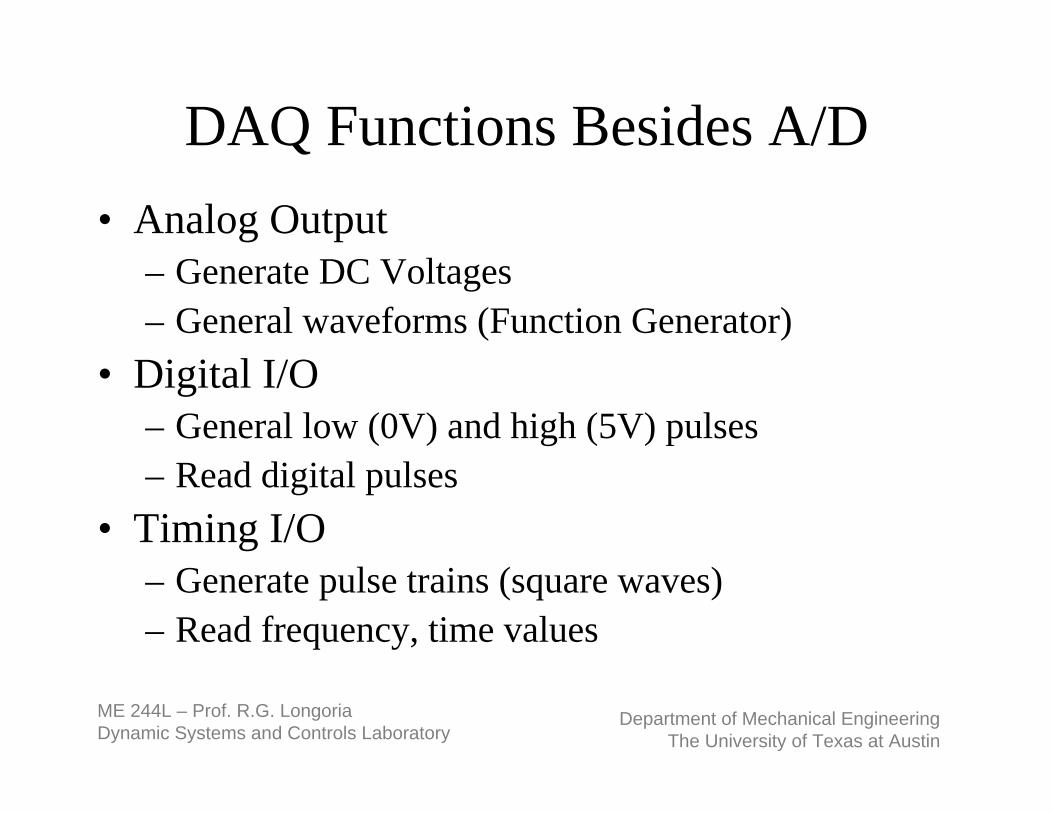
DAQ Functions Besides A/D• Analog Output
– Generate DC Voltages– General waveforms (Function Generator)
• Digital I/O– General low (0V) and high (5V) pulses– Read digital pulses
• Timing I/O– Generate pulse trains (square waves)– Read frequency, time values

ME 244L – Prof. R.G. LongoriaDynamic Systems and Controls Laboratory
Department of Mechanical EngineeringThe University of Texas at Austin
DAQ Boards• I/O Boards on PCs
– Bus specific– e.g., PCMIA, PCI
• These boards plug right into the computer chassis and offer many advantages such as speed, versatility, multi-function (A/D, D/A, digital I/O, etc).
ME 244L – Prof. R.G. LongoriaDynamic Systems and Controls Laboratory
Department of Mechanical EngineeringThe University of Texas at Austin
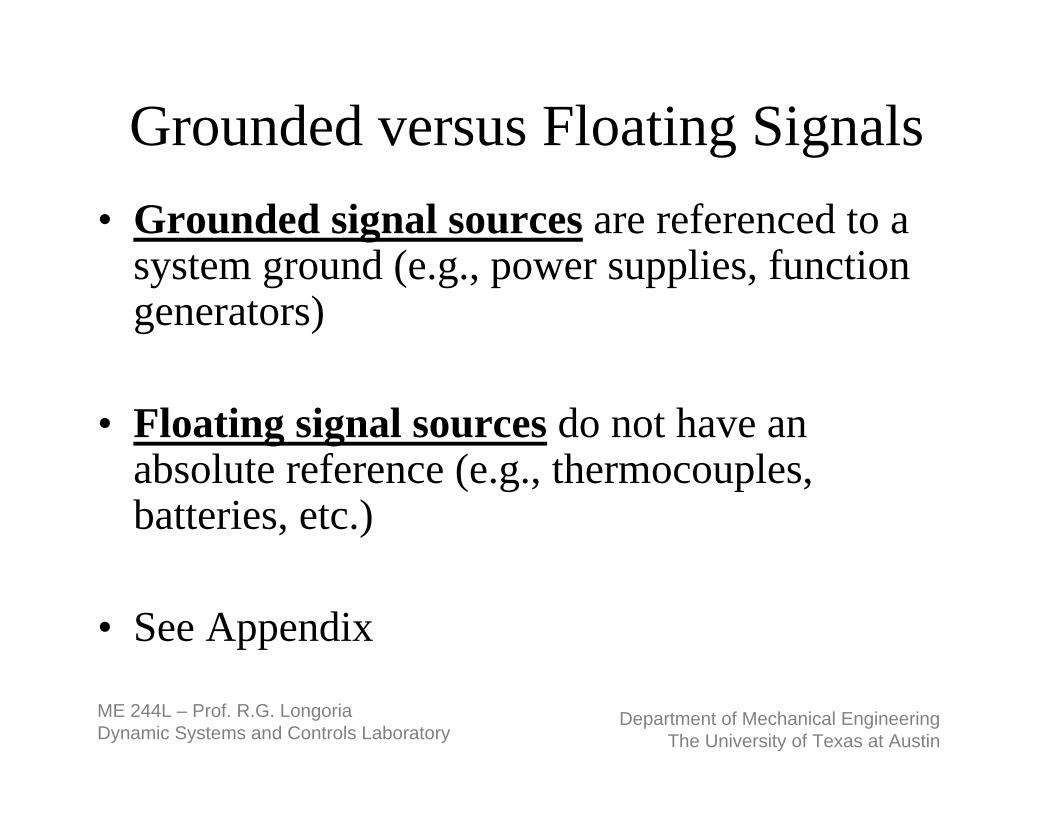
Grounded versus Floating Signals• Grounded signal sources are referenced to a
system ground (e.g., power supplies, function generators)
• Floating signal sources do not have an absolute reference (e.g., thermocouples, batteries, etc.)
• See Appendix

ME 244L – Prof. R.G. LongoriaDynamic Systems and Controls Laboratory
Department of Mechanical EngineeringThe University of Texas at Austin
Connecting Signals to DAQ BoardsWhen using a DAQ board, it is very helpful to
understand the following concepts• Single-ended connections• Common-mode voltage• Ground loops• Differential-ended connections• Signal-conditioning modules
Some of these are explained in following slides.

ME 244L – Prof. R.G. LongoriaDynamic Systems and Controls Laboratory
Department of Mechanical EngineeringThe University of Texas at Austin
Single-Ended Connections• Referenced single-ended (RSE) connections
are used in measurement systems when measuring relative to “building ground”.
• Non-referenced single-ended (NRSE) connections assume all the signals are grounded to a common reference.
• Single-ended connections have the advantage of sharing a ground, and on a DAQ board will not take up a channel like differential connections.
ME 244L – Prof. R.G. LongoriaDynamic Systems and Controls Laboratory
Department of Mechanical EngineeringThe University of Texas at Austin
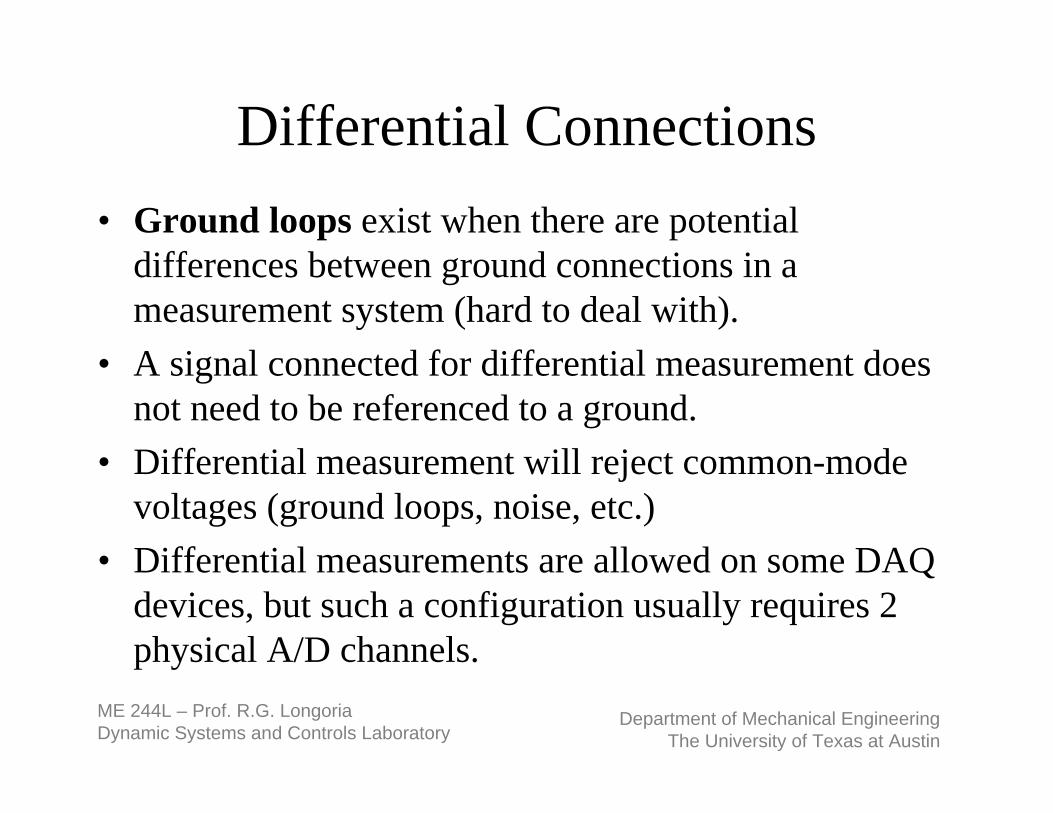
Differential Connections• Ground loops exist when there are potential
differences between ground connections in a measurement system (hard to deal with).
• A signal connected for differential measurement does not need to be referenced to a ground.
• Differential measurement will reject common-mode voltages (ground loops, noise, etc.)
• Differential measurements are allowed on some DAQ devices, but such a configuration usually requires 2 physical A/D channels.
ME 244L – Prof. R.G. LongoriaDynamic Systems and Controls Laboratory
Department of Mechanical EngineeringThe University of Texas at Austin
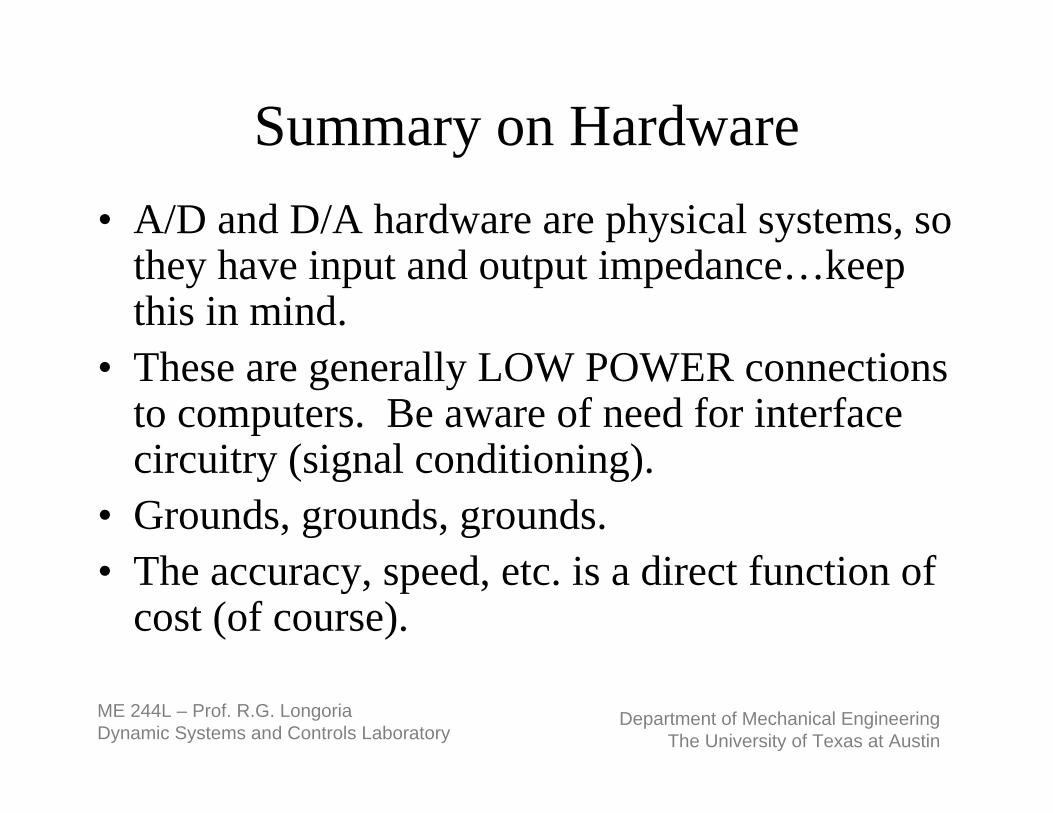
Summary on Hardware• A/D and D/A hardware are physical systems, so
they have input and output impedance…keep this in mind.
• These are generally LOW POWER connections to computers. Be aware of need for interface circuitry (signal conditioning).
• Grounds, grounds, grounds.• The accuracy, speed, etc. is a direct function of
cost (of course).

ME 244L – Prof. R.G. LongoriaDynamic Systems and Controls Laboratory
Department of Mechanical EngineeringThe University of Texas at Austin
Example InterfaceBNC-2120 from National Instruments

ME 244L – Prof. R.G. LongoriaDynamic Systems and Controls Laboratory
Department of Mechanical EngineeringThe University of Texas at Austin
Communications
ME 244L – Prof. R.G. LongoriaDynamic Systems and Controls Laboratory
Department of Mechanical EngineeringThe University of Texas at Austin
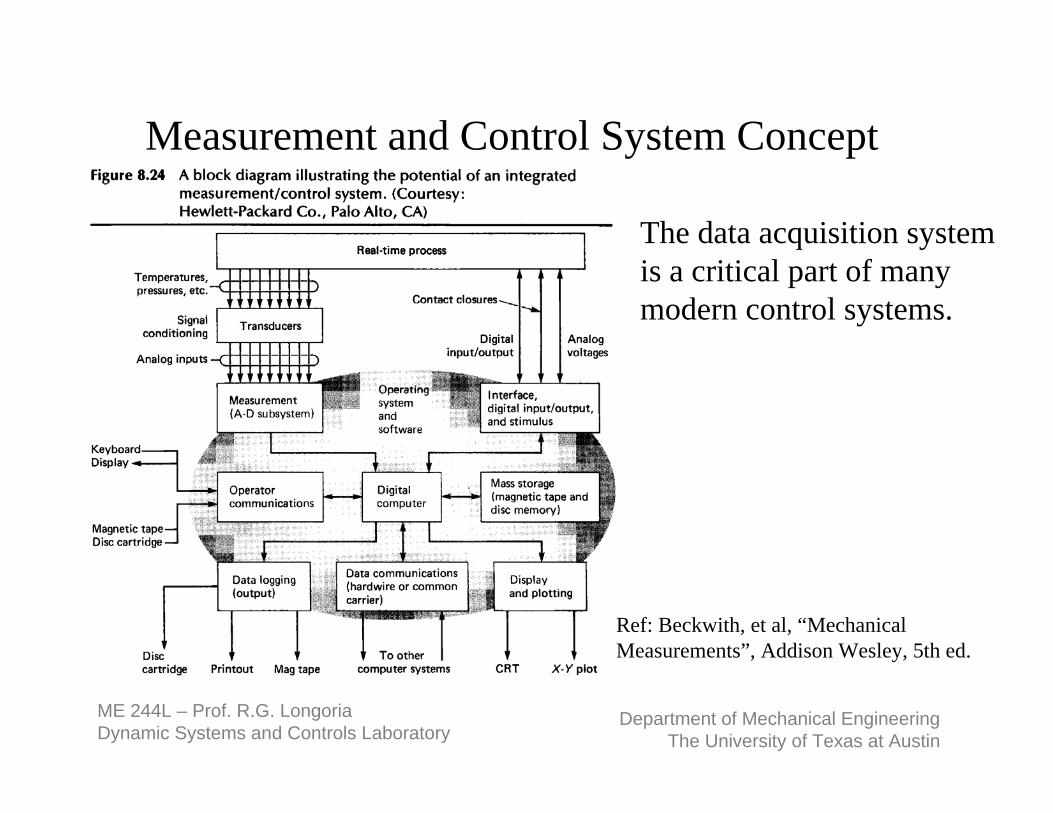
Measurement and Control System Concept
Ref: Beckwith, et al, “Mechanical Measurements”, Addison Wesley, 5th ed.
The data acquisition systemis a critical part of many modern control systems.

ME 244L – Prof. R.G. LongoriaDynamic Systems and Controls Laboratory
Department of Mechanical EngineeringThe University of Texas at Austin
Communication with Existing InstrumentsSerial, GPIB, and now USB (more and more common)!
Serial (RS-232C, RS-422A, etc.)
Parallel (GPIB, general purpose interface bus)
Advantage of using anexisting instrumentwhich probably has verygood measurement characteristics.

ME 244L – Prof. R.G. LongoriaDynamic Systems and Controls Laboratory
Department of Mechanical EngineeringThe University of Texas at Austin
GPIB Control of a Digital Scope
Computer-control of digital scope
The GPIB interface modulefor this Hewlett Packard scope allows communicationwith a PC and also adds new functions to the scope(e.g., FFT capability, signal analysis functions, etc.)

ME 244L – Prof. R.G. LongoriaDynamic Systems and Controls Laboratory
Department of Mechanical EngineeringThe University of Texas at Austin
GPIB (IEEE 488)•The general purpose interface bus (IEEE 488) is a parallel communication bus that allows up to 32 devices to be connected together.
•Any instrument with a GPIB interface has circuitry that communicates with the bus and local functions that can be executed using GPIB “commands”.
•This makes computer control of the instrument relatively easy.
•A controller is required (e.g., computer) on the bus, and it can receive signals from long distance (e.g., via modem, ethernet, etc.)
ME 244L – Prof. R.G. LongoriaDynamic Systems and Controls Laboratory
Department of Mechanical EngineeringThe University of Texas at Austin
Software

ME 244L – Prof. R.G. LongoriaDynamic Systems and Controls Laboratory
Department of Mechanical EngineeringThe University of Texas at Austin
Data Acquisition Software• At the core of computer-based instrumentation is control of the
hardware that communicates with the outside world (e.g., plug-in cards, external instruments, etc.) and hardware that performscommunication functions.
• This control is possible with software. • The lowest level of software control utilizes machine language,
and this used to be the only way that computers could be integrated with instrumentation.
• Low level control using the assembly language of the computer offers the fastest performance. However, the programming is not very easy.
ME 244L – Prof. R.G. LongoriaDynamic Systems and Controls Laboratory
Department of Mechanical EngineeringThe University of Texas at Austin
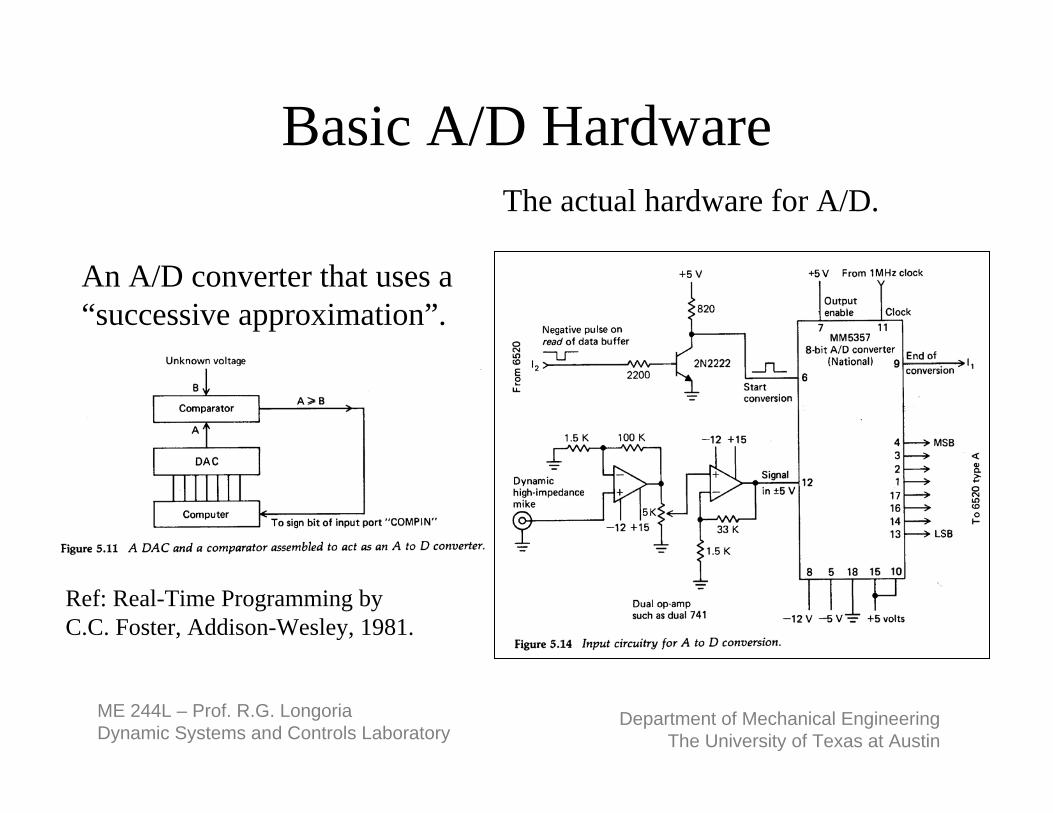
Basic A/D Hardware
An A/D converter that uses a“successive approximation”.
The actual hardware for A/D.
Ref: Real-Time Programming by C.C. Foster, Addison-Wesley, 1981.

ME 244L – Prof. R.G. LongoriaDynamic Systems and Controls Laboratory
Department of Mechanical EngineeringThe University of Texas at Austin
Low-Level Software for A/D
Assembly languagecode for a 6502 microprocessor (“ancient”) for controlling an A/D process.
This code/hardware could take on the order of 25 microseconds for an 8-bit conversion.Ref: Real-Time Programming by C.C. Foster,
Addison-Wesley, 1981.

ME 244L – Prof. R.G. LongoriaDynamic Systems and Controls Laboratory
Department of Mechanical EngineeringThe University of Texas at Austin
High-Level Software• High-level languages such as BASIC, FORTRAN, C,
etc., have also been used to program computer-based instrumentation functions.
• These languages do not directly support the functions required to control the base systems. Usually, a subroutine is available that can be called from a high-level language program. Subroutines then communicate information both ways.

ME 244L – Prof. R.G. LongoriaDynamic Systems and Controls Laboratory
Department of Mechanical EngineeringThe University of Texas at Austin
Software Solutions• Software programs exist that facilitate the programming of data
acquisition and control functions.• The LabVIEW program is one example of a graphical
programming environment. This program is widely used in industry, education, and government laboratories.
• Programs such as LabVIEW also offer very advanced analysis routines.
• The relative ease in developing very sophisticated programs tailored to a particular application has made graphical computer-based instrumentation software extremely popular.
• Some particulars of the LabVIEW program will be introduced in the lab.

ME 244L – Prof. R.G. LongoriaDynamic Systems and Controls Laboratory
Department of Mechanical EngineeringThe University of Texas at Austin
Summary• Most textbooks on ‘measurement’ have entire chapters
that review sampling, data acquisition, hardware, etc. For more information, check the library stacks
• National Instruments has extensive online discussion of data acquisition fundamentals: www.ni.com
• Check Omega Engineering also: www.omega.com• There are numerous other vendors that provide tutorial
information on the web.
ME 244L – Prof. R.G. LongoriaDynamic Systems and Controls Laboratory
Department of Mechanical EngineeringThe University of Texas at Austin
Appendix
Practical Steps in Using LabVIEW

ME 244L – Prof. R.G. LongoriaDynamic Systems and Controls Laboratory
Department of Mechanical EngineeringThe University of Texas at Austin
Practical Steps Using LabVIEW• Finding the hardware on the PC• Testing the hardware and its operation• Connecting signals to the DAQ hardware• Software approach

ME 244L – Prof. R.G. LongoriaDynamic Systems and Controls Laboratory
Department of Mechanical EngineeringThe University of Texas at Austin
Checking your hardware
Desktop Icon
MAX Window
In a LabVIEW environment, the Measurement and Automation Explorer (MAX) allows easy check of hardware.

ME 244L – Prof. R.G. LongoriaDynamic Systems and Controls Laboratory
Department of Mechanical EngineeringThe University of Texas at Austin
Test your hardwareFrom the MAX, you can test the hardware using a “Test Panel”. This makes it possible to determine if everything is running OK before you run a LabVIEW program.

ME 244L – Prof. R.G. LongoriaDynamic Systems and Controls Laboratory
Department of Mechanical EngineeringThe University of Texas at Austin
Connecting Signals to a System
Types of Measurement Systems:
1. Differential measurement system2. Referenced single-ended (RSE)3. Non-referenced single-ended (NRSE)
You may see these connection options on DAQ hardware.
ME 244L – Prof. R.G. LongoriaDynamic Systems and Controls Laboratory
Department of Mechanical EngineeringThe University of Texas at Austin
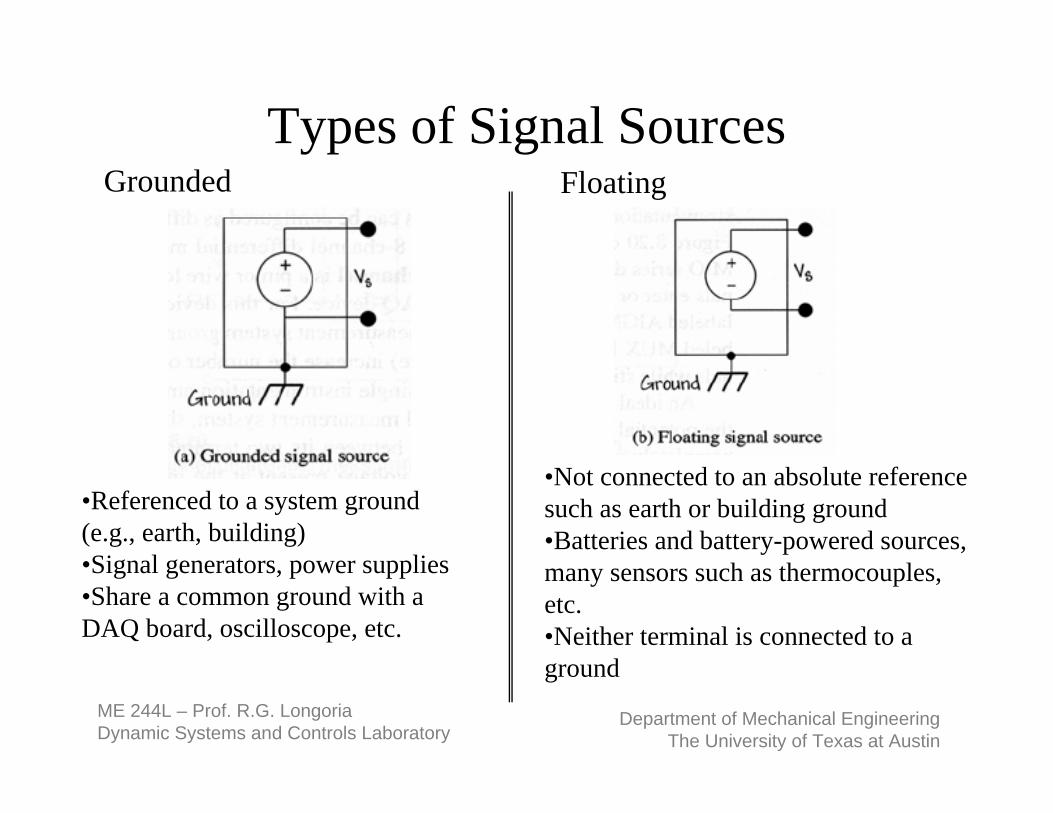
Types of Signal Sources
•Referenced to a system ground (e.g., earth, building)•Signal generators, power supplies•Share a common ground with a DAQ board, oscilloscope, etc.
•Not connected to an absolute reference such as earth or building ground•Batteries and battery-powered sources, many sensors such as thermocouples, etc.•Neither terminal is connected to a ground
Grounded Floating
ME 244L – Prof. R.G. LongoriaDynamic Systems and Controls Laboratory
Department of Mechanical EngineeringThe University of Texas at Austin
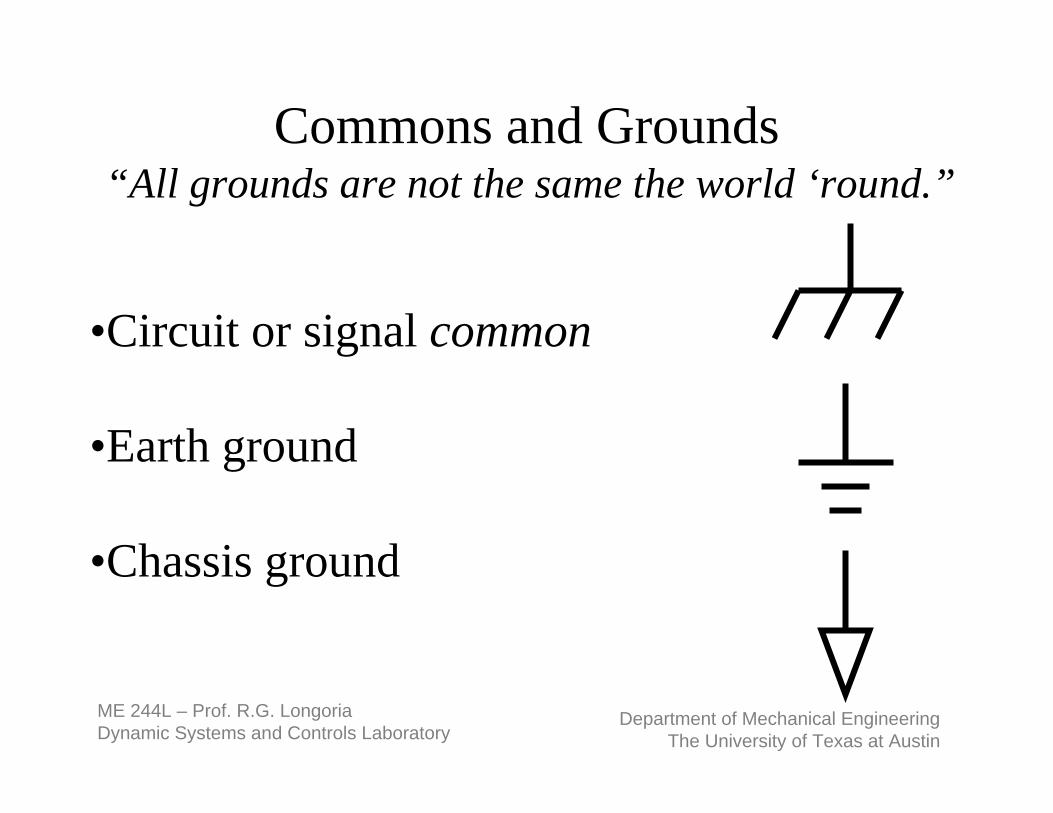
Commons and Grounds“All grounds are not the same the world ‘round.”
•Circuit or signal common
•Earth ground
•Chassis ground

ME 244L – Prof. R.G. LongoriaDynamic Systems and Controls Laboratory
Department of Mechanical EngineeringThe University of Texas at Austin
Software: Utilize LabVIEW• Virtual Instrument (VI) – a LabVIEW program• Front Panel – the user Interface of a LabVIEW
program (gray background)• Block Diagram – the code of a LabVIEW program
(white background)• Icon/Connector – the way to represent a VI within
another VI• Controls Palette – User Interface tools• Functions Palette – Programming tools• Tools Palette – Editing and debugging tools
ME 244L – Prof. R.G. LongoriaDynamic Systems and Controls Laboratory
Department of Mechanical EngineeringThe University of Texas at Austin
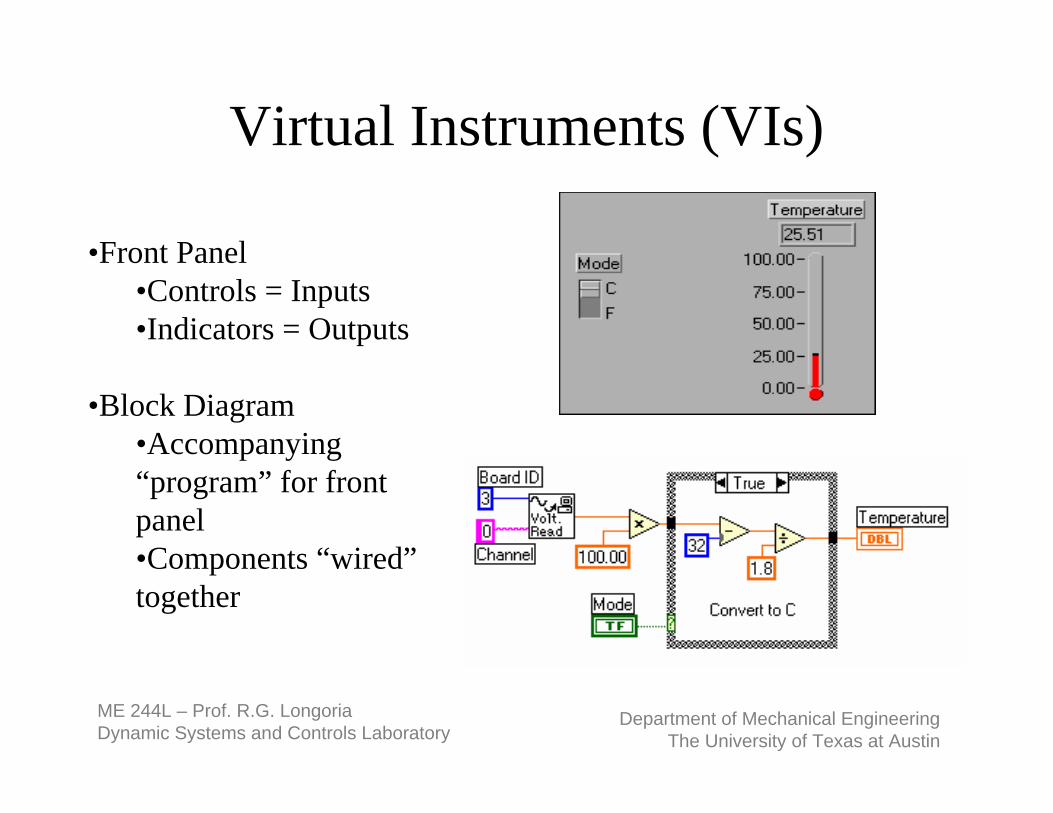
Virtual Instruments (VIs)
•Front Panel•Controls = Inputs•Indicators = Outputs
•Block Diagram•Accompanying “program” for front panel•Components “wired”together

ME 244L – Prof. R.G. LongoriaDynamic Systems and Controls Laboratory
Department of Mechanical EngineeringThe University of Texas at Austin
User Interface on Front Panel

ME 244L – Prof. R.G. LongoriaDynamic Systems and Controls Laboratory
Department of Mechanical EngineeringThe University of Texas at Austin
Function in the Block Diagram

ME 244L – Prof. R.G. LongoriaDynamic Systems and Controls Laboratory
Department of Mechanical EngineeringThe University of Texas at Austin
Icons and Connectors
icon
connector
terminals
An icon represents a VI in other block diagrams
A connector passes data to and receives data from a “subVI”through terminals
ME 244L – Prof. R.G. LongoriaDynamic Systems and Controls Laboratory
Department of Mechanical EngineeringThe University of Texas at Austin
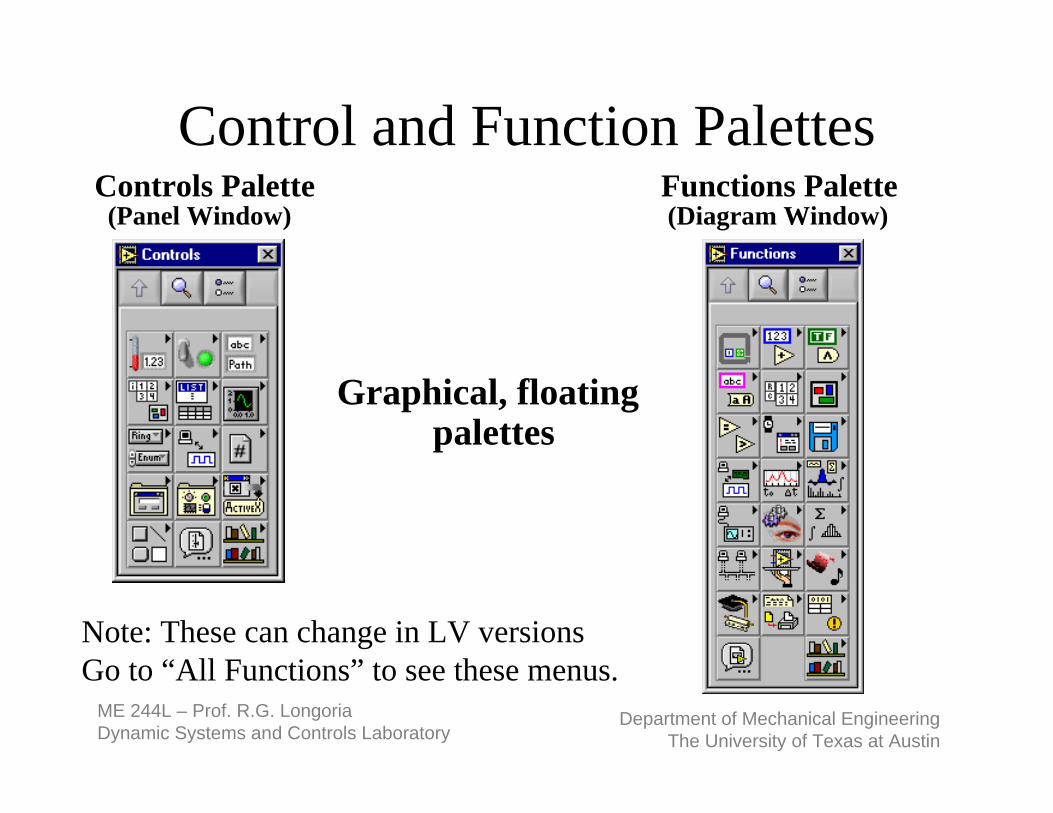
Control and Function Palettes
Graphical, floating palettes
Controls Palette(Panel Window)
Functions Palette(Diagram Window)
Note: These can change in LV versionsGo to “All Functions” to see these menus.

ME 244L – Prof. R.G. LongoriaDynamic Systems and Controls Laboratory
Department of Mechanical EngineeringThe University of Texas at Austin
Tools
Operating Tool
Positioning/Resizing Tool
Labeling Tool
• Editing and Debugging Tools
• Floating Palette
Wiring Tool
Coloring Tool

ME 244L – Prof. R.G. LongoriaDynamic Systems and Controls Laboratory
Department of Mechanical EngineeringThe University of Texas at Austin
The Front Panel and Diagram
ControlTerminals
Diagram Window
Panel Window
Indicator Terminals
Controls
Indicators

ME 244L – Prof. R.G. LongoriaDynamic Systems and Controls Laboratory
Department of Mechanical EngineeringThe University of Texas at Austin
Data types in LabVIEWScalar 1D Array
Numeric
Boolean
String
Orange (floating point)Blue ( integer)
Green
Purple
2D Array
Use your Wiring Tool to wireObjects of your block diagramTogether.

ME 244L – Prof. R.G. LongoriaDynamic Systems and Controls Laboratory
Department of Mechanical EngineeringThe University of Texas at Austin
Dataflow Programming• Block diagram does NOT execute left to right• Node executes when data is available to ALL input
terminals• Nodes supply data to all output terminals when done

ME 244L – Prof. R.G. LongoriaDynamic Systems and Controls Laboratory
Department of Mechanical EngineeringThe University of Texas at Austin
DAQ Functions Palette• The Data Acquisition
sub-palette is where all the DAQ programming tools are located.
• The tools we will most be interested in using are the Analog Input tools.

ME 244L – Prof. R.G. LongoriaDynamic Systems and Controls Laboratory
Department of Mechanical EngineeringThe University of Texas at Austin
This program acquires one DC voltage value from one channel.
This program acquires one DC voltage value each from multiple channels.
Single value DC measurements

ME 244L – Prof. R.G. LongoriaDynamic Systems and Controls Laboratory
Department of Mechanical EngineeringThe University of Texas at Austin
Multiple (Waveform) Acquisition
This program acquires one waveform from one channel.
This program acquires one waveform each from multiple channels.
There are inputs to these VIs that allow you to change the sampling rate, number of samples, etc.

ME 244L – Prof. R.G. LongoriaDynamic Systems and Controls Laboratory
Department of Mechanical EngineeringThe University of Texas at Austin
Single-point measurements

ME 244L – Prof. R.G. LongoriaDynamic Systems and Controls Laboratory
Department of Mechanical EngineeringThe University of Texas at Austin
Waveform measurements