digital imaging in pathology: whole-slide imaging and beyonddigital imaging in pathology:...
TRANSCRIPT

PM08CH13-Feldman ARI 13 December 2012 19:7
Digital Imaging in Pathology:Whole-Slide Imagingand BeyondFarzad Ghaznavi,1 Andrew Evans,2
Anant Madabhushi,3 and Michael Feldman4
1Department of Pathology and Laboratory Medicine, University of Toronto, Toronto,Ontario M5S 2S2, Canada; email: [email protected] Medicine Program, University Health Network, Toronto General Hospital,Toronto, Ontario M5G 2M9, Canada3Department of Biomedical Engineering, Laboratory for Computational Imaging andBioinformatics, Rutgers University, Piscataway, New Jersey 088544Department of Pathology and Laboratory Medicine, University of Pennsylvania School ofMedicine, Philadelphia, Pennsylvania 19104; email: [email protected]
Annu. Rev. Pathol. Mech. Dis. 2013. 8:331–59
First published online as a Review in Advance onNovember 15, 2012
The Annual Review of Pathology: Mechanisms ofDisease is online at pathol.annualreviews.org
This article’s doi:10.1146/annurev-pathol-011811-120902
Copyright c© 2013 by Annual Reviews.All rights reserved
Keywords
multispectral imaging, computer-assisted diagnostics, histocytometry,nonlinear dimensionality reduction
Abstract
Digital imaging in pathology has undergone an exponential period ofgrowth and expansion catalyzed by changes in imaging hardware andgains in computational processing. Today, digitization of entire glassslides at near the optical resolution limits of light can occur in 60 s.Whole slides can be imaged in fluorescence or by use of multispectralimaging systems. Computational algorithms have been developed forcytometric analysis of cells and proteins in subcellular locations by useof multiplexed antibody staining protocols. Digital imaging is unlockingthe potential to integrate primary image features into high-dimensionalgenomic assays by moving microscopic analysis into the digital age. Thisreview highlights the emerging field of digital pathology and exploresthe methods and analytic approaches being developed for the applica-tion and use of these methods in clinical care and research settings.
331
Ann
u. R
ev. P
atho
l. M
ech.
Dis
. 201
3.8:
331-
359.
Dow
nloa
ded
from
ww
w.a
nnua
lrev
iew
s.or
gby
Cas
e W
este
rn R
eser
ve U
nive
rsity
on
11/1
2/13
. For
per
sona
l use
onl
y.

PM08CH13-Feldman ARI 13 December 2012 19:7
DIGITAL PATHOLOGY ANDWHOLE-SLIDE IMAGINGSYSTEMS: AN OVERVIEW
Since the development of the first automated,high-resolution whole-slide imaging (WSI)system by Wetzel and Gilbertson in 1999(described in Reference 1), interest in usingWSI for different applications in pathologypractice has steadily grown (1–3). All currentWSI systems consist of illumination systems,microscope optical components, and a focusingsystem that precisely places an image on acamera. The final product, or virtual slide, canbe assembled in various ways, depending on theparticular scanner being used (tiling, line scan-ning, dual sensor scanning, dynamic focusing,or array scanning) (3). The result is a com-prehensive digital rendering of an entire glassslide, visible at resolutions of less than 0.5 μm,that can be examined with interactive softwareon a computer screen (4). The viewing softwareclosely emulates the performance characteris-tics of a light microscope in that the pathologistcan freely navigate a digital image of a histolog-ical section over a complete range of standardmagnifications (including oil immersion) andperform functions that have historically beencarried out with a light microscope. WSI tech-nology holds tremendous promise with respectto the digitization of pathology because it avoidsmany of the limitations imposed by earliermethods such as photomicroscopy (the cap-turing of selected representative images) androbotic microscopy (5). These approaches werelimited by several factors, including subopti-mal image quality, the inability of the viewingpathologist to see a high-resolution overview ofthe entire slide or to have control over its nav-igation, and the need for an extended amountof time to adequately review a slide (1, 3, 6–8).
Pathology, as with most medical specialties,is currently facing a growing demand toimprove quality, patient safety, and diagnosticaccuracy because there is an increasing empha-sis on subspecialization. These factors, coupledwith economic pressures to consolidate andcentralize diagnostic services, are driving the
development of systems that can optimizeaccess to expert opinion and highly specializedpathology services. Digital pathology networksbased on WSI systems provide a potentialsolution to all of these challenges and willundoubtedly play a critical role in this regardin the future (2). As with digital radiology, it isnow believed that transformation to a soft-copyreading environment is possible for pathologyas well. The emergence of more than 10 differ-ent WSI vendors over the past 5 years furtherindicates that pathology will eventually be-come a digital specialty. To date, however, theadoption of digital platforms by the pathologycommunity as a whole has been slow, and theapplications of WSI systems in pathology havebeen limited to education, research, and specificniches in clinical practice. Much work remainsto be done before WSI technology for diag-nostic purposes can be widely adopted (8–10).Arguably, the most important limiting factoris the perception among pathologists that WSIsystems are inferior in terms of performancewhen compared with light microscopes. Giventhat pathologists have carried out their workwith light microscopes for more than 100 years,WSI is considered a disruptive technology.
In this review, we focus primarily on thefactors that currently facilitate or impede theadoption of WSI systems in pathology. Wealso review the limited but growing literaturethat describes the validation of WSI systemsfor diagnostic purposes and the use of this tech-nology for actual patient care, multidisciplinarypatient conferences (tumor boards), quality-assurance (QA) activities, and education.
ADOPTION OF DIGITALPATHOLOGY SYSTEMS BYPATHOLOGISTS: FACILITATORSAND BARRIERS
One can easily identify advantages and disad-vantages to switching from glass slides and lightmicroscopes to WSI platforms. The adoptionof digital technology by the pathology com-munity has been slower than in radiology for
332 Ghaznavi et al.
Ann
u. R
ev. P
atho
l. M
ech.
Dis
. 201
3.8:
331-
359.
Dow
nloa
ded
from
ww
w.a
nnua
lrev
iew
s.or
gby
Cas
e W
este
rn R
eser
ve U
nive
rsity
on
11/1
2/13
. For
per
sona
l use
onl
y.

PM08CH13-Feldman ARI 13 December 2012 19:7
various reasons (11). Although pathology canlearn lessons from radiology concerning theswitch to digital reporting, there are key dif-ferences that prevent pathologists from sim-ply reapplying the digital radiology template.These differences include our need for colorimages and the data-storage challenges that arecreated when large volumes of slides are com-pletely digitized (12). In addition, radiology wasable to eliminate films and all of the hazardouschemicals associated with producing them (13).The same cannot be said for pathology, whereinglass slides must still be produced and stored aswell as scanned, which adds an extra step to theprediagnostic work flow.
Facilitators
Facilitators for the adoption of digital pathol-ogy can be considered in terms of cost savings,performance, work-flow efficiency, and accessto pathology services in underresourced lo-cations. The cost of replacing single-purposemicroscopes with multipurpose computersand monitors can be shared among variousdepartments as the number of WSI applica-tions increases within and between institutions,which should stimulate growth in investmentin this area over the next few years (7, 10,14, 15). Digital pathology systems are alsolikely to be more ergonomically friendly thanlight microscopes, a factor that led a group inKalmar, Sweden, to adopt the former technol-ogy to keep one of its members functioningas a pathologist (16). WSI systems can now beintegrated with laboratory information systemsto reduce errors related to specimen-patientmismatching. In terms of work-flow efficiency,WSI systems allow for more-streamlinednavigation of slides at all magnifications byeliminating disruptions that can occur when apathologist bumps a slide on the microscopestage (particularly when viewing a slide at highmagnification). Computer-aided diagnostictools will undoubtedly make pathologistsmore efficient and precise at quantifyinghistoprognostic factors such as mitotic figures.
Because relatively little is known about thecognitive factors that affect human perfor-mance in pathology practice, human-factorstudies using digital pathology platforms havebeen performed. These studies have focusedprimarily on understanding the diagnosticpathways used by virtual slide readers in orderto develop more usable interfaces for visual-ization of virtual slides, design more efficientdigital reading environments, and improve theaccuracy of digital slide interpretations (17, 18).It is more efficient to review virtual slides withresidents in sign-out situations that involvemore than one or two trainees. Residents canalso have access to annotated online educationmodules, which is particularly advantageous forthe independent study of rare or unusual caseswithout the need for a staff pathologist. Timeand motion studies have convincingly shownthat pathologists spend up to 15% of theirprofessional time matching slides to paper req-uisitions and looking for glass slides for signingout, second opinion, tumor boards, research,and resident teaching. WSI systems withonline digital archives have the potential togreatly reduce these inefficiencies and improvepathologist productivity (19, 20). Finally, WSIsystems have tremendous potential to provideaccess to subspecialty pathology services forremote locations that have limited or no on-sitepathology support. The digital approach obvi-ates both the costs and time delays associatedwith shipping glass slides between centers andthe risk of valuable slides being lost or dam-aged during transport. These potential benefitscertainly make WSI systems an attractive alter-native to traditional microscopy for a completespectrum of activities in clinical pathology (2).
Barriers
Despite the numerous advantages outlinedabove, many technical and practical issues mustbe overcome before pathology can follow radi-ology’s example in terms of going digital (11).These barriers can be considered in terms ofcost and required infrastructure, image qualityand speed of acquisition, data management,
www.annualreviews.org • Digital Imaging in Pathology 333
Ann
u. R
ev. P
atho
l. M
ech.
Dis
. 201
3.8:
331-
359.
Dow
nloa
ded
from
ww
w.a
nnua
lrev
iew
s.or
gby
Cas
e W
este
rn R
eser
ve U
nive
rsity
on
11/1
2/13
. For
per
sona
l use
onl
y.

PM08CH13-Feldman ARI 13 December 2012 19:7
standards, and regulatory approval, as well aspathologists’ concerns with respect to inferiorperformance.
The cost of purchasing, implementing, andmaintaining a WSI system can be prohibitive,depending on the scope of the digital pathologyservice under consideration, and especiallyfor small pathology groups in nonacademicinstitutions or in situations where a compellingbusiness case cannot be made. Apart from thecost of scanners (in excess of US$100,000–150,000 apiece), one must consider the costassociated with training of pathology staffand lab personnel, service contracts, tech-nical support during the installation phaseand ongoing use, digital slide storage andretrieval, and regulatory or licensure issuesthat may have to be addressed. There is alsothe possibility that labs will have to retrofittedwith bar-code tracking systems, particularly ifthe WSI platform is to be integrated with adepartmental laboratory information system.
Although robust, high-throughput slidescanners are now commercially available, theirscanning speed and the acquisition of consis-tently well-focused digital slides are shortcom-ings (1, 4). Vendors in the digital pathology
space are acutely aware of the need for fast WSIsystems that provide image quality that matchesor exceeds the visual experience obtained withlight microscopy, and there has been progressin this area. Today’s scanners can be loadedwith 400 or more slides and can scan slides con-tinuously; however, round-the-clock operationof multiple scanners is required to completelydigitize the slide volumes of a typical academicpathology department (12), and rescanning isrequired for a variable percentage of slides.More than 1 min is still required to scan a typi-cal 1.5 × 1.5 cm section at 20× magnification.Most image-quality problems are focus related,and many can be traced back to the quality of thehistologic section that was placed in the scan-ner. With current WSI technology, the qualityof the slides to be scanned must be optimized interms of uniform section thickness, placementof the section in the center of the slide suchthat it is completely covered by the coverslip,avoiding the creation of chatter artifact and tis-sue folds during microtomy, and avoiding thecreation of air bubbles during coverslipping.All of these irregularities can adversely affectthe focus and image quality of adjacent areason the resulting virtual slide (Figures 1 and 2).
a bMounting mediawith dirt
Edge ofcoverslipEdge ofcoverslip
Figure 1Representative examples showing the limitations imposed by suboptimal slide quality on the quality of imagesproduced by whole-slide imaging devices. (a) Excess mounting media (with attached dirt) on the top of thecoverslip adversely affect the focus of adjacent tissue. Dirty slides, such as this section from a seminoma,should be cleaned prior to scanning. (b) The coverslip on this kidney section has shifted, leaving the left edgeof the section uncovered and out of focus. The coverslip should be reapplied and the slide rescanned.
334 Ghaznavi et al.
Ann
u. R
ev. P
atho
l. M
ech.
Dis
. 201
3.8:
331-
359.
Dow
nloa
ded
from
ww
w.a
nnua
lrev
iew
s.or
gby
Cas
e W
este
rn R
eser
ve U
nive
rsity
on
11/1
2/13
. For
per
sona
l use
onl
y.

PM08CH13-Feldman ARI 13 December 2012 19:7
a b
Tissue fold
Air bubbleAir bubble
Figure 2Representative examples showing the limitations on image quality imposed by suboptimal histologicprocessing of frozen sections read by whole-slide imaging. (a) A prominent tissue fold in this frozen sectionhas adversely affected the focus of the top half of the image. Depending on the slide scanner being used, onemust pay careful attention to avoiding the inclusion of tissue folds in the focus map that is generated prior tothe scanning process. The alternative is to get a recut section without tissue folds. (b) Air bubbles likewisecause the affected area to be completely out of focus, rendering that portion of the slide unsuitable forassessment.
A recent study by Bautista & Yagi (21) investi-gated an automated method for detecting andavoiding these suboptimal areas during thefocus-mapping stage of scanning; however,more work is required before this processcan become successfully integrated into WSIscanners. Not all WSI systems can performreal-time multiplanar focusing to compensatefor suboptimally focused areas. Although vir-tual focusing is now technically feasible, slidesneed to be scanned at multiple focal planes,which generates enormous image files (22, 23).For these reasons, current WSI systems are notsuitable for reading cytology slides, whereinmultiplanar focusing is frequently required toexamine three-dimensional details of cells andcell clusters (24).
Development of an effective data-management system that can handle hugeamounts of data (terabytes to petabytes),provide a streamlined image-retrieval process,and ensure security with currently availablemedical information systems remains an area ofconcern (9, 15, 25). Due to rapid technologicaladvances in the area of digital processing andstorage and the availability of effective com-pression algorithms, current difficulties related
to the management of digital slide archives canbe overcome. To illustrate this point, Huismanet al. (12) digitally archived all of the casesreported since November 2007 at UniversityMedical Center in Utrecht, Netherlands. Theyundertook this project primarily to aid patholo-gists in their preparation for clinicopathologicalconferences. Three 120-slide scanners wereused to continuously scan slides at 20× magni-fication with a JPEG compression ratio of 70.More than 2,000 slides were scanned per week,on average, and the file sizes for individualslides ranged between 5 MB and 3.9 GB.This process generated roughly 40 TB of dataannually, and by April 2009, the digital archivecontained approximately 150,000 slides.
The increasing emphasis on quality andaccuracy in pathology has created a growingneed for pathology departments to followbest-practice standards and standard operatingprocedures, particularly when introducing newtechnologies such as WSI. The CLIA (ClinicalLaboratory Improvements Act) requires alllaboratory tests to be validated; however, it isnot clear what part of examining a hematoxylinand eosin (H&E)-stained slide with a WSIsystem constitutes “the test” (5). The US Food
www.annualreviews.org • Digital Imaging in Pathology 335
Ann
u. R
ev. P
atho
l. M
ech.
Dis
. 201
3.8:
331-
359.
Dow
nloa
ded
from
ww
w.a
nnua
lrev
iew
s.or
gby
Cas
e W
este
rn R
eser
ve U
nive
rsity
on
11/1
2/13
. For
per
sona
l use
onl
y.

PM08CH13-Feldman ARI 13 December 2012 19:7
and Drug Administration (FDA) has not yetapproved the use of WSI systems for H&Ediagnosis, although the approval process hasbeen initiated by several WSI vendors. Guide-lines on monitor resolution and image qualityand standards, such as the Digital Imagingand Communications in Medicine [DICOM,Supplements 122 (26) and 145 (27)], to createinteroperability between WSI platforms, com-pression ( JPEG 2000), and retention of digitalslides used for diagnostic purposes are onlybeginning to appear (28). In addition, medi-colegal and licensure guidelines governing theuse of WSI systems for providing diagnosticservices across jurisdictional boundaries havenot yet been established. Because we are onlyjust entering the digital era in pathology,it is not surprising that there is a paucityof guidelines. It is also not surprising thatthe pathology community is guarded aboutadopting a technology that lacks best-practicebenchmarks.
Today’s pathologists are under increasingpressure to handle large volumes of cases in atimely manner while providing an increasinglylarge amount of histoprognostic information intheir consultation reports (especially in cancercases). The stakes are high in that definitivesurgical and medical treatments are based onthe information provided by pathologists. Insuch an environment, pathologists are naturallywary about adopting digital systems that theythink could both slow them down and increasethe possibility of diagnostic error (11). Anotherkey performance factor that remains to be eval-uated is the possibility of visual fatigue (over andabove that encountered with light microscopes)caused by signing out cases at a monitor for pro-longed periods of time (29). Computerized sim-ulations of a high-volume histology laboratorywork flow carried out by McClintock et al. (30)provide a quantitative assessment of the feasi-bility for the full adoption of WSI in pathologypractice. These authors’ results, together withthose from a study by Isaacs et al. (31), show thatimplementing WSI into high-volume pathol-ogy work flows has significant implications interms of extra work, cost, and time.
OVERCOMING THEPERCEPTION OF INFERIORPERFORMANCE: THE ROLE OFVALIDATION STUDIES
Even if most of the barriers are overcome,widespread adoption of WSI for primary diag-nosis will not occur as long as pathologists be-lieve that the performance of digital pathologysystems is inferior to that of light microscopy(11, 32). The information required to surmountthis important barrier can be obtained onlyby collecting objective data from well-designedvalidation studies that demonstrate the diag-nostic equivalence (if not the superiority) ofWSI systems to the light microscope. Such in-vestigations will be necessary to gain regulatoryapproval from agencies such as the FDA, as wellas to ensure pathologists’ confidence in the di-agnoses they make with these systems. In aneffort to standardize the validation process, theCollege of American Pathologists has draftedrecommendations on how to structure valida-tion studies (33).
There is a relative paucity of peer-reviewedliterature on validation studies for makingprimary diagnoses with WSI; however, newstudies are steadily appearing in abstract form.In terms of published papers, Jukic et al.(34) investigated intrapathologist diagnosticdiscrepancy rates and diagnostic certaintybetween glass and digital slides by having threepathologists review 101 cases (900 slides intotal from neoplastic and nonneoplastic cases)by both methods. They concluded that the useof WSI technology would not have adverselyaffected patient care or the diagnostic certaintyof each pathologist.
A recent study by Mooney et al. (35) as-sessed the diagnostic accuracy and acceptabilityof virtual slides in dermatopathology. Tenpathologists and dermatopathologists werepresented with a randomized series of 20 glassand virtual slides. These investigators found nosignificant differences in the diagnostic abilityof the participants between the two modalities(0.85 for digital versus 0.81 for conventionalmicroscopy; p = 0.286). Chargari et al. (36)
336 Ghaznavi et al.
Ann
u. R
ev. P
atho
l. M
ech.
Dis
. 201
3.8:
331-
359.
Dow
nloa
ded
from
ww
w.a
nnua
lrev
iew
s.or
gby
Cas
e W
este
rn R
eser
ve U
nive
rsity
on
11/1
2/13
. For
per
sona
l use
onl
y.

PM08CH13-Feldman ARI 13 December 2012 19:7
compared assessments of pathological featuresin a series of 816 prostate needle biopsycores from 69 consecutive patients by usingoptical microscopy and digital means. Theirresults showed no significant difference in thepercentage of biopsies in which cancer wasdetected (34.8% for conventional slides versus33.4% for digital slides). Gilbertson et al.(4) demonstrated that WSI can be used formaking routine diagnoses on genitourinary anddermatology cases. Although the three studypathologists raised concerns about areas onspecific virtual slides that were suboptimally fo-cused, this study reported complete agreementbetween WSI consensus diagnoses and goldstandard diagnoses based on light microscopy.In a retrospective study by Fine et al. (37),five reviewers examined 30 diagnostically chal-lenging prostate needle biopsies that requiredthe use of immunohistochemical stains. Thediagnostic performance of a WSI system wascompared with that of light microscopy basedon intra- and interobserver κ values, the timerequired to examine the cases, and informationgathered from poststudy focus group discus-sions. Intraobserver agreements were reportedas perfect for one reviewer, substantial forthree reviewers, and moderate for the remain-ing reviewer. Although diagnostic agreementbetween each pathologist and the gold standardranged from 0.52 to 0.73, agreement was in theexcellent range (κ = 0.817) when comparingconsensus WSI diagnoses with interpretationbased on light microscopy.
A pilot study of 15 cases in Kyoto, Japan,conducted by Tsuchihashi et al. (38) sug-gested that rapid and accurate frozen-sectiondiagnoses can be made by WSI. Fallon et al.(39) had two pathologists examine virtualslides created from 52 consecutive ovariantumor frozen-section cases that coveredbenign, malignant, and borderline tumors.Although the reviewing pathologists did nothave the full clinical information when theyreviewed the virtual slides, they reported 96%concordance between WSI and the originallight-microscopy diagnoses issued at the time
of surgery. Interestingly, in some cases theWSI diagnoses were more accurate than thosegiven at the time of surgery. Importantly,the discrepant cases were associated withwell-known interobserver variability issues andwere not considered to be a function of WSI.
Recently, Nielsen et al. (40) reported the di-agnostic performance of virtual microscopy forroutine histological diagnosis of skin tumors.Four pathologists who had limited experiencein the use of virtual slides rendered diagnoses on96 cases based on glass and digital sides (scannedat 20× magnification). They reported an over-all diagnostic accuracy of 89.2% for virtual mi-croscopy and 92.7% for light microscopy; theκ values were in the very good range for bothintra- and interobserver agreement. Diagnos-tic discrepancies between WSI and light mi-croscopy were attributed to the pathologists’lack of experience with the digital platform.These investigators concluded that it is feasi-ble to use WSI systems to make diagnoses onthe skin tumor types represented in the study.
A series of recent abstracts presented at the2011 US and Canadian Academy of Pathologymeeting has also provided encouraging valida-tion data. Ramey at al. (41) reported completediagnostic concordance of 91% between WSIand the original light-microscopy diagnosesissued for 72 consecutive frozen sections thatwere scanned at 20× magnification and subse-quently reviewed by eight pathologists on bothdesktop and laptop computers. The overall κ
value was 0.84. All the discrepancies were mi-nor in nature and would have had no impact onintraoperative management. The type of frozensection had no influence on performance. Ina companion abstract, the Ramey group (42)reported essentially identical results in terms ofconcordance when virtual slides of these frozensections were reviewed on a high-resolutionmobile device (an iPad). Finally, Reyes et al.(43) had three pathologists examine 103 breastneedle biopsies by WSI (20× magnificationscans) and light microscopy. These authorsreported no disagreements with respect todistinguishing benign from malignant diseases.
www.annualreviews.org • Digital Imaging in Pathology 337
Ann
u. R
ev. P
atho
l. M
ech.
Dis
. 201
3.8:
331-
359.
Dow
nloa
ded
from
ww
w.a
nnua
lrev
iew
s.or
gby
Cas
e W
este
rn R
eser
ve U
nive
rsity
on
11/1
2/13
. For
per
sona
l use
onl
y.

PM08CH13-Feldman ARI 13 December 2012 19:7
All disagreements were associated with casesdiagnosed as duct hyperplasia or atypical ducthyperplasia.
The validation studies summarized aboveindicate that WSI platforms can be used tomake diagnoses that are as accurate as thosemade by light microscopy. The emergingtheme from all of them is that when discrep-ancies between WSI and light-microscopydiagnoses arise, they tend to involve entitiesthat are known to be plagued by interobservervariability. However, the problems with thesestudies are that they are limited to specificapplications and that the results cannot begeneralized to all areas of surgical pathology.Validation studies that cover the entire spec-trum of cases and tissue types encountered insurgical pathology have not been performed,but will be required. A key issue, for which thereare currently no guidelines, is how to design theideal validation study. How many cases shouldthere be? What about the mix of cases? Howmany pathologists should there be? Is the endpoint diagnostic concordance, feature recogni-tion, or a combination of the two? What is anappropriate washout period between reviewingcases with WSI and light microscopy? Howdoes one control for intra- and interobservervariability? In how many different centers dothese studies need to be performed? These areonly some of the issues that need to be consid-ered, although it will probably be impossibleto design a single perfect validation study (44).
VALIDATION OF WHOLE-SLIDEIMAGING FOR USE INCONSULTATION MODELS
WSI technology is an obvious way to providerapid consultation services to hospitals thatlack on-site pathologists (45). The same wouldapply to solo pathologists in remote locations,who could benefit from expert consultationswithout having to incur courier costs, timedelays, and the risks of losing or damagingslides if they are shipped to a referral center(37, 39). The number of studies evaluatingWSI in consultation models is small; however,
available data are encouraging. Rodriguez-Urrego et al. (46) recently published the resultsof an inter- and intraobserver agreement studyin which four urologic pathologists comparedWSI with light microscopy with respect toassigning Gleason scores and identifyingother useful histoprognostic parameters in 50challenging prostate biopsies in a consultationsetting. Interobserver agreement in bothmethods was similar; the κ values ranged from0.35 to 0.65 for all parameters. Intraobserveragreement was very good to excellent; the κ
values for primary Gleason grade and Gleasonscore were >0.73. Tumor quantitation andperineural invasion also showed a high level ofinter- and intraobserver concordance. Theseinvestigators concluded that WSI platformswould be sufficient for providing reliableconsultation diagnoses on prostate biopsies.
A study by Wilbur et al. (47) looked at thefeasibility of using WSI systems to provide con-sultation diagnoses for challenging cases fromvarious anatomic sites. Fifty-three cases wereassessed by two subspecialty pathologists, oneusing light microscopy and the other usingWSI. They reported an overall concordance of91% between WSI and light microscopy; neo-plastic cases showed better concordance (93%)than did nonneoplastic cases (88%). Impor-tantly, these investigators noted difficulties withnavigation at high magnifications and in the in-terpretation of inflammatory or infectious le-sions when using WSI.
USE OF WHOLE-SLIDE IMAGINGFOR ACTUAL PATIENT CAREOUTSIDE OF VALIDATIONSTUDIES
Given the barriers described above, it shouldnot be surprising that the literature describ-ing the use of WSI systems for actual patientcare, so-called off-label use, is sparse. Isolatedabstracts have been presented that describe theuse of WSI in a subspecialty consultation net-work in the United States (48) and for makingprimary diagnoses in the setting of a small grouppathology practice in Kalmar, Sweden (16).
338 Ghaznavi et al.
Ann
u. R
ev. P
atho
l. M
ech.
Dis
. 201
3.8:
331-
359.
Dow
nloa
ded
from
ww
w.a
nnua
lrev
iew
s.or
gby
Cas
e W
este
rn R
eser
ve U
nive
rsity
on
11/1
2/13
. For
per
sona
l use
onl
y.

PM08CH13-Feldman ARI 13 December 2012 19:7
Starting in late 2006, Evans et al. (7) at Uni-versity Health Network (UHN) in Toronto,Canada, have used WSI to make primaryfrozen-section diagnoses in the absence ofan on-site pathologist. UHN is a three-siteacademic institution in downtown Toronto.The pathology department is consolidated inone site, leaving two sites without regular on-site pathologists for frozen-section coverage.One site is located approximately 1 mile fromthe consolidated department; it generates a lowvolume of frozen sections (typically fewer than10 per week), the vast majority of which comefrom neurosurgery. WSI telepathology was im-plemented to deal with the inefficiencies as-sociated with sending a single pathologist tocover frozen sections and the quality issuesthat may arise when a lone pathologist is facedwith challenging cases in the absence of sup-port from a colleague. This program is the firstof its kind to use WSI for real-time diagno-sis in patient care. On the basis of experiencewith more than 2,000 cases as of December2011, single-block frozen sections are routinelyreported with a total turnaround time of 14to 16 min, with a deferral rate of ≤5% and adiscrepancy rate of ≤2% (when comparing in-traoperative WSI diagnoses with the diagnosesprovided by light microscopy at final sign-out).This program has leveraged the ability of WSIto enable real-time consultation on all cases inwhich the primary pathologist is consideringdeferring a frozen-section diagnosis. Patholo-gists have used WSI to make reliable interpre-tations of smears (or squash preps), which areoften important in intraoperative neuropathol-ogy. It has been their experience that 20× mag-nification scans are sufficient for assessing bothfrozen sections and smears, and image quality isnot a problem if well-prepared slides are placedin the scanner (Figure 3). Figure 4 showsan approach to scanning intraoperative smearslides that minimizes the area of the smear thatneeds to be scanned and optimizes the focusof cells at the diagnostic (thinnest) end of thesmear.
The WSI telepathology program at UHNhas recently been expanded to provide primary
frozen-section support, without incident, to ahospital 400 miles north of Toronto when thereis no on-site pathologist (A. Al Habeeb, A.Evans, S. Serra & R. Vajpeyi, unpublished ob-servations). This system also facilitates the in-troduction of quality measures, such as rapidconsultation between colleagues, when there isan on-site pathologist (3, 7).
MULTIDISCIPLINARY PATIENTCONFERENCES
Multidisciplinary conferences, or tumorboards, play a central role in decision makingfor quality cancer care. Although tumor boardsmay seem an obvious application for WSItechnology, there is, once again, a paucity ofliterature on the subject. Spinosa (49) provideda comprehensive overview of a pilot projectinvestigating the effectiveness of using WSI fortumor boards at Scripps Memorial HospitalLa Jolla in California. This study demonstratesbenefits such as increased efficiency for pathol-ogists when preparing cases for presentation,improved quality in terms of informationthat is presented to clinical colleagues, andincreased satisfaction on the part of all whoattend these meetings.
QUALITY ASSURANCE
All medical specialties face increasing pressureto improve quality and patient safety. In pathol-ogy, the public attitude has shifted towardexpectations of faster and more patient-centricsubspecialty service that minimizes diagnosticerrors (50–52). QA plays a central role in thisprocess, and indeed, a growing number ofinstitutions are adopting QA policies wherebya given percentage of cases must be indepen-dently reviewed by a second pathologist beforesign-out (1, 50). Several studies, using differentapproaches, have investigated the incidenceand characteristics of discrepancies betweenoriginal and second reviews when both areperformed using only glass slides. Manion et al.(53) reviewed 5,629 surgical pathology cases atthe University of Iowa Hospitals and Clinics
www.annualreviews.org • Digital Imaging in Pathology 339
Ann
u. R
ev. P
atho
l. M
ech.
Dis
. 201
3.8:
331-
359.
Dow
nloa
ded
from
ww
w.a
nnua
lrev
iew
s.or
gby
Cas
e W
este
rn R
eser
ve U
nive
rsity
on
11/1
2/13
. For
per
sona
l use
onl
y.

PM08CH13-Feldman ARI 13 December 2012 19:7
a b
c d
a b
c d
Figure 3Representative examples of the image quality that can be obtained from 20× magnification scans ofwell-prepared frozen sections and intraoperative smears. (a,b) A meningioma frozen section and a pairedsmear, respectively. (c,d ) A low-grade astrocytoma frozen section and a paired smear, respectively.
and found 132 (2.3%) major disagreements,of which 68 resulted in changes in clinicalmanagement. In a nonconcurrent cohort studyby Raab et al. (54), pathologists reviewed glassslides from a total of 7,824 in-house cases, ofwhich 7,444 were selected using a targeted 5%random review process and 380 were chosenfor focused review. The total number of dis-crepancies detected by random review was 222,of which 27 (12%) were considered major ( p <
0.001). Through the use of focused review, 12of 62 (19.4%) discrepant cases were consideredmajor ( p < 0.001). Published results based onreviews of outside material report discrepancyrates ranging from 1.4 to 11.3%; almost 60%of major discrepancies resulted in changes inclinical management (55).
QA is an area in which WSI technology canplay a critical enabling role. Digital pathology
networks can avoid costs and potential diffi-culties associated with transporting glass slidesbetween facilities. They can also be set up insuch a way that potential second-reviewer bias,in favor of or against the original diagnosis,can be minimized (1, 56).
One of the first pilot studies demonstratingthe potential of using WSI for QA purposescame from the University of PittsburghMedical Center in 2006. In this study byHo et al. (1), 24 full genitourinary pathologycases with significant diagnostic complexity(comprising 47 separate parts and 391 slides)were rereviewed by three pathologists usingWSI and traditional light microscopy. All ofthe reviewers had prior experience in readingdigital slides. Four clinically insignificantdiscrepancies were found, two of which werebased on the WSI review and two on light
340 Ghaznavi et al.
Ann
u. R
ev. P
atho
l. M
ech.
Dis
. 201
3.8:
331-
359.
Dow
nloa
ded
from
ww
w.a
nnua
lrev
iew
s.or
gby
Cas
e W
este
rn R
eser
ve U
nive
rsity
on
11/1
2/13
. For
per
sona
l use
onl
y.

PM08CH13-Feldman ARI 13 December 2012 19:7
b
a
cb
a
c
Thinner portionThinner portionThicker portion
Figure 4An approach to handling intraoperative smears (squash preps) by whole-slide imaging, as illustrated with ahigh-grade astrocytoma. (a) An overview of the entire smear. The area adjacent to the location where thetissue was placed on the slide prior smearing is thick (left), whereas the distal portion of the smear is muchthinner (right). (b) Including the thick portion on the smear in the area to be scanned creates a much largerdigital slide file, prolongs the scanning time, and produces a suboptimally focused image (in the absence ofthe ability to perform real-time multiplanar focusing). (c) Limiting the scanned area to the thinner, distalportion of the smear reduces scanning time and maximizes the image quality in terms of cytological detail atthe diagnostic end of the slide.
microscopy. No significant concerns wereraised by the study pathologists with respect toimage quality, and all of them agreed that WSIis a viable foundation on which to build a QAprogram in a multisite health care facility.
In a recently published review, Graham et al.(56) described a WSI-enabled QA programat the University of Arizona. This system isused to provide same-day QA reviews betweentwo hospitals located 6 miles apart in Tucson.One of these sites is a high-volume centerstaffed by several pathologists, whereas theother has a considerably lower volume of workand is staffed by a single part-time pathologist.
During daily QA conferences, all new cancercases and other difficult cases encountered atthe low-volume site are scanned and rereviewedby staff pathologists and pathology residentsat the larger site. This study has nicely shownthat the vast majority (>95%) of QA workbetween two or more centers can be performedusing WSI without having to transport glassslides. On the basis of QA of 329 cases betweenMarch 2006 and September 2008, there wascomplete diagnostic agreement in 91.8% ofthem. Minor discrepancies that would havehad no impact on patient care were noted in3% of the cases, and major discrepancies that
www.annualreviews.org • Digital Imaging in Pathology 341
Ann
u. R
ev. P
atho
l. M
ech.
Dis
. 201
3.8:
331-
359.
Dow
nloa
ded
from
ww
w.a
nnua
lrev
iew
s.or
gby
Cas
e W
este
rn R
eser
ve U
nive
rsity
on
11/1
2/13
. For
per
sona
l use
onl
y.

PM08CH13-Feldman ARI 13 December 2012 19:7
would have resulted in different treatmentwere found in 1.5%. In 1.8% of the cases, theQA diagnoses were deferred pending review ofthe original glass slides.
Another study conducted at the Universityof Arizona (51) described the performance ofa WSI-based same-day second-opinion servicefor 154 newly diagnosed breast cancers in afour-site institution. As with the earlier reportfrom Graham et al. (56), the vast majority(>95%) of QA work could be accomplishedusing digital slides. The breast cancer QAprogram identified a small number (1.9%) ofminor discrepancies. Major discrepancies thatwould have resulted in different treatmentwere found in 2.3% of rereviewed cases, 1.9%of cases were deferred for further immunohis-tochemical staining, and 1.3% were deferredpending review of the original glass slides.
CLINICAL EDUCATION ANDCOMPETENCY ASSESSMENTIN PATHOLOGY
Because of efforts to satisfy the demand forhigh-quality pathology services, there is a grow-ing need for systems that can efficiently assessthe diagnostic proficiency of pathology traineesand staff pathologists (57, 58–60). WSI is alogical platform on which to build such educa-tion and proficiency-testing programs (61, 62).Importantly, WSI platforms ensure that exactlythe same slides can be simultaneously reviewedby all participants. WSI provides an effectivemeans of annotating images for instructionalpurposes and creating digital slide archivesthat can easily be coupled with the relevantclinical and/or radiological information. Theseapproaches improve teaching efficiency andincrease pedagogic versatility (14). The experi-ence at the University of Oklahoma Health Sci-ences Center (63) shows that integrating WSIinto their online pathology education programhas enabled content such as annotated digitalslides and an online WSI atlas. van den Tweel& Bosman (64) recently reported on the bene-fits of incorporating virtual slides into a system
known as EUROPALS (European PathologyAssessment and Learning System) to assessthe diagnostic skills and theoretical knowledgeof pathology trainees across Europe. Despitetechnical challenges from both server and usersides, the use of virtual slides provided greaterflexibility than did selected static images.
Several institutions, including the Uni-versity of Iowa in the United States (14),the University of Basel in Switzerland, andthe University of Saarland in Germany, havesuccessfully implemented digital technology intheir undergraduate medical curricula (65, 66).Emerging data suggest that today’s medicaltrainees prefer teaching modules based on WSIsystems to those based on light microscopyand glass slides (65). To assess the effectivenessof virtual microscopy for teaching purposes,Collier et al. (67) interviewed 12 teachingassistants from an undergraduate humananatomy course. They found that the majorityof interviewees cited ease of use, universalaccess to teaching material, and increasedstudent collaboration as advantages of the newtechnology. Fonyad et al. (59) summarizedtheir 4-year experience of using digitalizedhistology labs in graduate student education atSemmelweis University in Hungary. Between2007 and 2009, their digital histology lab served928 students with a virtual slide set comprisingpredominantly H&E slides scanned at 20×magnification. These authors reported highuser satisfaction with the WSI approach. TheUniversity of Pittsburgh has successfully im-plemented a Web-based digital teaching modelfor genitourinary pathology (60). Bruch et al.(58) have similarly developed a WSI-basedtool for assessing the competency of pathologyresidents at the University of Iowa. Thisprogram allows them to follow an individualresident’s progress throughout the course ofhis or her training. These authors concludedthat their model can be applied across multiplepathology residency programs. A survey con-ducted at the University of Queensland Schoolof Dentistry in Australia (68) indicated thatundergraduate students were reluctant to use
342 Ghaznavi et al.
Ann
u. R
ev. P
atho
l. M
ech.
Dis
. 201
3.8:
331-
359.
Dow
nloa
ded
from
ww
w.a
nnua
lrev
iew
s.or
gby
Cas
e W
este
rn R
eser
ve U
nive
rsity
on
11/1
2/13
. For
per
sona
l use
onl
y.

PM08CH13-Feldman ARI 13 December 2012 19:7
traditional light microscopes and were heavilyin favor of learning through virtual microscopy.A majority of students (>88%) felt that the vir-tual slide method increased their engagementwith course content. Finally, two Web-basedvirtual microscopy applications in breastpathology and Gleason grading of prostatebiopsies indicated that WSI systems providea robust platform for educational purposes(69, 70).
CYTOMETRIC ANALYSIS OFPATHOLOGY MATERIALS:BACKGROUND
For decades, pathologists have been usingimmunohistochemistry (IHC) as an adjunctivetool to evaluate protein-expression patternsin tissue. This process assists in diagnosis byfinding protein-expression patterns that cor-relate with the type of tumor (e.g., carcinoma,sarcoma, lymphoma, or melanoma) or, morespecifically, the site of a primary tumor whenan occult metastasis is identified. Althoughfew single proteins define a site of origin,combinations of stains often allow pathologiststo predict the probable site of a tumor’s origin.More recently, immunohistochemical stainshave been used to quantitate biomarkers toassist in therapeutic drug selection. Perhapsthe best-known example of this applicationis in breast cancer management. Expressionof hormone receptors for estrogen (ER) andprogesterone (PR) are semiquantitatively mea-sured using IHC. The resulting Allrad score canthen be used to select hormone targeted ther-apy in tumors that are ER positive. In addition,overexpression of the epidermal growth factorreceptor (EGFR)-family protein HER-2/neuis also measured semiquantitatively to evaluatefor protein overexpression (usually associatedwith gene amplification) for a selection of pa-tients who may respond to antibody therapy tothe Her-2 gene product, such as trastuzumab.
Although such visual, analog, pathologist-driven scoring systems have been used fordecades to evaluate protein expression, recent
advances in WSI, multispectral imaging, andimmunofluorescence microscopy, combinedwith automated image-analysis tools, havebegun to allow pathologists to consider newparadigms for automated scoring of IHCstudies. Importantly, these new technologiesallow pathologists to consider adopting newstaining protocols, including multiplexedantibody studies, which are very difficult, ifnot impossible, to accurately quantitate usinghistorical analog-driven approaches. Thesenew digital methodologies also allow for thebroader adoption of immunofluorescence,rather than IHC, as a primary diagnostic tool.Immunofluorescence has many advantagesover IHC, including the ability to develophigh-order multiplexing. Immunofluorescenceis also linearly related to the amount of anti-body bound to the tissue, which renders it moresuitable for reproducible quantitative studies.A significant limitation of immunofluorescencestudies is the need for the end-user pathologistto spend time in dark rooms at a fluorescencemicroscope. New digital imaging platformsobviate the need for the pathologist to drive afluorescence scope and allow imaging techni-cians to perform the primary image capture andautomated analysis; the pathologist reviews andintegrates the information from these systemswith the morphology to create a comprehensivedisease report. If this paradigm sounds familiar,it should. It is the exact paradigm used in thepractice of hematopathology, in which a techni-cian performs multiplexed immunofluorescentstains (four to six stains at a time) by using aflow cytometer. (It is a rare hematopathologistwho has time to run the flow cytometer intoday’s busy clinical environment.) The tech-nician returns the resulting flow scatter plots tothe hematopathologist for interpretation andintegration into the hemepath report. If dataneed reanalysis, the hematopathologist directsthe technician how to perform the reanalysis.This is the future of cytometric analysis oftissue sections, which will be enabled with theadvent of the technologies discussed in the nextsection, namely multispectral histocytometric
www.annualreviews.org • Digital Imaging in Pathology 343
Ann
u. R
ev. P
atho
l. M
ech.
Dis
. 201
3.8:
331-
359.
Dow
nloa
ded
from
ww
w.a
nnua
lrev
iew
s.or
gby
Cas
e W
este
rn R
eser
ve U
nive
rsity
on
11/1
2/13
. For
per
sona
l use
onl
y.

PM08CH13-Feldman ARI 13 December 2012 19:7
image analysis and immunofluorescencehistocytometric image analysis.
MULTISPECTRAL IMAGING:BACKGROUND
Spectral microscopic imaging refers to the cap-ture of spectrally resolved information at eachpixel in an image—in essence, spatial spec-trophotometry. The number of wavelengths ofthe information captured distinguishes multi-spectral (10–30 bands of data) from hyperspec-tral (hundreds to thousands of bands of data)imaging systems. Spectral microscopy, there-fore, is a specialized form of digital microscopydesigned to capture spatially resolved spectralinformation (using bright field, fluorescence,or even a combination of the two). Althoughit is feasible to capture a multispectral imageof a whole slide, this is not routinely done be-cause only a few dozen fields of informationare required to create a statistically meaning-ful sample of a tissue slide. The resulting spec-tral information captured by a spectral imag-ing system is a data cube that comprises x andy coordinates of information from the charge-coupled device (CCD) sensor; each z plane inthe data cube provides information about in-tensity at each pixel as a function of wavelength(z axis of the data cube). Figure 5 illustrates thecreation of a spectral data stack.
Whole-slide digital imaging systems cur-rently on the market use red-green-blue(RGB)-based imaging methods. Spectralimaging systems offer advantages over RGBsystems, including the ability to analyze pathol-ogy slides stained with multiple antibodies (ineither bright-field or fluorescence mode). Spec-tral imaging systems also permit the use of fluo-rescence imaging by overcoming autofluores-cence, which is very commonly observed informalin-fixed paraffin-embedded tissue. Au-tofluorescence removal is accomplished bydirectly measuring autofluorescence spectrallyand then unmixing (by using a curve-fittingalgorithm to separate the spectral fluorescencecurve attributed to autofluorescence from the
spectral curve associated with a specific fluo-rophore). Although both the autofluorescenceand the fluorophore may appear green, theyare spectrally different. Through the removalof autofluorescence, spectral imaging allowspathologists or researchers to use single or mul-tiplexed fluorescence imaging methodologiesin routine surgical pathology. Finally, spectralimaging enables computer analysis of routinestains (H&E- or Papanicolaou-stained sam-ples) in order to develop automated machineclassification systems to predict disease types oroutcomes (71–73). Like fluorescence imaging,the application of multispectral imaging inbright field–based IHC application allows forthe use of multiplexed immunohistochemicalstains that are in spatially overlapping cellularcompartments (74–77). The ability of wholeslide–based RGB imaging systems to resolvemore than three colors of information is, inpractice, impossible. RGB imaging systems arenot able to adequately deconvolve or separatethe chromogens for analysis. In contrast, spec-tral imaging systems can resolve three of morechromogens. Figure 6 shows a multispectraldata stack of breast carcinoma stained withDAPI (4′,6-diamidino-2-phenylindole) andEGFR, comparing (a) conventional fluores-cence imaging with monochrome band passeswithout autofluorescence removal with (b) thesame field of view imaged using a spectral sys-tem with autofluorescence removal. Multiplex-ing more than two antibody labels is not done inroutine pathology practice at present; however,the ability to simultaneously label more thantwo proteins in a single slide will allow for thedevelopment of cellularly resolved informationabout pathways (e.g., an antibody to phos-phorylated ERK, a member of the mitogen-activated protein kinase signaling pathway), cellfate (e.g., a second antibody to Ki-67) and celltypes (e.g., a third antibody to cytokeratin tofind tumor cells in a field of view versus nontu-mor stromal areas). Roysam and colleagues (78,79) have developed a system for the analysis ofcytometrically resolved multiplexed IHC or im-munofluorescence. This slide-based system is
344 Ghaznavi et al.
Ann
u. R
ev. P
atho
l. M
ech.
Dis
. 201
3.8:
331-
359.
Dow
nloa
ded
from
ww
w.a
nnua
lrev
iew
s.or
gby
Cas
e W
este
rn R
eser
ve U
nive
rsity
on
11/1
2/13
. For
per
sona
l use
onl
y.

PM08CH13-Feldman ARI 13 December 2012 19:7
Spectral unmixing
AcquisitionWavelength
Nuance™multispectralimaging system
RGB representation ofspectral cube
Spectra of labels
RGB representation ofspectral cube
Unmixing of overlapping fluorophores using pure component spectra
1.0
0.5
0.0450 500 550 600
Wavelength (nm)650 700
a c
b d
Figure 5A multispectral imaging system and the resulting spatially aligned image stack are illustrated for a carcinoma stained with DAPI(4′,6-diamidino-2-phenylindole) and three fluorescently labeled antibodies. In this case, a liquid-crystal tunable filter multispectralimaging system from CRI, Inc. (NuanceTM) was used to capture the data from 420 to 720 nm. The spectral profiles of the fourfluorochromes are shown: (a) DAPI, (b) Alexa 488, (c) Alexa 594, and (d ) Alexa 660. With a known spectral library of the purefluorochromes, linear unmixing allows the individual fluorochromes to be separated from the complex mixture in the original startingimage, shown as a red-green-blue (RGB) image.
analogous to flow cytometry and is aptly namedquantitative histocytometry. Applications ofquantitative histocytometry are exploredfurther below. However, the implications ofquantitatively measuring cell-signaling path-ways and linking them to cell fate (proliferation,apoptosis, or autophagy) will be significantas pathologists enter the era of personalizeddiagnostics and the development of companiondiagnostics for pharmacologic agents thattarget signaling pathways, of which there arehundreds in various stages of clinical trials.
MULTISPECTRAL HARDWARE
Spectral imaging requires specialized imag-ing hardware that is different from WSIsystems. A means of generating spectrallyencoded information is required. There aremultiple methods for creating the spectraldata, including liquid-crystal tunable filters(LCTFs) and tunable light sources, acousto-optical methods, diffraction gradients, andfixed-filter methods (80). Three of thesesystems are commercially available: the LCTF(CRI, Inc.; see http://www.cri-inc.com),
www.annualreviews.org • Digital Imaging in Pathology 345
Ann
u. R
ev. P
atho
l. M
ech.
Dis
. 201
3.8:
331-
359.
Dow
nloa
ded
from
ww
w.a
nnua
lrev
iew
s.or
gby
Cas
e W
este
rn R
eser
ve U
nive
rsity
on
11/1
2/13
. For
per
sona
l use
onl
y.

PM08CH13-Feldman ARI 13 December 2012 19:7
Spectra of labels
450 500 550 600
Wavelength (nm)650
1.0
0.5
0.0
Detecting EGFR in breast tissue
Monochrome bandpass image
Unmixed EGFR signal
Conventional
Multispectral
Signal (counts)
Membrane 69.1
Nuclear 99.9
Off sample 6.9
Signal (counts)
Membrane 23.4
Nuclear 1.3
Off sample 0.4
a
b
c
Figure 6A breast carcinoma case stained for DAPI (4′,6-diamidino-2-phenylindole), epidermal growth factor receptor (EGFR) (Alexa 594), andestrogen receptor (Alexa 547) is (a) shown as a red-green-blue image and then analyzed (b) by conventional monochrome band-passfilters without autofluorescence removal or (c) after autofluorescence is removed following multispectral image acquisition. The removalof autofluorescence, followed by unmixing of the two antibodies, allows for precise measurement of the EGFR membrane signal.
the prism-based method (Lightform; seehttp://www.lightforminc.com/), and thefixed- or diffraction methods filter (Zeiss; seehttp://zeiss-campus.magnet.fsu.edu/articles/spectralimaging/index.html).
In general, spectral imaging systems allowfor the capture of spectrally resolved infor-mation across the visible range and into thenear-IR bands (1-nm band passes between 420nm and 900 nm). These systems allow transmis-sion of saturated colors within narrow spectralbands that can be electronically and randomlychanged (or tuned) to any wavelength. Spectralimaging systems typically couple the spectralimaging hardware (LCTF or a prism ordiffraction system) with coupling optics and
a cooled, scientific-grade monochrome CCDinto an integrated imaging platform. Softwarecoordinates the image-acquisition process.These systems are capable of fluorescence-based analysis or bright field–based projectsfor chromogen-based assays. Image acquisitionis accomplished via a software interface thatcan be automated. The resulting data cube (xand y coordinate position on a CCD sensor;the z axis represents intensity data at differentwavelengths) is then stored for further analysis.
SOFTWARE (ANALYSIS OFSPECTRAL IMAGES)
Images acquired using a spectral imaging sys-tem can be either further analyzed by unmixing
346 Ghaznavi et al.
Ann
u. R
ev. P
atho
l. M
ech.
Dis
. 201
3.8:
331-
359.
Dow
nloa
ded
from
ww
w.a
nnua
lrev
iew
s.or
gby
Cas
e W
este
rn R
eser
ve U
nive
rsity
on
11/1
2/13
. For
per
sona
l use
onl
y.
PM08CH13-Feldman ARI 13 December 2012 19:7
(multianalyte assays or for object classificationsystems) or used in classification projects inwhich the spectral signature of different objectclasses is used to discriminate cells or tissue onthe basis of routine sample preparation (H&E-or Papanicolaou-stained materials). The use ofspectral images to classify disease processes hasshown promise in some disease states. El Dieryand colleagues (81) have used spectral spectralimaging to distinguish benign from neoplasticmelanocytic lesions, with good success. Incytopathology, Rimm and colleagues (71–73)have used multispectral imaging to classifybladder cytology samples for the identificationof high-grade dysplastic cells and thyroid cy-tology samples for thyroid neoplasia, with verygood success. Classification of these differentdisease states may occur according to simpledifferences in the spectral signatures of thedifferent disease states, or it may require morecomplex analysis of the spectral patterns inher-ent within different disease classes (describedbelow in the section titled Image Analysis).
In addition to the application of multispec-tral imaging for disease classification, a morecommon use of spectral imaging is in the analy-sis of tissue stained with one or more antibodies,either in fluorescence or bright-field imagingapplications. Analyses of multianalyte problemsbegin by unmixing or spectrally separating theindividual stains into their individual spectra.Unmixing begins with pure spectra of the indi-vidual stains, which are obtained by staining thetissue with one antibody or counterstain alonebefore applying them in combination. The in-dividual spectra of each stain can then be di-rectly measured and used to build a spectral li-brary. Through the use of the individual purespectra, unmixing is based on a least-squarescurve fitting for linear unmixing (77). The re-sulting unmixed spectra then show the intensitycontribution of each stain at every pixel in theimage, thereby allowing for additional imageanalysis and classification schemas (describedin detail below). In addition to linear unmix-ing, some applications are best performed usingalternative algorithms, including nonlinear un-mixing approaches such as spectral waveform
cross-correlation analysis (81). These alter-nate spectral unmixing algorithms are especiallyvaluable when linear unmixing approaches fail[i.e., when stains do not obey Beer’s law (82)].
STAINING LIMITATIONS PLUSAUTOFLUORESCENCE
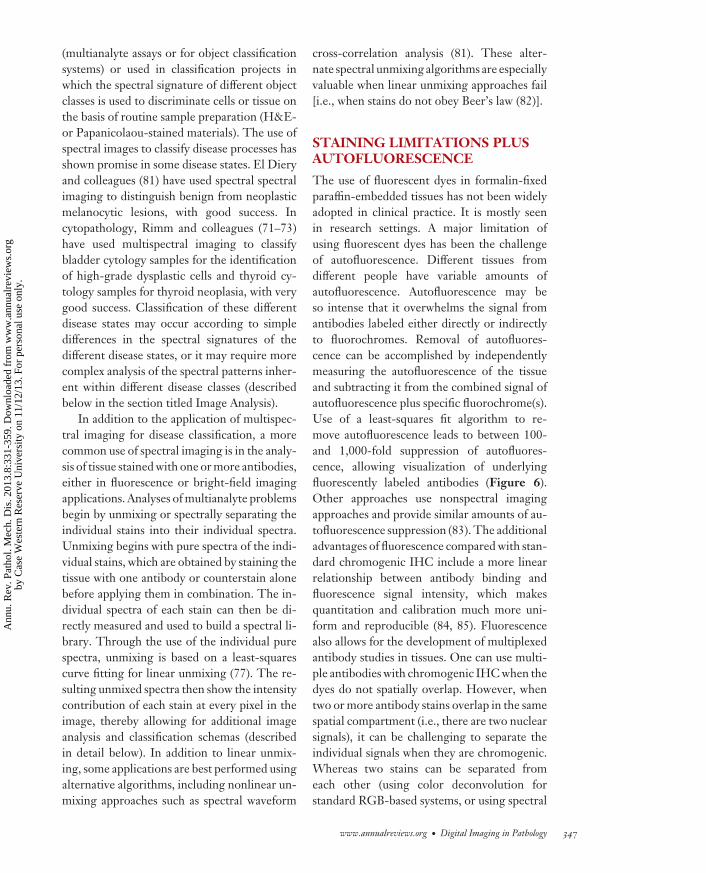
The use of fluorescent dyes in formalin-fixedparaffin-embedded tissues has not been widelyadopted in clinical practice. It is mostly seenin research settings. A major limitation ofusing fluorescent dyes has been the challengeof autofluorescence. Different tissues fromdifferent people have variable amounts ofautofluorescence. Autofluorescence may beso intense that it overwhelms the signal fromantibodies labeled either directly or indirectlyto fluorochromes. Removal of autofluores-cence can be accomplished by independentlymeasuring the autofluorescence of the tissueand subtracting it from the combined signal ofautofluorescence plus specific fluorochrome(s).Use of a least-squares fit algorithm to re-move autofluorescence leads to between 100-and 1,000-fold suppression of autofluores-cence, allowing visualization of underlyingfluorescently labeled antibodies (Figure 6).Other approaches use nonspectral imagingapproaches and provide similar amounts of au-tofluorescence suppression (83). The additionaladvantages of fluorescence compared with stan-dard chromogenic IHC include a more linearrelationship between antibody binding andfluorescence signal intensity, which makesquantitation and calibration much more uni-form and reproducible (84, 85). Fluorescencealso allows for the development of multiplexedantibody studies in tissues. One can use multi-ple antibodies with chromogenic IHC when thedyes do not spatially overlap. However, whentwo or more antibody stains overlap in the samespatial compartment (i.e., there are two nuclearsignals), it can be challenging to separate theindividual signals when they are chromogenic.Whereas two stains can be separated fromeach other (using color deconvolution forstandard RGB-based systems, or using spectral
www.annualreviews.org • Digital Imaging in Pathology 347
Ann
u. R
ev. P
atho
l. M
ech.
Dis
. 201
3.8:
331-
359.
Dow
nloa
ded
from
ww
w.a
nnua
lrev
iew
s.or
gby
Cas
e W
este
rn R
eser
ve U
nive
rsity
on
11/1
2/13
. For
per
sona
l use
onl
y.

PM08CH13-Feldman ARI 13 December 2012 19:7
unmixing), the addition of a third or fourthantibody in the same spatial cellular compart-ment causes these separation techniques to failbecause color deconvolution uses only threedata channels (RGB channels) to unmix mul-tiple colors. Also, the aggregation of multiplechromogens causes the role of chromogens tochange from light absorber to stronger lightscatterer, and at very strong stain intensities, thescattering properties of the chromogens pre-vent light from passing through the aggregatedchromogens.
HISTOCYTOMETRIC ANALYSISOF MULTISPECTRAL IMAGES
Antibody staining to reveal specific molecularbiomarkers is increasingly being used toimprove cancer diagnosis and classification,establish prognosis, and determine therapy.Although molecular biomarkers play an in-creasingly large role in this process, the scoringof stained specimens (immunohistochemicallyor immunofluorescently) remains largelyvisually subjective: Cells are scored as positiveor negative or are graded for degree of antigenstaining, the percentage of positive cells isestimated, and overall scores are binned orscaled using semiquantitative approaches.This process requires considerable expertiseand is susceptible to interobserver variability,despite standardization efforts (86–88). Theuse of semiquantitative scoring (e.g., 0, 1+,2+, 3+ staining) and H-scores acknowledgesthe inherent imprecision and subjectivityinvolved.
Computer-automated methods to quantifyantigen expression in tissue images havebeen developed (89–92); these methods offerobjectivity, reproducibility, and quantifica-tion on a continuous scale. Most operate bymeasuring the number of pixels stained forone or more antigens and by quantifying thecolocalization of stains. These methods canquantify at the level of individual pixels, groupsof pixels, or image regions. Although suchpixel-based approaches offer improvementsin quantitation and reliability over manual
scoring methods, they are not performedon a cytometric basis (i.e., individual cellanalysis). The HistoRx platform (see http://www.historx.com/launch/index.html) is per-haps the most advanced pixel-level automatedimage-analysis system available today; multiplestudies have shown the advantage of automatedquantitation using this platform compared withthe manual scoring of pathology samples (84,85, 89, 93, 94). Cells, rather than pixels, are thefundamental units in which many biologicalprocesses occur. Sufficiently reliable automatedmethods to segment (delineate) individual cells,identify subcellular compartments within cells,and quantify biomarkers within the subcellularregions have only recently been developed.Roysam and colleagues (79) have developed anopen source–based cytometric analysis system(Farsight; see http://farsight-toolkit.org)for the analysis of cells in surgical pathologysamples. Using tissues stained with hema-toxylin and DAB (diaminobenzidine) or DAPIand fluorochromes, Farsight uses the nuclearchannel (either DAPI or hematoxylin) toperform a nuclear segmentation process byconverting the image into a binary map,then finding and refining the center of nucleito segment the nuclear contours. Followingnuclear segmentation, a cell-membrane markerin another spectral channel is used to definethe cell membrane (e.g., E-cadherin is usedfor breast carcinoma). The resulting nuclearand membrane boundaries are then utilizedto define the cytoplasmic area by use of anadaptive algorithm that switches between dif-ferent cell-based models on a cell-by-cell basis.The resulting cellular segmented maps withassociated subcellular localization can then beused to associate additional staining informa-tion from additional analyte channels fromthe multispectral assay on a cell-by-cell basiswith subcellular localization to the nucleus,cytoplasm or cell membrane. The resultingoutput data set resembles a list-mode data filefrom a flow cytometer in that each row of datarepresents a cell and each column a marker ofinterest within a subcellular compartment ofthe individual cell (Figure 7).
348 Ghaznavi et al.
Ann
u. R
ev. P
atho
l. M
ech.
Dis
. 201
3.8:
331-
359.
Dow
nloa
ded
from
ww
w.a
nnua
lrev
iew
s.or
gby
Cas
e W
este
rn R
eser
ve U
nive
rsity
on
11/1
2/13
. For
per
sona
l use
onl
y.

PM08CH13-Feldman ARI 13 December 2012 19:7
a
c
b da
c
b d
Figure 7The inFormTM machine learning and classification system is used to score a breast carcinoma case stained for progesterone receptor.(a) A pathologist shows inForm a few areas of tumor (red ) and a few areas of tumor stroma ( green). On the basis of these trainingregions, (b) inForm learns the remaining areas with high accuracy and classifies the remainder of the image into tumor regions (red ) andnontumor regions ( green). (c) The system finds the nuclei only within the tumor region. (d ) The system displays a list-mode data file forthe optical density of diaminobenzidine for each tumor cell nucleus it finds. If more than one stain was applied to the tissue, each stainand its component intensity are associated with each cell and its subcellular localization.
In addition to open-source applications,commercial vendors are entering the quan-titative analytic space. Industrial applicationsfrom Aperio, Definiens, and Perkin Elmer(formerly CRI, Inc.) have been developingcytometric image-analysis solutions. Althoughthe software from Aperio is designed to workon whole slides, Aperio has extended itsanalytic platform to fluorescent images as wellas spectral images that have been unmixedinto spectral component planes. The softwarefrom Aperio, Definiens, and Perkin Elmer alsoincludes region segmentation algorithms thatare designed to classify regions on the basis ofa user-training paradigm. During training, anexperienced end user trains the segmentationalgorithm by showing the software a few exam-ple regions of different disease classes (invasivetumor, in situ tumor, stroma, etc.); the algo-
rithm then classifies the remaining image, aswell as additional images that might be neededfor analysis in a batch-mode study. The Aperioplatform uses a genetic algorithm (Genie R©)licensed from Los Alamos National Labo-ratory. Perkin Elmer has developed its ownlearn-by-example algorithm, which uses a pro-prietary advanced machine learning algorithm(inFormTM) similar to Genie’s, and Definienshas developed another proprietary train-by-example paradigm. Figure 7 illustrates atypical training session with inForm in whicha breast carcinoma was stained for ER and thetumor counterstained with hematoxylin.
IMAGE ANALYSIS
BackgroundWSI has led to substantial growth in thenumber of researchers and companies seeking
www.annualreviews.org • Digital Imaging in Pathology 349
Ann
u. R
ev. P
atho
l. M
ech.
Dis
. 201
3.8:
331-
359.
Dow
nloa
ded
from
ww
w.a
nnua
lrev
iew
s.or
gby
Cas
e W
este
rn R
eser
ve U
nive
rsity
on
11/1
2/13
. For
per
sona
l use
onl
y.

PM08CH13-Feldman ARI 13 December 2012 19:7
to utilize computer-based image analysis forpathology images and to develop new softwaretools to assist pathologists. Prior to WSI, thefield of pathology image analysis was limited bypathologists’ need to select fields of view uponwhich computer image-analysis routines couldrun. WSI allows the entire slide to be availablefor analysis; field selection can then be auto-mated, allowing the pathologist to act as finalinterpreter and analyzer of the resulting data,rather than as a field selection technologist.
In general, image analysis is a multistep pro-cess that involves feature extraction, feature se-lection, dimensionality reduction, and classifi-cation steps. These steps are discussed in thefollowing sections.
Feature Extraction
Research on useful features for cancer classi-fication and diagnosis has often been inspiredby grading features determined by cliniciansto be particularly important for the diagnosis.The vast majority of these features are nuclearfeatures, and many have been established asuseful in the analysis of both cytopathologyand histopathology imagery. Other featuresthat assume discriminatory importance in-clude the margin and boundary appearanceof ductal, stromal, tubular, and glandularstructures. Although a compilation of featuresfor cytopathology imagery exists (95), there isrelatively little such work for histopathologyimagery.
Human observers’ (pathologists’) conceptof the world is inherently object based, as op-
Figure 8Automated segmentation of nuclei on a prostate histology image from a fullydigitized virtual slide. In this image, the nuclei are mathematically identified byuse of a combination of color, shape, and texture information. The resultingmathematical model can accurately trace out the nuclei of each cell on the basisof its digital information. Although a human can easily trace out the samenuclei, once trained a computer can perform this task in seconds; a humanwould take hours.
posed to the largely pixel-based representationof computer vision. As such, pathology expertsdescribe and understand images in terms ofsuch objects. For pathologists, diagnostic crite-ria are inevitably described by using cytologicterms, such as nucleus and cell, and by therelationship of larger objects to one anotherand to benign adjacent tissue, arrangement ofglands, invasion of tissues, and desmoplasticreactions. It is therefore important to developcomputer vision methods that are capable ofsuch object-level analysis. Figure 8 showsan automated algorithm for nuclear identi-fication, known as nuclear segmentation inimage-processing parlance.
In addition to cytologic features (cells, nu-clei, cell membranes), spatial relationships areused by pathologists to classify diseases. To cre-ate a set of mathematical features that relate tothe spatial information that pathologists use, re-searchers have utilized the mathematical tech-nique of graph theory as an effective means ofrepresenting structural and spatial informationby defining a large set of topological features.Real-world graphs of various types and scaleshave been extensively investigated in techno-logical, social (96), and biological (97) systems.Use of the mathematical principle of graph the-ory has allowed for the development of addi-tional features from digital pathology imagesthat can be used to model tissues and diseasestates. These graph-based features are quanti-fied by definition of computable metrics. Theuse of graph-based spatial arrangement of his-tological entities (generally at low resolutions)is relatively new, especially in comparison tothe wealth of research on nuclear features (athigher resolutions) that has accumulated dur-ing the same time frame. Graph-based featureextraction methods have allowed for the addi-tion of approximately 150 new features for allgraph structures (98).
Graph-based metrics can be defined andcomputed on a graph created by connecting thenuclei of cells to each other (i.e., a cell graph)to create a rich set of descriptive features thatcan be used for tissue classification. These fea-tures provide structural information about the
350 Ghaznavi et al.
Ann
u. R
ev. P
atho
l. M
ech.
Dis
. 201
3.8:
331-
359.
Dow
nloa
ded
from
ww
w.a
nnua
lrev
iew
s.or
gby
Cas
e W
este
rn R
eser
ve U
nive
rsity
on
11/1
2/13
. For
per
sona
l use
onl
y.

PM08CH13-Feldman ARI 13 December 2012 19:7
tissue organization, such as the distribution oflocal and global information around a single cellcluster or the global connectivity informationof a graph. The end result of these feature ex-traction algorithms is a set of features that canbe used for image classification. Figure 9 il-lustrates graph-related features based on twocomputational tools: the Delaunay triangula-tion (Figure 9c) and the minimum spanningtree (Figure 9d).
Interestingly, although pathologists donot compute succinct graph-based features,pathologists often observe information aboutobjects relative to one another, in effect usingobservation graph networks to understandthe relationships among nuclei (for instance:Are the nuclei overlapping? Are they uni-formly spaced? Are they basally oriented?) orthe arrangement of glandular patterns (e.g.,defining a normal lobule from an infiltrativeacinar pattern). Therefore, it is unsurprisingthat the use of mathematically derived graphnetworks yields informative data about spatialinformation within digital pathology images.
Feature Selection
Although humans have innate abilities toprocess and understand imagery, explaininghow they reach their decisions is more difficult;pathologists often rely on a small set of featuresthat occur at a high frequency within an imagescene to classify disease states and patterns. Assuch, image-analysis applications often beginwith large feature sets that are generated in thehopes that some subset of features incorporatesthe information used by the human expert foranalysis. Therefore, many of the generated fea-tures could be redundant or irrelevant. Featureselection is a way to extract the relevant andimportant features from a large set of features.
Feature selection in histopathological imageanalysis provides several benefits in additionto improving accuracy. Because images tendto be relatively large, one should calculate asmall subset of features, which reduces thecomputational complexity of classificationalgorithms. A smaller number of features also
a b
c d
a b
c d
Figure 9(a) Hematoxylin and eosin–stained image of breast carcinoma. (b) Nuclei ofbreast carcinoma cells identified by automated algorithm based on colordeconvolution. (c) Delaunay triangulation calculation applied to breast cancernuclei. (d ) Minimum spanning tree (MST) computed on the tumor nucleiidentified in panel b. To understand the general nature of the tissuearchitecture, we construct graphs such as the Delaunay triangulation and theMST. Statistics such as those related to triangle area, triangle perimeter, andMST edge length are calculated to quantify the spatial arrangement of thenuclei in the image.
makes it easier to explain the underlying modeland to improve the chances of generalization ofthe developed system. Additionally, in a mul-tiresolution framework (e.g., a whole digitalslide with varying levels of magnification), a setof features that are useful at a given resolutionmay not be relevant at another resolution, evenwithin the same image. A feature selectionalgorithm helps determine which featuresshould be used at a given resolution. Thisfact is intuitively obvious to the practicingpathologist, who uses scale-based informationnaturally and seamlessly. Who hasn’t openeda slide tray and moved immediately to thediagnostic slide by looking for the bluest slide?At very low magnification (scale), color infor-mation is very informative, whereas at higher
www.annualreviews.org • Digital Imaging in Pathology 351
Ann
u. R
ev. P
atho
l. M
ech.
Dis
. 201
3.8:
331-
359.
Dow
nloa
ded
from
ww
w.a
nnua
lrev
iew
s.or
gby
Cas
e W
este
rn R
eser
ve U
nive
rsity
on
11/1
2/13
. For
per
sona
l use
onl
y.
PM08CH13-Feldman ARI 13 December 2012 19:7
magnification, other features of architectureand nuclear morphology become important.
An optimal feature selection method re-quires an exhaustive search, which is not prac-tical for a large set of features generated from alarge data set. Therefore, several heuristic algo-rithms that use classification accuracy as the op-timality criterion have been developed and usedin various image-processing strategies. (14–16,99–101).
Dimensionality Reduction
Whereas feature selection aims to choose thosefeatures (and reduce the feature dimensionality)that best optimize some criterion related to theclass labels (i.e., that separate different classes orstates of disease) of the data (e.g., classificationperformance), dimensionality reduction tech-niques aim to reduce the overall dimensionalityof the data set from thousands of features toa smaller set of features on the basis of someother criterion. A well-known and commonlyused method of linear dimensionality reductionis principal components analysis (PCA).
PCA (103) attempts to find a new coordi-nate system that shows the first three axes thatdefine the maximum variance of the data. Thefirst feature (eigenvector) is incorporated in thefirst dimension, the next-largest eigenvectorholds the next-largest amount of variance inthe starting high-dimensional data set, and soforth. By reducing the dimensionality of thestarting problems from a feature space withthousands of features to three features, onecan more easily visualize the data and theirrelationship to the outcome variable. In thislower-dimensional feature space, classificationalgorithms can be run to separate clinical orbiological conditions. Thus, when only thefirst few dimensions of the PCA transform areretained, the sources of the largest amount ofvariation in the data are maintained.
Recently, nonlinear dimensionality reduc-tion (NLDR) methods have become popularin learning applications. These methods over-come a major limitation of linear dimension-ality reduction methods, such as PCA, which
assume that the geometrical structure of thehigh-dimensional feature space is a linear orstraight-line relationship. PCA is a linear trans-formation that transforms the data to a newcoordinate system such that the direction withthe greatest variance lies on the first coordinate(termed the first principal component), the sec-ond greatest variance on the second coordinate,and so on. In reality, high-dimensional featurespaces are often composed of highly nonlin-ear structures, and locality-preserving dimen-sionality reduction methods are highly sought.Several manifold learning algorithms have beenconstructed to deal with different types of data(104–108). Graph embedding is one such al-gorithm that aims to nonlinearly project high-dimensional data into a reduced dimensionalspace while preserving object adjacencies (109–111). The high-dimensional feature space is sig-nificantly reduced, in terms of the number of di-mensions, to a lower-dimensional feature vec-tor space. A key value of NLDR methods is thatthey preserve object adjacencies. Thus, if twoobjects (e.g., pathology images) are close to oneanother in the original high-dimensional fea-ture space, they will likewise be embedded closeto one another in the lower-dimensional sub-space. This preservation of feature adjacencysuggests that the two objects are similar to oneanother, perhaps in terms of biological or clin-ical potential (survival, nuclear grade, etc.).
Classification
Following feature selection extraction, featureselection, and dimensionality reduction, clas-sification schema can be run on image data toclassify the features into clinical classes (suchas different histologic states, different tumorgrades, and different outcome measures).Alternately, classification can be performed onthe large feature space, but doing so makes for acomputationally challenging problem. Unlikesome other applications of image analysis, inhistopathology imagery a primary considera-tion in the choice of a classifier is its ability todeal with large, highly dense data sets. Also,due to multiple image scales at which relevant
352 Ghaznavi et al.
Ann
u. R
ev. P
atho
l. M
ech.
Dis
. 201
3.8:
331-
359.
Dow
nloa
ded
from
ww
w.a
nnua
lrev
iew
s.or
gby
Cas
e W
este
rn R
eser
ve U
nive
rsity
on
11/1
2/13
. For
per
sona
l use
onl
y.

PM08CH13-Feldman ARI 13 December 2012 19:7
information may be extracted from histologicalimagery, use of an ensemble (combination) ofclassifiers as opposed to a single classifier hasbeen proposed. Following feature extraction,selection, and dimensionality reduction, differ-ent schemas for classification may be appliedto the histopathologic images.
Multiclassifier Ensemble Schemes
Both theoretical and empirical results haveestablished that, in terms of accuracy, en-sembles of classifiers generally outperformmonolithic solutions. Learning ensembles ormultiple classifier systems are methods forimproving classification accuracy throughaggregation of several similar classifiers’predictions and, thereby, reducing either thebias or the variance of the individual classifiers(112–114).
Support vector machines Support vectormachines (SVMs) project a set of training data,E, that represents two different classes into ahigh-dimensional space by means of a kernelfunction, K. In this transformed data space,nonlinear data are transformed so that a flat linecan be generated (a discriminating hyperplane)to separate the classes so as to maximize the classseparation. Testing data are then projectedinto the high-dimensional space via K, and thetest data are classified on the basis of wherethey fall with respect to the hyperplane. Thekernel function K defines the method in whichdata are projected into the high-dimensionalspace. A commonly used kernel known as theradial basis function has been employed todistinguish among three different classes ofprostate tissue (115), as well as to differentiatecolon adenocarcinoma histopathology imagesfrom benign histopathology images (116) andto classify four different subtypes of menin-giomas from their histopathology images(117).
AdaBoost The AdaBoost algorithm for classi-fication is used to combine a number of weakclassifiers (image features that do not individ-
ually sort images into different object classes)to generate a strong classifier (a combined clas-sifier made by linearly combining and weight-ing weak classifiers). A study by Doyle et al.(118) presented a hierarchical boosted cascadescheme (a linear combination of features cre-ated through the selected weighting of individ-ual features to best classify an image) for de-tecting suspicious areas on digitized prostatehistopathology. Efficient and accurate analysisis performed by first detecting those areas foundto be suspicious only at lower scales (low mag-nification). Analysis at subsequent, higher mag-nifications is limited to those regions deemed tobe suspicious at lower scales. Pixels classified asnontumor at a lower magnification (scale) arediscarded at the subsequent higher scale, whichreduces the number of pixels needed for analy-sis at higher scales. The process is repeated us-ing an increasingly large number of image fea-tures and an increasing classification thresholdat each iteration.
Case Study: Prostate CarcinomaGrading
Classification of histopathology images is oftenthe ultimate goal in image analysis, particularlyin cancer applications. Features derived fromsegmented nuclei and glands from histopathol-ogy are usually a prerequisite to extraction ofhigher-level information regarding the state ofthe disease. For instance, the grading of prostatecancer by Jafari-Khouzani & Soltanian-Zadeh(119) yielded 97% accuracy for H&E-stainedimagery on the basis of features derived fromnuclear structures in histopathology. Tabeshet al. (120) found 96.7% accuracy in discrim-inating between prostate tissue slides with can-cer and without cancer, and they found 81%accuracy in the discrimination between low andhigh Gleason grades. Using nonlinear dimen-sionality and SVMs, Madabhushi et al. (121)demonstrated 95.8% classification accuracy be-tween Gleason grade 3 and grade 4, 96% accu-racy between Gleason grade 3 and benign, and100% accuracy between Gleason grade 4 andbenign.
www.annualreviews.org • Digital Imaging in Pathology 353
Ann
u. R
ev. P
atho
l. M
ech.
Dis
. 201
3.8:
331-
359.
Dow
nloa
ded
from
ww
w.a
nnua
lrev
iew
s.or
gby
Cas
e W
este
rn R
eser
ve U
nive
rsity
on
11/1
2/13
. For
per
sona
l use
onl
y.

PM08CH13-Feldman ARI 13 December 2012 19:7
Case Study: Predicting BreastCarcinoma Outcomes
In contrast to prostate cancer grading, in whicha computer is trained to mimic the effort of apathologist (i.e., to identify and grade cancer byusing predefined human categories), Beck et al.(122) used an unbiased image-analysis solutionthat they developed, named C-Path, to identifya feature set that predicted 5-year survival ofbreast carcinoma patients. Tissue microarrays(TMAs) of breast carcinoma were analyzed inthe Definiens Developer XDTM software plat-form, and a feature set of some 6,000 imagefeatures were defined and measured. This fea-ture set included both epithelial and stromalfeatures. Using a machine learning algorithm(L1 logistic regression), Beck et al. developed aprediction model that accurately predicts good-versus poor-prognosis patients and is indepen-dent of molecular subtype, stage, ER status,and pathology grade. This model was trainedon a TMA from the Netherlands Cancer In-stitute and was validated on a separate breastcancer TMA from Vancouver General Hospi-tal. One of the unique features of this studywas the identification of stromal features thatare strongly prognostic, are not routinely ex-amined, and are scored in routine pathologic
analysis of breast cancer samples. This studyunderscores the power of automated and unbi-ased image-analysis and machine learning sys-tems and points toward an exciting opportunityfor future studies in this area.
CONCLUSIONS
From its genesis as an interesting idea in the late1990s, digital pathology has become a usefuland valuable tool in clinical and research pathol-ogy. This transition was initially fueled by thedevelopment of digital slide scanners, fluores-cent slide scanners, multispectral imaging hard-ware, and computational horsepower. Today,integrated systems with increasingly complexand functional software tools are being devel-oped and will become part of our diagnostictoolbox as we move into personalized medicine.Of the various barriers to widespread adoptionthat were described above, comprehensivevalidation of this technology for diagnosticpurposes across the complete spectrum of sur-gical pathology represents the most important.As this process unfolds, digital pathology willundoubtedly open up new avenues for compu-tational exploration of individual disease tissuesand will transform the practice of pathology.
DISCLOSURE STATEMENT
A.E. is a nonpaid member of the Omnyx Collaborators’ Program. The authors are not aware ofany affiliations, memberships, funding, or financial holdings that might be perceived as affectingthe objectivity of this review.
LITERATURE CITED
1. Ho J, Parwani AV, Jukic DM, Yagi Y, Anthony L, Gilbertson JR. 2006. Use of whole slide imaging insurgical pathology quality assurance: design and pilot validation studies. Hum. Pathol. 37:322–31
2. Pantanowitz L. 2010. Digital images and the future of digital pathology. J. Pathol. Inform. 1:153. Weinstein RS, Graham AR, Richter LC, Barker GP, Krupinski EA, et al. 2009. Overview of telepathol-
ogy, virtual microscopy, and whole slide imaging: prospects for the future. Hum. Pathol. 40:1057–694. Gilbertson JR, Ho J, Anthony L, Jukic DM, Yagi Y, Parwani AV. 2006. Primary histologic diagnosis
using automated whole slide imaging: a validation study. BMC Clin. Pathol. 6:45. Williams S, Henricks WH, Becich MJ, Toscano M, Carter AB. 2010. Telepathology for patient care:
What am I getting myself into? Adv. Anat. Pathol. 17:130–49
354 Ghaznavi et al.
Ann
u. R
ev. P
atho
l. M
ech.
Dis
. 201
3.8:
331-
359.
Dow
nloa
ded
from
ww
w.a
nnua
lrev
iew
s.or
gby
Cas
e W
este
rn R
eser
ve U
nive
rsity
on
11/1
2/13
. For
per
sona
l use
onl
y.

PM08CH13-Feldman ARI 13 December 2012 19:7
6. Della Mea V, Bortolotti N, Beltrami CA. 2009. eSlide suite: an open source software system for wholeslide imaging. J. Clin. Pathol. 62:749–51
7. Evans AJ, Chetty R, Clarke BA, Croul S, Ghazarian DM, et al. 2009. Primary frozen section diagnosisby robotic microscopy and virtual slide telepathology: the University Health Network experience. Hum.Pathol. 40:1070–81
8. Massone C, Brunasso AM, Campbell TM, Soyer HP. 2008. State of the art of teledermatopathology.Am. J. Dermatopathol. 30:446–50
9. Difranco MD, O’Hurley G, Kay EW, Watson RW, Cunningham P. 2011. Ensemble based systemfor whole-slide prostate cancer probability mapping using color texture features. Comput. Med. ImagingGraph. 35:629–45
10. Gabril MY, Yousef GM. 2010. Informatics for practicing anatomical pathologists: marking a new era inpathology practice. Mod. Pathol. 23:349–58
11. Patterson ES, Rayo M, Gill C, Gurcan MN. 2011. Barriers and facilitators to adoption of soft copyinterpretation from the user perspective: lessons learned from filmless radiology for slideless pathology.J. Pathol. Inform. 2:9
12. Huisman A, Looijen A, van den Brink SM, van Diest PJ. 2010. Creation of a fully digital pathology slidearchive by high-volume tissue slide scanning. Hum. Pathol. 41:751–57
13. Siegel EL, Kolonder RM. 1999. Filmless Radiology. New York: Springer14. Dee FR. 2009. Virtual microscopy in pathology education. Hum. Pathol. 40:1112–2115. Hedvat CV. 2010. Digital microscopy: past, present, and future. Arch. Pathol. Lab. Med. 134:1666–7016. Thorstenson S. 2009. From the conventional microscope to the digital slide scanner in routine diagnostic
histopathology. Presented at Pathol. Vis. Conf., San Diego17. Costello SS, Johnston DJ, Dervan PA, O’Shea DG. 2003. Development and evaluation of the virtual
pathology slide: a new tool in telepathology. J. Med. Internet Res. 5:e1118. Krupinski EA, Tillack AA, Richter L, Henderson JT, Bhattacharyya AK, et al. 2006. Eye-movement
study and human performance using telepathology virtual slides: implications for medical education anddifferences with experience. Hum. Pathol. 37:1543–56
19. Stratman C. 2009. Digital pathology in the clinical histology lab: a time and motion study. Presented at Pathol.Vis. Conf., San Diego
20. Velez N, Jukic D, Ho J. 2008. Evaluation of two whole-slide imaging applications in dermatopathology.Hum. Pathol. 39:1341–49
21. Bautista PA, Yagi Y. 2010. Improving the visualization and detection of tissue folds in whole slide imagesthrough color enhancement. J. Pathol. Inform. 1:25
22. Evered A, Dudding N. 2010. Accuracy and perceptions of virtual microscopy compared with glass slidemicroscopy in cervical cytology. Cytopathology 22:82–87
23. Kalinski T, Zwonitzer R, Sel S, Evert M, Guenther T, et al. 2008. Virtual 3D microscopy using multiplanewhole slide images in diagnostic pathology. Am. J. Clin. Pathol. 130:259–64
24. Thrall M, Pantanowitz L, Khalbuss W. 2011. Telecytology: clinical applications, current challenges,and future benefits. J. Pathol. Inform. 2:51
25. Schrader T, Niepage S, Leuthold T, Saeger K, Schluns K, et al. 2006. The diagnostic path, a usefulvisualisation tool in virtual microscopy. Diagn. Pathol. 1:40
26. DICOM Stand. Comm. Work. Group 26 Pathol. 2008. Specimen Module and Revised Pathology SOP Classes,suppl. 122. Rosslyn, VA: DICOM. ftp://medical.nema.org/medical/dicom/final/sup122_ft2.pdf
27. DICOM Stand. Comm. Work. Group 26 Pathol. Whole Slide Microscopic Image IOD and SOP Classes,suppl. 145. Rosslyn, VA: DICOM. ftp://medical.nema.org/medical/dicom/supps/sup145_ft.pdf.
28. Daniel C, Rojo MG, Klossa J, Della Mea V, Booker D, et al. 2011. Standardizing the use of whole slideimages in digital pathology. Comput. Med. Imaging Graph. 35:496–505
29. Krupinski EA. 2009. Virtual slide telepathology workstation of the future: lessons learned from telera-diology. Hum. Pathol. 40:1100–11
30. McClintock DS, Lee RE, Gilbertson JR. 2012. Using computerized workflow simulations to assess thefeasibility of whole slide imaging full adoption in a high-volume histology laboratory. Anal. Cell. Pathol.35:57–64
www.annualreviews.org • Digital Imaging in Pathology 355
Ann
u. R
ev. P
atho
l. M
ech.
Dis
. 201
3.8:
331-
359.
Dow
nloa
ded
from
ww
w.a
nnua
lrev
iew
s.or
gby
Cas
e W
este
rn R
eser
ve U
nive
rsity
on
11/1
2/13
. For
per
sona
l use
onl
y.

PM08CH13-Feldman ARI 13 December 2012 19:7
31. Isaacs M, Lennerz JK, Yates S, Clermont W, Rossi J, Pfeifer JD. 2011. Implementation of whole slideimaging in surgical pathology: a value added approach. J. Pathol. Inform. 2:39
32. Evans AJ. 2011. Re: Barriers and facilitators to adoption of soft copy interpretation from the user per-spective: lessons learned from filmless radiology for slideless pathology. J. Pathol. Inform. 2:8
33. Evans AJ, Sinard JH, Fatheree LA, Henricks WH, Carter AB, et al. 2011. Validating whole slide imagingfor diagnostic purposes in pathology: recommendations of the College of American Pathologists (CAP)Pathology and Laboratory Quality Center. Anal. Cell. Pathol. 34:169–203
34. Jukic DM, Drogowski LM, Martina J, Parwani AV. 2011. Clinical examination and validation of primarydiagnosis in anatomic pathology using whole slide digital images. Arch. Pathol. Lab. Med. 135:372–78
35. Mooney E, Hood AF, Lampros J, Kempf W, Jemec GB. 2011. Comparative diagnostic accuracy in virtualdermatopathology. Skin Res. Technol. 17:251–55
36. Chargari C, Comperat E, Magne N, Vedrine L, Houlgatte A, et al. 2011. Prostate needle biopsy exam-ination by means of virtual microscopy. Pathol. Res. Pract. 207:366–69
37. Fine JL, Grzybicki DM, Silowash R, Ho J, Gilbertson JR, et al. 2008. Evaluation of whole slide imageimmunohistochemistry interpretation in challenging prostate needle biopsies. Hum. Pathol. 39:564–72
38. Tsuchihashi Y, Takamatsu T, Hashimoto Y, Takashima T, Nakano K, Fujita S. 2008. Use of virtual slidesystem for quick frozen intra-operative telepathology diagnosis in Kyoto, Japan. Diagn. Pathol. 3(Suppl.1):6
39. Fallon MA, Wilbur DC, Prasad M. 2010. Ovarian frozen section diagnosis: Use of whole-slide imagingshows excellent correlation between virtual slide and original interpretations in a large series of cases.Arch. Pathol. Lab. Med. 134:1020–23
40. Nielsen PS, Lindebjerg J, Rasmussen J, Starklint H, Waldstrom M, Nielsen B. 2010. Virtual microscopy:an evaluation of its validity and diagnostic performance in routine histologic diagnosis of skin tumors.Hum. Pathol. 41:1770–76
41. Ramey JP, Fung K, Hassell LA. 2011. Validation of pathologist use of whole slide images for remotefrozen section evaluation. Mod. Pathol. 24:436 (Abstr.)
42. Ramey JP, Fung K, Hassell LA. 2011. Use of mobile high resolution device for remote frozen sectionevaluation of whole slide images. Mod. Pathol. 24:341 (Abstr.)
43. Reyes C, Ikpatt F, Nadiji M, Cote RJ. 2011. Is virtual microscopy ready for the prime time? A comparisonwith conventional microscopy. Mod. Pathol. 24:454 (Abstr.)
44. Ho J. 2009. Validating digital slides for clinical use: When is image quality good enough? Presented at Pathol.Vis. Conf., San Diego
45. Sawai T, Uzuki M, Kamataki A, Tofukuji I. 2010. The state of telepathology in Japan. J. Pathol. Inform.1:13
46. Rodriguez-Urrego PA, Cronin AM, Al-Ahmadie HA, Gopalan A, Tickoo SK, et al. 2011. Interob-server and intraobserver reproducibility in digital and routine microscopic assessment of prostate needlebiopsies. Hum. Pathol. 42:68–74
47. Wilbur DC, Madi K, Colvin RB, Duncan LM, Faquin WC, et al. 2009. Whole-slide imaging digitalpathology as a platform for teleconsultation: a pilot study using paired subspecialist correlations. Arch.Pathol. Lab. Med. 133:1949–53
48. Bloom K. 2009. The virtual consultative network. Presented at Pathol. Vis. Conf., San Diego49. Spinosa JC. 2008. Minute by minute, digital a boon to tumor board. Coll. Am. Pathol. Today 2008
Arch.:Oct.50. Hede K. 2008. Breast cancer testing scandal shines spotlight on black box of clinical laboratory testing.
J. Natl. Cancer Inst. 100:836–4451. Lopez AM, Graham AR, Barker GP, Richter LC, Krupinski EA, et al. 2009. Virtual slide telepathology
enables an innovative telehealth rapid breast care clinic. Hum. Pathol. 40:1082–9152. Raab SS, Nakhleh RE, Ruby SG. 2005. Patient safety in anatomic pathology: measuring discrepancy
frequencies and causes. Arch. Pathol. Lab. Med. 129:459–6653. Manion E, Cohen MB, Weydert J. 2008. Mandatory second opinion in surgical pathology referral
material: clinical consequences of major disagreements. Am. J. Surg. Pathol. 32:732–3754. Raab SS, Grzybicki DM, Mahood LK, Parwani AV, Kuan SF, Rao UN. 2008. Effectiveness of random
and focused review in detecting surgical pathology error. Am. J. Clin. Pathol. 130:905–12
356 Ghaznavi et al.
Ann
u. R
ev. P
atho
l. M
ech.
Dis
. 201
3.8:
331-
359.
Dow
nloa
ded
from
ww
w.a
nnua
lrev
iew
s.or
gby
Cas
e W
este
rn R
eser
ve U
nive
rsity
on
11/1
2/13
. For
per
sona
l use
onl
y.

PM08CH13-Feldman ARI 13 December 2012 19:7
55. Woolgar JA, Ferlito A, Devaney KO, Rinaldo A, Barnes L. 2011. How trustworthy is a diagnosis in headand neck surgical pathology? A consideration of diagnostic discrepancies (errors). Eur. Arch. Otorhino-laryngol. 268:643–51
56. Graham AR, Bhattacharyya AK, Scott KM, Lian F, Grasso LL, et al. 2009. Virtual slide telepathology foran academic teaching hospital surgical pathology quality assurance program. Hum. Pathol. 40:1129–36
57. Hassell LA, Fung KM, Chaser B. 2011. Digital slides and ACGME resident competencies in anatomicpathology: an altered paradigm for acquisition and assessment. J. Pathol. Inform. 2:27
58. Bruch LA, De Young BR, Kreiter CD, Haugen TH, Leaven TC, Dee FR. 2009. Competency assessmentof residents in surgical pathology using virtual microscopy. Hum. Pathol. 40:1122–28
59. Fonyad L, Gerely L, Cserneky M, Molnar B, Matolcsy A. 2010. Shifting gears higher—digital slides ingraduate education—4 years experience at Semmelweis University. Diagn. Pathol. 5:73
60. Li L, Dangott BJ, Parwani AV. 2010. Development and use of a genitourinary pathology digital teachingset for trainee education. J. Pathol. Inform. 1:2
61. Marchevsky AM, Khurana R, Thomas P, Scharre K, Farias P, Bose S. 2006. The use of virtual microscopyfor proficiency testing in gynecologic cytopathology: a feasibility study using ScanScope. Arch. Pathol.Lab. Med. 130:349–55
62. Stewart J 3rd, Miyazaki K, Bevans-Wilkins K, Ye C, Kurtycz DF, Selvaggi SM. 2007. Virtual microscopyfor cytology proficiency testing: Are we there yet? Cancer 111:203–9
63. Fung KM, Hassell LA, Talbert ML, Wiechmann AF, Chaser BE, Ramey J. 2012. Whole slide imagesand digital media in pathology education, testing, and practice: the Oklahoma experience. Anal. Cell.Pathol. 35:37–40
64. van den Tweel JG, Bosman FT. 2011. The use of virtual slides in the EUROPALS examination. Diagn.Pathol. 6(Suppl. 1):23
65. Merk M, Knuechel R, Perez-Bouza A. 2010. Web-based virtual microscopy at the RWTH AachenUniversity: didactic concept, methods and analysis of acceptance by the students. Ann. Anat. 192:383–87
66. Paulsen FP, Eichhorn M, Brauer L. 2010. Virtual microscopy: the future of teaching histology in themedical curriculum? Ann. Anat. 192:378–82
67. Collier L, Dunham S, Braun MW, O’Loughlin VD. 2012. Optical versus virtual: teaching assistantperceptions of the use of virtual microscopy in an undergraduate human anatomy course. Anat. Sci. Educ.5:10–19
68. Farah CS, Maybury TS. 2009. The e-evolution of microscopy in dental education. J. Dent. Educ. 73:942–49
69. Helin H, Lundin M, Lundin J, Martikainen P, Tammela T, et al. 2005. Web-based virtual microscopyin teaching and standardizing Gleason grading. Hum. Pathol. 36:381–86
70. Lundin M, Lundin J, Helin H, Isola J. 2004. A digital atlas of breast histopathology: an application ofWeb based virtual microscopy. J. Clin. Pathol. 57:1288–91
71. Angeletti C, Harvey NR, Khomitch V, Fischer AH, Levenson RM, Rimm DL. 2005. Detection ofmalignancy in cytology specimens using spectral-spatial analysis. Lab. Investig. 85:1555–64
72. Jaganath R, Angeletti C, Levenson RM, Rimm DL. 2004. Diagnostic classification of urothelial cells inurine cytology specimens using exclusively spectral information. Cancer 102:186–91
73. Mansoor I, Zalles C, Zahid F, Gossage K, Levenson RM, Rimm DL. 2008. Fine-needle aspiration offollicular adenoma versus parathyroid adenoma: the utility of multispectral imaging in differentiatinglesions with subtle cytomorphologic differences. Cancer 114:22–26
74. Levenson RM. 2006. Spectral imaging perspective on cytomics. Cytometry A 69:592–60075. Levenson RM, Lynch DT, Kobayashi H, Backer JM, Backer MV. 2008. Multiplexing with multispectral
imaging: from mice to microscopy. Inst. Lab. Anim. Res. J. 49:78–8876. Levenson RM, Mansfield JR. 2006. Multispectral imaging in biology and medicine: slices of life. Cytometry
A 69:748–5877. Mansfield JR, Gossage KW, Hoyt CC, Levenson RM. 2005. Autofluorescence removal, multiplexing,
and automated analysis methods for in-vivo fluorescence imaging. J. Biomed. Opt. 10:4120778. Al-Kofahi Y, Lassoud W, Grama K, Nath S, Zhu J, et al. 2011. Cell-based quantification of molecular
biomarkers in histopathology specimens. Histopathology 59:40–54
www.annualreviews.org • Digital Imaging in Pathology 357
Ann
u. R
ev. P
atho
l. M
ech.
Dis
. 201
3.8:
331-
359.
Dow
nloa
ded
from
ww
w.a
nnua
lrev
iew
s.or
gby
Cas
e W
este
rn R
eser
ve U
nive
rsity
on
11/1
2/13
. For
per
sona
l use
onl
y.

PM08CH13-Feldman ARI 13 December 2012 19:7
79. Al-Kofahi Y, Lassoued W, Lee W, Roysam B. 2010. Improved automatic detection and segmentationof cell nuclei in histopathology images. IEEE Trans. Biomed. Eng. 57:841–52
80. Levenson RM. 2004. Spectral imaging and pathology: seeing more. Lab. Med. 4:244–5181. Dicker DT, Lerner J, Van Belle P, Barth SF, Guerry D, et al. 2006. Differentiation of normal skin and
melanoma using high resolution hyperspectral imaging. Cancer Biol. Ther. 5:1033–3882. Keshava N. 2003. A survey of spectral unmixing algorithms. Lincoln Lab. J. 14:55–7883. Woolfe F, Gerdes M, Bello M, Tao X, Can A. 2010. Autofluorescence removal by non-negative matrix
factorization. IEEE Trans. Image Process 20:1085–9384. Moeder CB, Giltnane JM, Moulis SP, Rimm DL. 2009. Quantitative, fluorescence-based in situ assess-
ment of protein expression. Methods Mol. Biol. 520:163–7585. Dolled-Filhart M, Gustavson M, Camp RL, Rimm DL, Tonkinson JL, Christiansen J. 2010. Automated
analysis of tissue microarrays. Methods Mol. Biol. 664:151–6286. Menard S, Balsari A, Tagliabue E, Camerini T, Casalini P, et al. 2008. Biology, prognosis and response
to therapy of breast carcinomas according to HER2 score. Ann. Oncol. 19:1706–1287. Chivukula M, Bhargava R, Brufsky A, Surti U, Dabbs DJ. 2008. Clinical importance of HER2 immuno-
histologic heterogeneous expression in core-needle biopsies versus resection specimens for equivocal(immunohistochemical score 2+) cases. Mod. Pathol. 21:363–68
88. Kurosumi M. 2007. Immunohistochemical assessment of hormone receptor status using a new scoringsystem ( J-score) in breast cancer. Breast Cancer 14:189–93
89. Camp RL, Chung GG, Rimm DL. 2002. Automated subcellular localization and quantification of proteinexpression in tissue microarrays. Nat. Med. 8:1323–27
90. Ryan D, Mulrane L, Rexhepaj E, Gallagher WM. 2011. Tissue microarrays and digital image analysis.Methods Mol. Biol. 691:97–112
91. Mulrane L, Rexhepaj E, Penney S, Callanan JJ, Gallagher WM. 2008. Automated image analysis inhistopathology: a valuable tool in medical diagnostics. Expert Rev. Mol. Diagn. 8:707–25
92. Taylor CR, Levenson RM. 2006. Quantification of immunohistochemistry—issues concerning methods,utility and semiquantitative assessment. II. Histopathology 49:411–24
93. Anagnostou VK, Welsh AW, Giltnane JM, Siddiqui S, Liceaga C, et al. 2010. Analytic variability inimmunohistochemistry biomarker studies. Cancer Epidemiol. Biomark. Prev. 19:982–91
94. Emerson JW, Dolled-Filhart M, Harris L, Rimm DL, Tuck DP. 2009. Quantitative assessment of tissuebiomarkers and construction of a model to predict outcome in breast cancer using multiple imputation.Cancer Inform. 7:29–40
95. Rodenacker K, Bengtsson E. 2003. A feature set for cytometry on digitized microscopic images. Anal.Cell Pathol. 25:1–36
96. Watts DJ, Strogatz SH. 1998. Collective dynamics of “small-world” networks. Nature 393:440–4297. Wuchty S, Stadler PF. 2003. Centers of complex networks. J. Theor. Biol. 223:45–5398. Boucheron LE, Harvey NR, Manjunath BS. 2008. On using cytoplasm and stroma features in automated
cancer diagnosis. Presented at Workshop Bio-Image Inform. Biol. Imaging, Comput. Vis. Data Min.,Santa Barbara
99. Peng Y, Wu Z, Jiang J. 2009. A novel feature selection approach for biomedical data classification.J. Biomed. Inform. 43:15–23
100. Sima C, Dougherty ER. 2006. What should be expected from feature selection in small-sample settings.Bioinformatics 22:2430–36
101. Xiong M, Fang X, Zhao J. 2001. Biomarker identification by feature wrappers. Genome Res. 11:1878–87102. Jain A, Zongker D. 1997. Feature selection: evaluation, application, and small sample performance. IEEE
Trans. Pattern Anal. Mach. Intell. 19:153–58103. Jolliffe IT. 2002. Principal Component Analysis. New York: Springer104. Qiao H, Zhang P, Zhang B, Zheng S. 2009. Learning an intrinsic-variable preserving manifold for
dynamic visual tracking. IEEE Trans. Syst. Man Cybern. B 40:868–80105. Takahashi S, Fujishiro I, Okada M. 2009. Applying manifold learning to plotting approximate contour
trees. IEEE Trans. Vis. Comput. Graph. 15:1185–92106. Hou Y, Zhang P, Xu X, Zhang X, Li W. 2009. Nonlinear dimensionality reduction by locally linear
inlaying. IEEE Trans. Neural Netw. 20:300–15
358 Ghaznavi et al.
Ann
u. R
ev. P
atho
l. M
ech.
Dis
. 201
3.8:
331-
359.
Dow
nloa
ded
from
ww
w.a
nnua
lrev
iew
s.or
gby
Cas
e W
este
rn R
eser
ve U
nive
rsity
on
11/1
2/13
. For
per
sona
l use
onl
y.

PM08CH13-Feldman ARI 13 December 2012 19:7
107. Li X, Lin S, Yan S, Xu D. 2008. Discriminant locally linear embedding with high-order tensor data.IEEE Trans. Syst. Man Cybern. B 38:342–52
108. Law MH, Jain AK. 2006. Incremental nonlinear dimensionality reduction by manifold learning. IEEETrans. Pattern Anal. Mach. Intell. 28:377–91
109. Madabhushi A, Yang P, Rosen M, Weinstein S. 2006. Distinguishing lesions from posterior acousticshadowing in breast ultrasound via non-linear dimensionality reduction. Conf. Proc. IEEE Eng. Med. Biol.Soc. 1:3070–73
110. Yan S, Xu D, Zhang B, Zhang HJ, Yang Q, Lin S. 2007. Graph embedding and extensions: a generalframework for dimensionality reduction. IEEE Trans. Pattern Anal. Mach. Intell. 29:40–51
111. Madabhushi A, Shi J, Rosen M, Tomaszeweski JE, Feldman MD. 2005. Graph embedding to improvesupervised classification and novel class detection: application to prostate cancer. Med. Image Comput.Comput. Assist. Interv. 8:729–37
112. Kuncheva LI. 1993. An aggregation of pro and con evidence for medical decision support systems.Comput. Biol. Med. 23:417–24
113. Kuncheva LI. 1991. Evaluation of computerized medical diagnostic decisions via fuzzy sets. Int. J. Biomed.Comput. 28:91–100
114. Kuncheva LI. 1990. Fuzzy multi-level classifier for medical applications. Comput. Biol. Med. 20:421–31115. Doyle S, Hwang M, Shah K, Madabhushi A, Tomaszeweski J, Feldman M. 2007. Automated grading of
prostate cancer using architectural and textural image features. Int. Symp. Biomed. Imaging, pp. 1284–87116. Rajpoot K, Rajpoot N. 2004. SVM optimization for hyperspectral colon tissue cell classification. Med.
Image Comput. Comput. Assist. Interv. 2:829–37117. Qureshi HNR, Wilson R, Nattkemper T, Hans V. 2007. Comparative analysis of discriminant wavelet
packet features and raw image features for classification of meningioma subtypes. Presented at Med. ImageUnderst. Anal., Aberystwyth, Wales
118. Doyle S, Madabhushi A, Feldman M, Tomaszeweski J. 2006. A boosting cascade for automated detectionof prostate cancer from digitized histology. Med. Image Comput. Comput. Assist. Interv. 9:504–11
119. Jafari-Khouzani K, Soltanian-Zadeh H. 2003. Multiwavelet grading of pathological images of prostate.IEEE Trans. Biomed. Eng. 50:697–704
120. Tabesh A, Teverovskiy M, Pang HY, Kumar VP, Verbel D, et al. 2007. Multifeature prostate cancerdiagnosis and Gleason grading of histological images. IEEE Trans. Med. Imaging 26:1366–78
121. Madabhushi A, Doyle S, Lee G, Basavanhally A, Monaco J, et al. 2010. Integrated diagnostics: a con-ceptual framework with examples. Clin. Chem. Lab. Med. 48:989–98
122. Beck AH, Sangoi AR, Leung S, Marinelli RJ, Nielsen TO, et al. 2011. Systematic analysis of breastcancer morphology uncovers stromal features associated with survival. Sci. Transl. Med. 3:108ra13
www.annualreviews.org • Digital Imaging in Pathology 359
Ann
u. R
ev. P
atho
l. M
ech.
Dis
. 201
3.8:
331-
359.
Dow
nloa
ded
from
ww
w.a
nnua
lrev
iew
s.or
gby
Cas
e W
este
rn R
eser
ve U
nive
rsity
on
11/1
2/13
. For
per
sona
l use
onl
y.

PM08-FrontMatter ARI 17 December 2012 9:46
Annual Review ofPathology:Mechanisms ofDisease
Volume 8, 2013Contents
Pathogenesis of Langerhans Cell HistiocytosisGayane Badalian-Very, Jo-Anne Vergilio, Mark Fleming,
and Barrett J. Rollins � � � � � � � � � � � � � � � � � � � � � � � � � � � � � � � � � � � � � � � � � � � � � � � � � � � � � � � � � � � � � � � � � � � � � � � 1
Molecular Pathophysiology of Myelodysplastic SyndromesR. Coleman Lindsley and Benjamin L. Ebert � � � � � � � � � � � � � � � � � � � � � � � � � � � � � � � � � � � � � � � � � � � � � � �21
The Role of Telomere Biology in CancerLifeng Xu, Shang Li, and Bradley A. Stohr � � � � � � � � � � � � � � � � � � � � � � � � � � � � � � � � � � � � � � � � � � � � � � � �49
Chromosome Translocation, B Cell Lymphoma,and Activation-Induced Cytidine DeaminaseDavide F. Robbiani and Michel C. Nussenzweig � � � � � � � � � � � � � � � � � � � � � � � � � � � � � � � � � � � � � � � � � � �79
Autophagy as a Stress-Response and Quality-Control Mechanism:Implications for Cell Injury and Human DiseaseLyndsay Murrow and Jayanta Debnath � � � � � � � � � � � � � � � � � � � � � � � � � � � � � � � � � � � � � � � � � � � � � � � � � � � 105
Pathogenesis of Antineutrophil Cytoplasmic Autoantibody–AssociatedSmall-Vessel VasculitisJ. Charles Jennette, Ronald J. Falk, Peiqi Hu, and Hong Xiao � � � � � � � � � � � � � � � � � � � � � � � � � 139
Molecular Basis of Asbestos-Induced Lung DiseaseGang Liu, Paul Cheresh, and David W. Kamp � � � � � � � � � � � � � � � � � � � � � � � � � � � � � � � � � � � � � � � � � � 161
Progressive Multifocal Leukoencephalopathy: Why Grayand White MatterSarah Gheuens, Christian Wuthrich, and Igor J. Koralnik � � � � � � � � � � � � � � � � � � � � � � � � � � � � � � 189
IgA Nephropathy: Molecular Mechanisms of the DiseaseJiri Mestecky, Milan Raska, Bruce A. Julian, Ali G. Gharavi,
Matthew B. Renfrow, Zina Moldoveanu, Lea Novak, Karel Matousovic,and Jan Novak � � � � � � � � � � � � � � � � � � � � � � � � � � � � � � � � � � � � � � � � � � � � � � � � � � � � � � � � � � � � � � � � � � � � � � � � � � � 217
Host Responses in Tissue Repair and FibrosisJeremy S. Duffield, Mark Lupher, Victor J. Thannickal,
and Thomas A. Wynn � � � � � � � � � � � � � � � � � � � � � � � � � � � � � � � � � � � � � � � � � � � � � � � � � � � � � � � � � � � � � � � � � � � � 241
v
Ann
u. R
ev. P
atho
l. M
ech.
Dis
. 201
3.8:
331-
359.
Dow
nloa
ded
from
ww
w.a
nnua
lrev
iew
s.or
gby
Cas
e W
este
rn R
eser
ve U
nive
rsity
on
11/1
2/13
. For
per
sona
l use
onl
y.

PM08-FrontMatter ARI 17 December 2012 9:46
Cellular Heterogeneity and Molecular Evolution in CancerVanessa Almendro, Andriy Marusyk, and Kornelia Polyak � � � � � � � � � � � � � � � � � � � � � � � � � � � � � � 277
The Immunobiology and Pathophysiology of Primary Biliary CirrhosisGideon M. Hirschfield and M. Eric Gershwin � � � � � � � � � � � � � � � � � � � � � � � � � � � � � � � � � � � � � � � � � � � � 303
Digital Imaging in Pathology: Whole-Slide Imaging and BeyondFarzad Ghaznavi, Andrew Evans, Anant Madabhushi,
and Michael Feldman � � � � � � � � � � � � � � � � � � � � � � � � � � � � � � � � � � � � � � � � � � � � � � � � � � � � � � � � � � � � � � � � � � � � 331
Pathological and Molecular Advances in PediatricLow-Grade AstrocytomaFausto J. Rodriguez, Kah Suan Lim, Daniel Bowers,
and Charles G. Eberhart � � � � � � � � � � � � � � � � � � � � � � � � � � � � � � � � � � � � � � � � � � � � � � � � � � � � � � � � � � � � � � � � � 361
Diagnostic Applications of High-Throughput DNA SequencingScott D. Boyd � � � � � � � � � � � � � � � � � � � � � � � � � � � � � � � � � � � � � � � � � � � � � � � � � � � � � � � � � � � � � � � � � � � � � � � � � � � � � � � � 381
Pathogenesis of the Viral Hemorrhagic FeversSlobodan Paessler and David H. Walker � � � � � � � � � � � � � � � � � � � � � � � � � � � � � � � � � � � � � � � � � � � � � � � � � � 411
Skeletal Muscle Degenerative Diseases and Strategies for TherapeuticMuscle RepairMohammadsharif Tabebordbar, Eric T. Wang, and Amy J. Wagers � � � � � � � � � � � � � � � � � � � 441
The Th17 Pathway and Inflammatory Diseases of the Intestines,Lungs, and SkinCasey T. Weaver, Charles O. Elson, Lynette A. Fouser, and Jay K. Kolls � � � � � � � � � � � � � � 477
Indexes
Cumulative Index of Contributing Authors, Volumes 1–8 � � � � � � � � � � � � � � � � � � � � � � � � � � � � � � 513
Cumulative Index of Article Titles, Volumes 1–8 � � � � � � � � � � � � � � � � � � � � � � � � � � � � � � � � � � � � � � � � 517
Errata
An online log of corrections to Annual Review of Pathology: Mechanisms of Disease articlesmay be found at http://pathol.annualreviews.org
vi Contents
Ann
u. R
ev. P
atho
l. M
ech.
Dis
. 201
3.8:
331-
359.
Dow
nloa
ded
from
ww
w.a
nnua
lrev
iew
s.or
gby
Cas
e W
este
rn R
eser
ve U
nive
rsity
on
11/1
2/13
. For
per
sona
l use
onl
y.