digital marketing benchmarks leveraged by marketing
TRANSCRIPT
EFZG WORKING PAPER SERIES E FZ G SER IJ A Č LAN AK A U NAS TA JAN J U I S S N 1 8 4 9 - 6 8 5 7 U D C 3 3 : 6 5
No. 20-01
Petra Leonora Cvitanović
Digital Marketing Benchmarks
Leveraged by Marketing Analytics Tools
J. F. Kennedy sq. 6 10000 Zagreb, Croatia Tel +385(0)1 238 3333
www.efzg.hr/wps [email protected]
E F Z G W O R K I N G P A P E R S E R I E S 2 0 - 0 1
Page 2 of 13
Digital Marketing Benchmarks
Leveraged by Marketing Analytics
Tools
Petra Leonora Cvitanović [email protected]
Ekonomski fakultet Zagreb
The views expressed in this working paper are those of the author(s) and not necessarily represent those of the Faculty of Economics and Business – Zagreb. The paper has not undergone formal review or approval. The paper is published to
bring forth comments on research in progress before it appears in final form in an academic journal or elsewhere.
Copyright January 2020 by Petra Leonora Cvitanović All rights reserved.
Sections of text may be quoted provided that full credit is given to the source.
E F Z G W O R K I N G P A P E R S E R I E S 2 0 - 0 1
Page 3 of 13
Abstract
The aim of this paper is to provide a structured overview of several useful marketing analytics tools
and guidance in creation of company’s own digital marketing dashboard and benchmarks. These tools
display in a clear and creative manner the trends and dynamics of the numbers (budgets, costs,
investment), the percentages (shares, ratios), as well as various statistical data, rankings and KPIs. By
exploiting the data from marketing analytics tools, the entire business of a company can be leveraged.
Ideally, the data should be regularly monitored and benchmarked to relevant criteria and business
results of the industry leaders. If some benchmarks are not available within a marketing analytics tool,
a company can develop own benchmarking system and scales based on own database. Then it would
be able to personalize such dashboards to great extent – to reflect own product assortment, lines of
business, digital capabilities of own B2B partners, and allow scores comparison through markets and
through time (MoM / YoY trends and dynamics). By combining external and internal analytics tools, a
company can achieve insights of greater value in relation to its core-business, products / services and
its digital marketing strategy. This paper covers detailed review of digital marketing metrics within the
selected tools, by also mentioning the major advantages and disadvantages of each tool. The paper
also discusses development of internal digital marketing standards, ranking scales and benchmarking
criteria which can support decision-making in digital marketing practice, and it also addresses the
probable direction of future development of marketing analytics tools in general.
Key words
digital marketing analytics tools, data-driven marketing, marketing dashboards, digital marketing
benchmarks, digital marketing metrics
JEL classification
M31
E F Z G W O R K I N G P A P E R S E R I E S 2 0 - 0 1
Page 4 of 13
1. INTRODUCTION
It is difficult to imagine how the society of today would collect information, communicate and
interact in various situations, and/or purchase goods and services without digital technologies. What
used to be difficult to imagine would ever exist, today has become the firm new norm - the starting
point for all other activities in an average day of a modern-day citizen or business. From the
perspective of businesses using online and mobile platforms for trade and advertising of products /
services, measuring of profitability and tracking of dynamics and trends through analytics tools and
dashboards has become “the new black”. With valuable analytics tools in place offering data on a
silver platter, the only remaining obstacle is the sceptical mind-set of some digital marketers. Apart
from digital marketers who have already embraced the analytical part of marketing job as its integral
component equal to any other, there are a few who don’t quite jump with joy when terms “data” and
“analysis” are mentioned. When confronted with some marketing analytics tools or marketing
dashboards, they chose to carefully watch from afar and continue neglecting them as valuable sources
of information. Perhaps they believe that creativity as such cannot be integrated into analytics, not
even when it comes to the systems which support marketing decision-making (i.e. marketing
intelligence tools) and therefore they take their time with fully adopting marketing analytics tools and
integrating them in their daily work. But the lack of creativity cannot be what is keeping them from
approaching these tools with curiosity and faith, can it? Most probably they lack the knowledge to feel
confident about using the available data in their work effectively. (Carstensen, 2019) The practical use
of analytics is up to the people who work in a company, who need to not only know how to gather data
but also how to use it correctly. (Technopedia, 2019) The data which these tools provide is arguably
100% applicable to every business scenario and/or every company but without this data it would be
like doing business “in the dark” so it is better to use them than not to use them at all. By exploiting
the data from these databases, the entire business can be leveraged, not just the marketing of a
company. These tools display in a clear manner the trends and dynamics of the most important
numbers (budgets, costs), the percentages (shares, ratios) as well as various statistics, rankings and
Key Performance Indicators (KPIs). KPI is a measure for evaluating how well an organization is
achieving its stated goals and objectives, and benchmarks are what helps the company establish the
appropriate targets and performance thresholds for its KPIs so that it knows if it is on the right path or
not. (Heffernan, 2019) Marketing KPIs can vary widely within particular industries so using an
average marketing KPI would not be appropriate for evaluating the success of a particular marketing
initiative. (Kononenko, 2018)
The author’s motivation to perform analysis on this subject is both personal and professional
interest in all aspects of digitization, especially when it comes to the areas related to online and mobile
marketing as the main pillars of modern-day omnipresent B2C communication. With the intention of
being an active agent in changing readers’ attitudes towards data-driven marketing and digital
marketing benchmarks, the author proactively approaches various aspects of digital marketing
analytics. Some of the insights presented in this paper stem from author’s own work experience at the
position of Marketing Analytics Manager for EMEA region at Microsoft Hrvatska d.o.o. where the
author has used marketing analytics tools in practice for the purpose of analyses and internal reporting
during period from November 2018 to January 2020. During this scientific research, which took place
in the period from January 2019 to January 2020 different sources were used to collect information -
not just mainstream literature but also many online sources. Considering that in general digital
analytics tools is a rather new area of research, not many industry books and professional papers have
been found which would cover the topics of digital marketing analytics, marketing dashboards and
digital marketing benchmarks. The lack of recognized references represents the main limitation of this
research. To perform search within Emerald Insight database, the author used the following keywords
and search terms related to the field of digital marketing: digital data analytics, digital marketing
analytics tools, marketing intelligence, data-driven marketing, marketing dashboards, marketing
benchmarks, benchmarking criteria, digital marketing metrics, marketing budgets, competitive
benchmarking, digital marketing benchmarks, online marketing, mobile marketing, e-commerce, m-
commerce, cognitive analytics, predictive analytics, and other related terms. During the writing of this
E F Z G W O R K I N G P A P E R S E R I E S 2 0 - 0 1
Page 5 of 13
paper, the methods of analysis and synthesis were used, and deductive and inductive reasoning
applied.
The aim of this paper is to provide a structured overview of different types of analytics tools
in digital marketing practice and to highlight the importance of benchmarks in digital marketing. The
paper provides an overview of marketing analytics tools and discusses development of internal digital
marketing standards and criteria which can be internally developed. The paper is consisted of
introduction chapter, middle chapter and the conclusion. The main chapter opens with the discussion
on which analytics tools to invest in and what the companies should consider when deciding which
tools they will choose. After giving an overview of top marketing analytics tools in author’s
professional opinion, the author explains how internal analytics tools and developing own benchmarks
can benefit marketing decision-making. The emphasis is placed on digital marketing benchmarks and
how marketing analytics tools can leverage them. The final chapter addresses the changing attitude of
Digital Marketing Managers towards the usage of analytics tools in everyday decision-making. The
author mentions probable future implications and outlines recommendations for future research.
2. DIGITAL MARKETING BENCHMARKS LEVERAGED BY MARKETING ANALYTICS
TOOLS
Approximately a decade ago many authors began writing about the importance of marketing
decision support systems. Back then analytics tools have not yet been invented. Everyone seemed
fascinated by the idea of having a system for gathering information which would be “flexible,
computerized and which would enable managers to obtain and manipulate information as they are
making decisions” (Lamb, Hair, McDaniel, 2009) The term “marketing analytics tools” refers to the
platforms, online applications and databases specifically developed for the purpose of analysis of
numerous digital marketing initiatives of companies which do business at the online market. The
major parties which are taken into account in this arena include the players of the “game”: e-retailers,
digital visitors, digital buyers, the suppliers, non-consumers and of course, the competitors) on
separate local markets and the global market. Marketing analytics tools provide insight into their
activities tied to e-Commerce, conversions, traffic and engagement. Using the right analytics tools
which track all of company’s digital marketing data through all of the channels and platforms, helps
Marketing Managers make more informed decisions about adapting digital marketing strategies.
(Fronetics, 2019) The term “benchmarking” understands evaluating own strategies and operations
against best-in-class results, practices and methodologies in order to improve own performance.
According to Gowing, digital marketing benchmarking can be described as “a method of objectively
evaluating own company’s digital marketing activities after carrying out an assessment of own
existing digital marketing activities, tracking how often they are carried out, how much they are
engaged with and what effect they have. Once a company has a snapshot of the quality of own digital
marketing at the present moment, the next step is to use this information for improvements in the
future”. (Gowing, 2016) Benchmarks should not be confused with best - practice cases but should
rather be viewed as best case scenarios (i.e. ideals) which a business should strive towards. When a
company knows its similarities to and discrepancies from the benchmarked goal, it is much easier to
understand own market position, competitors’ positions and to take appropriate actions at a certain
moment in time. Benchmarking involves identification who to benchmark against, selection of
business aspects which will be benchmarked, collection of relevant data which will enable comparison
of processes and operations, as well as own processes with the identified benchmarks. (Hooley et al.,
2017) If some benchmarks are not available within a certain analytics tool, a company can develop
own benchmarking system according to which it will track digital marketing execution on its own,
taking into account own digital capabilities, as well as those of its B2B clients / partners.
2.1. HOW MOBILE TECHNOLOGY HAS AFFECTED HUMAN LIFESTYLE
For the past fifteen years digital transformation has revolutionized all aspects of business
across all industries. Digitalization is one of the most significant on-going transformations of
contemporary society and it encompasses many elements of business (Hagberg, Sundstrom and
Zandén, 2016). New online IT solutions and applications allow tracking of marketing activities in
E F Z G W O R K I N G P A P E R S E R I E S 2 0 - 0 1
Page 6 of 13
online environment in marketing dashboards by providing easy and transparent measurement of
success rates, profitability and effectiveness of each marketing activity. The technologies integrated in
the mobile devices are constantly being upgraded and changing the world we live in. On a mundane
level, this offers more and more possibilities to individuals for better organization of their everyday
lives, time savings, money savings, spending more quality time with family and friends; achieving
satisfactory work-life balance; finding the best deals; travelling more and affording themselves luxury
goods and services. Thanking to handheld devices which have caused mobile to become the number
one channel of communication and trade, lifestyle of millions of people across the world is being
leveraged to a whole new level. Various forms of technological equipment are present in individuals’
day-to-day activities, and new forms of communication are developing rapidly (e.g. new social media
platforms or smartphone apps). (Backholm et al., 2018)
To illustrate how technology affects and irreversibly changes humanity, let’s take
Scandinavian markets as an excellent example of highly digitised society; where technology is highly
developed and immersed into all aspects of everyday life of local citizens, making it a benchmarking
paragon to other countries. In Norway, most of the citizens don’t carry cash on them and they rely
mostly on debit cards, credit cards and mobile payment apps for common purchases (Nikel, 2018).
Most of the communication between companies and end-consumers who are gathering information
online, happens via their smart phones. Precisely, in the period of only a couple of months, from April
2019 to June 2019, incoming website traffic on some of the most popular websites in Norway within
“e-Commerce and shopping” category derived from desktop search. This makes up 37%-54% of total
website traffic in the observed period, while mobile traffic gains greater share in the total traffic - from
45% up to 63%. In Sweden the results are even more impressive, with desktop search between 30%
and 37% and mobile search between 63% and 70% (SimilarWeb, 2019) depending on the digital
retailer (in this analysis the following Nordic e-retailers were included: Elkjop, Expert/Power,
Komplett, GameStop, Cdon, NetOnNet and MediaMarkt). In other words, individuals residing in these
countries search for information using dominantly their mobile phones, they regularly make mobile
purchases and carry their smart phones with them at all times. With forecasted mobile commerce (i.e.
“m-Commerce”) sales rising from 4.13 billion USD in 2019 to 5.43 billion USD in 2023 (eMarketer
PRO, 2019), it is expected that in the upcoming years the usage of mobile devices in general will rise
further and mobile technologies will play even a greater role in people’s lives than they do today.
2.2. WHICH ANALYTICS TOOLS TO INVEST IN?
In the world of data in which we live in, the power of data must not be underestimated. The
importance of data science is growing day by day in all industries, specifically in telecommunications
and high-tech industries. With the enormous quantity of data being collected each day, the demand for
tools which will help analyse and make sense of it all has gone through the roof. Online environment
has been flooded with analytics tools in the past years – now there are data analytics tools, business
analytics tools, website analytics tools, social media analytics tools, content analytics tools… but
which one to choose? How long will a tool manage to outlive the competition depends mostly on the
value which it is able to continually provide to the users. Since every business lies on sales and
marketing as two interconnected disciplines, the best approach would be to find a tool which combines
the results of both. Data Scientist will prefer an in-depth, narrow type of tool in which they will be
able to drill down the data and get to the very bottom. However, Business Analysts and Data Analysts
will appreciate a tool which offers an overall view of many more aspects of business and the effect
which they eventually have on company’s cash flow because this data is requested by the
management, who always needs to have knowledge of everything going on in and around the company
what is affecting its business results. Sadly, out of many tools available, there isn’t a single one that
would suit specific needs of every company 100%. This is what brings companies to a standstill when
it comes to choosing the analytics tool they will invest in.
2.2.1. WHAT TO CONSIDER WHEN DECIDING ON ANALYTICS TOOLS?
A digital marketing analytics tool that offers a large quantity of data which cannot be
understood easily and applied into future business-decision, or which is presented in the interface
E F Z G W O R K I N G P A P E R S E R I E S 2 0 - 0 1
Page 7 of 13
without a proper context, can’t bring much value to a company. On the other hand, a tool offering a
small amount of quality data cannot be a solution on its own so a company would need to invest in
additional tools which would supplement it. For a business to be able to drive its marketing based on
data, it is essential that certain metrics are selected from the pool of marketing metrics available and
that they are closely monitored through time. There are hundreds and thousands of different variables
that could be tracked in digital marketing unlike in traditional marketing media. (Erhart, 2016) When
choosing an analytics tool, another very important aspect to consider is its price - in online
environment free tools with open access can be found, but there are also paying tools with yearly
license fees rising up to as much as 10.000 EUR per each company’s subsidiary using it at their
respective local market, which most companies will see as a rather risky investment with a more than
probable very low ROI. Apart from many advantages which external analytics tools bring to the table,
their main disadvantage is the fact that they are designed by independent vendors aiming to achieve
profit of their own business by attracting as many various B2B buyers as possible. They make their
analytics tool too general, hoping they would be able to offer their product / service to a greater
number potential users. Some analytics tools offer a wide overview of a large number of markets
across the world, across all industries, with too general metrics which cannot be applied to every
single company and every market. Other owners of analytics tools make their product way too
granular, allowing deep-diving into a particular field but they don’t give users the big picture because
such tool doesn’t deal with other aspects of digital marketing. Such tool limitations result with
delivering less value to the individual B2B clients/users, and satisfaction of their needs only up to a
certain extent.
Apart from categorizing marketing analytics tools by its mainstream focus (e.g. social media
marketing analytics tools, website analytics tools, etc.), the basic division of analytics tools is into
internal and external ones. While internal analytics tools are mainly developed by the very company
using them for its own purposes with the intention of using it internally for tracking and reporting, the
focus of external analytics tools is mainly on website traffic, website ranking, marketing channels,
market research results, statistical data related to market, marketing benchmarks, various forecasts and
trends. Account-based external tools can be used only by registered individuals/employees of
companies that pay the license fee. Yet many analytics tools can be accessed through a temporary,
free of charge demo account with a fairly limited view of the basic metrics but enough for the users
to get acquainted with the interface and the tool’s possibilities. Nevertheless, even such general data
gathered from several tools at once can be combined in a single report and serve as a valuable business
decision-making platform with an overall comprehensive view for the management.
2.2.2. SHORT OVERVIEW OF TOP MARKETING ANALYTICS TOOLS1
For instance, SimilarWeb offers a variety of data which can be tracked through a desired period, on
a certain market, through metrics such as: website traffic, global or local website ranking, website
visits over time (total traffic and number of unique visitors), share of organic vs. paid traffic, traffic
share between selected websites; demographics and geography of website visitors; overview of
marketing channels generating highest incoming traffic; top referring websites; top keywords / search
terms, search traffic by engines, etc. The data presented in this tool comes both in numerical and
graphical form.
Another relatively easy-to-use tool is SEMrush which offers a smaller number of website
domains and marketing metrics. In SEMrush the focus is on Search Engine Optimization (i.e. “SEO”),
social media metrics and content marketing. Especially useful characteristic of SimilarWeb is the
ranking of a website within a particular category, such as “Computer Electronics and Technology /
Consumer Electronics”, which allows the tool users to gain a deeper understanding of the strength of
the website on a global level, but only within the selected category (i.e. among the websites which are
their biggest competitors). Data extracted from SimilarWeb or SEMrush can give more valuable
insight if complemented with slightly different tools, such as Jumpshot, which tracks the same
websites in the same respective period, but focuses on different metrics. A business can achieve the
1 In the opinion of the author, based on own work experience as the user of the tools during the period of November 2018 – January 2020.
E F Z G W O R K I N G P A P E R S E R I E S 2 0 - 0 1
Page 8 of 13
highest value if it decides to use several different analytics tools simultaneously, each of which would
contain a different set of metrics. In this way, one tool would deliver the data which is missing in the
other one, and vice versa. Specifically in case of SimilarWeb and Jumpshot combo, Jumpshot shows a
number of transactions at partners’ websites, their rankings and share within pre-set categories such as
“Electronics” or “Toys & Video Games”, average prices of products sold on e-retailer websites,
number of conversions / transaction per product brand within a selected period, search engine analysis,
etc. However, Jumpshot does not offer insight into the number of impressions / views of a certain
“product display page” (also called: “a PDP”) nor the number of website visitors (“traffic”), which
would be particularly useful in many analyses of digital marketing performance. One of the most
important benefits of Jumpshot is the extremely useful marketing funnel analysis, which not only
informs the user of the share of visitors per each stage of the funnel, but it also gives a clear
recommendation what next steps to take, which marketing tactics to focus on, in order to improve the
weakest stage of the funnel. For an example:
If only 3.6% of the total number of visitors who interacted with the site in a particular period,
added to cart, Marketing Managers need to adopt tactics which would increase “Add to cart” rate.
In case the share of the visitors who started checkout within the total number of visitors who
added to cart is higher than 80%, it can be concluded that there isn’t such a problem in this stage of
the funnel, compared to the previous stage.
If the share of the visitors who converted (out of the total number of visitors who started
checkout) is 60%-80%, there is room for improvement in this stage.
A wonderful option also offered in funnel view is the possibility to compare a certain website’s funnel
performance with its main competitors at a particular market, which shows in a clear and simple way
the competitive position of each analysed e-retailer website at every stage of the marketing funnel. The
tool’s database from which the tool pulls information into the user interface is being refreshed on a
daily basis, unlike SimilarWeb, which is being refreshed at the beginning of every month.
Next, unlike most of the tools which allow insight into marketing data only, Profitero tool offers
the possibility to analyse digital marketing data of chosen websites at a certain period together with
sales data achieved at web shops of the same websites. What this tool offers, brings its users closest to
digital marketing ROI estimation. The unique value of this tool is seen in its usage at B2B arena – the
platform is designed in such a way to allow access to the manufacturers / brands of products to have
the needed insight into traffic and sales results of their B2B partners (e-retailers) who sell their
products on B2C market. The tool has proved to be especially useful in case of websites which are not
just e-Commerce sites but marketplaces as well, such as: Amazon Germany, Amazon Spain, Amazon
Italy, Amazon UK, Amazon France, Argos UK, Fnac France, John Lewis UK, etc. because it offers
the possibility to separately view and analyse 1P sales data from 3P sales data.2
Certain analytics tools are not related only to digital marketing and can therefore be used also by
other departments in the company. In eMarketer Pro tool different sets of data can be found, including
various analyses, reports, statistics, forecasts, performance metrics, trends and benchmarks for over
250 countries in the world, covering all marketing channels, not just digital marketing ones. The data
found in this tool can be useful for decision-making related to e-Commerce and digital marketing due
to the fact that it provides a number of local benchmarks and downloadable graphic results combined
with the forecasted results on the same matter, covering up to 8-10 years of time-frame in total (e.g.
monitoring revenue dynamics from the year 2015 until 2023). General data needs to be selected and
analysed within the context of a specific market, industry and time frame. Most sought after are the
insights into trends and forecasts for the upcoming 3-4 years period because this gives the users better
understanding of their market.
Statista tool is convenient for finding out statistical data, dossiers, studies, market research results,
etc. for a specific market and a specific industry. Google Trends tool offers useful insights which
could be incorporated into specific local reports because the tool contains specific country, period and
category filters which have to be applied at the start of the analysis. The tool allows also the selection
2 “1P products” are original brand products purchased by the e-retailer such as Amazon, and offered at their web shop to B2C consumers,
whereas “3P products” are products posted to the same website / marketplace by individual persons, resellers or suppliers which are not
monitored by the brand or by Amazon, which generate a significant share of the total sales of a product.
E F Z G W O R K I N G P A P E R S E R I E S 2 0 - 0 1
Page 9 of 13
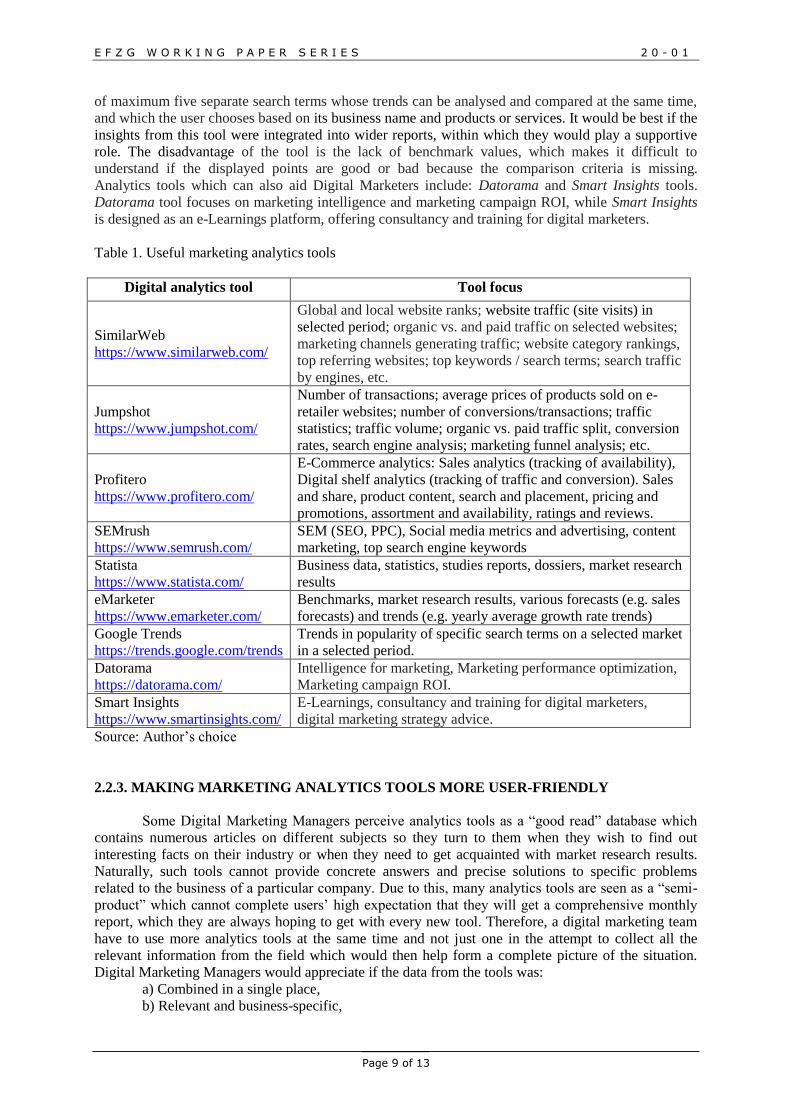
of maximum five separate search terms whose trends can be analysed and compared at the same time,
and which the user chooses based on its business name and products or services. It would be best if the
insights from this tool were integrated into wider reports, within which they would play a supportive
role. The disadvantage of the tool is the lack of benchmark values, which makes it difficult to
understand if the displayed points are good or bad because the comparison criteria is missing.
Analytics tools which can also aid Digital Marketers include: Datorama and Smart Insights tools.
Datorama tool focuses on marketing intelligence and marketing campaign ROI, while Smart Insights
is designed as an e-Learnings platform, offering consultancy and training for digital marketers.
Table 1. Useful marketing analytics tools
Digital analytics tool Tool focus
SimilarWeb
https://www.similarweb.com/
Global and local website ranks; website traffic (site visits) in
selected period; organic vs. and paid traffic on selected websites;
marketing channels generating traffic; website category rankings,
top referring websites; top keywords / search terms; search traffic
by engines, etc.
Jumpshot
https://www.jumpshot.com/
Number of transactions; average prices of products sold on e-
retailer websites; number of conversions/transactions; traffic
statistics; traffic volume; organic vs. paid traffic split, conversion
rates, search engine analysis; marketing funnel analysis; etc.
Profitero
https://www.profitero.com/
E-Commerce analytics: Sales analytics (tracking of availability),
Digital shelf analytics (tracking of traffic and conversion). Sales
and share, product content, search and placement, pricing and
promotions, assortment and availability, ratings and reviews.
SEMrush
https://www.semrush.com/
SEM (SEO, PPC), Social media metrics and advertising, content
marketing, top search engine keywords
Statista
https://www.statista.com/
Business data, statistics, studies reports, dossiers, market research
results
eMarketer
https://www.emarketer.com/
Benchmarks, market research results, various forecasts (e.g. sales
forecasts) and trends (e.g. yearly average growth rate trends)
Google Trends
https://trends.google.com/trends
Trends in popularity of specific search terms on a selected market
in a selected period.
Datorama
https://datorama.com/
Intelligence for marketing, Marketing performance optimization,
Marketing campaign ROI.
Smart Insights
https://www.smartinsights.com/
E-Learnings, consultancy and training for digital marketers,
digital marketing strategy advice.
Source: Author’s choice
2.2.3. MAKING MARKETING ANALYTICS TOOLS MORE USER-FRIENDLY
Some Digital Marketing Managers perceive analytics tools as a “good read” database which
contains numerous articles on different subjects so they turn to them when they wish to find out
interesting facts on their industry or when they need to get acquainted with market research results.
Naturally, such tools cannot provide concrete answers and precise solutions to specific problems
related to the business of a particular company. Due to this, many analytics tools are seen as a “semi-
product” which cannot complete users’ high expectation that they will get a comprehensive monthly
report, which they are always hoping to get with every new tool. Therefore, a digital marketing team
have to use more analytics tools at the same time and not just one in the attempt to collect all the
relevant information from the field which would then help form a complete picture of the situation.
Digital Marketing Managers would appreciate if the data from the tools was:
a) Combined in a single place,
b) Relevant and business-specific,
E F Z G W O R K I N G P A P E R S E R I E S 2 0 - 0 1
Page 10 of 13
c) Easy to understand and work with,
d) Benchmarked to realistic criteria,
e) If it contained precise suggestions which way to go moving forward and why.
In that case, the data from the tools would be most valuable to them. The purpose of the analytics tools
isn’t just to provide the data and the numerical results backed-up with nicely looking tables or
colourful charts. Key justification why a company decides to invest into external analytics tools is to
get the benchmarks against which the achieved results can be compared to and to get
recommendations for further marketing actions. Otherwise, any business can get rather satisfactory
reports from its own systems and continue deciding on further actions based on tradition, professional
experience, intuitive insights, own market research results or competitive analysis. In other words,
every company already has a lot of information at hand and does not need analytics tools which would
just confirm the information which it already has from other sources. Instead, each business needs
tools which would bring the reporting in general to the next level and add value in the form of
benchmarked results and guidance based on factual data, in which direction to go from here and
now.
2.3. INTERNAL ANALYTICS TOOLS AND OWN MARKETING BENCHMARKS
Most digital marketing analytics tools are designed in the USA and so external analytics tools such
as eMarketer PRO3 abound with benchmarks from US perspective which are impressive but often not
easily applicable (nor attainable) for most other countries around the world. These benchmarks can act
as guiding light to companies in countries other than the USA when it comes to showcasing what can
be done and what business results achieved ideally. However, what companies across the world really
need in their everyday work are benchmarks relevant to their own local market or region. Until every
market has developed own marketing benchmarks which will be locally applicable to the fullest
extent, for the time being they will need to find a role-model market which is similar to theirs in terms
of macroeconomic factors such as population size, GDP per capita, geographic location, territory size,
market size, competition, local business leaders in each industry, and best ways of tracking success
rates for each of the digital marketing categories and channels.
Undoubtedly, the practical “value” of marketing analytics tools would skyrocket if their intelligent
design contained marketing benchmarks as well (in online, mobile and retail channels). Until the day
when this becomes reality, many companies will alternatively create their own marketing dashboards
in which they will incorporate own benchmarking criteria, depending on the needs of their business,
the requests of the local market and own business industry. Such benchmarks entail pre-set scores (i.e.
possible points achieved) of various aspects of digital marketing, and mark their performance /
execution / success on an internal ranking scale. Such benchmarks contain grading scales with scores
categories such as:
81-100 excellent,
61-80 satisfactory,
41-60 average,
0-41 bad,
assigned to each of the pre-set criteria which is relevant to them. One such criterion can be an aspect
of a website for which the company wishes to track digital marketing execution through a period of
time, or on a MoM basis or YoY basis. Specific examples would be:
The existence of product specifications on product display page on e-retailer’s website, the
existence of ratings and reviews from other consumers who already purchased the product,
and similar.
Specific expected behaviors and actions of website visitors in a certain phase of the
purchasing journey (how do visitors search for specific products within the website?, how do
they learn about the products on product display pages?, are all the needed product
3 Expressed standpoints are not supported by any market research results so they should not be treated as a solid fact - they only represent
author's viewpoint developed through own work experience with this analytics tool.
E F Z G W O R K I N G P A P E R S E R I E S 2 0 - 0 1
Page 11 of 13
information available and embedded where they need to be?, do visitors make conversions as
a result of a cross-sell?)
It is possible to track month over month changes of scores and results, year over year, quarter to date,
year to date, weekly trends and expected monthly results before the current month is over. In setting
up standards for good benchmarking, a company needs to take into account that the benchmarks are
relevant, reliable and realistic. (Heffernan, 2019) Pre-set normative results enable Data Analysts to
quickly recognize the best-performing categories and the apparent roadblocks, and flag them to Digital
Marketing Managers. Another excellent benchmark, highly accepted and often used is the threshold
benchmark (e.g. in marketing budgeting scope there is the maximum cost/investment needed for a
certain type of marketing activity, against which the cost for all similar activities is benchmarked and
ROI evaluated – the threshold is usually set to 80% of the maximum cost/investment and the goal is to
keep the costs below this threshold since all the costs above this threshold signalize possible
overspend to finance).
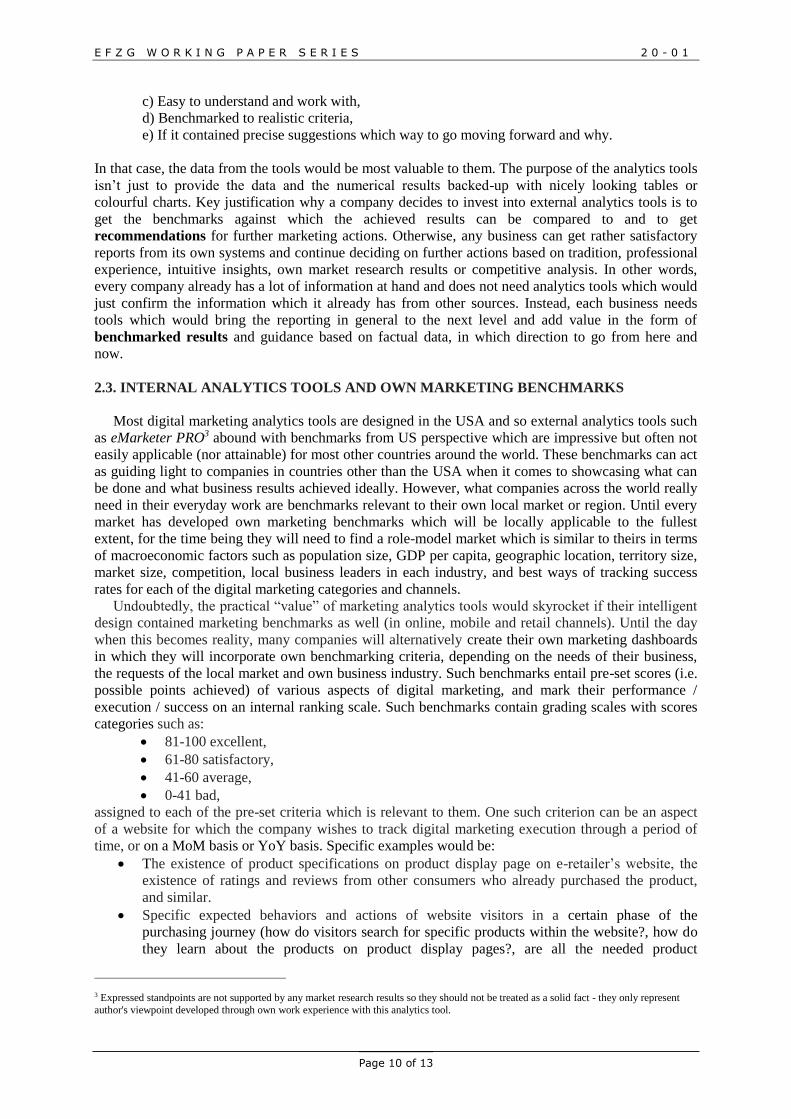
Once ranking scales with minimum, maximum, average and standard results are set up, achieved
scores have to be compared against the ranking scale and afterwards the results need to be clearly
presented in the dashboard in any of the chart types by choice – recommended types of charts are the
standard and mostly used Excel and Power Bi charts, such as Column chart , Pie chart , Bar
chart , Line chart , Area chart or the data can also be presented in the form of a small table. It is
always better to have fewer tabs in the dashboard with more filters and drilling options. It’s
recommended to combine many different types of information in one tab but not to overwhelm to
dashboard, so to keep in mind to create between four and six charts in every tab of the dashboard. The
source files should be flattened Excel tables (i.e. containing unified data), which exclude pivot tables
and which have no filtered cells. It always good to have many filters on the side of the dashboard, but
to keep the source files as simple as possible, with only columns such as marketing campaign name
and the most important marketing metrics. Data which should rather be set up as filters than columns
are: year, quarter, month, country/market, product group, marketing goal (raising brand awareness or
interest, informing the consumers, enticing sales, etc.), marketing category (ATL/BTL), marketing
channel, marketing tactic, etc. In this way, any unnecessary repetitiveness can be avoided in the source
files, which will divest them of all irrelevant data and only the values which are the skeleton of the
entire dashboard will remain instead. Internal marketing dashboards should be “live”, meaning should
be connected to source files which are easily maintained and regularly updated, which is immediately
reflected in the dashboard.
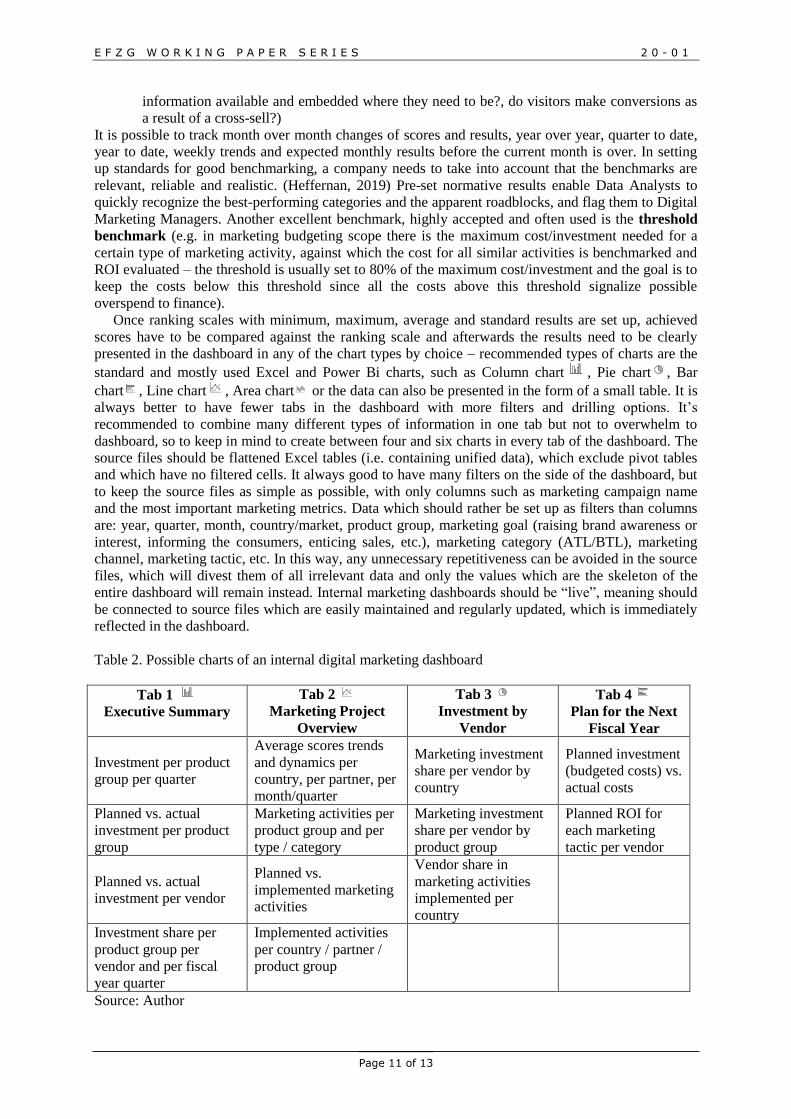
Table 2. Possible charts of an internal digital marketing dashboard
Tab 1
Executive Summary
Tab 2
Marketing Project
Overview
Tab 3
Investment by
Vendor
Tab 4
Plan for the Next
Fiscal Year
Investment per product
group per quarter
Average scores trends
and dynamics per
country, per partner, per
month/quarter
Marketing investment
share per vendor by
country
Planned investment
(budgeted costs) vs.
actual costs
Planned vs. actual
investment per product
group
Marketing activities per
product group and per
type / category
Marketing investment
share per vendor by
product group
Planned ROI for
each marketing
tactic per vendor
Planned vs. actual
investment per vendor
Planned vs.
implemented marketing
activities
Vendor share in
marketing activities
implemented per
country
Investment share per
product group per
vendor and per fiscal
year quarter
Implemented activities
per country / partner /
product group
Source: Author
E F Z G W O R K I N G P A P E R S E R I E S 2 0 - 0 1
Page 12 of 13
Table 2 displays possible charts themes which an internal digital marketing dashboard can contain.
In a simple graphic view a lot of aspects of a multi-country digital marketing project can be presented
in an easy to understand form. The emphasis of this sample case is on financial aspects (budgets,
costs) of the project as well as on internal digital marketing execution scores (i.e. benchmarks)
combined in a single view to show the profitability and the effectiveness of the project. Depending on
the focus of the analysis, each set of data can be displayed in absolute or relative amounts.
3. CONCLUSION
This paper provides an overview of top marketing analytics tools, which are proved to be useful in
business practice, as well as an in-depth analysis when it comes to creating company’s own digital
marketing dashboard. The author offers clarification of the existing misconceptions around the topic of
marketing benchmarks and provides instructions and real-life examples with specific explanations.
The main obstacle in the research was the relative novelty of all topics related to digital marketing
analytics tools and benchmarks, the unavailability of certain information due to their confidential
nature (such as business facts of some companies), non-existent information due to not yet developed
digital business models as well as not fully developed habit of using analytics tools for reporting and
decision-making in business practice.
Today, a business can achieve the highest value from analytics tools if it uses more different
analytics tools at the same time, each of which should come with a different set of metrics, and cover
the gaps of the other tools. The practical “value” of marketing analytics tools for Digital Marketing
Managers will skyrocket after specific recommendations and marketing benchmarks get integrated
into them. Moreover, by combining the use of external and internal analytics tools, a company can
achieve insights of greater value, which will be more related to core-business of a company, own
specific products in focus, as well as own digital marketing strategy. When it comes to managing
marketing data, there had been a lot of mistreatments in the past, owing to the non-existence of
adequate tools needed for the task and the human factor. Many Digital Marketing Managers were not
ready to deal with a marketing data analysis on a daily basis but today they are growing to like the
analytics tools because they are recognizing the numerous benefits which the tools can bring to
everyday marketing decision-making.
New forms of analytics tools which are becoming more and more popular are predictive analytics
tools and cognitive marketing analytics tools. We can expect these tools leverage the efforts of digital
marketing, especially when it comes to predicting of consumer behaviour and their purchasing
decision journey. At this moment the technology is still not developed enough to be able to support all
the aspects which such a tool should cover. Statistical data gathered from cognitive marketing
analytics tools combined with other digital marketing metrics will result with consumers changing
their expected decision journey in online environment. By integrating predictive and cognitive
analytics tools in the existing business intelligence systems, companies will be able to predict
consumer online behaviour and gain direct insight into their opinions at an early stage of a product
lifecycle. It will be interesting to observe how analytics tools will evolve in the next five years and to
track the progress of defining ideal digital marketing benchmarks within the tools. It can be expected
that in a couple of years marketing dashboards will be transferred from digital computer software level
to mobile app level where every Digital Marketing Manager will be able to access the data relevant to
their business on their mobile phone and free of charge. Hopefully, by the year 2023-2024 analytics
tools will contain suggestions, flagging of overachievement and underachievement based on pre-set
criteria, as well as valid recommendations for the next steps based on superior big data management
knowledge and the information which the tools will have gathered by then. By the time this
transformative period of digital revolution gets completed, after technology and marketing have
blended into one, the psychology of digital marketing will never be the same again.
4. REFERENCES
[1] Backholm, K., Högväg, J., Knutsen, J., Lindholm, J., Westvang, E. (2018). Tailoring Tools to the
Rescue: Lessons Learned from Developing a Social Media Information Gathering Tool. Social Media
Use in Crisis and Risk Communication, downloaded: [January 1 2020]
E F Z G W O R K I N G P A P E R S E R I E S 2 0 - 0 1
Page 13 of 13
[2] Carstensen, N. (2019). 6 Incredible Real-Life Examples of Data-driven Marketing in Action,
https://blog.adverity.com/examples-data-driven-marketing, accessed: [January 1 2020]
[3] Dykes, B. (2016). Data Storytelling: The Essential Data Science Skill Everyone Needs,
https://www.forbes.com/sites/brentdykes/2016/03/31/data-storytelling-the-essential-data-science-skill-
everyone-needs/#36b038f952ad, accessed: [January 1 2020]
[4] eMarketer PRO (2019). Retail & Ecommerce Sales, Norway, https://forecasts-
na1.emarketer.com/5a4fffafd8690c0c28d1f4cf/5a57dd33d8690c0dfc42e79e, accessed: [January 1
2020]
[5] Erhart, A. (2016). Digital Marketing Analytics – Why It Is Important to Understand Your Metrics,
https://www.youtube.com/watch?v=PN7KfMfj__o&feature=youtu.be, accessed: [January 1 2020]
[6] Fronetics (2019). How To Overcome The Challenges Of Data-Driven Digital Marketing,
https://youtu.be/vaARd52S4p4, accessed: [January 1 2020]
[7] Gowing, S. (2016). 7-Step Guide On How to Benchmark Marketing Activities,
https://www.fiftyfiveandfive.com/how-to-benchmark-marketing-activities/, accessed: [January 1
2020]
[8] Heffernan, P. (2019). How to Benchmark Your Marketing Performance https://www.marketing-
partners.com/conversations2/how-to-benchmark-your-marketing-performance, accessed: [January 1
2020]
[9] Hooley, G; Piercy, N.F; Nicoulaud, B; Rudd, J.M. (2017). Marketing Strategy & Competitive
Positioning. Pearson Education Limited, Harlow, United Kingdom.
[10] Kononenko, K. (2018). 11 Marketing KPI Reports with Industry-Specific Benchmarks,
https://databox.com/industry-specific-marketing-kpi-benchmarks, accessed: [January 1 2020]
[11] Nikel, D. (2018). The Ultimate Guide to Moving to Norway,
https://www.lifeinnorway.net/moving-to-norway/, accessed: [January 1 2020]
[12] SimilarWeb (2019). Website Performance, https://www.similarweb.com/, downloaded: [August 5
2019]
[13] Spacey, J. (2018). 18 Types of Marketing Benchmark, https://simplicable.com/new/marketing-
benchmarks, accessed: [January 1 2020]
[14] Techopedia (2019). What is Cognitive Analytics? - Definition from Techopedia,
https://www.techopedia.com/definition/29437/cognitive-analytics, accessed: [January 1 2020]
[15] The Digiterati (2019). A beginner's guide to digital psychology. The Digiterati,
https://thedigiterati.com/training/digital-marketing-training/digital-psychology/, accessed: [January 1
2020]
[16] Vizek, M. (2018). Definitivno nismo kao Afrika, ali nismo ni Švicarska ni Norveška,
https://www.tportal.hr/biznis/clanak/maruska-vizek-definitivno-nismo-kao-afrika-ali-nismo-ni-
svicarska-ni-norveska-foto-20180702, accessed: [January 1 2020]
[17] Walker, J. (2017). Big Data 2.0: Cognitive analytics and why it matters. Monitis Blog,
http://www.monitis.com/blog/big-data-2-0-cognitive-analytics-and-why-it-matters/, accessed:
[January 1 2020]
[18] XenonStack (2018). Quick Guide to Cognitive Analytics Tools and Architecture,
https://www.xenonstack.com/insights/what-is-cognitive-analytics/, accessed: [January 1 2020]