digital, rapid, accurate, and label-free enumeration of
TRANSCRIPT

sensors
Article
Digital, Rapid, Accurate, and Label-Free Enumerationof Viable Microorganisms Enabled by Custom-BuiltOn-Glass-Slide Culturing Device andMicroscopic Scanning
Donghui Song 1 , Haomin Liu 2, Qiuchen Dong 1, Zichao Bian 1, Huixiang Wu 3 and Yu Lei 1,2,*1 Department of Biomedical Engineering, University of Connecticut, Storrs, CT 06269, USA;
[email protected] (D.S.); [email protected] (Q.D.); [email protected] (Z.B.)2 Department of Chemical and Biomolecular Engineering, University of Connecticut, Storrs, CT 06269, USA;
[email protected] Key Laboratory for Biorheological Science and Technology of Ministry of Education, State and Local Joint
Engineering Laboratory for Vascular Implants, Bioengineering College of Chongqing University,Chongqing 400044, China; [email protected]
* Correspondence: [email protected]; Tel.: +1-860-486-4554; Fax: +1-860-486-2959
Received: 8 September 2018; Accepted: 24 October 2018; Published: 31 October 2018�����������������
Abstract: Accurately measuring the number of viable microorganisms plays an essential role inmicrobiological studies. Since the conventional agar method of enumerating visible colonies istime-consuming and not accurate, efforts have been made towards overcoming these limitationsby counting the invisible micro-colonies. However, none of studies on micro-colony counting wasable to save significant time or provide accurate results. Herein, we developed an on-glass-slide cellculture device that enables rapid formation of micro-colonies on a 0.38 mm-thick gel film withoutsuffering from nutrient and oxygen deprivation during bacteria culturing. Employing a phasecontrast imaging setup, we achieved rapid microscopic scanning of micro-colonies within a largesample area on the thin film without the need of fluorescent staining. Using Escherichia coli (E. coli) asa demonstration, our technique was able to shorten the culturing time to within 5 h and automaticallyenumerate the micro-colonies from the phase contrast images. Moreover, this method delivered moreaccurate counts than the conventional visible colony counting methods. Due to these advantages, thisimaging-based micro-colony enumeration technique provides a new platform for the quantificationof viable microorganisms.
Keywords: digital; enumeration; micro-colonies; microscopic scanning; viable microorganism
1. Introduction
In microbiological research, it is essential to accurately enumerate microbial cells. For example,as a key step in developing new antimicrobial agents, the determination of minimum inhibitoryconcentration (MIC) requires inoculation of a precise number of viable microorganisms [1,2]. To date,the colony-forming unit (CFU) has been used as a gold standard method for estimating the number ofviable microbial cells [3]. In this conventional method, liquid microbial suspension is uniformly spreadon the surface of semi-solid nutrient agar plate by an inoculation loop. Next, the plate is incubated atan optimal temperature until the cells grow to visible colonies [4,5]. The number of colonies is referredto as a CFU.
The major advantages of agar plate method are that the materials are inexpensive and theprocedures are simple enough for trainees to follow. However, long cell culture time (up to a few
Sensors 2018, 18, 3700; doi:10.3390/s18113700 www.mdpi.com/journal/sensors
Sensors 2018, 18, 3700 2 of 11
days) and laborious manual counting result in poor time and cost efficiency [3,6]. To reduce manualwork and its related human error, commercial automated colony-counters, such as ProtoCOLTM
(Synbiosis, UK), EC2TM (BioMérieux, Marcy-l′Étoile, France), and ScannTM 500 (Interscience, Woburn,MA, USA), have been established through applications of imaging processing algorithms. Nonetheless,the counting results are accurate only when the number of colonies per plate is between 10 and 200 [7].Thus, serial dilutions of microbial samples are necessary to ensure a countable range. As a majorconcern of serial dilutions, errors become larger as dilution times increase or total counts per platedecrease [8–10].
To address the shortcomings of the conventional method, counting invisible growingmicro-colonies (average radius <100 microns) at the very early stage of culturing provides a potentiallyalternative tool [11–14]. Specifically, micro-colony counting techniques enable much faster detectionof viable microbial cells by significantly shortening cell culture time. These previous attempts can beclassified using lensless techniques and conventional light microscopy. Recently, Jung et al. employeda complementary metal-oxide-semiconductor (CMOS) sensor chip to real-time image the microbialcells growing into micro-colonies and demonstrated that micro-colony-based enumeration resultswere comparable to the conventional method [12]. However, the non-movable small imaging area(5.7 mm × 4.3 mm) and limited sample loading volume (1 µL) failed to exceed the cell capacity of theagar plate. Moreover, limited nutrition and air in their isolated cell culture setup resulted in delayedgrowth of aerobic bacteria, which would not significantly shorten the detection time. Hence, thison-chip imaging technique seemed not to overcome the limitations faced by the conventional countingmethod. Compared to the lensless imaging systems, conventional light microscopy can deliver higherresolution of images with clear morphology and contrast of the micro-colonies [15]. Although thefield-of-view (FOV) of each image captured by microscope is very small, the microscope is capableof producing a large image in any desired size by stitching numerous images taken from the culturearea of interest [16–19]. In previous studies, wide-field fluorescence microscopy was employedto rapidly enumerate micro-colonies stained by fluorescent probes, which served as viable cellindicators [11,20,21]. However, the counts from the microscope could be 50 times larger thanthose from the conventional method [11]. In addition to the interference caused by light scattering,lack of solid data of accuracy validation restrained microscopy-based counting techniques frombroader applications.
In this study, we demonstrated a novel microscopy-based viable bacteria enumeration techniquethat employed large-area microscopic scanning to achieve rapid, accurate, and label-free enumeration.Specifically, we first developed a bacteria culturing device for microscopic scanning. This deviceenabled rapid formation of micro-colonies on a 0.38 mm-thick gel film without suffering from nutrientand oxygen deprivation. Next, an imaging setup was customized for rapid automated scanning of themicro-colonies. As a demonstration, EGFP-expressing E. coli was used to evaluate the performance ofthe bacteria culturing device and the imaging setup. Herein, a modified confocal microscope with amotorized x-y sample holder plane was employed to scan the sample area and create phase contrastand fluorescence images side by side. Using fluorescence as a reference, automatically counting themicro-colonies in the phase contrast image was able to rapidly and accurately provide the numberof them.
2. Materials and Methods
2.1. Materials and Instruments
Luria-Bertani (LB) broth for growing bacteria was purchased from Sigma-Aldrich (St. Louis, MO,USA). Agarose was from Promega (Madison, WI, USA). Silicon wafer was obtained from UniversityWafer (Boston, MA, USA). Agar, polystyrene petri dishes (diameter 100 mm), glass microscope slides,and coverslips were purchased from Thermo Fisher Scientific (Waltham, MA, USA). Escherichia coli(E. coli) K-12 expressing enhanced green fluorescent protein (EGFP) was received as gift from

Sensors 2018, 18, 3700 3 of 11
Dr. Yongku Cho’s laboratory (University of Connecticut). The fluorescence from E. coli expressedEGFP was used only for validation purpose. Images were captured by Nikon A1R confocal microscope(Nikon, Japan) and processed using Nikon NIS-Elements Advanced Research microscope imagingsoftware version 4.40.
2.2. Preparation of On-Glass-Slide Bacteria Culturing Device
A microscope glass slide with two pieces of spacers (0.38 mm-thick silicon wafer) on the top of itwas placed in a petri dish. Another piece of cover glass slide was then mounted on the silicon wafersto form an empty chamber between the two glass slides. Next, 0.6% (w/v) agarose were suspended inLB culture media. This mixture was sterilized by autoclaving at 121 ◦C for 15 min. When the mediacooled down below 60 ◦C, kanamycin was added to a final concentration of 50 µg/mL for the selectionof EGFP expression. This molten medium was poured into the petri dish and filled the empty chamber.After the media was kept at room temperature for 20 min and became solidified, the cover glass slidewas gently removed to present a thin film of nutrient gel with a flat surface.
2.3. Preparation of Bacterial Samples
Since E. coli cells carried antibiotic resistant gene as a reporter of the production of EGFP,kanamycin was added to LB broth at a final concentration of 50 µg/mL for the selection of EGFPexpression. E. coli cells from the stock were inoculated into LB broth and pre-enriched at 200 rpm ina 37 ◦C shaker for 4 h to ensure the bacterial growth was at log phase. Then, the cells were dilutedinto various concentrations of interest with phosphate buffered saline (PBS). Bacterial suspension(5 µL) was dropped onto the aforementioned thin film of LB-agarose gel. After the drop completelyevaporated, the petri dishes were transferred into a 37 ◦C incubator. The surface of the culture areawas placed upside down to prevent the loss of water content.
2.4. Imaging Bacterial Micro-Colonies Using Microscopic Scanning
After 5-h incubation, the glass slide with the thin film was taken out by cutting off the surroundingbulk of LB-agarose gel. Then, the silicon wafer spacers were removed and a glass coverslip was gentlymounted on the cell culture area that carries micro-colonies. To ensure the distance between themicro-colonies and the lens constant, the coverslip side of the gel was mounted on a supporting glassslide. This setup was next placed on the motorized x-y sample holder stage of confocal microscope,where the supporting glass slide was at the bottom. After the horizontal plane of micro-colonies wasfocused by the objective lens, images were continuously captured as the sample holder stage movedalong a sequential path programmed by the control panel of Nikon software until the entire samplearea was scanned. Herein, tiles of phase contrast and fluorescence images (0.665 mm × 0.665 mm foreach tile) were acquired simultaneously by an S Plan Fluor ELWD Ph1 20× objective lens (NA 0.45,Nikon, Japan). Finally, the Nikon NIS Elements software automatically created a large image bystitching all the tiles together.
2.5. Image Processing and Micro-Colony Enumeration
The large image obtained from the confocal microscopic scanning was analyzed by using ImageJsoftware version 1.52 (NIH, Bethesda, MD, USA). First, the threshold was adjusted to enhance thecontrast of the objects of interest. Second, the image was binarized to remove the noise by renderingmicro-colony regions with clear boundaries as black and surrounding background as white. After thebinarization, filling-holes processing was conducted to ensure each closed region represents one intactmicro-colony. Finally, micro-colony regions above desired size were outlined and the number of theseregions was automatically counted by ImageJ software.
Sensors 2018, 18, 3700 4 of 11
2.6. Bacteria Enumeration Using Conventional Agar Plate
A sterile molten liquid mixture of 2% (w/v) LB culture media and 1.5% (w/v) agar supplementedwith 50 µg/mL kanamycin was poured into petri dishes. As a gelling reagent, the agar can be replacedby agarose and the concentration of it can be adjusted according to specific needs. After the mediawas solidified in 20 min, 100 µL of E. coli suspension was inoculated onto the surface of the gel byuniformly spreading it using a metal loop. The petri dishes were then incubated at 37 ◦C. After thebacterial colonies were detectable by naked eyes, the number of colonies was manually counted.
3. Results and Discussion
3.1. Preparation and Evaluation of On-Glass-Slide Bacteria Culturing Device
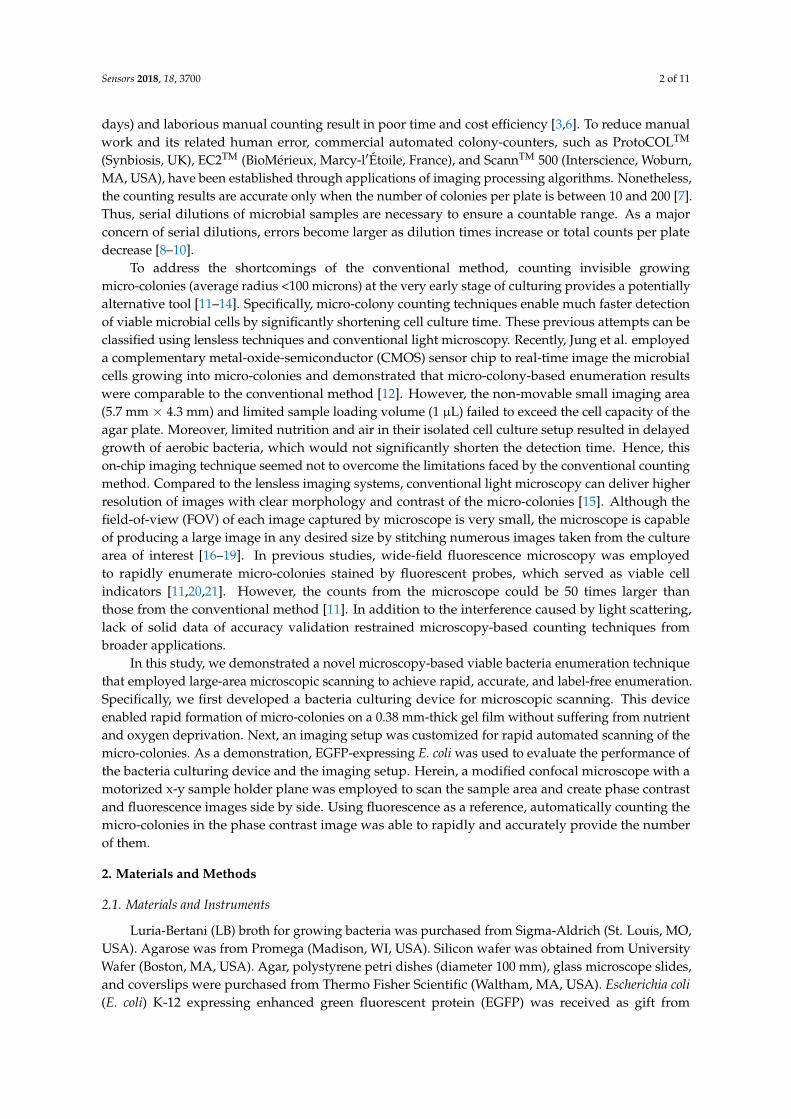
In previous studies, micro-colonies were grown and imaged on a film of nutrient gel, which had tobe thin enough to deliver good transparency and thereby generate high-quality images. To prevent thethin gel film from drying out, it was sealed in a closed chamber during cell culture and imaging [12,15].However, limited nutrition and isolating oxygen supplies resulted in slow cell growth. To addressthis issue, we invented a special on-glass-slide bacteria culturing device (details of preparation aredescribed in the Experimental Section). As illustrated in Figure 1A, a glass slide was embedded inLB-agarose gel. On the top of the glass slide was a flat thin gel film, whose thickness (0.38 mm) wasdetermined by that of the spacer. The cross-section of this device (Figure 1B) shows that the thin filmis like a “bridge” connected the bulk gel. This unique design ensures that the film can continuouslyreceive water and nutrition from the bulk gel, as well as oxygen from the ambient air, allowing a longtime for incubation without gel drying and rapid formation of micro-colonies without suffering fromany restriction on cell growth.
Sensors 2018, 18, x FOR PEER REVIEW 4 of 11
was solidified in 20 min, 100 μL of E. coli suspension was inoculated onto the surface of the gel by uniformly spreading it using a metal loop. The petri dishes were then incubated at 37 °C. After the bacterial colonies were detectable by naked eyes, the number of colonies was manually counted.
3. Results and Discussion
3.1. Preparation and Evaluation of On-Glass-Slide Bacteria Culturing Device
In previous studies, micro-colonies were grown and imaged on a film of nutrient gel, which had to be thin enough to deliver good transparency and thereby generate high-quality images. To prevent the thin gel film from drying out, it was sealed in a closed chamber during cell culture and imaging [12,15]. However, limited nutrition and isolating oxygen supplies resulted in slow cell growth. To address this issue, we invented a special on-glass-slide bacteria culturing device (details of preparation are described in the Experimental Section). As illustrated in Figure 1A, a glass slide was embedded in LB-agarose gel. On the top of the glass slide was a flat thin gel film, whose thickness (0.38 mm) was determined by that of the spacer. The cross-section of this device (Figure 1B) shows that the thin film is like a “bridge” connected the bulk gel. This unique design ensures that the film can continuously receive water and nutrition from the bulk gel, as well as oxygen from the ambient air, allowing a long time for incubation without gel drying and rapid formation of micro-colonies without suffering from any restriction on cell growth.
Figure 1. Schematics of the reported custom-built on-glass-slide microbial culturing device. (A) A thin Luria-Bertani (LB)-agarose gel film with a flat surface created on a glass slide in a petri dish. The components of the device are described. (B) A cross-section of the device showing its capability of culturing microorganisms on the thin gel film without any growth limitation.
Regarding the composition of the semi-solid culture media, there was only one difference between our system and the conventional method. Here, we used agarose instead of agar to prepare the nutrient gel. Typically, agar is added to aqueous nutrition to form gel matrix, which helps immobilize microbial cells and support them to multiply to colonies. However, the opaque appearance of agar gel determines that it is not a good choice for imaging application [22]. As an alternative, agarose gel has been extensively employed for imaging due to better optical clarity [12,15,23–28]. Notably, the flatness of the gel surface is critical for acquirement of high quality scanning image and the accuracy of micro-colonies counting. Hence, we prepared the gel matrix using 0.6% (w/v) agarose rather than widely used 1.5%, since it was difficult to generate flat thin gel film when the agarose concentration was above 0.6%. Even though the gel becomes softer as agarose content decreases, as previously reported, 0.6% agarose or agar gel still possessed good ability to immobilize microbial cells and support their growth without any issue [24,29].
To evaluate the cell-cultivability of this device, we inoculated the same amounts of bacterial suspension on LB-agarose thin film, conventional LB agar (1.5%) plate, and LB agarose (0.6% and
Figure 1. Schematics of the reported custom-built on-glass-slide microbial culturing device. (A) Athin Luria-Bertani (LB)-agarose gel film with a flat surface created on a glass slide in a petri dish.The components of the device are described. (B) A cross-section of the device showing its capability ofculturing microorganisms on the thin gel film without any growth limitation.
Regarding the composition of the semi-solid culture media, there was only one difference betweenour system and the conventional method. Here, we used agarose instead of agar to prepare thenutrient gel. Typically, agar is added to aqueous nutrition to form gel matrix, which helps immobilizemicrobial cells and support them to multiply to colonies. However, the opaque appearance of agargel determines that it is not a good choice for imaging application [22]. As an alternative, agarose gelhas been extensively employed for imaging due to better optical clarity [12,15,23–28]. Notably, theflatness of the gel surface is critical for acquirement of high quality scanning image and the accuracyof micro-colonies counting. Hence, we prepared the gel matrix using 0.6% (w/v) agarose rather than

Sensors 2018, 18, 3700 5 of 11
widely used 1.5%, since it was difficult to generate flat thin gel film when the agarose concentration wasabove 0.6%. Even though the gel becomes softer as agarose content decreases, as previously reported,0.6% agarose or agar gel still possessed good ability to immobilize microbial cells and support theirgrowth without any issue [24,29].
To evaluate the cell-cultivability of this device, we inoculated the same amounts of bacterialsuspension on LB-agarose thin film, conventional LB agar (1.5%) plate, and LB agarose (0.6% and1.5%) plate respectively and monitored the growth of bacteria. Since inoculation, pictures of these LBagar/agarose plates were captured at 0, 8, 11, 13, 15, and 17 h. It was observed that the bacterial coloniesbecame visible to the naked eye and manually countable at 13 h. The average size of the coloniesfrom these methods showed no remarkable difference (Figure S1), suggesting that the cells on ourcustom-designed thin gel film grew as fast as on conventional agar plates. Therefore, microscopicallyanalyzing the invisible micro-colonies would significantly shorten the detection time.
3.2. Microscopic Scanning Micro-Colonies on a Large Sample Area
Since bacteria cells are transparent in reality and do not affect the amplitude of visible lightwaves passing through them, high-contrast images are needed for recognizing them. Presented inFigure S2 are images of E. coli micro-colonies captured in phase contrast and DIC, respectively.Obviously, compared to DIC, it is much easier to utilize phase contrast to distinguish the micro-coloniesfrom the background. Moreover, a halo surrounding each micro-colony indicates the boundary andfurther benefits the identification. Therefore, it is more suitable to utilize phase contrast for digitallyrecognizing the micro-colonies by using image-processing software.
Aiming at recording all the micro-colonies in one image, we employed the microscopic scanningtechnique to generate an image encompassing the entire sample area. Such scanning was conductedby continuously capturing tiles of images on a certain focal plane and stitching the tiles togetherinto a large image. Considering bacterial micro-colonies growing on gel matrix actually expand inthree dimensions [30] and their thickness may not be uniform, significantly more time would beconsumed on locating each object through continuously focusing at different depths in the z-direction.To enable fast imaging, we customized the sample setup to ensure that all the micro-colonies couldbe scanned without conducting any z-scanning. As illustrated in Figure 2B, the setup consisted ofa glass slide on the top, a gel film in the middle, a coverslip and a supporting glass slide on thebottom. The micro-colonies at the bottom side of the gel film were compressed on the coverslip by thegravity of the glass slide on the top. The robust flat surface of the supporting glass slide rendered ahorizontal coverslip-gel interface, which could be considered as a perfect target plane for the scanning.Moreover, the thickness of the coverslip and supporting glass was fixed, assuring that the distancebetween the target plane and the lens remained constant. Hence, no concern about any out-of-focusissue was expected.
To test the performance of this system, we used EGFP-expressing E. coli as a model bacteriumand conducted scanning of the micro-colonies grown from them. Although bacteria cells in realityare seldom fluorescent, the green fluorescence from micro-colonies was merely used as a reference tocorroborate the accuracy of the result obtained from phase contrast images. Herein, we chose confocalmicroscopy to meet the specific need of both phase contrast and high-quality fluorescence images inthis study. As the LB-agarose gel is a thick specimen with considerable autofluorescence, the confocalmicroscope can block the out-of-focus light above and below the focal plane by the spatial pinhole andtherefore provides higher resolution and enhanced contrast by increasing signal-to-noise ratio [31–33].Additionally, since the transmitted light mode of confocal microscopy can also view the specimenthrough phase contrast [34], confocal microscopy is capable of simultaneously generating high-qualityfluorescence and phase contrast images and viewing them side by side, whereas this cannot be achievedby other microscopy. However, it is worth noting that confocal microscopy is not required for realapplications if only phase contrast is employed in enumeration of viable microorganisms. After thebacteria cells on thin gel film were incubated at 37 ◦C for 5 h, the culture area was scanned at a speed

Sensors 2018, 18, 3700 6 of 11
of approximately 17.7 mm2/min by a 20× objective lens. Figure 3 displays a large image (1.16 cm ×1.81 cm) created by stitching tiles of images together. The area was large enough to accommodate allthe micro-colonies. Zooming in the large image enabled us to identify each micro-colony by phasecontrast or fluorescence. It was clear that the micro-colonies presented on the boundaries between thetiles were in their normal shape, suggesting that there was no stitching artifact, such as duplication ordisappearance. Therefore, the large image acquisition function presented here was able to accuratelydeliver the number of the micro-colonies.
Sensors 2018, 18, x FOR PEER REVIEW 5 of 11
1.5%) plate respectively and monitored the growth of bacteria. Since inoculation, pictures of these LB agar/agarose plates were captured at 0, 8, 11, 13, 15, and 17 h. It was observed that the bacterial colonies became visible to the naked eye and manually countable at 13 h. The average size of the colonies from these methods showed no remarkable difference (Figure S1), suggesting that the cells on our custom-designed thin gel film grew as fast as on conventional agar plates. Therefore, microscopically analyzing the invisible micro-colonies would significantly shorten the detection time.
3.2. Microscopic Scanning Micro-Colonies on a Large Sample Area
Since bacteria cells are transparent in reality and do not affect the amplitude of visible light waves passing through them, high-contrast images are needed for recognizing them. Presented in Figure S2 are images of E. coli micro-colonies captured in phase contrast and DIC, respectively. Obviously, compared to DIC, it is much easier to utilize phase contrast to distinguish the micro-colonies from the background. Moreover, a halo surrounding each micro-colony indicates the boundary and further benefits the identification. Therefore, it is more suitable to utilize phase contrast for digitally recognizing the micro-colonies by using image-processing software.
Aiming at recording all the micro-colonies in one image, we employed the microscopic scanning technique to generate an image encompassing the entire sample area. Such scanning was conducted by continuously capturing tiles of images on a certain focal plane and stitching the tiles together into a large image. Considering bacterial micro-colonies growing on gel matrix actually expand in three dimensions [30] and their thickness may not be uniform, significantly more time would be consumed on locating each object through continuously focusing at different depths in the z-direction. To enable fast imaging, we customized the sample setup to ensure that all the micro-colonies could be scanned without conducting any z-scanning. As illustrated in Figure 2B, the setup consisted of a glass slide on the top, a gel film in the middle, a coverslip and a supporting glass slide on the bottom. The micro-colonies at the bottom side of the gel film were compressed on the coverslip by the gravity of the glass slide on the top. The robust flat surface of the supporting glass slide rendered a horizontal coverslip-gel interface, which could be considered as a perfect target plane for the scanning. Moreover, the thickness of the coverslip and supporting glass was fixed, assuring that the distance between the target plane and the lens remained constant. Hence, no concern about any out-of-focus issue was expected.
Figure 2. Schematic illustration of the reported micro-colony imaging system. (A) a photograph of the experimental setup. (B) The components of a sample setup. The thickness of each component is described. (C) The scanning of the entire cell culture area on thin LB-agarose gel film is conducted by sequentially capturing images in field-of-views. Each square on the plane represents a field-of-view. The arrows indicate the path of the movement of the camera.
Figure 2. Schematic illustration of the reported micro-colony imaging system. (A) a photograph ofthe experimental setup. (B) The components of a sample setup. The thickness of each component isdescribed. (C) The scanning of the entire cell culture area on thin LB-agarose gel film is conducted bysequentially capturing images in field-of-views. Each square on the plane represents a field-of-view.The arrows indicate the path of the movement of the camera.
Sensors 2018, 18, x FOR PEER REVIEW 6 of 11
To test the performance of this system, we used EGFP-expressing E. coli as a model bacterium and conducted scanning of the micro-colonies grown from them. Although bacteria cells in reality are seldom fluorescent, the green fluorescence from micro-colonies was merely used as a reference to corroborate the accuracy of the result obtained from phase contrast images. Herein, we chose confocal microscopy to meet the specific need of both phase contrast and high-quality fluorescence images in this study. As the LB-agarose gel is a thick specimen with considerable autofluorescence, the confocal microscope can block the out-of-focus light above and below the focal plane by the spatial pinhole and therefore provides higher resolution and enhanced contrast by increasing signal-to-noise ratio [31–33]. Additionally, since the transmitted light mode of confocal microscopy can also view the specimen through phase contrast [34], confocal microscopy is capable of simultaneously generating high-quality fluorescence and phase contrast images and viewing them side by side, whereas this cannot be achieved by other microscopy. However, it is worth noting that confocal microscopy is not required for real applications if only phase contrast is employed in enumeration of viable microorganisms. After the bacteria cells on thin gel film were incubated at 37 °C for 5 h, the culture area was scanned at a speed of approximately 17.7 mm2/min by a 20× objective lens. Figure 3 displays a large image (1.16 cm × 1.81 cm) created by stitching tiles of images together. The area was large enough to accommodate all the micro-colonies. Zooming in the large image enabled us to identify each micro-colony by phase contrast or fluorescence. It was clear that the micro-colonies presented on the boundaries between the tiles were in their normal shape, suggesting that there was no stitching artifact, such as duplication or disappearance. Therefore, the large image acquisition function presented here was able to accurately deliver the number of the micro-colonies.
Figure 3. Representative images captured by using the reported platform. Transmitted light (A) and fluorescence (B) images of bacterial micro-colonies presented on an area of 1.16 cm × 1.81 cm. Fluorescence image was only used for confirmation purpose.
3.3. .Micro-Colony Enumeration
After the images were acquired by confocal microscopy scanning, the micro-colonies appeared there were enumerated by using image-processing software. Figure 4A presents a selected area containing micro-colonies grown from the cells in 5 μL bacterial suspension. In addition to micro-colonies, empty regions that could be produced by artifacts or tiny air bubbles were also shown in the image. Nonetheless, they do not cause any interference in recognizing the micro-colonies. It is known that phase contrast is generated by the difference in density. Since no other elements, such as the empty regions, throughout the imaged area were as dense as the micro-colonies, micro-colonies
Figure 3. Representative images captured by using the reported platform. Transmitted light (A)and fluorescence (B) images of bacterial micro-colonies presented on an area of 1.16 cm × 1.81 cm.Fluorescence image was only used for confirmation purpose.
Sensors 2018, 18, 3700 7 of 11
3.3. Micro-Colony Enumeration
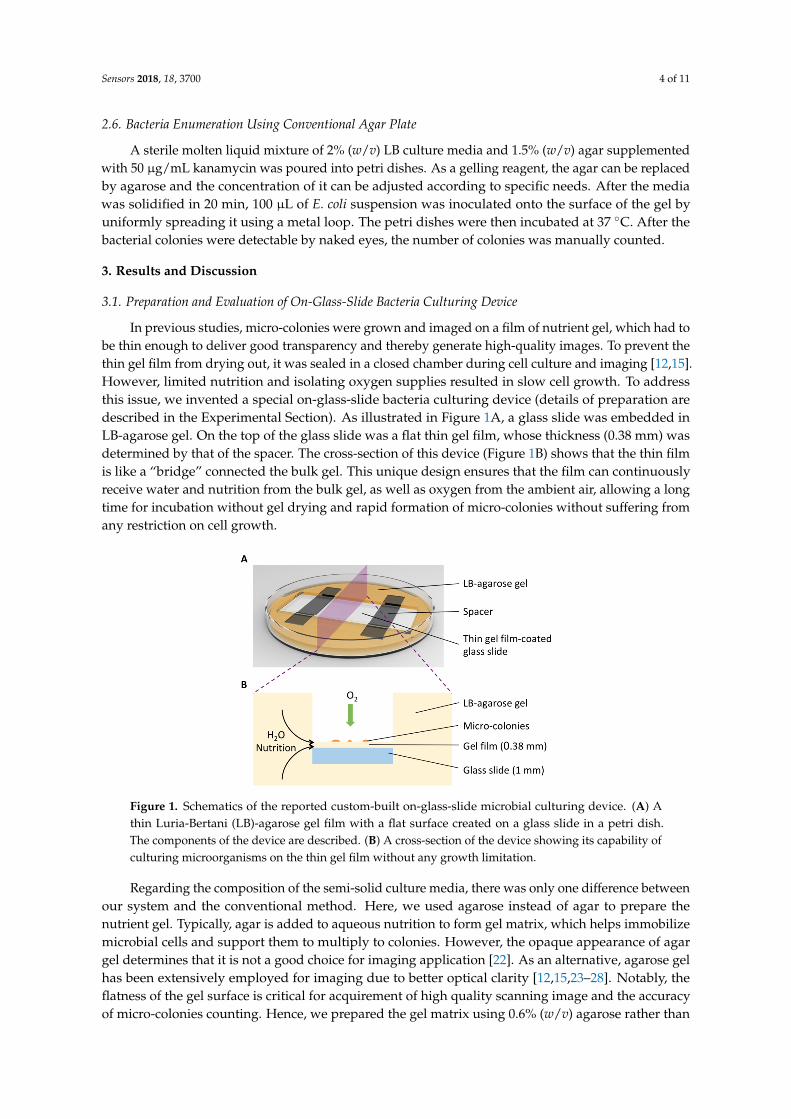
After the images were acquired by confocal microscopy scanning, the micro-colonies appearedthere were enumerated by using image-processing software. Figure 4A presents a selected areacontaining micro-colonies grown from the cells in 5 µL bacterial suspension. In addition tomicro-colonies, empty regions that could be produced by artifacts or tiny air bubbles were also shownin the image. Nonetheless, they do not cause any interference in recognizing the micro-colonies. It isknown that phase contrast is generated by the difference in density. Since no other elements, such as theempty regions, throughout the imaged area were as dense as the micro-colonies, micro-colonies can beeasily distinguished by filtering the low-contrast objects. Figure 4B shows the corresponding processedimage, in which the total number of micro-colonies (dark regions) was counted as 155 (details ofthe algorithms applied in automated enumeration are described in Figure 5). The locations of themicro-colonies and the number of them were consistent with those obtained from the fluorescenceimage (Figure 4C), indicating that the result obtained from phase contrast image was trustworthy.To validate if this result represented actively growing micro-colonies, the imaged sample was placedback into the agar plate and further cultured in situ for 20 h at room temperature until visible coloniesappeared. The image of these visible colonies (Figure 4D), which was captured by a Nikon D5300DSLR camera (Nikon, Japan), was used to compare with that of micro-colonies side by side.
Sensors 2018, 18, x FOR PEER REVIEW 7 of 11
can be easily distinguished by filtering the low-contrast objects. Figure 4B shows the corresponding processed image, in which the total number of micro-colonies (dark regions) was counted as 155 (details of the algorithms applied in automated enumeration are described in Figure 5). The locations of the micro-colonies and the number of them were consistent with those obtained from the fluorescence image (Figure 4C), indicating that the result obtained from phase contrast image was trustworthy. To validate if this result represented actively growing micro-colonies, the imaged sample was placed back into the agar plate and further cultured in situ for 20 h at room temperature until visible colonies appeared. The image of these visible colonies (Figure 4D), which was captured by a Nikon D5300 DSLR camera (Nikon, Japan), was used to compare with that of micro-colonies side by side.
Figure 4. Phase contrast (A) and fluorescence (B) images of an area (7.9 mm × 9.0 mm) containing micro-colonies grown from the inoculated cells in 5 μL bacterial suspension. Scale bars: 500 μm. Fluorescence image was only used for confirmation purpose. (C) An image processed from the raw image in (A). The black spots indicate micro-colonies. (D) A photograph of visible colonies in situ developed from the micro-colonies shown in (A,B). The whitish dots were bacterial colonies. The objects pointed by the white arrows were debris, which can be distinguished from the bacterial colonies by the colors. The difference in color can be more easily identified from the high-resolution photograph shown in Figure S3.
Figure 4. Phase contrast (A) and fluorescence (B) images of an area (7.9 mm × 9.0 mm) containingmicro-colonies grown from the inoculated cells in 5 µL bacterial suspension. Scale bars: 500 µm.Fluorescence image was only used for confirmation purpose. (C) An image processed from the rawimage in (A). The black spots indicate micro-colonies. (D) A photograph of visible colonies in situdeveloped from the micro-colonies shown in (A,B). The whitish dots were bacterial colonies. The objectspointed by the white arrows were debris, which can be distinguished from the bacterial colonies bythe colors. The difference in color can be more easily identified from the high-resolution photographshown in Figure S3.
Sensors 2018, 18, 3700 8 of 11
Sensors 2018, 18, x FOR PEER REVIEW 8 of 11
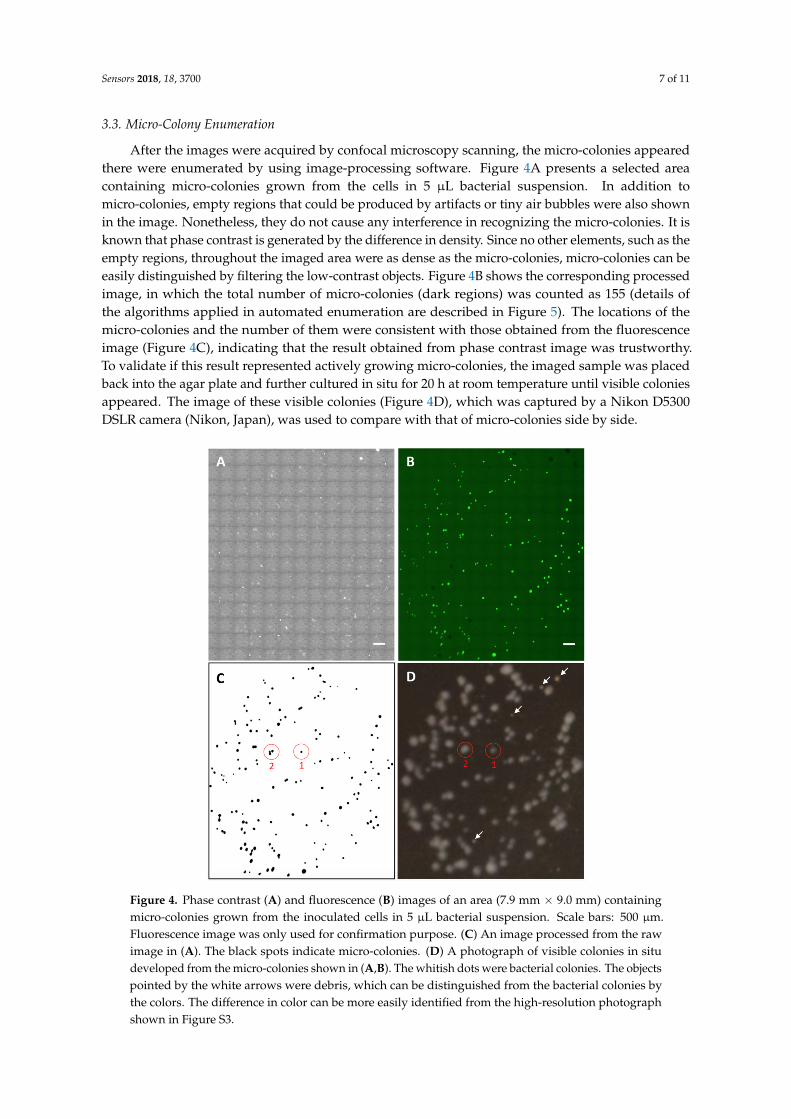
Figure 5. An example of automated enumeration of micro-colonies. The original transmitted light image (A) was processed through adjusting threshold (B), finding edges, binarization, and filling the holes (C), and the black regions above certain size were counted by using ImageJ (D).
Apparently, all the micro-colonies were capable of actively growing, indicating that the number of micro-colonies certainly represents that of viable microbial microorganisms. Furthermore, we found that, multiple micro-colonies in close proximity to each other, which could eventually develop to one single visible colony under the conventional agar plate enumerating method, can be identified and differentiated microscopically using our method. For instance, colony 1 was derived from one micro-colony, whereas colony 2 was developed from three neighboring micro-colonies. This finding suggests that, especially when the density of cells inoculated on an agar plate is high, the counts obtained from the conventional method are much likely to be underestimated. By contrast, our digital enumeration technique can differentiate the neighboring micro-colonies at the earliest stage and be more accurate than counting large visible colonies used in conventional methods. According to specific needs, the upper counting limit can be increased by simply expanding the scanning area. This feature allows that fewer or even no dilutions are needed using our enumerating method, which could reduce the serial dilution-induced error. Furthermore, enumerating around 200 micro-colonies within an area of 60 mm2, which is the maximum limit of a 100 mm agar plate, took only around 3 min, freeing up more space and workload on sample preparation through miniaturizing the work on a piece of glass slide. It is worth noting that the scanning time was limited by the function of confocal microscopy. In this study, confocal microscopy was only used to evaluate the performance of our custom-designed bacteria culturing and imaging system in the compatibility with the microscopic scanning function. In practice, since the technique reported here can accurately deliver the counts of micro-colonies only from phase contrast images (fluorescence imaging is not necessary), some recently emerged ultrafast high-resolution microscopic scanning techniques [35–37], which can conduct whole glass slide scanning in a few minutes, would be able to further reduce the scanning time per unit area and thereby provide counting result in a timely and high-throughput manner. Overall, the developed technique not only shortened the culturing time, but also allowed the labor-intensive plate counting work to be automatically conducted on a glass slide, thoroughly overcoming the limitations of the conventional method.
Figure 5. An example of automated enumeration of micro-colonies. The original transmitted lightimage (A) was processed through adjusting threshold (B), finding edges, binarization, and filling theholes (C), and the black regions above certain size were counted by using ImageJ (D).
Apparently, all the micro-colonies were capable of actively growing, indicating that the numberof micro-colonies certainly represents that of viable microbial microorganisms. Furthermore, we foundthat, multiple micro-colonies in close proximity to each other, which could eventually develop toone single visible colony under the conventional agar plate enumerating method, can be identifiedand differentiated microscopically using our method. For instance, colony 1 was derived from onemicro-colony, whereas colony 2 was developed from three neighboring micro-colonies. This findingsuggests that, especially when the density of cells inoculated on an agar plate is high, the countsobtained from the conventional method are much likely to be underestimated. By contrast, our digitalenumeration technique can differentiate the neighboring micro-colonies at the earliest stage and bemore accurate than counting large visible colonies used in conventional methods. According to specificneeds, the upper counting limit can be increased by simply expanding the scanning area. This featureallows that fewer or even no dilutions are needed using our enumerating method, which could reducethe serial dilution-induced error. Furthermore, enumerating around 200 micro-colonies within an areaof 60 mm2, which is the maximum limit of a 100 mm agar plate, took only around 3 min, freeing upmore space and workload on sample preparation through miniaturizing the work on a piece of glassslide. It is worth noting that the scanning time was limited by the function of confocal microscopy.In this study, confocal microscopy was only used to evaluate the performance of our custom-designedbacteria culturing and imaging system in the compatibility with the microscopic scanning function.In practice, since the technique reported here can accurately deliver the counts of micro-coloniesonly from phase contrast images (fluorescence imaging is not necessary), some recently emergedultrafast high-resolution microscopic scanning techniques [35–37], which can conduct whole glassslide scanning in a few minutes, would be able to further reduce the scanning time per unit area andthereby provide counting result in a timely and high-throughput manner. Overall, the developedtechnique not only shortened the culturing time, but also allowed the labor-intensive plate countingwork to be automatically conducted on a glass slide, thoroughly overcoming the limitations of theconventional method.
Sensors 2018, 18, 3700 9 of 11
4. Conclusions
We demonstrated a unique technique that enabled digital, rapid, accurate, label-free enumerationof viable microorganisms using optical scanning microscopy. A custom-built bacteria culturingand imaging system was applied to ensure that all the micro-colonies on the large sample areacould be displayed on an image generated by microscopic scanning. Since the micro-coloniescan be counted based on their phase contrast rather than fluorescent staining, the proceduresare much simplified, rendering this technique applicable to a wide range of microorganisms thatcan form micro-colonies with clear edges. Employing E. coli as a model bacterium, our methodreduced the cell culture time from at least 13 h required for the conventional method to within5 h. Compared to conventional enumerating methods requiring an overnight (18–24 h) incubation,such improvement would benefit the analytical methods that require rapid and accurate quantitativedetermination of bacteria. Moreover, since the employment of confocal microscopy proved thatthis enumeration system was compatible with the microscopic scanning function, the application ofcost-effective ultrafast microscopic scanning techniques in the future would significantly enhancethe performance of our system by miniaturizing the bacteria enumeration work with hundreds ofagar plates into a piece of microscope glass slide. Notably, regarding the quantification of viablebacteria, this method is more accurate than the conventional agar plate method due to the fact thatneighboring bacteria before merging into one large visible colony can be differentiated using ourmethod. Therefore, this microscopic scanning-based micro-colony enumeration system has greatpotential for being adopted as a standard tool for quantifying viable microorganisms.
Supplementary Materials: The following are available online at http://www.mdpi.com/1424-8220/18/11/3700/s1.
Author Contributions: D.S. conducted the experiments and wrote the manuscript. H.L. and Q.D. performed thediscussion of the results. Z.B. developed the image-processing methods. H.W. took part in the revision of themanuscript. Y.L. conceived and managed the project and also finalized the manuscript.
Funding: This work was partially supported by National Science Foundation (NSF).
Acknowledgments: We greatly appreciate Christopher O’Connell for his guidance on operating the confocalmicroscope. We also thank Shaojia Yang for his assistance in graphic design. We thank the partial supportfrom NSF.
Conflicts of Interest: The authors declare no conflict of interest.
References
1. Wiegand, I.; Hilpert, K.; Hancock, R.E. Agar and broth dilution methods to determine the minimal inhibitoryconcentration (MIC) of antimicrobial substances. Nat. Protoc. 2008, 3, 163–175. [CrossRef] [PubMed]
2. Balouiri, M.; Sadiki, M.; Ibnsouda, S.K. Methods for in vitro evaluating antimicrobial activity: A review.J. Pharm. Anal. 2016, 6, 71–79. [CrossRef] [PubMed]
3. Hazan, R.; Que, Y.A.; Maura, D.; Rahme, L.G. A method for high throughput determination of viable bacteriacell counts in 96-well plates. BMC Microbiol. 2012, 12, 259. [CrossRef] [PubMed]
4. Austin, B. The value of cultures to modern microbiology. Antonie Van Leeuwenhoek 2017, 110, 1247–1256.[CrossRef] [PubMed]
5. Messer, J.W.; Rice, E.W.; Johnson, C.H. Total viable counts. Spread plate technique. Encycl. Food Microbiol.2000, 3, 2159–2160.
6. Davis, C. Enumeration of probiotic strains: Review of culture-dependent and alternative techniques toquantify viable bacteria. J. Microbiol. Methods 2014, 103, 9–17. [CrossRef] [PubMed]
7. Frost, H.R.; Tsoi, S.K.; Baker, C.A.; Laho, D.; Sanderson-Smith, M.L.; Steer, A.C.; Smeesters, P.R. Validation ofan automated colony counting system for group A Streptococcus. BMC Res. Notes 2016, 9, 72. [CrossRef][PubMed]
8. Sutton, S. Accuracy of plate counts. J. Valid. Technol. 2011, 17, 42–46.9. Jennison, M.W.; Wadsworth, G.P. Evaluation of the Errors Involved in Estimating Bacterial Numbers by the
Plating Method. J. Bacteriol. 1940, 39, 389–397. [PubMed]
Sensors 2018, 18, 3700 10 of 11
10. Snyder, T.L. The Relative Errors of Bacteriological Plate Counting Methods. J. Bacteriol. 1947, 54, 641–654.[PubMed]
11. Wang, X.; Yamaguchi, N.; Someya, T.; Nasu, M. Rapid and automated enumeration of viable bacteria incompost using a micro-colony auto counting system. J. Microbiol. Methods 2007, 71, 1–6. [CrossRef] [PubMed]
12. Jung, J.H.; Lee, J.E. Real-time bacterial microcolony counting using on-chip microscopy. Sci. Rep. 2016, 6,21473. [CrossRef] [PubMed]
13. Frost, W.D. Improved Technic for the Micro or Little Plate Method of Counting Bacteria in Milk. J. Infect. Dis.1921, 28, 176–184. [CrossRef]
14. Jiang, C.; Chen, P.; Shan, S. Total microcolony counting on the moving narrow culture band. J. Microbiol. Methods1995, 23, 297–300. [CrossRef]
15. Maeda, Y.; Dobashi, H.; Sugiyama, Y.; Saeki, T.; Lim, T.K.; Harada, M.; Matsunaga, T.; Yoshino, T.; Tanaka, T.Colony fingerprint for discrimination of microbial species based on lensless imaging of microcolonies.PLoS ONE 2017, 12, e0174723. [CrossRef] [PubMed]
16. Preibisch, S.; Saalfeld, S.; Tomancak, P. Globally optimal stitching of tiled 3D microscopic image acquisitions.Bioinformatics 2009, 25, 1463–1465. [CrossRef] [PubMed]
17. Legesse, F.B.; Chernavskaia, O.; Heuke, S.; Bocklitz, T.; Meyer, T.; Popp, J.; Heintzmann, R. Seamless stitchingof tile scan microscope images. J. Microsc. 2015, 258, 223–232. [CrossRef] [PubMed]
18. Yang, F.; Deng, Z.S.; Fan, Q.H. A method for fast automated microscope image stitching. Micron 2013, 48,17–25. [CrossRef] [PubMed]
19. Ma, B.; Zimmermann, T.; Rohde, M.; Winkelbach, S.; He, F.; Lindenmaier, W.; Dittmar, K.E. Use of Autostitchfor automatic stitching of microscope images. Micron 2007, 38, 492–499. [CrossRef] [PubMed]
20. Rodrigues, U.M.; Kroll, R.G. Rapid selective enumeration of bacteria in foods using a microcolonyepifluorescence microscopy technique. J. Appl. Bacteriol. 1988, 64, 65–78. [CrossRef] [PubMed]
21. Baumstummler, A.; Chollet, R.; Meder, H.; Olivieri, F.; Rouillon, S.; Waiche, G.; Ribault, S. Developmentof a nondestructive fluorescence-based enzymatic staining of microcolonies for enumerating bacterialcontamination in filterable products. J. Appl. Microbiol. 2011, 110, 69–79. [CrossRef] [PubMed]
22. Jaeger, P.A.; McElfresh, C.; Wong, L.R.; Ideker, T. Beyond Agar: Gel Substrates with ImprovedOptical Clarity and Drug Efficiency and Reduced Autofluorescence for Microbial Growth Experiments.Appl. Environ. Microbiol. 2015, 81, 5639–5649. [CrossRef] [PubMed]
23. Chen, M.T.; Weiss, R. Artificial cell-cell communication in yeast Saccharomyces cerevisiae using signalingelements from Arabidopsis thaliana. Nat. Biotechnol. 2005, 23, 1551–1555. [CrossRef] [PubMed]
24. Gu, Y.H.; Ko, W.H. Water agarose medium for studying factors affecting germination of conidia ofAmpelomyces quisqualis. Mycol. Res. 1997, 101, 422–424. [CrossRef]
25. Choi, J.; Kang, J.S.; Hong, S.C.; Bae, G.N.; Jung, J.H. A new method for the real-time quantification of airbornebiological particles using a coupled inertial aerosol system with in situ fluorescence imaging. Sens. ActuatorsB Chem. 2017, 244, 635–641. [CrossRef]
26. Hong, W.; Karanja, C.W.; Abutaleb, N.S.; Younis, W.; Zhang, X.; Seleem, M.N.; Cheng, J.X. AntibioticSusceptibility Determination within One Cell Cycle at Single-Bacterium Level by Stimulated RamanMetabolic Imaging. Anal. Chem. 2018, 90, 3737–3743. [CrossRef] [PubMed]
27. Karanja, C.W.; Hong, W.; Younis, W.; Eldesouky, H.E.; Seleem, M.N.; Cheng, J.X. Stimulated Raman ImagingReveals Aberrant Lipogenesis as a Metabolic Marker for Azole-Resistant Candida albicans. Anal. Chem.2017, 89, 9822–9829. [CrossRef] [PubMed]
28. Choi, J.; Jung, Y.G.; Kim, J.; Kim, S.; Jung, Y.; Na, H.; Kwon, S. Rapid antibiotic susceptibility testing bytracking single cell growth in a microfluidic agarose channel system. Lab Chip 2013, 13, 280–287. [CrossRef][PubMed]
29. Mitchell, A.J.; Wimpenny, J.W. The effects of agar concentration on the growth and morphology of submergedcolonies of motile and non-motile bacteria. J. Appl. Microbiol. 1997, 83, 76–84. [CrossRef] [PubMed]
30. Su, P.T.; Liao, C.T.; Roan, J.R.; Wang, S.H.; Chiou, A.; Syu, W.J. Bacterial colony from two-dimensionaldivision to three-dimensional development. PLoS ONE 2012, 7, e48098. [CrossRef] [PubMed]
31. Jonkman, J.; Brown, C.M. Any Way You Slice It—A Comparison of Confocal Microscopy Techniques. J. Biomol.Tech. 2015, 26, 54–65. [CrossRef] [PubMed]
32. Singh, A.; Gopinathan, K. Confocal microscopy: A powerful technique for biological research. Curr. Sci.1998, 74, 841–851.

Sensors 2018, 18, 3700 11 of 11
33. Wright, S.J.; Centonze, V.E.; Stricker, S.A.; DeVries, P.J.; Paddock, S.W.; Schatten, G. Chapter 1 Introduction toConfocal Microscopy and Three-Dimensional Reconstruction. In Methods in Cell Biology; Matsumoto, B., Ed.;Academic Press: San Diego, CA, USA, 1993; Volume 38, pp. 1–45.
34. Shotton, D.; White, N. Confocal scanning microscopy: Three-dimensional biological imaging. Trends Biochem. Sci.1989, 14, 435–439. [CrossRef]
35. Guo, K.; Liao, J.; Bian, Z.; Heng, X.; Zheng, G. InstantScope: A low-cost whole slide imaging system withinstant focal plane detection. Biomed. Opt. Express 2015, 6, 3210–3216. [CrossRef] [PubMed]
36. Liao, J.; Wang, Z.; Zhang, Z.; Bian, Z.; Guo, K.; Nambiar, A.; Jiang, Y.; Jiang, S.; Zhong, J.; Choma, M.; et al.Dual light-emitting diode-based multichannel microscopy for whole-slide multiplane, multispectral andphase imaging. J. Biophotonics 2018, 11. [CrossRef] [PubMed]
37. Liao, J.; Jiang, S.; Zhang, Z.; Guo, K.; Bian, Z.; Jiang, Y.; Zhong, J.; Zheng, G. Terapixel hyperspectralwhole-slide imaging via slit-array detection and projection. J. Biomed. Opt. 2018, 23, 1–7. [CrossRef][PubMed]
© 2018 by the authors. Licensee MDPI, Basel, Switzerland. This article is an open accessarticle distributed under the terms and conditions of the Creative Commons Attribution(CC BY) license (http://creativecommons.org/licenses/by/4.0/).