digital soil mapping in gis environment for crop-land ... · digital soil mapping in gis...
TRANSCRIPT

INTERNATIONAL JOURNAL OF GEOMATICS AND GEOSCIENCES
Volume 2, No 1, 2011
© Copyright 2010 All rights reserved Integrated Publishing services
Research article ISSN 0976 – 4380
Submitted on September 2011 published on November 2011 133
Digital Soil Mapping in GIS Environment for Crop-Land Suitability
Analysis Eric K. Forkuo
1, Abrefa K. Nketia
2
1- Department of Geomatic Engineering, Kwame Nkrumah University of Science &
Technology, Private Mail Bag, Kumasi, Ghana
2- Soil Research Institute, Council for Scientific and Industrial Research, Academy Post
Office, Kwadaso-Kumasi, Ghana
ABSTRACT
In recent years, geo-computational technologies have emerged as useful tools in diverse
range of application traditionally catered for by soil surveys. These are used to record, store,
manipulate and retrieve data from many soil observations including their location and
elevation on the ground. The purpose of this study is to produce a digital soil map and to
develop an interactive geodatabase with crop-land suitability analysis on the growth and
production requirement of oil palm, cassava, and citrus in the study area. Also, to develop a
choropleth map that is able to provide a visual view of all potential areas within the district
study area where the selected crops can be grown. A geodatabase for crop land suitability
analysis (Crop Mapper) was developed with the combination of ESRI ArcGIS and Microsoft
SQL Server. The attribute data of the soils are effective depth, texture, drainage, pH, course
fragments, slope, base saturation and climatic conditions such as rainfall, temperature and
length of dry season. These attributes which were linked with spatial data to develop the soil
geodatabase model, were considered as important criteria to determine the crop land
suitability. The developed Crop Mapper has the ability to upload a soil map of the study area,
perform spatial queries by attribute or using a query builder, and perfumes suitability analysis
on three different soil series for three selected crops. Also, it is user friendly, fast and gives
more accurate results.
Keywords: Geodatabase, Digital soil map, Soil survey, GIS, Crop-land suitability
1. Introduction
Digital soil mapping becomes essential due to the decreasing, time-consuming, and expensive
field surveys which are no longer affordable by the soil surveys of the individual districts
(Behrens and Scholten, 2006). In recent years, geo-computational technologies have emerged
as useful tools in diverse range of application traditionally catered for by traditional soil
surveys. For example, advances in these technologies (geographic information science,
digital terrain modelling, remote sensing, and fuzzy logic) have created a tremendous
potential for improvement in the way that soil maps are produced (Scull et al, 2003). Also,
soil physicists and scientists in Ghana have tools to develop digital soil maps, to analyze
spatial soil structures, and to simulate spatial variation of soil properties (Burrough, 1991).
Over the past few decades, few observations of soils are made in reconnaissance surveys and
maps showing the distribution of different kinds of soil are made almost exclusively by the
informed interpretation of external features as seen on aerial photographs (Burrough, 1991).
This kind of mapping is a complex, subjective art which resists quantification and it is
therefore difficult to assess the latent value of the documents produced (Burrough, 1991).
Digital Soil Mapping in GIS Environment for Crop-Land Suitability Analysis
Eric K. Forkuo, Abrefa K. Nketia
International Journal of Geomatics and Geosciences
Volume 2 Issue 1, 2011 134
Hence, the ability of GIS (Geographic Information System) to record, store and retrieve data
from many soil observations including their location and elevation on the ground (i.e., the
exact location of a soil profile observation was rarely recorded in many early surveys.) has
paved the way for studies of the spatial variation of soil properties within the subjectively
delineated landscape units (Burrough, 1991).
According to Burrough (1991) soil survey applications were among the first uses of GIS.
Also, GIS is now firmly established in modern soil survey practice and are used for map
production, deriving suitability maps to meet users’ requests for special-purpose information
and for modelling environmental processes. Based on the literature review, it has been
realized that, the problems associated with soil data could be properly dealt with if the
potentials of GIS are tapped into.
Therefore, the purpose of this study is to produce a digital soil map and to develop an
interactive geodatabase with crop land suitability analysis (called Crop Mapper) on the
growth and production requirement of oil palm, cassava, and citrus in the study area. Also, to
develop a choropleth map that is able to provide a visual view of all potential areas within the district where the selected crops can be grown. That is, choropleth map which gives a visual
impression and spatial variation of soil properties of selected crops (oil palm, cassava and
citrus) within the study. The Crop Mapper is developed with the combination of ESRI
ArcGIS and Microsoft SQL server. That is the capture of spatial data (digitizing), processing
and spatial analyzes were performed within the GIS environment. Since soil data is spatial in
nature, it can be easily handled and analyzed using ERSI ArcGIS. Also, spatially related
information in ArcGIS can be managed, analyzed and presented
Despite the large amount of work published on GIS applications in literature, little has been
published in terms of digital soil mapping using GIS for crop land suitability analysis.
Kalogirou (2002) modeled a geographic information technology in conjunction with expert
systems called LEIGIS software to implement a land suitability evaluation model. The model
used is based on the Food and Agriculture Organisation (FAO) land classification for crops
and data which describes an agriculture area in terms of soil mechanics and environment. The
software developed allows the evaluation and presentation of any equivalent spatial dataset
and does not require special computer skills.
In a study carried out by Ramakrishnan et al (2009), it was observed that if soil information
is available in GIS then many professionals could assess the information for developmental
purposes, effective agricultural research and in advisory programs. Behrens and Scholten
(2006) also developed a digital soil map as a tool to generate spatial soil information which
provided solutions for the growing demand for high-resolution soil maps worldwide. The
paper summarized the present state of soil survey in terms of digitally available soil data,
applied digital soil mapping. Similarly, Behrens et al (2005) developed digital soil mapping
using artificial neural networks. This study focused on the development of a methodology
based on artificial neural networks that is able to spatially predict soil units.
Jayasinghe and Machida (2008) developed an interactive web-based GIS consulting portal
with crop-land suitability analysis, which provides information on Tomato and Cabbage
cultivation in Sri Lanka. Soil pH, topography, average annual temperature, and average
annual rain fall were considered as important criteria to determine crop-land suitability. Their
application utilized most of the open source components and is considered as a low cost
application which will be suited for developing country. In a series of paper (Smith et al,
Digital Soil Mapping in GIS Environment for Crop-Land Suitability Analysis
Eric K. Forkuo, Abrefa K. Nketia
International Journal of Geomatics and Geosciences
Volume 2 Issue 1, 2011 135
2006, Bishop et al, 2001, Shi et al, 2001, McBratney et al, 2003) researchers developed
digital soil maps and also investigated the quality of the developed soil maps.
In Effland et al (2009), the authors discussed the theoretical developments in the
classification of tropical soil and also examined three of the eight national maps of Ghana.
The authors concluded that research in soil morphology and genesis is important for soil
mapping and classification with applications for land use and management in the tropics.
Also, Boateng (2005) used FAO methodology in a computer assisted programme to establish
areas which have potentials to support rice cultivation in Ghana. His methodology utilizes a
GIS approach for establishing a spatially inventory of land resource database to assess
potential areas suitable for sustainable rice production.
Other researchers like Debella-Gilo et al (2007) and Moore et al (1993) presented a new
digital terrain analysis and statistical analysis framework for digital soil mapping in a GIS
environment. Their research exemplified how digital terrain analysis can be used for digital
soil mapping. The rest of report outlines the background of the study area and methodology
(geodatabase design and implementation) that is organized to fulfill the research objectives. Also, results and application examples are provided and discussed. Conclusions and
discussions of future research works are outlined.
2. Digital Soil Mapping and Geodatabase Modelling
As mentioned before, the purpose of this study is to produces a digital soil map and to
develop an interactive geodatabase with crop land suitability analysis. The following sections
outline the method used to capture both spatial and attribute data, geo-reference, and design
and implement geodatabase. The background information on soil suitability classification,
choropleth mapping and the study area is also reviewed.
2.1 Soil Suitability Classification and Evaluation
Soil suitability classification involves the execution and interpretation of basic surveys of
climate, soils, vegetation and other aspects of land in terms of the requirements of alternative
forms of land use (FAO, 1976). Soil classifications are based on knowledge of crop
requirements, of prevailing soil conditions and of applied soil management (Ande, 2011).
Soil suitability evaluation, on the other hand, involves characterizing the soils in a given area
for specific land use type (Ande, 2011). Certain groups of activities are common to all types
of soil suitability evaluation and details of these activities which are carried out vary with
circumstances.
The suitability of a given piece of land is its natural ability to support a specific purpose and
this may be major kind of land use, such as rain fed agriculture, livestock production, forestry
(Ande, 2011). According to FAO (1976), two stage approaches is often used in resource
inventories for broad planning purposes and in studies for assessment of biological
productive potential. Also, there are four categories of decreasing generalization which are
recognized namely; orders, classes, subclasses and units. These classes are numbered
consequently by Arabic numbers, in sequence of decreasing degrees of suitability within the
order. More detailed information can be found in (Boateng, 2005; FAO, 1976). The design
and implantation of soil suitability are discussed in Section 2.5.
2.2 Soil Choropleth Map
Digital Soil Mapping in GIS Environment for Crop-Land Suitability Analysis
Eric K. Forkuo, Abrefa K. Nketia
International Journal of Geomatics and Geosciences
Volume 2 Issue 1, 2011 136
Recent developments have also demonstrated the critical role that visualization plays in the
domain of exploratory spatial data analysis (Anselin, 1998). Among various visualization
techniques employed in this analysis, choropleth mapping is often used to display or discover
(1) patterns in spatial observations of enumeration areas such as counties or census tracts
(Monmonier, 1993) and (2) resulting spatial statistical outcomes, such as measures of local
spatial autocorrelation (Getis and Ord, 1992; Anselin, 1995). Choropleth maps, in general,
are created by shading or colouring aerial units with intensity proportional to the data values
associated with units (Kumar, 2003). Soil choropleth maps, on the other hand, shows the
region of interest divided by the boundaries into parcels of a particular soil type (Burgess and
Webster, 1984). They provide an easy way to visualize how a measurement varies across a
geographic area or it shows the level of variability within a region.
According to Burgess and Webster (1984) soil choropleth maps are the conventional product
of traditional soil surveys or classification. That is, classification was traditionally used as
instrument for producing choropleth maps. The tools include direct manipulation controls for specifying arbitrary class boundaries, graphs representing statistical distribution of attribute
values, means for automatic classification, calculation of statistical quality of classification,
and various color schemes that can be applied to represent classes on a choropleth map
(Andrienko et al, 2001).These maps are extensively used for data presentation and significant
efforts have been invested into development of various methods of data classification for
choropleth mapping (Andrienko et al, 2001). To design soil choropleth maps in GIS
environment, the user needs error-free polygon coverage with proper topology, a mapping
variable in the polygon attribute table, and a variable with a unique identification number for
each soil unit (Kumar, 2003). A more complete discussion appears in Kumar (2003). Soil
choropleth map of the study area for three selected crops are presented and discussed in
Section 3.
2.3 The Study Area
The study area (as can be seen in Figure 1a) is a proposed farmland in the Adansi West
District (now referred to as Obuasi Municipal District). The Municipality shares
boundaries with Amansie Central District to the west, Adansi North District to the north,
Adansi South District to the east and the Upper Denkyira District (in the Central
Region) to the south. The Municipality experiences semi-equatorial climatic conditions with
a double maximum rainfall regime. Temperatures are uniformly high all year and relative
humidity is highest in the wet season (Yeboah, 2008). The vegetation is predominantly a
degraded semi-deciduous forest.
The Municipality has generally an undulating terrain with more of the hills rising above 500
meters above sea level and the vegetation is predominantly a degraded semi-deciduous forest
(Yeboah, 2008).
The farming communities of Kwame Duoku, Odumase, Gyimisokakraba, Diewieso and
Akrofuom are the settlements (Figure 1b) found around the study area. The study area
shares boundary in the west with the Kumasi-Takoradi railway line while it is bordered
in the east by a north to south line passing through the Diewieso and Gyimisokakraba
settlements. The northern fringe, on the other hand occurs on the immediate north of
Kwame Duokrom and the southern fringes by the Aserebo stream which is just north of
Akrofuom. The study area lies within 6˚ 07΄ and 6˚ 11΄ North and 1˚ 35΄ and 1˚ 40΄
Digital Soil Mapping in GIS Environment for Crop-Land Suitability Analysis
Eric K. Forkuo, Abrefa K. Nketia
International Journal of Geomatics and Geosciences
Volume 2 Issue 1, 2011 137
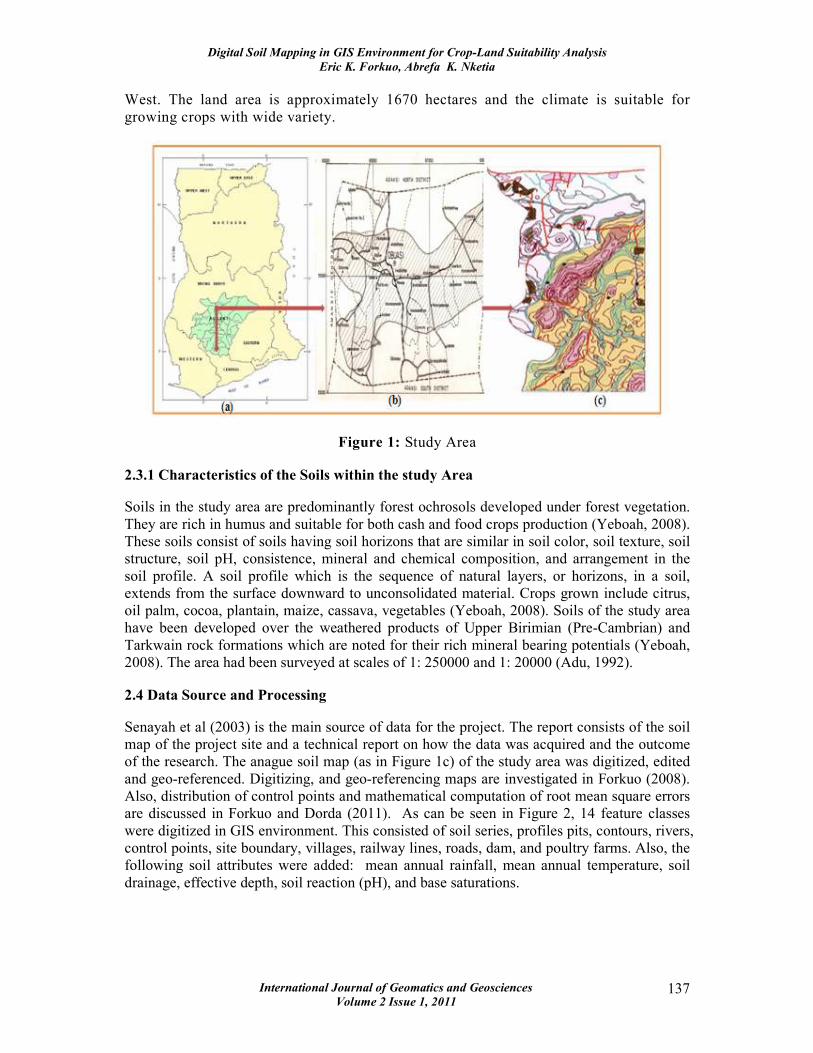
West. The land area is approximately 1670 hectares and the climate is suitable for
growing crops with wide variety.
Figure 1: Study Area
2.3.1 Characteristics of the Soils within the study Area
Soils in the study area are predominantly forest ochrosols developed under forest vegetation.
They are rich in humus and suitable for both cash and food crops production (Yeboah, 2008).
These soils consist of soils having soil horizons that are similar in soil color, soil texture, soil
structure, soil pH, consistence, mineral and chemical composition, and arrangement in the
soil profile. A soil profile which is the sequence of natural layers, or horizons, in a soil,
extends from the surface downward to unconsolidated material. Crops grown include citrus,
oil palm, cocoa, plantain, maize, cassava, vegetables (Yeboah, 2008). Soils of the study area
have been developed over the weathered products of Upper Birimian (Pre-Cambrian) and
Tarkwain rock formations which are noted for their rich mineral bearing potentials (Yeboah,
2008). The area had been surveyed at scales of 1: 250000 and 1: 20000 (Adu, 1992).
2.4 Data Source and Processing
Senayah et al (2003) is the main source of data for the project. The report consists of the soil
map of the project site and a technical report on how the data was acquired and the outcome
of the research. The anague soil map (as in Figure 1c) of the study area was digitized, edited
and geo-referenced. Digitizing, and geo-referencing maps are investigated in Forkuo (2008).
Also, distribution of control points and mathematical computation of root mean square errors
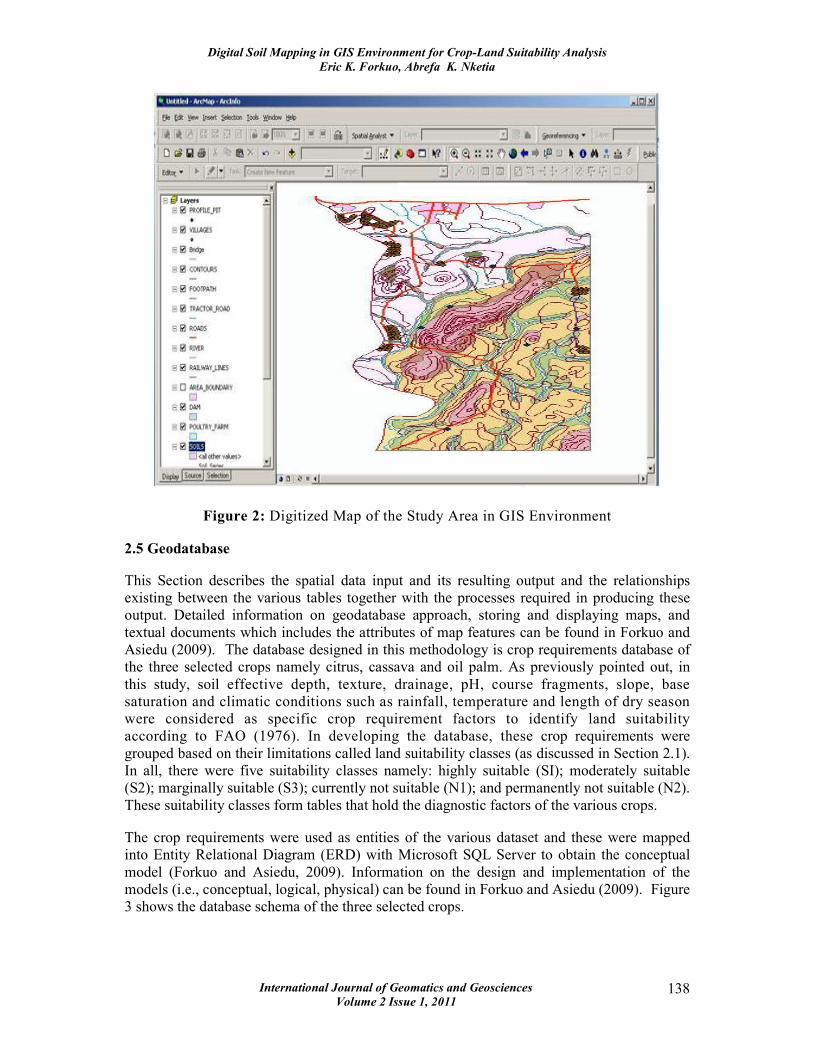
are discussed in Forkuo and Dorda (2011). As can be seen in Figure 2, 14 feature classes
were digitized in GIS environment. This consisted of soil series, profiles pits, contours, rivers,
control points, site boundary, villages, railway lines, roads, dam, and poultry farms. Also, the
following soil attributes were added: mean annual rainfall, mean annual temperature, soil
drainage, effective depth, soil reaction (pH), and base saturations.
Digital Soil Mapping in GIS Environment for Crop-Land Suitability Analysis
Eric K. Forkuo, Abrefa K. Nketia
International Journal of Geomatics and Geosciences
Volume 2 Issue 1, 2011 138
Figure 2: Digitized Map of the Study Area in GIS Environment
2.5 Geodatabase
This Section describes the spatial data input and its resulting output and the relationships
existing between the various tables together with the processes required in producing these
output. Detailed information on geodatabase approach, storing and displaying maps, and
textual documents which includes the attributes of map features can be found in Forkuo and
Asiedu (2009). The database designed in this methodology is crop requirements database of
the three selected crops namely citrus, cassava and oil palm. As previously pointed out, in
this study, soil effective depth, texture, drainage, pH, course fragments, slope, base
saturation and climatic conditions such as rainfall, temperature and length of dry season
were considered as specific crop requirement factors to identify land suitability
according to FAO (1976). In developing the database, these crop requirements were
grouped based on their limitations called land suitability classes (as discussed in Section 2.1).
In all, there were five suitability classes namely: highly suitable (SI); moderately suitable
(S2); marginally suitable (S3); currently not suitable (N1); and permanently not suitable (N2).
These suitability classes form tables that hold the diagnostic factors of the various crops.
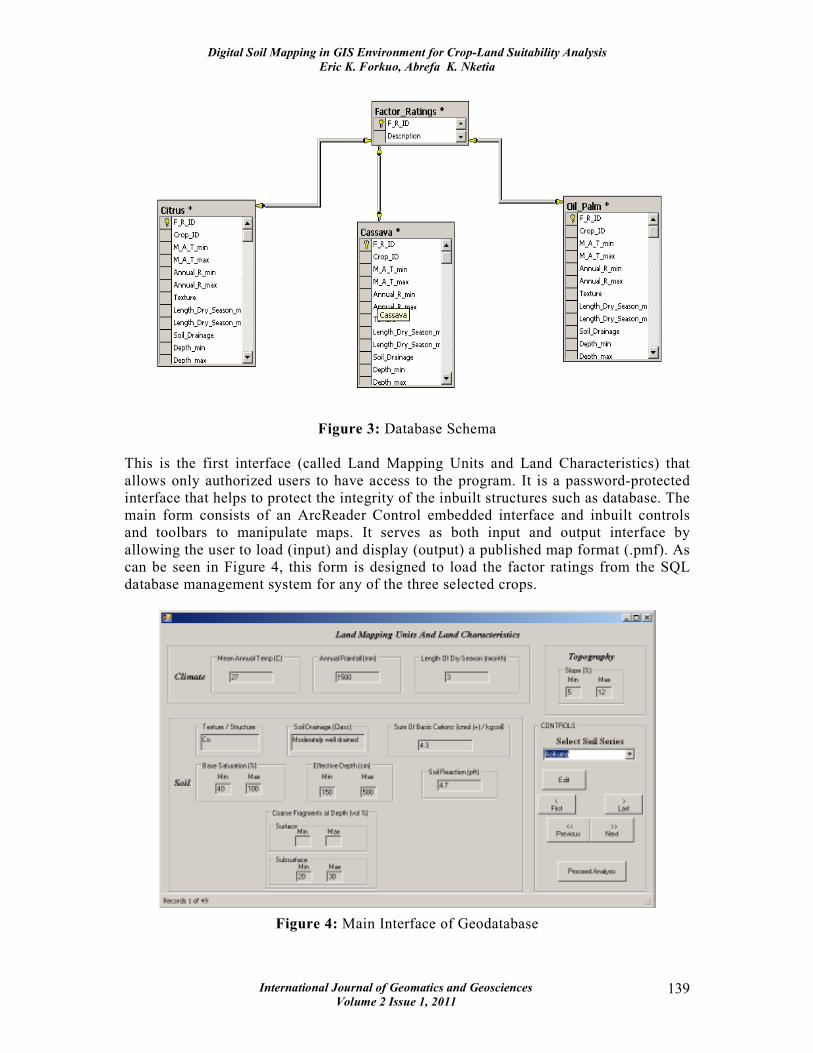
The crop requirements were used as entities of the various dataset and these were mapped
into Entity Relational Diagram (ERD) with Microsoft SQL Server to obtain the conceptual
model (Forkuo and Asiedu, 2009). Information on the design and implementation of the
models (i.e., conceptual, logical, physical) can be found in Forkuo and Asiedu (2009). Figure
3 shows the database schema of the three selected crops.
Digital Soil Mapping in GIS Environment for Crop-Land Suitability Analysis
Eric K. Forkuo, Abrefa K. Nketia
International Journal of Geomatics and Geosciences
Volume 2 Issue 1, 2011 139
Figure 3: Database Schema
This is the first interface (called Land Mapping Units and Land Characteristics) that
allows only authorized users to have access to the program. It is a password-protected
interface that helps to protect the integrity of the inbuilt structures such as database. The
main form consists of an ArcReader Control embedded interface and inbuilt controls
and toolbars to manipulate maps. It serves as both input and output interface by
allowing the user to load (input) and display (output) a published map format (.pmf). As
can be seen in Figure 4, this form is designed to load the factor ratings from the SQL
database management system for any of the three selected crops.
Figure 4: Main Interface of Geodatabase
Digital Soil Mapping in GIS Environment for Crop-Land Suitability Analysis
Eric K. Forkuo, Abrefa K. Nketia
International Journal of Geomatics and Geosciences
Volume 2 Issue 1, 2011 140
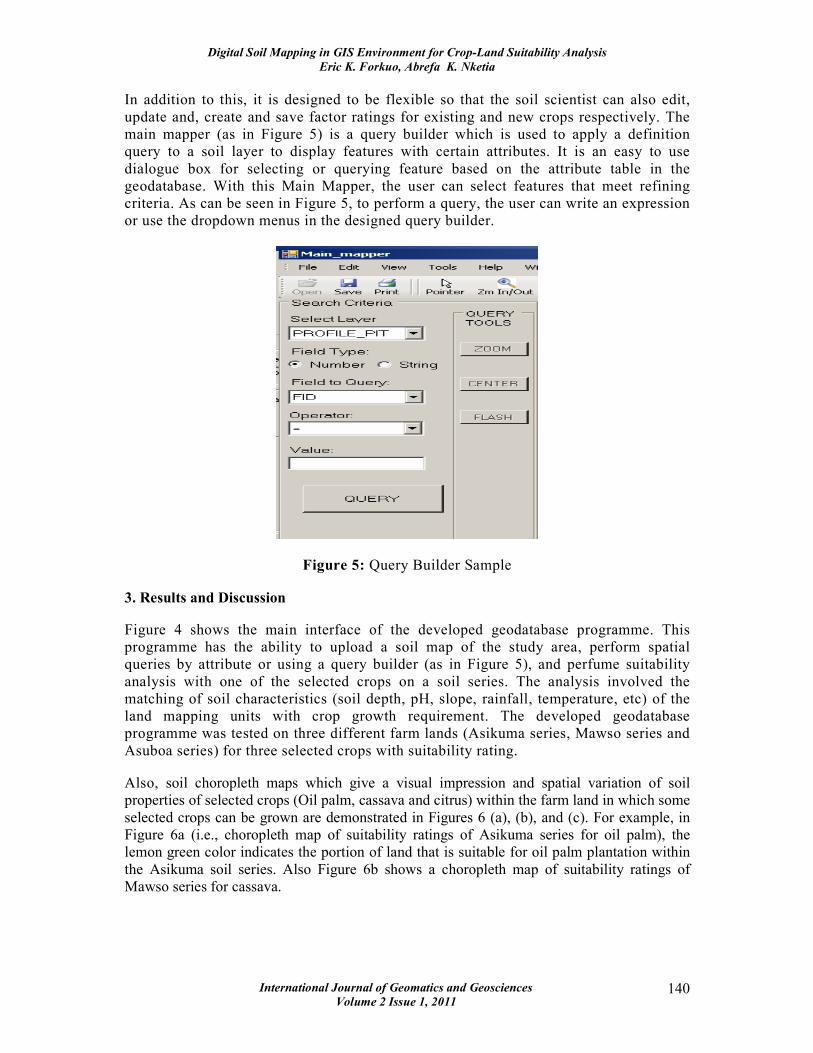
In addition to this, it is designed to be flexible so that the soil scientist can also edit,
update and, create and save factor ratings for existing and new crops respectively. The
main mapper (as in Figure 5) is a query builder which is used to apply a definition
query to a soil layer to display features with certain attributes. It is an easy to use
dialogue box for selecting or querying feature based on the attribute table in the
geodatabase. With this Main Mapper, the user can select features that meet refining
criteria. As can be seen in Figure 5, to perform a query, the user can write an expression
or use the dropdown menus in the designed query builder.
Figure 5: Query Builder Sample
3. Results and Discussion
Figure 4 shows the main interface of the developed geodatabase programme. This
programme has the ability to upload a soil map of the study area, perform spatial
queries by attribute or using a query builder (as in Figure 5), and perfume suitability
analysis with one of the selected crops on a soil series. The analysis involved the
matching of soil characteristics (soil depth, pH, slope, rainfall, temperature, etc) of the
land mapping units with crop growth requirement. The developed geodatabase
programme was tested on three different farm lands (Asikuma series, Mawso series and
Asuboa series) for three selected crops with suitability rating.
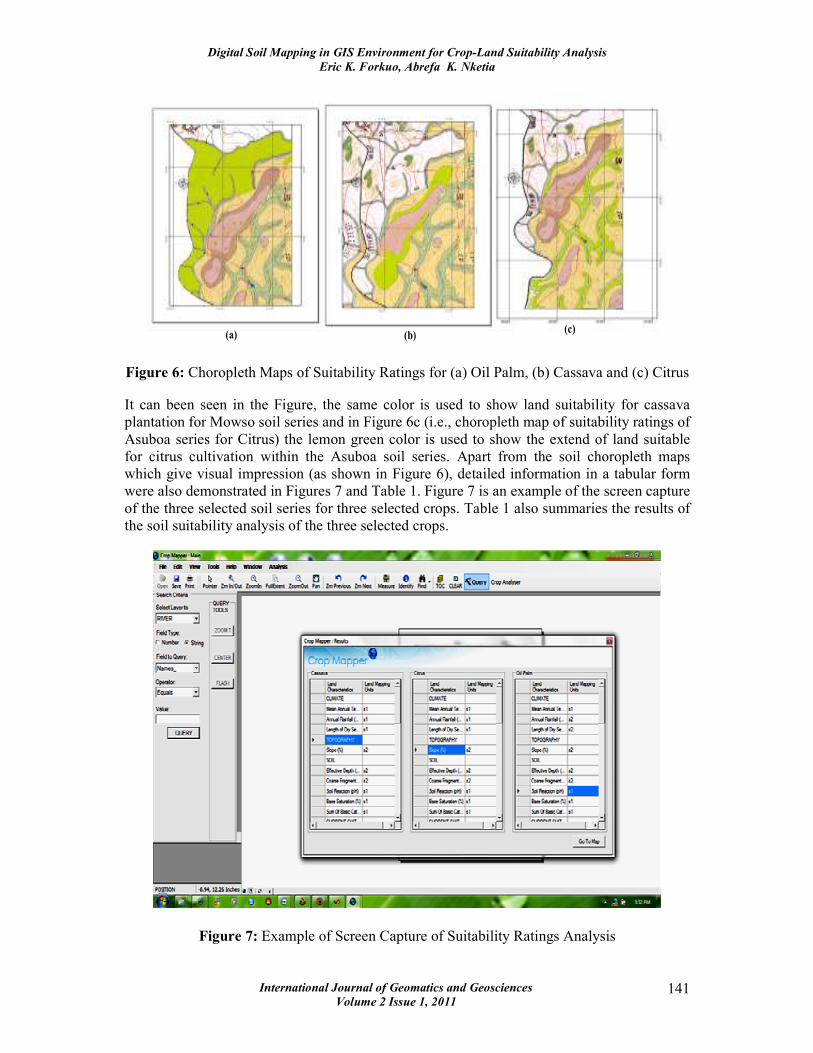
Also, soil choropleth maps which give a visual impression and spatial variation of soil
properties of selected crops (Oil palm, cassava and citrus) within the farm land in which some
selected crops can be grown are demonstrated in Figures 6 (a), (b), and (c). For example, in
Figure 6a (i.e., choropleth map of suitability ratings of Asikuma series for oil palm), the
lemon green color indicates the portion of land that is suitable for oil palm plantation within
the Asikuma soil series. Also Figure 6b shows a choropleth map of suitability ratings of
Mawso series for cassava.
Digital Soil Mapping in GIS Environment for Crop-Land Suitability Analysis
Eric K. Forkuo, Abrefa K. Nketia
International Journal of Geomatics and Geosciences
Volume 2 Issue 1, 2011 141
(a) (b)(c)
Figure 6: Choropleth Maps of Suitability Ratings for (a) Oil Palm, (b) Cassava and (c) Citrus
It can been seen in the Figure, the same color is used to show land suitability for cassava
plantation for Mowso soil series and in Figure 6c (i.e., choropleth map of suitability ratings of
Asuboa series for Citrus) the lemon green color is used to show the extend of land suitable
for citrus cultivation within the Asuboa soil series. Apart from the soil choropleth maps
which give visual impression (as shown in Figure 6), detailed information in a tabular form
were also demonstrated in Figures 7 and Table 1. Figure 7 is an example of the screen capture
of the three selected soil series for three selected crops. Table 1 also summaries the results of
the soil suitability analysis of the three selected crops.
Figure 7: Example of Screen Capture of Suitability Ratings Analysis

Digital Soil Mapping in GIS Environment for Crop-Land Suitability Analysis
Eric K. Forkuo, Abrefa K. Nketia
International Journal of Geomatics and Geosciences
Volume 2 Issue 1, 2011 142
Suitability assessment performed on Asikuma series for oil palm yielded the result in
Table 1a. It could be seen from this Table that the Asikuma series is potentially
moderately suitable for the growth of oil palm. Their limitations are currently moisture
and nutrient availability to the crop, which is represented by S2mn. Moisture
availability (m) and nutrient availability (n) are a combination of amount of such factors
as rainfall and low level of pH.
Also, suitability assessment was performed on Mawso series for cassava and the results
are shown in Table 1b. It is on the other hand, rated as S2r as can be seen in this Table.
This implies that Mawso series is potentially moderately suitable for the growth of
cassava and the limitation to its use is reflected in the high gravel content of subsoil.
The gravelly nature of the subsoil affects proper root development. Since cassava is a
root crop, there is the tendency that cassava will not grow to its maximum capacity in
such a soil.
Furthermore, a suitability assessment performed on Asuboa series and from the report in Table 1c, it could be observed that Asuboa series is currently graded N1n. This implies
that Asuboa Series is currently not suitable for the growth of citrus. The major
limitation to its use is nutrient availability (n) which is reflected in low pH levels
obtained. Potentially, it is an S2 which is moderately suitable. It can be seen that the
limitation to its use is rooting condition (r) and it is reflected in the high amount of
gravel in the subsoil. The gravelly nature of the subsoil inhibits proper root penetration.
Since citrus crops have long tap roots, it has fewer chances of doing well on such soil.
Table 1: Summary of Soil Suitability Analysis of Selected Crops
Land Characteristics Soil Suitability Rating for
(a)
Oil Palm
(b)
Cassava
(c)
Citrus
CLIMATE
Mean Annual Temperature(C) S1 S1 S1
Annual Rainfall(mm) S1 S2 S1
Length of Dry Season S2 S2 S1
TOPOGRAPHY
Slope (%) S1 S2 S2
SOIL
Effective Depth (mm) S2 S2 S1
Coarse Fragments(vol %) subsurface S1 S2 S2
Soil Reaction(pH) N1 S2 S1
Base Saturation(%) S1 S1 S1
Current Suitability N1n S2mm S2r
Potential Suitability S2r S2mm S2r
It is worth noting that the suitability ratings in Table 1 using the developed crop mapper
do not imply that assessment for other crops could yield the same results. This is
because every crop has got its own suitability ratings and depending on the crop
assessed for suitability, the result could be varying. Moreover, in designing the
geodatabase for the suitability ratings, not all requirements were included. This is
because different crop has different requirements for their suitability evaluation. That

Digital Soil Mapping in GIS Environment for Crop-Land Suitability Analysis
Eric K. Forkuo, Abrefa K. Nketia
International Journal of Geomatics and Geosciences
Volume 2 Issue 1, 2011 143
notwithstanding, if a crop forms part of any of the classes of crops that have been
assessed, the crop mapper could be used to perform the assessment on how suitable a
land mapping unit could support the growth of such crops.
Other than that, the crop mapper allows the user to input in new suitability ratings for
new crop. This makes the program versatile to be used to analyze various crops based
on the diagnostic factors designed for this program. There is the need to also emphasize
that this kind of land evaluation is based solely on the physical and chemical
characteristics of soils neglecting basic economic factors and major agricultural
practices. The developed crop mapper for land suitability analysis is faster and gives
more accurate results provided the geodatabase is accurate. Also, as discussed in
Boateng (2005) the accuracy of this depends on reliable and accurate climate and soil
data, as well as expert knowledge in interpreting the data.
4. Conclusions and Recommendations
A digital soil map has been produced to store and develop an interactive geodatabase
(called crop mapper model). The fundamental conceptual elements of creating this model has been solved designed and developed using Microsoft SQL and GIS. This
crop mapper model has been used to analyze land suitability for the growth and
production of some of the selected crops in the study area. Also, Arc Reader control has
been customized and this will assist soil scientists to identify all current and future land
mapping units (or soil series) which are suitable for the growth. The video in the help
menu with sound inset will assist in empowering the end-user to use the program for
future analyses.
Again, a chloropleth thematic maps which have the potential of visual impression and
special variation of soil properties have been created. These maps delineated one
suitability rating from the other using color coding system. That is, a particular color (a
lemon green) was used to indicate the portion of land in the study area that is suitable
for the cultivation of cassava, citrus and oil palm. The developed model for land
suitability analysis was tested on three different soil series for three selected crops. It is
user friendly, fast and precise. However, the precision of the model depends on
reliability and accuracy of crop growth requirements (soil depth, pH, slope, rainfall,
temperature) used in this study.
The land crop suitability analysis could even be improved if crop mapping model is
updated for the production of many crops and the model is extended to cover the whole
country. Also, other factors such as humidity, digital terrain models, land use,
vegetation cover, geology and the influence of the topography should be considered.
The methodology and deliverables of this project will allow the Adansi West District to
utilize new planning guidelines to preserve and manage the soil fertility while managing
development in the region.
Acknowledgement
The success of this project will not have been possible if not with the help of the Director, Dr.
J. O. Fening and management of CSIR-SRI Ghana. The authors acknowledge the CSIR-
Soil Research Institute, Kumasi for their help and cooperation in acquiring the soil data
of the study area. CSIR-SRI provided data used for the analysis and their scientific technical
know-how is much appreciated. Mr. J. K. Senayah (Head of Department, Soil Genesis and

Digital Soil Mapping in GIS Environment for Crop-Land Suitability Analysis
Eric K. Forkuo, Abrefa K. Nketia
International Journal of Geomatics and Geosciences
Volume 2 Issue 1, 2011 144
Classification) assisted with the interpretation of soil suitability data in determining factor
ratings and classification.
5. References
1. Adu, S.V (1992), soils of the Kumasi Region, Ashanti Region, Ghana, Soils
Research Institute, Kwadaso-Kumasi, Memoir, No. 8, pp 22-24.
2. Ande, O. T (2011), soil Suitability Evaluation and Management for Cassava
Production in the Derived Savanna Area of Southwestern Nigeria. International
Journal of Soil Science, 6, pp 142-149.
3. Andrienko, G., Andrienko, N., and Savinov, A (2001), Choropleth Maps:
Classification revisited, In Proceedings ICA 2001, Beijing,China, 2, pp 1109-
1219
4. Anselin, L (1998), exploratory Spatial Data Analysis in a Geo-computational
Environment. In P. Longley, S. Brooks, B. Macmillan and R. McDonnell (Eds.),
GeoComputation, A Primer, pp. 77-94. New York: Wiley.
5. Behrens, T., and Scholten, T (2006), digital Soil Mapping in Germany - a review, Journal of Plant Nutrition and Soil Science, 169(3), pp 434 – 443.
6. Behrens, T., Förster, H., Scholten, T., Steinrücken, U., Ernst-Dieter., S., and
Goldschmitt., M (2005), digital Soil Mapping using Artificial Neural Networks,
Journal of Plant Nutrition and Soil Science, 168(1), pp 21 – 33.
7. Bishop, T. F. A., McBratney, A. B., and Whelan, B. M (2001), measuring the
Quality of Digital Soil Maps using Information Criteria, Geoderma, 103(1-2,
31), pp 95-111.
8. Boateng, E (2005), GIS as a Decision Support Tool for Land Suitability
Assessment for Rice Production in Ghana, West Africa Journal of Applied
Ecology, 7, pp 69-81.
9. Burgess, T. M., and Webster, R (1984), optimal Sampling Strategies for
Mapping Soil Types: Distribution of boundary spacings, Journal of Soil Science,
35(4), pp 641–654,.
10. Burrough, P. A (1991), soil Information Systems. In: Maguire, D. J. M. F.
Goodchild and D. W. Rhind, Editor. Geographical Information Systems.
Principles and Applications. New York: John Wiley & Sons; pp153-169.
11. Debella-Gilo, M., Etzelmuller, B., Klakegg, O (2007), digital Soil Mapping
Using Digital Terrain Analysis and Statistical Modelling Integrated into GIS:
Examples from Vestfold County of Norway, Proceedings, ScanGIS’2007, pp
237- 253.
12. Effland, W. R., Asiamah, R. D., Adjei-Gyapong,T., DeIa-Dedzoe, C., and
Boateng, E (2009), discovering Soils in the Tropics: Soil Classification in
Ghana, Soil Survey Horizon, 50, pp 39-46.
Digital Soil Mapping in GIS Environment for Crop-Land Suitability Analysis
Eric K. Forkuo, Abrefa K. Nketia
International Journal of Geomatics and Geosciences
Volume 2 Issue 1, 2011 145
13. Food and Agriculture Organization (FAO) (1976), a Framework for Land
Evaluation. FAO Soil Bulletin No. 32, FAO, Rome, pp 17-21.
14. Forkuo, E. K., and Dorda, A. G (2011), the Effects of Production Steps on
Accuracy of Digital Orthoimages. The Journal of Geomatics, 5(1), pp 1-9.
15. Forkuo, E. K., and Asiedu, S. B (2009), developing a One Stop Shop Model for
Integrated Land Information Management. Journal of Science and Technology,
29(3), pp 114-125.
16. Forkuo, E. K (2008), digital Terrain Modelling in a GIS Environment. The
International Archives of the Photogrammetry, Remote Sensing and Spatial
Information Sciences”. Vol. XXXVII, Part B2, pp 1023-1028.
17. Getis, A., and Ord, J. K (1992), the Analysis of Spatial Association by use of
Distance Statistics. Geographic Anals, 24, pp 189-206.
18. Jayasinghe, P. K. S. C. T., and Machida, T (2008), web-based Online
Consulting System with Crop-Land Suiability Identification, Agricultural
Information Research, 17(1), pp 13-19.
19. Kalogirou, S (2002), expert Systems and GIS: An Application of Land
Suitability Evaluation. Computers, Environment and Urban Systems, 26(2-3),
pp 89-112.
20. Kumar, N (2003), mapping Spatial and Statistical Distributions in a Choropleth
Map. ArcUser, Online Magazine for ESRI Software Users. Available at http://
www.esri.com/news/arcuser/1003/ files/choropleth.pdf, Accessed on August
2011.
21. McBratney, A. B., Mendonc Santos, M. L., and Minasnya, B (2003), on Digital
Soil Mapping. Geoderma, 117, pp 3–52.
22. Moore, I. D., Gessler, G. A., Nielsen, G. A., Peterson (1993), soil Attribute
Prediction using Analysis, Soil Science Society of American Journal, 57, pp
443-452.
23. Monmonier, M (1993), maps in humanities and Social Science. In: Monmonier
M, ed. mapping it Out-Expository Cartography for The Humanities And
Sciences. Chicago, University of University Press, pp 3-18.
24. Ramakrishnan, S. S., and Guruswamy, V (2009), GIS Applications in Soil Data
Analysis, Center for GIS Applications, Anna University, India. Available at:
http://www.gisdevelopment.net, Accessed on March 2011.
25. Senayah, J. K., Adjei, S., Dwomo, O., and Asiamah, R. O (2003), land
Suitability Assessment for the Production of Selected Crops in the Adansi West
District: SRI Technical Report No. 23. Kwadaso-Kumasi.
26. Scull, P., Franklin, J., Chadwick, O. A., and McArthur, D (2003), predictive Soil
Mapping: A Review. Progress in Physical Geography, 27(2), pp 171–197.
Digital Soil Mapping in GIS Environment for Crop-Land Suitability Analysis
Eric K. Forkuo, Abrefa K. Nketia
International Journal of Geomatics and Geosciences
Volume 2 Issue 1, 2011 146
27. Shi, X, Z., Yu, D. S., Warner, E. D., Pan, X. Z., Petersen, G. W., Gong, Z. G.,
Weindorf, D. C (2001), soil Database of 1:1,000,000 Digital Soil Survey and
Reference System of the Chinese Genetic Soil Classification System, Soil
Survey Horizons, 45(4), pp 129-136.
28. Smith, M. P., Zhu, A. X., Burta, J. E., and Cynthia Stiles (2006), the Effects of
DEM Resolution and Neighborhood Size on Digital Soil Survey. Geoderma,
137(1-2), 31, pp 58-69.
29. Yeboah, J. Y (2008), environmental and Health Impact of Mining on
Surrounding Communities: A Case Study of Anglogold Ashanti in Obuasi. A
Master of Arts Thesis, The Department of Geography and Rural Development,
Faculty of Social Sciences, College of Art and Social Sciences, Kwame
Nkrumah University of Science and Technology, pp 54-60.