digitalised transportation data as disruptive innovation: prospects in
TRANSCRIPT

Seediscussions,stats,andauthorprofilesforthispublicationat:https://www.researchgate.net/publication/282118931
DIGITALISEDTRANSPORTATIONDATAASDISRUPTIVEINNOVATION:PROSPECTSINMEXICOCITY
ARTICLE·MARCH2015
READS
7
3AUTHORS,INCLUDING:
ChrisZegras
MassachusettsInstituteofTechnology
62PUBLICATIONS279CITATIONS
SEEPROFILE
Availablefrom:ChrisZegras
Retrievedon:20January2016
DIGITALIZED PUBLIC TRANSPORTATION DATA AS DISRUPTIVE INNOVATION: PROSPECTS IN MEXICO CITY
Chris Zegras
[email protected] Massachusetts Institute of Technology
Department of Urban Studies and Planning 77 Massachusetts Avenue
Cambridge, MA 02138 T 617-452-2433 / F 617-258-8081
Emily Eros
[email protected] Massachusetts Institute of Technology
Department of Urban Studies and Planning 77 Massachusetts Avenue
Cambridge, MA 02138 T 603-306-2354 / F 617-253-2654
Shomik Mehndiratta
[email protected] The World Bank Group
Latin America and Caribbean Region 1818 H St, NW
Washington, DC 20433 T 202-458-9691 / F 202-676-9594
Working Paper
MARCH 2015
1
ABSTRACT Many cities in the Global South rely on highly atomised, cartelised paratransit services that pose challenges for regulation, oversight, and planning. Agencies’ lack of information exacerbates these struggles. However, increasingly affordable and powerful mobile devices, along with standardised formats for codifying public transportation information, are changing the information landscape. This paper uses a data collection project in Mexico City to explore conditions under which digitalisation of public transportation information may act as a disruptive innovation, creating value and altering dynamics within and between different stakeholder groups. Findings suggest that Mexico’s current, static data feed is unlikely to cause significant disruption, but that real-time data collection could increase government regulatory capacity, expediting efforts to franchise atomised services and expand higher-capacity public transport supply. The case underscores the importance of public transport information for development and suggests how digitalised data collection may help reform public transportation systems dominated by atomised paratransit services. Keywords: public transport; paratransit; Mexico City; information; ICTs; disruptive innovation INTRODUCTION
Much public transportation in the Global South is provided by the private sector. Often small-scale enterprises, these services operate under a range of business, regulatory and service conditions, providing inarguable value. They offer flexible and adaptable supply, key to satisfying dynamic demands, at low direct cost to government, and provide employment. Nonetheless, such services pose several challenges: on-street competition and accident risks, crowded vehicles, traffic congestion from oversupplied routes, local air pollution from aging fleets, regulation and enforcement difficulties, even violence (Cervero and Golub, 2007). At some scale, such services become the de facto public transportation system and planning and regulatory force.
These conditions represent one stage on a longer-term public transportation supply cycle moving from entrepreneurs to eventual public monopoly (Gómez-Ibáñez and Meyer, 1993). A purely “free market”-based urban public transport system cannot effectively satisfy the public good, requiring regulations to reduce externalities and minimise cartelistic advantages. Purely public monopolies, in contrast, tend to produce supply inefficiencies and high public costs due, partly, to weak competition. Achieving the optimal balance inevitably requires some regulatory capability. Accurate and comprehensive information – on routes, frequencies, schedules, fares, etc. – can play a crucial role, relieving the plights of users, planners, regulators, and operators.
The inherent traits of highly atomised, cartelised private operator systems – with thousands of vehicles, hundreds of routes, operators and owners, and numerous associations – inhibit collecting data to generate accurate and comprehensive service information. Most codified public information remains limited, analog, and paper-based. Some route associations may possess extensive, digital information for their particular services, but such information typically remains private. As a result, responsible agencies lack a complete picture of transit operations, limiting capacity to monitor, regulate, assess, and plan. This “hidden information” landscape also impacts system users, who must depend upon personal experiences and word-of-mouth to understand and use the system.

2
Into this environment comes a range of information and communication technologies (ICTs) associated with the information and communication technology (ICT) “revolution.” Digitalisation, epitomised by the General Transit Feed Specification (GTFS), can provide detailed route and stop and, increasingly, real-time performance information (via GTFS-Real Time) through various communication media. The increasingly ubiquitous “smartphone” – with low cost computing, sensing and communication capabilities – puts this information generation, processing and consuming capabilities directly into the hands of users. The smartphone-enabled, ICT-based promise has already manifest in several developing megacities, including Manila, Dhaka, Nairobi and Mexico City resulting in GTFS feeds, GIS shapefiles and sometimes physical public transportation maps (Zegras et al, 2015).
Such data collection and release represents a move from hidden to open data – promising low cost, spatiotemporally precise, digitalised information, easily accessible to in various formats, potentially acquired without operators’ assistance or acquiescence. This article speculates on possible impacts of these digitalised data in Mexico City, a megacity with a long history in the public transport regulatory cycle and a strong ongoing presence of private, small-scale operators within a larger, heterogeneous public transport service milieu. The paper explores conditions under which the digitalisation of public transportation information may act as a disruptive innovation, altering dynamics within and between different stakeholder groups.
KEY CONCEPTS AND APPROACH “Informality” and “Paratransit” in Public Transportation
In the Global South, a large share of urban residents’ daily mobility needs are provided by services variously referred to as “paratransit,” “informal transport,” “intermediate transit,” etc. (Rimmer, 1980). While often used interchangeably (Cervero and Golub, 2007), paratransit and informal transit have different meanings. Paratransit refers to the service characteristics of a particular transportation supply; informality refers to the nature of the business enterprise and the broader economic and regulatory context. Both terms were apparently coined in the early 1970s, coming out of different fields (Rimmer, 1980, Peattie, 1987), and remain somewhat ambiguous in definitions and connotations.
Conceptually, the informal sector in international development circles has long been debated (Rakowski, 1994). Peattie (1987) considers the term inherently “fuzzy,” originating in the early 1970s to describe a “way of doing things.” The literature reveals a range of relevant dimensions, relating to the ease of entry into an industry, ownership structure, firm size, employment structure and relations, labour intensiveness and sophistication (e.g., formal training), relative capital intensity, degree of regulation and enforcement, formality of transactions (e.g., taxes, receipts), product and service types offered, legal status (e.g., registration, labour rules), and agency role (e.g., self-appointed regulators) (Peattie, 1987; Mead and Morrisson, 1996; Maloney, 2004; Woolf and Joubert, 2013). Harriss-White (2010) categorises informal sector activities as either legal activities, undertaken within an illegal institutionality; or illegal activities undertaken within a “legal” institutionality. Ultimately, informality is best understood as a spectrum of enterprise and sector characteristics. The state plays a conscious role, selectively applying rules and regulations, protecting interest groups, and adjusting to larger

3
economic realities and needs (Rakowski, 1994; Bunnell and Harris, 2012). Dierwechter (2002) argues that understanding the urban informal sector requires deeper empirical understanding of its inherent spatiality.
Paralleling the recognition of the “informal sector” in economic development circles, during the early 1970s the term “paratransit” emerged in North America to describe services operating in the space between taxis and fixed route public transport (e.g., trains). Encompassing demand-responsive transit, shared-ride taxis, subscription services, among others (Rimmer, 1980), paratransit services have some degree of flexibility in routes, frequencies, and/or fares (Silcock, 1981). Regulation of paratransit services essentially focuses on these three dimensions, but may also include related quality and quantity controls. Government and/or industry groups themselves (e.g., route associations) may impose and enforce regulations. Typically, fare and route/area controls are stronger than schedule controls (Silcock, 1981). In the Global South paratransit includes Nairobi’s matatus, Manila’s jeepneys, and Mexico City’s colectivos.
Silcock (1981, 1986) characterises paratransit in the developing world as: having a business structure with many sellers, easy entry, entrepreneurial ownership, abundant non-union labour, and weak accounting methods; providing relatively demand-responsive supply at low labour and capital cost with little subsidy, variable fares, and small vehicles; operating with difficult and costly quality and quantity controls, prone to corruption. By this description, conflating “informal” and “paratransit” seems understandable. Informality, in the form of illegal operations, may be a necessary precedent to “formal” recognition by authorities, by demonstrating the need for and viability of a particular route (Uzell, 1987).
Public Transportation Regulatory Cycles
In the longer arc of public transportation history, entrepreneurial paratransit-type services play a key role, across a range of contexts. Gómez-Ibáñez and Meyer (1993) depict urban bus system histories through a ten-stage cycle: entrepreneurial; service consolidation; fare/franchise regulation; profit decline; service reduction; public takeover; public subsidies; declining efficiency; subsidy and service cuts and fare increases; and, privatisation. Gwilliam (2008) describes a similar, albeit simplified, four-stage cycle in the “post-colonial” case: private regulated monopoly, public sector monopoly, fragmented informal supply, and informal sector cartel. Some version of this cycle has played out over time in places like the USA, which essentially landed and remained at the public monopoly stage after public takeover of most services in the 1950s, Singapore, which arrived at the private regulated monopoly stage in the 1970s, and Santiago de Chile which arrived at the private regulated monopoly stage in the late 2000s.
Similarly to the emergence of and debates over the concept of the “informal sector,” the public transport regulatory cycle fits into broader development debates related to dualistic ideas around “modernisation, “corporatisation,” “free markets,” etc. As mainstream development institutions pushed deregulation “to release the dynamic entrepreneurialism” (Harriss-White, 2010; 176) within economies generally, similar arguments were being made in the public transportation sector (Rimmer, 1980). Notably, Pinochet’s Chile, the neo-liberal poster child of the 1970s and 1980s, was a pioneer in “liberalising” its urban public transportation system. Especially in Santiago, the policy
4
ultimately resulted in more vehicles of smaller capacities, higher fares, a stronger operator cartel, and severe congestion, pollution and accident costs (Fernández, 1994).
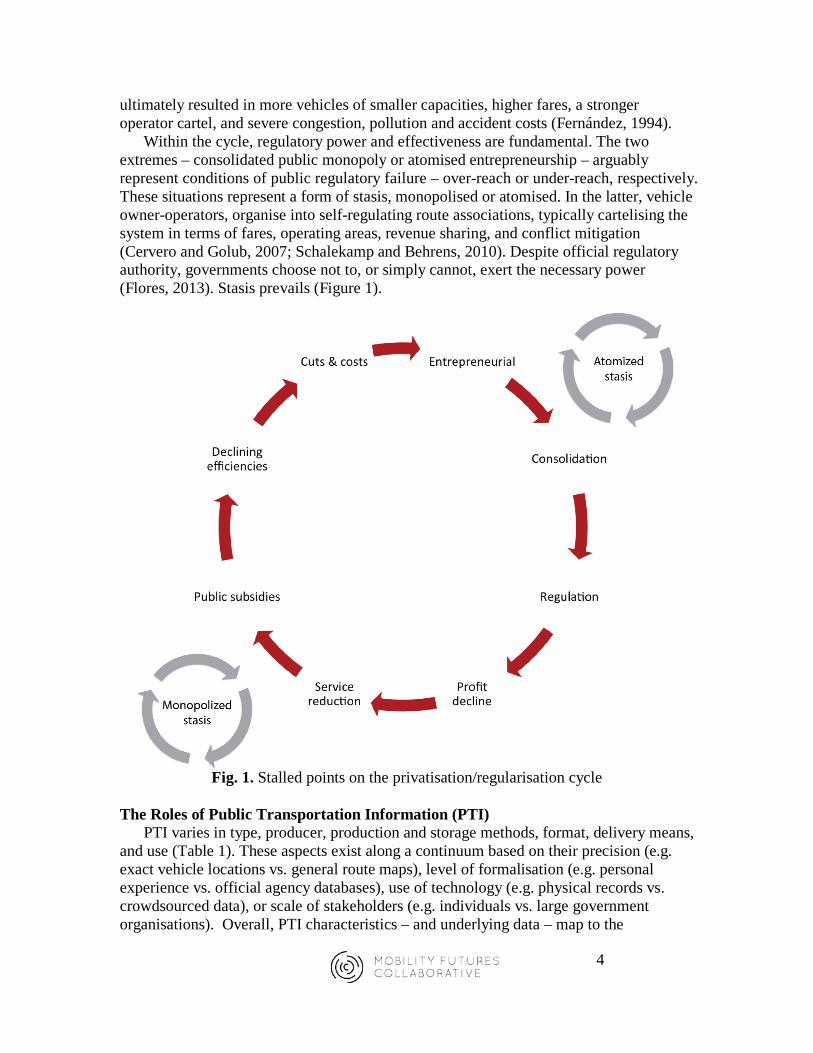
Within the cycle, regulatory power and effectiveness are fundamental. The two extremes – consolidated public monopoly or atomised entrepreneurship – arguably represent conditions of public regulatory failure – over-reach or under-reach, respectively. These situations represent a form of stasis, monopolised or atomised. In the latter, vehicle owner-operators, organise into self-regulating route associations, typically cartelising the system in terms of fares, operating areas, revenue sharing, and conflict mitigation (Cervero and Golub, 2007; Schalekamp and Behrens, 2010). Despite official regulatory authority, governments choose not to, or simply cannot, exert the necessary power (Flores, 2013). Stasis prevails (Figure 1).
Fig. 1. Stalled points on the privatisation/regularisation cycle
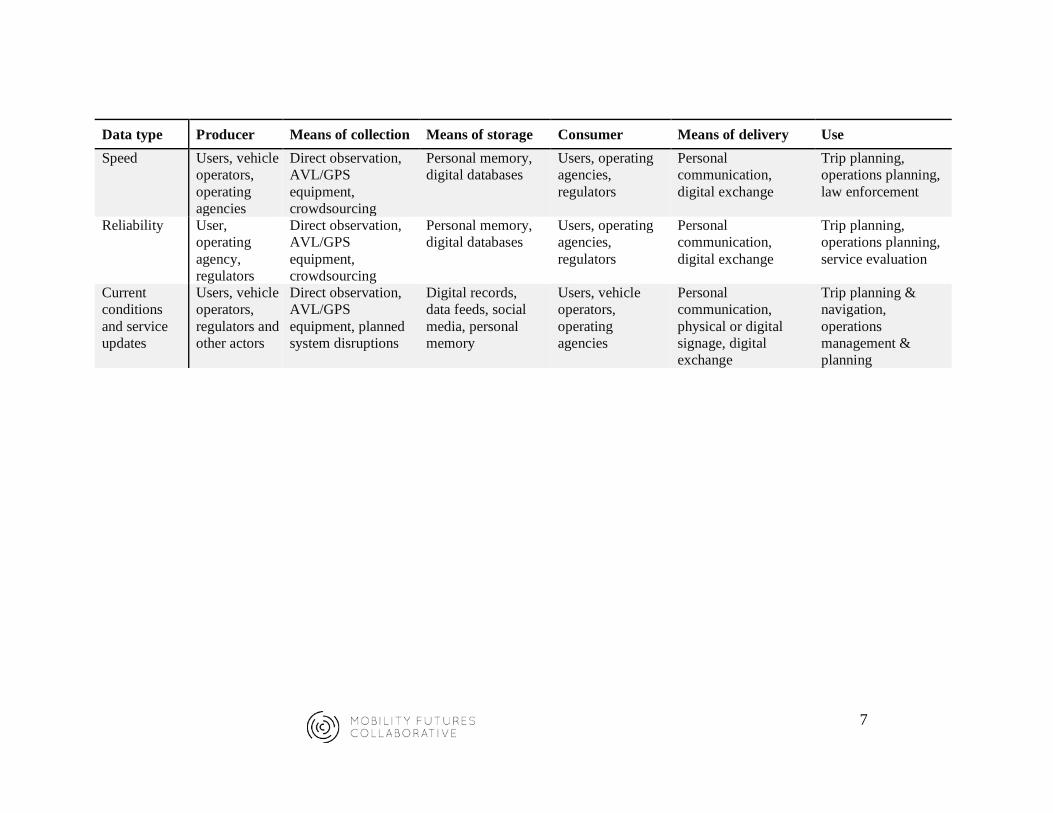
The Roles of Public Transportation Information (PTI) PTI varies in type, producer, production and storage methods, format, delivery means,
and use (Table 1). These aspects exist along a continuum based on their precision (e.g. exact vehicle locations vs. general route maps), level of formalisation (e.g. personal experience vs. official agency databases), use of technology (e.g. physical records vs. crowdsourced data), or scale of stakeholders (e.g. individuals vs. large government organisations). Overall, PTI characteristics – and underlying data – map to the
5
paratransit and informality spectra. More temporal and spatial flexibility in a service, for example, makes information codification more difficult; more informality in enterprise operations, such as cash transactions and unclear vehicle/route licensing, also hampers the codification of accurate and reliable information. Hidden information can serve as a business strategy – to remain outside the regulatory light and/or to avoid competition.
For system users or potential users, PTI influences system understanding, ease and comfort of use, and conceptions of potential destinations in, and even overall perceptions about, a city (Zegras et al., 2015). More broadly PTI enables operations planning, implementation, regulation, and enforcement. Among prevailing paratransit systems in the Global South, non-codified, face-to-face information sources and channels often dominate all operating dimensions: market entry, labour recruitment and training, driver and association relations, vehicle dispatching, system wayfinding, passenger recruitment, and service evolution (Woolf and Joubert, 2013). The lack of paratransit supply and demand information hampers government regulation, essentially leaving it in industry hands (Schalekamp and Behrens, 2010). Uzzell (1987), in analysing Lima’s microbuseros in the 1980s, suggested that many chose to remain small-scale, partly to evade regulation and competition. Operators created an “information vacuum” (p. 28) to keep regulators in the dark and strategically concentrate power, while leveraging their direct access to “daily market information” (p. 22) from riders to rapidly and dynamically respond to market demands (Uzzell, 1987). Despite their typical conspicuousness in many developing cities, paratransit services often remain “informal” in the information dimension; being “unenumerated” (Peattie, 1987; 858) makes service extent, degree of legality, and overall effectiveness difficult to know.
Para-transit “efficiency” hinges on basic information-related market assumptions of perfect competition and perfect consumer information, clearly elusive in current urban realities. Externalities and collusion require regulations, but, in an atomised stasis, government lacks the capacity and/or motivations. Information plays an important role here as well; information being power, paratransit operators and associations have strong incentives to conceal information to tip the balance of power in their favour vis-à-vis regulators and competitors. A landscape of “hidden information” emerges. Recent ICT-related advances, however, seem poised to change this landscape: relatively easy-to-use, standardised formats for codifying PTI (such as routes, stops, frequencies), exemplified by GTFS (Eros et al., 2014); and increasingly cheap and powerful mobile devices, epitomised by the so-called smartphone, giving spatiotemporal sensing, communication, and computing power to an increasing number of urban residents (Zegras, et al., 2015).

6
Table 1 Characteristics of Public Transportation Information. Data type Producer Means of collection Means of storage Consumer Means of delivery Use Vehicle type, number, and capacity
Owners, concession holders, operating agency
Purchasing records, physical observation, crowdsourcing
Physical records, digital databases
Government regulator
Digital or physical exchange
Service analysis, evaluation, & regulation
Route User, vehicle operators, transit operating agency
Individual experience, direct observation, location-sensing equipment, crowdsourcing
Personal memory, physical maps, spatial records (e.g. GIS), digital databases or feeds, hard-copy records
Users, operating agencies, regulators, developers
Personal communication, digital exchange, websites, physical maps and signage, web-based apps, mobile phones
Trip planning & navigation, system monitoring & analysis, operations planning, regulation
Schedule Operating agency, regulator
Not applicable. Schedules are set, not collected
Digital or physical records, data feeds
Users, operating agencies, vehicle operators, regulators
Physical schedules and signage, websites, web apps, digital exchange
Trip planning & navigation, operations management & planning
Travel time Users, vehicle operators, operating agency
Personal experience, location-sensing equipment, crowdsourcing
Personal memory, physical records, digital databases
Users, operating agencies, regulators
Personal communication, printed schedules, web-based apps, digital exchange
Trip planning, system analysis, operations planning
Frequency Operating agencies, vehicle operators, users
Direct observation (vehicle counts), location-sensing equipment, crowdsourcing
Physical records, digital records, personal memory
Operating agencies, regulators, users (self or others)
Physical or digital exchange, internet devices, personal communications
System analysis, operations planning, regulation, trip planning
7
Data type Producer Means of collection Means of storage Consumer Means of delivery Use Speed Users, vehicle
operators, operating agencies
Direct observation, AVL/GPS equipment, crowdsourcing
Personal memory, digital databases
Users, operating agencies, regulators
Personal communication, digital exchange
Trip planning, operations planning, law enforcement
Reliability User, operating agency, regulators
Direct observation, AVL/GPS equipment, crowdsourcing
Personal memory, digital databases
Users, operating agencies, regulators
Personal communication, digital exchange
Trip planning, operations planning, service evaluation
Current conditions and service updates
Users, vehicle operators, regulators and other actors
Direct observation, AVL/GPS equipment, planned system disruptions
Digital records, data feeds, social media, personal memory
Users, vehicle operators, operating agencies
Personal communication, physical or digital signage, digital exchange
Trip planning & navigation, operations management & planning

8
PTI Digitalisation (PTID) as Disruptive Innovation? “Disruptive innovation” (Bower and Christensen, 1995; Christensen and Raynor,
2003) refers to a form of technology, or organisational or service model, that adds new value to an existing market and, in doing so, displaces incumbent firms or models. The theory’s roots lie in the seminal work of Schumpeter, particularly his early work focusing on entrepreneurial innovation, capitalising on discontinuous opportunities, and combining new products, production methods, new markets, and/or restructuring of economic sectors (Utterback and Acee, 2005). While disruptive innovation represents the norm in private sector product development and service provision (e.g., digital cameras), public sector examples – particularly those relating to organisational structures – are rarer. For transportation, Andersen (2103) classifies disruptive innovation into three categories: (1) challenges to conventional travel modes (e.g. bus rapid transit (BRT) as an alternative to rail), (2) changes in communications technologies that undercut conventional notions of time or transportation’s value proposition (e.g. social media and online retail’s travel demand impacts), and (3) technologies that undercut the traditional urban transportation planning “business model.” The first two categories concern technologies that change transportation supply or demand, respectively; the third relates to organisational structures. Considering the latter, in monopolistic public transportation industries, paratransit itself could be considered a disruptive innovation, “provoking existing institutions and groupings into providing and improving more of these service types” (Rimmer, 1980; 939). In places of highly atomised stasis, BRT implementation may also be a disruptive innovation, physically changing the streetscape, road space allocation, operating models, and industry structure (Flores, 2013).
What about digitalised PTI? The explicit role of information seems ignored in most paratransit “reform” discussions (see Schalekamp and Behrens, 2010 on South Africa and Cervero (1991) on Southeast Asia). Yet, digital information already seems to be disrupting monopolistic urban transportation systems, evidenced by the emergence of companies like Uber, globally; data-driven paratransit like Bridj bus, in the USA; and GrabTaxi, in Southeast Asia. These services are evidence of “datafication,” creating new services by decoupling data from associated physical objects (Mulligan, 2014). In paratransit in the Global South, where hidden information predominates, digitalisation alone may be disruptive, by generating new information and making it widely available. Objectives and Approach
The following sections explore, using the Mexico City case, how digitalised PTI might create value and change stakeholder relationships in a paratransit-dominated system. Using a 2013 PTI data collection project (Eros et al, 2014), we speculate on the ways and extent to which new information may cause disruptive innovation, and implications for users, regulators, and operators. The speculation is informed by data collected during fieldwork and follow-up efforts. Rather than formal hypothesis-testing, the approach aims to formalise the understanding of possible pathways of effects. EMPIRICAL CONTEXT
Mexico City (the Federal District or DF) epitomises the challenges of a place with a large paratransit presence operating at a somewhat stalled point in the regulatory cycle. With 8.9 million people, the DF forms part of a larger metropolitan area (MCMA) of

9
over 22 million across more than 40 jurisdictions. Over the past century, the DF’s public transportation service has run through several regulatory cycles to the current point of a mix of atomised stasis, dominated by privately owned paratransit microbuses (aka colectivos) (Flores, 2013). Public transport in the MCMA includes (motorised 2007 mode shares, Guerra, 2013): trolleybus, BRT, light rail, commuter rail (2%, combined); metro (14%); microbuses (46%); and fixed-route, mixed-traffic buses (1%). Since 1975, public transport in the DF has fallen under the transportation secretariat’s (SETRAVI) oversight, either as operator (e.g., trolleybuses) or regulator (e.g., microbuses).
As generalised above, the DF’s microbuses – over 22,000 owners organised in over 100 associations – provide benefits and drawbacks, with an organisational structure which impairs regulation and planning by SETRAVI and its sub-office for microbus oversight, the Direccion General de Transporte (DGT). The DGT spends considerable time ad hoc negotiating and enforcing regulations and mediating conflicts among microbus organisations and between microbuses and other transit modes, at the cost of system planning (Flores, 2013). The associations wield their accumulated political power in myriad ways: blocking competitors’ routes, threatening to cut off main arteries if they are fined for stopping at undesignated points, committing fraud in vehicle sales and registrations, and generally leveraging power for financial gain (Wirth, 1997).
The DF’s introduction of BRT in 2005, augured a strengthening of the state’s role in road-based public transport. Metrobús is both the name given to the BRT service as well as the authority charged with planning and regulating the private companies providing the BRT services (SETRAVI legally grants the operating concessions). Flores (2013) presents some evidence of increasing regulatory capability and muscle as additional BRT corridors have been introduced, although protracted and expensive negotiations with impacted microbus route associations, lasting upwards of one year, preceded BRT implementation on each corridor. Beyond Metrobús, SETRAVI/DGT have introduced numerous “low emissions” corridors, on which microbuseros have been “transitioned” into more formalised organisations with the goal of introducing higher-capacity vehicles and decoupling driver remuneration from fares.
Overall, despite some progress, SETRAVI remains hindered by its relatively low regulatory capacity, keeping its microbus services in an atomised stasis and others (e.g., Metro) in monopolised stasis. Might digitalised PTI change the dynamics?
PTI DIGITALIZATION AND POTENTIAL DISRUPTIONS
In 2013, SETRAVI launched a PTID project, resulting in the DF’s first GTFS feed, released to the general public and app developers in autumn 2013. The feed contains route, stop, and estimated frequencies and trip times for each of the DF’s six transit modes (Eros, et al., 2014). While representing a significant step forward, the GTFS feed currently only includes static information since real-time positioning was not available for most transit modes; microbus route frequencies are also absent. Moreover, SETRAVI’s publically available feed currently excludes microbuses. Several possible motivations could explain this. The feed could: reflect poorly upon the agency if it is incomplete or inaccurate; reflect poorly on public services if it highlights the relative lack of high-capacity services serving much of the city, or make microbus services look more attractive, countering SETRAVI’s interest in consolidating and restructuring microbuses into higher-capacity modes.
10
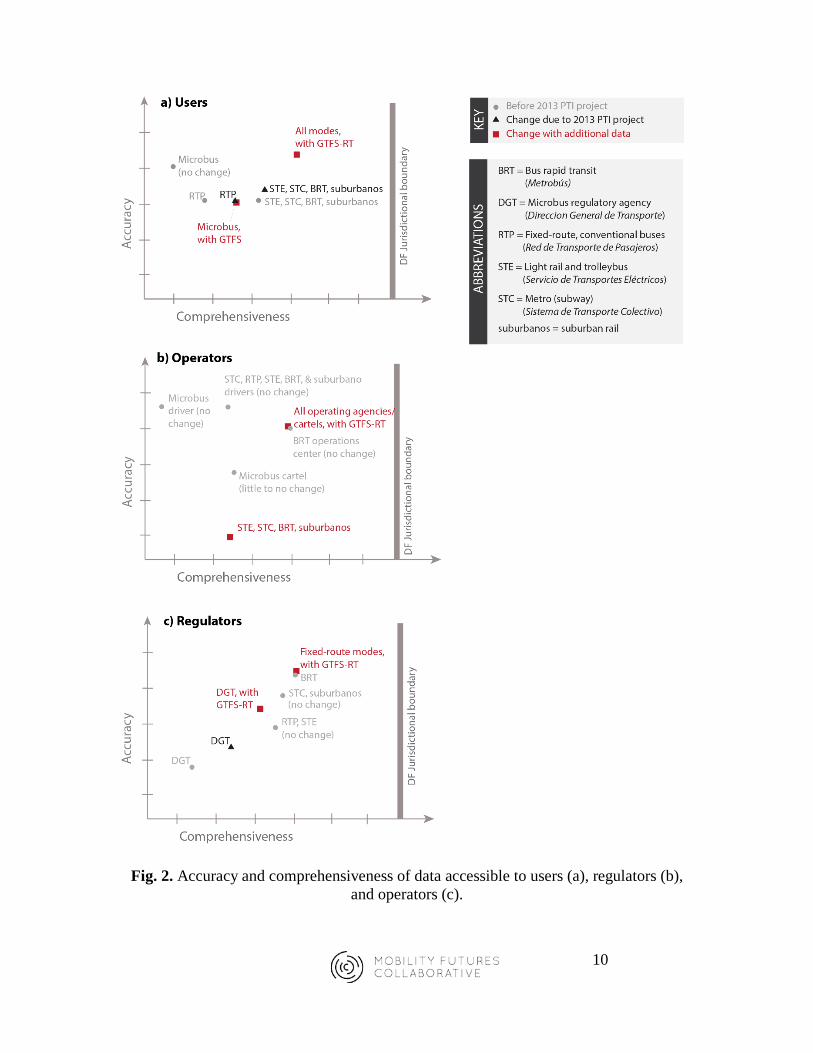
Fig. 2. Accuracy and comprehensiveness of data accessible to users (a), regulators (b), and operators (c).
11
While limited, SETRAVI’s efforts increased the quality and quantity of data available to different stakeholders. Figure 2 visualises these changes for each stakeholder group (users, operators, and regulators) by situating transit modes along a continuum of data accuracy (i.e. correctness of the information) and data comprehensiveness (i.e. completeness and precision of the data). The x-axis represents comprehensiveness, from very basic knowledge about a minority of routes, to knowledge about all routes, to knowledge about all routes and their frequencies or other aspects, to real-time knowledge of fleet patterns and locations. This axis hits a literal political limit, due to the lack of service integration beyond the DF’s boundaries. On the y-axis, accuracy moves from very low to very high. The graphs show modes’ relative position on these axes before the 2013 PTI project (grey), after the project (black), and with hypothetical future steps including the microbuses (red). A major shift on this graph could indicate potential for disruptive innovation, since higher data quality can increase the value of existing transportation services for different users. The following sub-sections discuss each stakeholder category, analysing respective potential changes, and evaluating the type and degree of potential disruption.
Transportation users
Public transportation accounts for over two thirds of all motorised trips in the MCMA. Socioeconomics naturally play a role. Lower-income populations rely more heavily on the Metro and microbuses; Crôtte et al (2009) suggest that the Metro may be perceived as a normal good among lower income groups but an inferior good among the wealthier; microbuses appear to be an inferior good, while anecdotal evidence suggests that wealthier individuals favour the Metrobús.
Before the GTFS release, fixed-route users (e.g. Metro) already had access to information about these modes in the form of posted system maps, online map and route information, and smartphone applications directing users to the nearest transit station. Data accuracy and comprehensiveness were therefore fairly high. Users had little codified information about microbuses, however, generally relying on informal sources (e.g. personal experience, word-of-mouth). While the accuracy of such information may be high, especially in the spatial dimension, comprehensiveness is likely low, covering a limited area of the city.
GTFS release may raise data accuracy and accessibility slightly, but would not produce a major shift for the majority of transit users. Without including microbuses, the release of already-available information in a more convenient format for developers adds limited value to transportation services and is unlikely to disrupt current dynamics.
Including microbus data in the publically available GTFS feed would increase the comprehensiveness of transit information available to users (see Fig. 2) and enable independent mapping and app development that could provide route and stop information for all DF microbus routes, facilitating trip planning and implementation and expanding knowledge of the DF’s microbus-accessible areas. This would potentiate Andersen’s second form of disruptive innovation in public transportation: changing its value proposition by enhancing accessibility quantity and quality, without altering actual operations. The nature of the data collected – representing a relative snapshot of a system of somewhat unknown dynamism – means that the microbus GTFS feed would have some inaccuracy, incompleteness, and out datedness and, in digital form, remain

12
inaccessible for users without internet-capable devices. Finally, even a completely accurate and comprehensive GTFS feed for the DF’s microbuses would ignore many travellers’ needs by omitting transit data in the greater MCMA.
The 2013 release represents no change for microbus users and a small improvement for fixed-route users (Fig. 2a). Larger increases in data accuracy and comprehensiveness would come from a complete, open GTFS feed, or from a new intervention: developing a live-tracking system to release real-time microbus data. With such data, SETRAVI could generate accurate, up-to-date frequency, trip time, and locational information for microbuses, providing two key outputs for users: comprehensive routing/trip planning, and next-bus arrival times. The impact of the latter could be useful during periods of infrequent service or in areas in which personal safety is a concern, although individuals’ communication media access may limit impacts. Overall, real-time location data could add additional (though limited) value to the microbus data that SETRAVI has already collected, increasing its disruptive potential with respect to users.
Transportation regulators
The DF government includes sub-offices responsible for each of its publicly operated or closely regulated transit services, including BRT, Metro, light rail, and fixed-route buses. Because these sub-offices already possessed the data necessary to create a GTFS feed, the accuracy and comprehensiveness of data available to regulators did not change for these modes, thus having no disruptive potential. This section therefore focuses on the microbuses.
DGT possesses scant information about the microbus services that carry the majority share of public transport passengers. The 2013 open data project therefore offers a significant improvement in data accuracy and comprehensiveness (Fig. 2b). Data availability could raise DGT’s regulation and planning capacities, both of which add value to the “business model of transportation planning” that Andersen (2013) describes as his third form of disruptive innovation.
Regarding regulation, DGT would benefit from any information enhancing its position vis-à-vis the microbus route associations. Data from the 2013 PTID increases the accuracy and comprehensiveness of DGT’s transportation information (Fig. 2b), which may assist in enforcing route concessions. The information currently collected limits this potential, however; a regulator would still need to observe on-street operations and, presuming GTFS feed accuracy, use the vehicle’s displayed route number to validate route compliance. Maximum effectiveness would require DGT access to trip frequencies, vehicle counts, and travel times. Gaining this information would require live-tracking to generate a GTFS-RT feed. While the current data have some disruptive potential, information would have a much greater capacity to improve regulatory capacity if it included aspects that could be generated from real-time location sensors.
The GTFS data, as a whole, have yet to play a significant role in SETRAVI’s internal data management and analysis, but SETRAVI has been exploring potential planning applications, such as Open Trip Planner Analyst (OTPA), a tool using GTFS to visualise transport network coverage and time-based accessibility within a city. This tool can be used to inform planners, but faces limitations in the DF case. Travel time is central to OTPA’s functionality; the tool displays locations an individual can reach in a given amount of time. The microbus trip times in the DF’s current GTFS feed may be

13
unreliable, however, because individual routes were tracked only once, frequencies are estimates, and the data may require frequent updating. Moreover, OTPA itself does not consider vehicle capacity – a key accessibility limitation in Mexico City’s crowded systems. Instituting a live-tracking system and developing a GTFS-RT feed could reduce these limitations.
The 2013 microbus data could also facilitate longer-term planning for BRT expansion. The increased accuracy of data on microbus routes could help DGT quickly determine the route location and number of microbus operators affected by proposed Metrobús expansions. It could then determine appropriate compensation and devise a route relocation strategy for affected operators, expediting negotiations, saving costs, and accelerating implementation. This would add substantial value to SETRAVI’s transportation service provision model.
Overall, the 2013 GTFS feed enables SETRAVI to visualise and analyse its transportation network, facilitating more comprehensive planning. It can also reduce time and cost barriers for Metrobús expansion. These outcomes qualify as Andersen’s third form of disruptive innovation. While the static GTFS feed enables both to some extent, GTFS-RT data would enable larger impacts. Transportation operators
“Operators” include various stakeholders with different interests and agency: microbus owner-operators, microbus operators who do not own their vehicles, small-scale microbus owners with a more vested interest, larger-scale fleet owners, and route association leadership. Again, since the PTID does not affect data available to fixed-route operators, this section considers open data concerns and impacts that could affect various microbus stakeholders, positively and negatively.
The 2013 PTI project has not altered the accuracy or comprehensiveness of data available to operators (Fig. 2c); changes would be insignificant even if SETRAVI released the microbus data. Route association leadership typically holds detailed information about their routes, stops, and frequencies. A static GTFS may increase their information regarding other routes, but probably would not confer benefits to the association since routes are fixed to a relative geography. In contrast, by increasing SETRAVI’s information access, the route association may lose negotiating power. Route information might enable SETRAVI to more easily modify/overhaul route structures or to increase enforcement of existing concessions. These outcomes all imply an organisational disruption, incurring some degree of loss for the route associations.
Operators’ losses would be exacerbated by a GTFS-RT feed (Fig. 2c). While operators’ data accuracy and availability would increase, SETRAVI would likely gain more, enhancing its ability to negotiate compensation for displaced microbus routes and perhaps enabling identification of corridors that would benefit from higher capacity services, like Metrobús.
Conversely, real-time microbus information would confer certain benefits to microbus leadership. Semi-structured interviews with 16 DF microbus operators indicated that GTFS-RT information would enable route associations and owners to better track their vehicles, ensure driver compliance with routes and stops, and perhaps prompt passengers to choose one service over another – increasing profits for data-oriented route associations. Microbus owners were particularly enthusiastic about vehicle

14
location information, to help mitigate vehicle theft risk and identify bus drivers who inappropriately use vehicles. Real-time location data can apparently improve the organizational model of transit service delivery and increase transit service value in a manner that causes disruption in favour of certain microbus operator types.
Real-time microbus location data could also improve dispatch services, one of a route association’s most critical operations. Associations conduct dispatch in an informal manner, often hiring youth to stand on street corners with radios, timing and counting the buses, and informing drivers when to begin their route or increase headways. Route association officials suggested that live data would enable agency staff to replace labour with technology to better coordinate the fleet movements and to generate data for planning. These improvements could reduce traffic congestion, representing a positive disruption for the organisational model of transportation service delivery.
As the organisational models of transportation change, disruption could hurt certain members of the microbus industry. While route associations and bus owners stand to benefit, drivers would likely lose with lower information opacity. Drivers receive earnings as a share of the fares they collect, creating incentive to overload vehicles and pocket fares. Better information could improve route associations’ and owners’ regulation of drivers, likely reducing drivers’ earnings.
Bus drivers also stand to lose the most from Metrobús expansion and franchising agreements. When Metrobús adds or expands a BRT line, it generally relocates route concessions to a new area, likely less desirable to operators. Route associations receive compensation for affected routes, but these payments may not trickle down to drivers. In theory, displaced microbus drivers could seek employment with Metrobús, but lost jobs would likely outnumber new positions. Furthermore, interviewees indicated that bus operators prefer the microbus system because of its opportunities for advancement, daily remuneration, and greater independence. While formalisation may curtail this independence, drivers may gain in the long term from better working conditions and benefits.
Bus drivers’ potential losses from formalisation suggest they might resist information availability. In the past, microbus owners on different routes installed passenger-counting devices on their vehicles to ensure that drivers were reporting all fares. Drivers immediately tampered with the devices to prevent proper functioning. Similar reactions could prevent the creation of a GTFS-RT feed, unless this were done through surreptitious crowdsourcing. Low smartphone penetration rates currently restrict this possibility, however. Generating real-time information would thus require support from bus operators, since location-sensing equipment would need to be placed in the vehicles and allowed to operate without interference. The feasibility of location sensing therefore depends upon driver perceptions.
When asked about real-time data collection possibilities, leaders and drivers of non-formalised routes expressed suspicion about how the data would be used. Lack of trust in the government was a recurring refrain. Key themes centred upon corruption, opacity, and lack of accountability. Nevertheless, drivers declared that they may be willing to share location information with SETRAVI if it generated financial benefits. Bus operators explained that better information services could increase riders’ satisfaction with the service; accurate frequency and text-messaged arrival times would be useful for users on the outskirts of the DF during times when frequencies are lower, and within the

15
city centre during peak hours when travel times are highest. Expectations for higher ridership may motivate these drivers to allow vehicle tracking.
Overall, the current, static GTFS feed (whether or not it is released) promises little to no impact on microbus operations, while perhaps slightly increasing SETRAVI’s power with respect to microbus associations. A real-time location service appears to offer a larger net gain to route associations and bus owners. Bus drivers may oppose and perhaps prevent its functioning, however, unless they felt that increased information would ultimately increase their earnings.
PATHS FORWARD
Three paths forward seem likely in Mexico City, with respect to PTID: (1) no additional intervention, (2) government intervention for data collection, and (3) data collection as part of incremental formalisation. Table 2 summarises the impacts and implementation barriers under each scenario.
Table 2 PTID in Mexico City: Speculative stakeholder impacts and implementation barriers.
Scenario 1: No additional intervention
Stakeholder Impact Degree Implementation Barriers
Regulators + Minor N/A Route associations – Minor N/A Microbus owners – Minor N/A Microbus drivers – Negligible N/A Users + Minor N/A
Scenario 2: Government intervention for data collection
Stakeholder Impact Degree Implementation Barriers
Regulators + Major Cost, driver compliance Route associations + Major Driver compliance Microbus owners +/– Moderate Driver compliance Microbus drivers +/– Moderate N/A Users + Moderate N/A
Scenario 3: Data collection as part of incremental formalisation
Stakeholder Impact Degree Implementation Barriers
Regulators + Major Time required to franchise routes throughout the city
Route associations + Major Additional vehicle costs Bus operators None N/A N/A Users + Variable N/A
N/A: not applicable

16
Scenario 1: No additional intervention From the 2013 PTID project, SETRAVI gains improved microbuses route
information that could improve planning/enforcement capacity, enhance government information provision to citizens, and enhance SETRAVI’s position during microbus displacement negotiations. Route associations may lose some degree of power from increased information transparency, but impacts would be mild because the static GTFS offers limited insight into microbus operations. Users experience insignificant direct impacts since the GTFS feed is not available to them, does not include real-time information, and does not include the broader MCMA. Indirectly, users would benefit from any service improvements induced by SETRAVI’s enhanced planning and regulatory powers. As discussed, these dynamics create some possibilities for disruptive innovation. However, if SETRAVI intervenes no further, the GTFS feed will have relatively minor impacts on transportation dynamics in Mexico City and would not noticeably disrupt transportation supply (Table 2). This scenario seems moderately likely since it requires no explicit action by SETRAVI or other stakeholders.
Scenario 2: Government intervention for data collection
As discussed, SETRAVI and the route associations could significantly benefit from a GTFS-RT feed, but creating a real-time dataset would require costly and challenging inputs. Equipping over 22,000 microbuses with location-sensing devices would likely be prohibitively expensive for SETRAVI or the route associations, however, and the approval or acquiescence of bus drivers could be difficult to achieve.
Under current dynamics, bus drivers’ distrust towards the government may create scepticism regarding data collection efforts and prompt drivers to tamper with the devices. Interviews indicate that drivers could be persuaded to support data collection efforts if they believed that resulting information would increase public transit ridership and, ultimately, driver incomes. In the long-term, however, SETRAVI may wish to decouple driver remuneration from passenger fares to prevent on-street fare competition and decrease congestions. This could remove drivers’ main motivation for permitting location sensors.
This scenario results in a substantial disruptive innovation with respect to the ways in which transportation is regulated, planned, and supervised. It also causes some disruptive innovation by increasing the value of existing transit services for users (Table 2). Ultimately, however, the expense of data collection equipment and risks of driver interference may make a top-down intervention too risky for SETRAVI. This scenario is therefore unlikely. Scenario 3: Data collection as part of incremental reform
SETRAVI’s move towards incremental microbus reform may present an ideal opportunity to launch a real-time data collection effort. When microbus routes become franchises, they typically purchase new, larger vehicles. These vehicles could be equipped with location-sensors at relatively low additional costs, precluding the logistical difficulties of retrofitting existing vehicles.
The labour dynamics of a franchise system would be much more conducive to data collection. Because wages are decoupled from fares, drivers face lower incentives to

17
underreport fares, deviate from fixed routes, interfere with regulatory processes, and tamper with on-board equipment.
Under this scenario (Table 2), a GTFS-RT feed would increase SETRAVI’s institutional capacity to plan and regulate transit, as well as route associations’ ability to conduct monitoring and dispatching for their routes. These represent a planning and service delivery form of disruptive innovation. Bus drivers, having already undergone the franchising process, would neither gain nor lose from data collection efforts. Moreover, users may benefit from additional bus information.
Overall, this scenario seems feasible for SETRAVI to undertake (particularly since the 2013 GTFS data could speed the franchising process) and would confer benefits to regulators, users, and route associations without stirring significant resistance from microbus drivers. Thus, Scenario 3 suggests that state capacity to regulate is necessary before the information revolution spurs disruptive innovation; by exercising its regulatory capacity and strength, a transportation agency can allow a particular technology to become effective. CONCLUSIONS
Paratransit’s dynamic nature in the global south makes information difficult to standardise and easy to hide. Poor information transparency enables informality which only further increases information opacity. Recent ICT-related developments may fundamentally change these conditions, enabling the digitalisation of public transportation information and its widespread dissemination. These developments, epitomised by the smartphone and GTFS, stand the chance to reform paratransit-dominated public transport systems, long trapped in an atomised stasis.
Using the recent development and release of a GTFS feed in Mexico City, this paper explored the possibilities that this digitalised public transport information might spark a disruptive innovation. Two types of disruptive innovation can occur: that which changes the value proposition of transportation and increases the utility of existing services; and that which alters the organisational model of transportation planning and service delivery. Our findings, albeit speculative, suggest that the current, static GTFS feed may have some effects on government capacity and operations but will not significantly impact operators or users, and will not likely produce a substantial disruption to transportation supply or demand. A top-down or bottom-up data collection initiative could enable real-time data collection to take place on the microbuses, greatly increasing the potential impacts amongst all stakeholder groups, and increasing the disruptive power of data. High costs and risks of driver intervention make a government-sponsored initiative unlikely, however, and a crowdsourced approach would require much higher smartphone penetration rates among the population and the right incentives to actively participate. The disruptive potential of a successful intervention is very high, but the likelihood of success is quite low.
Disruptive innovation may still occur if, for example, SETRAVI integrates a data collection initiative as part of its franchising process. In this way, institutional reforms undertaken by SETRAVI could activate information in a manner that enables disruptive innovation, potentially breaking the city out of its current atomised stasis and spurring improved public transportation service provision. Even under these conditions, outcomes face certain limitations. Institutional barriers prevent data-driven innovation from causing

18
disruption beyond the DF’s jurisdictional boundary, where more than half the metropolis’ residents reside. Without institutional coordination, even real-time data can have only limited impacts on public transportation in the broader metropolitan area. Impacts on the publicly owned and operated systems (e.g. Metro) also are unclear.
This article is necessarily speculative. The data collection initiative described in this study represents one of only a handful of very recent efforts in the world. Sufficient time has not passed to observe the effects of these projects. Nonetheless, as more metropolitan areas accumulate experiences with PTI digitalisation, more evidence will emerge to allow the institutional and regulatory effects to be understood. Finally, this case has examined digitalisation and its impacts in the paratransit services common in the Global South. Similar movements are under way in the Global North, where data-enabled paratransit may also disrupt systems, like those in the USA, caught in a monopolised stasis. The disruptive potential of public transportation digitalisation and datafication remains large.
REFERENCES ANDERSEN, D. (2013), ‘Disruptive innovation and the future of transportation in America,’ Smart Growth Network: National Conversation on the Future of Our Communities: Compendium, 1–5. BOWER, J., and CHRISTENSEN, C. (1995), ‘Disruptive Technologies: Catching the Wave,’ Harvard Business Review, 73 (1), 43–53. BUNNELL, T. and HARRIS, T. (2012), ‘Re-viewing informality: perspectives from urban Asia,’ International Development Planning Review, 34 (4), 339-347. CERVERO, R. (1991), ‘Paratransit in Southeast Asia: A Market Response to Poor Roads?’ Review of Urban and Regional Development Studies, 3, 3-27. CERVERO, R., and GOLUB, A. (2007), ‘Informal Transport: A Global Perspective,’ Transport Policy, 14 (6), 445–457. CHRISTENSEN, C. and RAYNOR, M. (2003), The Innovator’s Solution: Creating and Sustaining Successful Growth, Boston, Harvard Business Press. CRÔTTE, A., NOLAND, R., GRAHAM, D. (2009), ‘Is the Mexico City Metro an Inferior Good?’ Transport Policy, 16 (1), 40–45. DIERWECHTER, Y. (2002), ‘Six cities of the informal sector – and beyond,’ International Development Planning Review, 24 (1), 21-40. EROS, E., MEHNDIRATTA, S., ZEGRAS, C., WEBB, K., OCHOA, M.C. (2014), ‘Applying the General Transit Feed Specification (GTFS) in the global south: Experiences in Mexico City and beyond’, Transportation Research Record, 2442, 44–52.

19
FERNÁNDEZ, D. (1994), ‘The modernization of Santiago's public transport: 1990–1992,’ Transport Reviews, 14 (2), 167-185. FLORES, O. (2013), Expanding transportation planning capacity in cities of the global south: Public-private collaboration and conflict in Chile and Mexico. PhD Dissertation, Cambridge (MA), Massachusetts Institute of Technology. GÓMEZ-IBÁÑEZ, J.A. and MEYER, J.R. (1993), Going Private: The International Experience with Transport Privatization, Washington, DC, Brookings. GUERRA, E. (2013), The New Suburbs: Evolving travel behavior, the built environment, and subway investments in Mexico City. PhD Dissertation, Berkeley, University of California. GWILLIAM, K. (2008), ‘Bus transport: Is there a regulatory cycle?’ Transportation Research Part A, 42 (9), 1183-1194. HARRISS-WHITE, B. ‘Work and Wellbeing in Informal Economies: The Regulative Roles of Institutions of Identity and the State,’ World Development, 38 (2), 170-183. MALONEY, W. (2004), ‘Informality Revisited,’ World Development, 32 (7), 1159–1178. MEAD, D. and MORRISSON, C. (1996), ‘The Informal Sector Elephant,’ World Development, 24 (10), 1611-1619. Mulligan, C.E.A. (2014), ‘The Impact of Datafication on Strategic Landscapes,’ Stockholm, Ericsson. PEATTIE, L. (1987), ‘An Idea in Good Currency and How it Grew: The Informal Sector,’ World Development, 15 (7), pp. 851-860. RAKOWSKI, C. (1994), ‘Convergence and divergence in the informal sector debate: A focus on Latin America, 1984–92,’ World Development, 22 (4), 501-516. RIMMER, P.J. (1980), ‘Paratransit: a commentary,’ Environment and Planning A, 12, 937-944. SCHALEKAMP, H. and BEHRENS, R. (2010), ‘Engaging paratransit on public transport reform initiatives in South Africa: A critique of policy and an investigation of appropriate engagement approaches,’ Research in Transportation Economics, 29, 371-378. SILCOCK, D. (1981), ‘Urban paratransit in the developing world,’ Transport Reviews, 1 (2), 151-168.

20
SILCOCK, D. (1986), ‘Bus or paratransit?: the issues involved,’ Transportation Planning and Technology, 10 (4), 305-322. UTTERBACK, J. and ACEE, H. (2005), ‘Disruptive Technologies: An Expanded View,’ International Journal of Innovation Management, 9 (1), 1-17. UZZELL, D. (1987), ‘A Homegrown Mass Transit System in Lima, Peru: A Case of Generative Planning,’ City & Society, 1 (1), 6–34. WIRTH, C. J. (1997), ‘Transportation Policy in Mexico City: The Politics and Impacts of Privatization,’ Urban Affairs Review, 33 (2), 155–181. WOOLF, S.E. and JOUBERT, J.W. (2013), ‘A people-centred view on paratransit in South Africa,’ Cities, 35, pp. 284-293. ZEGRAS, P.C., EROS, E., BUTTS, K., RESOR, E., KENNEDY, S., CHING, A., MAMUN, M. (2015), ‘Tracing a Path to Knowledge? Indicative User Impacts of Introducing a Public Transport Map in Dhaka, Bangladesh’, Cambridge Journal of Regions, Economy and Society, 8 (1), 113–129.