direct integration of reverse engineering and rapid prototyping
TRANSCRIPT

Direct integration of reverse engineering and rapidprototyping
Kwan H. Lee*, H. Woo
Department of Mechatronics, Kwangju Institute of Science and Technology (K-JIST), 1 Oryong-dong, Puk-gu,
Kwangju, 500-712, South Korea
Abstract
Reverse engineering (RE) technology enables us to create CAD models of new or existing products bycapturing surface data. Rapid prototyping (RP) is another emerging technology that allows us topromptly fabricate the physical prototype of a new product using a layered manufacturing technique. Inthis research, a new method that creates a direct link between these two technologies, is proposed. InRE, an enormous amount of point data is gathered during data acquisition. This leads to a huge ®le sizethat requires a large execution time. Surface modeling using these point data is time-consuming andrequires expert modeling skills. Some researchers suggested creating an STL ®le directly from the pointcloud data to avoid surface modeling tasks. The STL ®le, however, has many drawbacks. In thisresearch, algorithms that greatly reduce point cloud data are developed, and thereby, the data ®le sizesare decreased considerably. The e�ciency of the algorithms is demonstrated by comparing them withexisting ones. 7 2000 Elsevier Science Ltd. All rights reserved.
Keywords: Rapid prototyping; Reverse engineering; Point cloud data reduction; STL ®le; Rapid productdevelopment
1. Introduction
As product varieties increase and life cycles shorten, the need to reduce product developmenttime becomes more critical to maintain competitiveness in the market. The reduction of
Computers & Industrial Engineering 38 (2000) 21±38
0360-8352/00/$ - see front matter 7 2000 Elsevier Science Ltd. All rights reserved.PII: S0360-8352(00)00017-6
www.elsevier.com/locate/dsw
* Corresponding author. Tel.: +82-62-970-2386; fax: +82-62-970-2384.E-mail address: [email protected] (K.H. Lee).

product development time, therefore, requires revolutionary improvements rather than gradualchanges in technology. Both reverse engineering (RE) and rapid prototyping (RP) are emergingtechnologies that can play a promising role in reducing the product development time.RE refers to the process of creating engineering design data from existing parts [1±3]. It
recreates or clones an existing part by acquiring the surface data of an existing part using ascanning or measurement device. It is useful in recreating the CAD model of an existing partwhen the engineering design is lost or when the model has gone through many design changes.It enables us to capture the surfaces of design models that are otherwise impossible todetermine. It also saves us from performing tedious manual dimensioning and tracing work.When a designer creates a new design using a mock-up, it is necessary to construct the CADmodel of the mock-up for further use of the design data in analysis and manufacturing. Themanual operation involved in RE requires a great amount of time and operator skills and isalso subject to error. Coordinate measuring machines have been used to extract surface databut their data capturing operation is very slow for parts having complex free-form surfaces. Inrecent years, the laser scanning technology has improved signi®cantly, and it has become apowerful tool in capturing the geometry of complicated design models.Surface modeling in the RE process, however, is a challenging task. It takes a signi®cant
amount of time and skill to generate an accurate surface model from the point cloud data.This step is usually not automated and involves frequent manual interaction with the user evenwith a well-developed surface modeling software package [4,5].The CAD model developed by an RE process can be converted to the physical prototype
using an RP technique. Generally, in RP, physical parts are fabricated layer by layer. It usesadditive manufacturing processes, which do not require any tools or set-ups compared to thesubtractive techniques used in the traditional machining operation. It allows us to fabricatefeatures that are di�cult or impossible to fabricate by machining operation. Di�erentfabrication methods exist for RP, but nearly all use the same geometry input format, calledSTL (Stereo Lithography), which consists of a list of triangular facet data. The STL formathas advantages due to its simple structure and ease of use, but it also has serious drawbacks. Itrequires a large amount of memory as the accuracy of a part increases and also takes asigni®cant amount of repair time when it has ¯aws such as gaps, overlaps, and mixed normalvectors. In order to bridge RP and RE technologies, e�cient point cloud handling methodshave to be developed ®rst. Second, an accurate geometry input format for RP machines needsto be prepared. This paper proposes a procedure that allows fabricating RP parts directly fromreverse engineered geometric data. With the procedure, algorithms that reduce the size of pointcloud are developed.
2. Related work
Though both RE and RP are emerging technologies that have been well developed, littleresearch has been done in integrating the two. The research activities described below deal withinterfacing RE data to RP.Hosni, et al. [6] developed a laser based system for capturing the geometric details of the
object and tried to apply the captured data to RP using the STL format. Their research,
K.H. Lee, H. Woo / Computers & Industrial Engineering 38 (2000) 21±3822

however, was focused on developing an experimental scanning system for RE. Schoene andHo�mann [7] used a triangulation method to generate the STL ®le directly from the scanneddata using a 5-axis digitizer. Their objective was to develop an algorithm that can processpoint cloud data with undercuts and to handle unordered set of points. Vail et al. [8]investigated the issues related to interfacing the point cloud data directly to manufacturingprocesses, especially, RP. They used a modi®ed Delauney triangulation algorithm combinedwith the marching cube algorithm to generate triangular meshes. It required post-processingprocedures such as removing spurious triangles and gaps, harmonizing normal vectors, anddetecting mesh intersections.The shortcomings of the STL format have been discussed by many researchers. Yan and Gu
[9] categorized the common sources of errors in RP and stated that the approximation used inthe STL format as one of the major errors. Other researchers such as Jamieson and Hacker[10] and Qiming and Yungan [11] investigated the pros and cons of using original CAD ®lescompared to using STL ®les. They claimed that the slice data directly generated from theoriginal CAD ®le showed better accuracy. The STL ®les often had problems such as gaps,overlaps, and mixed normals. Many researchers (Makela and Dolenc [12], Rock and Wozny[13] and Bohn and Wozny [14]) discussed STL ®le problems, and currently dozens ofcommercial software packages exist that provide repair routines.In establishing the link between RE and RP, another major challenge is to handle the huge
amount of point data generated by scanning devices. The scanners have become more accurateand the speed of data acquisition has increased signi®cantly. It becomes quite important toreduce the amount of acquired data and to convert it into a format required by manufacturingprocesses while maintaining the accuracy of the data. Fujimoto and Kariya [15] suggested animproved sequential data reduction method for 2D digitized point data. Their methodguaranteed that the error from the reduced data set remained within the given angle anddistance tolerance. Hamann [16] presented a new reduction method for triangulation ®les basedon an iterative triangle removal principle. As a measure of reduction in the ®le size, eachtriangulation is weighted according to the principal curvature estimates at its vertices and theinterior angles. Chen et al. [17] proposed a method that reduced the number of triangles usedin an STL ®le generated from a point cloud. Triangles in planar or near planar regions wereremoved by comparing the normal vectors of corresponding triangles, and re-triangulation wasperformed. They showed the reduction of ®le size using the STL ®le of a human face digitizedby a coordinate measuring machine. Veron and Le eon [18] introduced an approach to reducethe number of points of a polyhedral model using error zones assigned to each point of theinitial polyhedron so that the simpli®ed polyhedron intersects with each error zone. Hamannand Chen [19] proposed a method to reduce point data through various planar curves,compressing 2D images, and visualizing volumes. In their method, points were selected withrespect to local absolute curvature estimates for a piecewise linear curve approximation. Thedegree of reduction was controlled either by the number of points to be selected or by thetolerance. Martin et al. [20] proposed a data reduction method using a uniform grid structurewith a median ®ltering method. In their procedure, point clouds are subdivided and assigned toindividual grids and the median point in each grid is selected to represent the grid.As discussed above, the importance of interfacing RE to RP was raised but the past research
lacked in establishing a framework that provided the direct interfacing of the two technologies.
K.H. Lee, H. Woo / Computers & Industrial Engineering 38 (2000) 21±38 23
3. Interfacing RE to RP
Bridging RE and RP technologies can facilitate the process of new product development. REtechniques focus on extracting the design data, while RP techniques concentrate on verifying orevaluating the design. Both technologies use 3D CAD models. In RE, 3D CAD models arecreated from physical parts, whereas in RP, 3D CAD models are utilized to make physicalparts. Combining these two technologies is ideal since one helps in the design phase and theother in the prototyping phase and both use 3D CAD models. The modes of interface can becritical in terms of e�ciency, as discussed below.
3.1. Interfacing modes between RE and RP
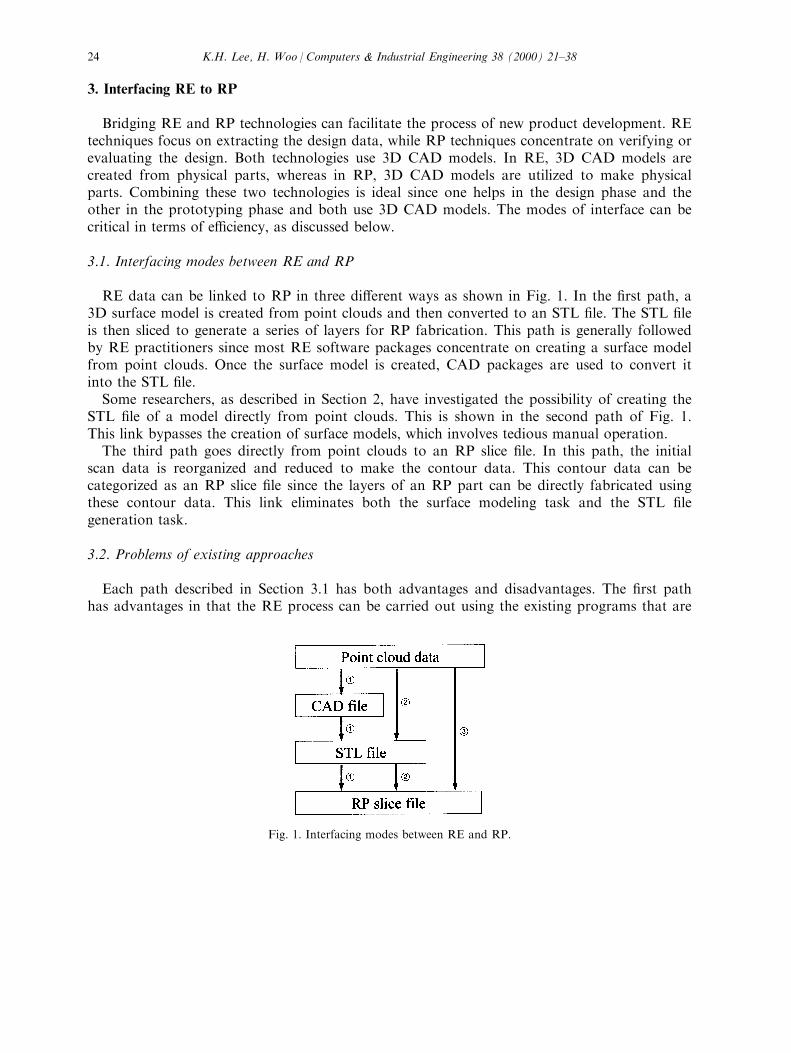
RE data can be linked to RP in three di�erent ways as shown in Fig. 1. In the ®rst path, a3D surface model is created from point clouds and then converted to an STL ®le. The STL ®leis then sliced to generate a series of layers for RP fabrication. This path is generally followedby RE practitioners since most RE software packages concentrate on creating a surface modelfrom point clouds. Once the surface model is created, CAD packages are used to convert itinto the STL ®le.Some researchers, as described in Section 2, have investigated the possibility of creating the
STL ®le of a model directly from point clouds. This is shown in the second path of Fig. 1.This link bypasses the creation of surface models, which involves tedious manual operation.The third path goes directly from point clouds to an RP slice ®le. In this path, the initial
scan data is reorganized and reduced to make the contour data. This contour data can becategorized as an RP slice ®le since the layers of an RP part can be directly fabricated usingthese contour data. This link eliminates both the surface modeling task and the STL ®legeneration task.
3.2. Problems of existing approaches
Each path described in Section 3.1 has both advantages and disadvantages. The ®rst pathhas advantages in that the RE process can be carried out using the existing programs that are
Fig. 1. Interfacing modes between RE and RP.
K.H. Lee, H. Woo / Computers & Industrial Engineering 38 (2000) 21±3824

already available. The surface model created in this path is useful in many design andmanufacturing applications, such as design modi®cation, engineering analysis, and tool pathgeneration. The task of creating surfaces from the point clouds, however, is di�cult and time-consuming even with the help of surface modeling programs.In the RE process, the initial point clouds require preprocessing operations which include the
®ltering of outliers, smoothing and blending of existing points, and registration of point cloudsinto one coordinate system. For surface modeling operation, the preprocessed point cloudsgenerally need to be subdivided into many patches since the entire model cannot beapproximated by a single mathematical surface. Then the boundary curves for each patch arecreated. By increasing the number of control points and the degree of the curves, moreaccurate shapes can be generated. Finally, all surface patches have to be connected to eachother smoothly. The surface modeling task requires a considerable amount of manualoperation and computing time. It is reported that the surface modeling task accounts for 90±95% of the RE time compared to 5±10% of that for the digitizing task [7]. Though highlyskilled operators are required in performing these tasks, the resulting surfaces often are subjectto error and generally show some deviation from the point cloud data. The di�erence betweenthe point cloud data and the created surfaces can be shown using an error map in which theamount of deviation is represented by colored regions.Both the ®rst and the second path in Fig. 1 use the STL format. The STL format is the de
facto industry standard and is being used by most RP vendors. The format is good in terms ofthe ease of use, the compatibility of ®les between di�erent CAD packages, the simplicity of thedata structure, and the e�ciency for viewing and intersecting algorithms. The STL format,however, has many problems. It includes unsorted and unrelated triangles and does not retainany surface or feature data. Three vertices and a normal vector are required to represent eachtriangle but the vertices are redundant in the database. The format does not necessarilyrepresent a complete object either. Some of the problems include having gaps, overlapping oftriangles, and reversed normal vectors. The biggest problem comes from the error caused byapproximating the model using planar triangular patches. Decreasing the size of triangles canreduce the amount of approximation error but this in turn, increases the computing time aswell as the ®le size. Large size triangles, on the other hand, result in unacceptable parts due tothe approximation error.The third path illustrated in Fig. 1 can be a viable option when an RP part has to be
fabricated from RE data. This path facilitates the RE process and reduces the time to make anRP part. However, the successful implementation of this path has some challenges that need tobe overcome. In order to e�ciently generate the slices for RP fabrication, the number of pointclouds needs to be reduced. The enormous number of point clouds generated by scannersgreatly increases the computing loads of the RE process, and often leads to situations that arepractically unjusti®able to proceed with computation. Point data reduction methods for RPfabrication are described in the subsequent sections.
4. Point clouds reduction methods
In layered manufacturing, the slices with a constant thickness are used in part construction.
K.H. Lee, H. Woo / Computers & Industrial Engineering 38 (2000) 21±38 25

Therefore, only cross-sectional data at every ®xed height are needed for part fabricationregardless of the density of the scanned data. This cross-sectional data will result in a series ofstair-steps when a curved feature along the z-axis of a part is built. This implies that neitherthe entire data needs to be maintained nor a complete surface ®tting is needed when RE dataare utilized in RP fabrication. The point data for cross-sections that are within the tolerance ofthe previous cross-section need not be kept. The proposed algorithm reduces the amount ofpoint data by eliminating these redundant cross-sections. The overall procedure from RE toRP, including the reduction in the number of point clouds, is shown in Fig. 2Once the point clouds are acquired, the curvature changes of a part along z-axis are
identi®ed and recorded, and then they are used to divide the point data model into subregions.The point data for each cross-section within a subregion can be tested and either eliminated ormaintained based on the boundary contours (or cross-sections). A ruled surface is assumedbetween these boundary contours and an intermediate contour can be calculated using thestraight-line homotopy method. When the deviation between the intermediate contour of asubregion and the corresponding point data is within tolerance, the subregion of the model canbe accurately represented by boundary contours and all intermediate point data can beremoved. When the deviation is greater than the tolerance, the intermediate contour becomes aboundary contour and the corresponding subregion is divided into two subregions. The pointdata reduction process is then applied to each new subregion in a recursive manner. Uponcompletion of this procedure, the minimum number of contours that represents the part shapeare determined, and the slices that are needed for part fabrication are generated from thesedata. The data reduction procedure is described in the following sections.
Fig. 2. The overall procedure from RE to RP.
K.H. Lee, H. Woo / Computers & Industrial Engineering 38 (2000) 21±3826

4.1. Part scanning and point data acquisition
In RE, the quality of the data acquisition process is crucial to the accuracy of the resultingCAD model. It starts with preparing the part surface. Parts with dark or shiny surfaces aredi�cult to digitize and they need to be spray coated. Then the part has to be set up properlyso that it can be scanned. If the part cannot be scanned with one orientation, it needsadditional setups. When a part is scanned with multiple orientations, the scanned data fromeach orientation need to be combined and represented in a common coordinate system. This iscalled the registration. It is achieved by using reference features on the part, such as attachingtooling balls, or ®xturing the part on a rotary table. After ®xturing is completed, the part canbe scanned. However, the initial scanned data cannot generally be used for surface modelingoperation. They usually contain spikes, outliers, and poor quality regions. These need to beremoved, and further preprocessing operations are required such as merging overlapped pointdata and performing registration of separate point clouds [21].
4.2. Point data arrangement
The types of point data arrangement can be di�erent based on subsequent manufacturingoperations. In this research, point data are arranged as a series of cross-sectional contours. Thecross-sectional data format is popular in the construction of medical images such as thoseobtained by computed tomography or magnetic resonance imaging. This contour data formatis selected since it can be directly applied to part fabrication in RP where parts are built layerby layer. The point clouds obtained in the previous step need to be converted to a series ofcross-sectional contours. In order to construct each contour, the point clouds are divided bytwo parallel planes, giving a constant thickness E: The point data contained in each slice arerearranged by projecting them on the cross-sectional planes.
4.3. Extraction of curvature information
In RP, the part is built by sweeping each cross-section vertically by the height of a layer andthis results in zero vertical curvature for each slice. The curvature data on the cross-sectionalplanes is kept but the ones along the vertical direction are approximated due to the stair-stepsinherent in layered manufacturing. It is crucial to keep critical features such as the edges andpeak points along the z-axis; this can be best achieved by keeping cross-sectional contours atthe z-heights where sharp curvature changes occur.Keeping these critical cross-sectional contours require the acquisition of curvature data of a
part along the z-axis. The procedure consists of four steps: (1) generate vertical cross-sections,(2) identify the points of curvature changes, (3) recreate the point data model using extractedpoints, and (4) calculate the point extraction ratio. The details of each step are describedbelow.
4.3.1. Generation of vertical cross-sectionsTo obtain the curvature data along the z-direction, cross-sections are made perpendicular to
the xy-plane of the model. As shown in Fig. 3, three di�erent ways of vertical cross-sectioning
K.H. Lee, H. Woo / Computers & Industrial Engineering 38 (2000) 21±38 27
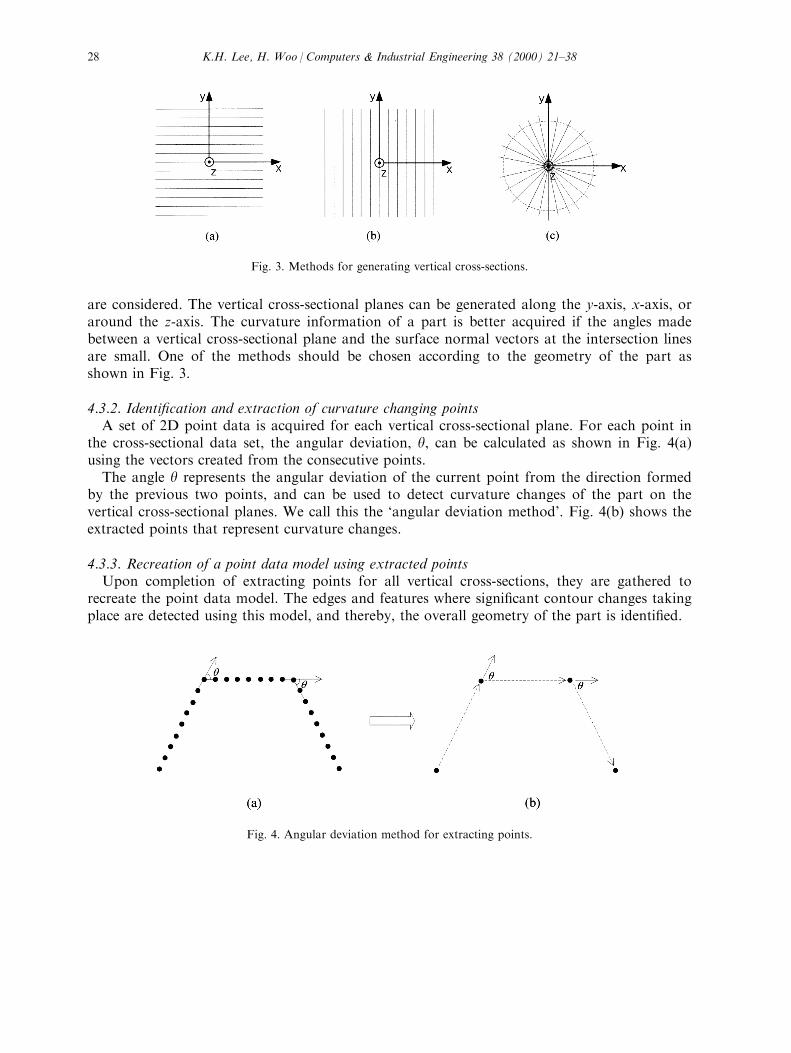
are considered. The vertical cross-sectional planes can be generated along the y-axis, x-axis, oraround the z-axis. The curvature information of a part is better acquired if the angles madebetween a vertical cross-sectional plane and the surface normal vectors at the intersection linesare small. One of the methods should be chosen according to the geometry of the part asshown in Fig. 3.
4.3.2. Identi®cation and extraction of curvature changing pointsA set of 2D point data is acquired for each vertical cross-sectional plane. For each point in
the cross-sectional data set, the angular deviation, y, can be calculated as shown in Fig. 4(a)using the vectors created from the consecutive points.The angle y represents the angular deviation of the current point from the direction formed
by the previous two points, and can be used to detect curvature changes of the part on thevertical cross-sectional planes. We call this the `angular deviation method'. Fig. 4(b) shows theextracted points that represent curvature changes.
4.3.3. Recreation of a point data model using extracted pointsUpon completion of extracting points for all vertical cross-sections, they are gathered to
recreate the point data model. The edges and features where signi®cant contour changes takingplace are detected using this model, and thereby, the overall geometry of the part is identi®ed.
Fig. 3. Methods for generating vertical cross-sections.
Fig. 4. Angular deviation method for extracting points.
K.H. Lee, H. Woo / Computers & Industrial Engineering 38 (2000) 21±3828

4.3.4. Calculation of point extraction ratioA point extraction ratio is introduced to identify the edges that involve signi®cant curvature
changes of a part on the vertical cross-sectional planes. Between the point data model and theextracted points, the ratio of the number of points at each level of height Zi can be calculated.The point extraction ratio, rzi , is the number of extracted points over the total number ofpoints in the horizontal cross-sectional plane at height Zi as de®ned below.
rzi ��The number of extracted points�zi
�Total number of points in the cross-section�ziÿ0RrziR1
�A graph that shows the ratio of point extraction at di�erent heights of a part can be created.The value of rzi is greater when a large amount of curvature changes occur, and vice versa.
4.4. Subregioning of point data models
Dividing the point data model into subregions can facilitate the data reduction process. Thesubregioning can be performed based on the point extraction ratio described above. Boundarycontours of each subregion can be generated by the horizontal cross-sections located at z-heights where the point extraction ratio is greater than the given threshold value. The purposeof subregioning is twofold. First, it ensures accurate fabrication of edges and critical features.These boundary contours reduce the stair step errors. Second, the boundary contours are usedas reference data for comparison during the data reduction process.When a part consists of quadric surfaces and uniform cross-sections, the subregions can be
generated using a higher extraction ratio as the threshold. However, when a part has free-formsurfaces, a lower extraction ratio has to be used. If the threshold level of point extraction ratiois high for free-form surfaces, it may mistakenly eliminate cross-sectional point data that needto be maintained.
4.5. Reduction of point data
For point data reduction, the points on a horizontal cross-sectional contour have to becompared with those of the neighboring boundary cross-sections. If the deviation is within thegiven tolerance, the points in that contour can be eliminated; otherwise, they need to be kept.In order to compare the point data with e�ciency, a homotopy method is introduced.
4.5.1. HomotopyIntermediate contours between the boundary contours can be generated using a homotopy.
A homotopy is de®ned as follows [22].Let f, g : X4Y be maps, where X and Y are topological spaces. Then f is homotopic to g if
there exist a map F : X� I4 Y such that F�x, 0� � f�x� and F�x, 1� � g�x� for all points x 2X where I � �0, 1� � R: The map F is called a homotopy from f to g. When F is de®ned byF�x, t� � �1ÿ t�f�x� � tg�x�, it is called a straight-line homotopy. Fig. 5(a) illustrates theconcept of the straight-line homotopy.The homotopy can be used in di�erent ways. The homotopy is used to generate intermediate
K.H. Lee, H. Woo / Computers & Industrial Engineering 38 (2000) 21±38 29

contours. But a surface that connects two boundary contours can be represented as well by thelocus of homotopy that transforms one contour to the other. Fig. 5(b) and (c) show boundarycontours and the corresponding intermediate contours generated using the homotopy,respectively.
4.5.2. Elimination of point data at intermediate contoursAfter the point data model is divided into subregions, B-spline curves are generated by
approximating the points in the boundary contours. Then, a mid-contour between theconsecutive boundary contours is calculated using the homotopy. Distances between the mid-contour and the corresponding cross-sectional point data are calculated. When the deviation ofeach point from the mid-contour is within tolerance, all cross-sectional point data located atthe same z-height are eliminated. If the deviation is greater than the tolerance, these cross-sectional point data cannot be removed and they become the boundary contours of newsubregions. The process of halving the boundary contours continues until the height of thesubregion is smaller than two times the minimum allowable layer thickness, lmin. To check thetolerance, both the maximum allowable deviation and the average deviation are used, withthese values being set by the user. The algorithm terminates when no further subregioning canbe performed. Since the algorithm only checks for the mid-contour in examining the deviationbetween the point data and the intermediate contours, it may miss some contours that are out
Fig. 5. Homotopy and its examples: (a) homotopy, (b) boundary contours, (c) generation of intermediate contours.
K.H. Lee, H. Woo / Computers & Industrial Engineering 38 (2000) 21±3830

of tolerance. This can be avoided by increasing the number of initial subregions by loweringthe level of the point extraction ratio as described in the earlier section.Fig. 6 shows the point data elimination procedure. Fig. 6(a) shows the initial point cloud
model that is divided into three subregions using the point extraction ratio. In subregions I andII, the intermediate cross-section point data are represented by the homotopy of the boundarycurves. Therefore, all the point data except the ones at the boundary curves are eliminated. Insubregion III, however, the mid-contour cannot be eliminated since it is bigger than thetolerance when compared with the boundary curves, and additional subregions are needed.Fig. 6(c) shows the ®nal point data model obtained upon completion of the data eliminationprocedure. We call this model a contour data model since each contour is represented by thepoint data. It can be stored and used for slice data ®le generation for RP.
5. Slice data ®le generation and part fabrication
A slice data ®le contains contour data of all layers that are required in fabricating an RPpart. The contour data model created in the previous section can be used for this purpose.
Fig. 6. Point data elimination procedure.
K.H. Lee, H. Woo / Computers & Industrial Engineering 38 (2000) 21±38 31

Using the contour data model directly made from the point cloud data, the STL ®le creationstep can be eliminated. The contour data model consists of boundary contours of subregionsthat remained in the data reduction process. But due to point data reduction, some intervalsbetween consecutive contours are much larger than the layer thickness of a machine. The slicedata from these contours cannot be used for fabricating a part since RP machines havelimitations in terms of their maximum curing depth. For these thick slices, additionalintermediate contours are generated between the boundary contours. These intermediatecontours need to be generated without disrupting the continuity of the surface. The straight-line homotopy is used to generate these additional contours between boundary contours. Thenumber of contours generated at this stage coincides with the number of layers in RPfabrication. This contour information constitutes the slice data ®le, which is ®nally transferredto the RP machine.Di�erent slice ®le formats exist for di�erent types of RP machines, but the slice data ®le
basically consists of a layer ®le and a scan ®le. The layer ®le contains the contour curves of alllayers and the scan ®le contains the laser path in the contour of each layer.In our research, several RP parts were fabricated using the slice data without the use of STL
®les. In the next section, the proposed method is applied to example parts and the results arediscussed.
6. Application examples
In implementing the proposed procedure, a laser scanner, Surveyor Model 1200 from LaserDesign Inc., was used to acquire the point cloud data and an RP machine, the Sinterstation2000 system of DTM Corp. was used to make RP parts using the slice data. The algorithmswere developed using the open architecture of Surfacer 7.1, the CAD kernel ACIS, and C/C++ language on an SGI Indigo2 workstation. Two examples are presented to demonstratethe e�ciency of the proposed procedure.
6.1. Example 1: a bottle
In the ®rst example, a part with a bottle shape (75 mm in length) is reverse-engineered inorder to illustrate the point data reduction algorithm for parts with a simple geometry. Theinitial point clouds of the part are shown in Fig. 7(a). The point clouds are sliced vertically byan angle of 58 around the center axis of the part, and the resulting vertical cross-sections arecollected to generate the point data model shown in Fig. 7(b). Curvature changing points areidenti®ed by applying the angular deviation method and Fig. 7(c) shows the point data modelrecreated using only the extracted points. From this, the point extraction ratio is calculated.The extraction ratio graph for the part is shown in Fig. 7(d). This graph makes it possible forusers to identify the signi®cant contours along the z-axis.Using the extraction ratio of 0.1 for the above graph, subregions are created as shown in
Fig. 8(a). The data reduction algorithm using the straight-line homotopy is applied, and thecontour model in Fig. 8(b) is obtained. Table 1 shows that 79% reduction is achieved for this
K.H. Lee, H. Woo / Computers & Industrial Engineering 38 (2000) 21±3832
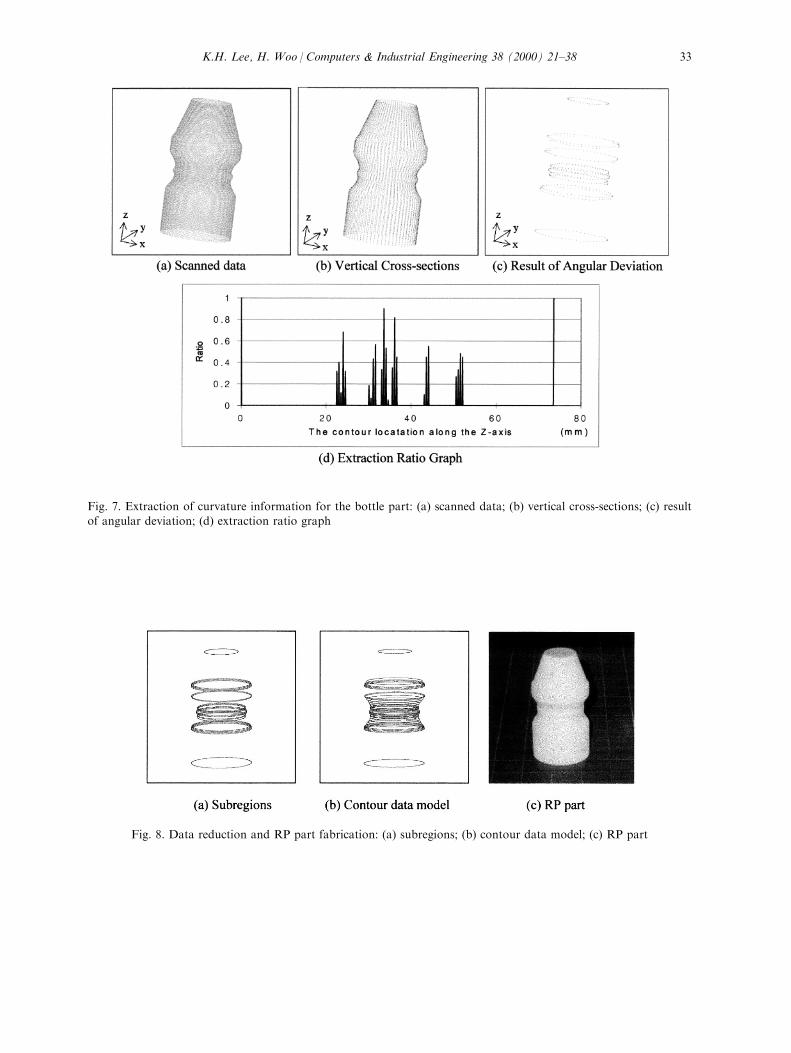
Fig. 7. Extraction of curvature information for the bottle part: (a) scanned data; (b) vertical cross-sections; (c) resultof angular deviation; (d) extraction ratio graph
Fig. 8. Data reduction and RP part fabrication: (a) subregions; (b) contour data model; (c) RP part
K.H. Lee, H. Woo / Computers & Industrial Engineering 38 (2000) 21±38 33

model. The slice data ®le is then created from the contour model, and the corresponding RPpart is shown in Fig. 8(c).
6.2. Example 2: a stem
The upper stem of a hip-joint implant was scanned and manufactured as the secondexample. Fig. 9(a) shows the initial scanned data. In order to extract the curvature
Table 1Data reduction results for the bottle part
Item Number of points
The initial number of point data 44,064The number of points in the contour model 9271The number of reduced data points 34,793
Reduction ratio 78.96 (%)
Fig. 9. Extraction of curvature information for the bottle part: (a) scanned data; (b) vertical cross-sections; (c) resultof angular deviation; (d) extraction ratio graph.
K.H. Lee, H. Woo / Computers & Industrial Engineering 38 (2000) 21±3834
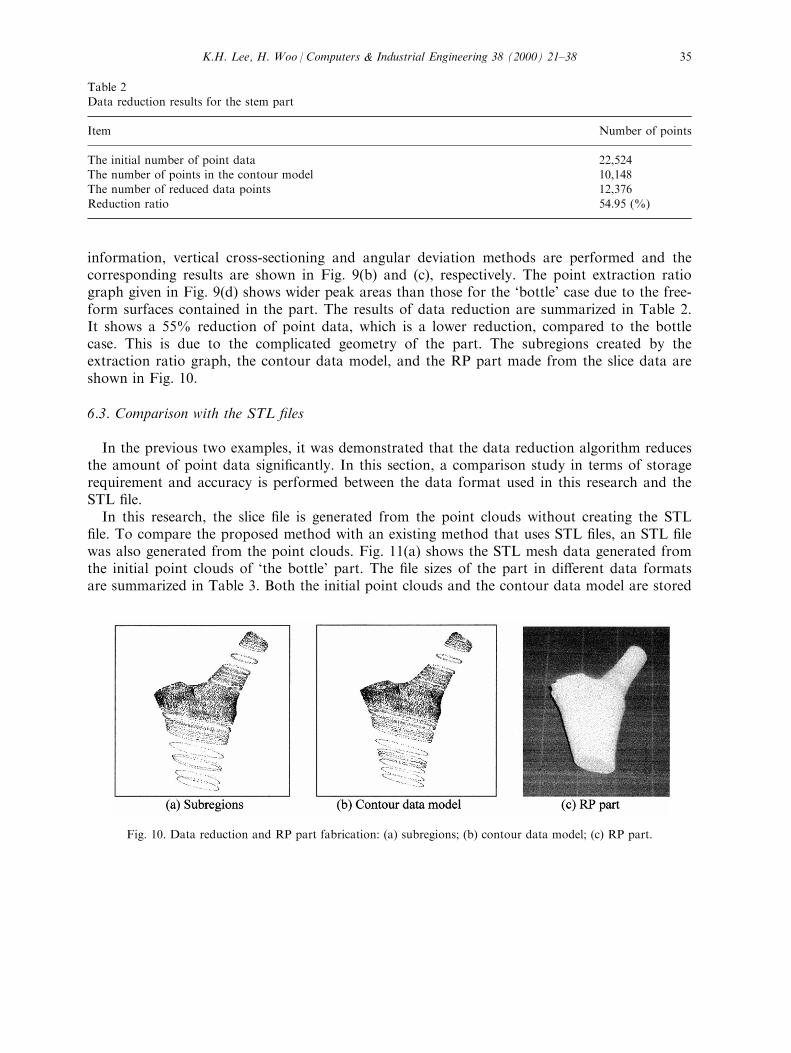
information, vertical cross-sectioning and angular deviation methods are performed and thecorresponding results are shown in Fig. 9(b) and (c), respectively. The point extraction ratiograph given in Fig. 9(d) shows wider peak areas than those for the `bottle' case due to the free-form surfaces contained in the part. The results of data reduction are summarized in Table 2.It shows a 55% reduction of point data, which is a lower reduction, compared to the bottlecase. This is due to the complicated geometry of the part. The subregions created by theextraction ratio graph, the contour data model, and the RP part made from the slice data areshown in Fig. 10.
6.3. Comparison with the STL ®les
In the previous two examples, it was demonstrated that the data reduction algorithm reducesthe amount of point data signi®cantly. In this section, a comparison study in terms of storagerequirement and accuracy is performed between the data format used in this research and theSTL ®le.In this research, the slice ®le is generated from the point clouds without creating the STL
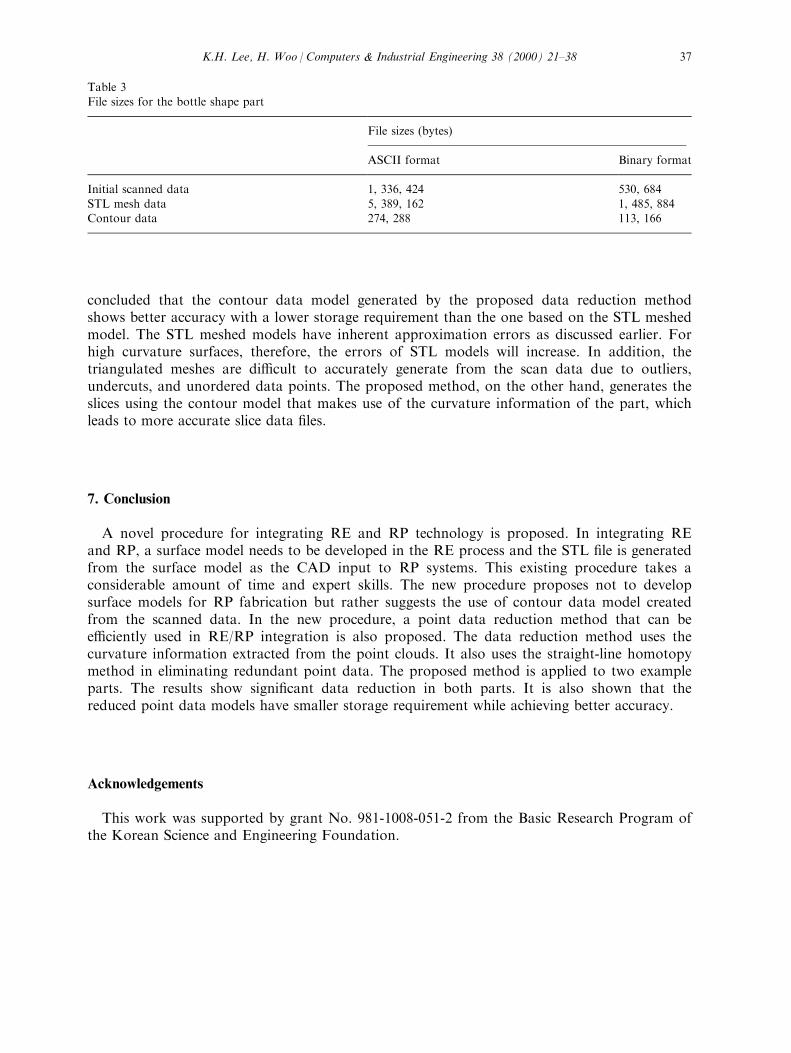
®le. To compare the proposed method with an existing method that uses STL ®les, an STL ®lewas also generated from the point clouds. Fig. 11(a) shows the STL mesh data generated fromthe initial point clouds of `the bottle' part. The ®le sizes of the part in di�erent data formatsare summarized in Table 3. Both the initial point clouds and the contour data model are stored
Table 2Data reduction results for the stem part
Item Number of points
The initial number of point data 22,524The number of points in the contour model 10,148The number of reduced data points 12,376
Reduction ratio 54.95 (%)
Fig. 10. Data reduction and RP part fabrication: (a) subregions; (b) contour data model; (c) RP part.
K.H. Lee, H. Woo / Computers & Industrial Engineering 38 (2000) 21±38 35

in ASCII as well as in the binary format. The STL ®le was also generated using both formats.The results show that the ®le size of the contour model is much smaller than that of the STL®le in both ASCII and binary formats. Similar results are also obtained for `the stem' partshown in Fig. 11(b).The accuracy of the contour model and that of the STL ®le were also compared. For the
purpose of comparison, the bottle part was used again. First, 10 contours from the contourmodel and the same number of contours from the STL meshed model at the same heights wereextracted. Both of these contours were compared, respectively, with those of the original CADmodel at each corresponding height as shown in Fig. 12(a). Fig. 12(b) shows the maximumdeviations of each model from the original CAD model. It shows that the contour model hasless deviation than the STL meshed model from the original CAD model. Therefore, it can be
Fig. 11. STL mesh data: (a) bottle part; (b) stem part.
Fig. 12. Comparison of deviation of each model from the original CAD model.
K.H. Lee, H. Woo / Computers & Industrial Engineering 38 (2000) 21±3836
concluded that the contour data model generated by the proposed data reduction methodshows better accuracy with a lower storage requirement than the one based on the STL meshedmodel. The STL meshed models have inherent approximation errors as discussed earlier. Forhigh curvature surfaces, therefore, the errors of STL models will increase. In addition, thetriangulated meshes are di�cult to accurately generate from the scan data due to outliers,undercuts, and unordered data points. The proposed method, on the other hand, generates theslices using the contour model that makes use of the curvature information of the part, whichleads to more accurate slice data ®les.
7. Conclusion
A novel procedure for integrating RE and RP technology is proposed. In integrating REand RP, a surface model needs to be developed in the RE process and the STL ®le is generatedfrom the surface model as the CAD input to RP systems. This existing procedure takes aconsiderable amount of time and expert skills. The new procedure proposes not to developsurface models for RP fabrication but rather suggests the use of contour data model createdfrom the scanned data. In the new procedure, a point data reduction method that can bee�ciently used in RE/RP integration is also proposed. The data reduction method uses thecurvature information extracted from the point clouds. It also uses the straight-line homotopymethod in eliminating redundant point data. The proposed method is applied to two exampleparts. The results show signi®cant data reduction in both parts. It is also shown that thereduced point data models have smaller storage requirement while achieving better accuracy.
Acknowledgements
This work was supported by grant No. 981-1008-051-2 from the Basic Research Program ofthe Korean Science and Engineering Foundation.
Table 3File sizes for the bottle shape part
File sizes (bytes)
ASCII format Binary format
Initial scanned data 1, 336, 424 530, 684
STL mesh data 5, 389, 162 1, 485, 884Contour data 274, 288 113, 166
K.H. Lee, H. Woo / Computers & Industrial Engineering 38 (2000) 21±38 37
References
[1] Va rady T, Martin RR, Cox J. Reverse engineering of geometric models±an introduction. Computer AidedDesign 1997;29(4):255±68.
[2] Gaspardo S. Applications of reverse engineering. In: Rapid Prototyping and Manufacturing '99 Conference,Rosemont, IL, vol. 3. 1999. p. 515±8.
[3] Yau H. Reverse engineering of engine intake ports by digitization and surface approximation. International
Journal of Machine Tools Manufacturing 1997;37(6):871±85.[4] Hoppe H. Surface reconstruction from unorganized points. Ph.D. thesis, University of Washington, Seattle,
WA, 1994.
[5] Surfacer, User's Guide, Imageware, 1997.[6] Hosni Y, Ferreira L, Burjanroppa R. Rapid prototyping through reverse engineering. In: Second Industrial
Engineering Research Conference Proceedings. 1991. p. 420±4.[7] Schoene C, Ho�mann J. Reverse engineering based on multi-axis digitized data. International Conference on
Manufacturing Automation (ICMA '97) 1997;1:909±14.[8] Vail NK, Wilke W, Bieder H, Juneman G. Interfacing reverse engineering data to rapid prototyping. In: Solid
Freeform Fabrication Symposium. 1996. p. 481±90.
[9] Yan X, Gu P. A review of rapid prototyping technology and systems. Computer Aided Design 1996;28:307±18.[10] Jamieson R, Hacker H. Direct slicing of CAD models for rapid prototyping. In: Internet Conference http://
www.mcb.co.uk/services/confec95/rapidpd/jamieson/jamieson.htm. 1995.
[11] Qiming H, Yungan W. Direct slicing for rapid prototyping. In: International Conference on ManufacturingAutomation (ICMA '97), vol. 1. 1997. p. 890±3.
[12] Makela I, Dolenc A. Some e�cient procedures for correcting triangulated models. In: Solid FreeformFabrication Symposium. 1993. p. 126±34.
[13] Rock SJ, Wozny MJ. Generating topological information from a ``bucket of facets''. In: Solid FreeformFabrication Symposium. 1992. p. 251±9.
[14] Bohn JH, Wozny MJ. Automatic CAD-model repair: shell-closure. In: Solid Freeform Fabrication Symposium.
1992. p. 86±94.[15] Fujimoto M, Kariya K. An improved method for digitized data reduction for computer integrated
manufacturing. In: Proceedings of the 1992 International Conference on Industrial Electronics, Control,
Instrumentation, and Automation. 1992. p. 896±901.[16] Hamann B. A data reduction scheme for triangulation surfaces. Computer Aided Geometric Design
1994;11:197±214.
[17] Chen YH, Ng CT, Wang YZ. Data reduction in integrated reverse engineering and rapid prototyping.International Journal of Computer Integrated Manufacturing 1999;12(2):97±103.
[18] Ve ron P, Le on JC. Static polyhedron simpli®cation using error measurements. Computer Aided Design1997;29:287±98.
[19] Hamann B, Chen J. Data point selection for piecewise linear curve approximation. Computer Aided GeometricDesign 1994;11:289±301.
[20] Martin RR, Stroud IA, Marshall AD, Data reduction for reverse engineering. RECCAD, Deliverable
Document 1 COPERNICUS Project No. 1068, 1996, pp.101±113.[21] DataSulpt User's Manual Version 4.0. Laser Design, 1995.[22] Kunii TL, Shinagama Y, Gotoda H. Intelligent design and manufacturing. New York: Wiley, 1992.
K.H. Lee, H. Woo / Computers & Industrial Engineering 38 (2000) 21±3838