direct lithium-ion battery recycling to yield battery ... · ion battery has grown to become the...
TRANSCRIPT

DIRECT LITHIUM-ION BATTERY RECYCLING TO YIELD
BATTERY GRADE CATHODE MATERIALS
Dayang Ge
Thesis submitted to the faculty of the
Virginia Polytechnic Institute and State University
in partial fulfillment of the requirements for the degree of
Master of Science
In
Mechanical Engineering
Zheng Li
Rui Qiao
Jinsuo Zhang
June 20, 2019
Blacksburg, VA
Keywords: Recycling, battery cathode material, Lithium nickel cobalt manganese
oxides

DIRECT LITHIUM-ION BATTERY RECYCLING TO YIELD
BATTERY GRADE CATHODE MATERIALS
Dayang Ge
ABSTRACT
The demand for Lithium-ion batteries (LIBs) has been growing exponentially in recent
years due to the proliferation of electric vehicles (EV). A large amount of lithium- ion
batteries are expected to reach their end-of-life (EOL) within five to seven years. The
improper disposal of EOL lithium-ion batteries generates enormous amounts of
flammable and explosive hazardous waste. Therefore, cost-effectively recycling LIBs
becomes urgent needs. Lithium nickel cobalt manganese oxides (NCM) are one of the
most essential cathode materials for EV applications due to their long cycle life, high
capacity, and low cost. In 2008, 18.9% of Lithium-ion batteries used NCM cathode
material worldwide while this number increased to 31% six years later. An
environment–friendly and low-cost direct recycling process for NCM has been
developed in this project. The goal of this project is to recycle the EOL NCM and yield
battery-grade NCM with equivalent electrochemical performance compared to virgin
materials. In order to achieve this goal, four different heat treatment conditions are
investigated during the direct recycling process. From the experimental results, the
charge and discharge capacities of the recycled material are stable (between 151-155

mAh/g) which is similar to that of the commercial MTI NCM when sintered at 850 °C
for 12 hours in the air. In addition, the cycling performance of recycled NCM is better
than the commercial MTI NCM up to 100 cycles.
DIRECT LITHIUM-ION BATTERY RECYCLING TO YIELD
BATTERY GRADE CATHODE MATERIALS
Dayang Ge
GENERAL AUDIENCE ABSTRACT
The demand for Lithium-ion batteries has been growing exponentially in recent years
due to the proliferation of electric vehicles. A large amount of lithium-ion batteries are
expected to reach their end-of-life within five to seven years. The improper disposal of
end-of-life lithium-ion batteries generates enormous amounts of flammable and
explosive hazardous waste. Therefore, cost-effectively recycling Lithium-ion batteries
becomes urgent needs. Lithium nickel cobalt manganese oxides are one of the most
essential cathode materials for electric vehicles applications due to their long cycle life,
high capacity, and low cost. In 2008, 18.9% of Lithium-ion batteries used Lithium
nickel cobalt manganese oxides cathode material worldwide while this number
increased to 31% six years later. An environment–friendly and low-cost direct recycling
process for Lithium nickel cobalt manganese oxides material has been developed in this
project. The goal of this project is to recycle the end-of-life manganese oxides cathode
material. In order to achieve this goal, four different heat treatment conditions are
investigated during the direct recycling process. From the experimental results, the
cycling performance of recycled NCM is better than the commercial MTI NCM.

v
ACKNOWLEDGMENTS
I would like to express my sincere gratitude to my research advisor Dr. Zheng Li for
the support of my research, for his patience, academic spirit, and guidance. I appreciate
the research change he gives to me in the past year. His guidance not only improves my
research skills but also helps in my thoughts and life. I also really appreciate Dr. Rui
Qiao and Dr. Jinsuo Zhang for serving as my thesis committee.
My sincere thanks also go to my labmates in Dr.Li’s group: Liurui Li, Panni Zheng,
Tairan Yang, Yingqi Lu, and Sanpei Zhang, for the time we work together to solve the
problems and also improve ourselves.
Last but not least, I would like to thank my parents. Thanks for the life they give to me
and give me the chance I can study at Virginia Tech.

vii
TABLE OF CONTENTS
CHAPTER 1: Introduction.................................................................................................... 1
1.1 History of lithium-ion battery .................................................................................. 1
1.2 Structure of lithium-ion batteries ............................................................................. 2
1.3 Demand for recycling............................................................................................... 4
1.3.1 Cathode active material market ......................................................................... 4
1.3.2 Battery materials cost ........................................................................................ 5
1.3.3 Environment ..................................................................................................... 6
1.4 Recycling methods ................................................................................................... 7
1.4.1 Pyrometallurgical processes ............................................................................... 7
1.4.2 Hydrometallurgical processes ............................................................................ 8
1.4.3 Direct Recycling Process .................................................................................... 9
1.5 Methods to improve the electrochemical performance of lithium nickel cobalt
manganese oxide (NCM) cathode ................................................................................. 10
1.5.1 Method one: Creating a core-shell structure of NCM by NCA modification........ 11
1.5.2 Method two: Interconnected single crystal with the porous structure ................. 13
1.5.3 Method three: Coating Nano-sized SiO2 ........................................................... 14
1.5.4 Method four: Changing the ratio of Ni, Co, and Mn .......................................... 17
CHAPTER 2: Experimental Methodology ............................................................................ 18
CHAPTER 3: Commercial material...................................................................................... 19
CHAPTER 4: Results ......................................................................................................... 21
4.1 Pellet-sinter at 850 °C for 12 hours in the air........................................................... 21
4.1.1 Process conditions ........................................................................................... 21
4.1.2 Partial size and structure analyze ..................................................................... 22
4.1.3 Electrochemical performance........................................................................... 24
4.2 Pellet-sinter at 850 °C for 12 hours in the oxygen .................................................... 27
4.2.1 Process conditions ........................................................................................... 27
4.2.2 Partial size and structure analyze ..................................................................... 28
4.2.3 Electrochemical performance........................................................................... 30
4.3 Powder-sinter at 850 °C for 12 hours in the air........................................................ 33
4.3.1 Process conditions ........................................................................................... 33

viii
4.3.2 Partial size and structure analyze ..................................................................... 34
4.3.3 Electrochemical performance........................................................................... 36
4.4 Powder-sinter at 850 °C for 12 hours in the oxygen ................................................. 38
4.4.1 Process conditions ........................................................................................... 38
4.4.2 Partial size and structure analyze ..................................................................... 39
4.4.3 Electrochemical performance........................................................................... 41
CHAPTER 5: Conclusion .................................................................................................... 44
References...................................................................................................................... 46

ix
LIST OF FIGURES
Figure 1: Expansion of worldwide LIB demand [2] ............................................................ 1
Figure 2: The structure of the lithium-ion battery .............................................................. 3
Figure 3: The cost of battery material [5]........................................................................... 5
Figure 4: The cost of battery material detail ...................................................................... 6
Figure 5: Recycle process of Umicore battery [4, 7, 8, 9] ..................................................... 7
Figure 6: The recycling process from Batrec. [8, 10] ........................................................... 8
Figure 7: Batrec recycle process. [8, 10] ............................................................................. 9
Figure 8: (a) Core-shell structure model and (b) EDS line profile[11] ................................ 11
Figure 9: (a) First cycle charge and discharge and (b) cycle performance of core and core -
shell.[11] ........................................................................................................................ 12
Figure 10: The process of modified sol-gel method [3] ...................................................... 13
Figure 11: Pore volume distribution [3] ........................................................................... 13
Figure 12: Cyclic performance of NCM cells at a rate of 0.1 C. [3] .................................... 14
Figure 13: The XRD of a) P-NCM b) 0.5 wt. %, c) 1.0 wt. %, and d) 3.0 wt. % SiO2 [12].... 15
Figure 14: TEM image of S-NCM [12] ............................................................................. 15
Figure 15: Cycle performance at a high temperature of 60 C. [11]..................................... 16
Figure 16: Phase diagram of LNO, LCO and LMO [13] ................................................... 17
Figure 17: The SEM images of (a) End of life NCM 201810#2, (b) Commercial MTI NCM 19
Figure 18: EC performance profile of commercial MTI NCM .......................................... 19
Figure 19: The XRD patterns of End of life NCM ( EOL NCM), add 37% Li cycled NCM, add
40% Li cycled NCM, add 43% Li cycled NCM, and MTI commercial NCM(523) powder. . 22
Figure 20: The SEM images of (a) add 37%Li Sinter, (b) add 40%Li Sinter, (c) add 43%Li
Sinter ............................................................................................................................ 23
Figure 21: (a) The first circle EC performance profile of add 37% Li cycled NCM, add 40%
Li cycled NCM, add 43% Li cycled NCM, and MTI commercial NCM(523) powder at C/5
rate cycling between 2.75 - 4.2V. (b)The cycling performance of add 37% Li cycled NCM, add
40% Li cycled NCM, add 43% Li cycled NCM, and MTI commercial NCM (523) powder at
C/5 rate cycling between 2.75 - 4.2V ................................................................................ 24
Figure 22: The XRD patterns of End of life NCM ( EOL NCM), add 37% Li cycled NCM, add
40% Li cycled NCM, add 43% Li cycled NCM, and MTI commercial NCM(523) powder. . 28
Figure 23: The SEM images of (a) End of life NCM, (b) add 37%Li Sinter,(c) add 40%Li Sinter,
(d) add 43%Li Sinter, (e) add 46%Li Sinter,(f) add 49%Li Sinter ..................................... 29
Figure 24: (a) The first circle EC performance profile of add 37% Li cycled NCM, add 40%
Li cycled NCM, add 43% Li cycled NCM, add 46% Li cycled NCM, 49% Li cycled NCM, and
MTI commercial NCM(523) powder at C/5 rate cycling between 2.75 - 4.2V. (b)The cycling
performance of add 37% Li cycled NCM, add 40% Li cycled NCM, add 43% Li cycled NCM,
add 46% Li cycled NCM, 49% Li cycled NCM, and MTI commercial NCM (523) powder at
C/5 rate cycling between 2.75 - 4.2V ................................................................................ 30
Figure 25: The XRD patterns of End of life NCM (EOL NCM), add 43% Li cycled NCM, add

x
46% Li cycled NCM, 49% Li cycled NCM, and MTI commercial NCM523 powder. .......... 34
Figure 26: The SEM images of (a) End of life NCM, The SEM images of (a) End of life NCM,
(b) add 37%Li Sinter, (c) add 40%Li Sinter, (d) add 43%Li Sinter, (e) add 46%Li Sinter, (f)
add 49%Li Sinter ........................................................................................................... 35
Figure 27: (a) The first circle EC performance profile of add 43% Li cycled NCM, add 46%
Li cycled NCM, 49% Li cycled NCM, and MTI commercial NCM (523) powder at C/5 rate
cycling between 2.75 - 4.2V. (b)The cycling performance of add 43% Li cycled NCM, add 46%
Li cycled NCM, 49% Li cycled NCM, and MTI commercial NCM (523) powder at C/5 rate
cycling between 2.75 - 4.2V ............................................................................................. 36
Figure 28: The XRD patterns of End of life NCM ( EOL NCM) add 43% Li cycled NCM, add
46% Li cycled NCM, 49% Li cycled NCM, and MTI commercial NCM(523) powder ........ 39
Figure 29: The SEM images of (a) Sintered NCM43%, (b) Sintered NCM46% , (c) Sintered
NCM49% ...................................................................................................................... 40
Figure 30: (a) The first circle EC performance profile of 43% Li cycled NCM, add 46% Li
cycled NCM, 49% Li cycled NCM, and MTI commercial NCM(523) powder at C/5 rate
cycling between 2.75 - 4.2V. (b)The cycling performance of add 43% Li cycled NCM, add 46%
Li cycled NCM, 49% Li cycled NCM, and MTI commercial NCM (523) powder at C/5 rate
cycling between 2.75 - 4.2V ............................................................................................. 41

xi
LIST OF TABLES
Table 1: Different cathode active material in the world [4] .................................................. 4
Table 2: The price of raw material [5]................................................................................ 5
Table 3: Calibration machine name and type ................................................................... 18
1
CHAPTER 1: Introduction
1.1 History of lithium-ion battery
In the 1970s, the research on the lithium-ion battery started, and the first
commercial lithium-ion battery was manufactured in 1991.[1] Since then, the lithium-
ion battery has grown to become the dominant power storage solution for portable
information technology devices: mobile phone batteries, laptop batteries, and camera
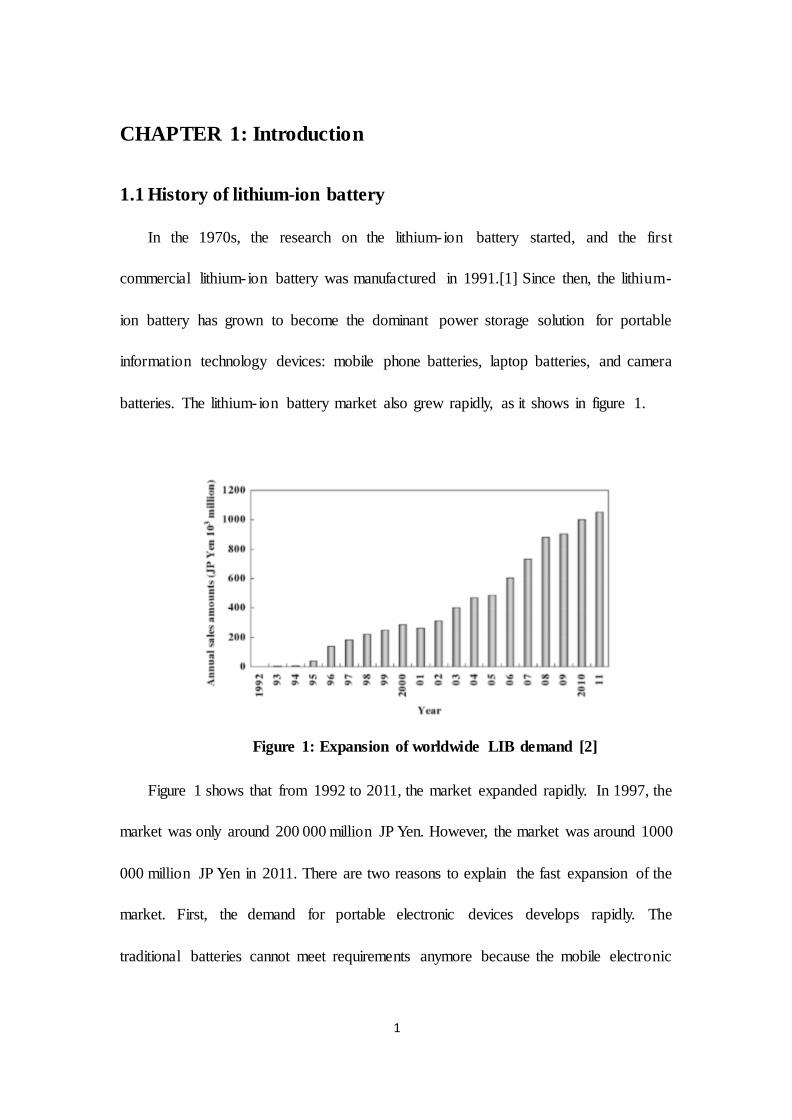
batteries. The lithium-ion battery market also grew rapidly, as it shows in figure 1.
Figure 1: Expansion of worldwide LIB demand [2]
Figure 1 shows that from 1992 to 2011, the market expanded rapidly. In 1997, the
market was only around 200 000 million JP Yen. However, the market was around 1000
000 million JP Yen in 2011. There are two reasons to explain the fast expansion of the
market. First, the demand for portable electronic devices develops rapidly. The
traditional batteries cannot meet requirements anymore because the mobile electronic
2
devices request rechargeable batteries with high energy density, which means high
capacity and lightweight. The second reason is that the lithium-ion batteries meet the
requirements exactly. Lithium-ion batteries have high power and energy density. Their
pouch cells are small with lightweight. It means that these types of batteries are easy to
carry. Lithium-ion batteries also have a long life cycle that can last more than 1000
cycles. Low self-discharge rate also prolongs their lives to ten years.
1.2 Structure of lithium-ion batteries
The principle and the structure of lithium-ion batteries can also explain why
lithium-ion batteries have high energy density. There are four main components in a
single lithium-ion battery cell: anode, cathode, electrolyte, and separator. The anode
sheet contains graphite, a Cu current collector, and a binder. The cathode sheet contains
LiCoO2, Al current collectors, the conductive carbon, and a binder. In the charging
process, Li ions are released from the cathode and go through the electrolyte into the
anode. In the discharging process, Li ions are released from the anode and go into the
cathode, as it shows in the graph below:

3
Figure 2: The structure of the lithium-ion battery
Figure 2 shows the structure of a single cell of lithium-ion batteries. However, one
pouch cell contains many individual cells. In other words, one pouch cell contains
multiple cathodes and anode sheets. In this way, pouch cells achieve the most efficient
utilization of space and 90–95 percent packaging efficiency. Therefore, lithium- ion
batteries can possess high energy density with small volume.

4
1.3 Demand for recycling
1.3.1 Cathode active material market
With the development of science and technology, a large amount of lithium- ion
batteries are used in cellphones, laptops, and electric vehicles (EV). The high energy
density and long life cycles become urgent demands. As a result, nickel cobalt
manganese oxide (NCM) cathode is attractive and alternative to lithium cobalt oxide
(LCO) as cathode materials because the former has a longer life cycle, a higher capacity,
and lower costs.[3] There are different types of nickel cobalt manganese oxide (NCM)
cathode in market: LiNi0.33Mn0.33Co0.33O2 (NCM333), and LiNi0.6Mn0.2Co0.2O2
(NCM622), etc. The numbers following NCM show the molar ratio of Ni: Co: Mn. For
example, NCM622 shows LiNi0.6Mn0.2Co0.2O2 and the ratio of Ni: Co: Mn is 6: 2: 2.
Table 1: Different cathode active material in the world [4]
Year LiNi0.33Mn0.33Co0.33O2 LiCoO2 LiMn2O4 LiFePO4 LiNiO2
2008 18.9% 60.8% 10.5% 3.5% 6.5%
2012 29.0% 37.2% 21.4% 5.2% 7.2%
2014 31.0% 39.8% 15.9% 8.8% 4.5%
As can be seen from table 1, NCM333 occupied 18.9% of the cathode active
material market in 2008, which was only second to LCO material. However, the
occupation of NCM333 increased to 31% in 2014. The increasing rate of NCM is
speedy, and it becomes one of the most important cathode materials.

5
1.3.2 Battery materials cost
Table 2: The price of raw material [5]
Material Price 2010($/kg) Price 2015($/kg) Long-term Price
2010($/kg)
Li2CO3 7 8.8 9.3
Manganese 8 7.4 6.3
Nickel 22 18.9 17.7
Cobalt 48 33.6 26.4
Table 2 shows the price of Li2CO3, Manganese, and Cobalt. The cost of raw metals
is very high.
Figure 3: The cost of battery material [5]
Figure 3 shows the cost of battery cell manufacture. About 39% of the cost is on
raw materials and raw material processing. Through Recycling dead batteries, the cost
6
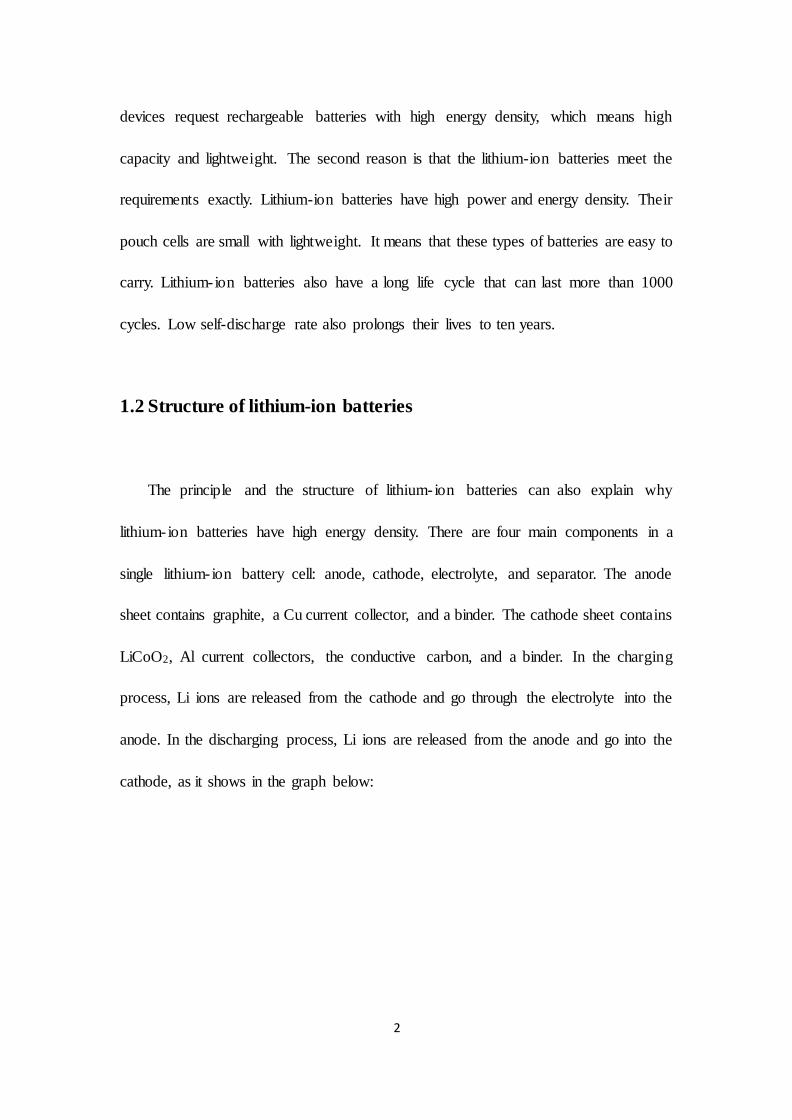
of this part can be decreased. As for raw materials and raw material processing, cathode
material covers 14% of the cost as shown in Figure 4. Therefore, recycling cathode
material is a good choice to cut the cost.
1.3.3 Environment
Many battery components are toxic and dangerous for the environment. Recycling
batteries is the best way to avoid pollution. It can also save energy and protect the
environment in other ways. We can recycle dead batteries instead of making active
materials by using raw materials from mines. For example, if we recycle the LiCoO2
from cathode materials that are beyond their service lives, we can save 70% of CO2
emission compared with producing LiCoO2 by using raw metal form mines. [5]
Figure 4: The cost of battery material detail

7
1.4 Recycling methods
There are three main ways to recycle the Li-ion battery: pyrometallurgica l
processes, hydrometallurgical processes and direct recycling. [6]
1.4.1 Pyrometallurgical processes
The pyrometallurgical process is to extract valuable metals through their melting
points. There is an example of using the pyrometallurgical process to recycle Umicore
battery.
Figure 5: Recycle process of Umicore battery [4, 7, 8, 9]
Figure 5 shows that the first step is to mix dead batteries, slag formers, sand,
limestone, and coke together. Secondly, all the mixtures are sent into a single furnace
which has three separate areas. The temperature of the preheating process should be
lower than 300°C, and the temperature should be increased slowly because the furnace
may explode if the temperature is too high or increases too fast. Also, electrolyte
evaporates in this process. The second area is for plastic pyrolysis. The temperature is

8
around 700°C that can melt plastics. The hot gases are used for the preheating process.
The third area is for smelting and reduction process. The temperature in this area is
from 1200 to 1450°C. During this process, the slag (Al, Si, Ca, Fe, Li) and alloy (Cu,
Co, Li, Ni) can be obtained. After chemical treatment, the alloy (Cu, Co, Li, and Ni)
can be recycled.
1.4.2 Hydrometallurgical processes
Hydrometallurgical processes are used to recover the main metals by chemical leaching.
There is an example as shown below:
Figure 6: The recycling process from Batrec. [8, 10]

9
Figure 7: Batrec recycle process. [8, 10]
Figures 6 and 7 show the recycling process from Batrec. The first step is to create
a protective atmosphere by using CO2, which can avoid lithium reaction and rise of
temperature when the dead batteries are disassembling in the shredder. The second step
is the neutralization process. The moist air cloud neutralizes the waste from batteries.
The most critical step is the leaching process. Different kinds of metals are recovered
by using the acidified aqueous liquid. Then, high-purified recycled metals are achieved
during the further process.
1.4.3 Direct Recycling Process
Direct Physical Recycling process is very different from the other two processes.
For pyrometallurgical and hydrometallurgical processes, the final products are single
metals. For the direct recycling process, the final products are cathode active materia ls.
For example, there are some NCM materials that are beyond their service lives. If
pyrometallurgical and hydrometallurgical processes are used in recycling the waste

10
material, the final product should be metal Ni, Mn, and Co. Then, those single metals
can be synthesized to new NCM active materials. However, for the direct recycling
process, the final product is the new NCM active material. As we can see, several
processes can be saved if we replace pyrometallurgical and hydrometallurgica l
processes with the direct recycling process. Also, several steps can be reduced during
the recycling process which means the cost of the recycling process and the origina l
material can be saved. In addition, there are several challenges during the direct
recycling process. First, different batteries should be identified. For example, since the
LCO batteries and NCM batteries have different components, these two types of
batteries should be recycled separately. Second, it is hard to decide the lithium loss of
dead batteries and each battery needs to add a different amount of lithium. Third, it is
difficult to produce new recycled materials with excellent EC performance.
1.5 Methods to improve the electrochemical performance of lithium
nickel cobalt manganese oxide (NCM) cathode
How to improve the electrochemical performance of NCM is still strongly required
after or during the recycling process. Therefore, I reviewed some essays to look for
different methods to improve the electrochemical performance of NCM.

11
1.5.1 Method one: Creating a core-shell structure of NCM by NCA modification
The goal of this method is to improve the structure and capacity of NCM613.
Therefore, a core-shell structure is created to replace the original core structure. The
core-shell structure is showed as below:
Figure 8: (a) Core-shell structure model and (b) EDS line profile[11]
Figure 8 (a) shows the model of the core-shell structure. It is clear that the nickel
concentration is low in the core part. When the point is far away from point A and close
to point B, the nickel concentration will increase. EDS technology is used to measure
the result after the compound experiment. The EDS line profile of the cathode material
shows the ratio of nickel, manganese and cobalt concentrations which keep the same
tendency along the central line. However, the EDS line profile of the precursor shows
the nickel concentration of the shell part is lower than the core part. It means that a
core-shell structure is created. Also, from the EC performance diagram, it can be seen
that this special structure increases capacity and cycling performance:

12
Figure 9: (a) First cycle charge and discharge and (b) cycle performance of core
and core-shell.[11]
Figure 9 (a) shows that the first circle discharge capacity of core-shell electrodes is
192.07 mAh/g, which is much higher than the core structure (133.24 mAh/g). And
figure (b) shows that the cycling performance of core-shell electrodes is better than core
electrodes. First, the capacity is higher. Second, after 50 cycles, the capacity of core-
shell electrodes keeps 99.27% compared with the beginning. In conclusion, the core-
shell structure with NCM core and high nickel NCA shell can improve the capacity of
NCM613, the cycling performance, and reduce the cost by reducing the cobalt
component.

13
1.5.2 Method two: Interconnected single crystal with the porous structure
The purpose of this method is to extend the surface of NCM333 which can lead to
high capacity with good cycling stability. The acid-assisted sol-gel method is used to
create porous structures and the details of the process is shown below:
Figure 10: The process of modified sol-gel method [3]
After the acid-assisted sol-gel method, the pore volume increases:
Figure 11: Pore volume distribution [3]

14
Figure 11 shows that the pore volume of M-NCM-1 and 2, which are created by
the modified sol-gel method, is bigger than the control group (C-NCM).
Figure 12: Cyclic performance of NCM cells at a rate of 0.1 C. [3]
From figure 12, it can be seen that the M-NCM group has a larger capacity than
the control group(C-NCM). In conclusion, the acid-assisted sol-gel method can
improve the capacity of NCM333.
1.5.3 Method three: Coating Nano-sized SiO2
Through using a wet process with Nano-sized SiO2 powder, the cycling
performance of NCM622 cathode material and the thermal properties of NCM622
improve at a high temperature of 60C. The XRD pattern is showed below:

15
Figure 13: The XRD of a) P-NCM b) 0.5 wt. %, c) 1.0 wt. %, and d) 3.0 wt. %
SiO2 [12]
The XRD pattern shows the structural properties of powder NCM622, and
NCM622 with a coat of 0.5, 1.0, 3.0 wt. % SiO2. The peak of NCM622 coated with
SiO2 does not have any shift and there is no SiO2 peak showed on the pattern because
of the low amount. The surface of the particle can be observed by TEM.
Figure 14: TEM image of S-NCM [12]

16
Figure 14 shows the surface of NCM622 coated with SiO2. The Nano-sized SiO2
powder which attaches to the surface of NCM622 particle can reduce the direct contact
between the electrode and electrolyte and lead to good thermal properties[8].
Figure 15: Cycle performance at a high temperature of 60 C. [11]
Figure 15 shows the cycling performance of powder NCM622 (P-NCM), and
NCM622 coated with 0.5, 1.0, 3.0 wt. % SiO2. The capacities of NCM622 coated with
SiO2 are higher than the capacities of NCM622 without coating. In addition, from the
slope of capacity lines, the NCM622 coated with SiO2 has better cycling stability.

17
1.5.4 Method four: Changing the ratio of Ni, Co, and Mn
Figure 16: Phase diagram of LNO, LCO and LMO [13]
Figure 16 shows the phase diagram of the ternary system between LNO, LCO,
and LMO. With the increase of the LNO ratio, the capacity of NCM increases and the
process becomes safer. However, the Decrease of LCO can reduce the cost of the
cathode.
1.5.6 Conclusion
Several different methods have been applied to improve NCM cathode
electrochemical performance which will lead to larger capacities and better cycling
stabilities. First, creating a core-shell structure of NCM by NCA modification for
NCM613. Second, extending the surface of NCM333 by the porous structure. Third,
Coating them with Nano-sized SiO2.

18
CHAPTER 2: Experimental Methodology
Charging and discharging the NCM523 battery (201810#2) with current 1 C. After
350 cycles, the capacity of the battery is lower than 80% of the original capacity. This
end of life battery was disassembled in the glove box. Cathode materials are taken and
washed off from the current collector by using NMP for the recycling test. After drying
the EOL NCM cathode powder and testing the ICP result, the first step is to add LiOH
into the end of life NCM (201810#2). In this step, considering the evaporation of the
LiOH, different amounts of LiOH are added into the EOL NCM powder. Second, the
mixture is pressed into small pellets. Then the pelleted mixture is sintered at 850 °C for
12 hours in a tube furnace which is in oxygen or air condition. After 12 hours and before
the temperature decreases under 100 °C, the recycled NCM is moved into the glove box
in order to avoid moisture effect. Before making the slurry and testing EC performance,
I also test the XRD and SEM for measuring particle size and structure. All the measure
machine types are as shown below:
Table 3: Calibration machine name and type
Calibration machine type
Muffle furnace KSL-1100X, MTI corporation
Tube furnace OTF-1200X, MTI corporation
X-ray diffractometer Bruker, D2 PHASER
ICP Atomic Emission Spectrometer ICP-AES
SEM FEI Quanta 600 FEG

19
CHAPTER 3: Commercial material
Figure 17: The SEM images of (a) End of life NCM 201810#2, (b) Commercial
MTI NCM
Figure 17 shows the size of particles from the scanning electron microscope. The
particle sizes of NCM which are beyond their service lives are in the range of 5 to 20
µm and the particle sizes of sintered NCM are between 5 to 25 µm. Compared with
Commercial MTI NCM, the particle sizes of commercial NCM is larger than those
which are beyond their service lives. From the image (a), the crack structure may show
the deficiency of lithium in the EOL NCM Powder.
Figure 18: EC performance profile of commercial MTI NCM

20
Figure 18 shows the first circle EC performance profile and cycling performance
of each recycled powder at C/5 rate cycling between 2.75 - 4.2V for the MTI
commercial NCM 523 power, The first cycle charge capacity is 187.1 mAh/g and the
first cycle discharge capacity is 158.5mAh/g, so the first cycle capacity irreversibi lity
is 28.6mAh/g. After 2cycles, the charge and discharge capacities are stable (between
156-159 mAh/g).

21
CHAPTER 4: Results
4.1 Pellet-sinter at 850 °C for 12 hours in the air
4.1.1 Process conditions
The first step is to add LiOH into the end of life NCM (201810#2) Which Lix is
0.63. In this step, considering the evaporation of the LiOH, different amounts of LiOH
(37% of Li, 40% of Li and 43% of Li) are added into the EOL NCM powder. Since the
conditions of this group of experiments are pelleted mixture and sintering in air, three
low amounts of LiOH have been chosen because the pelleted mixture has less surface
which decreases the evaporation of the LiOH. Second, the mixture is pressed into small
pellets in order to decrease the evaporation of the LiOH and increases the contact
between LiOH particle and particle of the wasted NCM. Then the pelleted mixture is
sintered at 850 °C for 12 hours in a tube furnace settled in air condition. After 12 hours
and before the temperature decreases under 100 °C, the recycled NCM is moved into
the glove box in order to avoid moisture effect.

22
4.1.2 Partial size and structure analyze
Figure 19: The XRD patterns of End of life NCM ( EOL NCM), add 37% Li cycled
NCM, add 40% Li cycled NCM, add 43% Li cycled NCM, and MTI commercial
NCM(523) powder.
Figure 19 shows the XRD patterns of wasted NCM powder (201810#2), EOL NCM
powder with 37% of Li, 40% of Li, and 43% of Li which are pelleted and sintered at
850 °C for 12 hours in the air, and MTI commercial NCM (523) powder. The intens ity
ratio of peak 102/ peak 006 is higher for sintered NCM powder and commercial powder
compared with the EOL NCM. The small intensity ratio of peak 102/ peak 006 shows
Lithium’s deficiency in the crystal structure. Therefore, there is no distinct difference
between sintered NCM powder and commercial MTI powder. Figure 20 shows the
particle size from the scanning electron microscope. The size of the particle which is at
its end is in the range of 5 to 20 µm and the particle size of sintered NCM is between 5
to 25 µm. After sintering, the particle sizes increase a little bit. This crystal growth
usually leads to better electrochemical performance under a high C rate. Also from

23
image (a), the crack structure shows the deficiency of lithium in the EOL NCM Powder.
This situation cannot be found in sintered NCM, which means that the cycled process
recovers the broken structure of the wasted NCM.
Figure 20: The SEM images of (a) add 37%Li Sinter, (b) add 40%Li Sinter, (c)
add 43%Li Sinter

24
4.1.3 Electrochemical performance.
Figure 21: (a) The first circle EC performance profile of add 37% Li cycled NCM,

25
add 40% Li cycled NCM, add 43% Li cycled NCM, and MTI commercial
NCM(523) powder at C/5 rate cycling between 2.75 - 4.2V. (b)The cycling
performance of add 37% Li cycled NCM, add 40% Li cycled NCM, add 43% Li
cycled NCM, and MTI commercial NCM (523) powder at C/5 rate cycling between
2.75 - 4.2V
Figure 21 shows the first circle EC performance profile and cycling performance
of each recycled powder at C/5 rate cycling between 2.75 - 4.2V compared with the
commercial MTI NCM 523 powder. For the EC performance of the MTI commercia l
NCM 523 power, the first cycle charge capacity is 187.1 mAh/g and the first cycle
discharge capacity is 158.5mAh/g. So the first cycle capacity irreversibility is
28.6mAh/g. After 2cycles, the charge and discharge capacities become stable (between
156-159 mAh/g). The first cycle capacity irreversibility of cycled NCM with 37% of
Li is 35.6 mAh/g. The first cycle capacity irreversibility of cycled NCM with 40% of
Li is 29.3 mAh/g. The first cycle capacity irreversibility of cycled NCM with 43% of
Li is 25.3mAh/g. From the result, the first cycle capacity irreversibility of cycled NCM
with 40% of Li, and cycled NCM with 43% of Li is lower than the commercial materia ls.
In addition, the cycling capacities of cycled NCM with 43% of Li are similar to the
commercial NCM. For cycled NCM with 37% of Li, the charge and discharge
capacities are stable (between 143-145 mAh/g) after 2 cycles, which is lower than
commercial NCM powder. For cycled NCM with 40% of Li, the charge and discharge
capacities are stable (between 147-155 mAh/g) after 2 cycles, which is much similar to
the commercial NCM powder. For cycled NCM with 43% of Li, the charge and
discharge capacities are stable (between 151-155 mAh/g) after 2 cycles, which is
similar to the commercial NCM powder. In addition, it is concluded that after 100

26
cycles, the cycling performance of cycled NCM with 43% of Li is better than the
commercial NCM. After 100 cycles, the capacity of commercial NCM decrease hastily.
However, the capacity of cycled NCM with 43% of Li keeps around 150 mAh/g. It
means cycled NCM with 43% of Li has better life cycles than commercial NCM.

27
4.2 Pellet-sinter at 850 °C for 12 hours in the oxygen
4.2.1 Process conditions
The first step is to add LiOH into the end of life NCM (201810#2) Which Lix is
0.63. In this step, considering the evaporation of the LiOH, different amounts of LiOH
(37% of Li, 40% of Li, and 43% of Li) are added into the EOL NCM powder. Since the
capacities of these three groups coin cells are deficient. Groups of 46% of Li and 49%
of Li are tested. Therefore five different amounts of LiOH are added into the EOL NCM
powder. Second, the mixture is pressed into small pellets in order to decrease the
evaporation of the LiOH and increase the contact between LiOH particles and particles
of the wasted NCM. Then the pelleted mixture is sintered at 850 °C for 12 hours in a
tube furnace settled in oxygen condition. After 12 hours and before the temperature
decreases under 100 °C, the recycled NCM is moved into the glove box in order to
avoid moisture effect.

28
4.2.2 Partial size and structure analyze
Figure 22: The XRD patterns of End of life NCM ( EOL NCM), add 37% Li
cycled NCM, add 40% Li cycled NCM, add 43% Li cycled NCM, and MTI
commercial NCM(523) powder.
Form Figure 22. Shows the XRD patterns of wasted NCM powder (201810#2),
EOL NCM powder add 37% of Li, 40% of Li, 43% of Li which are pelleted and sintered
at 850 °C for 12 hours in the oxygen, and MTI commercial NCM(523) powder. The
intensity ratio of peak 102/ peak 006 is bigger for sintered NCM powder and
commercial powder compared with the EOL NCM. The small intensity ratio of peak
102/ peak 006 shows Lithium’s deficiency in the crystal structure. Therefore, there is
no distinct difference between sintered NCM powder and commercial MTI powder.
Figure 23 shows the particle size from the scanning electron microscope. The particle
size of the end of life is in the range of 5 to 20 µm and the particle size of sintered NCM
is between 5 to 25 µm. After sintering, the particle sizes increase a little bit. This crystal

29
growth usually leads to better electrochemical performance under a high C rate. Also
from image (a), the crack structure shows the deficiency of Lithium in the EOL NCM
Powder. This situation cannot be found in sintered NCM which means that the cycled
process recovers the broken structure of the end of life NCM.
Figure 23: The SEM images of (a) End of life NCM, (b) add 37%Li Sinter,(c) add
40%Li Sinter, (d) add 43%Li Sinter, (e) add 46%Li Sinter,(f) add 49%Li Sinter

30
4.2.3 Electrochemical performance.
Figure 24: (a) The first circle EC performance profile of add 37% Li cycled NCM,

31
add 40% Li cycled NCM, add 43% Li cycled NCM, add 46% Li cycled NCM, 49%
Li cycled NCM, and MTI commercial NCM(523) powder at C/5 rate cycling
between 2.75 - 4.2V. (b)The cycling performance of add 37% Li cycled NCM, add
40% Li cycled NCM, add 43% Li cycled NCM, add 46% Li cycled NCM, 49% Li
cycled NCM, and MTI commercial NCM (523) powder at C/5 rate cycling between
2.75 - 4.2V
Figure 24 shows the first circle EC performance profile and cycling performance
of each recycled powder at C/5 rate cycling between 2.75 - 4.2V compared with the
commercial MTI NCM 523 powder. For the EC performance of the MTI commercia l
NCM 523 power, the first cycle charge capacity is 187.1 mAh/g and the first cycle
discharge capacity is 158.5mAh/g. So the first cycle capacity irreversibility is
28.6mAh/g. After 2cycles, the charge and discharge capacities become stable (between
156-159 mAh/g). The first cycle capacity irreversibility of add 37% of Li cycled NCM
is 32 mAh/g. The first cycle capacity irreversibility of adding 40% of Li cycled NCM
is 30.9 mAh/g. The first cycle capacity irreversibility of adding 43% of Li cycled NCM
is 29.5 mAh/g. The first cycle capacity irreversibility of adding 46% of Li cycled NCM
is 26.2 mAh/g. The first cycle capacity irreversibility of adding 49% of Li cycled NCM
is 25 mAh/g. From the result, the first cycle capacity irreversibility of recycled NCM
is lower than the commercial martial. However, the cycling capacities of recycled NCM
is lower than commercial NCM. For add 37% of Li cycled NCM after 2 cycles, the
charge and discharge capacities are stable (between 136-138 mAh/g) which is much
lower than commercial NCM powder. For add 40% of Li cycled NCM after 2 cycles,
the charge and discharge capacities are stable (between 138-141 mAh/g) which is much
lower than commercial NCM powder. For adding 43% of Li cycled NCM after 2 cycles,

32
the charge and discharge capacities are stable (between 138-141 mAh/g) which is much
lower than commercial NCM powder. For adding 46% of Li cycled NCM after 2 cycles,
the charge and discharge capacities are stable (between 147-149 mAh/g) which is also
lower than commercial NCM powder. For adding 49% of Li cycled NCM after 2 cycles,
the charge and discharge capacities are stable (between 148-150 mAh/g) which is little
lower than commercial NCM powder the cycle performance will be compared after 150
cycles.

33
4.3 Powder-sinter at 850 °C for 12 hours in the air
4.3.1 Process conditions
The first step is to add LiOH into the end of life NCM (201810#2) Which Lix is 0.63.
In this step, considering the evaporation of the LiOH, different amounts of LiOH (43%
of Li, 46% of Li, and 49% of Li) are added into the EOL NCM powder because the
powder will not be pelleted compared with pelleted group tests. Therefore three
different amounts of LiOH are added into the EOL NCM powder. Second, the mixture
is not pressed into small pellets at this time. Then the mixture is sintered at 850 °C for
12 hours in a furnace settled in air condition. After 12 hours and before the temperature
decreases under 100 °C, the recycled NCM is moved into the glove box in order to
avoid moisture effect.

34
4.3.2 Partial size and structure analyze
Figure 25: The XRD patterns of End of life NCM (EOL NCM), add 43% Li cycled
NCM, add 46% Li cycled NCM, 49% Li cycled NCM, and MTI commercial
NCM523 powder.
Form Figure 25, it shows the XRD patterns of wasted NCM powder (201810#2),
EOL NCM powders add 43% of Li, and 46% of Li, and 46% of Li pelleted and sinter
at 850 °C for 12 hours in oxygen, and MTI commercial NCM523 powder. The intens ity
ratio of peak 102/ peak 006 is bigger for sintered NCM powder and commercial powder
comparing with the EOL NCM. The small intensity ratio of peak 102/ peak 006 shows
Lithium deficiency in the crystal structure. Therefore, there is no distinct difference
between sintered NCM powder and commercial MTI powder. Figure 26 shows the
particle size from the scanning electron microscope. The particle size of the end of life
is in the range of 5 to 20 µm, and the particle size of sintered NCM is between 5 to 25
µm. After sintering, the particle sizes increase a little bit. This crystal growth usually
leads to better electrochemical performance under a high C rate. Also, the crack

35
structure, which shows the lithium deficiency in the EOL NCM Powder cannot be found
in sintered NCM which means that the cycled process recover the broken structure of
the end of life NCM.
Figure 26: The SEM images of (a) End of life NCM, The SEM images of (a) End
of life NCM, (b) add 37%Li Sinter, (c) add 40%Li Sinter, (d) add 43%Li Sinter, (e)
add 46%Li Sinter, (f) add 49%Li Sinter

36
4.3.3 Electrochemical performance.
Figure 27: (a) The first circle EC performance profile of add 43% Li cycled NCM,

37
add 46% Li cycled NCM, 49% Li cycled NCM, and MTI commercial NCM (523)
powder at C/5 rate cycling between 2.75 - 4.2V. (b)The cycling performance of add
43% Li cycled NCM, add 46% Li cycled NCM, 49% Li cycled NCM, and MTI
commercial NCM (523) powder at C/5 rate cycling between 2.75 - 4.2V
Figure 27 shows the first circle EC performance profile and cycling performance of
each recycled powder at C/5 rate cycling between 2.75 - 4.2V compared with the
commercial MTI NCM 523 powder. For the EC performance of the MTI commercia l
NCM 523 power, the first cycle charge capacity is 187.1 mAh/g, and the first cycle
discharge capacity is 158.5mAh/g. So the first cycle capacity irreversibility is
28.6mAh/g. After 2cycles, the charge and discharge capacities become stable (between
156-159 mAh/g). The first cycle capacity irreversibility of adding 43% of Li cycled
NCM is 46 mAh/g. The first cycle capacity irreversibility of adding 46% of Li cycled
NCM is 41.4 mAh/g. The first cycle capacity irreversibility of adding 49% of Li cycled
NCM is 42.9 mAh/g. From the result, the first cycle capacity irreversibility of recycled
NCM is much larger than the commercial martial. And the cycling capacities of
recycled NCM is also lower than commercial NCM. For adding 43% of Li cycled NCM
after 2 cycles, the charge and discharge capacities are stable (between 107-112 mAh/g)
which is much lower than commercial NCM powder. For adding 46% of Li cycled
NCM after 2 cycles, the charge and discharge capacities are stable (between 121-124
mAh/g) which is also higher than adding 46% of Li cycled NCM but still much lower
than commercial NCM materials. For adding 49% of Li cycled NCM after 2 cycles, the
charge and discharge capacities are stable (between 121-123 mAh/g) which is also
much lower than commercial NCM materials.

38
4.4 Powder-sinter at 850 °C for 12 hours in the oxygen
4.4.1 Process conditions
In this group of the test, the process is similar to the previous test. The only
difference is that the mixture is not pelleted before sintering. The whole process is as
shown below: the first step is to add LiOH into the end of life NCM (201810#2) Which
Lix is 0.63. Since in the previous test, the EC performance results of adding 37% of Li
and 40% of Li are very low. Moreover, comparing two test conditions, un-pelleted
mixture should have more evaporation of the LiOH than the pelleted mixture. Adding
43% of Li becomes the start level. Therefore, three different amounts of LiOH are added
into the EOL NCM powder (add 43% of Li, add 46% of Li and add 49% of Li). Second,
the un-pelleted mixture is sintered at 850 °C for 12 hours in the tube furnace settled in
oxygen condition. After 12 hours and before the temperature decreases under 100 °C,
the recycled NCM is moved into the glove box to avoid moisture effect.

39
4.4.2 Partial size and structure analyze
Figure 28: The XRD patterns of End of life NCM ( EOL NCM) add 43% Li cycled
NCM, add 46% Li cycled NCM, 49% Li cycled NCM, and MTI commercial
NCM(523) powder
Figure 28 shows the XRD patterns of end of life NCM powder (201810#2), EOL
NCM powder adds 43% of Li, 46% of Li, and 49% of Li which are un-pelleted and
sintered at 850 °C for 12 hours in oxygen, and MTI commercial NCM(523) powder.
The intensity ratio of peak 102/ peak 006 is bigger for sintered NCM powder and
commercial powder comparing with the EOL NCM. The small intensity ratio of peak
102/ peak 006 shows Lithium deficiency in the crystal structure. Therefore, there is no
distinct difference between sintered NCM powder and commercial MTI powder. Form
Figure 29, it shows the particle size from the scanning electron microscope. The particle
size of the end of life is in the range of 5 to 20 µm and the particle size of sintered NCM
is between 10 to 25 µm. After sintering, the particle sizes increase a little bit. This

40
crystal growth usually leads to better electrochemical performance under a high C rate.
Also from image (a), the crack structure shows the lithium’s deficiency in the EOL
NCM Powder. This situation cannot be found in sintered NCM which means that the
cycled process recover the broken structure of wasted NCM.
Figure 29: The SEM images of (a) Sintered NCM43%, (b) Sintered NCM46% , (c)
Sintered NCM49%

41
4.4.3 Electrochemical performance.
Figure 30: (a) The first circle EC performance profile of 43% Li cycled NCM,
add 46% Li cycled NCM, 49% Li cycled NCM, and MTI commercial NCM(523)
powder at C/5 rate cycling between 2.75 - 4.2V. (b)The cycling performance of

42
add 43% Li cycled NCM, add 46% Li cycled NCM, 49% Li cycled NCM, and
MTI commercial NCM (523) powder at C/5 rate cycling between 2.75 - 4.2V
Figure 30 shows the first circle EC performance profile and cycling performance
of each recycled powder at C/5 rate cycling between 2.75 - 4.2V compared with the
commercial MTI NCM 523 powder. For the EC performance of the MTI commercia l
NCM 523 power, the first cycle charge capacity is 187.1 mAh/g and the first cycle
discharge capacity is 158.5mAh/g. So the first cycle capacity irreversibility is
28.6mAh/g. After 2cycles, the charge and discharge capacities are stable (between 156-
159 mAh/g). The first cycle capacity irreversibility of adding 43% of Li cycled NCM
is 29.5 mAh/g. The first cycle capacity irreversibility of adding 46% of Li cycled NCM
is 26.4 mAh/g. The first cycle capacity irreversibility of adding 49% of Li cycled NCM
is 36 mAh/g. From the result, the first cycle capacity irreversibility of adding 43% of
Li cycled NCM and add 46% of Li cycled NCM is lower than the commercial martial.
Moreover, the first cycle capacity irreversibility of adding 49% of Li cycled NCM is
higher than the commercial martial. However, For adding 49% of Li cycled NCM after
2 cycles, the charge and discharge capacities are stable (between 155-159 mAh/g)
which is the same as commercial NCM material and after 100 cycles, the capacity of
adding 49% of Li cycled NCM is larger than Commercial NCM. It means after 100
cycles cycling performance of add 49% of Li cycled NCM is better than Commercia l
NCM. For the other two recycled NCM, adding 43% of Li cycled NCM after 2 cycles,
the charge and discharge capacities are stable (between 128-131 mAh/g) which is much
lower than commercial NCM powder. For adding 46% of Li cycled NCM after 2 cycles,

43
the charge and discharge capacities are stable (between 142-144 mAh/g) which is also
lower than commercial NCM material.

44
CHAPTER 5: Conclusion
From the results of four groups of tests, all the partial sizes and structures become
better compared with the waste NCM523 after lithium adding and sintering process.
The EC performance shows that the recycled NCM has a better performance, which is
close to commercial NCM under two conditions. The first condition is pellet-sinter at
850 °C for 12 hours in oxygen. And the second condition is the pellet-sinter at 850 °C
for 12 hours in the air. For the first condition, after pelleted mixture (49% of Li added)
was burned at 850 °C for 12 hours in oxygen, the charge and discharge capacities are
stable (between 148-150 mAh/g), which is close to theoretical capacity and capacity of
commercial MTI NCM 523 powder. The cycling performance will be checked in the
future. For the second condition, after the pelleting mixture (43% of Li added) was
burned at 850 °C for 12 hours in the air, the charge and discharge capacities are stable
(between 151-155 mAh/g), which is similar to the commercial NCM powder. In
addition, we can find that after 100 cycles, the cycling performance of recycled NCM
with 43% of Li is better than the commercial NCM. The capacity of commercial NCM
decrease hastily. However, the capacity of recycled NCM with 43% of Li keeps around
150 mAh/g after 100 cycles. It means that recycled NCM with 43% of Li has better life
cycles than the commercial NCM. It can also be concluded sintered products with
deficiencies of lithium have lower capacity. Powder-sintering products have a lower
capacity than pellet sintering products with small-scale sintering because of higher
lithium evaporation. Air-sintering products have a higher capacity than O2-sintering

45
products, which means that the atmosphere does not improve the EC performance in
small – scale sintering. In the future, I will try to recycle on large scale sintering under
different conditions and try to recycle different types of NCM.

46
References
[1] G. E. Blomgren, “The Development and Future of Lithium Ion Batteries,” Journal of The
Electrochemical Society, vol. 164, no. 1, pp. A5019–A5025, 2017.
[2] A. Yoshino, “Development of the Lithium-Ion Battery and Recent Technological Trends,”
in Lithium-ion batteries, Elsevier, pp. 1-20, 2014.
[3] Z.-D. Huang, X.-M. Liu, S.-W. Oh, B. Zhang, P.-C. Ma, and J.-K. Kim, “Microscopically
porous, interconnected single crystal LiNi1/3Co1/3Mn1/3O2 cathode material for Lithium
ion batteries,” J. Mater. Chem., vol. 21, no. 29, pp. 10777–10784, Jul. 2011.
[4] L. Gaines, S. John, B. Andrew, and I. Belharouak. “Life-cycle analysis for lithium-ion
battery production and recycling.” In Transportation Research Board 90th Annual
Meeting, Washington, DC, pp. 23-27, 2011.
[5] A. Vezzini, “Manufacturers, materials and recycling technologies.” In Lithium-Ion
Batteries, pp. 529-551. Elsevier, 2014.
[6] J. Heelan et al., “Current and Prospective Li-Ion Battery Recycling and Recovery
Processes,” JOM, vol. 68, no. 10, pp. 2632–2638, Oct. 2016.
[7] B. Yazicioglu, J. Tytgat, “Life cycle assessments involving Umicore’s battery recycling
process,” DG Environment–Stakeholder Meeting, 2011.
[8] C. O. Vadenbo, “Prospective environmental assessment of lithium recovery in battery
recycling,” ETH IED-NSSI, pp. 19-38, 2009.
[9] D. Cheret, S. Santen, “Battery Recycling,” US Patent, US 7169206 B2, 2007.
[10] T. Zenger, A. Krebs, H. Deutekom, “Method of and Apparatus for Dismantling and
Storage of Objects Comprising Alkali Metals such as Alkali Metal Containing Batteries,”
US Patent, US 7833646 B2, 2010.
[11] G.-W. Yoo, B.-C. Jang, and J.-T. Son, “Novel design of core shell structure by NCA
modification on NCM cathode material to enhance capacity and cycle life for lithium
secondary battery,” Ceramics International, vol. 41, no. 1, pp. 1913–1916, Jan. 2015.
[12] W. Cho et al., “Improved electrochemical and thermal properties of nickel rich
LiNi0.6Co0.2Mn0.2O2 cathode materials by SiO2 coating,” Journal of Power Sources, vol.
282, pp. 45–50, May 2015.
[13] F. Schipper, E. M. Erickson, C. Erk, J.-Y. Shin, F. F. Chesneau, and D. Aurbach,
“Review—Recent Advances and Remaining Challenges for Lithium Ion Battery
Cathodes I. Nickel-Rich, LiNixCoyMnzO2,” J. Electrochem. Soc., vol. 164, no. 1, pp.
A6220–A6228, Jan. 2017.