director networks, information environment, and corporate … · 2020-03-18 · 1 1. introduction...
TRANSCRIPT

Director Networks, Information Environment, and Corporate Investment
Rebecca N. Hann
Robert H. Smith School of Business
University of Maryland
Musa Subasi
Robert H. Smith School of Business
University of Maryland
Yue Zheng
School of Business and Management
The Hong Kong University of Science and Technology
Marcy 2019
Abstract
We explore whether director connections improve the efficiency of a firm’s investment decisions
by enhancing its external information environment. We find that board connectedness is
negatively associated with the extent of under- and overinvestment. The effect of board
connectedness on underinvestment is stronger for firms characterized by greater financial
constraints, higher demand for external capital, lower financial reporting quality, and less analyst
following, while the effect of board connectedness on overinvestment is stronger for firms
subject to greater monitoring by external stakeholders and higher agency costs. These findings
suggest that director networks serve as an information intermediary that provides important
information to external capital providers and monitors, thereby mitigating underinvestment
arising from capital constraints and overinvestment arising from agency problems.
Keywords: Director networks; information environment; investment efficiency; information
asymmetry; agency costs.
JEL Classifications: G3, G14, L14, G31
We would like to thank Ferhat Akbas, David Erkens, Gilles Hilary, Fikret Polat, and workshop participants at the
University of Maryland, the 2017 Washington Area Accounting Conference, and the 2018 Carnegie Mellon
University Summer Slam Conference for their valuable comments.

1
1. Introduction
Director networks serve as a conduit of information exchange and knowledge sharing
among corporate board members. Prior studies suggest that director networks can affect
corporate decisions by influencing the firm’s internal information set (e.g., Haunschild and
Beckman, 1998; Beckman and Haunschild, 2002). However, the flow of information in the
network is not unidirectional—important information about the firm can also be transmitted from
the firm’s corporate directors to external market participants such as short sellers, mutual fund
managers, and sell-side analysts (e.g., Cohen et al., 2008, 2010; Akbas et al., 2016;). A natural
question that arises is: Does this outflow of information affect the quality of managers’ corporate
decisions by influencing the firm’s external information environment? In this paper, we shed
light on this question by examining the effect of boardroom connections on corporate investment
efficiency.
Ex-ante, whether boardroom connections have a significant effect on a firm’s external
information environment, or how such an effect should influence the firm’s investment
efficiency, is unclear. On the one hand, ample empirical evidence suggests that both public and
private information travels through director networks. To the extent that boardroom connections
enhance a firm’s external information environment, these connections may improve investment
efficiency through two channels. First, by facilitating the transmission of private information to
outside stakeholders, board connections can reduce information asymmetry between the firm and
its external capital providers and thereby mitigate the underinvestment problem arising from
capital constraints. Second, by improving the information sets of external monitors such as
institutional investors and analysts, board connections can improve these monitors’ ability to

2
assess the firm’s investment opportunities and oversee managerial investment decisions, and
thereby, curb the overinvestment problem caused by managerial entrenchment.
On the other hand, corporate directors have a duty of confidentiality and may suffer
potential legal and reputational consequences for revealing sensitive firm information to
outsiders, which implies that the extent to which value-relevant information is transmitted to
outsiders may be limited. Moreover, sensitive firm information may be revealed to only certain
groups of outsiders through the boardroom network, which could result in increased information
asymmetry among investors. For example, Akbas et al. (2016) show that for firms with more
connected directors, the trades of sophisticated investors such as short sellers, option traders, and
financial institutions reveal a higher degree of informedness. To the extent that only a subset of
investors are privy to the private information transmitted in the network, boardroom connections
may lead to greater adverse selection, which can exacerbate underinvestment for capital-
constrained firms. In addition, information transmitted through director networks may be
miscommunicated, misleading, or incorrect, in which case such information may not always be
useful to external investors and monitors. Thus, whether director connections can increase
investment efficiency by improving a firm’s external information environment is a priori unclear.
In this paper, we address this question by exploring the separate effects of director
connections on under- and overinvestment. Identifying the different effects of boardroom
connections on under- and overinvestment is important because the factors that drive
underinvestment are quite different from those that drive overinvestment. In particular, firms
tend to underinvest for reasons related to financial constraints, while they tend to overinvest for
reasons related to agency problems (e.g., Jensen 1986, 2005; Stulz, 1990; Harford, 1999; Biddle
et al., 2009). These different determinants of under- and overinvestment allow us to study the

3
information and monitoring roles of director networks and formulate two sets of hypotheses.
First, we predict that if board connections reduce information asymmetry by facilitating
information flow to external capital providers, then the extent of underinvestment should be
lower for more connected firms, with this effect stronger for firms that are more financially
constrained and for firms with a weaker external information environment. Second, we predict
that if board connections mitigate agency problems by enhancing monitoring from external
monitors (e.g., institutional investors), then the extent of overinvestment should be lower for
more connected firms, with this effect stronger for firms with higher agency costs and for firms
with a greater presence of external monitors.
We test these hypotheses using a panel of U.S. firms over the period 2000-2015. To
capture board connectedness, we use the total number of first-degree links to outside boards, a
measure that is widely used in the social network literature (e.g., Salk and Brannen, 2000;
Larcker et al., 2013; Chuluun et al., 2014).1 Investment inefficiency is defined as the extent to
which firm investment deviates from the level predicted given the firm’s investment
opportunities (Brennan, 2003). Accordingly, we follow prior studies (e.g., Biddle et al., 2009;
Chen et al., 2011) and measure investment inefficiency as the absolute value of the difference
between actual investment and the expected level of investment given the firm’s investment
opportunities, with a positive (negative) difference reflecting overinvestment (underinvestment).
We begin our analysis by exploring the effect of board connectedness on investment
efficiency for the “underinvestment” sample. We find that investment is significantly more
1 We use first-degree director connections as our primary measure of board connectedness in part because it allows
us to retain a larger number of observations in our sample. Also, for information flowing from the firm to external
market participants, higher-degree connections may result in the transmission of more noisy information about the
firm, and hence may play less of a role in enhancing a firm’s external information environment. Nevertheless, we
employ three alternative measures of connectedness used in the social network literature, namely, CLOSENESS,
BETWEENESS, and EIGENVECTOR, in our main tests. See Section 3.2.2 for a more detailed discussion.

4
efficient for firms with more connected boards, controlling for various factors previously shown
to affect investment efficiency (e.g., financial reporting quality, institutional ownership, and
financial slack). In particular, investment efficiency is 13% higher when we move from the firms
in the highest connectedness decile to those in the lowest decile, ceteris paribus, which points to
an economically significant effect of board connectedness on the efficiency of capital outlays.
While the negative association between board connectedness and the degree of
underinvestment is consistent with boardroom connections improving investment efficiency, the
exact mechanism is unclear. This result could be driven by board connectedness enhancing a
firm’s external information environment, which improves access to external capital due to
reduced information asymmetry between the firm and external capital providers, or by
boardroom connections enhancing a firm’s internal information environment (e.g., through the
board’s advising role), which allows managers to make more informed decisions.2 We conjecture
that if the reduction in underinvestment for more connected firms is driven at least in part by the
first channel (i.e., the “external information channel”), the effect should be stronger for more
financially constrained firms. Consistent with this conjecture, we find that the effect of
connectedness on underinvestment is stronger for financially constrained firms (as captured by
the Whited-Wu index, the Hadlock-Pierce size and age index, and the absence of an S&P debt
rating). We further examine whether the effect of board connectedness on underinvestment
varies with firms’ need for external capital. We find that the effect of connectedness on
underinvestment is stronger for firms with greater demand for external equity financing (as
captured by Rajan and Zingales’ (1998) measures of external capital needs).
2 Although we control for measures of managers’ information quality in our multivariate analysis, our results may be
driven in part by board connectedness improving managers’ information set.

5
To shed additional light on the external information channel, we examine how the effect
of board connectedness on underinvestment varies with the strength of other information sources
that affect the firm’s external information environment. Prior research finds that high-quality
financial reporting and analyst coverage reduce information asymmetry and facilitate efficient
investment. If director connections serve as an alternative source of information, their effect on
underinvestment should be weaker to the extent that capital providers benefit from other
information mechanisms in place. Consistent with this conjecture, we find that the effect of
connectedness on underinvestment is less pronounced for firms with higher financial reporting
quality and more analyst following, which suggests that director networks serve as a substitute
for other external information mechanisms.
We also explore whether the information transmitted to external capital providers comes
primarily from directors’ connections to banks. To do so, we construct a measure of
connectedness that focuses on connections to financial institutions. We find that, directors’
connections to banks have no incremental effect on the extent to which firms underinvest after
controlling for the total number of interlocks, suggesting that the effect of board connectedness
on underinvestment is not an artifact of directors’ connections to financial institutions. Taken
together, our findings are consistent with director networks serving as an important information
intermediary that enhances a firm’s external information environment, which mitigates
underinvestment arising from information asymmetry.
Next, we explore the effect of board connectedness on investment efficiency for the
“overinvestment” sample. In univariate analyses, we find a negative and statistically significant
association between board connectedness and the degree of overinvestment. In multivariate
analyses, however, the negative association becomes statistically insignificant. The absence of a

6
significant effect could be driven by board connectedness having offsetting effects on investment
efficiency for firms with different characteristics. Specifically, as we discuss above, while board
connectedness may improve a firm’s external information environment, which should increase
the monitoring effectiveness of other external stakeholders, boardroom connections may
negatively affect the board’s own monitoring. Indeed, prior research shows that boards with
social ties to their CEOs have greater advisory ability but lower monitoring efficiency (e.g.,
Schmidt, 2015; Hwang and Kim, 2009). Barnea and Guedj (2009) further argue that when
directors are not connected, they work to build their reputation by providing superior monitoring,
whereas when they are highly connected, they provide softer monitoring as they feel that their
status in the network is secure. To shed light on whether the information transmission role of
boardroom connections enables external stakeholders to become better monitors of managerial
actions, we conduct two sets of cross-sectional tests.
First, we examine whether the effect of board connectedness on overinvestment varies
with the degree of external monitoring. If director networks transmit information that is
incrementally useful to external monitors, board connectedness should have a more pronounced
effect on overinvestment for firms with greater external monitoring. In contrast, if board
connectedness is a substitute for other forms of external monitoring, then its effect on
overinvestment should be weaker for firms with greater external monitoring. We find that well-
connected firms with higher institutional ownership and analyst coverage are less likely to
overinvest. This result suggests that the external information effect of director networks
improves the monitoring effectiveness of external stakeholders and thereby curbs overinvestment
from entrenched managers.

7
Second, we examine whether the effect of board connectedness on overinvestment is
stronger for firms that have higher agency costs. Following prior theory and evidence on the
agency costs of free cash flow and overvalued equity (Jensen, 1986, 2005; Moeller,
Schlingemann, and Stulz, 2005; Fu, Lin, and Officer, 2013), we capture agency costs using two
measures, namely, excess cash holdings and stock overvaluation.3 We find that well-connected
firms with higher excess cash holdings or overvalued equity are less likely to overinvest
compared to their less-connected counterparts. Taken together, our results suggest that
boardroom connections provide value-relevant information to external monitors, which helps
mitigate overinvestment arising from agency problems.
Our causal inference based on the relationship between board connectedness and
investment efficiency may suffer from the endogenous nature of board connectedness. First, it is
possible that an omitted or unobservable firm characteristic that drives both investment
efficiency and board connectedness results in a spurious correlation between these two variables.
For example, more prestigious firms or firms with higher-quality managers may make more
efficient capital outlay decisions, and at the same time attract more connected directors to serve
on the board.4 Second, it is possible that our results suffer from reverse-causality, whereby firms
that make more efficient investment decisions recruit more connected directors to benefit from
these directors’ access to information and resources. We conduct four sets of tests to address
these endogeneity concerns. First, we control for various measures of managerial quality such as
management forecast accuracy and the ratio of insider stock transactions to total transactions. We
3 Consistent with Jensen’s (2005) theory on the agency costs of overvalued equity, Fu et al. (2013) find that
overvalued acquirers significantly overpay for their targets. Similarly, Moeller, Schlingemann, and Stulz (2005) find
that bidders in large loss deals have significantly larger market-to-book ratios. These findings suggest that
overvalued acquirers engage in value-destroying acquisitions. 4 Consistent with this idea, Masulis and Mobbs (2014) find that directors who serve on multiple boards allocate their
time and effort to each firm based on the firm’s relative prestige.

8
continue to find similar results. Second, as in Larcker et al. (2013) and Schabus (2018), we
restrict our sample to firms whose board composition remains unchanged from the prior year to
the current year, which ensures that any change in board connectedness stems from exogenous
changes in a given board member’s outside directorships. When we rerun our main analyses with
this restricted sample, we continue to obtain similar results. Third, we include firm fixed effects
to control for time-invariant firm-specific unobservable or omitted factors. We again obtain
similar results. Finally, as in Larcker et al. (2013), we examine the relationship between board
connectedness in a given year and lagged changes in investment efficiency. We find no evidence
of an association between prior investment efficiency and current board connectedness. These
tests help corroborate our causal inference that board connectedness results in more efficient
investment decisions.
Our paper makes several contributions to the literature. First, our study adds to the
growing literature on the effect of director networks on corporate decisions and firm value (e.g.,
Larcker et al., 2013; Akbas et al., 2016; Schabus, 2018) by uncovering a new channel through
which director networks can have real effects and enhance firm value. Specifically, our results
suggest that director connections, by enhancing a firm’s external information environment, can
lead to more efficient investment decisions. Second, prior studies that explore the role of
boardroom connections as a source of information focus primarily on the flow of information
from the network to the firm (e.g., Haunschild and Beckman, 1998; Beckman and Haunschild,
2002). Our paper extends this work by establishing that the flow of information in the director
network is not unidirectional. In particular, we show that real benefits derive from the flow of
information from the firm to external market participants. Third, our paper complements the
growing literature on the effect of the information environment on investment efficiency (e.g.,

9
Biddle et al., 2009; Chen et al., 2011, Shroff et al., 2014). Our findings suggest that director
networks have a significant effect on the firm’s external information environment, and in turn
investment efficiency, that is incremental to the effect of analyst coverage and financial reporting
quality. Moreover, our cross-sectional results indicate that director networks represent an
important channel of information exchange that serves as a substitute for other information
intermediaries such as analysts, and that choosing a well-connected board may be an effective
way to improve a firm’s external information environment.
The rest of the paper is organized as follows. Section 2 provides a brief discussion of the
prior literature and motivates our analyses. Section 3 describes our sample, variables, and
research design. Sections 4 and 5 present our main empirical results. In section 6 we discuss
additional analyses and robustness tests. Finally, section 7 concludes.
2. Related Literature and Motivation
Corporate directors build valuable experience and knowledge over the years serving as
board members and possess a wealth of firm-, industry-, and market-related information.
Connections with corporate officers serving on various boards provide channels through which
directors could exchange information and resources, form new relationships, and leverage
existing ones (Larcker et al. 2013). Several studies examine the effect of director networks on
firms’ internal information environment and the quality of various corporate decisions. For
example, Beckman and Haunschild (2002) show that firms pay lower premiums and engage in
better performing acquisitions when they are connected to other firms that have heterogeneous
prior acquisition experience. Larcker et al. (2013) highlight the role of director networks as a
channel through which firms share information and resources and show that firms with well-
connected boards earn superior stock returns. Similarly, Schabus (2018) argues that better access

10
to information and resources enables well-connected firms to make higher quality planning and
forecasting. Collectively, the results in these studies highlight the role of director networks as a
channel through which managers become informed about other firms’ practices and use that
information in their strategic decisions.
The effect of director networks on firms’ internal information environment
notwithstanding, the findings in nascent research point to the possibility that the information in
director networks could flow to external market participants, which in turn could have an impact
on the firm’s external information environment. For example, Cohen, Frazzini, and Malloy
(2010) show that sell-side analysts gain comparative information advantages through their
educational ties with senior officers and board members of firms that they cover. In a similar
vein, Akbas et al. (2016) show that sophisticated traders such as short sellers, option traders, and
institutional investors execute more profitable trades in the stocks of firms whose boards have
more connected directors. The results in these studies highlight the role of director networks as a
mechanism that could alter a firm’s external information environment. However, it is unclear ex-
ante whether the impact of director networks on firm’s external information environment is
beneficial or detrimental to the wealth of existing stakeholders. We shed light on this question by
examining the effect of director networks on investment efficiency.
A large body of prior work has examined the impact of various economic and
institutional forces on the efficiency of corporate investment (e.g., Love 2003; Chen et al. 2011;
Bae et al. 2017). Most related to our study is the stream of literature on the effects of the firm’s
external information environment on the quality of firms’ investment decisions. Using various
measures of accounting quality, Biddle and Hilary (2006) show that higher-quality accounting
enhances the efficiency of investment decisions. Further refining the notion of investment

11
efficiency, Biddle et al. (2009) show that higher-quality financial reporting reduces both over-
and underinvestment. Chen et al. (2011) use a sample of private firms from emerging markets
and document a significant effect of financial reporting quality on investment efficiency.
Goodman et al. (2014) show that the quality of manager’s earnings forecasts, an externally
available measure of managers’ forecasting ability is associated with better performing
acquisitions and more efficient fixed capital investments. Further, aspects of financial reporting
behavior such as accounting conservatism (Lara, Osma, and Penalva, 2016), financial
misreporting (McNichols and Stubben 2008), and the disclosure of material internal control
weaknesses (Cheng, Dhaliwal, and Zhang 2013) affect the quality of corporate investment
decisions. Finally, a battery of studies investigates how information quality affects capital
allocation efficiency and economic growth in the international setting. For example, Shroff et al.
(2014) find that the investment decisions of foreign subsidiaries in country-industries with more
transparent information environments are more responsive to local growth opportunities.5
A priori the predictions on how board connectedness affects a firm’s external
information environment and, in turn, its investment efficiency are mixed. On the one hand, if
director networks enhance a firm’s external information environment and facilitate better access
to relevant firm-specific information for capital providers, then they should have a positive
impact on investment efficiency by reducing the extent of both under- and overinvestment. With
respect to underinvestment, the effect of board connectedness on investment efficiency likely
stems from director networks reducing the information asymmetry between the firm and its
capital providers. Hence, the information risk perceived by capital providers should be lower for
firms with well-connected boards compared to otherwise similar firms and, therefore, board
connectedness should mitigate the underinvestment problem arising from financial constraints.
5 Other related studies include Francis, Huang, Khurana, and Pereira (2009), and Li and Shroff (2010).

12
Similarly, for firms that otherwise would overinvest, connected boards could facilitate
information transmission to external monitors (e.g., institutional investors and analysts) and
enable them to become more effective monitors of corporate investment, which in turn should
mitigate the overinvestment that arises due to agency problems.
On the other hand, the information spread through director networks may be
miscommunicated, incorrect, or misleading (Larcker et al. 2013) and may not possess the two
fundamental qualitative characteristics of decision useful information—relevance and faithful
representation—to enhance the information environment of the firm and affect capital providers’
decisions.6 Moreover, boardroom connections have been instrumental in the diffusion of various
negative corporate practices such as option backdating (Bizjak et al., 2009), poison pill adoptions
(Davis 1991), and earnings management (Chiu et al., 2013), all of which could have a
detrimental effect on the firm’s external information environment upon revelation.7
For privately disseminated information, such as that transmitted through director
networks, there is the added issue of how widely disseminated the information is (i.e., are less
connected investors at an information disadvantage relative to those who can tap on the director
networks). The results in Cohen et al (2010) and Akbas et al. (2016) suggest that firm-specific
information is transmitted to select groups of investors or information intermediaries. If frictions
in financial markets prevent these agents from signaling their private information to other
stakeholders, then boardroom connections may lead to adverse selection, which can exacerbate
underinvestment for capital-constrained firms. Given these opposing arguments, whether director
6 Statement of Financial Accounting Concepts No. 8 (September 2010). 7 Other studies on interfirm mimetic behavior have shown that firms with shared directors have more similar
governance structures (Bouwman, 2011), similar effective tax rates (Brown and Drake, 2014), and are more likely to
follow tied firms’ when switching stock exchanges (Rao, Davis, and Ward 2000).

13
networks improve firms’ external information environment and, in turn, the efficiency of
investment decisions is ultimately an empirical question.
3. Sample Selection, Variable Construction, and Research Design
3.1. Sample
Our sample begins with all firms covered in the BoardEx database over the period from
2000 to 2015. We exclude firms in the financial industries (SIC code 6000 – 6999) and utility
industries (SIC code 4900 – 4999) and drop firm-year observations with less than $1 million
book value of assets. Financial information is from Compustat, analyst forecast data are from
I/B/E/S, and institutional ownership data are from Thomson Reuters 13f filings. We require a
minimum of 20 observations in each industry-year to construct our investment efficiency
variables. After conducting these screening procedures and merging with various datasets, our
final sample includes 29,432 firm-year observations covering 3,830 unique firms operating in 39
industries based on the Fama and French 48 industry portfolios.
3.2. Variable Construction
3.2.1. Investment (in)efficiency
We follow prior studies (Biddle et al. 2009; Chen et al. 2011; Chen et al. 2013) and
measure investment (in)efficiency by estimating a parsimonious model of investment that
captures the extent to which a firm deviates from the expected investment level. Specifically,
using sales growth in a given year as a proxy for a firm’s growth opportunities, we estimate the
following model:
𝐼𝑁𝑉𝐸𝑆𝑇𝑀𝐸𝑁𝑇𝑖,𝑡+1 = 𝛼0 + 𝛼1𝑆𝐴𝐿𝐸𝑆_𝐺𝑅𝑖,𝑡 + 𝜀𝑖,𝑡+1, (1)
where 𝐼𝑁𝑉𝐸𝑆𝑇𝑀𝐸𝑁𝑇𝑖,𝑡+1 is firm i’s total investment in year t+1, calculated as the sum of
capital expenditures, research and development expenditures, and acquisition expenditures less

14
cash receipts from the sale of property, plant, and equipment and divided by lagged total assets.
For easier presentation, we follow Biddle et al. (2009) and multiply 𝐼𝑁𝑉𝐸𝑆𝑇𝑀𝐸𝑁𝑇𝑖,𝑡+1 by 100.
𝑆𝐴𝐿𝐸𝑆_𝐺𝑅𝑖,𝑡 is the percentage change in firm i’s sales between year t-1 and t. The model is
estimated within each Fama and French 48 industry portfolio with at least 20 observations in a
given year.
The residuals from Equation (1) capture the deviation from the predicted investment level
and are used to measure firm investment (in)efficiency. We classify firms with negative
(positive) residuals in a given year as underinvesting (overinvesting) firms. INVEST_INEFF is
defined as the absolute value of the residuals from Equation (1), and higher values of that
variable reflect a larger degree of under- or overinvestment.
3.2.2. Board Connectedness
To measure director connectedness, we follow prior research (e.g., Larcker et al., 2013;
Chuluun et al. 2014; Bajo et al. 2016) and examine four dimensions of well-connectedness
established in the social networks literature.8 Our primary measure, DEGREE, captures the total
number of first-degree links to outside boards. Intuitively, a board is better connected if its
directors have more direct links with individuals in outside boards. The second measure,
CLOSENESS, captures how easily or quickly a board can reach an outside board through
interlocking directorates. It is measured as the inverse of the average distance between a board
and an outside board. The third measure, BETWEENESS, captures how well-situated a board is
in terms of the network paths it lies on. It is defined as the average proportion of paths between
two other outside boards on which a board lies. The fourth measure, EIGENVECTOR, captures
how connected a board is based on its direct contacts. It is measured by the eigenvector of the
8 We only provide a brief description of the four measures of connectedness in this section. For a more detailed
discussion on the constructions of these measures please refer to Larcker et al. (2013).

15
matrix formed by assigning 1(0) to its elements if a board is (not) directly connected to another
board.
3.3. Research Design
To test our main hypotheses, we estimate the following equations separately for the
underinvestment and overinvestment subsamples. This research design allows us to separately
examine whether connectedness affects both and is consistent with the prior literature (Chen et
al. 2011; Chen et al. 2013; Biddle et al. 2009).9
𝐼𝑁𝑉𝐸𝑆𝑇_𝐼𝑁𝐸𝐹𝐹𝑖,𝑡+1 = 𝛽0 + 𝛽1𝐶𝑂𝑁𝑁𝐸𝐶𝑇𝑖,𝑡 + 𝛽2𝐶𝑂𝑁𝑇𝑅𝑂𝐿𝑖,𝑡 + 𝐼𝑛𝑑𝑢𝑠𝑡𝑟𝑦𝑗 + 𝑌𝑒𝑎𝑟𝑡 + 𝜀𝑖,𝑡, (2)
where 𝐼𝑁𝑉𝐸𝑆𝑇_𝐼𝑁𝐸𝐹𝐹𝑖,𝑡+1 captures investment (in)efficiency, which is the absolute value of the
residuals from estimating the investment model as described in Section 3.2.1. 𝐶𝑂𝑁𝑁𝐸𝐶𝑇𝑖,𝑡 is
director connectedness and is defined as one of the four measures – DEGREE, CLOSENESS,
BETWEENNESS, and EIGENVECTOR. We use either the continuous or decile ranking of the
connectedness measures.
𝐶𝑂𝑁𝑇𝑅𝑂𝐿𝑖,𝑡 represents a matrix of control variables which include various firm
characteristics that might confound the effect of director connectedness on investment efficiency.
Our control variables are largely consistent with those used in the prior literature (Biddle and
Hilary 2006; Biddle et al. 2009; Chen et al. 2013). To isolate the effect of director networks, we
control for other dimensions of firms’ information environment, including financial reporting
quality (FRQ) estimated based on the modified Dechow and Dichev (2002) model, the natural
logarithm of the number of financial analysts following the firm (ANALYST_FOL), and
managers’ private information (PRIVATE_INFO) as captured by absolute abnormal returns
around earnings announcements. We also include two firm characteristics, firm size (SIZE),
9 Biddle et al. (2009) adopt a multinomial logit regression design, where they classify firm-years into three groups –
underinvestment, efficient investment, and over investment based on the residuals from regressing investment on
sales growth. Our results hold if we take such approach.

16
measured as the natural logarithm of total assets, and market-to-book ratio (M/B), calculated as
the market value of total assets divided by the book value of total assets. Further, we control for
several corporate governance mechanisms, namely, the natural logarithm of institutional
ownership (IO), the size of the board (BOARD_SIZE), board independence (BOARD_IND), and
the average age of directors (BOARD_AGE). To capture the idea that firms in different stages of
their business cycles may have different board compositions and investment policies, we control
for firm age (AGE) measured as the natural logarithm of the number of years that a firm has been
covered by CRSP, the length of the operating cycle (OPCYCLE) calculated as the natural
logarithm of (receivables to sales plus inventory to cost of goods sold multiplied by 360), and the
incidence of loss (LOSS) which equals one if income before extraordinary items is negative and
zero otherwise.
As the long-term solvency of the firm affects investment choices, we control for firm
capital structure (KSTRUCTURE) defined as the long-term debt divided by the sum of long-term
debt and the market value of equity; financial slack (SLACK) measured as the ratio of cash and
cash equivalents to PP&E. To control for the effect of the uncertainty in firms’ operating
environment on investment decisions, we include cash flow volatility (CFOVOL), sales volatility
(SALESVOL), and investment volatility (INVESTVOL). Lastly, we follow prior studies and
control for asset tangibility (TANGIBILITY) measured as the ratio of PP&E and total assets,
dividend payout (DIVIDEND), which equals one if the firm paid a dividend and zero otherwise,
bankruptcy risk (Z_SCORE), cash flow from operations divided by sales (CFOSALE), industry
leverage (IND_K, the average KSTRUCTURE of firms in the same industry).
The Appendix provides a detailed description of the variables. All continuous variables
are winsorized each year at the bottom and top 1% level. We include industry fixed effects and

17
year fixed effects to control for unobserved industry factors and market-wide performance shifts
over the sample period, respectively. Standard errors are clustered by firm.10 We predict that 𝛽1
is negative for the underinvestment and the overinvestment group, respectively.
4. Empirical Results: Board Connections and Investment Efficiency
4.1. Descriptive Statistics
Table 1, Panel A reports the descriptive statistics on our main variables. In our final
sample of 29,383 firm-year observations, 19,632 firm-years are classified as the underinvestment
group and 9,751 firm-years fall into the overinvestment group. As can be seen in Table 1, while
there is a larger number of firms that underinvest, the average deviation from expected
investment level is higher for overinvesting firms (13.057) than underinvesting firms (7.865).
This pattern is consistent with what has been reported in prior studies (e.g., Biddle et al. 2009;
Chen et al. 2011). In terms of connectedness measures, the mean (median) DEGREE is 5.6 (4),
which suggests that on average our sample firms have five direct links with outside boards. 11
Turning to the control variables, the mean and median total assets are $667 and $615
million, respectively. Approximately 27% of firms experience losses during our sample period.
On average, our sample firms are followed by three analysts and have institutional ownership of
50%. In addition, the average firm holds 24.78% of tangible assets relative to total assets and has
a market leverage of 14%.
Table 1, Panel B reports correlations among our main variables separately for
underinvestment and overinvestment firm-years. For both groups, INVEST_INEFF is negatively
and significantly correlated with measures of board connectedness, lending support to our
conjecture that well-connected firms are less likely to engage in inefficient investment.
10 Our inferences remain qualitatively the same when we cluster standard errors by firm and year. 11 These figures are comparable to the mean (5.1) and median (3) DEGREE reported by Larcker et al (2013).

18
Moreover, within each group of firm-years, DEGREE, BETWEENNES, and CLOSENESS are
highly positively correlated with each other. The correlations of EIGENVECTOR with the other
three measures are all significantly positive albeit at smaller magnitudes.
4.2. Univariate Results
We begin our analysis of the effect of board connectedness on firm investment efficiency
by conducting univariate analyses. We sort the four measures of board connectedness into
deciles by year and then calculate the average INVEST_INEFF for each decile of connectedness
measure. In order to understand whether board connectedness reduces investment inefficiency
due to both underinvestment and overinvestment, we perform this analysis separately within the
underinvestment and overinvestment subsamples.
Table 2 reports the results for the univariate tests. For the underinvestment group, we
observe a decline in INVEST_INEFF as board connectedness increases across all four
connectedness measures. For example, as DEGREE moves from the first to the tenth decile of its
distribution, INVEST_INEFF decreases from 8.829 to 7.306, reflecting a difference of 1.523,
which is significant at the 1% level. A similar pattern is present for the overinvestment group
(e.g., INVEST_INEFF declines from 14.058 to 10.033 as DEGREE changes from the first to the
tenth decile); however, the monotonic relation between investment efficiency and connectedness
measures is less clear. Taken together, the univariate results are consistent with board
connectedness mitigating both underinvestment and overinvestment, with the effect being
stronger for the underinvestment subsample.
4.3 Multivariate Results
In this section, we employ a regression approach to test our main hypothesis that board
connectedness improves investment efficiency. Table 3 reports the results from estimating

19
Equation (2) using both continuous and decile-ranked connectedness measures. As shown in
Table 3, Panel A, in the majority of specifications, the coefficient estimates on the connectedness
measures are negative and statistically significant. For example, in Column (1), which includes
industry- and year-fixed effects but no other controls, the coefficient estimate on DEGREE is -
0.070 (p-value <0.01). When we add the vector of control variables in Column (2), the
coefficient estimate on DEGREE is -0.053 and significant at the 1% level. Results are consistent
when we use the decile ranked DEGREE. While we continue to find significant results for
CLOSENESS and BETWEENNESS, the results based on EIGENVECTOR are relatively weaker
as in the univariate results. These findings suggest that director connectedness mitigates
underinvestment, with the effect being stronger for more direct connections. Further, the results
are economically meaningful as well. For example, in Column (2), a one standard deviation
increase in DEGREE reduces INVEST_INEFF by 0.26, which represents a 3.3% decrease in
investment efficiency relative to the sample average of INVEST_INEFF. In Column (4), as
DEGREE moves from the bottom to the top decile, INVEST_INEFF decreases by 1.005, which
represents a 11.4% (1.005/8.829) reduction in underinvestment. Taken together, the results in
Panel A, Table 3 suggest that director connectedness is associated with more efficient investment
among firms that are in the underinvestment subsample.
Table 3, Panel B provides the results from estimating Equation (2) for observations in the
overinvestment subsample. Across the specifications in which only industry- and year-fixed
effects are included, the coefficient estimates on the four proxies of director connectedness are
negative and statistically significant. However, the effect becomes insignificant once the full set
of control variables are included. These results again mimic the findings from our univariate
analyses – the impact of director connectedness on investment efficiency is more pronounced on
20
the underinvestment side. However, in additional analyses we provide evidence on situations
where connectedness might play a more important role in reducing overinvestment.
5. Board Connectedness and Investment Efficiency: Cross-sectional Tests
Prior research shows that firms tend to underinvest mainly due to financial constraints
and overinvest due to mainly agency problems. In this section, we explore whether board
connectedness mitigates these inefficiencies by improving firms’ external information
environment. In 5.1, we focus on the underinvestment sample and examine how the effect of
board connectedness on investment efficiency varies with financial constraints, dependence on
external capital, and the availability/strength of other external sources of information that could
substitute for director networks. In 5.2, we consider firms in the overinvestment sample and
examine whether board connectedness mitigates investment inefficiencies emanating from
agency problems by increasing external monitors’ informedness and thereby enabling them to
become more effective monitors of managerial actions.
5.1. Underinvestment
5.1.1 The role of board connections in mitigating the effect of financial constraints on
underinvestment
Boardroom networks are important channels through which information is exchanged and
diffused (Schoorman et al. 1981; Haunschild and Beckman 1998; Larcker et al. 2013; Chuluun et
al. 2014). Well-connected directors who can leverage social relationships and increase the
visibility of firms’ positive NPV projects, could help bridge the information gap between the
firm and its capital providers. Hence, for otherwise similar firms, the information risk perceived
by lenders should be lower for well-connected firms. Accordingly, we expect financially
constrained firms and firms that are more dependent on external financing (as opposed to

21
internally generated cash) to benefit the most from a well-connected board in terms of accessing
capital and therefore the effect of board connectedness in reducing underinvestment should be
more pronounced among these firms.
To test these predictions, we modify Equation (2) by interacting our connectedness
measures with proxies of financial constraints and external capital needs and estimate the
following regressions using firm-years in the underinvestment subsample:
𝐼𝑁𝑉𝐸𝑆𝑇_𝐼𝑁𝐸𝐹𝐹𝑖,𝑡+1 = 𝛽0 + 𝛽1𝐶𝑂𝑁𝑁𝐸𝐶𝑇𝑖,𝑡 + 𝛽2𝐶𝑂𝑁𝑁𝐸𝐶𝑇𝑖,𝑡 ∗ 𝐹𝐼𝑁𝐶𝑂𝑁𝑆𝑇𝑅𝐴𝐼𝑁𝑇𝑆𝑖,𝑡
+𝛽3𝐹𝐼𝑁𝐶𝑂𝑁𝑆𝑇𝑅𝐴𝐼𝑁𝑇𝑆𝑖,𝑡 + 𝛽4𝐶𝑂𝑁𝑇𝑅𝑂𝐿𝑖,𝑡 + 𝐼𝑛𝑑𝑢𝑠𝑡𝑟𝑦𝑗 + 𝑌𝑒𝑎𝑟𝑡 + 𝜀𝑖,𝑡, (3)
𝐼𝑁𝑉𝐸𝑆𝑇_𝐼𝑁𝐸𝐹𝐹𝑖,𝑡+1 = 𝛾0 + 𝛾1𝐶𝑂𝑁𝑁𝐸𝐶𝑇𝑖,𝑡 + 𝛾2𝐶𝑂𝑁𝑁𝐸𝐶𝑇𝑖,𝑡 ∗ 𝐹𝐼𝑁𝑁𝐸𝐸𝐷𝑖,𝑡
+𝛾3𝐹𝐼𝑁𝑁𝐸𝐸𝐷𝑖,𝑡 + 𝛾4𝐶𝑂𝑁𝑇𝑅𝑂𝐿𝑖,𝑡 + 𝐼𝑛𝑑𝑢𝑠𝑡𝑟𝑦𝑗 + 𝑌𝑒𝑎𝑟𝑡 + 𝜀𝑖,𝑡, (4)
where 𝐹𝐼𝑁𝐶𝑂𝑁𝑆𝑇𝑅𝐴𝐼𝑁𝑇𝑆 measures the degree to which a firm is financially constrained and is
based on one of the following three measures: the Whited-Wu (WW) index (Whited and Wu,
2006), the size and age (SA) index (Hadlock and Pierce, 2010), and the absence of an S&P credit
rating (CRATING). The WW index and the SA index are robust predictors of the degree to which
a firm is financially constrained (Hadlock and Pierce, 2010), with larger values of both indices
indicating that the firm is more financially constrained. Extant literature offers motivations for
treating firms without a credit rating as financially constrained. Firms without a credit rating tend
to have difficulty accessing public debt markets (Faulkender and Petersen, 2006) and thus have
to rely on intermediaries such as banks with less competitive terms. Whited (1992) argues that
unrated firms are more opaque than rated firms, and hence more likely to be rationed by lenders
because the rating process helps reduce information asymmetries. Therefore, we create a dummy
variable, CRATING, which equals one if the firm does not have a credit rating (and is therefore
more financially constrained), and zero otherwise.

22
We use two measures to capture firms’ needs of external capital financing, FINNEED,
following Rajan and Zingales (1998). The first measure, EXTFIN, is based on the notion that the
amount of targeted investment that cannot be financed through internal cash flows will be
supported by external financing. EXTFIN is defined as the difference between the firm’s capital
expenditures and cash flow from operations scaled by capital expenditures. The second measure,
EQUITY, is equal to the difference between total sales and purchases of common and preferred
stock scaled by capital expenditures. Larger values of EQUITY imply higher demand for external
capital from the equity market. All other variables used in Equations (3) and (4) are defined in
the Appendix.
If board connectedness mitigates underinvestment by enhancing the board’s information
intermediary role and facilitating the firm’s access to external capital, then we expect negative
coefficients on CONNECT * FINCONSTRAINTS and CONNECT * FINNEED (i.e., 𝛽2 < 0 and
𝛾2 < 0). Table 4 presents the regression results. From Panel A, the coefficient on the interactions
of DEGREE and the three measures of financial constraints (WW, SA, and CRATING) are all
significantly negative. Similarly, in Panel B, the coefficients on the interactions of DEGREE
with both EXTFIN and EQUITY are negative and significant.12 These results provide strong
support to our conjecture that director networks enable firms to access external capital and
prevent underinvestment by helping bridge the information gap between the firm and external
capital providers and thus enhancing the board’s information intermediary role.
5.1.2 Board connections and the moderating effect of alternative external sources of information
To the extent that director connections represent alternative information sources to other
information channels, we expect firms to benefit more from director connections when other
12 Results are similar when we use BETWEENNESS, CLOSENESS, and EIGENVECTOR and are not tabulated for
brevity.

23
sources of information are less available or of lower quality. To test this conjecture, we conduct
cross-sectional analyses based on analyst coverage and financial information quality, which are
two alternative channels that can help reduce information asymmetry. In particular, analysts
convey valuable information that can help resolve information asymmetry between the firm and
its external providers of capital as well as among outsiders (Hong, Lim, and Stein 2000; Baker,
Nofsinger, and Weaver 2002; Frankel and Li 2004; Bowen, Chen, and Cheng 2008). Previous
studies document that financial reporting quality serves an important role in mitigating
information frictions that hamper investment efficiency (Biddle and Hilary 2006; Biddle et al.
2009; Chen et al. 2011). For firms with lower analyst coverage and lower quality of financial
reporting, information diffusion through directors would matter more in reducing information
asymmetry and increasing investment efficiency. We estimate the following equations using the
underinvestment firm-years:
𝐼𝑁𝑉𝐸𝑆𝑇_𝐼𝑁𝐸𝐹𝐹𝑖,𝑡+1 = 𝛽0 + 𝛽1𝐶𝑂𝑁𝑁𝐸𝐶𝑇𝑖,𝑡 + 𝛽2𝐶𝑂𝑁𝑁𝐸𝐶𝑇𝑖,𝑡 ∗ 𝐴𝑁𝐴𝐿𝑌𝑆𝑇_𝐹𝑂𝐿𝑖,𝑡
+𝛽3𝐴𝑁𝐴𝐿𝑌𝑆𝑇_𝐹𝑂𝐿𝑖,𝑡 + 𝛽4𝐶𝑂𝑁𝑇𝑅𝑂𝐿𝑖,𝑡 + 𝐼𝑛𝑑𝑢𝑠𝑡𝑟𝑦𝑗 + 𝑌𝑒𝑎𝑟𝑡 + 𝜀𝑖,𝑡, (5)
𝐼𝑁𝑉𝐸𝑆𝑇_𝐼𝑁𝐸𝐹𝐹𝑖,𝑡+1 = 𝛾0 + 𝛾1𝐶𝑂𝑁𝑁𝐸𝐶𝑇𝑖,𝑡 + 𝛾2𝐶𝑂𝑁𝑁𝐸𝐶𝑇𝑖,𝑡 ∗ 𝐹𝑅𝑄𝑖,𝑡
+𝛾3𝐹𝑅𝑄𝑖,𝑡 + 𝛾4𝐶𝑂𝑁𝑇𝑅𝑂𝐿𝑖,𝑡 + 𝐼𝑛𝑑𝑢𝑠𝑡𝑟𝑦𝑗 + 𝑌𝑒𝑎𝑟𝑡 + 𝜀𝑖,𝑡, (6)
where ANALYST_FOL is the natural logarithm of the number of analysts following the firm. We
follow the existing literature and measure FRQ by accruals quality as estimated via a modified
Dechow and Dichev (2002) model wherein working capital accruals is regressed on lagged,
current, and future cash flows plus the change in revenue and PP&E. All other variables are
defined previously. Appendix provides detailed variable definitions. We expect both 𝛽2 and 𝛾2 to
be negative if board network affects the tendency of under-investment through the information
channel.

24
Table 5 reports the results from estimating Equations (5) and (6). For both cross-sectional
tests conditional on analyst coverage and financial reporting quality, the coefficient estimates on
the interaction terms are negative and statistically significant, suggesting a greater influence of
connectedness on underinvestment when information asymmetry is high. Such findings provide
evidence that director networks allow boards to more effectively perform their information
intermediary roles, which reduces information asymmetries between firms and capital providers
and therefore mitigates underinvestment.
5.2 Overinvestment
The empirical evidence we have reported thus far provides strong support for the
hypothesis that board connectedness improves a firm’s external information environment. An
implication of this hypothesis is that for firms with well-connected boards, external stakeholders
should become more effective monitors of managerial actions as they become endowed with
higher quality information about the firm. In order to examine whether this is the case, in this
section we conduct two sets of cross-sectional tests using the overinvestment subsample.
5.2.1 Board connections and the effectiveness of external monitors in mitigating overinvestment
In this subsection, we examine how the effect of board connectedness on the extent of
overinvestment varies with the monitoring pressure from external monitors via the following
panel regression:
𝐼𝑁𝑉𝐸𝑆𝑇_𝐼𝑁𝐸𝐹𝐹𝑖,𝑡+1 = 𝛽0 + 𝛽1𝐶𝑂𝑁𝑁𝐸𝐶𝑇𝑖,𝑡 + 𝛽2𝐶𝑂𝑁𝑁𝐸𝐶𝑇𝑖,𝑡 ∗ 𝐸𝑋𝑇𝑀𝑂𝑁𝐼𝑇𝑂𝑅𝑖,𝑡
+𝛽3𝐸𝑋𝑇𝑀𝑂𝑁𝐼𝑇𝑂𝑅𝑖,𝑡 + 𝛽4𝐶𝑂𝑁𝑇𝑅𝑂𝐿𝑖,𝑡 + 𝐼𝑛𝑑𝑢𝑠𝑡𝑟𝑦𝑗 + 𝑌𝑒𝑎𝑟𝑡 + 𝜀𝑖,𝑡, (7)
where EXTMONITOR represents the degree of external monitoring. We use two proxies for the
strength of the external monitoring pressure: institutional ownership and the number of analysts
following the firm. Definitions for all other variables are provided in Appendix. If director
networks transmit information that is incrementally useful to institutional investors and analysts,

25
then board connectedness should have a more pronounced effect in reducing the extent of
overinvestment for firms with greater institutional ownership and analyst coverage. Put
differently, the relationship between INVEST_INEFF and CONNECT should become more
negative for larger values of EXTMONITOR (i.e., 𝛽2 < 0). In contrast, if board connectedness is
a substitute for other forms of external monitoring, then its effect in reducing overinvestment
should be muted for firms with greater external monitoring (i.e. 𝛽2 > 0).
Table 6 presents the results from estimating equation (7). The coefficient estimates on the
interaction of DEGREE and both measures of external monitoring are significantly negative in
all specifications, suggesting that well-connected firms with higher institutional ownership and
analyst coverage are less likely to overinvest. This result implies that the external information
effect of director networks improves the monitoring effectiveness of external stakeholders and
thereby curbs overinvestment from entrenched managers. It also indicates that the monitoring
from institutional shareholders and analysts complements the role of board connectedness.
5.2.2 The role of board connections in mitigating the effect of agency costs on overinvestment
In this section, we examine whether the effect of board connectedness on overinvestment
is stronger for firms that have higher agency costs. We consider firms’ agency costs arising from
cash holdings and overvalued equity. Our use of cash holdings is motivated by Jensen (1986),
who suggests that free cash flow exacerbates agency problems by providing managers with the
capital to undertake inefficient investments. Hence, firms with relatively large amounts of cash
and liquid securities tend to have higher agency costs. 13 In addition to cash holdings, we also
consider agency costs of overvalued equity, which is grounded on the idea that overvalued firms
13 Consistent with this theory, Blanchard, Lopez-di-Silanes, and Vishny (1994) document excessive investment and
acquisition activity for eleven firms that experience a large cash windfall following a legal settlement. Harford
(1999) finds that cash-rich firms are more likely to make acquisitions that later experience abnormal deterioration in
operating performance. Bates (2005) finds that firms who retain cash from subsidiary sales tend to invest more
relative to industry peers.

26
are associated with more severe agency problems and have higher likelihood of overinvesting.
Jensen (2005) argues that when a firm’s equity becomes substantially overvalued it sets in
motion a set of organizational forces that might lead to value-destroying investments. 14
We estimate the following regression within the overinvestment subsample:
𝐼𝑁𝑉𝐸𝑆𝑇_𝐼𝑁𝐸𝐹𝐹𝑖,𝑡+1 = 𝛽0 + 𝛽1𝐶𝑂𝑁𝑁𝐸𝐶𝑇𝑖,𝑡 + 𝛽2𝐶𝑂𝑁𝑁𝐸𝐶𝑇𝑖,𝑡 ∗ 𝐴𝐺𝐸𝑁𝐶𝑌𝐶𝑂𝑆𝑇𝑖,𝑡
+𝛽3𝐴𝐺𝐸𝑁𝐶𝑌𝐶𝑂𝑆𝑇𝑖,𝑡 + 𝛽4𝐶𝑂𝑁𝑇𝑅𝑂𝐿𝑖,𝑡 + 𝐼𝑛𝑑𝑢𝑠𝑡𝑟𝑦𝑗 + 𝑌𝑒𝑎𝑟𝑡 + 𝜀𝑖,𝑡, (8)
where AGENCYCOST is measured as either cash holdings (CASHHOLD) or the degree of stock
overvaluation (OVERVALUATION). CASHHOLD is calculated as the ratio of cash and cash
equivalents to sales and OVERVALUATION is the natural logarithm of the ratio of the observed
market value of equity to the intrinsic value of equity constructed as in Fu et al. (2013).15
Because industry is a significant factor in determining firm-level cash holdings, we adjust cash
holdings by industry median. Both CASHHOLD and OVERRVALUATION are decile ranked and
normalized to the range of [0,1]. Definitions for all other variables are provided in the Appendix.
Table 7 presents the regression results. In all specifications, the coefficient estimates on
the interaction of DEGREE and measures of agency costs are negative and significant, indicating
that director connectedness is associated with less overinvestment for firms with higher agency
costs. More importantly, the sum of the coefficient on DEGREE and that on DEGREE *
AGENCYCOST is negative and statistically significant in all regressions, which suggests that
board networks effectively help mitigate overinvestment for firms that experience relatively
serious agency problems. Such results are consistent with boardroom connections enhancing
14 Consistent with this argument, Moeller, Schlingemann, and Stulz (2005) find that acquiring firms in large loss
deals have significantly higher market-to-book ratios than acquirers in other deals. Moreover, Fu, Lin, and Officer
(2013) show that overvalued acquirers overpay for their targets and such acquisitions are concentrated among
acquirers with governance problems. 15 Please refer to Appendix of Fu et al. (2013) for details on how this measure is constructed.

27
boards’ monitoring role, thereby curbing overinvestment arising from management
entrenchment.
6. Additional Analyses and Robustness Tests
In this section, we conduct several additional analyses to provide more insights into the
effects of director connectedness on investment efficiency and assess the robustness of our
results to alternative explanations, specifications, and variable measurements.
6.1. Director Connections with Financial Institutions and Underinvestment
To the extent that firms’ directors have connections with board members at financial
institutions such as banks, such links might enable firms to have easier access to capital and, in
turn, have lower likelihood of underinvestment. To test this conjecture, we estimate the
following regression:
𝐼𝑁𝑉𝐸𝑆𝑇_𝐼𝑁𝐸𝐹𝐹𝑖,𝑡+1 = 𝛽0 + 𝛽1𝐹𝐼_𝐶𝑂𝑁𝑁𝐸𝐶𝑇𝑖,𝑡 + 𝛽2𝐶𝑂𝑁𝑁𝐸𝐶𝑇𝑖,𝑡 + 𝛽3𝐶𝑂𝑁𝑇𝑅𝑂𝐿𝑖,𝑡
+𝐼𝑛𝑑𝑢𝑠𝑡𝑟𝑦𝑗 + 𝑌𝑒𝑎𝑟𝑡 + 𝜀𝑖,𝑡, (9)
where 𝐹𝐼_𝐶𝑂𝑁𝑁𝐸𝐶𝑇 is either the number of first-degree links to boards of financial institutions
(SIC code 6000-6999) or a dummy variable that equals one if the firm has at least one link to
boards of financial institutions and zero otherwise. All other variables are as previously defined.
We predict 𝛽1 < 0 if connections to financial institutions play a role in reducing
underinvestment.
Table 8 reports the results from estimating Equation (9). For brevity, we only report
results based on DEGREE. For both the continuous and decile ranked DEGREE, the coefficient
on FI_CONNECT is insignificant, while that on DEGREE remains negative and significant.
Thus, we fail to find any evidence that suggests that the effect of connectedness on
underinvestment is due to director connections with board members at financial institutions.

28
6.2. Robustness Tests
6.2.1 Endogeneity
Our finding of a positive relationship between board connectedness and firm investment
efficiency may suffer from potential endogeneity issues that could make our causal inferences
based on that relationship problematic. First, it is possible that the relationship between board
connectedness and investment efficiency is spurious as it might arise due to an omitted or
unobservable firm characteristic that drives both investment efficiency and board connectedness.
For example, more prestigious firms or firms with higher-quality managers may make more
efficient investment decisions, and at the same time attract more connected directors to serve on
their boards. Second, it is possible that our results suffer from a reverse-causality (i.e., firms that
make more efficient investment decisions recruit more connected directors to benefit from these
directors’ access to information and resources). While it is not clear in what direction the
correlated omitted variables problem will bias the effect we document, the reverse-causality
likely results in the same relationship between board connectedness and investment efficiency
upon which we base our causal inferences. We employ various approaches to gauge the
robustness of our causal inference to these two sources of endogeneity.
First, we restrict our sample to firms whose board compositions remain unchanged from
the prior year to the current year. That is, the board is composed of the same group of directors in
years t-1 and t.16 This exercise is based on the idea that changes in board centrality for such firms
must be due to changes in the boards of other companies in the network or from their board
members taking additional directorships at other firms. Hence, for this subset of firms, board-
16 This approach has been used by Larcker et al. (2013) in assessing the strength of their causal inference based on
the positive relation between board connectedness and future firm performance. It has also been used by Schabus
(2018) who examines the relationship between board connectedness and the accuracy of managers’ forecasts of
earnings, sales, and expenditures.

29
related endogenous choices made by a firm are less likely to affect its board centrality; rather, it
is the decisions of other firms that are exogenous in nature that drive the change in the focal
firm’s board centrality. The results from this analysis are reported in Table 9. The sample size
drops significantly as a result of holding the board composition constant from the prior year to
the current year; however, in our baseline regressions we continue to find a significantly negative
association between investment inefficiency and degree centrality. This negative association
continues to hold when we control for other firm characteristics for the underinvestment
subsample and remain insignificant on average in the overinvestment subsample. Second, we
include firm fixed effects to control for time-invariant firm-specific unobservable or omitted
factors. The results, reported in Table 10, are similar to those in Table 2 and our inference
remains the same. Third, in untabulated analyses we control for various measures of managerial
quality such as management forecast accuracy and the ratio of insider stock transactions to total
transactions. Our inferences remain qualitatively the same. Finally, as in Larcker et al. (2013), in
untabulated tests, we examine the relationship between board connectedness in a given year and
lagged changes in investment efficiency and find no evidence in support of the argument that
firms with higher prior investment efficiency attract more connected directors to their boards.
Collectively, the results in this section help mitigate endogeneity concerns and corroborate our
causal inference based on the relationship between board connectedness and investment
efficiency.
6.2.2 Other Robustness Tests
We perform a battery of additional analyses (untabulated) to test the robustness of our
results. First, we measure investment as capital expenditure scaled by total assets, capital
expenditure scaled by plant, property, and equipment (PP&E) or capital expenditure plus R&D
30
expenditure scaled by total assets. Our results hold using these alternative measures of
investment. Second, we employ modified versions of the investment model. Specifically, we
follow Chen et al. (2011) and allow differential effects of positive and negative sales growth on
investment by adding a negative sales growth dummy and its interaction with sales growth. In
addition, following Chen et al. (2013), we include Tobin’s Q in the investment model. Our
inferences remain unaffected if we use the above two specifications. Third, we follow Biddle et
al. (2009) and adopt a multinomial logit regression design, where we classify firm-years into
three groups – under-investment, efficient investment, and over-investment based on the
residuals from regressing investment on sales growth. Our results hold if we take such approach.
7. Conclusion
Corporate directors possess valuable firm-, industry-, and market-related information that
they share with other corporate officers via social networks. A large stream of literature has
examined whether the information that flows through director networks impacts a firm’s
corporate decisions by affecting its internal information environment. However, recent studies
show that firm-specific information is likely to leak to outsiders such as short sellers, option
traders, and securities analysts when the firm’s board is more connected (Cohen et al., 2010;
Akbas et al., 2016). In this paper, we examine whether this outflow of information affects a
firm’s external information environment, and, consequently, the quality of its corporate decisions
by focusing on the effect of boardroom connections on corporate investment efficiency.
Using a panel of U.S. firms over the period 2000-2015, we separately analyze the
mechanisms through which board connectedness affects investment efficiency for firms that
under- and overinvest. For the underinvestment sample, we find the extent of underinvestment is
significantly lower when the board is more connected, controlling for various factors previously

31
shown to affect investment efficiency, including a firm’s information environment (e.g.,
financial reporting quality, analyst coverage, and manager’s information quality). This effect is
stronger for financially constrained firms and for firms with greater demand for external equity
financing, consistent with boardroom connections improving a firm’s external information
environment. We further find that the effect of board connectedness on underinvestment is less
pronounced for firms with higher financial reporting quality and more analyst following, which
suggests that director networks serve as a substitute for other external information mechanisms.
For the overinvestment subsample, we find that well-connected firms with higher
institutional ownership and analyst coverage are less likely to overinvest, suggesting that the
external information effect of director networks facilitates the monitoring effectiveness of
external stakeholders in curbing overinvestment from entrenched managers. Moreover, well-
connected firms with higher excess cash holdings or overvalued equity are less likely to
overinvest compared to their less-connected counterparts, consistent with boardroom connections
facilitating the flow of information to external monitors, which helps mitigate overinvestment
arising from agency problems.
Taken together, our results suggest that boardroom networks formed by shared board
directors can have a significant effect on firms’ external information environment and, in turn, on
the quality of managerial decisions by enabling external stakeholders to become better-informed
and more effective monitors. Our findings thus uncover a new channel through which director
networks can have real effects and increase firm value.

32
Appendix: Variable Definitions
Variable Definition
Investment Efficiency
INVEST_INEFF A firm-level measure of investment inefficiency, defined as the absolute value
of the residual from regressing total investment in year t+1 on growth
opportunities in year t. Total investment is the sum of capital expenditures,
research and development expenditures, and acquisition expenditures less cash
receipts from sale of property, plant, and equipment and divided by lagged total
assets. Growth opportunities is the percentage change in firm i’s sales between
year t-1 and t. The model is estimated for each Fama and French 48 industry
with at least 20 observations in a given year.
Board Connectedness
DEGREE The number of first-degree links to outside boards.
CLOSENESS The inverse of the average distance between a board and an outside board.
BETWEENNESS The average proportion of paths between two other outside boards on which a
board lies.
EIGENVECTOR The connectedness of a firm’s direct links.
Control Variables
ANALYST_FOL The natural logarithm of the number of sell-side analysts following the firm.
AGE The natural logarithm of the number of years that a firm has been covered by
CRSP.
BOARD_AGE The natural logarithm of the average age of directors on the board.
BOARD_IND The percentage of outside directors on the board.
BOARD_SIZE The natural logarithm of the number of directors on the board.
CFO Cash flow from operations divided by sales.
CFO_VOL Cash flow volatility, which is the standard deviation of cash flow from
operation scaled by average total assets from year t-5 to t-1.
DIVIDEND An indicator variable that equals one if the firm paid a dividend in year t and
zero otherwise.
FRQ The standard deviation of the residuals from the modified Dechow and Dichev
(2002) model over the years t-4 to t, multiplied by negative one. The model is a
regression of working capital accruals on lagged, current, and future cash flows
plus the change in revenues and PPE. All variables are scaled by lagged total
assets. The model is estimated cross-sectionally for each 2-digit SIC industry
with at least 10 observations in a given year.
IND_K The average KSTRUCTURE of firms in the same industry, where
KSTRUCTURE is The long-term debt divided by the sum of long-term debt and
the market value of equity.
INVEST_VOL Investment volatility, which is the standard deviation of total investment from
year t-5 to t-1. Total investment is the sum of capital expenditures, research and
development expenditures, and acquisition expenditures less cash receipts from
sale of property, plant, and equipment and divided by lagged total assets.
IO The natural logarithm of the percentage of common stock held by institutional
investors as of the most recent reporting quarter.
KSTRUCTURE The long-term debt divided by the sum of long-term debt and the market value
of equity.
LOSS An indicator variable that equals one if income before extraordinary items is
negative and zero otherwise.
M/B The market value of total assets divided by the book value of total assets.
OP_CYCLE The natural logarithm of (receivables to sales plus inventory to cost of goods
sold multiplied by 360).

33
PRIVATE_INFO The amount of managerial private information, measured as the average of the
absolute stock returns around the 3-day windows of the four quarterly earnings
announcement dates.
SALES_VOL Sales volatility, defined as the standard deviation of sales scaled by average
total assets from year t-5 to t-1.
SLACK The ratio of cash and cash equivalents to plant, property and equipment
(PP&E). TANGIBILITY The ratio of PP&E to total assets.
TOTAL_ASSETS The natural logarithm of total assets.
Z_SCORE A measure of bankruptcy risk, calculated as 3.3x(pretax income) + sales +
0.25x(retained earnings) + 0.5x(current assets – current liabilities), scaled by
total assets.
Variables for cross-sectional and additional tests
CASH_HOLD The ratio of cash and cash equivalents to sales, adjusted by industry median.
The measure is in decile ranking and normalized to the range of [0,1].
CRATING An indicator variable that equals one if the firm does not have an S&P credit
rating and zero otherwise.
EQUITY The difference between total sales and purchases of common and preferred
stock scaled by capital expenditures. The measure is in decile ranking and
normalized to the range of [0,1].
EXTFIN The difference between the firm’s capital expenditures and cash flow from
operations scaled by capital expenditures. The measure is in decile ranking and
normalized to the range of [0,1].
FI_CONNECT The number of first-degree links to boards of financial institutions (SIC code
6000-6999) or a dummy variable the equals one if the board has at least one
link to boards of financial institutions and zero otherwise.
OVERVALUATION A measure of overvaluation calculated following Fu et al. (2013) as the natural
logarithm of the ratio of the observed market value of equity to the intrinsic
value of equity. The intrinsic value of equity is modeled as a linear function of
book value of equity, net income, and leverage. See Appendix A of Fu et al.
(2013) for details on how this measure is constructed.
SA The size and age index based on Hadlock and Pierce (2010), which is
calculated using the following equation: SA = -0.737xSize+ 0.043xSize2 -
0.040xAge, where Size is the log of inflation adjusted (to 2004) book assets,
and Age is the number of years the firm has been on Compustat with a non-
missing stock price. The measure is in decile ranking and normalized to the
range of [0,1].
WW The Whited-Wu index based on Whited and Wu (2006), which is calculated
using the following equation: WW = -0.091xCFL - 0.062xDIV + 0.021xTLTD -
0.044xSIZE+ 0.102xISG - 0.035xSG where CFL is cash flows, DIV is a
dividend dummy indicating positive preferred or common dividends, TLTD is
leverage, SIZE is firm size, ISG is industry sales growth, and SG is firm sales
growth. The measure is in decile ranking and normalized to the range of [0,1].

34
References
Akbas, Ferhat, Felix Meschke, and M. Babajide Wintoki. 2016. “Director Networks and
Informed Traders.” Journal of Accounting and Economics 62:1–23.
Armstrong, Christopher S. and David F. Larcker. 2009. “Discussion of ‘“The Impact of the
Options Backdating Scandal on Shareholders”’ and “Taxes and the Backdating of Stock
Option Exercise Dates.” Journal of Accounting and Economics 47:50–58.
Bae, Gil Soo, Dan S. Dhaliwal, and Phillip T. Lamoreaux. 2017. “Auditors and Client
Investment Efficiency.” The Accounting Review 92(2):19–40.
Bajo, Emanuele, Thomas J. Chemmanur, Karen Simonyan, and Hassan Tehranian. 2016.
“Underwriter Networks, Investor Attention, and Initial Public Offerings.” Journal of
Financial Economics 000:1–33.
Baker, H. Kent, John R. Nofsinger, and Daniel G. Weaver. 2002. “International Cross-Listing
and Visibility.” The Journal of Financial and Quantitative Analysis 37(3):495–521.
Barnea, Amir and Ilan Guedj. 2009. “Director Networks.” Working Paper.
Barzuza, Michal and Quinn Curtis. 2015. “Board Interlocks and Corporate Governance.”
Delaware Journal of Corporate Law 39:669–702.
Bates, Thomas W. 2005. “Asset Sales, Investment Opportunities, and the Use of Proceeds.” The
Journal of Finance 60(1):105–35.
Beckman, Christine M., and Pamela R. Haunschild. 2002. "Network Learning: The Effects of
Partners' Heterogeneity of Experience on Corporate Acquisitions." Administrative Science
Quarterly 47(1): 92-124.
Benson, Bradley W., Subramanian Rama Iyer, Kristopher J. Kemper, and Jing Zhao. 2016.
“Director Networks and Credit Ratings.” Working Paper.
Biddle, Gary C. and Gilles Hilary. 2006. “Accounting Quality and Firm-Level Capital
Investment.” The Accounting Review 81(5):963–82.
Biddle, Gary C., Gilles Hilary, and Rodrigo S. Verdi. 2009. “How Does Financial Reporting
Quality Relate to Investment Efficiency?” Journal of Accounting and Economics 48:112–
31.
Bizjak, J., M. Lemmon, and R. Whitby. 2009. “Option Backdating and Board Interlocks.”
Review of Financial Studies 22(11):4821–47.
Black, F., 1976. "Studies of stock price volatility changes." Proceedings of the 1976 Meetings of
the American Statistical Association, Business and Economic Statistics Section.

35
Blanchard, Olivier Jean, Florencio Lopez-de-Silanes, and Andrei Shleifer. 1994. “What Do
Firms Do with Cash Windfalls?” Journal of Financial Economics 36:337–60.
Bouwman, C. H. S. 2011. “Corporate Governance Propagation through Overlapping Directors.”
Review of Financial Studies 24(7):2358–94.
Bowen, Robert M., Xia Chen, and Qiang Cheng. 2008. “Analyst Coverage and the Cost of
Raising Equity Capital: Evidence from Underpricing of Seasoned Equity Offerings.”
Contemporary Accounting Research 25(3):657–99.
Brennan, Michael J. 2003. "Corporate Investment Policy." In Handbook of the Economics of
Finance, vol. 1: 167-214. Elsevier.
Brown, Jennifer L. and Katharine D. Drake. 2013. “Network Ties Among Low-Tax Firms.” The
Accounting Review 89(2):483–510.
Cai, Ye and Merih Sevilir. 2012. “Board Connections and M&A Transactions.” Journal of
Financial Economics 103(2):327–49.
Chen, Chen, Danqing Young, and Zili Zhuang. 2013. “Externalities of Mandatory IFRS
Adoption: Evidence from Cross-Border Spillover Effects of Financial Information on
Investment Efficienc.” The Accounting Review 88(3):881–914.
Chen, Feng, Ole-Kristian Hope, Qingyuan Li, and Xin Wang. 2011. “Financial Reporting
Quality and Investment Efficiency of Private Firms in Emerging Markets.” The Accounting
Review 86(4):1255–88.
Cheng, Mei, Dan Dhaliwal, and Yuan Zhang. 2013. “Does Investment Efficiency Improve after
the Disclosure of Material Weaknesses in Internal Control over Financial Reporting?”
Journal of Accounting and Economics 56(1):1–18.
Chiu, Peng-Chia, Siew Hong Teoh, and Feng Tian. 2013. “Board Interlocks and Earnings
Management Contagion.” The Accounting Review 88(3):915–44.
Christie, Andrew A. 1982. “The Stochastic Behavior of Common Stock Variances: Value,
Leverage and Interest Rate Effects.” Journal of Financial Economics 10(4):407–32.
Chuluun, Tuugi, Andrew Prevost, and John Puthenpurackal. 2014. “Board Ties and the Cost of
Corporate Debt.” Financial Management FALL:533–68.
Cohen, Lauren, Andrea Frazzini, and Christopher Malloy. 2008. "The Small World of Investing:
Board Connections and Mutual Fund Returns." Journal of Political Economy 116(5): 951-
979.
Cohen, Lauren, Andrea Frazzini, and Christopher Malloy. 2010. "Sell-side School Ties." The
Journal of Finance 65(4): 1409-1437.

36
Davis, Gerald F. 1991. “Agents without Principles? The Spread of the Poison Pill through the
Intercorporate Network.” Administrative Science Quarterly 36(4):583–613.
Dechow, Patricia M., and Ilia D. Dichev. 2002. "The Quality of Accruals and Earnings: The Role
of Accrual Estimation Errors." The Accounting Review 77: 35-59.
Duchin, Ran, John G. Matsusaka, and Oguzhan Ozbas. 2010. “When Are Outside Directors
Effective?” Journal of Financial Economics 96(2):195–214.
Engelberg, Joseph, Pengjie Gao, and Christopher A. Parsons. 2012. “Friends with Money.”
Journal of Financial Economics 103:169–88.
Faulkender, Michael and Mitchell A. Petersen. 2006. “Does the Source of Capital Affect Capital
Structure?” The Review of Financial Studies 19(1):45–79.
Fich, Eliezer M. and Anil Shivdasani. 2006. “Are Busy Boards Effective Monitors ?” The
Journal of Finance LXI(2):689–724.
Fich, Eliezer M. and Lawrence J. White. 2003. “CEO Compensation and Turnover: The Effects
of Mutually Interlocked Boards.” Wake Forest Law Review 38(3).
Francis, Jere R., Shawn Huang, Inder K. Khurana, and Raynolde Pereira. 2009. "Does Corporate
Transparency Contribute to Efficient Resource Allocation?." Journal of Accounting
Research 47 (4): 943-989.
Frankel, Richard and Xu Li. 2004. “Characteristics of a Firm’s Information Environment and the
Information Asymmetry between Insiders and Outsiders.” Journal of Accounting and
Economics 37:229–59.
Fu, Fangjian, Leming Lin, and Micah S. Officer. 2013. “Acquisitions Driven by Stock
Overvaluation : Are They Good Deals ?” Journal of Financial Economics 109(1):1–16.
Goodman, Theodore H., Monica Neamtiu, Nemit Shroff, and Hal D. White. 2014. "Management
Forecast Quality and Capital Investment Decisions." The Accounting Review 89 (1): 331-
365.
Hadlock, Charles J. and Joshua R. Pierce. 2010. “New Evidence on Measuring Financial
Constraints: Moving Beyond the KZ Index.” The Review of Financial Studies 23(5):1909–
40.
Hallock, Kevin F. 1997. “Reciprocally Interlocking Boards of Directors and Executive
Compensation.” The Journal of Financial and Quantitative Analysis 32(3):331–44.
Harford, Jarrad. 1999. “Corporate Cash Reserves and Acquisitions.” The Journal of Finance
54(6):1969–97.

37
Haunschild, Pamela R. and Christine M. Beckman. 1998. “When Do Interlocks Matter ?:
Alternate Sources of Information and Interlock Influence.” Administrative Science
Quarterly 43(4):815–44.
Hong, Harrison, Terence Lim, and Jeremy C. Stein. 2000. “Bad News Travels Slowly: Size ,
Analyst Coverage, and the Profitability of Momentum Strategies.” The Journal of Finance
55(1):265–95.
Hwang, Byoung-Hyoun and Seoyoung Kim. 2009. “It Pays to Have Friends.” Journal of
Financial Economics 93:138–58.
Jensen, Michael C. 1986. “Agency Costs of Free Cash Flow , Corporate Finance, and
Takeovers.” The American Economic Review 76(2):323–29.
Jensen, Michael C. 2005. “Agency Costs of Overvalued Equity.” Financial Management
Spring:5–19.
Kramarz, Francis and David Thesmar. 2013. “Social Networks in the Boardroom.” Journal of
the European Economic Association 11(4):780–807.
Lara, Juan Manuel García, Beatriz García Osma, and Fernando Penalva. 2016. “Accounting
Conservatism and Firm Investment Efficiency.” Journal of Accounting and Economics
61:221–38.
Larcker, David F., Scott A. Richardson, Andrew J. Seary, and Irem Tuna. 2005. “Back Door
Links Between Directors and Executive Compensation.” Working Paper.
Larcker, David F., Eric C. So, and Charles C. Y. Wang. 2013. “Boardroom Centrality and Firm
Performance.” Journal of Accounting and Economics 55(2-3):225–50.
Li, Feng, and Nemit Shroff. 2010. "Financial Reporting Quality and Economic Growth."
Working paper.
Love, Inessa. 2003. “Financial Development and Financing Constraints : International Evidence
from the Structural Investment Model.” The Review of Financial Studies 16(3):765–91.
Masulis, Ronald W., and Shawn Mobbs. 2014. "Independent Director Incentives: Where Do
Talented Directors Spend Their Limited Time and Energy?." Journal of Financial
Economics 111 (2): 406-429.
Mcnichols, Maureen F. and Stephen R. Stubben. 2008. “Does Earnings Management Affect
Firms ’ Investment Decisions?” The Accounting Review 83(6):1571–1603.
Mizruchi, Mark S. 1996. “What Do Interlocks Do ? An Analysis, Critique , and Assessment of
Research on Interlocking Directorates.” Annual Review of Sociology 22:271–98.

38
Moeller, Sara B., Frederik P. Schlingemann, and René M. Stulz. 2005. “Wealth Destruction on a
Massive Scale? A Study of Acquiring-Firm Returns in the Recent Merger Wave.” The
Journal of Finance 60(2):757–82.
Mol, Michael J. 2001. “Creating Wealth through Working with Others: Interorganizational
Relationships.” Academy of Management Executive 15:150–52.
Rajan, Raghuram G. and Luigi Zingales. 1998. “Financial Dependence and Growth.” The
American Economic Review 88(3):559–86.
Rao, Hayagreeva, Gerald F. Davis, and Andrew Ward. 2000. “Embeddedness , Social Identity
and Mobility : Why Firms Leave the NASDAQ and Join the New York Stock Exchange.”
Administrative Science Quarterly 45(2):268–92.
Salk, Jane E., and Mary Yoko Brannen. 2000. "National Culture, Networks, and Individual
Influence in a Multinational Management Team." Academy of Management Journal 43 (2):
191-202.
Schabus, Mario. 2018. "Do Director Networks Help Managers Plan and Forecast Better?."
Working Paper.
Schmidt, Breno. 2015. “Costs and Benefits of Friendly Boards during Mergers and
Acquisitions.” Journal of Financial Economics 117:424–47.
Schoorman, F. David, Max H. Bazerman, and Robert S. Atkin. 1981. “Interlocking Directorates :
A Strategy for Reducing Environmental Uncertainty.” The Academy of Management Review
6(2):243–51.
Shroff, Nemit, Rodrigo S. Verdi, and Gwen Yu. 2014. “Information Environment and the
Investment Decisions of Multinational Corporations.” The Accounting Review 89(2):759–
90.
Stuart, Toby E. and Soojin Yim. 2010. “Board Interlocks and the Propensity to Be Targeted in
Private Equity Transactions.” Journal of Financial Economics 97:174–89.
Stulz, Renc M. 1990. “Managerial Discretion and Optimal Financing Policies.” Journal of
Financial Economics 26:3–27.
Useem, Michael. 1984. The Inner Circle: Large Corporations and the Rise of Business Political
Activity in the U.S. and U.K. New York and Oxford: Oxford University Press.
Whited, Toni M. 1992. “Debt , Liquidity Constraints , and Corporate Investment : Evidence from
Panel Data.” The Journal of Finance 47(4):1425–60.
Whited, Toni M. and Guojun Wu. 2006. “Financial Constraints Risk.” The Review of Financial
Studies 19(2):531–59.

39
Table 1. Descriptive Statistics and Correlations
This table reports descriptive statistics for the variables used in our analyses. Panel A presents descriptive statistics
for the main variables. Panel B reports Pearson (Spearman) correlations among the main variables used in our
regressions in the lower (upper) diagonal of the panel. *, **, and *** denote statistical significance at the 10%, 5%,
and 1% level, respectively. All variables are defined in the Appendix.
Panel A. Descriptive Statistics
N Mean Std. Dev. 25th Pctl. Median 75th Pctl.
INVEST_INEFF 29,383 9.588 11.751 3.192 6.535 11.741
INVEST_INEFF (under-investment) 19,632 7.865 6.003 3.493 6.481 10.784
INVEST_INEFF (over-investment) 9,751 13.057 18.043 2.585 6.714 15.638
DEGREE 29,383 5.606 4.969 2.000 4.000 8.000
CLOSENESS 24,947 0.194 0.029 0.174 0.194 0.212
BETWEENNESS 24,947 0.003 0.004 0.000 0.001 0.003
EIGENVECTOR 24,947 0.002 0.010 0.000 0.000 0.000
FRQ 29,383 -0.059 0.052 -0.071 -0.044 -0.027
ANALYST_FOL 29,383 1.392 0.962 0.693 1.386 2.197
PRIVATE_INFO 29,383 0.106 0.065 0.059 0.090 0.135
TOTAL_ASSETS 29,383 6.506 1.860 5.143 6.424 7.762
M/B 29,383 1.987 1.328 1.157 1.559 2.319
AGE 29,383 2.667 0.845 2.115 2.716 3.295
IO 29,383 0.386 0.255 0.112 0.476 0.609
BOARD_SIZE 29,383 2.087 0.273 1.946 2.079 2.303
BOARD_IND 29,383 0.738 0.146 0.667 0.750 0.857
BOARD_AGE 29,383 4.093 0.080 4.048 4.101 4.146
CFO_VOLA 29,383 0.068 0.065 0.028 0.048 0.083
SALES_VOLA 29,383 0.175 0.159 0.070 0.125 0.225
INVEST_VOLA 29,383 11.876 16.399 2.812 6.071 13.403
Z_SCORE 29,383 1.296 1.221 0.711 1.314 1.952
TANGIBILITY 29,383 0.248 0.227 0.075 0.169 0.351
KSTRUCTURE 29,383 0.143 0.178 0.000 0.077 0.224
IND_K 29,383 0.151 0.083 0.093 0.119 0.190
CFO 29,383 -0.020 0.934 0.033 0.090 0.165
SLACK 29,383 4.146 11.017 0.152 0.696 3.041
DIVIDEND 29,383 0.407 0.491 0.000 0.000 1.000
OP_CYCLE 29,383 4.592 0.757 4.196 4.675 5.082
LOSS 29,383 0.273 0.446 0.000 0.000 1.000

40
Table 1 Continued
Panel B: Correlations
Under-investment
INVEST_INEFF DEGREE CLOSENESS BETWEENNESS EIGENVECTOR
INVEST_INEFF 1 -0.081*** -0.069*** -0.047*** -0.012
DEGREE -0.062*** 1 0.801*** 0.853*** 0.405***
CLOSENESS -0.069*** 0.750*** 1 0.770*** 0.673***
BETWEENNESS -0.041*** 0.762*** 0.694*** 1 0.431***
EIGENVECTOR -0.026*** 0.347*** 0.504*** 0.544*** 1
Over-investment
INVEST_INEFF DEGREE CLOSENESS BETWEENNESS EIGENVECTOR
INVEST_INEFF 1 -0.054*** -0.082*** -0.063*** -0.047***
DEGREE -0.047*** 1 0.738*** 0.817*** 0.323***
CLOSENESS -0.062*** 0.687*** 1 0.702*** 0.650***
BETWEENNESS -0.060*** 0.681*** 0.642*** 1 0.359***
EIGENVECTOR -0.043*** 0.248*** 0.488*** 0.506*** 1
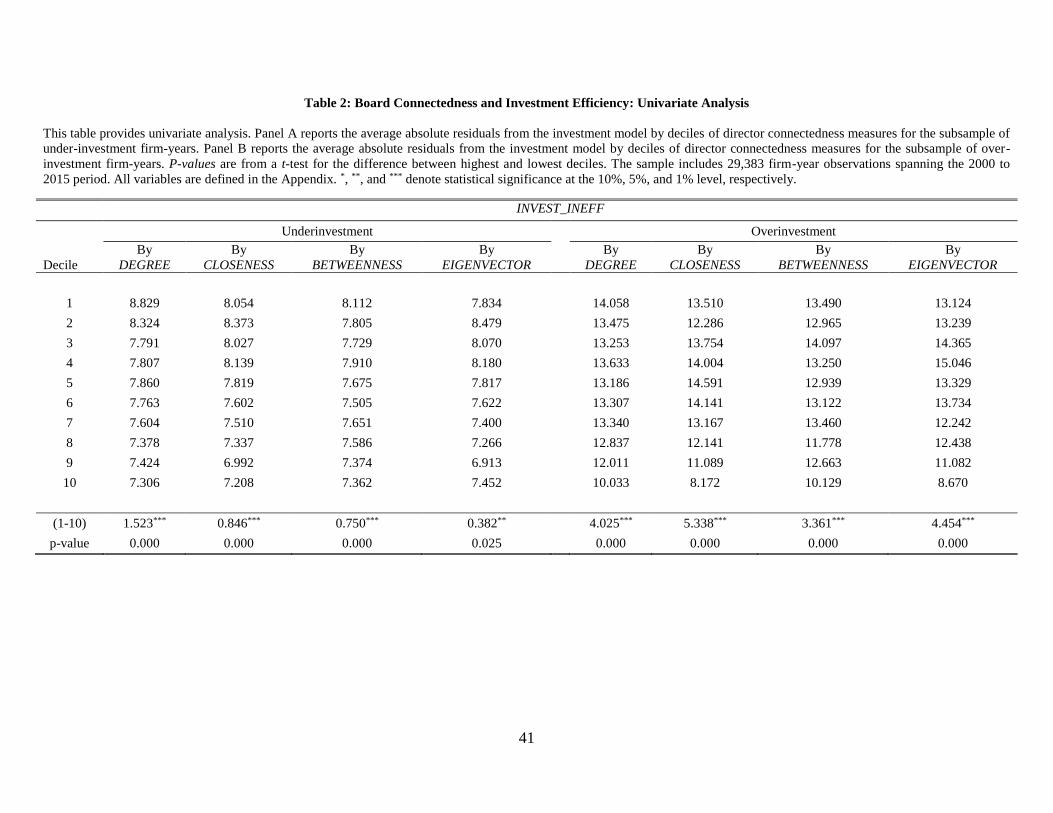
41
Table 2: Board Connectedness and Investment Efficiency: Univariate Analysis
This table provides univariate analysis. Panel A reports the average absolute residuals from the investment model by deciles of director connectedness measures for the subsample of
under-investment firm-years. Panel B reports the average absolute residuals from the investment model by deciles of director connectedness measures for the subsample of over-
investment firm-years. P-values are from a t-test for the difference between highest and lowest deciles. The sample includes 29,383 firm-year observations spanning the 2000 to
2015 period. All variables are defined in the Appendix. *, **, and *** denote statistical significance at the 10%, 5%, and 1% level, respectively.
INVEST_INEFF
Underinvestment Overinvestment
Decile
By
DEGREE
By
CLOSENESS
By
BETWEENNESS
By
EIGENVECTOR
By
DEGREE
By
CLOSENESS
By
BETWEENNESS
By
EIGENVECTOR
1 8.829 8.054 8.112 7.834 14.058 13.510 13.490 13.124
2 8.324 8.373 7.805 8.479 13.475 12.286 12.965 13.239
3 7.791 8.027 7.729 8.070 13.253 13.754 14.097 14.365
4 7.807 8.139 7.910 8.180 13.633 14.004 13.250 15.046
5 7.860 7.819 7.675 7.817 13.186 14.591 12.939 13.329
6 7.763 7.602 7.505 7.622 13.307 14.141 13.122 13.734
7 7.604 7.510 7.651 7.400 13.340 13.167 13.460 12.242
8 7.378 7.337 7.586 7.266 12.837 12.141 11.778 12.438
9 7.424 6.992 7.374 6.913 12.011 11.089 12.663 11.082
10 7.306 7.208 7.362 7.452 10.033 8.172 10.129 8.670
(1-10) 1.523*** 0.846*** 0.750*** 0.382** 4.025*** 5.338*** 3.361*** 4.454***
p-value 0.000 0.000 0.000 0.025 0.000 0.000 0.000 0.000
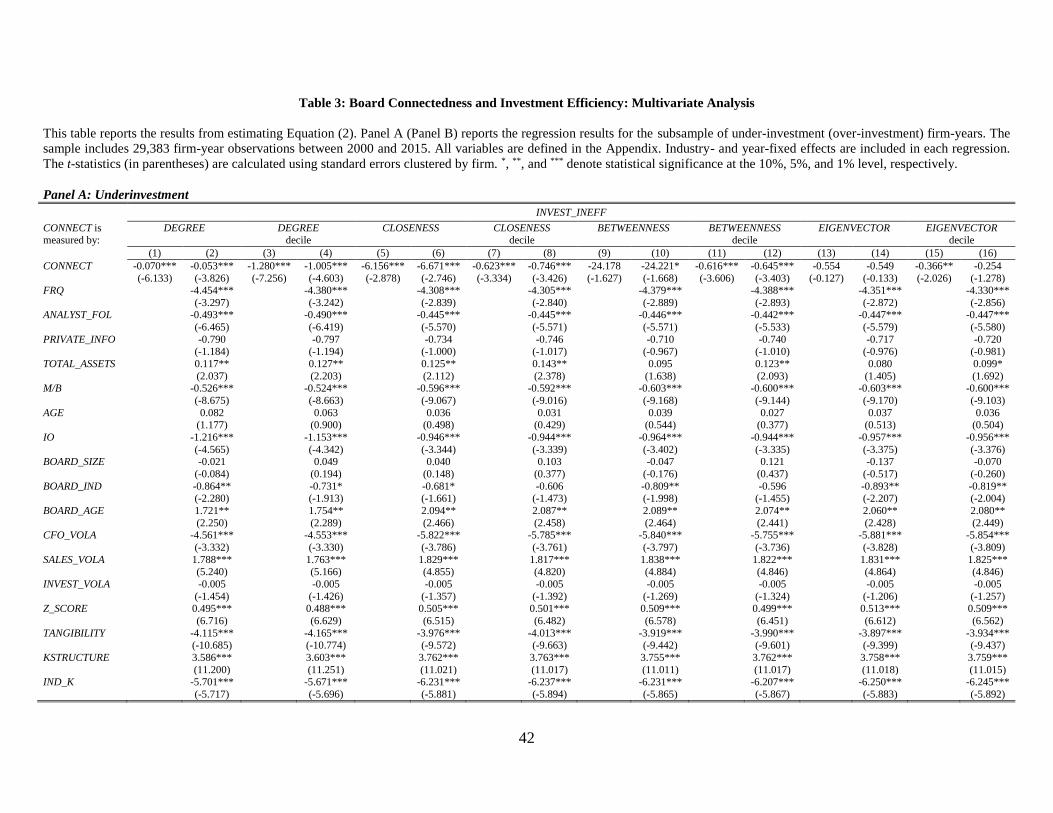
42
Table 3: Board Connectedness and Investment Efficiency: Multivariate Analysis
This table reports the results from estimating Equation (2). Panel A (Panel B) reports the regression results for the subsample of under-investment (over-investment) firm-years. The
sample includes 29,383 firm-year observations between 2000 and 2015. All variables are defined in the Appendix. Industry- and year-fixed effects are included in each regression.
The t-statistics (in parentheses) are calculated using standard errors clustered by firm. *, **, and *** denote statistical significance at the 10%, 5%, and 1% level, respectively.
Panel A: Underinvestment INVEST_INEFF
CONNECT is measured by:
DEGREE DEGREE decile
CLOSENESS CLOSENESS decile
BETWEENNESS BETWEENNESS decile
EIGENVECTOR EIGENVECTOR decile
(1) (2) (3) (4) (5) (6) (7) (8) (9) (10) (11) (12) (13) (14) (15) (16)
CONNECT -0.070*** -0.053*** -1.280*** -1.005*** -6.156*** -6.671*** -0.623*** -0.746*** -24.178 -24.221* -0.616*** -0.645*** -0.554 -0.549 -0.366** -0.254
(-6.133) (-3.826) (-7.256) (-4.603) (-2.878) (-2.746) (-3.334) (-3.426) (-1.627) (-1.668) (-3.606) (-3.403) (-0.127) (-0.133) (-2.026) (-1.278) FRQ -4.454*** -4.380*** -4.308*** -4.305*** -4.379*** -4.388*** -4.351*** -4.330***
(-3.297) (-3.242) (-2.839) (-2.840) (-2.889) (-2.893) (-2.872) (-2.856) ANALYST_FOL -0.493*** -0.490*** -0.445*** -0.445*** -0.446*** -0.442*** -0.447*** -0.447***
(-6.465) (-6.419) (-5.570) (-5.571) (-5.571) (-5.533) (-5.579) (-5.580)
PRIVATE_INFO -0.790 -0.797 -0.734 -0.746 -0.710 -0.740 -0.717 -0.720 (-1.184) (-1.194) (-1.000) (-1.017) (-0.967) (-1.010) (-0.976) (-0.981)
TOTAL_ASSETS 0.117** 0.127** 0.125** 0.143** 0.095 0.123** 0.080 0.099*
(2.037) (2.203) (2.112) (2.378) (1.638) (2.093) (1.405) (1.692) M/B -0.526*** -0.524*** -0.596*** -0.592*** -0.603*** -0.600*** -0.603*** -0.600***
(-8.675) (-8.663) (-9.067) (-9.016) (-9.168) (-9.144) (-9.170) (-9.103)
AGE 0.082 0.063 0.036 0.031 0.039 0.027 0.037 0.036 (1.177) (0.900) (0.498) (0.429) (0.544) (0.377) (0.513) (0.504)
IO -1.216*** -1.153*** -0.946*** -0.944*** -0.964*** -0.944*** -0.957*** -0.956***
(-4.565) (-4.342) (-3.344) (-3.339) (-3.402) (-3.335) (-3.375) (-3.376) BOARD_SIZE -0.021 0.049 0.040 0.103 -0.047 0.121 -0.137 -0.070
(-0.084) (0.194) (0.148) (0.377) (-0.176) (0.437) (-0.517) (-0.260)
BOARD_IND -0.864** -0.731* -0.681* -0.606 -0.809** -0.596 -0.893** -0.819** (-2.280) (-1.913) (-1.661) (-1.473) (-1.998) (-1.455) (-2.207) (-2.004)
BOARD_AGE 1.721** 1.754** 2.094** 2.087** 2.089** 2.074** 2.060** 2.080**
(2.250) (2.289) (2.466) (2.458) (2.464) (2.441) (2.428) (2.449) CFO_VOLA -4.561*** -4.553*** -5.822*** -5.785*** -5.840*** -5.755*** -5.881*** -5.854***
(-3.332) (-3.330) (-3.786) (-3.761) (-3.797) (-3.736) (-3.828) (-3.809)
SALES_VOLA 1.788*** 1.763*** 1.829*** 1.817*** 1.838*** 1.822*** 1.831*** 1.825*** (5.240) (5.166) (4.855) (4.820) (4.884) (4.846) (4.864) (4.846)
INVEST_VOLA -0.005 -0.005 -0.005 -0.005 -0.005 -0.005 -0.005 -0.005
(-1.454) (-1.426) (-1.357) (-1.392) (-1.269) (-1.324) (-1.206) (-1.257)
Z_SCORE 0.495*** 0.488*** 0.505*** 0.501*** 0.509*** 0.499*** 0.513*** 0.509***
(6.716) (6.629) (6.515) (6.482) (6.578) (6.451) (6.612) (6.562)
TANGIBILITY -4.115*** -4.165*** -3.976*** -4.013*** -3.919*** -3.990*** -3.897*** -3.934*** (-10.685) (-10.774) (-9.572) (-9.663) (-9.442) (-9.601) (-9.399) (-9.437)
KSTRUCTURE 3.586*** 3.603*** 3.762*** 3.763*** 3.755*** 3.762*** 3.758*** 3.759***
(11.200) (11.251) (11.021) (11.017) (11.011) (11.017) (11.018) (11.015) IND_K -5.701*** -5.671*** -6.231*** -6.237*** -6.231*** -6.207*** -6.250*** -6.245***
(-5.717) (-5.696) (-5.881) (-5.894) (-5.865) (-5.867) (-5.883) (-5.892)
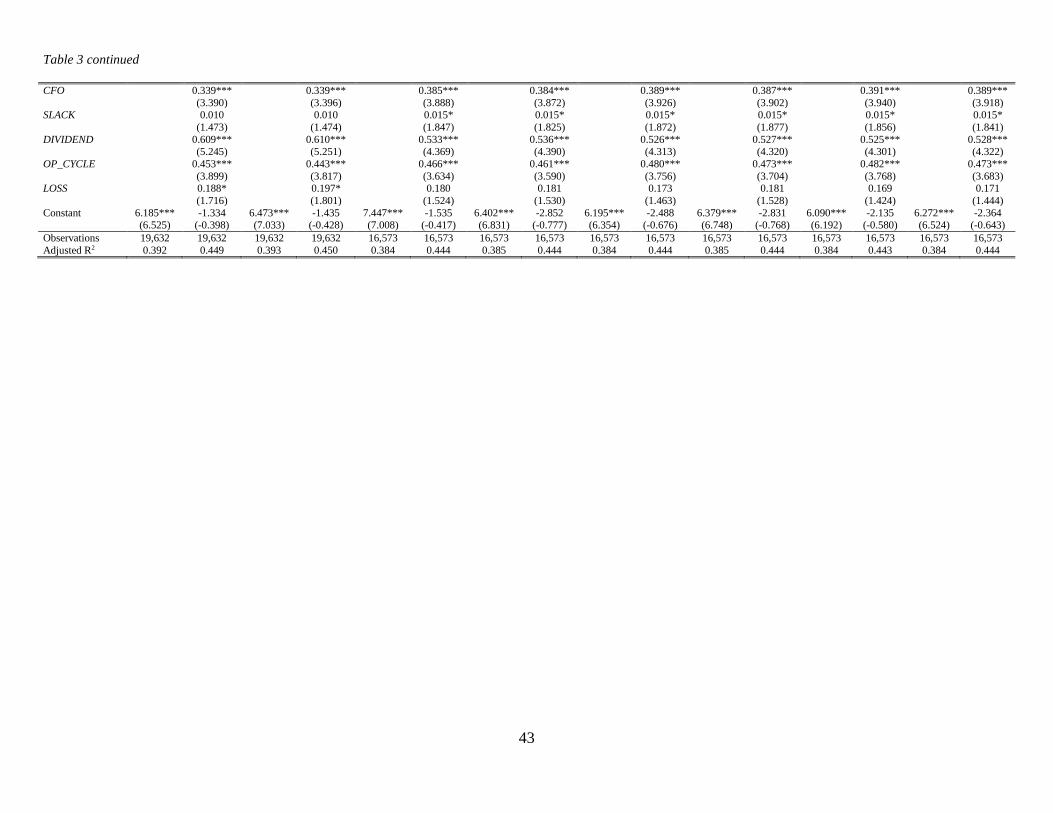
43
Table 3 continued
CFO 0.339*** 0.339*** 0.385*** 0.384*** 0.389*** 0.387*** 0.391*** 0.389***
(3.390) (3.396) (3.888) (3.872) (3.926) (3.902) (3.940) (3.918) SLACK 0.010 0.010 0.015* 0.015* 0.015* 0.015* 0.015* 0.015*
(1.473) (1.474) (1.847) (1.825) (1.872) (1.877) (1.856) (1.841)
DIVIDEND 0.609*** 0.610*** 0.533*** 0.536*** 0.526*** 0.527*** 0.525*** 0.528*** (5.245) (5.251) (4.369) (4.390) (4.313) (4.320) (4.301) (4.322)
OP_CYCLE 0.453*** 0.443*** 0.466*** 0.461*** 0.480*** 0.473*** 0.482*** 0.473***
(3.899) (3.817) (3.634) (3.590) (3.756) (3.704) (3.768) (3.683) LOSS 0.188* 0.197* 0.180 0.181 0.173 0.181 0.169 0.171
(1.716) (1.801) (1.524) (1.530) (1.463) (1.528) (1.424) (1.444)
Constant 6.185*** -1.334 6.473*** -1.435 7.447*** -1.535 6.402*** -2.852 6.195*** -2.488 6.379*** -2.831 6.090*** -2.135 6.272*** -2.364 (6.525) (-0.398) (7.033) (-0.428) (7.008) (-0.417) (6.831) (-0.777) (6.354) (-0.676) (6.748) (-0.768) (6.192) (-0.580) (6.524) (-0.643)
Observations 19,632 19,632 19,632 19,632 16,573 16,573 16,573 16,573 16,573 16,573 16,573 16,573 16,573 16,573 16,573 16,573
Adjusted R2 0.392 0.449 0.393 0.450 0.384 0.444 0.385 0.444 0.384 0.444 0.385 0.444 0.384 0.443 0.384 0.444

44
Table 3 continued
Panel B: Overinvestment
INVEST_INEFF
CONNECT is measured by:
DEGREE DEGREE decile
CLOSENESS CLOSENESS decile
BETWEENNESS BETWEENNESS decile
EIGENVECTOR EIGENVECTOR decile
(1) (2) (3) (4) (5) (6) (7) (8) (9) (10) (11) (12) (13) (14) (15) (16)
CONNECT -0.220*** -0.067 -2.879*** -0.641 -29.455*** -5.304 -2.401*** -0.167 -238.665*** -47.149 -2.308*** -0.304 -52.498*** -9.667 -2.748*** -1.309
(-5.119) (-1.102) (-4.426) (-0.711) (-3.608) (-0.488) (-3.440) (-0.173) (-3.908) (-0.688) (-3.498) (-0.373) (-2.592) (-0.475) (-3.944) (-1.463) FRQ -4.734 -4.781 -3.903 -3.956 -3.962 -3.941 -3.972 -3.766
(-0.872) (-0.881) (-0.706) (-0.715) (-0.715) (-0.711) (-0.717) (-0.683)
ANALYST_FOL 0.014 0.018 -0.018 -0.018 -0.017 -0.016 -0.018 -0.020 (0.052) (0.069) (-0.063) (-0.063) (-0.062) (-0.056) (-0.063) (-0.072)
PRIVATE_INFO 0.089 0.049 -3.163 -3.172 -3.155 -3.170 -3.201 -3.160
(0.026) (0.014) (-0.892) (-0.894) (-0.889) (-0.894) (-0.901) (-0.891) TOTAL_ASSETS -1.109*** -1.142*** -1.310*** -1.332*** -1.317*** -1.326*** -1.341*** -1.242***
(-4.714) (-4.904) (-5.318) (-5.307) (-5.501) (-5.439) (-5.770) (-5.055)
M/B 1.125*** 1.120*** 1.000*** 0.996*** 0.994*** 0.995*** 0.995*** 1.019*** (6.216) (6.188) (5.088) (5.074) (5.068) (5.073) (5.070) (5.176)
AGE -0.707** -0.708** -0.738** -0.733** -0.728** -0.735** -0.726** -0.763**
(-2.326) (-2.325) (-2.281) (-2.258) (-2.249) (-2.264) (-2.240) (-2.356) IO -0.362 -0.321 -0.462 -0.468 -0.485 -0.460 -0.479 -0.485
(-0.322) (-0.285) (-0.385) (-0.389) (-0.404) (-0.382) (-0.398) (-0.404)
BOARD_SIZE 0.288 0.164 0.946 0.856 0.959 0.925 0.824 1.178 (0.272) (0.155) (0.791) (0.714) (0.826) (0.790) (0.720) (1.004)
BOARD_IND 4.253*** 4.138*** 4.387*** 4.279** 4.374*** 4.346*** 4.246** 4.656***
(2.765) (2.681) (2.600) (2.536) (2.634) (2.607) (2.557) (2.762) BOARD_AGE 4.202 4.211 6.870** 6.830* 6.851* 6.845* 6.819* 6.987**
(1.348) (1.350) (1.963) (1.951) (1.960) (1.958) (1.952) (1.996)
CFO_VOLA -3.680 -3.715 -5.671 -5.676 -5.681 -5.679 -5.676 -5.743 (-0.849) (-0.858) (-1.206) (-1.206) (-1.208) (-1.207) (-1.207) (-1.223)
SALES_VOLA 0.593 0.557 1.971 1.955 1.983 1.962 1.953 1.990
(0.368) (0.346) (1.118) (1.110) (1.124) (1.111) (1.107) (1.127)
INVEST_VOLA 0.041*** 0.042*** 0.031** 0.031** 0.031** 0.031** 0.031** 0.031**
(3.020) (3.041) (2.272) (2.283) (2.274) (2.276) (2.279) (2.251)
Z_SCORE -0.575** -0.572** -0.596* -0.592* -0.596* -0.596* -0.592* -0.596* (-2.023) (-2.011) (-1.929) (-1.918) (-1.930) (-1.928) (-1.920) (-1.936)
TANGIBILITY -7.098*** -7.078*** -7.640*** -7.596*** -7.599*** -7.611*** -7.556*** -7.779***
(-4.360) (-4.342) (-4.219) (-4.199) (-4.203) (-4.200) (-4.179) (-4.297) KSTRUCTURE 1.926 1.949 2.152 2.155 2.141 2.160 2.147 2.141
(1.177) (1.192) (1.215) (1.217) (1.209) (1.220) (1.211) (1.208)
IND_K -2.692 -2.801 -1.187 -1.222 -1.136 -1.183 -1.178 -1.321 (-0.516) (-0.538) (-0.206) (-0.212) (-0.197) (-0.205) (-0.204) (-0.229)
CFO 0.384* 0.386* 0.367* 0.368* 0.366* 0.368* 0.368* 0.370*
(1.809) (1.817) (1.684) (1.686) (1.678) (1.688) (1.684) (1.700) SLACK -0.049* -0.050* -0.054* -0.054* -0.054* -0.054* -0.054* -0.054*
(-1.777) (-1.790) (-1.954) (-1.952) (-1.941) (-1.947) (-1.942) (-1.960)
DIVIDEND 0.605 0.599 0.679 0.672 0.671 0.669 0.671 0.692 (1.103) (1.093) (1.125) (1.113) (1.113) (1.110) (1.114) (1.148)
OP_CYCLE -0.719* -0.715* -0.685* -0.678* -0.676* -0.676* -0.676* -0.698*
(-1.904) (-1.894) (-1.675) (-1.659) (-1.657) (-1.658) (-1.656) (-1.713) LOSS -3.574*** -3.589*** -3.160*** -3.167*** -3.154*** -3.157*** -3.169*** -3.147***
(-6.093) (-6.117) (-5.037) (-5.049) (-5.024) (-5.027) (-5.038) (-5.011) Constant 9.888*** 1.584 10.291*** 2.129 15.249*** -8.016 10.009*** -8.569 9.906*** -8.913 9.819*** -8.805 9.295*** -8.374 10.176*** -9.965
(3.929) (0.120) (4.077) (0.161) (4.679) (-0.551) (3.759) (-0.583) (3.722) (-0.609) (3.764) (-0.600) (3.425) (-0.575) (3.829) (-0.680)
Observations 9,751 9,751 9,751 9,751 8,374 8,374 8,374 8,374 8,374 8,374 8,374 8,374 8,374 8,374 8,374 8,374
Adjusted R2 0.0580 0.0811 0.0575 0.0810 0.0513 0.0712 0.0511 0.0712 0.0512 0.0713 0.0512 0.0712 0.0500 0.0712 0.0517 0.0715

45
Table 4: Board Connectedness and Underinvestment:
Financial Constraints and Dependence on External Capital
This table reports the results from estimating Equations (3) and (4). Panel A presents the results for Equation (3). In
Columns (1) and (2), the level of financial constraints is measured as the size and age (SA) index. In Columns (3)
and (4), the level of financial constraints is measured as the Whited-Wu (WW) index. In Columns (5) and (6), firms
without an S&P credit rating are defined as constrained firms. Panel B presents the results for Equation (4), where
we use Rajan and Zingales’ (1998) measure of a firm’s dependence on external finance (EXTFIN) and external
equity finance (EQUITY). The sample includes 18,858 firm-year observations from 2000 to 2015. All variables are
defined in the Appendix. Industry- and year-fixed effects are included in each regression. The t-statistics (in
parentheses) are calculated using standard errors clustered by firm. *, **, and *** denote statistical significance at the
10%, 5%, and 1% level, respectively.
Panel A: Financial Constraints INVEST_INEFF
SA WW CRATING
CONNECT is measured by: DEGREE DEGREE decile DEGREE DEGREE decile DEGREE DEGREE decile
(1) (2) (3) (4) (5) (6)
CONNECT -0.083*** -1.076*** -0.081*** -1.037*** -0.068*** -0.980***
(-4.869) (-4.775) (-4.798) (-4.647) (-4.301) (-4.426)
CONNECT * FINCONSTRAINT -0.158*** -2.205*** -0.159*** -1.708*** -0.057** -0.806**
(-3.841) (-3.649) (-4.046) (-3.122) (-2.410) (-2.174)
FINCONSTRAINT -0.645 -0.557 -1.880*** -2.277*** 0.191 0.275
(-1.288) (-1.068) (-3.551) (-3.936) (0.856) (1.028)
FRQ -4.327*** -4.286*** -4.405*** -4.363*** -4.371*** -4.314***
(-3.149) (-3.125) (-3.205) (-3.181) (-3.168) (-3.127)
ANALYST_FOL -0.459*** -0.458*** -0.485*** -0.485*** -0.473*** -0.471***
(-5.944) (-5.913) (-6.314) (-6.305) (-6.114) (-6.078)
PRIVATE_INFO -0.578 -0.551 -0.482 -0.448 -0.629 -0.626
(-0.857) (-0.816) (-0.715) (-0.665) (-0.933) (-0.927)
TOTAL_ASSETS -0.085 -0.099 -0.249*** -0.256*** 0.102 0.102
(-0.919) (-1.076) (-2.731) (-2.799) (1.642) (1.644)
M/B -0.535*** -0.536*** -0.565*** -0.567*** -0.534*** -0.535***
(-8.860) (-8.907) (-9.383) (-9.429) (-8.827) (-8.858)
AGE -0.114 -0.129 0.041 0.032 0.050 0.036
(-1.270) (-1.453) (0.569) (0.445) (0.685) (0.503)
IO -1.152*** -1.112*** -1.151*** -1.103*** -1.181*** -1.128***
(-4.277) (-4.137) (-4.243) (-4.069) (-4.404) (-4.215)
BOARD_SIZE -0.002 -0.013 0.015 0.009 -0.009 0.007
(-0.007) (-0.049) (0.060) (0.035) (-0.034) (0.026)
BOARD_IND -0.851** -0.829** -0.810** -0.787** -0.865** -0.799**
(-2.220) (-2.151) (-2.107) (-2.039) (-2.251) (-2.070)
BOARD_AGE 2.041*** 2.060*** 1.938** 1.968** 1.974** 2.001***
(2.635) (2.657) (2.512) (2.548) (2.554) (2.587)
CFO_VOLA -4.594*** -4.568*** -4.503*** -4.493*** -4.594*** -4.588***
(-3.373) (-3.359) (-3.308) (-3.305) (-3.355) (-3.354)
SALES_VOLA 1.800*** 1.791*** 1.822*** 1.814*** 1.785*** 1.762***
(5.259) (5.246) (5.306) (5.299) (5.218) (5.156)
INVEST_VOLA -0.005 -0.005 -0.005 -0.005 -0.005 -0.005
(-1.425) (-1.336) (-1.355) (-1.272) (-1.482) (-1.418)
Z_SCORE 0.484*** 0.480*** 0.450*** 0.446*** 0.488*** 0.484***
(6.544) (6.484) (6.031) (5.977) (6.576) (6.531)
TANGIBILITY -4.291*** -4.303*** -4.361*** -4.380*** -4.272*** -4.296***
(-10.984) (-10.986) (-11.119) (-11.147) (-10.864) (-10.902)
KSTRUCTURE 3.503*** 3.480*** 3.612*** 3.594*** 3.494*** 3.510***
(10.934) (10.886) (11.249) (11.219) (10.568) (10.589)
IND_K -5.523*** -5.500*** -5.672*** -5.662*** -5.425*** -5.408***
(-5.509) (-5.484) (-5.651) (-5.643) (-5.420) (-5.409)
CFO 0.332** 0.340** 0.290** 0.297** 0.338** 0.342**
(2.280) (2.341) (1.987) (2.040) (2.307) (2.335)
SLACK 0.009 0.009 0.009 0.009 0.008 0.008
(1.199) (1.218) (1.193) (1.214) (1.109) (1.112)
DIVIDEND 0.567*** 0.564*** 0.133 0.128 0.588*** 0.587***
(4.912) (4.904) (0.866) (0.841) (5.074) (5.079)
OP_CYCLE 0.402*** 0.395*** 0.400*** 0.394*** 0.412*** 0.405***
(3.382) (3.327) (3.386) (3.338) (3.468) (3.415)
LOSS 0.218* 0.223** 0.312*** 0.319*** 0.204* 0.209*
(1.960) (2.003) (2.813) (2.877) (1.831) (1.878)
Constant -0.684 -0.468 1.007 1.129 -2.039 -2.009
(-0.196) (-0.134) (0.293) (0.329) (-0.602) (-0.593)
Observations 18,858 18,858 18,858 18,858 18,858 18,858
Adjusted R2 0.454 0.455 0.455 0.456 0.453 0.454

46
Table 4 continued
Panel B: Dependence on External Financing
INVEST_INEFF
EXTFIN EQUITY
CONNECT is measured by: DEGREE DEGREE decile DEGREE DEGREE decile
(1) (2) (3) (4)
CONNECT -0.054*** -0.955*** -0.057*** -0.969***
(-3.862) (-4.366) (-4.043) (-4.410)
CONNECT * FINNEED -0.118*** -1.479*** -0.078*** -1.048**
(-3.723) (-3.125) (-2.730) (-2.343)
FINNEED -0.843*** -0.796*** 0.186 0.239
(-3.810) (-3.194) (0.851) (0.946)
FRQ -4.766*** -4.692*** -4.501*** -4.442***
(-3.475) (-3.421) (-3.261) (-3.219)
ANALYST_FOL -0.463*** -0.461*** -0.478*** -0.476***
(-6.021) (-6.003) (-6.206) (-6.162)
PRIVATE_INFO -0.453 -0.478 -0.527 -0.525
(-0.675) (-0.710) (-0.783) (-0.780)
TOTAL_ASSETS 0.089 0.099* 0.112* 0.117**
(1.558) (1.721) (1.928) (2.021)
M/B -0.580*** -0.577*** -0.540*** -0.537***
(-9.681) (-9.664) (-8.926) (-8.909)
AGE 0.074 0.057 0.069 0.053
(1.053) (0.807) (0.971) (0.746)
IO -1.308*** -1.261*** -1.223*** -1.169***
(-4.900) (-4.738) (-4.552) (-4.363)
BOARD_SIZE 0.015 0.070 -0.034 0.012
(0.060) (0.278) (-0.136) (0.049)
BOARD_IND -0.913** -0.804** -0.905** -0.803**
(-2.410) (-2.107) (-2.361) (-2.080)
BOARD_AGE 1.815** 1.840** 1.935** 1.963**
(2.368) (2.399) (2.506) (2.541)
CFO_VOLA -3.984*** -3.992*** -4.500*** -4.503***
(-2.914) (-2.923) (-3.287) (-3.294)
SALES_VOLA 1.905*** 1.875*** 1.804*** 1.783***
(5.587) (5.499) (5.263) (5.207)
INVEST_VOLA -0.007** -0.007* -0.005 -0.005
(-1.984) (-1.909) (-1.488) (-1.428)
Z_SCORE 0.441*** 0.435*** 0.489*** 0.483***
(6.012) (5.937) (6.631) (6.561)
TANGIBILITY -3.498*** -3.565*** -4.262*** -4.301***
(-8.771) (-8.917) (-10.894) (-10.954)
KSTRUCTURE 3.553*** 3.550*** 3.575*** 3.577***
(11.243) (11.221) (11.149) (11.139)
IND_K -5.525*** -5.545*** -5.412*** -5.416***
(-5.590) (-5.606) (-5.411) (-5.418)
CFO 0.203 0.206 0.335** 0.336**
(1.373) (1.391) (2.286) (2.298)
SLACK 0.008 0.007 0.009 0.009
(1.012) (0.983) (1.179) (1.186)
DIVIDEND 0.579*** 0.582*** 0.596*** 0.596***
(5.029) (5.048) (5.123) (5.122)
OP_CYCLE 0.463*** 0.455*** 0.418*** 0.411***
(3.940) (3.871) (3.518) (3.454)
LOSS 0.452*** 0.463*** 0.217* 0.221**
(4.044) (4.131) (1.950) (1.987)
Constant -1.640 -1.670 -1.978 -2.008
(-0.489) (-0.498) (-0.583) (-0.593)
Observations 18,858 18,858 18,858 18,858
Adjusted R2 0.457 0.457 0.453 0.454

47
Table 5: Board Connectedness and Underinvestment: Other Information Sources
This table reports the results from estimating Equations (6) and (7), where we test how the effect of board
connectedness on underinvestment varies with the strength of other information sources. In Columns (1) and (2), we
use analyst coverage to capture one dimension of external information environment. In Columns (3) and (4), we use
accruals quality based on the modified Dechow and Dichev model to represent one other information source. The
sample includes 19,632 firm-year observations from 2000 to 2015. All variables are defined in the Appendix.
Industry- and year-fixed effects are included. The t-statistics (in parentheses) are calculated using standard errors
clustered by firm. *, **, and *** denote statistical significance at the 10%, 5%, and 1% level, respectively. INVEST_INEFF
CONNECT is measured by: DEGREE DEGREE decile DEGREE DEGREE decile (1) (2) (3) (4)
CONNECT -0.067*** -0.994*** -0.061*** -1.008***
(-4.610) (-4.556) (-4.310) (-4.623)
CONNECT * ANALYST_FOL 0.107*** 1.434*** (3.340) (2.972)
ANALYST_FOL -2.127*** -2.182*** -0.492*** -0.489***
(-7.613) (-6.771) (-6.467) (-6.396) CONNECT * FRQ 0.112*** 1.690***
(3.715) (3.694)
FRQ -4.441*** -4.364*** -1.123*** -1.267*** (-3.294) (-3.238) (-4.519) (-4.478)
PRIVATE_INFO -0.722 -0.712 -0.781 -0.776
(-1.081) (-1.067) (-1.173) (-1.165) TOTAL_ASSETS 0.146** 0.142** 0.119** 0.122**
(2.544) (2.469) (2.049) (2.097) M/B -0.511*** -0.512*** -0.518*** -0.517***
(-8.396) (-8.415) (-8.564) (-8.569)
AGE 0.057 0.044 0.060 0.043 (0.816) (0.624) (0.859) (0.622)
IO -1.068*** -1.032*** -1.171*** -1.108***
(-4.002) (-3.878) (-4.399) (-4.167) BOARD_SIZE 0.013 0.038 -0.006 0.033
(0.050) (0.151) (-0.026) (0.132)
BOARD_IND -0.783** -0.712* -0.866** -0.771** (-2.068) (-1.868) (-2.283) (-2.019)
BOARD_AGE 1.713** 1.746** 1.803** 1.847**
(2.248) (2.289) (2.357) (2.410) CFO_VOLA -4.551*** -4.566*** -4.131*** -4.122***
(-3.330) (-3.343) (-3.117) (-3.112)
SALES_VOLA 1.772*** 1.755*** 1.833*** 1.810*** (5.201) (5.158) (5.419) (5.358)
INVEST_VOLA -0.005 -0.005 -0.004 -0.004
(-1.347) (-1.303) (-1.243) (-1.171) Z_SCORE 0.490*** 0.487*** 0.484*** 0.478***
(6.653) (6.618) (6.562) (6.482)
TANGIBILITY -4.152*** -4.184*** -4.160*** -4.194*** (-10.792) (-10.828) (-10.770) (-10.826)
KSTRUCTURE 3.607*** 3.616*** 3.623*** 3.636***
(11.233) (11.264) (11.333) (11.364) IND_K -5.760*** -5.707*** -5.684*** -5.689***
(-5.786) (-5.739) (-5.721) (-5.735)
CFO 0.337*** 0.339*** 0.333*** 0.337*** (3.381) (3.413) (3.330) (3.387)
SLACK 0.011 0.011 0.011 0.011
(1.535) (1.534) (1.555) (1.560) DIVIDEND 0.600*** 0.599*** 0.617*** 0.617***
(5.184) (5.181) (5.324) (5.321)
OP_CYCLE 0.444*** 0.439*** 0.447*** 0.437*** (3.822) (3.778) (3.848) (3.765)
LOSS 0.193* 0.200* 0.184* 0.194*
(1.766) (1.831) (1.689) (1.779) Constant -2.341 -2.294 -1.365 -1.416
(-0.699) (-0.685) (-0.406) (-0.421)
Observations 19,632 19,632 19,632 19,632 Adjusted R2 0.448 0.448 0.447 0.448
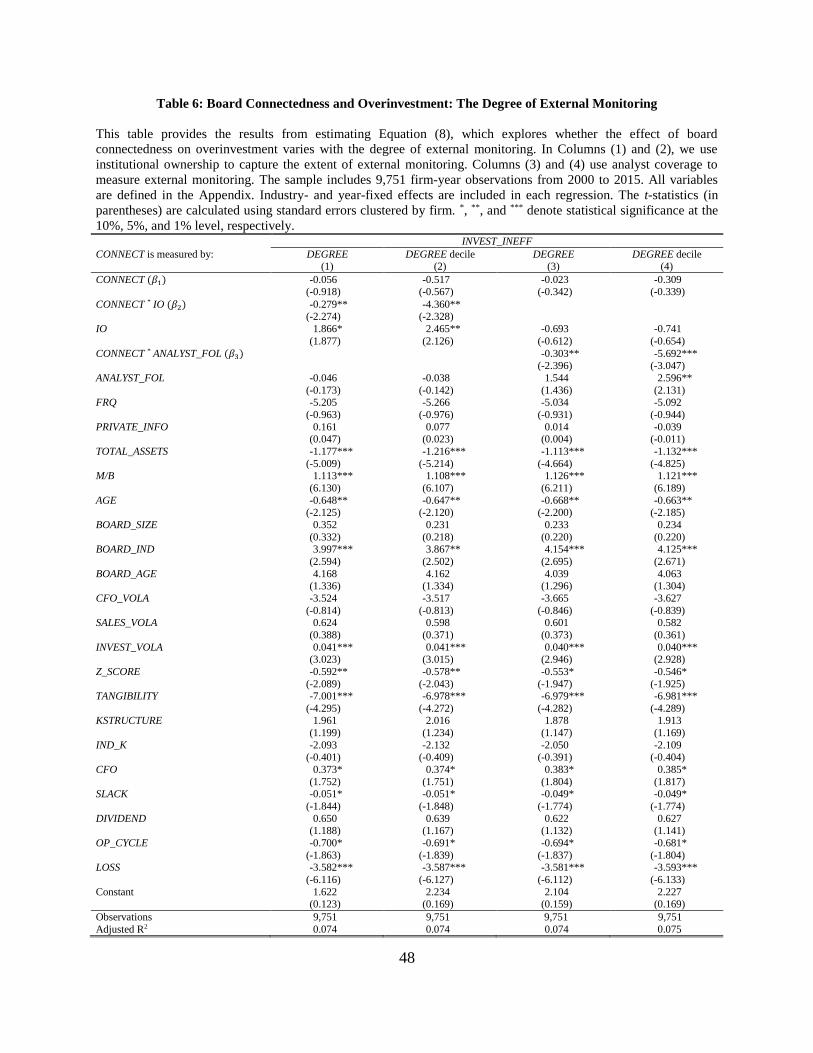
48
Table 6: Board Connectedness and Overinvestment: The Degree of External Monitoring
This table provides the results from estimating Equation (8), which explores whether the effect of board
connectedness on overinvestment varies with the degree of external monitoring. In Columns (1) and (2), we use
institutional ownership to capture the extent of external monitoring. Columns (3) and (4) use analyst coverage to
measure external monitoring. The sample includes 9,751 firm-year observations from 2000 to 2015. All variables
are defined in the Appendix. Industry- and year-fixed effects are included in each regression. The t-statistics (in
parentheses) are calculated using standard errors clustered by firm. *, **, and *** denote statistical significance at the
10%, 5%, and 1% level, respectively. INVEST_INEFF
CONNECT is measured by: DEGREE DEGREE decile DEGREE DEGREE decile (1) (2) (3) (4)
CONNECT (𝛽1) -0.056 -0.517 -0.023 -0.309 (-0.918) (-0.567) (-0.342) (-0.339)
CONNECT * IO (𝛽2) -0.279** -4.360** (-2.274) (-2.328)
IO 1.866* 2.465** -0.693 -0.741
(1.877) (2.126) (-0.612) (-0.654)
CONNECT * ANALYST_FOL (𝛽3) -0.303** -5.692*** (-2.396) (-3.047)
ANALYST_FOL -0.046 -0.038 1.544 2.596**
(-0.173) (-0.142) (1.436) (2.131) FRQ -5.205 -5.266 -5.034 -5.092
(-0.963) (-0.976) (-0.931) (-0.944)
PRIVATE_INFO 0.161 0.077 0.014 -0.039 (0.047) (0.023) (0.004) (-0.011)
TOTAL_ASSETS -1.177*** -1.216*** -1.113*** -1.132***
(-5.009) (-5.214) (-4.664) (-4.825) M/B 1.113*** 1.108*** 1.126*** 1.121***
(6.130) (6.107) (6.211) (6.189)
AGE -0.648** -0.647** -0.668** -0.663** (-2.125) (-2.120) (-2.200) (-2.185)
BOARD_SIZE 0.352 0.231 0.233 0.234
(0.332) (0.218) (0.220) (0.220) BOARD_IND 3.997*** 3.867** 4.154*** 4.125***
(2.594) (2.502) (2.695) (2.671)
BOARD_AGE 4.168 4.162 4.039 4.063 (1.336) (1.334) (1.296) (1.304)
CFO_VOLA -3.524 -3.517 -3.665 -3.627
(-0.814) (-0.813) (-0.846) (-0.839) SALES_VOLA 0.624 0.598 0.601 0.582
(0.388) (0.371) (0.373) (0.361)
INVEST_VOLA 0.041*** 0.041*** 0.040*** 0.040*** (3.023) (3.015) (2.946) (2.928)
Z_SCORE -0.592** -0.578** -0.553* -0.546*
(-2.089) (-2.043) (-1.947) (-1.925) TANGIBILITY -7.001*** -6.978*** -6.979*** -6.981***
(-4.295) (-4.272) (-4.282) (-4.289) KSTRUCTURE 1.961 2.016 1.878 1.913
(1.199) (1.234) (1.147) (1.169)
IND_K -2.093 -2.132 -2.050 -2.109 (-0.401) (-0.409) (-0.391) (-0.404)
CFO 0.373* 0.374* 0.383* 0.385*
(1.752) (1.751) (1.804) (1.817) SLACK -0.051* -0.051* -0.049* -0.049*
(-1.844) (-1.848) (-1.774) (-1.774)
DIVIDEND 0.650 0.639 0.622 0.627 (1.188) (1.167) (1.132) (1.141)
OP_CYCLE -0.700* -0.691* -0.694* -0.681*
(-1.863) (-1.839) (-1.837) (-1.804) LOSS -3.582*** -3.587*** -3.581*** -3.593***
(-6.116) (-6.127) (-6.112) (-6.133)
Constant 1.622 2.234 2.104 2.227 (0.123) (0.169) (0.159) (0.169)
Observations 9,751 9,751 9,751 9,751
Adjusted R2 0.074 0.074 0.074 0.075

49
Table 7: Board Connectedness and Overinvestment: Agency Costs
This table provides the results from estimating Equation (8), which explores whether board connectedness has a
larger role in preventing over-investment for high agency cost firms. In Columns (1) and (2), AGENCYCOST is
measured as cash holdings. Columns (3) and (4) measure AGENCYCOST as the degree of overvaluation. Both
measures of agency costs are in decile ranking and normalized to the range of [0,1]. The sample includes 9,751 firm-
year observations from 2000 to 2015. All variables are defined in the Appendix. Industry- and year-fixed effects are
included in each regression. The t-statistics (in parentheses) are calculated using standard errors clustered by firm. *, **, and *** denote statistical significance at the 10%, 5%, and 1% level, respectively. INVEST_INEFF
CASH_HOLD OVERVALUATION
CONNECT is measured by: DEGREE DEGREE decile DEGREE DEGREE decile (1) (2) (3) (4)
CONNECT (𝛽1) -0.054 -0.273 -0.037 -0.388 (-0.862) (-0.296) (-0.613) (-0.435)
CONNECT * AGENCYCOST (𝛽2) -0.268* -5.059** -0.300** -5.053**
(-1.875) (-2.358) (-2.199) (-2.512)
AGENCYCOST -1.395 -0.480 2.845*** 3.571***
(-1.284) (-0.387) (2.590) (2.878)
FRQ -4.178 -4.150 -4.741 -4.733
(-0.767) (-0.763) (-0.877) (-0.878) ANALYST_FOL 0.083 0.093 -0.016 -0.013
(0.316) (0.352) (-0.060) (-0.049)
PRIVATE_INFO 0.395 0.373 0.116 0.096 (0.116) (0.109) (0.034) (0.028)
TOTAL_ASSETS -1.093*** -1.139*** -1.148*** -1.172***
(-4.655) (-4.898) (-4.866) (-5.028) M/B 1.165*** 1.156*** 0.914*** 0.904***
(6.440) (6.394) (4.040) (4.002)
AGE -0.777** -0.773** -0.686** -0.684** (-2.554) (-2.541) (-2.261) (-2.251)
IO -0.162 -0.146 -0.429 -0.372
(-0.144) (-0.129) (-0.382) (-0.331) BOARD_SIZE 0.129 -0.002 0.254 0.202
(0.123) (-0.002) (0.240) (0.191)
BOARD_IND 4.065*** 3.891** 4.071*** 4.003*** (2.647) (2.527) (2.653) (2.602)
BOARD_AGE 3.925 3.954 4.296 4.377
(1.263) (1.271) (1.381) (1.406) CFO_VOLA -2.942 -3.035 -3.605 -3.567
(-0.683) (-0.706) (-0.832) (-0.824)
SALES_VOLA 0.402 0.362 0.551 0.533 (0.252) (0.227) (0.342) (0.331)
INVEST_VOLA 0.040*** 0.041*** 0.041*** 0.042***
(2.929) (2.975) (3.020) (3.055) Z_SCORE -0.816*** -0.803*** -0.557** -0.549*
(-2.730) (-2.689) (-1.965) (-1.936)
TANGIBILITY -7.979*** -7.905*** -7.075*** -7.090*** (-4.797) (-4.739) (-4.347) (-4.352)
KSTRUCTURE 0.906 0.964 0.945 0.955 (0.555) (0.592) (0.564) (0.570)
IND_K -1.760 -1.893 -2.295 -2.271
(-0.339) (-0.365) (-0.440) (-0.436) CFO 0.324 0.334 0.371* 0.373*
(1.549) (1.592) (1.743) (1.751)
SLACK -0.036 -0.037 -0.047* -0.047*
(-1.293) (-1.332) (-1.711) (-1.710)
DIVIDEND 0.491 0.474 0.606 0.604
(0.899) (0.867) (1.106) (1.103) OP_CYCLE -0.803** -0.799** -0.713* -0.710*
(-2.124) (-2.109) (-1.890) (-1.880)
LOSS -3.533*** -3.543*** -3.594*** -3.592*** (-6.028) (-6.041) (-6.129) (-6.129)
Constant 4.540 5.098 1.809 1.866
(0.343) (0.386) (0.137) (0.142)
Observations 9,751 9,751 9,751 9,751 Adjusted R2 0.076 0.076 0.074 0.075

50
Table 8: Board Connectedness and Underinvestment: Connections with Financial Institutions
This table provides the results from estimating Equation (5), where we test whether the effect of director
connectedness on under-investment is driven by connections with financial institutions. Column (1) uses continuous
versions of FI_CONNECT and DEGREE. Column (2) uses the dummy version of FI_CONNECT and DEGREE
decile. The sample includes 19,632 firm-year observations from 2000 to 2015. All variables are defined in the
Appendix. Industry- and year-fixed effects are included in each regression. The t-statistics (in parentheses) are
calculated using standard errors clustered by firm. *, **, and *** denote statistical significance at the 10%, 5%, and
1% level, respectively. INVEST_INEFF
(1) (2)
FI_CONNECT 0.127 0.170
(1.363) (1.363)
CONNECT -0.058*** -1.054***
(-3.971) (-4.717)
FRQ -4.453*** -4.376***
(-3.297) (-3.239)
ANALYST_FOL -0.491*** -0.489*** (-6.437) (-6.400)
PRIVATE_INFO -0.783 -0.792
(-1.173) (-1.186) TOTAL_ASSETS 0.115** 0.124**
(2.003) (2.154)
M/B -0.526*** -0.524*** (-8.685) (-8.677)
AGE 0.079 0.059 (1.124) (0.843)
IO -1.204*** -1.140***
(-4.517) (-4.293) BOARD_SIZE -0.025 0.038
(-0.101) (0.151)
BOARD_IND -0.874** -0.746* (-2.302) (-1.949)
BOARD_AGE 1.690** 1.724**
(2.210) (2.252)
CFO_VOLA -4.555*** -4.548***
(-3.329) (-3.328)
SALES_VOLA 1.785*** 1.762*** (5.237) (5.169)
INVEST_VOLA -0.005 -0.005
(-1.452) (-1.423) Z_SCORE 0.494*** 0.486***
(6.702) (6.607)
TANGIBILITY -4.138*** -4.180*** (-10.715) (-10.802)
KSTRUCTURE 3.592*** 3.607***
(11.219) (11.267) IND_K -5.681*** -5.645***
(-5.693) (-5.662)
CFO 0.339*** 0.339*** (3.391) (3.400)
SLACK 0.010 0.010
(1.468) (1.472)
DIVIDEND 0.601*** 0.600***
(5.166) (5.165)
OP_CYCLE 0.453*** 0.444*** (3.904) (3.831)
LOSS 0.191* 0.200*
(1.745) (1.825) Constant -1.220 -1.319
(-0.364) (-0.394)
Observations 19,632 19,632 Adjusted R2 0.447 0.448
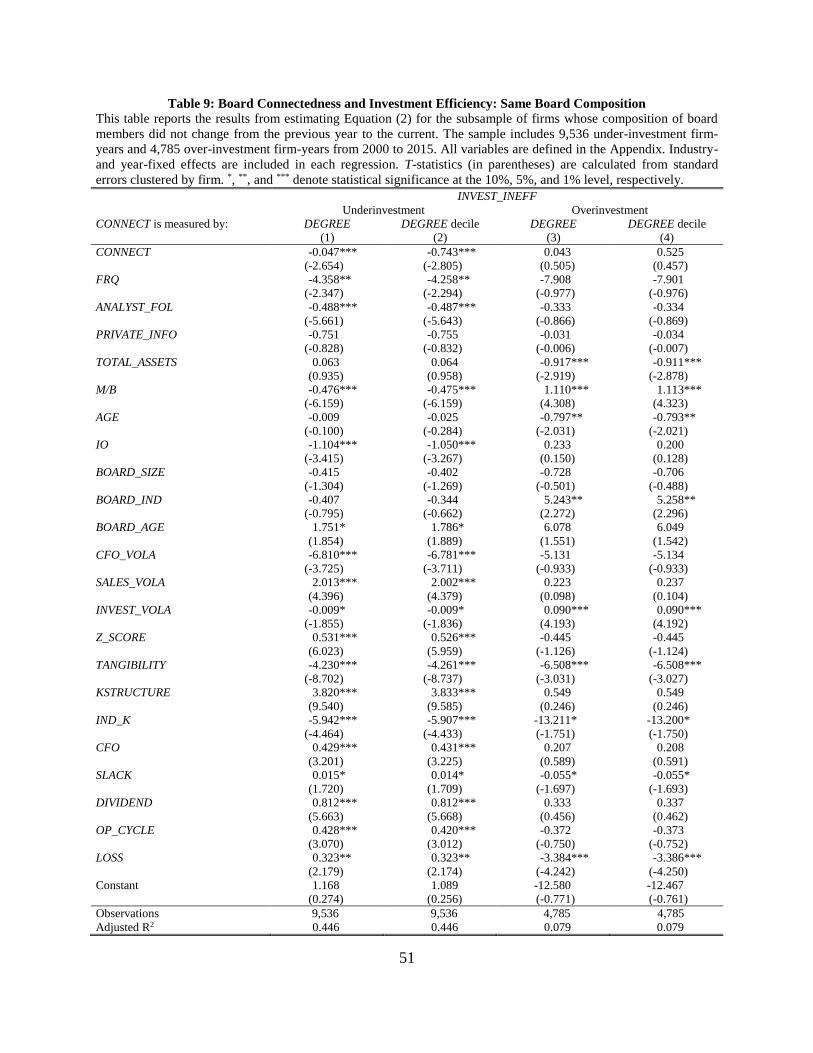
51
Table 9: Board Connectedness and Investment Efficiency: Same Board Composition This table reports the results from estimating Equation (2) for the subsample of firms whose composition of board
members did not change from the previous year to the current. The sample includes 9,536 under-investment firm-
years and 4,785 over-investment firm-years from 2000 to 2015. All variables are defined in the Appendix. Industry-
and year-fixed effects are included in each regression. T-statistics (in parentheses) are calculated from standard
errors clustered by firm. *, **, and *** denote statistical significance at the 10%, 5%, and 1% level, respectively.
INVEST_INEFF
Underinvestment Overinvestment
CONNECT is measured by: DEGREE DEGREE decile DEGREE DEGREE decile
(1) (2) (3) (4)
CONNECT -0.047*** -0.743*** 0.043 0.525
(-2.654) (-2.805) (0.505) (0.457)
FRQ -4.358** -4.258** -7.908 -7.901
(-2.347) (-2.294) (-0.977) (-0.976)
ANALYST_FOL -0.488*** -0.487*** -0.333 -0.334
(-5.661) (-5.643) (-0.866) (-0.869)
PRIVATE_INFO -0.751 -0.755 -0.031 -0.034
(-0.828) (-0.832) (-0.006) (-0.007)
TOTAL_ASSETS 0.063 0.064 -0.917*** -0.911***
(0.935) (0.958) (-2.919) (-2.878)
M/B -0.476*** -0.475*** 1.110*** 1.113***
(-6.159) (-6.159) (4.308) (4.323)
AGE -0.009 -0.025 -0.797** -0.793**
(-0.100) (-0.284) (-2.031) (-2.021)
IO -1.104*** -1.050*** 0.233 0.200
(-3.415) (-3.267) (0.150) (0.128)
BOARD_SIZE -0.415 -0.402 -0.728 -0.706
(-1.304) (-1.269) (-0.501) (-0.488)
BOARD_IND -0.407 -0.344 5.243** 5.258**
(-0.795) (-0.662) (2.272) (2.296)
BOARD_AGE 1.751* 1.786* 6.078 6.049
(1.854) (1.889) (1.551) (1.542)
CFO_VOLA -6.810*** -6.781*** -5.131 -5.134
(-3.725) (-3.711) (-0.933) (-0.933)
SALES_VOLA 2.013*** 2.002*** 0.223 0.237
(4.396) (4.379) (0.098) (0.104)
INVEST_VOLA -0.009* -0.009* 0.090*** 0.090***
(-1.855) (-1.836) (4.193) (4.192)
Z_SCORE 0.531*** 0.526*** -0.445 -0.445
(6.023) (5.959) (-1.126) (-1.124)
TANGIBILITY -4.230*** -4.261*** -6.508*** -6.508***
(-8.702) (-8.737) (-3.031) (-3.027)
KSTRUCTURE 3.820*** 3.833*** 0.549 0.549
(9.540) (9.585) (0.246) (0.246)
IND_K -5.942*** -5.907*** -13.211* -13.200*
(-4.464) (-4.433) (-1.751) (-1.750)
CFO 0.429*** 0.431*** 0.207 0.208
(3.201) (3.225) (0.589) (0.591)
SLACK 0.015* 0.014* -0.055* -0.055*
(1.720) (1.709) (-1.697) (-1.693)
DIVIDEND 0.812*** 0.812*** 0.333 0.337
(5.663) (5.668) (0.456) (0.462)
OP_CYCLE 0.428*** 0.420*** -0.372 -0.373
(3.070) (3.012) (-0.750) (-0.752)
LOSS 0.323** 0.323** -3.384*** -3.386***
(2.179) (2.174) (-4.242) (-4.250)
Constant 1.168 1.089 -12.580 -12.467
(0.274) (0.256) (-0.771) (-0.761)
Observations 9,536 9,536 4,785 4,785
Adjusted R2 0.446 0.446 0.079 0.079
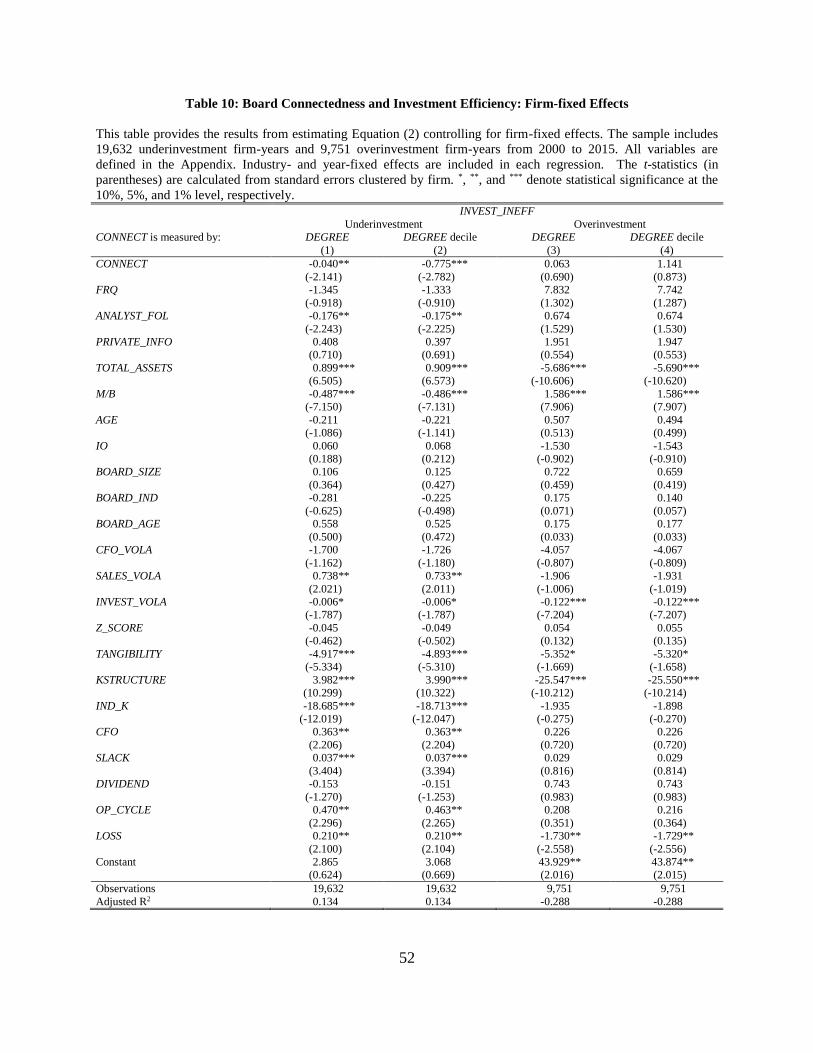
52
Table 10: Board Connectedness and Investment Efficiency: Firm-fixed Effects
This table provides the results from estimating Equation (2) controlling for firm-fixed effects. The sample includes
19,632 underinvestment firm-years and 9,751 overinvestment firm-years from 2000 to 2015. All variables are
defined in the Appendix. Industry- and year-fixed effects are included in each regression. The t-statistics (in
parentheses) are calculated from standard errors clustered by firm. *, **, and *** denote statistical significance at the
10%, 5%, and 1% level, respectively.
INVEST_INEFF
Underinvestment Overinvestment
CONNECT is measured by: DEGREE DEGREE decile DEGREE DEGREE decile
(1) (2) (3) (4)
CONNECT -0.040** -0.775*** 0.063 1.141
(-2.141) (-2.782) (0.690) (0.873)
FRQ -1.345 -1.333 7.832 7.742
(-0.918) (-0.910) (1.302) (1.287)
ANALYST_FOL -0.176** -0.175** 0.674 0.674
(-2.243) (-2.225) (1.529) (1.530)
PRIVATE_INFO 0.408 0.397 1.951 1.947
(0.710) (0.691) (0.554) (0.553)
TOTAL_ASSETS 0.899*** 0.909*** -5.686*** -5.690***
(6.505) (6.573) (-10.606) (-10.620)
M/B -0.487*** -0.486*** 1.586*** 1.586***
(-7.150) (-7.131) (7.906) (7.907)
AGE -0.211 -0.221 0.507 0.494
(-1.086) (-1.141) (0.513) (0.499)
IO 0.060 0.068 -1.530 -1.543
(0.188) (0.212) (-0.902) (-0.910)
BOARD_SIZE 0.106 0.125 0.722 0.659
(0.364) (0.427) (0.459) (0.419)
BOARD_IND -0.281 -0.225 0.175 0.140
(-0.625) (-0.498) (0.071) (0.057)
BOARD_AGE 0.558 0.525 0.175 0.177
(0.500) (0.472) (0.033) (0.033)
CFO_VOLA -1.700 -1.726 -4.057 -4.067
(-1.162) (-1.180) (-0.807) (-0.809)
SALES_VOLA 0.738** 0.733** -1.906 -1.931
(2.021) (2.011) (-1.006) (-1.019)
INVEST_VOLA -0.006* -0.006* -0.122*** -0.122***
(-1.787) (-1.787) (-7.204) (-7.207)
Z_SCORE -0.045 -0.049 0.054 0.055
(-0.462) (-0.502) (0.132) (0.135)
TANGIBILITY -4.917*** -4.893*** -5.352* -5.320*
(-5.334) (-5.310) (-1.669) (-1.658)
KSTRUCTURE 3.982*** 3.990*** -25.547*** -25.550***
(10.299) (10.322) (-10.212) (-10.214)
IND_K -18.685*** -18.713*** -1.935 -1.898
(-12.019) (-12.047) (-0.275) (-0.270)
CFO 0.363** 0.363** 0.226 0.226
(2.206) (2.204) (0.720) (0.720)
SLACK 0.037*** 0.037*** 0.029 0.029
(3.404) (3.394) (0.816) (0.814)
DIVIDEND -0.153 -0.151 0.743 0.743
(-1.270) (-1.253) (0.983) (0.983)
OP_CYCLE 0.470** 0.463** 0.208 0.216
(2.296) (2.265) (0.351) (0.364)
LOSS 0.210** 0.210** -1.730** -1.729**
(2.100) (2.104) (-2.558) (-2.556)
Constant 2.865 3.068 43.929** 43.874**
(0.624) (0.669) (2.016) (2.015)
Observations 19,632 19,632 9,751 9,751
Adjusted R2 0.134 0.134 -0.288 -0.288